Embed Size (px)
Citation preview

Editing Report Definitions using
Microsoft SQL Report Builder 2.0


Editing Report Definitions using Microsoft SQL Report Builder 2.0 User’s Guide
31 January 2014 ©2014 Osmose Utilities Services, Inc 3
Editing Report Definitions using Microsoft SQL Report Builder 2.0
31January 2014
Copyright
© 2002-2014 Osmose Utilities Services, Inc. All rights reserved.
The contents of this publication are intended for distribution to and use by the
licensed user, “Licensee”, of the related software. Any copies and reproductions of
the document may be made solely for use by the licensee. Licensee agrees to
reproduce and incorporate Osmose Utilities Services Inc.'s copyright notice in any
copy or partial copy. The publication may not be distributed, transmitted, sold,
published, or otherwise provided, in paper, electronic, or any other format, to any
third party without the prior written permission of Osmose Utilities Services, Inc.
Licensee shall not modify, translate, decompile, disassemble, or create derivative
works based on the contents of this publication. Information in this document is
subject to change without notice. Some screens and functions depicted within this
document may differ from those seen during use of the product.
Trademarks
Osmose is a registered trademarks of Osmose, Inc.
O-Calc Pro is registered trademark of Osmose Utilities Services, Inc.
Microsoft SQL Server 2008 Reporting Services Report Builder 2.0 is a licensed
product of Microsoft Corporation.
Windows, Windows 2000, Windows XP, Windows Vista, Windows 7 are registered
trademarks of Microsoft Corporation. All other trademarks mentioned are the
property of their respective owners.
Osmose Utilities Services, Inc.
215 Greencastle Road
Tyrone, Georgia 30290-2944
Phone: 1-716-319-3747
www.OsmoseUtilities.com

Editing Report Definitions using Microsoft SQL Report Builder 2.0 User’s Guide
4 ©2014 Osmose Utilities Services, Inc 31 January 2014
Disclaimer
This document contains dated material. Osmose Utilities Services, Inc. does not
warrant the accuracy of information contained within this document. All information
is subject to change as required by software and data components distributed with
this product. Items marked as “Reserved for future use” imply no promise or intent
to supply specific functionality.

Editing Report Definitions using Microsoft SQL Report Builder 2.0 User’s Guide
31 January 2014 ©2014 Osmose Utilities Services, Inc 5
Table of Contents
Understanding Report Design .......................................... 6 Report Creation and Editing Overview.............................................. 6
Installing and Configuring the Report Builder ................. 6 Installing the Report Builder.............................................................. 6 Configuring O-Calc Pro to use the Report Builder ............................ 6
Using the Report Designer ............................................... 7 Creating a New Report Template ...................................................... 7 Opening and Understanding the Report Builder ................................ 8
Overview of the Design Template Layout ................................. 9
Using Pole Data in Your Report ..................................... 10 Understanding the Report Data ........................................................ 10
A Quick Tutorial ............................................................. 29 A Simple Table Example ................................................................. 29
Create a New Report Template................................................ 29 Add a Header and Footer ......................................................... 31 Add a Report Title ................................................................... 33 Add a Table ............................................................................. 34 View the Result ....................................................................... 36 Beyond this Tutorial ................................................................ 38
Layout Tips .................................................................... 40 Adding Charts to Reports ................................................................ 40 Keep Element Boundaries within Printable Margins ....................... 41 Saving Copies of Templates from within Report Builder ............... 41
Other Information you Should Know ............................. 42 Report Builder Restrictions with O-Calc® Pro Templates .............. 42 Where the Reports Tool Finds Reports ............................................ 42
Headers and Footers ............................................................. 9 Body ...................................................................................... 9
Built-in Fields ..................................................................... 10 Parameters........................................................................... 11 Images ................................................................................. 19 Pole Data ............................................................................. 19

Editing Report Definitions using Microsoft SQL Report Builder 2.0 User’s Guide
6 ©2014 Osmose Utilities Services, Inc 31 January 2014
Understanding Report Design
Report Creation and Editing Overview
Custom reports can be designed and edited for Osmose O-Calc® Pro using
the Microsoft SQL Server 2008 Reporting Services Report Builder version
2.0. This tool is designed for use with Microsoft SQL Reporting Services but
can act in a standalone mode to edit O-Calc Pro report templates. This
document only applies to version 2.0, later versions of the Report Builder
may not work.
Users intending to create or modify report templates for Osmose O-Calc Pro
should download and install the Microsoft SQL Server 2008 Reporting
Services Report Builder. Once installed, details about the editing features of
the tool can be found in the help document that is deployed with the
software.
This document provides information about using the Report Builder to create
and edit Osmose O-Calc Pro Reports.
Installing and Configuring the Report Builder
Installing the Report Builder
If Report Builder is not already installed on your system, download the
Report Builder from here and follow the installation instructions provided.
Administrator permissions may be required.
The Report Builder is designed to connect to a SQL Server and will prompt
for connection information. You will need to configure it for use through O-
Calc Pro. The next section describes how to configure the O-Calc Pro
application to use the Report Builder for editing.
Configuring O-Calc Pro to use the Report Builder
Once the Report Builder tool is successfully installed, launch O-Calc Pro and
open a pole file.
After the pole file loads and capacity calculations are complete, select the
View►Reports menu to launch the Reports tool.
When the Reports Tool window opens go to the menu and select
“File►Options►Select RDLC Editor…”. This will launch a browser window.
Navigate the folders to find “MSReportBuilder.exe”. If you installed the tool
in the default location it will likely be found in the folder C:\Program
Files\Microsoft SQL Server\Report Builder 2.0.
Once you have located the folder, Click on “MSReportBuilder.exe” and click
on the Open button.
If you select “File►Edit Report Template” and open a template file it will
launch the Report Builder.

Editing Report Definitions using Microsoft SQL Report Builder 2.0 User’s Guide
31 January 2014 ©2014 Osmose Utilities Services, Inc 7
Using the Report Designer
Creating a New Report Template
You must first create an empty template from the O-Calc Pro Reports Tool.
This step embeds information about the pole data fields and properties in the
new template.
To create a new report template, launch the Reports Tool (View►Reports…
on the menu).
Select “File►New Report Template” from the Reports Tool menu. A
browser window will open. Navigate to the folder where you wish to store
your reports (see Where The Reports Tool Finds Reports) and type a name
for your report in the “File name” field. The filename must end with an
“.rdlc” extension. If you do not type the extension it will automatically be
appended to the filename for you. Click the Save button. The browser will
close and the Report Builder will launch.
Note that filenames with the .rdlc extension are of a format that is
specifically designed for O-Calc Pro reports. It is a unique version of the .rdl
files that the SQL Report Builder normally uses.

Editing Report Definitions using Microsoft SQL Report Builder 2.0 User’s Guide
8 ©2014 Osmose Utilities Services, Inc 31 January 2014
Opening and Understanding the Report Builder
Start editing your design by opening an existing report in the O-Calc Pro
Reports tool using the File►Open menu or create a new report using
File►New Report Template. In either case you will see a screen like Figure
1 below:
Figure 1
There are a number of views in the main window. These include (left to
right, top to bottom); Report Data, Design, Row/Column Groups and
Properties. Visibility for all but the Design view can be controlled from the
View menu.
The Report Data view lists the elements that provide the data that can be
displayed in your report.
The Design view is where you place the reporting data as you would like it to
appear on the output page. You design your report layout here using the
elements listed in the Report Data view. Data is placed in data regions on the
display layout. Data regions are defined in tables, lists, rectangles and
textboxes. Once placed in the display area they can be moved and sized
graphically.
The Row/Column Groups view is used to organize the appearance of data
in a table or other data region.
The Properties view lists properties for items selected in the Design view.
Properties can be modified for fine tuning position and size, color, border
type and other attributes of an item.
Report Data
Design View
Properties
Row/Column Groups

Editing Report Definitions using Microsoft SQL Report Builder 2.0 User’s Guide
31 January 2014 ©2014 Osmose Utilities Services, Inc 9
A complete explanation of the Report Builder’s features and functions is
beyond the scope of this document but can be found in the Report Builder
Help file. There are some restrictions to its use with O-Calc Pro’s report
templates. See “Restrictions when working with the Report Builder”.
Overview of the Design Template Layout
The design view represents the canvas on which you will define areas where
report information will be displayed.
The report is separated into three different regions: Header, Body, and
Footer.
A Header and Footer will appear on each page. The Body will contain report
information that flows from page to page.
Headers and Footers
A blank template does not include headers or footers by default. Headers
and\or footers can be added anytime.
Headers and footers can contain most of the elements of the body layout.
When laying out your header and footer consider information that you wish
to be displayed on the top and bottom of each page. The size of header and
footer definitions will affect the space left for the body.
Data that you might include on your headers or footers are things like the
report title, the pole identification, file name or page numbers. The page
number is a built-in field that can only appear in a header or footer.
Body
The Body region is where you place tables, text, images and other design
elements to organize and display data. The placement of these elements on
the output report is governed by the size and location of the element on the
template itself and the physical size of the output media’s printable area.
The reporting engine will fit the template elements to the physical page size.
Your design should consider the intended output medium and make sure that
your element placement does not exceed the printable margins. If you do not,
you may find page breaks and blank pages where you do not want them.
Display region elements (text, images and tables) can be selected from the
Insert ribbon and then placed in the body region. Size and location can be
adjusted using the mouse or by editing the item’s properties. Consult the
Report Builder help documentation for details.
The available Report Data objects are displayed in the Report Data view to
the left of the Design view. You insert these objects in your report’s display
elements. When a pole report is rendered the corresponding values for these
objects are displayed.

Editing Report Definitions using Microsoft SQL Report Builder 2.0 User’s Guide
10 ©2014 Osmose Utilities Services, Inc 31 January 2014
Using Pole Data in Your Report
Understanding the Report Data
There are a number of reporting objects that you can use. These are broken
down into the following categories; Built-in Fields, Parameters, Images and
Pole Data.
Built-in Fields
These items are used to display properties of the report itself. These values
are independent of the pole data. The following items are available.
Parameter Description
ExecutionTime Displays the time and date that the report was generated. Data/Time format can be controlled using the Visual Basic Format function.
PageNumber Displays the current page number. This value can only be used in Header and Footer regions.
ReportName Displays the name of the Report Template file.
Total Pages Displays the total number of pages in the report. This value can only be used in Header and Footer regions.
User ID Displays the windows login account for the user who generates the report.
Language Displays the language encoding used for this report (e.g. “en-us” for US English).
Note: The following Built-In Fields are not supported by O-Calc Reports. If
they are included in a report definition, they will always return an empty value.
ReportFolder
ReportServerURL

Editing Report Definitions using Microsoft SQL Report Builder 2.0 User’s Guide
31 January 2014 ©2014 Osmose Utilities Services, Inc 11
Parameters
These items contain singular values for the pole instance that is the subject of
the report. Where applicable, the values are displayed in the appropriate unit
scale based on the Units Convention (English or Metric) that is set for the
pole data. The units for the value are in the parameter description.
Parameter Description
Pole_Actual_length The length of the pole in feet or meters.
Pole_Allowable_Moment_At_MCU_Height The allowable moment at the height of Maximum Capacity Utilization (MCU), expressed in foot-pounds or Newton-meters.
Pole_Allowable_Moment_GL The allowable moment at GroundLine in foot-pounds or Newton-meters (rounded to 0 decimal places).
Pole_Allowable_Stress_GL The allowable bending stress at GroundLine in pounds per square inch or kilopascals (rounded to 0 decimal places).
Pole_Anchor_Strength_Factor The Anchor Strength factor for the applied Loadcase.
Pole_ANSI_FSR_Applied Value displayed is “Yes” or “No” depending on whether ANSI O5.1.2008 Fiber Strength Reduction (FSR) is used for the applied Loadcase.
Pole_Aux_Data_n Value displayed is one of 8 free-form Auxiliary Data values where n is 1..8 .
Pole_Aux_Data_n_Label The label value associated with the Auxiliary Data value (Pole_Aux_Data_n) where n is 1..8.
Pole_Circum_GL_Applied The Pole Circumference at setting depth from the butt in inches or centimeters.

Editing Report Definitions using Microsoft SQL Report Builder 2.0 User’s Guide
12 ©2014 Osmose Utilities Services, Inc 31 January 2014
Parameter Description
Pole_Circum_GL_Method Value displayed is “Calculated” or “Measured”.
Pole_Circum_Tip The Pole Circumference at the tip in inches or centimeters.
Pole_Class The Pole Class.
Pole_Code The Species Code.
Pole_Construction_Grade The construction grade as defined in the applicable code or standard.
Pole_Deflection_Amount The deflection at the pole tip in inches or centimeters.
Pole_Deflection_Angle The global reference angle associated with the direction of tip deflection in degrees.
Pole_Density The pole density in pounds per cubic foot or kilograms per cubic meter.
Pole_Effective_GL_Circumference The effective pole GroundLine Circumference in inches or centimeters.
Pole_Factor_Of_Safety The Pole Factor of Safety expressed as applied load divided by pole capacity.
Pole_Fiber_MOR_at_GL The Pole GroundLine Fiber Modulus of Rupture (ultimate stress) in pounds per square inch or kilopascals.
Pole_File_Name The pole data file name, ending in .pplx. This does not display the full file path.
Pole_GL_Fiber_Stress The Pole GroundLine Fiber stress in pounds per square inch or kilopascals.
Pole_Guy_Strength_Factor The Pole Guy strength factor for the applied Loadcase.

Editing Report Definitions using Microsoft SQL Report Builder 2.0 User’s Guide
31 January 2014 ©2014 Osmose Utilities Services, Inc 13
Parameter Description
Pole_Ice_Density The ice density in pounds per cubic foot or kilograms per cubic meter.
Pole_Ice_Thickness The ice thickness in inches or millimeters.
Pole_ID The Pole Number.
Pole_Installation_Or_Replacement Value displayed is “At Installation”, “At Replacement” or “Unset” depending on the setting for the applied Loadcase.
Pole_Loading_District The loading district (“Heavy”, “Medium” or “Light”) as described in the applicable code or standard. Edit the customloadingdistricts.txt file to modify these values.
Pole_Mfg_Length The pole’s manufactured length in feet or meters.
Pole_Modulus_Of_Elasticity The pole’s Modulus of Elasticity in pounds per square inch or kilopascals rounded to the nearest whole number.
Pole_NESC_Rule The NESC Rule used by the applied Loadcase. Values returned can be empty, “250 Rule” (if NESC Loadcase Method) or “-“.
Pole_New_Or_Existing The pole’s survey state; “New” or “Existing”.
Pole_Rule_250C_Max_Wind_Speed The calculated maximum wind speed per NESC Rule 250C, in miles per hour or kilometers per hour.
Pole_SettingDepth The pole setting depth in Feet or Meters.

Editing Report Definitions using Microsoft SQL Report Builder 2.0 User’s Guide
14 ©2014 Osmose Utilities Services, Inc 31 January 2014
Parameter Description
Pole_Species The name of the pole’s wood species.
Pole_Strength_Factor The pole’s strength factor.
Pole_Structure_Type The type of pole structure. The displayed value is one of “Auto”, “Tangent”, “Angle”, “Deadend” or “Junction”.
Pole_Tilt The pole tilt in degrees from vertical.
Pole_Transverse_Wind_Load_Factor The transverse wind load factor for the applied Loadcase.
Pole_Vertical_Load_Factor The vertical load factor for the applied Loadcase.
Pole_Wind_Angle_Method The value displayed is either “Manual” if the wind angle calculation method is set to Override Wind, or “Automatic”.
Pole_Wind_Pressure The Horizontal wind pressure in pounds per square foot or Pascals for the applied Loadcase.
Pole_Wind_Speed_Applied The Wind speed for the applied Loadcase in miles per hour or kilometers per hour.
Pole_Wire_Tension_Load_Factor The Wire Tension Load Factor for the applied Loadcase.
Software_Version The version of O-Calc® Pro used to generate the report.
Sum_Anchor_Status The pole’s calculated anchoring status. Values can be empty, “No Anchors”, “N/A”, “Inadequate”, “At Cap”, “Near Cap” or “Adequate”.

Editing Report Definitions using Microsoft SQL Report Builder 2.0 User’s Guide
31 January 2014 ©2014 Osmose Utilities Services, Inc 15
Parameter Description
Sum_Bending_Moment_GL The pole’s calculated bending moment at GroundLine in foot-pounds or Newton-meters.
Sum_Bending_Moment_Max The pole’s calculated maximum bending moment in foot-pounds or Newton-meters at any height on the pole.
Sum_GLCU The pole’s calculated Ground Line Capacity Utilization as a percent to one decimal place.
Sum_GLCU_Height The height of the pole’s calculated Ground Line Utilization, expressed in feet or meters to one decimal place. This value should always be zero.
Sum_GLCU_Load_Angle The Load Angle for the pole’s GroundLine Capacity Utilization, expressed in degrees to one decimal place.
Sum_GLCU_Wind_Angle The Wind Angle for the pole’s GroundLine Capacity Utilization, expressed in degrees to one decimal place.
Sum_Guy_Solved Expresses whether or not the Guy system calculations have successfully converged on a solution. Value is “Yes” or “No”.
Sum_Guy_Status Displays Guy system status as “Unguyed”, “Adequate”, Inadequate”, “Near Cap” or “At Cap”. If the program cannot converge on a solution it displays the value “Guys Not Solved”.
Sum_MCU The pole’s calculated Maximum Capacity Utilization,

Editing Report Definitions using Microsoft SQL Report Builder 2.0 User’s Guide
16 ©2014 Osmose Utilities Services, Inc 31 January 2014
Parameter Description
expressed as a percent to one decimal place.
Sum_MCU_Height The height of the pole’s calculated Maximum Capacity Utilization, expressed in feet or meters to 1 decimal place.
Sum_MCU_Load_Angle The load angle for the pole’s Maximum Capacity Utilization, expressed in degrees to one decimal place.
Sum_MCU_Wind_Angle The wind angle for the pole’s Maximum Capacity Utilization, expressed in degrees to one decimal place.
Sum_Pole_Status The calculated pole status shown as; “Guy Wires Adequate”, “Guy Wires Inadequate”, “Guy Wires Near Capacity”, “Guy Wires at Capacity”, “UnGuyed” or “N/A” .
Sum_Reporting_Angle The rotational angle about which the reported loading results are resolved, expressed in degrees.
Sum_Reporting_Angle_Type The type of reporting angle shown as; “none”, “Relative”, “Fixed”, “Tip Deflection”, “Wind”, “Automatic”, “Load”.
Sum_Vertical_Buckling_Capacity The calculated vertical buckling capacity, expressed in pounds or Newtons.
Sum_Vertical_Buckling_Column_Height The effective buckling column height, expressed in feet or meters to one decimal place.
Sum_Vertical_Buckling_Constant The buckling constant.
Sum_Vertical_Buckling_CU The calculated percent of vertical load, expressed to one

Editing Report Definitions using Microsoft SQL Report Builder 2.0 User’s Guide
31 January 2014 ©2014 Osmose Utilities Services, Inc 17
Parameter Description
decimal place.
Sum_Vertical_Buckling_Load The calculated vertical load at the effective buckling height, expressed in pounds or Newtons.
Sum_Vertical_Buckling_Margin_Of_Safety The vertical capacity divided by the vertical load at the buckling column height.
Sum_Vertical_Buckling_Min_GL_Diameter The minimum buckling diameter at the GroundLine in inches or centimeters to two decimal places.
Sum_Vertical_Buckling_Section_Diameter The calculated buckling diameter at the effective buckling height, expressed in inches or centimeters to two decimal places.
Sum_Vertical_Buckling_Section_Pct_Column_Height
The calculated percent of the buckling column height to two decimal places.
Sum_Vertical_Buckling_Wind_Angle The calculated worst wind angle for vertical load in degrees to one decimal place.
Sum_Wind_Angle Reserved for future use.
Type of Units
The Units parameters return a string useful for labeling values displayed in
reports. The text depends on the selected Units Convention (English or
Metric).
Parameter English Units Metric Units
Units_Density_Large_Abrev “pcf” “kg/m3”
Units_Density_Large_Long “Pounds Per Cubic Foot”
“Kilograms per Cubic Meter”
Units_Len_Large_Abrev “ft” “m”
Units_Len_Large_Long “Feet” “Meters”

Editing Report Definitions using Microsoft SQL Report Builder 2.0 User’s Guide
18 ©2014 Osmose Utilities Services, Inc 31 January 2014
Parameter English Units Metric Units
Units_Len_Small_Abrev “in” “cm”
Units_Len_Small_Long “Inches” “Centimeters”
Units_Len_Tiny_Abrev “in” “mm”
Units_Len_Tiny_Long “Inches” “Millimeters”
Units_Load_Abrev “lbs” “N”
Units_Load_Long “Pounds” “Newtons”
Units_Moment_Abrev “ft-lb” “N-m”
Units_Moment_Long “Foot-Pounds” “Newton-meters”
Units_Press_Large “psf” “Pa”
Units_Press_Small “psi” “kPa”
Units_Temp_Abrev “f” “c”
Units_Temp_Long “Fahrenheit” “Celsius”
Units_Vel_Abrev “mph” “kph”
Units_Vel_Long “Miles Per Hour” “Kilometers Per Hour”
Units_Weight_Abrev “lbs” “kg”
Units_Weight_Long “Pounds” “Kilograms”
Chart Images Parameters
The following parameters render image items
that can be added to your report. See section
“Adding Charts to Reports”.
Parameter Description
Chart_Anchor_Load_vs_Wind_Angle Displays Anchor Load vs. Wind Angle line chart.
Chart_Bending_Moment_vs_Height Displays Bending Moment vs. Height line chart.
Chart_Bending_Moment_vs_Wind_Angle Displays Bending Moment vs. Wind Angle line chart.

Editing Report Definitions using Microsoft SQL Report Builder 2.0 User’s Guide
31 January 2014 ©2014 Osmose Utilities Services, Inc 19
Parameter Description
Chart_Capacity_Utilization_vs_Height Displays Capacity Utilization vs. Height line chart.
Chart_Capacity_Utilization_vs_Wind_Angle Displays Capacity Utilization vs. Wind Angle line chart.
Chart_CapacityMeter Displays the Capacity meter graphic.
Chart_Deflection_vs_Height Displays Deflection vs. Height line chart.
Chart_GroundLine_Bending_vs_Height Reserved for future use.
Chart_Guy_Tension_vs_Wind_Angle Displays Guy Tension vs. Wind Angle line chart.
Chart_OverView Displays the 3D View image.
Chart_Rotational_Torque_vs_Height Reserved for future use.
Chart_Shear_Load_vs_Height Displays Shear Load vs. Height line/area chart.
Chart_SideView Displays image from the Schematic view.
Chart_Tension_Force_vs_Height Reserved for future use.
Chart_Total_Stress_vs_Height Displays Total Stress vs. Height line/area chart.
Chart_Total_Stress_vs_Wind_Angle Displays Total Stress vs. Wind Angle line chart.
Chart_Wind_Force_vs_Height Reserved for future use.
Images
O-Calc Pro does not use this particular dataset.
Pole Data
The following items are used to report on the component elements that make
up the pole. The values are returned in units corresponding to the Units
Convention (English or Metric) set in the O-Calc Pro interface.
Element Value Name Description
Anchor

Editing Report Definitions using Microsoft SQL Report Builder 2.0 User’s Guide
20 ©2014 Osmose Utilities Services, Inc 31 January 2014
Element Value Name Description
Owner Displays the anchor Owner.
RodLengthAGL Displays the length of the rod
associated with this anchor.
Above ground level in inches
or centimeters.
RodStrength Displays the strength of the
rod in pounds or Newtons.
HoldingStrength Displays the holding strength
of the anchor for the selected
soil class in pounds or
Newtons.
Description Displays the general
descriptive comment
associated with this anchor.
Capacity_Allowable Displays the Minimum of the
RodStrength or the
HoldingStrength, expressed in
pounds or Newtons.
Capacity_Rated Displays the RodStrength,
expressed in pounds or
Newtons.
Capacity_Consumed Displays the calculated sum
of Guy tensions applied to the
anchor at the pole’s current
wind angle, expressed in
pounds or Newtons.
Capacity_Consumed_Max Displays the worst case sum
of Guy tensions applied to
the anchor regardless of the
pole’s current wind angle,
expressed in pounds or
Newtons.
Angle Displays the angle from the
horizontal plane of the anchor
to the Guy attachment point
on the pole in degrees.
Offset Displays the horizontal
distance from pole to anchor
in feet or meters.

Editing Report Definitions using Microsoft SQL Report Builder 2.0 User’s Guide
31 January 2014 ©2014 Osmose Utilities Services, Inc 21
Element Value Name Description
Status Displays the calculated status
of the anchor returned as
“Adequate”, “Near Capacity”
or “Fail”.
StrengthFactor Displays the strength factor
assigned to the anchor.
Guy
Description Displays the general
descriptive comment for this
Guy.
Type Displays the Guy type;
“Down”, “Span/Head”,
“Sidewalk”, “Crossarm” or
“Pushbrace”.
Owner Displays the Guy owner.
Capacity_Rated Displays the Guy strength,
expressed in pounds or
Newtons.
Capacity_Allowable Displays the allowed
capacity, expressed in pounds
or Newtons.
Capacity_Consumed Displays the tension applied,
expressed in pounds or
Newtons.
Capacity_Consumed_Max Displays the maximum
tension applied, expressed in
pounds or Newtons.
Diameter Displays the guy wire
diameter, expressed in inches
or millimeters.
Height Displays the attachment
height of the Guy from
GroundLine, expressed in feet
or meters.
HeightAtOtherEnd Displays the height at the
anchor, expressed in feet or
meters.

Editing Report Definitions using Microsoft SQL Report Builder 2.0 User’s Guide
22 ©2014 Osmose Utilities Services, Inc 31 January 2014
Element Value Name Description
InclineAngle Displays the angle of the Guy
measured from a horizontal
plate at the GroundLine,
expressed in degrees.
PreTension Displays the pretension value
of the Guy, expressed in
pounds or Newtons.
TensionAllowable Displays the calculated
allowed tension, expressed in
pounds or Newtons.
TensionAppliedTotal Displays the total applied
tension in pounds or
Newtons.
TensionAppliedHorizontal Displays the horizontal
horizontal tension applied,
expressed in pounds or
Newtons.
TensionHorizontalResolved Displays the horizontal force
resolved to reporting angle,
expressed in pounds or
Newtons.
TensionAppliedVertical Displays the vertical
component of tension applied,
expressed in pounds or
Newtons.
LeadLength Displays the lead length,
expressed in feet or meters.
LeadAngle Displays the lead angle in,
expressed degrees.
ModulusOfElasticity Displays the Modulus of
Elasticity for the Guy,
expressed in pounds per
square inch or kilopascals.
RTSstrength Displays the rated tensile
strength, expressed in pounds
or Newtons.
RestingLength Displays the rest length of the
Guy, expressed in feet or
meters.

Editing Report Definitions using Microsoft SQL Report Builder 2.0 User’s Guide
31 January 2014 ©2014 Osmose Utilities Services, Inc 23
Element Value Name Description
StretchAtCurrentTension Displays the amount of
stretch at the current tension,
expressed in inches or
centimeters.
Weight Displays the weight of the
Guy, expressed in
pounds/foot or
Kilograms/Meter.
Wind_Angle Displays the reporting wind
angle, expressed in degrees.
Status Displays the Guy status as
“Adequate”, “At Capacity”,
“Near Capacity” or “Fail”.
MomentFromLeaning Reserved for future use.
MomentFromTension Displays the Moment from
Tension value, expressed in
foot-pounds or Newton-
meters.
MomentFromOffset Displays the Moment from
Offset value in, expressed
foot-pounds or Newton-
meters.
MomentFromWind Displays the Moment from
Wind value in, expressed
foot-pounds or Newton-
meters.
MomentSumAtGL Displays the calculated
Moment at GroundLine value,
expressed in foot-pounds or
Newton-meters.
StrengthFacor Displays the strength factor
for the Guy.
PercentSolid Displays the percent of guy
wire cross sectional area that
is solid material, expressed in
percent.

Editing Report Definitions using Microsoft SQL Report Builder 2.0 User’s Guide
24 ©2014 Osmose Utilities Services, Inc 31 January 2014
Element Value Name Description
Load
Height Displays the height of the
attachment above GroundLine
in feet or meters.
Type Displays the type of
attachment as;
“GenericEquipment”,
“Crossarm”, ‘Insulator”,
“PowerEquipment” or
“Streetlight”. Other types may
be defined in the future.
Description Displays the description detail
for the attachment.
Percent_MCU Displays the contribution of
the attachment to the pole’s
Maximum Capacity
Utilization, expressed in
percent.
Percent_GLCU Displays the contribution of
the attachment to the pole’s
GroundLine Capacity
Utilization, expressed in
percent.
Percent_VerticalCU Displays the contribution of
the attachment to the pole’s
Vertical Capacity Utilization,
expressed in percent.
Element Note that interpretation of these values depend on the
Element’s type or subtype.
Description Displays the description detail
for the element.
Type Displays the element type.
SubType Displays the element subtype.
Owner Displays the owner.
Priority Reserved for future use.

Editing Report Definitions using Microsoft SQL Report Builder 2.0 User’s Guide
31 January 2014 ©2014 Osmose Utilities Services, Inc 25
Element Value Name Description
AttachHeight Displays the height the
element is attached measured
from GroundLine, expressed
in feet or meters.
OtherEndHeight Displays a value in feet or
meters. Interpretation is
dependent on Element Type.
Sag Displays the sag value in feet
or meters.
Offset Displays the offset value in
inches or centimeters.
GapToPole Displays the value of the gap
from the element to the pole
in inches or centimeters.
OffsetAngle Displays the offset angle
value in degrees.
RotateAngle Displays the rotation angle
value in degrees.
InclineAngle Displays the value of the
inclination angle from vertical
in degrees.
CableDiameter Displays the diameter of a
cable element in inches or
millimeters.
CableModulusOfElasticity Displays the Modulus of
Elasticity of a cable element
in pounds or Newtons.
CableRTSstrength Displays the Rated Tensile
Strength of a cable element,
expressed in pounds or
Newtons.
CableAllowableTension Reserved for future use.
CableInitialTension Displays the initial tension for
a cable in pounds or Newtons.
CableRequiredTension Reserved for future use.

Editing Report Definitions using Microsoft SQL Report Builder 2.0 User’s Guide
26 ©2014 Osmose Utilities Services, Inc 31 January 2014
Element Value Name Description
CableAppliedTension Displays the applied tension
for a cable in pounds or
Newtons.
LeadAngle Displays the lead angle in
degrees.
UnitWeight Displays the unit weight in
pounds or Kilograms.
UnitHeight Displays the unit height in
inches or centimeters.
UnitWidth Displays the unit width in
inches or centimeters.
UnitDiameter Displays the unit diameter in
inches or centimeters.
UnitLength Displays the unit length in
inches or centimeters.
ShapeFactor Displays the Shape factor
applied. If cylinder then 1.0
otherwise 1.6. Value is 0 in
cases where this does not
apply.
CableWeightPerUnitLength Displays the cable weight per
unit length in pounds per foot
or kilograms per meter.
CableLengthLead Displays the bale length of
lead in feet or meters.
CableLengthTotal Displays the total cable length
in feet or meters.
Tension Displays the tension in
pounds or Newtons.
GuyLengthAtMcu Displays the Guy Length at
Maximum Capacity
Utilization in feet or meters.
MomentFromLeaning Displays the moment from
leaning in foot pounds or
Newton meters.

Editing Report Definitions using Microsoft SQL Report Builder 2.0 User’s Guide
31 January 2014 ©2014 Osmose Utilities Services, Inc 27
Element Value Name Description
MomentFromTension Displays the moment from
tension in foot pounds or
Newton meters.
MomentFromOffset Displays the moment from
offset in foot pounds or
Newton meters.
MomentFromWind Displays the moment from
wind in foot pounds or
Newton meters.
MomentSumAtGL Displays the calculated
moment at GroundLine in
foot pounds or Newton
meters.
ShearLoad Displays the shear load in
pounds or Newtons.
PercentAppliedLoad Reserved for future use.
PercentAppliedMoment Displays the percent of the
applied moment.
PercentPoleMomentCapacity Displays the percent of
moment capacity.
BendingStress Displays the bending stress in
pounds per square inch or
kilopascals.
VerticalLoad Displays the vertical load in
pounds or Newtons.
VerticalStress Displays the vertical stress in
pounds per square inch or
kilopascals.
TotalStress Displays the total stress
(Bending stress + Vertical
stress) in pounds per square
inch or kilopascals.
PercentPoleStressCapacity Displays the percent of total
stress capacity (Total stress /
Allowable Bending Stress)
used by the element in pounds
per square inch or kilopascals.

Editing Report Definitions using Microsoft SQL Report Builder 2.0 User’s Guide
28 ©2014 Osmose Utilities Services, Inc 31 January 2014
Element Value Name Description
NoteAuthor Displays the name of the
note’s author.
NoteDate Displays the date the note was
created or altered.
NoteContent Displays the content of the
note.
Images
ImagePath Returns a list of image paths.
This value cannot be used in a
Text Box.

Editing Report Definitions using Microsoft SQL Report Builder 2.0 User’s Guide
31 January 2014 ©2014 Osmose Utilities Services, Inc 29
A Quick Tutorial
A Simple Table Example
The following illustrates how to get started creating your own report
templates.
Most reports use tables to display information. In this example we will build
a simple report that uses a table to display the Type, Subtype and Description
for all Elements of a pole.
Create a New Report Template
The first step is to create a new report template. You must do this from O-
Calc Pro. O-Calc Pro creates an empty template that contains the schema that
will be used to access the pole data and parameter information.
To create a new report template, select View►Reports… from the O-Calc Pro
main menu. This will open the Reports window.
From the Reports menu select File►New Report Template. This will open a
browser window titled “Create Report” that is set to your user’s Reports
folder by default.
Figure 2

Editing Report Definitions using Microsoft SQL Report Builder 2.0 User’s Guide
30 ©2014 Osmose Utilities Services, Inc 31 January 2014
Enter “Tutorial1” for the File name and click the Save button.
Figure 3
The Report Builder launches displaying an empty design region with the
Report Data panel on the left and the item properties panel on the right. In
this case the properties shown are for the entire Report. Take a moment to
familiarize yourself with the Report properties.

Editing Report Definitions using Microsoft SQL Report Builder 2.0 User’s Guide
31 January 2014 ©2014 Osmose Utilities Services, Inc 31
Figure 4
Set the Page Size and Orientation
By default, a new template is set for a page size 8.5in wide by 11in high.
This describes a standard Portrait Letter format.
Click anywhere on the blue area outside the report body on the layout view.
The Report Properties will display.
Scroll down until you find the Page properties and look for InteractiveSize and
PageSize. Set both of these values to “8.5in,11in” for Portrait Letter layout.
Set the values to “11in, 8.5in” for Landscape Letter layout.
Adjust the margins if desired.
Set the Body Size
Next, click the left mouse button anywhere in the white design body area.
You will see the Properties view change to show the Body properties. The
body area is your canvas. This area must be within the margins of the Report
properties.
For example, if you set the report page size properties to 8.5in by 11in
(Portrait Letter) and the report page margins are .25 in on all sides, you
should set the body size to no more than 8in by 10.5 in.

Editing Report Definitions using Microsoft SQL Report Builder 2.0 User’s Guide
32 ©2014 Osmose Utilities Services, Inc 31 January 2014
Add a Header and Footer
As it is good practice, you should add headers and footers to the template.
These will appear on every page. Here you will add the pole filename to the
header and the page number to the footer.
Click on the Insert tab on the menu of the Report builder. At the right of the
ribbon you will see two buttons labeled Header and Footer.
Add a Header
Click on the Header button and select “Add Header”. The header area will
appear at the top of the design view.
Next, look under the Report Data view. Expand the Parameters folder and
find the parameter labeled “Pole_File_Name”. Left click and hold on this
parameter and drag it onto the Header area.
Figure 5

Editing Report Definitions using Microsoft SQL Report Builder 2.0 User’s Guide
31 January 2014 ©2014 Osmose Utilities Services, Inc 33
You can resize the area for the text by left clicking and dragging on any of
the resizing handles. You can move the text area by clicking on the move
handle, , and dragging.
Add a Footer
Now add the Footer with the page number on it. Go back to the ribbon bar
and click on the Footer button and then select Add Footer. You may have to
use the scroll bar at the right of the design view to scroll to the bottom of the
Body area to see the page footer.
On the Report Data View, expand the Built-In Fields and locate the Page
Number Built-In Field. Left click and hold and drag it into the Footer area.
You will notice as you drag it across the Report area of the body that the
cursor changes to a slashed circle indicating that you cannot drop it into the
main body of the report.
Figure 6
Add a Report Title
Now that you have a header and footer you can add some data. First add a
title to the report.
Right click near the top of the reporting area in the design view. A context
menu will pop up. Move the cursor over “Insert” and then select “Text Box”
(you can also click the Text Box button on the Insert menu’s ribbon bar).
An empty box will appear with move and resize handles. Type the title for
this report. “Tutorial 1 – a sample table of elements” was entered in the
Figure 7 below. You can move and resize the box to get the text placement

Editing Report Definitions using Microsoft SQL Report Builder 2.0 User’s Guide
34 ©2014 Osmose Utilities Services, Inc 31 January 2014
and fill the space that you want. You may have to resize the textbox for all
the text to appear.
By default you will get 10 pt text. This is not really what you want for a title
so go to the properties view and change the FontSize property in the Font
property group to “16pt”. Just highlight the “10pt”, type “16pt” and hit Enter.
Figure 7
Add a Table
Right click on the Report Body, move the cursor over Insert and select
Table. This will add an empty table with a header row a data row and 3
columns.
Expand the Report Data PPL dataset on the left and scroll down looking for
the “Element” data.
The first three items under the Element are “Description”, “Type” and
“Subtype”. In this example you will put Type in the first column, Subtype in
the second column and Description in the third column.
Left Click, hold and drag the “Type” item into the first column and drop it.

Editing Report Definitions using Microsoft SQL Report Builder 2.0 User’s Guide
31 January 2014 ©2014 Osmose Utilities Services, Inc 35
Figure 8
The column header, “Type” and [Type] value are filled in for you. You can
change the text of the column header if you wish.
Repeat this for the Subtype in the second column and Description in the third
column.
When you finish these steps you will see something that looks like this.
Figure 9
You may want to resize the rows and columns. The resizing controls for the
column and row widths are on the control bars at the top and left of the table.
As you move your cursor across the top or down the side you will see the
cursor change. When the cursor changes to a double ended arrow, click and
drag to change the width.
To change the whole table size click on the faint boundary lines at the bottom
and right of the table. The row and column controls will disappear and the
move and resize handles will appear.
Figure 10
If you click anywhere else on the report layout the handles will disappear and
you will see that the borders are very light. You can change the border style.
Just click anywhere on one of the borders until the row and column controls
appear then click on one of the row or column controls. The Properties view
will show Tablix1 properties. At the top of the properties is the Border
property group. You can change the border attributes here.

Editing Report Definitions using Microsoft SQL Report Builder 2.0 User’s Guide
36 ©2014 Osmose Utilities Services, Inc 31 January 2014
Change the border width to 2 pt and the border style to solid.
Figure 11
The interior cell borders can be changed by clicking on each cell individually
or clicking and dragging to select multiple cells then change the border
attributes for the selected cells.
View the Result
Save the report template file by pressing Ctrl-S or clicking on the disk icon at
the top of the window.
DO NOT PRESS THE RUN BUTTON on the Report Builder ribbon. Your
new report template can only be used with the O-Calc Pro Reports tool.
To view your report:
Minimize the Report Builder window. Your O-Calc Reports window
should still be open (from when you created the empty template).
Click the Reports dropdown on the menu bar. You should see
“Tutorial 1”. Select that.
Figure 12

Editing Report Definitions using Microsoft SQL Report Builder 2.0 User’s Guide
31 January 2014 ©2014 Osmose Utilities Services, Inc 37
You should see a report that looks something like this.

Editing Report Definitions using Microsoft SQL Report Builder 2.0 User’s Guide
38 ©2014 Osmose Utilities Services, Inc 31 January 2014
Figure 13
Your report will display the name of the pole file at the top of each page (in
this case it was “example.pplx”) and the page number at the bottom of each
page. One title is printed on the first page and a listing of element values will
fill the body of the rest of the remaining pages. Enough pages will be
generated to display all element information.
Beyond this Tutorial
This is an extremely simple report. However, the concepts and methods
illustrated here can be used to create your own reports. There are many more
controls and ways of formatting the tables and text and adding charts and
images to your reports. Many aspects of the reports can be controlled with
expressions that test the values to control visibility and formatting. The
Report Builder provides a rich set of tools that allows you to examine, edit
and design the report layout and content.
Examine the O-Calc® Pro Analysis Report template to get a view of some of
the powerful formatting controls that are available to you. Right click on

Editing Report Definitions using Microsoft SQL Report Builder 2.0 User’s Guide
31 January 2014 ©2014 Osmose Utilities Services, Inc 39
some of the items and select properties. You will see a number of items that
are used to control the display and content. Before you experiment with
editing or changing the stock template it is recommended that you save your
experiment with a new name.
Details about formatting methods and controls that are available to you are
found in the Report Builder help documentation.

Editing Report Definitions using Microsoft SQL Report Builder 2.0 User’s Guide
40 ©2014 Osmose Utilities Services, Inc 31 January 2014
Layout Tips
Adding Charts to Reports
You can add a number of chart graphics to your layout. These objects are
available in the Parameters list and begin with “Chart_”. However, unlike the
other data elements, charts are actually image objects. To put them in your
report you first need to insert an image and then use the desired Chart
parameter to display the graphic. These instructions explain how you add a
chart.
Right click in the design view where you want to add the chart.
Move the cursor over Insert and select Image. When you release the mouse
button the Image Properties dialog will pop up. Note that if you close this
dialog you can get it back by right click on the Image object and selecting
Image Properties…. A dialog titled Image Properties will appear as in
Figure 14 below.
Select the image source “External” from the drop down list. This is crucial.
Your chart image will not appear if you do not do this.
In the “Use this image” field, enter the name of the chart parameter enclosing
it in square brackets ( [ ] ). For example, to display the pole graphic as it
appears in the 3D View, use “[@Chart_Overview]” (no quotes, see Figure
14).
Figure 14
Select the image source
Use this image

Editing Report Definitions using Microsoft SQL Report Builder 2.0 User’s Guide
31 January 2014 ©2014 Osmose Utilities Services, Inc 41
Click OK. You can move or resize your chart using the handles on the image
object.
Keep Element Boundaries within Printable Margins
While the Report Builder is a great tool, it can sometimes make unexpected
adjustments to your layout, especially when you are dragging and resizing
your elements with a mouse.
When you have display elements that abut the printable margins you should
check that all elements remain within the printable margins before you save
your report template.
Use the ruler at the top of your layout as a guide to check the bounds. If you
scroll all the way to the right of your layout and look at the ruler, you will see
the total width of the layout (you can also check this by clicking on the Body
and checking the width in the Properties view). The total width should not
exceed the printable width of your output format.
For example, suppose you want your report printed in landscape format, 11in
wide by 8.5in high. Assuming that the unprintable margins on either side
(left and right) total .5 inches, this means that the total printable width will be
10.5 inches and that the width of the body should not exceed 10.5 inches. If
you look at the ruler and you find the width to be over 10.5 inches, even
slightly, then you need to scan down the right edge of your layout and move
or adjust the size of objects that extend beyond the right margin.
You should also click on the background and make sure that the width
property is not greater than 10.5 inches for the body.
In reports that are to be printed in the portrait format on standard 8.5x11 inch
paper, the width should not exceed 8 inches (allowing for .25 inch margins
on the left an right).
If you do not do this, you might find page breaks in your reports where you
do not expect them.
It is good practice to always check the margins before saving your report
template changes.
Saving Copies of Templates from within Report Builder
Take care when using the Save As function to save a copy of your template.
By default, Report Builder will save the file with an “.rdl” extension. You
must save your copy with an “.rdlc” extension for O-Calc reporting to find
the file.
On the Save As Report dialog, select “All Items (*.*)” in the “Items of type:”
field dropdown. Then enter the entire filename, including the “.rdlc”.
This ensures that the template file is saved with a name that is recognized by
O-Calc Reports. You will also need to make sure that the template file is
placed in the correct Reports folder for it to be found by the O-Calc Pro
Reports tool. See “Where the Reports Tool Finds Reports” for details.
Editing Report Definitions using Microsoft SQL Report Builder 2.0 User’s Guide
42 ©2014 Osmose Utilities Services, Inc 31 January 2014
Other Information you Should Know
Report Builder Restrictions with O-Calc® Pro Templates
You cannot preview your O-Calc® Pro template using the Run function on
the menu of the Report Builder. This function relies on SQL Reporting
services which do not have access to pole data (in .pplx files).
To view your report, save the report template and then switch to the O-Calc
Reports Tool (View►Reports…). Select the report from the Reports:
dropdown list. If it already appears in the box then reselect it. The Report
will be rendered with the latest changes.
If you do not see the report in the dropdown list you may need to rebuild the
report list (File►Options►Rebuild Reports List) or the file may have been
saved in the wrong location (see “Where the Reports Tool Finds Reports”).
If you do not see your changes, make sure that you have saved the report
template changes to one of the Reports folders (see “Where the Reports Tool
Finds Reports”).
Where the Reports Tool Finds Reports
The Reports Tool dropdown selection lists reports that it finds in one of two
locations; a user folder where the reports are unique to your user login and a
system folder where reports are available to all system users.
These folders can be found easily from O-Calc® Pro. Under Help in the main
menu, place your cursor over Folders. You will see a menu that lists “User
Reports” and “All Users Root”.
Clicking on “User Reports” opens a Windows Explorer browser window to
the folder where user defined reports are stored.
Clicking on “All Users Root” opens a Windows Explorer browser window to
the folder where data for all O-Calc® Pro users can be found. The reports
defined and deployed with O-Calc® Pro installation will be found in the
Reports subfolder. Open the Reports folder to see these.
The actual folder locations are explained below.
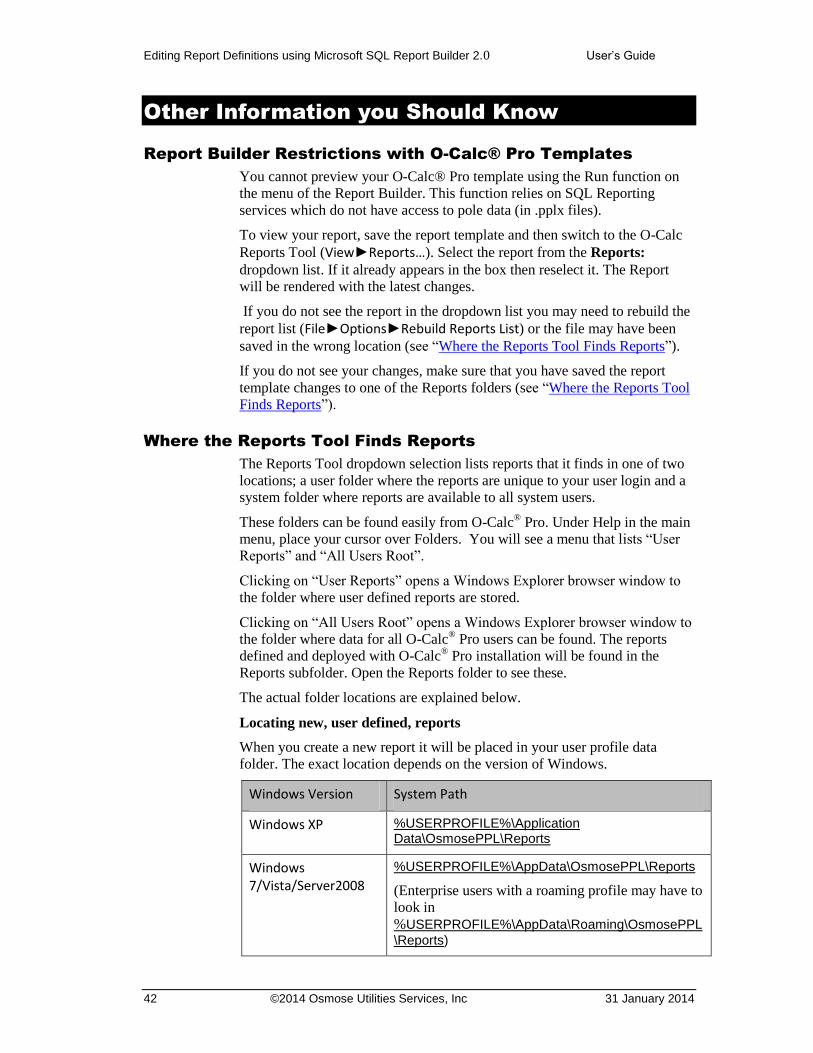
Locating new, user defined, reports
When you create a new report it will be placed in your user profile data
folder. The exact location depends on the version of Windows.
Windows Version System Path
Windows XP %USERPROFILE%\Application Data\OsmosePPL\Reports
Windows 7/Vista/Server2008
%USERPROFILE%\AppData\OsmosePPL\Reports
(Enterprise users with a roaming profile may have to
look in
%USERPROFILE%\AppData\Roaming\OsmosePPL
\Reports)

Editing Report Definitions using Microsoft SQL Report Builder 2.0 User’s Guide
31 January 2014 ©2014 Osmose Utilities Services, Inc 43
Locating reports available to all system users
Reports that are deployed with your O-Calc Pro installation or that you wish
to be visible to all system users are placed in a public system folder. The
exact location depends on the version of Windows.
Windows Version System Path
Windows XP %ALLUSERSPROFILE%\Application Data\OsmosePPL\Reports
Windows 7/Vista/Server2008
%ALLUSERSPROFILE%\OsmosePPL\Reports
If you create a report that you wish to be seen by all system users you must
manually copy the report template from the local user profile location to the
all user profile location.
Note: If you wish to explore the locations specified in the tables, simply copy
the underlined System Path value, open the Windows Explorer, then paste it into
the address field and press the Enter key. The values of %USERPROFILE% and
%ALLUSERSPROFILE% will be expanded to the value set for your system
installation.