Embed Size (px)
Citation preview

Advances in Critical Care Engineering
Edited by Dr. Ming-Chien Chyu

ISBN 978-1-907132-28-5©2011 Multi-Science Publishing Co. Ltd5 Wates Way, Brentwood, Essex CM15 9TB, United Kingdom
ContentsPreface
......................................................................................................... v
CRITICAL PATIENT CAREHemodynamic Instability Prediction Through Continuous MultiparameterMonitoring in ICU
Hanqing Cao, Larry J. Eshelman, Larry Nielsen, Brian D. Gross,Mohammed Saeed, Joseph J. Frassica .......................................... 3
Instrumented Indentation of Lung Reveals Significant Short TermAlteration in Mechanical Behavior with 100% Oxygen
Maricris R. Silva, Hsuan-Tso Shen, Ali Marzban and Andrew Gouldstone ......................................................................... 29
A New Approach in the Design of High-Risk Infusion TechnologyRobert S. Murphy and Steven J. Wilcox ......................................... 49
Design of an Integrated Sensor Platform for Vital Sign Monitoring ofNewborn Infants at Neonatal Intensive Care Units
Wei Chen, Sidarto Bambang Oetomo, Loe Feijs, Sibrecht Bouwstra,Idowu Ayoola, Sietse Dols ............................................................... 63
CRITICAL CARE QUALITYThe Use of Scan Statistics and Control Charts in Assessing Ventilator-Associated Pneumonia Quality Control Programs
Brian H. Nathanson and Thomas L. Higgins ................................... 85
Inter-Observer Agreement Among Medical Professionals in Critical Careof Neonates and Children
Tourgeman-Bashkin Osnat, Shinar David, Parmet Yisrael and Zmora Ehud ..................................................................................... 101
The Use of Observation and Interview Methods for Assessing Issues inPatient Care in the Resuscitation Unit of a Level-1 Trauma Center
Joseph Sharita, Lorgia McCaneb, Carl I. Schulmanc, Jill M. Graygodand Jeffrey S. Augensteine.............................................................. 111
CRITICAL CARE INFORMATION SYSTEMSPractitioner-Customizable Clinical Information Systems: A Case Study toGround Further Research and Development Opportunities
Cecily Morrison, Alan F. Blackwell, Alain Vuylsteke ........................ 131
SIMON: A Decade of Physiological Data Research and Development inTrauma Intensive Care
Patrick R. Norris, William P. Riordan, Benoit M. Dawant, Christopher J Kleymeer, Judith M. Jenkins, Anna E. Prestwich and John A. Morris Jr. ............................................................................ 149
A Clinical Database-Driven Approach to Decision Support: PredictingMortality Among Patients with Acute Kidney Injury
Leo Anthony G. Celi, Robin J. Tang, Mauricio C. Villarroe, Guido A. Davidzon, William T. Lester and Henry C. Chueh ............ 171
Supporting Communication and Decision Making in Finnish IntensiveCare with Language Technology
Hanna J. Suominen and Tapio I. Salakoski ..................................... 185
Data Acquisition and Complex Systems Analysis in Critical Care:Developing the Intensive Care Unit of the Future
Frank J. Jacono, Michael A. De Georgia, Christopher G. Wilson,Thomas E. Dick and Kenneth A. Loparo ......................................... 205
Applications of Temporal Reasoning to Intensive Care UnitsJ. M. Juarez, M. Campos, A. Morales, J. Palma, R. Marin ............. 225
Interoperable Medical Instrument Networking and Access System withSecurity Considerations for Critical Care
Deniz Gurkan and Fatima Merchant................................................ 247
CRITICAL CARE FACILITIESTwo Case Studies Using Mock-Ups for Planning Adult and NeonatalIntensive Care Facilities
Sue Hignett, Jun Lu, Mike Fray ....................................................... 267
Airborne Contamination Control through Directed Airflow in the ExamRoom: A Pilot Study Using a Membrane Diffuser
Debajyoti Pati, Michael P. Pietrzak, David Duthu, Ting-Kwo George Lei, David Vincent, Tom Franklin, Thomas E. Harvey, and Troy Ransdell ............................................. 283
Environmental Design for Patient Families in Intensive Care UnitsMahbub Rashid................................................................................ 303
v
PREFACE
Engineering plays an increasingly important role in helping critical care professionalsprovide best care to patients with acute, life-threatening illness or injury in intensivecare units (ICUs). The aim of this book is to provide a representation of the new trendsof fundamental and applied research on different aspects of engineering involved incritical care. The main focus is on the state of the art in various areas covered, with anindication of the current developments taking place and the problems and challengesthat remain to be addressed. The advanced knowledge, emerging technologies andinnovative ideas presented in this book should benefit healthcare engineeringresearchers, engineers, managers and consultants in critical care.
This book includes seventeen articles in critical care engineering originally publishedin the Journal of Healthcare Engineering (http://www.multi-science.co.uk/jhe.htm).The articles are logically divided into four areas: (a) critical patient care, (b) critical carequality, (c) critical care information systems, and (d) critical care facilities.
In Critical Patient Care, Cao et al. address early prediction of hemodynamicinstability for proactive management that allows intervention to prevent organ injuryassociated with low perfusion events in the ICU. Silva et al. report results ofmechanical tests to investigate possible changes in lung function in terms of stiffness,non-linear mechanical response, and induced alveolar deformation, when exposed to100% oxygen in the short term. Murphy and Wilcox examine the performance of atypical ICU syringe infusion pump and propose a prototype pump system thatdemonstrates a shorter start-up delay and significantly reduced flow error. Chen et al.present a vital sign monitoring platform integrated with non-invasive sensors for infantmonitoring in neonatal ICU.
In Critical Care Quality, Nathanson and Higgins present new rare-event-monitoring statistical methods that can be used for quality control in ICU, investigatingevents such as ventilator-associated pneumonia. Osnat et al. investigate the inter-observer agreement among physicians and nurses in assessing the potential severity ofAlmost Adverse Events observed in ICUs. Sharit et al. present a methodology forcollecting and analyzing observational data to identify and assess a broad array of issuesand concerns within the highly complex critical care setting.
In Critical Care Information Systems, Morrison et al. review the use of apractitioner-customizable clinical information system in an ICU, which allows trainedICU personnel to customize most or all aspects of the system with which they and theircolleagues interact. Norris et al. detail a system that continuously collects andprocesses bedside medical data, including heart rate, blood pressures, oxygensaturations, cardiac function variables, intracranial and cerebral perfusion pressures,and ECG waveforms, in a trauma ICU. Celi et al. describe a mortality predictionmodels with improved accuracy for ICU patients who developed acute kidney injury,
based on an approach to decision support that mines the local database to provide trulyrepresentative patient data. Suominen and Salakoski describe development ofcomputational methods for analyzing and generating natural, human language tosupport the flow of textual information in ICU. Jacono et al. address real-timeprocessing of biological signals to capture subtleties identifying early warning signalshidden in physiologic patterns. Juarez et al. present a review of development oftemporal reasoning methods and software tools that help physicians to betterunderstand the patient’s temporal evolution. Gurkan and Merchant propose aninteroperable networking of all critical care bedside instruments, that enables patientmonitoring, data archiving and secure access without the need of manual entry.
In Critical Care Facilities, Hignett et al. describe a 5-step protocol to determinefunctional space requirements for clinical activities in Cardiac ICU and NICU throughLink Analysis that analyzes movements between individuals and components in asystem. Pati et al. examine a clean room technology that has been successfully used intechnology and pharmaceutical industries, to control airborne contamination in anexamination room. Rashid introduces “healing environment of care” as a model forfamily integration with patient care in ICUs, and proposes design recommendations forcreating a healing environment of care that promotes family integration in ICUs.
I would like to express my grateful thanks to all the authors for their excellentcontributions. I also acknowledge the valuable comments from all the experts whocritically evaluated the articles and reviewed several revisions within a short time. Mywife Leslie and my daughters Sonya and Joanna deserve special thanks for theirpatience and understanding while I devoted myself to the publication of this book.
Ming ChyuLubbock, Texas
vi Preface

1
Critical Patient Care

3
Hemodynamic Instability Prediction ThroughContinuous Multiparameter Monitoring in ICU
Hanqing Cao1*, Larry J. Eshelman1, Larry Nielsen2, Brian D. Gross2,Mohammed Saeed2, Joseph J. Frassica2
1Philips Research North America, Briarcliff Manor, NY 10510 USA2Philips Healthcare, Andover, MA 01810 USA
ABSTRACTCurrent algorithms identifying hemodynamically unstable intensive care unit patients typicallyare limited to detecting existing dangerous conditions and suffer from high false alert rates. Ourobjective was to predict hemodynamic instability at least two hours before patient deteriorationwhile maintaining a low false alert rate, using minute-by-minute heart rate (HR) and bloodpressure (BP) data. We identified 66 stable and 104 unstable patients meeting our stability-instability criteria from the MIMIC II database, and developed multi-parameter measures usingHR and BP. An instability index combining measures of BP, shock index, rate pressure product,and HR variation was developed from a multivariate regression model to predict hemodynamicinstability (ROC of 0.82±0.03, sensitivity of 0.57±0.07 when the specificity was targeted at 0.90;the alert rate ratio of unstable to stable patients was 7.62). We conclude that these algorithmscould form the basis for reliable predictive clinical alerts which identify patients likely to becomehemodynamically unstable within the next few hours so that the clinicians can proactivelymanage these patients and provide necessary care.
Keywords: multiparameter monitoring, predictive alerts, acute hypotension, hemodynamicinstability, ICU intervention
1. INTRODUCTIONHemodynamic instability is considered one of the most critical events that requireeffective and prompt intervention in the intensive care unit (ICU). It is one of the majorreasons for ICU recidivism which causes longer length of ICU stay [1]. It is mostcommonly associated with an abnormal or unstable blood pressure (BP), especiallyhypotension, or more broadly associated with inadequate global or regional perfusion.Inadequate perfusion may result in damage of vital organs. The heart and brain areparticularly sensitive to perfusion compromise due to their high metabolic requirementsand their limited ability to compensate for decreased oxygen and metabolic substrate
*Corresponding author: Hanqing Cao, Ph.D., Philips Research North America, 345 Scarborough Road,Briarcliff Manor, NY 10510, Phone: 914-945-6153, Fax: 914-945-6580, Email: [email protected].
delivery. Compromised perfusion of these vital organs may quickly lead to life-threatening organ failure and death. Under normal circumstances, the autonomicnervous system provides fine control of cardiac output that is adequate to maintain bodyfunction and end organ perfusion in the face of normal stresses. However, in the ICU,clinicians often need to proactively intervene to augment the body’s own feedbacksystems which may be inadequate to maintain perfusion of vital organs in the face ofextreme stressors such as sepsis, hemorrhage or severe cardiac injury. In theseinstances, perfusion is often maintained through the judicious and timely use ofintravenous (IV) fluids and blood transfusion for vascular filling and/or vasoactive andinotropic agents. The onset of significant hemodynamic instability is often an event thatoccurs at the end of a long series of subtle physiologic derangements in patients whoare becoming unstable. These subtle derangements may not be readily noticeablewithin the torrent of physiologic data presented regularly to clinicians caring forpatients in a modern ICU.
Current automated alert mechanisms typically generate an alert if one or morephysiological parameters (e.g., mean BP) cross predetermined “normal” thresholds.Unfortunately, often by the time these alerts are triggered, the patient is already in anunstable state, making intervention much more difficult. Furthermore, these alerts areoften subject to high false alert rates, adding to the information overload [2-4]. Earlyinterventions in disease processes which often result in hemodynamic instability andend organ perfusion compromise such as sepsis have been widely advocated as a meansto limit the morbidity and mortality [5, 6]. Thus, reliable methods to predict whichpatients are most likely to become unable to maintain organ perfusion through their ownautonomic control should help ICU caregivers focus on earlier interventions that wouldlimit the impact of physiologic deterioration in the sickest patients.
We have previously reported a method to reduce the false alert rate by identifyingartifacts using multiple channels of monitoring data [7]. We have also developed a rule-based algorithm to predict hemodynamic instability using hourly electronic chartingdata [8] and logistic regression models using minute-by-minute vital signs fromelectronic patient monitors [9].
In this work, we report on hemodynamic instability prediction with minute-by-minute segments of continuous monitoring data in, for example, 2 hours. The purposeof the algorithms we developed based on trend (minute-by-minute) data of vital signswas not to replace the existing alerting systems in the current ICUs, which catchhemodynamic instability events when they occur. Rather, the purpose of thesealgorithms was to predict these events ahead of time so that the clinicians canproactively manage these patients and reduce the number of hemodynamic instabilityevents, leading to improved patient care and outcome. It is important to developalgorithms that use features that are robust to missing data, a common reality of the ICUdata. For example, since spectral analysis using Fourier Transformation (FT) is notrobust to missing data, it cannot be used to extract features in this case, although it hasbeen shown to be very important in heart rate variability analysis [11]. Using a window(2-hour segment) makes the algorithm less sensitive to natural variations of themeasured parameters and noisy artifacts. In addition, it becomes possible to extractuseful pattern identifying instability from multiple data points. Therefore, a better
4 Hemodynamic Instability Prediction Through Continuous MultiparameterMonitoring in ICU
classification performance might be achieved using monitoring data of higherresolution.
In this work, hemodynamic instability was based on clinical interventions ofvasopressors (more details in METHODS Section 2.1). In other words, prediction ofhemodynamic instability was equivalent to prediction of clinical interventionspresumably due to hemodynamic instability. Our hypothesis was that by combininginformation from several continuously monitored vital signs (i.e., HR from bodysurface ECG signals and arterial BP), more timely and accurate alerts can be generatedthan traditional alerts that are triggered when a single data stream crosses a threshold.In order to ensure that the alerts are accurate (low false alert rate) and timely, they weredeveloped using a high targeted specificity and using data two hours before the patient’sdeteriorating condition was diagnosed and an intervention was executed (i.e., theintervention occurs two hours after the end of the 2-hour window of data, illustrated inthe top panel of Figure 4).
The study was approved by the Institutional Review Boards of Beth IsraelDeaconess Medical Center (Boston, MA) and the Massachusetts Institute ofTechnology (Cambridge, MA) during collaboration with Philips Healthcare (Andover,MA). Requirement for individual patient consent was waived because the study did notimpact clinical care and all protected health information (PHI) was de-identified.
2. METHODS2.1. Data Collection and Reference Data Sets The reference data sets were based on retrospective data from MIMIC (MultiparameterIntelligent Monitoring in Intensive Care) II, which is a database of ICU patients createdby a partnership between Philips Healthcare (Andover, MA), Massachusetts Institute ofTechnology (Cambridge, MA) and Beth Israel Deaconess Medical Center (Boston,MA) [10]. The version of the MIMIC II database that we used contained data of 12,695medical, surgical, post-cardiac surgery, and cardiac ICU adult patients recordedbetween 2001 and 2005. A clinical information system, CareVue 9000 (PhilipsHealthcare, Andover, MA), was utilized to acquire laboratory results, IV medications,nurses’ notes, and nurse validated monitoring data such as HR and BP on an hourlybasis. Besides the CareVue data, the MIMIC II database also includes waveform dataand minute-by-minute trend data saved directly from the patient monitors (IntelliVueMP-70 Patient Monitor, Philips Healthcare, Andover MA) for 1875 patients, fromwhich our database was derived. The trend data include physiological data such as HR,various invasive BP measurements, oxygenation saturation (SpO2), and respiration rate(RR). Patient records with trend data for HR from ECG and arterial BP (systolic,diastolic and mean) were chosen for further analysis.
We developed our reference data sets based on whether a patient had therapeuticinterventions indicative of hemodynamic instability. In particular, those patients whoreceived vasopressors (dopamine, levophed, neosynephrine, epinephrine) were definedas unstable. In the patient population that did not qualify to be unstable, patients weredefined as nonstable if they received at least one of the following: (1) medications suchas lidocaine, nitroglycerine, labetolol, esmolol, nitroprusside, amiodarone, lasix,milrinone, (2) at least 1500cc IV-fluids in one hour, (3) at least 750cc of packed red
Advances in Critical Care Engineering 5
blood cells in 24 hours. The patients who were neither unstable nor nonstable weredefined as stable. However, patients who had data gaps of more than 2 hoursimmediately after receiving vasopressors were excluded because they might be out ofthe ICU for surgery, and the vasopressor might have been administered for reasonsother than hemodynamic instability. We utilized the occurrence of a “qualifying”clinical intervention to define hemodynamic instability as described above, rather thanthe simple occurrence of a change in vital signs, so that the physicians’ clinicaljudgment on the ICU patients at the bedside could be incorporated in the definition.Although the treatment end-points might differ for each disease-state group, we aimedat identifying those with physiologic evidence of deterioration without regard to thetreatment goals normally prescribed for a particular subset of patients in our population.Since hypotension requiring the use of vasopressor medication is a common final signalof hemodynamic instability among all of the potential subsets of patients included inour very heterogeneous population, we have utilized this as the standard for evidenceof hemodynamic instability.
There were 66 stable patients and 104 unstable patients that met our criteria, and 83non-stable patients that did not meet our instability criteria. There were 128 points ineach two-hour segment, and we required no more than 5 points missing in eachsegment. For each stable patient, up to 10 two-hour segments of minute-by-minutetrend data since admission were selected for a total of 505 segments. For each of the104 unstable patients, a two-hour segment 2 hours before the first onset of a vasopressormedication was selected. Twelve additional unstable segments were identified forwhich the vasopressor therapy was reinitiated after a period of at least 24 hours withoutvasopressors (i.e., the segment began at least 24 hours after therapy stopped and ended2 hours before another therapy was initiated). These 116 segments constituted thereference data sets for unstable patients. No “stable” segments were extracted fromunstable patients in order to establish a clear-cut case scenario, since the underlyingphysiological state might have been changed well in advance when the cliniciansinitiated critical intervention for hemodynamic instability, and it would be unclear whenan unstable patient was in a true stable physiological state.
2.2. Feature CreationBased on the original set of four physiological parameters – ECG heart rate (HR),systolic arterial BP (SAP), diastolic arterial BP (DAP), and mean arterial BP (MAP) -we developed several derived parameters. The intra-arterial BP data were collecteddirectly from arterial line. The derived parameters include:
• abs_dHR: the absolute successive difference of the minute-by-minute HRdata, a measure of physiological HR variation which is an indicator of manycardiovascular diseases [11].
• HR_div_BP: HR to BP ratio, including HR_div_SAP and HR_div_MAP, alsoknown as the shock index, which may be an early indicator of cardiogenic,hypovolemic, and septic shock [12].
• HR_prod_BP: Heart rate pressure product, including HR_prod_SAP andHR_prod_MAP, associated with cardiac oxygen consumption [13].
• ECO: Estimated Cardiac Output, defined as kco*HR*(SAP-DAP)/MAP, where
6 Hemodynamic Instability Prediction Through Continuous MultiparameterMonitoring in ICU
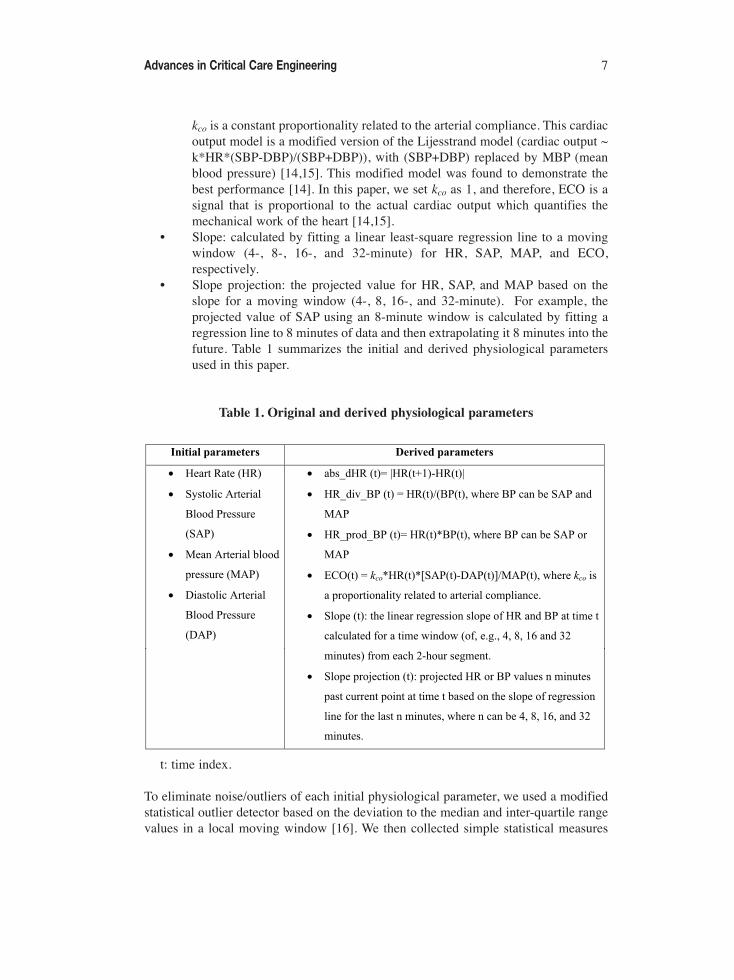
kco is a constant proportionality related to the arterial compliance. This cardiacoutput model is a modified version of the Lijesstrand model (cardiac output ~k*HR*(SBP-DBP)/(SBP+DBP)), with (SBP+DBP) replaced by MBP (meanblood pressure) [14,15]. This modified model was found to demonstrate thebest performance [14]. In this paper, we set kco as 1, and therefore, ECO is asignal that is proportional to the actual cardiac output which quantifies themechanical work of the heart [14,15].
• Slope: calculated by fitting a linear least-square regression line to a movingwindow (4-, 8-, 16-, and 32-minute) for HR, SAP, MAP, and ECO,respectively.
• Slope projection: the projected value for HR, SAP, and MAP based on theslope for a moving window (4-, 8, 16-, and 32-minute). For example, theprojected value of SAP using an 8-minute window is calculated by fitting aregression line to 8 minutes of data and then extrapolating it 8 minutes into thefuture. Table 1 summarizes the initial and derived physiological parametersused in this paper.
Table 1. Original and derived physiological parameters
t: time index.
To eliminate noise/outliers of each initial physiological parameter, we used a modifiedstatistical outlier detector based on the deviation to the median and inter-quartile rangevalues in a local moving window [16]. We then collected simple statistical measures
Advances in Critical Care Engineering 7
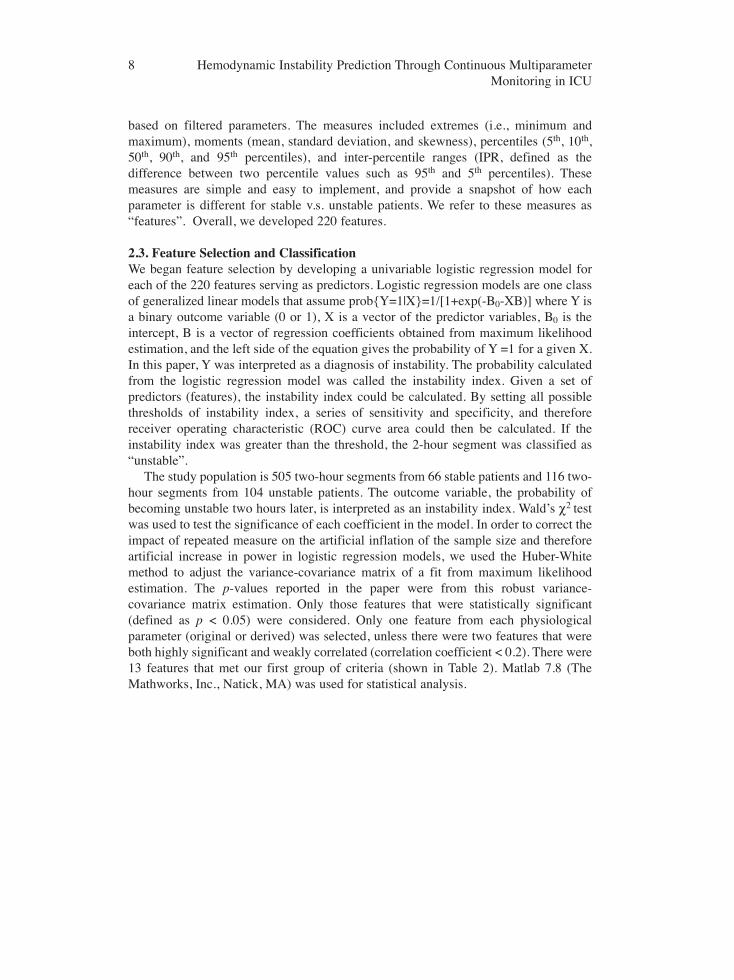
based on filtered parameters. The measures included extremes (i.e., minimum andmaximum), moments (mean, standard deviation, and skewness), percentiles (5th, 10th,50th, 90th, and 95th percentiles), and inter-percentile ranges (IPR, defined as thedifference between two percentile values such as 95th and 5th percentiles). Thesemeasures are simple and easy to implement, and provide a snapshot of how eachparameter is different for stable v.s. unstable patients. We refer to these measures as“features”. Overall, we developed 220 features.
2.3. Feature Selection and ClassificationWe began feature selection by developing a univariable logistic regression model foreach of the 220 features serving as predictors. Logistic regression models are one classof generalized linear models that assume prob{Y=1|X}=1/[1+exp(-B0-XB)] where Y isa binary outcome variable (0 or 1), X is a vector of the predictor variables, B0 is theintercept, B is a vector of regression coefficients obtained from maximum likelihoodestimation, and the left side of the equation gives the probability of Y =1 for a given X.In this paper, Y was interpreted as a diagnosis of instability. The probability calculatedfrom the logistic regression model was called the instability index. Given a set ofpredictors (features), the instability index could be calculated. By setting all possiblethresholds of instability index, a series of sensitivity and specificity, and thereforereceiver operating characteristic (ROC) curve area could then be calculated. If theinstability index was greater than the threshold, the 2-hour segment was classified as“unstable”.
The study population is 505 two-hour segments from 66 stable patients and 116 two-hour segments from 104 unstable patients. The outcome variable, the probability ofbecoming unstable two hours later, is interpreted as an instability index. Wald’s χ2 testwas used to test the significance of each coefficient in the model. In order to correct theimpact of repeated measure on the artificial inflation of the sample size and thereforeartificial increase in power in logistic regression models, we used the Huber-Whitemethod to adjust the variance-covariance matrix of a fit from maximum likelihoodestimation. The p-values reported in the paper were from this robust variance-covariance matrix estimation. Only those features that were statistically significant(defined as p < 0.05) were considered. Only one feature from each physiologicalparameter (original or derived) was selected, unless there were two features that wereboth highly significant and weakly correlated (correlation coefficient < 0.2). There were13 features that met our first group of criteria (shown in Table 2). Matlab 7.8 (TheMathworks, Inc., Natick, MA) was used for statistical analysis.
8 Hemodynamic Instability Prediction Through Continuous MultiparameterMonitoring in ICU
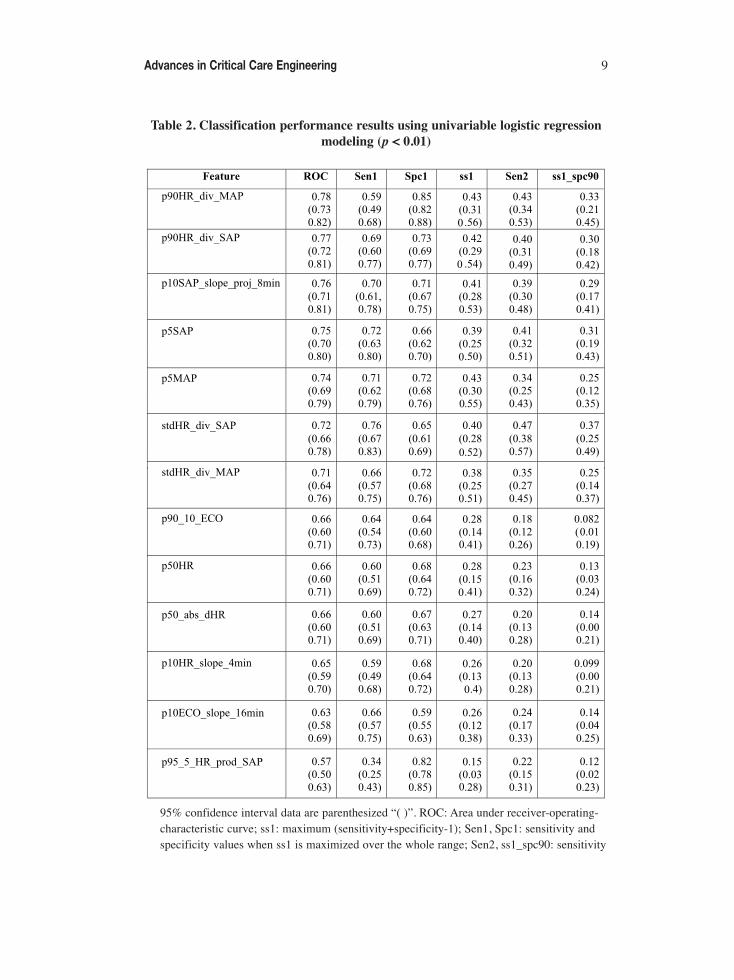
Table 2. Classification performance results using univariable logistic regressionmodeling (p < 0.01)
95% confidence interval data are parenthesized “( )”. ROC: Area under receiver-operating-characteristic curve; ss1: maximum (sensitivity+specificity-1); Sen1, Spc1: sensitivity andspecificity values when ss1 is maximized over the whole range; Sen2, ss1_spc90: sensitivity
Advances in Critical Care Engineering 9
and ss1 values when specificity ≥ 90%. p50HR = 50th percentile of HR; p90HR_div_SAP =p90(HR/SAP); p90HR_div_MAP = p90(HR/MAP); p95_5_HR_prod_SAP = p95(HR*SAP)- p5(HR*SAP); p90_10_ECO = p90 (ECO) - p10(ECO); p10ECO_slope_16min = 10th
percentile of ECO slope of moving 16-minute window; p50_abs_dHR = median ofabs[HR(n+1)-HR(n)], n=1, 2,…N-1 (N is segment length); p10HR_slope_4min = 10th
percentile of HR slope of moving 4-minute window; stdHR_div_SAP = standard deviationof (HR/SAP); stdHR_div_MAP = standard deviation of (HR/MAP); p5SAP, p5MAP = 5th
percentile of SAP and MAP; p10SAP_slope_proj_8min = 10th percentile of SAP projected 8minutes past current point based on slope of regression line for last 8 minutes.
In order to assess the correlation structure of these selected features, a hierarchicaltree was constructed (Figure 1) using the R function varclus from package DESIGN todraw the dendrogram depicting the clusters, and chose the matrix of squared Spearmanrank correlation coefficients as the similarity matrix (R, http://www.r-project.org/). TheSpearman correlation matrix was chosen due to some obviously non-Gaussian variablessuch as p50_abs_dHR. One feature was selected from each uncorrelated sub-tree ascandidate feature based on their ROC area values. The best combination of four featuresbased on ROC area after testing on all possible combinations of the features wasp90HR_div_MAP, p50_abs_dHR, p95_5_HR_prod_SAP, and p5SAP, wherep90HR_div_MAP was from sub-tree p50HR, p90HR_div_SAP and p90HR_div_MAP;p50_abs_dHR was from sub-tree p50_abs_dHR and p10HR_slope_4min;p95_5_HR_prod_SAP was from sub-tree p95_5_HR_prod_SAP, p90_10_ECO, andp10ECO_slope_16min; p5SAP was from sub-tree stdHR_div_SAP, stdHR_div_MAP,p5MAP, p5SAP, and p10SAP_slope_proj_8min.
We also compared performance on various subsets of the selected features bymultivariable logistic regression models. By setting different instability indexthresholds, one can adjust the tradeoff between sensitivity and specificity and maximizetheir summation. We define ss1 = sensitivity + specificity-1, also known as Youden’sindex [17], as an indicator of classification accuracy. In addition, in order to maintain alow false alert rate, we set a threshold for feature values so that the targeted specificitywas 0.90, and computed the corresponding sensitivity.
In order to show the advantages of our predictive algorithms, we compared theclassification results using conventional alerts for physiological parameters outside ofthe normal ranges. The current clinical practice uses single systolic or mean bloodpressure to alarm for potential hemodynamic instability. However, there are nouniversal thresholds for blood pressure levels. According to the guideline for septicpatients [6], for example, the rule is systolic pressure < 90 mmHg or mean pressure <65 mmHg. Therefore, we tested the classification performance using these two rules.
10 Hemodynamic Instability Prediction Through Continuous MultiparameterMonitoring in ICU
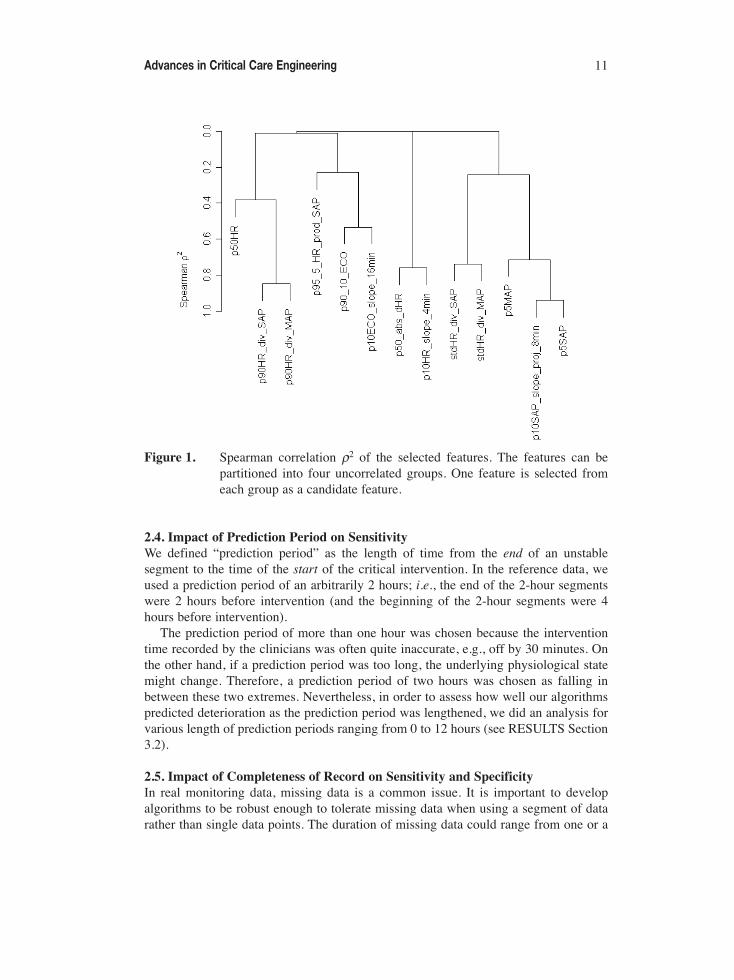
Figure 1. Spearman correlation ρ2 of the selected features. The features can bepartitioned into four uncorrelated groups. One feature is selected fromeach group as a candidate feature.
2.4. Impact of Prediction Period on Sensitivity We defined “prediction period” as the length of time from the end of an unstablesegment to the time of the start of the critical intervention. In the reference data, weused a prediction period of an arbitrarily 2 hours; i.e., the end of the 2-hour segmentswere 2 hours before intervention (and the beginning of the 2-hour segments were 4hours before intervention).
The prediction period of more than one hour was chosen because the interventiontime recorded by the clinicians was often quite inaccurate, e.g., off by 30 minutes. Onthe other hand, if a prediction period was too long, the underlying physiological statemight change. Therefore, a prediction period of two hours was chosen as falling inbetween these two extremes. Nevertheless, in order to assess how well our algorithmspredicted deterioration as the prediction period was lengthened, we did an analysis forvarious length of prediction periods ranging from 0 to 12 hours (see RESULTS Section3.2).
2.5. Impact of Completeness of Record on Sensitivity and Specificity In real monitoring data, missing data is a common issue. It is important to developalgorithms to be robust enough to tolerate missing data when using a segment of datarather than single data points. The duration of missing data could range from one or a
Advances in Critical Care Engineering 11
few consecutive points (a few minutes) to any extended length (e.g., hours, days). Weassessed the impact of completeness of record on classification performance for bothstable and unstable patients. We compared the sensitivity and specificity when therequired record completeness was varied over a range of 25%, 30%, 33.3%, 40%, 50%,60%, 75%, 80%, 90%, and 95%. As a special case, the data was downsampled to 5-minute by 5-minute from minute-by-minute using median value of each 5-minute data(typically the median value of every 5 points if there was no missing data), and theimpact of performance was also assessed.
2.6. ValidationWe validated our regression models using bootstrapping. Bootstrapping is a namegenerically applied to statistical resampling schemes that allow uncertainty in the datato be assessed from the data themselves. The basic idea is, given n samples (y1, y2,…,yn) of a random variable Y, which has an unknown cumulative distribution F(y) = Prob{Y ≤ y}, to compute the statistic of interest and to assess how the statistic behaves overB repetitions of sampling with replacement. As an estimate of F(y), the empiricalcumulative distribution Fn(y) can be estimated from repetitive sampling withreplacement from the n observed data when the number of repetition, B, is large enough.Therefore, the uncertainty or accuracy of the statistic of interest can be estimatedempirically using confidence intervals, standard errors (SE), etc. We used B = 100repetitions of the bootstrap validation procedure for each model. The classificationperformance was assessed by both ROC and contingency analysis. The validationresults were reported as mean ± standard error (SE).
In addition, we validated our algorithm by relaxing the data selection criteria toinclude segments: (1) with up to 50% of missing data instead of 4%; (2) for the wholelength of stay, instead of the first 10 segments only for stable patients, in the referencedataset; (3) with 120 points in each two-hour segment in the validation dataset, insteadof 128 points in the reference dataset, in order to reflect the 2-hour in real monitoringpractice. However, since only a few unstable segments were gained after relaxing thecompleteness from 96% to 50%, the data expansion was not sufficient to serve as avalidation dataset for unstable patients. Therefore, we only validated our algorithms onthe expanded dataset for stable patients.
2.7. Alert RateHigh false alarm rates are a major concern in the current ICU clinical settings. In order toassess the additional workload our alert algorithms might add to clinicians in the clinicalsettings, as well as to assess the effectiveness of the prediction of deterioration in realpractice, we calculated and compared the alert rates for both stable and unstable patients.
In many cases for classification algorithms, a positive predictive value (PPV) isreported to assess the percentage or probability of true positives among all positives.However, in real-time monitoring cases, rather than those diagnostic screening tests,PPV is dependent upon the relative length of time the stable patients are exposed to thealerting algorithms compared to the unstable patients. It should also be stressed that therelative exposure times are not only dependent upon the size of the two populations, butalso upon the average length of time the two groups are exposed to the algorithm. For
12 Hemodynamic Instability Prediction Through Continuous MultiparameterMonitoring in ICU
instance, an exposure ratio of 5 could be due to a situation where there are an equalnumber of stable and unstable patients, but the algorithm runs 5 times longer on thestable patients (their complete stay) than on the unstable patients (episodes prior tointerventions). Therefore, in this section we present the relative alert rates that are notas much affected by the ratio of the exposure time of stable and unstable patients.
Rule firings were defined as the time when the instability index of a segmentexceeded the preset threshold. Because the data were largely correlated, the firingtended to occur consecutively and unnecessarily frequently. In order to address thisproblem, we defined an alert based on a refractory period as the following: after thefirst rule firing, new rule firings were suppressed until there were no more rule firingsfor a certain period of time (e.g., 2 hours). In other words, consecutive firings werecounted as one alert, and a new alert was counted only when there was a gap of at leasta period of time (e.g., 2 hours) between two firings. This specified period of silent timewas defined as the refractory period. A two-hour refractory period was selected toensure no consecutive firings from overlapping moving windows.
We calculated alert rates in three different ways. One way was to calculate anaggregate alert rate by dividing the total number of alerts of all patients by the totalmonitoring time (Alert rate 1). Suppose Fi is the number of alerts for patient i, and Tiis the monitoring time for the same patient. Alert rate 1 (AR1) is defined as:
AR1 = (ΣFi)/(ΣTi) (1)
The second way (Alert rate 2, AR2) was to average the individual alert rates for eachpatient:
AR2 = 1/n Σ(Fi/Ti) (2)
The third way is to use a Poisson regression method described below. Since theevents occurred at a particular rate within a particular amount of time, an appropriateway to obtain a mean alert rate is to use Poisson regression models for predicting theexpected value of the count given a time frame (e.g., one day); i.e., log(E[Y]) = a+bX,where Y is the event count, E[Y] is the expected value of Y, and X is a vector ofpredictor variables. Therefore, we developed a third way of calculating alert rate usinga Poisson regression model (using length of monitoring time as a predictor variable andnumber of alerts as dependent variable). For stable patients, the distribution ofmonitoring time was skewed to the right, resulting from long ICU stays of a fewpatients, so we took the logarithm of monitoring time as a predictor variable. Forunstable patients, however, since the monitoring time was restricted to one to six hoursonly, the distribution is less skewed, and taking the logarithm of monitoring time as apredictor variable was not necessary. By setting the monitoring time as one day, theexpected count of alerts per patient day can be determined. Alert rate 3 (AR3) is thusdefined as:
log(E[AR3]) = a + b X (3)
where X is monitoring time, a is the intercept, and b is the coefficient of X.
Advances in Critical Care Engineering 13
When calculating alert rates, instead of using non-overlapping windows, we usedmoving 2-hour windows shifted in 15-minute increments to mimic a possible real timeclinical implementation of our algorithms. Before calculating the alert rates, themonitoring time for each patient needs to be computed. In general, the time when therewas no data should be excluded from the calculation of monitoring time in order toavoid an artificial inflation of monitoring time and therefore an artificial low alert rate.This is not straightforward because of the presence of missing data and the nature ofoverlapping moving windows. To accurately compute monitoring time, we set thecenter of the 2-hour operating window as the working point, which starts at thebeginning of each patient’s HR and arterial blood pressure (ABP) data. As the workingpoint moves ahead in 15-minute increments, if the 2-hour segment meets a minimumrequirement of completeness (e.g., 50%), 15 minutes are added to the monitoring time.If the 2-hour segment has less than 50% of data, the 15-minute time is not added. Forexample, if we have 60-minute continuous data, ideally, the monitoring time is 1 hour.If we need to move 4 times for the working point to be out of the 1-hour region, andeach time 15-minute time is counted, that makes exactly 60 minutes (4 × 15 minutes).
3. RESULTS3.1. ClassificationClinicians consider increased HR and decreased BP to be early signs of patientdeterioration. Thus we developed statistical HR and BP features including the slope andhypothesized that they would be useful in predicting hemodynamic instability. Figure 2shows the boxplots of the four sample features calculated for stable and unstablepatients. Not surprisingly, unstable patients had lower BP and higher shock index. Also,unstable patients had lower physiological HR variation, which was consistent withother studies demonstrating that low beat-to-beat HR variability was usually a sign ofphysiological derangement [11]. Interestingly, we also found that unstable patients hadslightly, but significantly higher rate pressure product, which might represent attemptedphysiological compensation — as BP decreases, HR often increases to compensate[18].
We also investigated the performance for multiple features. The results for thestrongest performers for 2, 3 and 4 features are shown in Table 3. Using more than 4features did not improve classification significantly (data not shown). Figure 3 showsthe ROC curve when using the 4 features in Table 3 as predictors. Figure 4 shows anexample of how the instability index changes before and after initiation of theintervention for an unstable patient.
14 Hemodynamic Instability Prediction Through Continuous MultiparameterMonitoring in ICU
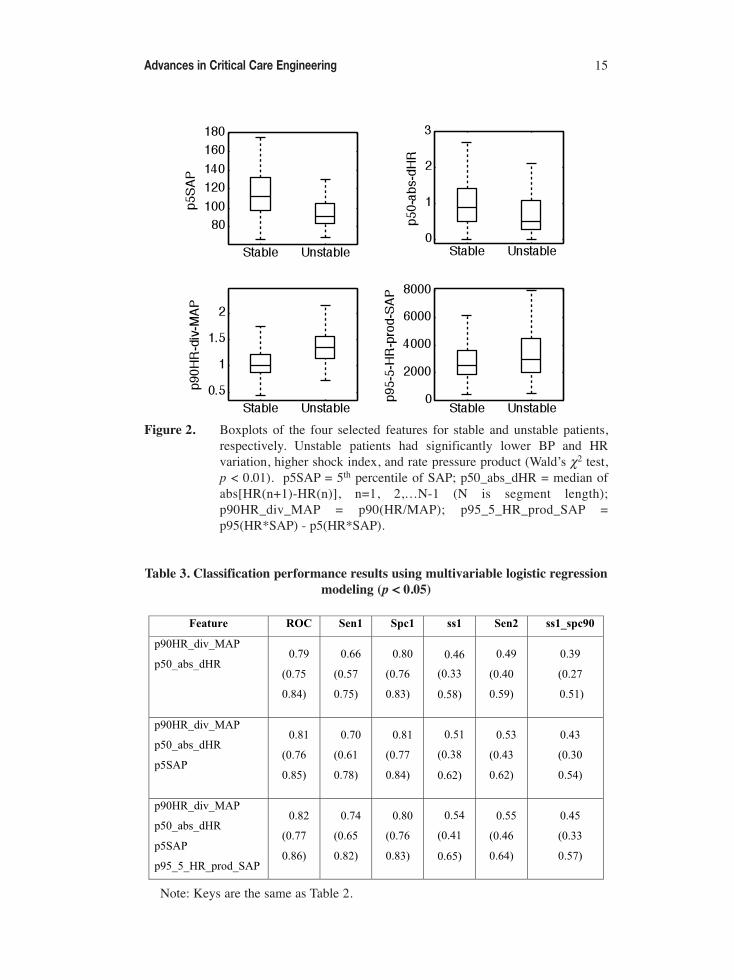
Figure 2. Boxplots of the four selected features for stable and unstable patients,respectively. Unstable patients had significantly lower BP and HRvariation, higher shock index, and rate pressure product (Wald’s χ2 test,p < 0.01). p5SAP = 5th percentile of SAP; p50_abs_dHR = median ofabs[HR(n+1)-HR(n)], n=1, 2,…N-1 (N is segment length);p90HR_div_MAP = p90(HR/MAP); p95_5_HR_prod_SAP =p95(HR*SAP) - p5(HR*SAP).
Table 3. Classification performance results using multivariable logistic regressionmodeling (p < 0.05)
Note: Keys are the same as Table 2.
Advances in Critical Care Engineering 15
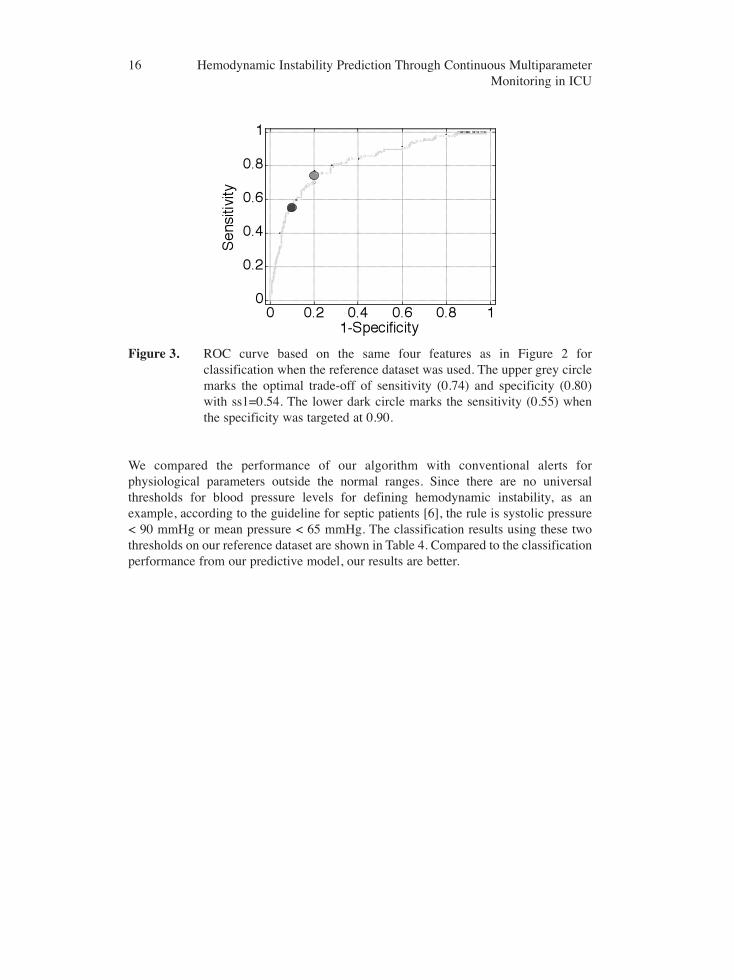
Figure 3. ROC curve based on the same four features as in Figure 2 forclassification when the reference dataset was used. The upper grey circlemarks the optimal trade-off of sensitivity (0.74) and specificity (0.80)with ss1=0.54. The lower dark circle marks the sensitivity (0.55) whenthe specificity was targeted at 0.90.
We compared the performance of our algorithm with conventional alerts forphysiological parameters outside the normal ranges. Since there are no universalthresholds for blood pressure levels for defining hemodynamic instability, as anexample, according to the guideline for septic patients [6], the rule is systolic pressure< 90 mmHg or mean pressure < 65 mmHg. The classification results using these twothresholds on our reference dataset are shown in Table 4. Compared to the classificationperformance from our predictive model, our results are better.
16 Hemodynamic Instability Prediction Through Continuous MultiparameterMonitoring in ICU
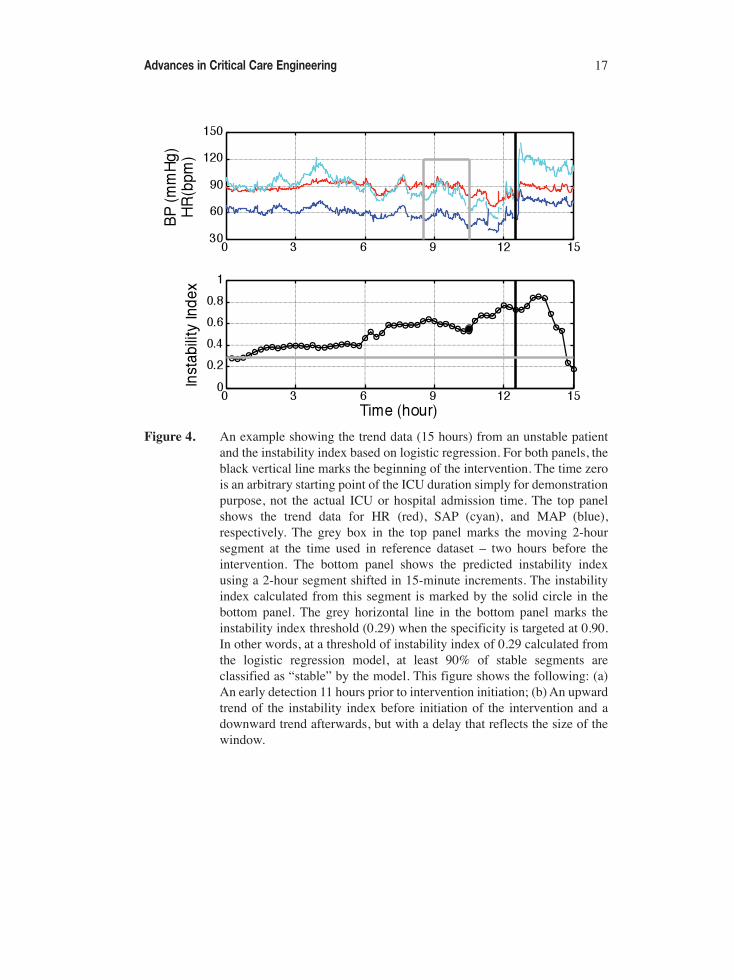
Figure 4. An example showing the trend data (15 hours) from an unstable patientand the instability index based on logistic regression. For both panels, theblack vertical line marks the beginning of the intervention. The time zerois an arbitrary starting point of the ICU duration simply for demonstrationpurpose, not the actual ICU or hospital admission time. The top panelshows the trend data for HR (red), SAP (cyan), and MAP (blue),respectively. The grey box in the top panel marks the moving 2-hoursegment at the time used in reference dataset – two hours before theintervention. The bottom panel shows the predicted instability indexusing a 2-hour segment shifted in 15-minute increments. The instabilityindex calculated from this segment is marked by the solid circle in thebottom panel. The grey horizontal line in the bottom panel marks theinstability index threshold (0.29) when the specificity is targeted at 0.90.In other words, at a threshold of instability index of 0.29 calculated fromthe logistic regression model, at least 90% of stable segments areclassified as “stable” by the model. This figure shows the following: (a)An early detection 11 hours prior to intervention initiation; (b) An upwardtrend of the instability index before initiation of the intervention and adownward trend afterwards, but with a delay that reflects the size of thewindow.
Advances in Critical Care Engineering 17
Table 4. Comparison of conventional alerts and the present predictive algorithms
95% confidence interval data are parenthesized “( )”.
3.2. Impact of Prediction Period on Sensitivity Figure 5 shows that as the moving window approaches the time of deterioration (time0), the instability index (top panel) increases, so does the proportion of unstablesegments (bottom panel) that are correctly classified as unstable (i.e., sensitivity) by ouralgorithm (when specificity was targeted at 90%). It drops quickly when the predictionperiod is longer than three hours. For example, sensitivity drops from 0.58 for one hourbefore intervention to 0.46 for five hours before intervention. Such decrease inprediction power was consistent with the finding shown in hemodynamic instabilityadvisory using hourly clinical electronic charting data [8].
3.3. Impact of Completeness of Record on Sensitivity and Specificity The impact of completeness of record on the sensitivity and specificity was assessedusing the following two different instability index thresholds obtained from logisticregression model and the reference dataset: (1) 0.20, when the maximum ss1 wasreached, and (2) 0.29, when the specificity was targeted at 90% (i.e. when a thresholdof instability index of more than 0.29 was chosen, at least 90% of stable segments wereclassified as “stable” by the model). The data for the whole length of stay for stablepatients and 2 to 8 hours before intervention for unstable patients were used for analysisof impact of missing data. As shown in Table 5, when the required record completenessvaried from 95% to 25%, the changes in sensitivity and specificity were small (≤ 2%),and there are a gain of 3449 (36.1%) 2-hour overlapping segments (shifted in 15-minuteincrements) for stable patients, and a gain of 548 (24.2%) for unstable patients. Notethat the baseline specificity (95% completeness) was lower than shown earlier (Table 3)as a much earlier prediction period (2 to 8 hours, vs. 2 hours, before intervention) wasused.
18 Hemodynamic Instability Prediction Through Continuous MultiparameterMonitoring in ICU
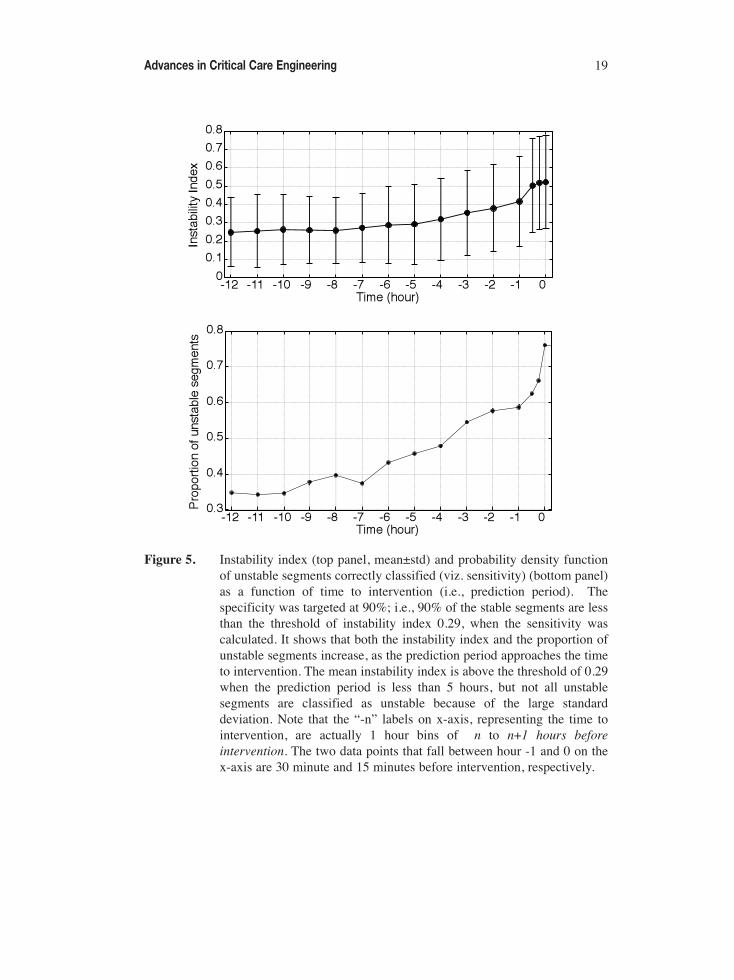
Figure 5. Instability index (top panel, mean±std) and probability density functionof unstable segments correctly classified (viz. sensitivity) (bottom panel)as a function of time to intervention (i.e., prediction period). Thespecificity was targeted at 90%; i.e., 90% of the stable segments are lessthan the threshold of instability index 0.29, when the sensitivity wascalculated. It shows that both the instability index and the proportion ofunstable segments increase, as the prediction period approaches the timeto intervention. The mean instability index is above the threshold of 0.29when the prediction period is less than 5 hours, but not all unstablesegments are classified as unstable because of the large standarddeviation. Note that the “-n” labels on x-axis, representing the time tointervention, are actually 1 hour bins of n to n+1 hours beforeintervention. The two data points that fall between hour -1 and 0 on thex-axis are 30 minute and 15 minutes before intervention, respectively.
Advances in Critical Care Engineering 19
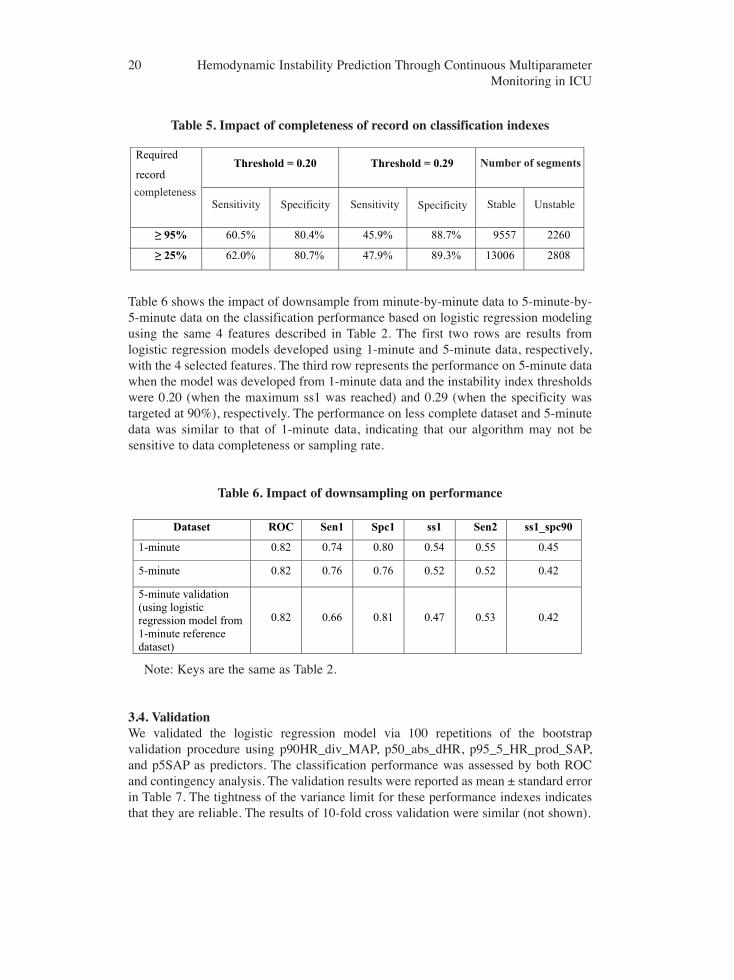
Table 5. Impact of completeness of record on classification indexes
Table 6 shows the impact of downsample from minute-by-minute data to 5-minute-by-5-minute data on the classification performance based on logistic regression modelingusing the same 4 features described in Table 2. The first two rows are results fromlogistic regression models developed using 1-minute and 5-minute data, respectively,with the 4 selected features. The third row represents the performance on 5-minute datawhen the model was developed from 1-minute data and the instability index thresholdswere 0.20 (when the maximum ss1 was reached) and 0.29 (when the specificity wastargeted at 90%), respectively. The performance on less complete dataset and 5-minutedata was similar to that of 1-minute data, indicating that our algorithm may not besensitive to data completeness or sampling rate.
Table 6. Impact of downsampling on performance
Note: Keys are the same as Table 2.
3.4. ValidationWe validated the logistic regression model via 100 repetitions of the bootstrapvalidation procedure using p90HR_div_MAP, p50_abs_dHR, p95_5_HR_prod_SAP,and p5SAP as predictors. The classification performance was assessed by both ROCand contingency analysis. The validation results were reported as mean ± standard errorin Table 7. The tightness of the variance limit for these performance indexes indicatesthat they are reliable. The results of 10-fold cross validation were similar (not shown).
20 Hemodynamic Instability Prediction Through Continuous MultiparameterMonitoring in ICU
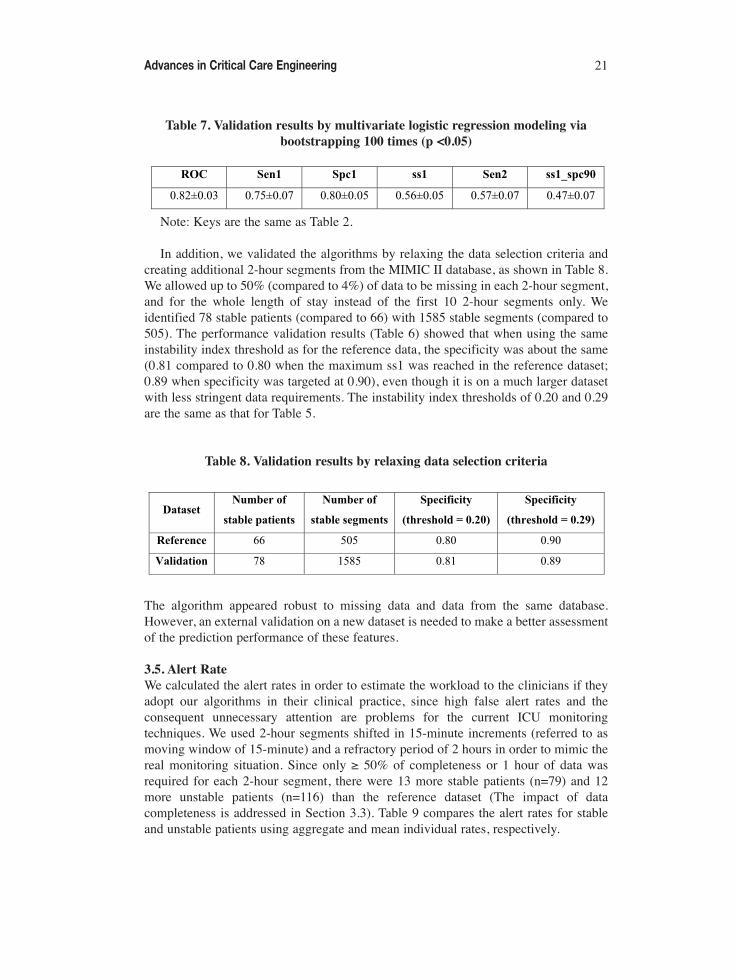
Table 7. Validation results by multivariate logistic regression modeling viabootstrapping 100 times (p <0.05)
Note: Keys are the same as Table 2.
In addition, we validated the algorithms by relaxing the data selection criteria andcreating additional 2-hour segments from the MIMIC II database, as shown in Table 8.We allowed up to 50% (compared to 4%) of data to be missing in each 2-hour segment,and for the whole length of stay instead of the first 10 2-hour segments only. Weidentified 78 stable patients (compared to 66) with 1585 stable segments (compared to505). The performance validation results (Table 6) showed that when using the sameinstability index threshold as for the reference data, the specificity was about the same(0.81 compared to 0.80 when the maximum ss1 was reached in the reference dataset;0.89 when specificity was targeted at 0.90), even though it is on a much larger datasetwith less stringent data requirements. The instability index thresholds of 0.20 and 0.29are the same as that for Table 5.
Table 8. Validation results by relaxing data selection criteria
The algorithm appeared robust to missing data and data from the same database.However, an external validation on a new dataset is needed to make a better assessmentof the prediction performance of these features.
3.5. Alert RateWe calculated the alert rates in order to estimate the workload to the clinicians if theyadopt our algorithms in their clinical practice, since high false alert rates and theconsequent unnecessary attention are problems for the current ICU monitoringtechniques. We used 2-hour segments shifted in 15-minute increments (referred to asmoving window of 15-minute) and a refractory period of 2 hours in order to mimic thereal monitoring situation. Since only ≥ 50% of completeness or 1 hour of data wasrequired for each 2-hour segment, there were 13 more stable patients (n=79) and 12more unstable patients (n=116) than the reference dataset (The impact of datacompleteness is addressed in Section 3.3). Table 9 compares the alert rates for stableand unstable patients using aggregate and mean individual rates, respectively.
Advances in Critical Care Engineering 21
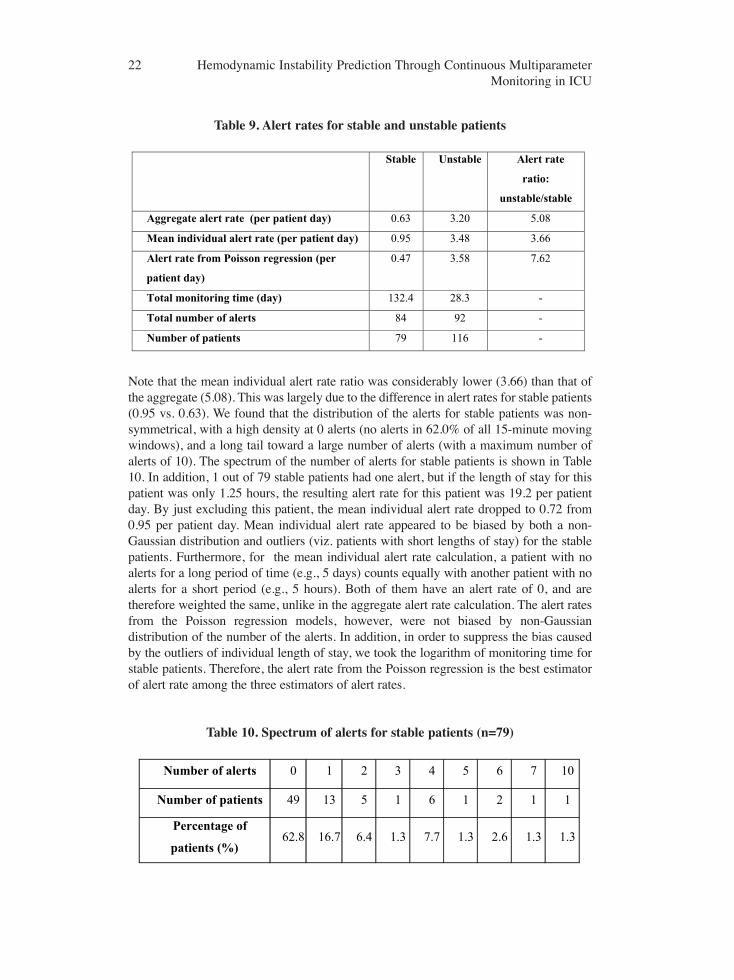
Table 9. Alert rates for stable and unstable patients
Note that the mean individual alert rate ratio was considerably lower (3.66) than that ofthe aggregate (5.08). This was largely due to the difference in alert rates for stable patients(0.95 vs. 0.63). We found that the distribution of the alerts for stable patients was non-symmetrical, with a high density at 0 alerts (no alerts in 62.0% of all 15-minute movingwindows), and a long tail toward a large number of alerts (with a maximum number ofalerts of 10). The spectrum of the number of alerts for stable patients is shown in Table10. In addition, 1 out of 79 stable patients had one alert, but if the length of stay for thispatient was only 1.25 hours, the resulting alert rate for this patient was 19.2 per patientday. By just excluding this patient, the mean individual alert rate dropped to 0.72 from0.95 per patient day. Mean individual alert rate appeared to be biased by both a non-Gaussian distribution and outliers (viz. patients with short lengths of stay) for the stablepatients. Furthermore, for the mean individual alert rate calculation, a patient with noalerts for a long period of time (e.g., 5 days) counts equally with another patient with noalerts for a short period (e.g., 5 hours). Both of them have an alert rate of 0, and aretherefore weighted the same, unlike in the aggregate alert rate calculation. The alert ratesfrom the Poisson regression models, however, were not biased by non-Gaussiandistribution of the number of the alerts. In addition, in order to suppress the bias causedby the outliers of individual length of stay, we took the logarithm of monitoring time forstable patients. Therefore, the alert rate from the Poisson regression is the best estimatorof alert rate among the three estimators of alert rates.
Table 10. Spectrum of alerts for stable patients (n=79)
22 Hemodynamic Instability Prediction Through Continuous MultiparameterMonitoring in ICU
Given relative alert rates and exposure times, one can estimate the PPV asTP/(TP+FP), where TP is true positive, FP is false positive . For example, using theaggregate alert rates presented in this paper (Table 9) with an unstable-to-stable-alertsratio of about 5:1 and assuming that the stable patients are exposed to the alerts 5 timeslonger than the unstable patients (in the aggregate), then the number of TP will be equalto that of FP, and therefore the PPV would be 0.5.
4. DISCUSSIONICU clinicians often base clinical care decisions on multiple physiological parametersand their trends. Traditional alerting technologies use single parameter and singlethreshold to alarm clinicians for attention. This work suggests that there may bephysiologic features that can be predictive of impending hemodynamic deterioration –and subsequent need for aggressive therapy – at least two hours prior to the onset oftherapy. We found that hemodynamically unstable patients had lower BP, higher shockindex, lower HR variability, and higher rate pressure product than stable patients. Thelatter three features are associated with physiological compensation mechanisms of lowBP. For an optimal tradeoff of specificity and sensitivity, logistic regression achieved aspecificity and sensitivity of 0.80±0.07 and 0.75±0.06, respectively. When thespecificity was targeted at 0.90, the sensitivity was 0.57±0.07. By targeting at a highspecificity, the false alert rate decreased. The present algorithm appeared robust tomissing data. The aggregate alert rate was 0.63 and 3.20 per patient day for stable andunstable patients, respectively, and the alert rate ratio of unstable vs. stable patients was7.62.
4.1. Feature ExtractionWhen the same single features were used, the ROC results of the present algorithmswere similar to the results of one of the winners of the Computers in CardiologyChallenge 2009 [19], even though there were a number of differences between the two(for example, to predict well-defined and hand-picked cases of acute hypotensiveevents rather than clinical intervention of pressor, and different prediction windows ofone hour vs. two hours). One of the strengths of our algorithms is that it enables usingmultiple features to predict patient deterioration, and the classification performance formulti-feature was better than single feature, e.g., sensitivity of 0.55 (4 features extractedfrom HR and BP, Table 3) compared to 0.43 (using best single feature ofp90HR_div_MAP, Table 2) when specificity was targeted at 0.90.
In addition to the features described above, we explored a number of simple andcomplex features (e.g., from wavelet transform of different scales), but there was nosignificant improvement in performance. Saeed et al. introduced a predictive algorithmusing symbolic representations of wavelet representations of hemodynamic time seriesand the MIMIC II database [14, 20]. The performance results of the present study weresimilar to theirs. However, given the limitations of our reference data set, it is prematureto conclude that complex features such as ECG signal and beat-to-beat HRV havenothing to contribute. In particular, the features utilized in the present study were basedon features chosen a priori that are likely to be physiologically meaningful. Robust“unsupervised” data mining techniques with MIMIC II may reveal hitherto
Advances in Critical Care Engineering 23
undiscovered features that may be predictive of one or more classes of hemodynamicinstability.
4.2. Clinical relevance of Hemodynamic Control and Reasons for False Negativesand PositivesReduced BP and its downward trend are the main indicators of hemodynamic instabilityin clinical practice, consistent with our findings. Shock index, defined as the ratio of HRto BP, was the primary predictor of hemodynamic instability in our findings, but notwidely used in clinical practice. Shock index was not correlated with SAP (correlationcoefficient < 0.1). Low HR variability has been associated with various disease states[11], and we found that unstable patients tended to have lower physiological HRvariation than stable patients, a result consistent with the findings of the studies thatused HR and BP spectra to assess the autonomic cardiovascular regulation [21]. Ratepressure product was reported to be associated with mortality in trauma ICU patients[22]. This combination of features yielded a better classification performance than asingle feature such as BP (ROC 0.82 vs. 0.75).
In order to improve our prediction algorithms, we attempted to determine the reasonsfor false negatives and false positives by examining the nurses’ notes for additionalinformation about patients, such as diagnosis, surgery, and medication. The followingsummarizes the reasons.
We identified two categories of reasons for false negatives where our algorithmsfailed to classify unstable segments as unstable. First, some patients simply deterioratedtoo fast (within 2-hour window) to be caught by our algorithms. Second, there wasbackground information available to the clinician but not to the algorithms, and theclinicians intervened due to patients’ conditions other than hemodynamic instability.These conditions were confirmed by reviewing the individual patient’s medical records,and included the following: (a) Intra Aortic Balloon Pump (IABP) patients who werehemodynamically unstable by definition, but their physiological parameters of HR andBP may appear stable, and our data selection did not exclude them. Thus a number offalse negatives were due to our inability to exclude IABP patients in our data selection.(b) Patients receiving a vasopressor after cardiac surgery to manage mild to severehypotension, or to overcome the excessive effect of nitroprusside during high bloodpressure control, rather than hemodynamic deterioration. (c) Head injury and spinalcord injury patients who receive neosynephrine and labetalol simultaneously to controlBP and to ensure sufficient cerebral perfusion pressure (CPP). (d) Head injury andspinal cord injury patients with vasopressors as a therapeutic measure in order tomaintain CPP above 70 mmHg in the phase of elevated intracranial pressure (ICP) bykeeping the BP at elevated levels (e.g., mean BP > 80 mmHg or systolic BP > 95mmHg) [23,24]. Thus, a number of false negatives (above cases (b) to (d)) were notedbecause patients received vasopressors for therapeutic purposes not related tohemodynamic instability. These patients were not hemodynamically unstable from aclinical perspective. For instance, the head injury patients in our study often receivedvasopressor as a therapeutic measure to maintain CPP in the setting of increased ICP. Inthese cases, the administration of vasopressor therapy did not coincide with truehemodynamic instability. However, since we used administration of vasopressors as the
24 Hemodynamic Instability Prediction Through Continuous MultiparameterMonitoring in ICU
criterion of instability (rationale of using this criterion is given in METHODS Section2.1), these patients were labeled as unstable in our dataset, which confounded thepresent results.
The main reason for false positives, where our algorithm failed to classify stablepatients as stable, was when a low BP (e.g., SAP < 90 mmHg) was accompanied by aconsistently high HR (e.g., HR > 100 bpm), resulting in a high instability index, sinceone of the major predictors was the ratio of HR to BP (viz. p90_HR_div_BP). Thishappened in 7 out of 10 patients whose instability index well exceeded the thresholdwhen targeting a specificity of 90% (a threshold of 0.50 vs. 0.29, see RESULTS Section3.3) using our predictive algorithm. However, physicians sometimes missed theseevents either because they failed to notice this pattern indicating a need for interventionand the patients recovered later on, or they did not consider it to be serious enough toinitiate an intervention that met our definition (viz. major vasopressor administration).Instead, the clinicians may have chosen a less aggressive treatment for the episode ofhemodynamic instability that did not meet our absolute definitions for an intervention(e.g., an infusion of 100cc/hour of normal saline for several consecutive hours). Otherreasons of false positives included positional or dampened waveform data arising fromthe arterial line collecting BP data [25]. In this case, the monitor continued to reportartificially low BP values, but the clinicians at the bedside recognized the conditionfrom the resulting waveform and chose not to initiate therapy knowing the arterial linedata was falsely reporting low BP. Ideally, the BP data from the overdampenedwaveform should be removed from the database using waveform data. However, it hasalso been demonstrated that the dampened data could also be removed using arterial BPtime series and the data usefulness could be potentially improved [26]. This will be onearea for our future algorithm improvement.
Our next steps include improving instability prediction by combining clinical labdata with trend data, as well as validating the algorithms on new datasets.
5. CONCLUSIONSTimely identification of patients who are likely to become hemodynamically unstablewould enable earlier intervention which will limit organ injury associated with lowperfusion events in the ICU. The algorithms presented in this work based on trend(minute-by-minute) data of vital signs could form the basis for reliable predictiveclinical alerts which identify patients likely to become hemodynamically unstable sothat the clinicians can proactively manage these patients and reduce the number ofhemodynamic instability events, leading to improved patient care and outcome.
ACKNOWLEDGMENTSWe would like to thank the Editor-in-Chief, Professor Ming Chyu, for his extensivecomments and suggestions that improved the readability of this paper. We would alsolike thank the reviewers and David Schaffer for their suggestions.
Advances in Critical Care Engineering 25

NOMENCLATURE abs_dHR (t) absolute difference between two consecutive heart rate
data points, i.e., |HR(t+1)-HR(t)|, where t is the index ofthe current time, t+1 is the index of the next time
ECO (t) estimated cardiac output, defined as kco*HR(t)*[SAP(t)-DAP(t)]/MAP(t), where kco is a proportionality related toarterial compliance
FP false positiveHR_div_BP (t) ratio of heart rate and blood pressure values at time t,
where BP can be SAP and MAPHR_prod_BP (t) product of heart rate and blood pressure values at time t,
where BP can be SAP or MAPp10ECO_slope_16min 10th percentile of ECO slope of moving 16-minute
window p10HR_slope_4min 10th percentile of HR slope of moving 4-minute windowp10SAP_slope_proj_8min 10th percentile of SAP projected 8 minutes past current
point based on slope of regression line for last 8 minutesp50_abs_dHR median of absolute difference of successive heart rate datap50HR 50th percentile of heart rate values in each segment p5SAP, p5MAP 5th percentile of SAP and MAPp90_10_ECO difference of 90th and 10th percentiles of ECOp90HR_div_MAP 90th percentile of the ratio of heart rate to mean arterial
blood pressure values p90HR_div_SAP 90th percentile of the ratio of heart rate to systolic arterial
blood pressure valuep95_5_HR_prod_SAP difference between 95th and 5th percentiles of the product
of heart rate and systolic arterial blood pressurePPV positive predictive valueSen1, Spc1 sensitivity and specificity values when ss1 is maximized
over the whole range Sen2, ss1_spc90 sensitivity and ss1 values when specificity = 90%Slope (t) the linear regression slope of HR and BP at time t
calculated for a time window (e.g., of 4-, 8-, 16- and 32-minute) from each 2-hour segment
Slope projection (t) projected HR or BP values n minutes past current point attime t based on the slope of regression line for the last nminutes, where n can be 4-, 8-, 16-, and 32-minute
stdHR_div_MAP standard deviation of the ratio of HR and MAPstdHR_div_SAP standard deviation of the ratio of HR and SAPTP true positive
26 Hemodynamic Instability Prediction Through Continuous MultiparameterMonitoring in ICU
REFERENCES[1] Vohra, H.A., Goldsmith, I.R., et al, The predictors and outcome recidivism in cardiac ICUs., European
Journal of Cardio-Thoracic Surgery, 2005, 27(3), 508-11.
[2] Tsien, C.L., Fackler, J.C., Poor prognosis for existing monitors in the intensive care unit, Crit CareMed, 1997, 25(4), 614-9.
[3] Chambrin, M.C., Alarms in the intensive care unit: how can the number of false alarms be reduced?Crit Care, 2001, 5(4), 184-8.
[4] Aboukhalil, A., Nielsen, L., Saeed, M., Mark, R. G. & Clifford, G. D. 2008 Reducing false alarm ratesfor critical arrhythmia using the arterial blood pressure waveform. J. Biomed. Inform. 41, 442-451.
[5] Casserly, B., Read, R., Levy M.M., Hemodynamic monitoring in sepsis, Crit Care Clin, 2009,25(4), 803-23.
[6] Anonymous, Practice parameters for hemodynamic support of sepsis in adult patients in sepsis. TaskForce of the American College of Critical Care Medicine, Society of Critical Care Medicine, Crit CareMed, 1999, 27(3), 639-60.
[7] Ali, W., Eshelman, L.J., Morphograms: exploiting correlation patterns to efficiently identify clinicallysignificant events in intensive care units. In Conf Proc 2004 IEEE Eng Med Biol Soc, 2004, 1, 554-7.
[8] Eshelman L.J., Lee K.P., et al, Development and evaluation of predictive alerts for hemodynamicinstability in ICU patients, in AMIA Annu Symp Proc 2008, 2008, 379-83.
[9] Cao, H., Eshelman, L.J., et al., Predicting ICU Hemodynamic Instability Using ContinuousMultiparameter Trends. In Conf Proc IEEE Eng Med Biol Soc.2008, 2008, 3803-6.
[10] Saeed, M., Lieu, C., et al, MIMIC II: a massive temporal ICU patient database to support research inintelligent patient monitoring. In Comput Cardiol, 2002, 29, 641-4.
[11] Task Force of the European Society of Cardiology and the North American Society of Pacing andElectrophysiology, heart rate variability: standards of measurement, physiological interpretation andclinical use, Circulation, 1996, 93(5), 1043-65.
[12] Rady, M.Y., Smithline, H.A., et al, A comparison of the shock index and conventional vital signs toidentify acute, critical illness in the Emergency Department, Ann Emerg Med, 1994, 24(4), 685-90.
[13] Gobel, F.L., Norstrom, L.A., The rate-pressure product as an index of myocardial oxygen consumptionduring exercise in patients with angina pectoris, Circulation, 1978, 57(3), 549-56.
[14] Saeed, M., Temporal pattern recognition in multiparameter ICU data, Ph.D. dissertation,Massachusetts Institute of Technology, 2007.
[15] Sun J.X., Reisner A.T., et al., The cardiac output from blood pressure algorithms trial, Crit Care Med,2009, 37(1), 72-80.
[16] Cao, H., Lake, D.E., et al, Toward quantitative fetal heart rate monitoring, IEEE Trans Biomed Eng,2006, 53(1), 111-8.
[17] Hilden, J., Glasziou, P., Regret graphs, diagnostic uncertainty and Youden’s index, Statistics inMedicine, 1996, 15, 969-86.
[18] Gross, B.D., Sacristán, E., et al, Supplemental Systemic Oxygen Support Using an IntestinalIntraluminal Membrane Oxygenator, Artificial Organs, 2000, 24(11), 864–9.
[19] Chen, X., Xu, D., et al, Forecasting acute hypotensive episodes in intensive care patients based on aperipheral arterial blood pressure waveform. In Comput Cardiol, 2009, 36.
[20] Saeed, M., Mark, R.G., A Novel Method for the Efficient Retrieval of Similar MultiparameterPhysiologic Time Series Using Wavelet-base Symbolic Representations. In AMIA Annu Symp Proc.2006, 2006, 679–683.
[21] Parati, G., Saul, J.P., Rienzo M.D., Mancia G., Spectral Analysis of Blood Pressure and Heart RateVariability in Evaluating Cardiovascular Regulation. In Hypertension, 1995, 25, 1276-1286.
[22] Cao, H., Norris, P., et al. Mortality and Non-Invasive Measurement of Myocardial OxygenConsumption Variability: A Study of 935 Trauma Patients. In The 29th Annual Conference on Shock2007, Baltimore, MD, Jun 9-12, 2007.
Advances in Critical Care Engineering 27

[23] Rosner, M.J., Rosner, S.D., Johnson, A.H.. Cerebral perfusion pressure: management protocol andclinical results. J Neurosurg, 1995, 83, 949-962
[24] Guidelines for the management of severe head injury. Brain Trauma Foundation, AmericanAssociation of Neurological Surgeons, Joint Section on Neurotrauma and Critical Care. JNeurotrauma, 1996, 13, 641-734.
[25] Stoker, M.R., Principles of pressure transducers, resonance, damping and frequency response,Anaesthesia and intensive care medicine, 2004, 5(11), 371-5.
[26] Cao, H., Norris, P., et al, A Simple Real-time Non-physiological Artifact Filter for Invasive ArterialBlood Pressure Monitoring: a Study of 1852 Trauma ICU Patients. In Conf Proc IEEE Eng Med BiolSoc. 2006, 1, 1417-20
28 Hemodynamic Instability Prediction Through Continuous MultiparameterMonitoring in ICU