Embed Size (px)
Citation preview

Edinburgh Research Explorer
Full-scale fire test on an earthquake-damaged reinforcedconcrete frame
Citation for published version:Kamath, P, Sharma, UK, Kumar, V, Bhargava, P, Usmani, A, Singh, B, Singh, Y, Torero, J, Gillie, M &Pankaj, P 2015, 'Full-scale fire test on an earthquake-damaged reinforced concrete frame' Fire SafetyJournal, vol 73, pp. 1-19. DOI: 10.1016/j.firesaf.2015.02.013
Digital Object Identifier (DOI):10.1016/j.firesaf.2015.02.013
Link:Link to publication record in Edinburgh Research Explorer
Document Version:Publisher's PDF, also known as Version of record
Published In:Fire Safety Journal
General rightsCopyright for the publications made accessible via the Edinburgh Research Explorer is retained by the author(s)and / or other copyright owners and it is a condition of accessing these publications that users recognise andabide by the legal requirements associated with these rights.
Take down policyThe University of Edinburgh has made every reasonable effort to ensure that Edinburgh Research Explorercontent complies with UK legislation. If you believe that the public display of this file breaches copyright pleasecontact [email protected] providing details, and we will remove access to the work immediately andinvestigate your claim.
Download date: 07. Jun. 2018

Full-scale fire test on an earthquake-damaged reinforced concreteframe
Praveen Kamath a, Umesh Kumar Sharma a,n, Virendra Kumar b, Pradeep Bhargava a,Asif Usmani c, Bhupinder Singh a, Yogendra Singh d, Jose Torero e, Martin Gillie f,Pankaj Pankaj c
a Department of Civil Engineering, Indian Institute of Technology Roorkee, Roorkee 247667, Indiab Department of Civil Engineering, National Institute of Technology Jamshedpur, Jamshedpur 831014, Indiac Institute for Infrastructure and Environment, School of Engineering, University of Edinburgh, Edinburgh EH9 3JL, UKd Department of Earthquake Engineering, Indian Institute of Technology Roorkee, Roorkee 247667, Indiae School of Civil Engineering, University of Queensland, Queensland 4072, Australiaf School of Mechanical, Aerospace and Civil Engineering, University of Manchester, Manchester M60 1QD, UK
a r t i c l e i n f o
Article history:Received 26 August 2012Received in revised form12 December 2014Accepted 1 February 2015
Keywords:Post earthquake fireReinforced concrete frameFull-scale testing and structuralperformance
a b s t r a c t
Fire, in the aftermath of an earthquake has evolved as a severely destructive force since the last century[1]. Codes and regulations exist in countries situated in seismically active regions of the world in order toensure safety of buildings and their occupants in the event of an earthquake; it is however rare to findregulations that also require the consideration of fire following an earthquake, thereby leaving thispossibility to be dealt with entirely by emergency responders on an ad-hoc basis with little preparedness.Fire following earthquake (FFE) events in the past, although rare, have sometimes been as destructive asthe original earthquake. The aim of this study was to carry out a set of full-scale loading tests on anearthquake damaged, reinforced concrete frame subsequently exposed to fire. The sequential loadingwas devised in the form of a three phase testing procedure – simulated earthquake loading facilitated bycyclic quasi-static lateral loads; followed by a compartment fire; and finally by subjecting the earthquakeand fire damaged frame to a monotonic pushover loading to assess its residual capacity. The reinforcedconcrete frame was well instrumented with numerous sensors, consisting of thermocouples, straingauges, linear variable differential transducers (LVDTs) and pressure sensors. A large database of resultsconsisting of temperature profiles, displacements and strains has been generated and salient observa-tions have been made during each stage of loading. This paper describes the experimental investigationand serves as a vehicle for dissemination of the key findings and all the important test data to theengineering community which could be used for validating numerical simulations for further advancingthe knowledge and understanding in this relatively poorly researched area.
& 2015 Elsevier Ltd. All rights reserved.
1. Introduction
The risk of fires in the aftermath of earthquakes is well known.Two largest peacetime fire disasters, regarded as the worst everfire disasters for mankind in the twentieth century: San Francisco(1906) and Tokyo (1923) were essentially triggered by earth-quakes. Major conflagrations and widespread devastation werereported in both the events resulting in far greater damage at-tributed to the fires than that caused by the earthquakes on theirown. In the 1906 San Francisco earthquake and fire, about 28,000buildings were destroyed whereas in 1923 earthquake and fire,
about 447,000 houses were destroyed by the blazing fire. Themajority of buildings those days were constructed using timber.The modern cities of San Francisco and Tokyo are completelysurrounded with reinforced concrete (RC) tall buildings andstructures. Fortunately, the scales of these events have not beenrepeated; though there have been many major earthquakes, whichhave led to fires in their wake. Nearly all major Californianearthquakes were followed by multiple ignitions, most notably the1989 Loma Prieta and the 1994 Northridge earthquakes, both ofwhich were followed by over 100 ignitions each. After the 1995Hanshin, Kobe (Japan) earthquake, over 100 ignitions were re-corded in Kobe City. The 1999 earthquake of Marmara (Turkey)was followed by many local fires in buildings and industrial pre-mises which were classified as uncontrollable. Collapse of re-inforced concrete structures were predominantly reported in the
Contents lists available at ScienceDirect
journal homepage: www.elsevier.com/locate/firesaf
Fire Safety Journal
http://dx.doi.org/10.1016/j.firesaf.2015.02.0130379-7112/& 2015 Elsevier Ltd. All rights reserved.
n Corresponding author. Fax: þ91 1332 275568.E-mail address: [email protected] (U.K. Sharma).
Fire Safety Journal 73 (2015) 1–19

two latter fire following earthquake (FFE) events. In the 1995Hanshin FFE event, a 90 m high RC heater stack collapsed whereasin the 1999 Marmara FFE event, many mid-rise non-ductile RCframes were reported to be damaged in the earthquake and
further affected by fire [2]. It is also important to note that manyrecent earthquakes, viz., Haiti (2010), Fukushima (2011) and Chile(2014) were followed by many conflagrations that damaged life-lines and critical facilities such as hospitals, oil refineries, and city
Fig. 1. Schematic of the test setup (a) plan and (b) elevation.
P. Kamath et al. / Fire Safety Journal 73 (2015) 1–192

centre areas irrespective of their type of construction [3–5]. Othersources of fires included outbreak of forest fires in earthquake hitzones, viz., Chile, where as many as 2000 houses in the denselypopulated areas were destroyed [6]. The level of urbanisation andindustrialisation and improper storage and disposal of HAZMATsin seismic zones are obvious factors that exacerbate the risks
associated with FFE events.Building codes in most countries require engineers to consider
the effect of seismic and fire loading on structures in order toprovide an adequate level of resistance to these hazards, howeverthis is done on a separate basis without considering any linkagebetween the two hazards. There are no current regulations that
Fig. 2. Detailing of a typical column per IS 13920:1993.
P. Kamath et al. / Fire Safety Journal 73 (2015) 1–19 3

Fig. 3. Detailing of reinforcement in a typical (a) slab and (b) beam.
P. Kamath et al. / Fire Safety Journal 73 (2015) 1–194

require structures to consider these hazards in a sequential man-ner and neither is there any available quantification of suchcompound loading, using which could assist engineers in provid-ing structures with the required resistance if desirable from aperformance perspective. A critical review of the literature showsthat research on behaviour of concrete structures under post-earthquake fires is still in its infancy. Considerable new researcheffort in the form of full-scale tests is required for addressing thechallenges posed by FFE in order to generate the requisite un-derstanding and its quantification. Although some of this type ofwork has been discussed in earlier literature [7], to the best of theauthors' knowledge no experimental studies have been conductedpreviously for reckoning the structural response of an RC frameunder a FFE event. A full-scale test involving the investigation ofthe fire performance of 5 storey RC building damaged by inducingground motion on a shake table was performed at University ofCalifornia San Diego's outdoor test facility. However, the scope ofthe test was limited to the aspects of building fire safety, namelycompartmentation, performance of fire protection systems, fire-stop systems, performance of exterior façade in relation to theescape of fire and smoke and fire and smoke transmission thoughthe interior [8].
In view of the preceding discussion, the primary objective ofthe study undertaken in this research was to examine experi-mentally the performance of a typical reinforced concrete buildingframe under an FFE scenario. The sequential loading consisted offirst subjecting the RC test frame to cyclic quasi-static loadingagainst a reaction wall in a dedicated outdoor testing facility at theDepartment of Civil Engineering, Indian Institute of TechnologyRoorkee so as to induce a pre-defined seismic damage. The da-maged test frame was then exposed to a one hour compartmentfire fed by a pool of kerosene.
2. Experimental programme
A single storey RC test frame was constructed on the strongfloor of the test facility, which forms the test frame of the present
investigation. The test setup in plan and elevation is presented inFig. 1(a) and (b), respectively, which also shows the geometricdimensions of the test frame. The test frame consisted of four300 mm square columns at 3000 mm centres in the N–S and E–Wdirections supporting a grid of four 230�230 mm2 beams un-derlying a 120 mm thick RC roof slab as shown in Fig. 1(b). Thehydraulic jacks were located in the north direction and the ven-tilation opening for the fire compartment was facing the westdirection as shown in Fig. 1(a). Plinth beams (used in India forsupporting masonry walls above ground level) also known asgrade beamwere also provided at the level of the ground floor andtheir size and configuration were similar to the roof beams of thebuilding. All the elements of the test frame were cast in differentconcrete lifts. Column fixity at the base was provided by the ter-mination of all the four columns into a 900 mm thick RC raftfoundation of plan size 6750�8550 mm2. The building frame wasdesigned according to the recommendations of the relevant IndianStandards. The ductile design of the test frame was establishedbased on the recommendations of IS 13920 [9] and the typicaldetailing of the reinforcement in the column, slab and beam of thetest frame are shown in Figs. 2 and 3(a, b), respectively. They sa-tisfy the requirements of IS 13920 [9] and SP: 34 [10]. Although itis desirable to use nominally identical companion specimens inany structural testing programme to ensure repeatability of testresults, because of the nature of test and resource constraints onlyone frame was tested.
The test frame was supported on the raft of the strong-floorand reaction wall testing facility built specifically for this purpose.The casting of the test frame occurred in five stages. The pedestalswere cast first on the strong-floor followed by the casting of800 mm height of the columns up to the soffit of the plinth beams.The plinth beams were then cast together with 300 mm height ofcolumns, which was followed by the construction of 1500 mmheight of all the columns. The rest of the frame was cast in one goduring the last pour of concrete in the structure. Care was taken inthe treatment of cold joints in the building to ensure that thedifferent segments of the concreted structure were properlybonded to each other. Care was also taken during mixing andplacing operations to ensure consistent concrete properties andconsolidation. Sufficient number of control specimens according tothe requirements of the Indian concrete code IS 456 [11] werecollected to monitor strength development in the test frame,particularly for determining the strength of concrete in the frameat the time of testing.
2.1. Materials
The mixture proportions of concrete used for casting the var-ious elements of the frame were in the proportion of 1:1.23:2.70,representing cement, fine aggregate and coarse aggregate re-spectively with a water–cement ratio of 0.44. The equivalent meancube compressive strength of concrete was 33.6 Mpa on the day ofthe test. The compressive strength was estimated according to theIndian Code IS456:2000 [11] based on 9 cubes (3 cubes per con-crete pour), the strengths of which were in the range of 715% of
Table 1Mechanical properties of the steel reinforcement under ambient conditions.
Dia of steel rebar and usage Yield stress(MPa)
Ultimate stress(MPa)
Yield strain (mm/mm)
Ultimate strain (mm/mm)
Elongation (%) Young's modulus (�105
MPa)
8 mm (Slab and beam ties) 550.69 642.97 0.0047 0.2070 20.7 2.1410 mm (Column ties) 446.57 538.21 0.0042 0.1960 19.6 2.1316 mm (Beam main reinforcement) 420.05 541.18 0.0023 0.1689 16.89 2.0320 mm (Column mainreinforcement)
448.55 567.50 0.0021 0.1458 14.58 2.10
Fig. 4. Loading history of the test frame (as obtained).
P. Kamath et al. / Fire Safety Journal 73 (2015) 1–19 5

Fig. 5. Instrumentation of the RC test frame (a) LVDT, (b) strain gauges (in beams and columns) (c) strain gauges (in slab), (d) thermocouples (in beams and columns), and(e) thermocouples (in slab).
P. Kamath et al. / Fire Safety Journal 73 (2015) 1–196

the mean strength reported. The details of the steel reinforcementused and its mechanical properties are provided in Table 1. Con-crete mix-proportioning was designed according to Indian Stan-dard IS10262:2009 [12] and the concrete was produced in ac-cordance with IS456:2000 [11]. A needle vibrator was used toensure proper compaction of the green concrete in casting all thetest frame components.
2.2. Key stages of the experiment
The following sections describe the stages of the test, namelyapplication of gravity loading; cyclic lateral loading to simulateseismic damage; fire following the simulated seismic damage; anda residual lateral load capacity test of the damaged and fire ex-posed frame after it had cooled down to the ambient environmenttemperature.
2.2.1. Gravity loadingA platform made of orthogonally oriented rolled steel I-beams
was constructed to rest on the four columns protruding above theroof slab of the test frame. This platform was loaded with1 m�1 m�0.1 m precast concrete slab strips and sand-filledhessian bags. The gravity loading was based on assuming that thetest frame columns were supporting the load of three storiesabove the ground floor in a notional R.C. building. According to therecommendations of the Indian seismic design code, IS 1893 (Part-1) [13], only 25% of the assumed uniformly distributed floor live
(or imposed) load of 2 kN/m2 is considered for seismic weightcalculations. Therefore, for estimating the loading on the platformthe full complement of the dead load and 25% of the live load fromthe assumed upper floors was considered, making a total gravityload of approximately 400 kN on the test frame. A schematic ofgravity loads on the loading platform is shown in Fig. 1(a) and (b).
2.2.2. Simulated seismic lateral loadingCyclic lateral loads on the test frame were applied in a quasi-
static manner in load-controlled mode using a pair of double
Fig. 6. (a) Simulated earthquake loading, (b) fire test and (c) residual capacity test on fire damaged RC frame.
Fig. 7. Load–displacement hysteretic curve.
Fig. 8. Nomenclature for the identification of RC test frame members and sche-matic of cracks due to cyclic loading.
P. Kamath et al. / Fire Safety Journal 73 (2015) 1–19 7

acting hydraulic rams acting in tandem with each other against astiff reaction wall and loading the frame at the roof slab level. Thesimulated seismic pre-damage thus induced corresponds to thelife safety level of structural performance according to FEMA 356[14]. The targeted lateral displacement in the first cycle of loadingwas 10 mm and this displacement was applied within 5 min andincremented by 10 mm in successive loading cycles so that at theconclusion of the loading cycles, the test frame was subjected to apre-calculated maximum displacement in order to induce thedesired level of mechanical damage. The loading history of the RCtest frame obtained by inducing lateral displacement corre-sponding to the life safety level of structural performance is pre-sented in Fig. 4. The calculated maximum target lateral
displacement of the test frame at roof level was 76 mm, whichcorresponds to an inter-storey drift ratio of 2% (Table C1-3, FEMA356 [14]). However, since the process was load controlled, themaximum lateral displacement obtained was �95 mm. This be-haviour is attributed to the process where an attempt was made tomaintain a constant load for facilitating the crack mapping activity.To ensure quasi-static loading, a time interval of about 300 s(frequency of 0.0033 Hz) [15] was chosen. However, upon loading,a constant time interval could not be followed due to the limita-tions of manual load controller attached to the hydraulic jacks.Also, the loading was stalled at intervals after each cycle to identifyand study the growth of cracks in different members of the RC testframe.
2.2.3. Fire loadingSubsequent to the testing of RC test frame under simulated
seismic load, the test frame was subjected to a compartment firetest. Before the actual fire test, a realistic compartment fire wasdesigned and tested in three mock fire tests, which were con-ducted in a temporarily constructed brick masonry compartmentof size 3000 mm�3000 mm�3000 mm as a replica of the com-partment that would encapsulate the frame in the actual tests. Thecompartment included a 3000 mm wide and 1000 mm heightopening at the base of one of its four sides. The opening was de-signed according to Thomas and Heselden [16] to achieve com-partment temperatures in the range of 900–1000 °C using kero-sene oil as fuel in a pool fire. The maximum temperatures in therange of 1198–1327 °C could be achieved in the third mock fire testafter the 21st minute and thus this fire design was chosen for thefire testing of the R.C. frame.
During the actual fire test of the RC test frame, the mild steeltray burner of size 1 m�1 m�0.05 m was placed at the centre ofthe compartment as in the mock fire tests. A galvanised iron pipeof diameter 0.0254 m was used for supplying the fuel to the bur-ner at a peak flow rate of 1.43�10�4 m3/s using a fixed head. Thetest frame was enclosed in a compartment fabricated on site usingfour detachable fire-proof panels. Each panel was made of steelangles and sheets and was provided with a single layer of glasswool insulation (25.4 mm thick) as the backing material. Over this,a thick layer of insulation was provided by means of glass woolmodules (300 mm�300 mm�200 mm in size). These moduleswere securely fastened to the metal frame. All panels were in-stalled firmly around the RC test frame with one of the panelsbeing smaller than the others to provide an identical opening asdescribed for the mock test compartment. The supply of fuel to thetray was terminated after one hour. Thereafter the fire was al-lowed to burn until the fuel in the tray was exhausted. Thiscorresponds to the decay phase, the longest of all stages of a fire.
2.2.4. Residual lateral load capacityThe final stage of the experiment comprised of subjecting the
RC test frame to a monotonic pushover loading to determine itsresidual capacity and quantify the strength and stiffness de-gradation during the cyclic and fire loading stages. The RC testframe was loaded continuously by the jacks to cause a lateraldisplacement towards the south beyond 95 mm, the maximumdisplacement imposed during cyclic lateral loading stage. Theloading was stopped when the hydraulic jacks reached theirmaximum ram length of 200 mm. The load and lateral displace-ment were recorded.
2.3. Instrumentation
A comprehensive instrumentation was devised for collectingthe data during the simulated seismic load test and subsequentlyduring the fire test. An on-site control room was constructed to
Table 2Formation of cracks in the RC test frame under cyclic loading.
Structural member Crack no. Roof slab displacement and loadingdirection
Slab 1 69 mm N–SB5 2 50 mm N–SB5 3, 4 80 mm S–NB5 1 95 mm N–SB7 1, 2 35 mm S–NB7 3 95 mm N–SC1 6, 9 31 mm N–SC1 7, 8 35 mm S–NC1 4, 5 95 mm N-SC1 1, 2, 3 85 mm S–NC2 9, 10, 11, 12, 13,
1435 mm S–N
C2 1, 2, 3 85 mm S–NC2 5, 6, 7 95 mm N–SC2 4, 8 85 mm S–NC3 9 31 mm N–SC3 1, 2, 3, 4 80 mm S–NC3 5, 6 95 mm N–SC3 7, 8 85 mm S–NC4 1, 3 69 mm N-SC4 2, 4 80 mm S–NC4 5, 7 95 mm N–SC4 6 85 mm S–NB1 4, 5, 6 40 mm N–SB1 2, 3 44 mm S–NB1 8, 9 61 mm S–NB1 7, 10, 11 69 mm N–SB1 1 80 mm S–NB3 8 31 mm N–SB3 3 35 mm S–NB3 4, 6 40 mm N–SB3 2, 7 44 mm S–NB3 5, 9 95 mm N–SB3 1 85 mm S–N
Fig. 9. Base shear vs. roof displacement.
P. Kamath et al. / Fire Safety Journal 73 (2015) 1–198

house various data acquisition systems and workstations. Theimposed cyclic lateral loads on the test frame were electronicallymeasured using two pressure sensors mounted on each of thedouble-acting hydraulic rams. Displacements at the roof levelwere measured using a network of nine linear variable displace-ment transducers (LVDT), in the vertical direction and eight in thehorizontal direction. Horizontal displacement transducers werepositioned in both parallel and perpendicular direction against thedirection of loading to capture the lateral displacement and tor-sion (if any). Fig. 5(a) illustrates the location of the displacementtransducers at the roof level. These transducers were supportedindependently by a secondary frame erected on all four sides ofthe frame and were kept free from any localised deflections of theframed structure.
Electrical resistance-type surface mounted high temperatureresistant strain-gauges were pasted on the steel rebars with the
help of high temperature resistant adhesive. One hundred and sixlocations were chosen in roof beams, columns and slab for re-cording the strain patterns in the test frame. The plinth beams,which were exposed on only one face, were equipped with 48number ambient temperature electrical-resistance type straingauges. Fig. 5(b) and (c) shows the typical locations of straingauges embedded inside the concrete at various key locations. Thetemperatures of concrete at different depths in the sections of thestructural members were recorded using 0.5 mm diameter K-typethermocouples embedded along the depth and across the width asshown in Fig. 5(d). Thermocouples were installed at three differentsections in the members i.e. near the end supports and at the mid-span of beams and mid-height of columns. Each section had ninethermocouples with five thermocouples along the depth of the
Fig. 10. Measured time–displacement curves.
Fig. 11. Schematics of the compartment fire.
Fig. 12. Spalling in roof slab after fire.
P. Kamath et al. / Fire Safety Journal 73 (2015) 1–19 9
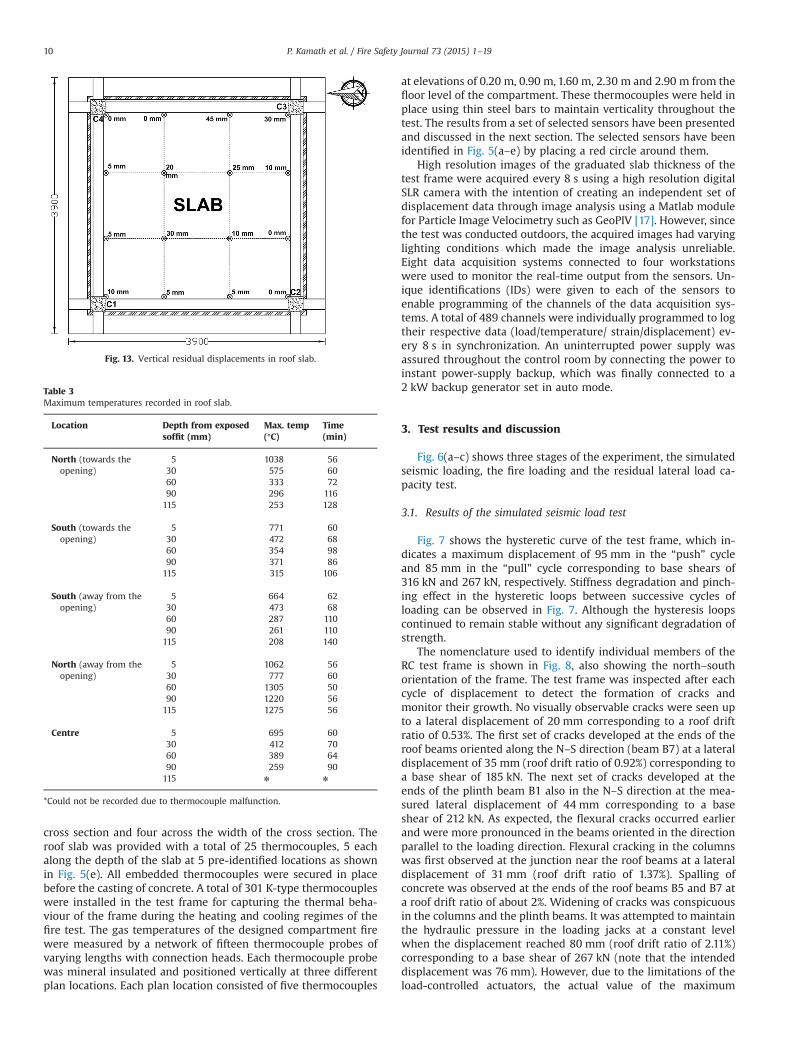
cross section and four across the width of the cross section. Theroof slab was provided with a total of 25 thermocouples, 5 eachalong the depth of the slab at 5 pre-identified locations as shownin Fig. 5(e). All embedded thermocouples were secured in placebefore the casting of concrete. A total of 301 K-type thermocoupleswere installed in the test frame for capturing the thermal beha-viour of the frame during the heating and cooling regimes of thefire test. The gas temperatures of the designed compartment firewere measured by a network of fifteen thermocouple probes ofvarying lengths with connection heads. Each thermocouple probewas mineral insulated and positioned vertically at three differentplan locations. Each plan location consisted of five thermocouples
at elevations of 0.20 m, 0.90 m, 1.60 m, 2.30 m and 2.90 m from thefloor level of the compartment. These thermocouples were held inplace using thin steel bars to maintain verticality throughout thetest. The results from a set of selected sensors have been presentedand discussed in the next section. The selected sensors have beenidentified in Fig. 5(a–e) by placing a red circle around them.
High resolution images of the graduated slab thickness of thetest frame were acquired every 8 s using a high resolution digitalSLR camera with the intention of creating an independent set ofdisplacement data through image analysis using a Matlab modulefor Particle Image Velocimetry such as GeoPIV [17]. However, sincethe test was conducted outdoors, the acquired images had varyinglighting conditions which made the image analysis unreliable.Eight data acquisition systems connected to four workstationswere used to monitor the real-time output from the sensors. Un-ique identifications (IDs) were given to each of the sensors toenable programming of the channels of the data acquisition sys-tems. A total of 489 channels were individually programmed to logtheir respective data (load/temperature/ strain/displacement) ev-ery 8 s in synchronization. An uninterrupted power supply wasassured throughout the control room by connecting the power toinstant power-supply backup, which was finally connected to a2 kW backup generator set in auto mode.
3. Test results and discussion
Fig. 6(a–c) shows three stages of the experiment, the simulatedseismic loading, the fire loading and the residual lateral load ca-pacity test.
3.1. Results of the simulated seismic load test
Fig. 7 shows the hysteretic curve of the test frame, which in-dicates a maximum displacement of 95 mm in the “push” cycleand 85 mm in the “pull” cycle corresponding to base shears of316 kN and 267 kN, respectively. Stiffness degradation and pinch-ing effect in the hysteretic loops between successive cycles ofloading can be observed in Fig. 7. Although the hysteresis loopscontinued to remain stable without any significant degradation ofstrength.
The nomenclature used to identify individual members of theRC test frame is shown in Fig. 8, also showing the north–southorientation of the frame. The test frame was inspected after eachcycle of displacement to detect the formation of cracks andmonitor their growth. No visually observable cracks were seen upto a lateral displacement of 20 mm corresponding to a roof driftratio of 0.53%. The first set of cracks developed at the ends of theroof beams oriented along the N–S direction (beam B7) at a lateraldisplacement of 35 mm (roof drift ratio of 0.92%) corresponding toa base shear of 185 kN. The next set of cracks developed at theends of the plinth beam B1 also in the N–S direction at the mea-sured lateral displacement of 44 mm corresponding to a baseshear of 212 kN. As expected, the flexural cracks occurred earlierand were more pronounced in the beams oriented in the directionparallel to the loading direction. Flexural cracking in the columnswas first observed at the junction near the roof beams at a lateraldisplacement of 31 mm (roof drift ratio of 1.37%). Spalling ofconcrete was observed at the ends of the roof beams B5 and B7 ata roof drift ratio of about 2%. Widening of cracks was conspicuousin the columns and the plinth beams. It was attempted to maintainthe hydraulic pressure in the loading jacks at a constant levelwhen the displacement reached 80 mm (roof drift ratio of 2.11%)corresponding to a base shear of 267 kN (note that the intendeddisplacement was 76 mm). However, due to the limitations of theload-controlled actuators, the actual value of the maximum
Fig. 13. Vertical residual displacements in roof slab.
Table 3Maximum temperatures recorded in roof slab.
Location Depth from exposedsoffit (mm)
Max. temp(°C)
Time(min)
North (towards theopening)
5 1038 5630 575 6060 333 7290 296 116115 253 128
South (towards theopening)
5 771 6030 472 6860 354 9890 371 86115 315 106
South (away from theopening)
5 664 6230 473 6860 287 11090 261 110115 208 140
North (away from theopening)
5 1062 5630 777 6060 1305 5090 1220 56115 1275 56
Centre 5 695 6030 412 7060 389 6490 259 90115 n n
*Could not be recorded due to thermocouple malfunction.
P. Kamath et al. / Fire Safety Journal 73 (2015) 1–1910

displacement reached was 95 mm. Flexural cracking, symptomaticof composite action between the RC slab and the roof beamsspanning along the N–S direction was noted. After the final load-ing cycle, these flexural cracks on the roof slab propagatedthroughout the span from one end to the other in the directionparallel to the direction of loading. The formation of these flexuralcracks indicates that a RC roof slab need not necessarily behave asa rigid diaphragm under in-plane loading [18]. Table 2 outlines thesequence of the occurrence of selected cracks in members of theframe that sustained the greatest damage during cycling loading.This table refers to crack locations shown schematically in Fig. 8.The base shear–roof displacement plot for the test frame depictedin Fig. 9 shows no deterioration in the lateral strength of the frameat life safety level of structural performance. Despite the observedinelastic excursions, the test frame did not suffer any significant
structural damage. Except for noticeable cracking, no major spal-ling (loss of big chunks) of concrete or loss of cover (exposingreinforcement) was observed at any location in the test frame atthe desired level of mechanical pre-damage.
3.2. Results of the fire test
Real time data recording was facilitated through a synchro-nized network of data-logging systems which largely performedwell during both heating and cooling phases of the fire test. Thedata from sensors were logged continuously for twelve hours thatincluded the one hour fire and eleven hours of cooling excursion.Detailed results and observations from the fire test are presentedin the following sections.
Fig. 14. Variation of temperatures in the roof slab along the depth (a) North (towards the opening), (b) South (towards the opening), (c) South (away from the opening),(d) North (away from the opening) and (e) at the centre.
P. Kamath et al. / Fire Safety Journal 73 (2015) 1–19 11

3.2.1. Compartment fire behaviourFig. 10(a), (b) and (c) shows the gas temperature history re-
corded in the fire compartment by three thermocouple trees atdifferent stages of fire: growth (roughly 16 min), fully developedfire stage (1 h) and decay stage (temperatures were measured forover 10 h, 90 min shown). The temperature profiles at five verticalpositions inside the compartment, 0.20 m, 0.90 m, 1.6 m, 2.3 mand 2.90 m are shown in each figure at locations A, B and C (asindicated in the inset figure of the compartment). The thermo-couples at tree locations A and C at the height of 0.2 m malfunc-tioned during the test as they were very close to the fire source.The maximum gas temperature recorded inside the compartmentduring the fire test was 1468 °C. This exceptionally high com-partment temperature was attained 62 min after ignition at anelevation of 2.8 m from the floor of the compartment. However, agas temperature of about 1000 °C was attained within 6 min ofignition as observed from Fig. 10(c). The desired time-temperaturebehaviour as achieved in mock fire tests was obtained precisely.Flashover occurred between five and seven minutes, after which,the fire advanced to its fully developed stage. As mentioned ear-lier, the supply of fuel to the pool was terminated after 60 min.However, the fire entered its decay stage once the remaining fuelin the tray had been consumed after approximately 15 min fol-lowing the termination of fuel supply. Fig. 11 shows a schematicvisualisation of the fire in the compartment deduced from obser-ving the flow of smoke and the external flaming. The flow patternwas as expected, however the exceptionally high compartmenttemperature attained after flashover (the maximum temperaturesexpected in a compartment fire are usually of the order of 1300 °C)could perhaps be attributed to the very high emissivity of the thicklayer of black smoke inside the compartment reaching a depth of
over 2 m coupled with a hydrocarbon fuel and a highly insulatedcompartment lining. This was an unusual feature of this com-partment as usually the highest temperatures in compartmentfires occur near the top of the compartment. Fig. 10(c) shows thatthe maximum temperature at the top of the compartment was1128 °C at 62 min after ignition. The flow pattern within thecompartment significantly affected the evolution of temperaturesin the structural members and highly non-uniform temperatureswere obtained within members that were otherwise at the sameheight in the compartment. This suggests that the incident heatfluxes at the same elevation were significantly different for dif-ferent surfaces and were highly dependent on the pattern of theflow of hot gases in the compartment. These differences will behighlighted further in discussing the temperature evolution ofvarious structural members in the following sections.
3.2.2. Behaviour of the frame and individual structural membersduring the fire test
The first major event to be observed, both visually and audibly,was the spalling (loss of cover concrete at the soffit) of concrete atthe roof slab initiating 4–5 min after ignition and continuing foralmost 15 min and resulting in the exposure of reinforcement.During this period the compartment temperatures near the roofslab were of the order of 300–400 °C in the front and close to1000 °C at the back of the compartment where the worst of thespalling was observed, suggesting that a high temperature gra-dient produces more severe spalling (see Fig. 12). Fire inducedspalling is often linked to temperature gradients causing rapiddevelopment of pore-pressure in concrete exceeding its tensilestrength [19–21], especially in regions of higher compressivestresses. Furthermore, the portions of the roof slab already
Fig. 15. Typical variation in temperatures in the roof level beams along the depth (a) B5, (b) B6, (c) B7 and (d) B8.
P. Kamath et al. / Fire Safety Journal 73 (2015) 1–1912

damaged during the lateral load test were more vulnerable tospalling compared to the undamaged portions. The loud fire-cracker like sounds which indicated the initiation of spallingsuggested that the spalling was of an explosive nature resultingfrom high pore pressures exacerbated by the fact that the framehad entrapped moisture from the rain earlier in the week beforethe test. Bazant [22], Ulm [23,24] and Zukov [25] suggest thatspalling occurs due to prevented thermal expansion. Careful ob-servation of spalled soffit of the slab suggests high compressiveforces were induced in the bottom layers of the roof slab concretedue to the rotational restraint offered by the peripheral beamsagainst thermal bowing (resulting in hogging bending momentsacross the whole exposed face of the slab). Further high com-pressive stresses are induced in the layers of concrete near theexposed face which are restrained from expanding thermally bythe cooler layers above and ultimately also by the lateral restraintfrom the peripheral beams. The lack of the spalling around theservice holes (made for anchoring thermocouple trees) also in-dicates that spalling may be influenced by high compressive. Eventhough compressive stresses exacerbate the severity of spalling,they were also likely to be beneficial to the integrity of the roofslab by aiding compressive membrane resistance (action similar toprestressing). However, spalling remains a very complex phe-nomenon dependent on parameters such as porosity, permeability,differential thermal expansion between cement paste and ag-gregate, high moisture content, heating rate and external loads[26] and is not the key focus of the current study. The lack ofcollapse of the roof slab even after severe spalling means that theeffect of thermally assisted compressive membrane action canconsiderably enhance the load-carrying capacity of the roof slabconsiderably beyond the calculated flexural resistance. In the laterstages of test, i.e., during the growth stage, spalling of concrete and
appearance of micro-cracks were observed in beams and columns.In general, the fire induced several surface cracks on all themembers which started forming at a temperature of about 600 °C.These cracks further widened at higher temperatures. As observedin the roof slab, the portions of the columns and beams, whichsuffered greater damage during the simulated earthquake loading,also experienced greater thermal damage.
The end regions of the beams B5 and B7 and columns C3 andC4 suffered minimal damage. The concrete in the soffit of thebeam B7 lost its cover at the edge resulting in the exposure of thelongitudinal and transverse reinforcement. Visual inspection of theframe was undertaken the 24 h. Unfortunately, the data acquisi-tion of vertical displacements of the roof slab during the fire failed.This was attributed to a transducer malfunctioning under the hightemperature environment. However, the post-fire residual verticaldisplacements of the roof slab were measured using an opticalinstrument and the schematic is represented in Fig. 13. A max-imum residual vertical displacement of 46 mm was recorded inthe roof slab after the fire test. Overall, the frame survived the fireexposure without collapse.
3.2.2.1. Roof slab. The maximum temperatures recorded at the fivechosen plan locations of the roof slab along the depth are providedin Table 3. It can be observed that near the exposed internal facesat the chosen locations of the slab the temperatures ranged be-tween 664 °C and 1038 °C after about 56–60 min of the start of thefire. The maximum temperatures of 575 °C, 472 °C, 473 °C, 777 °Cand 412 °C were observed at a distance of 30 mm from the ex-posed face i.e. roughly at the cover–core interface at the selectedfive locations. This shows that the slab experienced relativelyhigher temperatures throughout its depth compared to the roofbeams. A temperature of 1038 °C was recorded at the soffit of the
Fig. 16. Typical variation in temperatures in the roof level beams along the width (a) B5, (b) B6, (c) B7 and (d) B8.
P. Kamath et al. / Fire Safety Journal 73 (2015) 1–19 13

roof slab at the centre of the span. Temperatures of more than1200 °C were also noted at depths more than 60 mm from theexposed face in the N–E quarter, but this can be attributed to theloss of concrete and exposure of thermocouples. The temperaturevariation in the depth of slab is shown in Fig. 14(a–e) at the fiveplan locations embedded with thermocouples. It was observedthat the north half portion of the slab at the rear experiencedhigher temperatures than the southern half of the slab. Further-more, in the north half portion, the east side quarter portion hadhigher temperatures than the western quarter portion. The ther-mal data and the observations from the visual inspection indicatethat the roof slab of the test frame underwent major deteriorationunder fire in comparison with the other structural components.Despite the considerable damage, no collapse of slab was ob-served. The slab continued carrying the superimposed loads.
3.2.2.2. Roof level beams. As mentioned earlier, temperatures wererecorded at three different sections of all the roof beams, twosections near the joints and the mid-span section. At each of thesesections, the temperatures were measured at five locations alongboth the lateral dimensions of the beam. Fig. 15(a–d) shows
variations of temperature with depth from the exposed soffit forall the roof level beams at their mid-span section. The width-wisetemperature distribution for the roof level beams from the ex-posed side face, at the mid-span sections are shown in Fig. 16(a–d).The maximum temperatures attained in the roof beams during theheating stage at various levels along their depths (from exposedsoffit) and widths (from exposed vertical face) are given in Table 4.It is observed that the temperatures at the various levels along thedepth and across the width of the sections gradually increasedwith time. The temperatures along the depth of the roof beams B5,B6 and B8, at 5 mm from the exposed soffit were 365 °C, 512 °Cand 496 °C after 40 min of the fire exposure. The observed tem-peratures were high enough to initiate spalling, which correlatedwith visual observations of beam spalling most which occurredbetween 30 and 40 min. The average temperature observed at theconcrete cover–core interface (25 mm from surface) was 260 °C,however, the temperature at the mid-depth of the beam cross-section at the depth of 115 mm was much lower (80 °C). Thetemperatures at a depth of 5 mm from the exposed vertical face ofB5, B6 and B8 at 40 min were 692 °C, 230 °C and 84 °C, respec-tively. This indicates that the beam B5 was exposed to higher
Table 4Maximum temperatures recorded in roof level beams.
Member Direction Distance from internal surface(mm)
Left section Mid-span section Right section
Max. temp(°C)
Time (min) Max. temp(°C)
Time (min) Max. temp(°C)
Time (min)
B5 Depth (from exposed soffit) 5 604 52 593 52 784 5225 405 58 354 64 527 54115 124 168 147 156 123 154205 79 316 91 266 84 284225 81 220 72 320 76 282
B6 Depth (from exposed soffit) 5 555 58 658 152 n n
25 452 58 455 158 419 60115 120 184 163 270 175 148205 81 258 96 250 100 282225 77 238 82 20 94 294
B7 Depth (from exposed soffit) 5 902 52 972 52 940 5225 507 58 618 56 563 58115 172 166 232 128 179 142205 117 298 27 718 111 232225 111 320 109 286 97 234
B8 Depth (from exposed soffit) 5 900 58 662 58 662 6025 627 60 469 64 395 68115 202 144 187 156 124 232205 123 282 91 266 99 356225 118 296 80 44 93 344
B5 Width (from exposed verticalface)
5 587 52 840 52 890 5225 190 96 329 74 356 74
205 126 136 192 108 208 100225 179 92 230 84 194 100
B6 Width (from exposed verticalface)
5 169 68 336 56 190 9225 175 96 144 154 148 172
205 99 200 128 266 125 158225 101 142 121 166 127 234
B7 Width (from exposed verticalface)
5 280 60 425 56 279 5825 157 164 216 106 150 136
205 145 206 39 178 114 212225 133 206 147 186 98 188
B8 Width (from exposed verticalface)
5 269 66 n n 197 7825 142 170 146 170 139 176
205 127 200 122 226 118 254225 131 74 106 202 119 176
*Could not be recorded due to thermocouple malfunction.
P. Kamath et al. / Fire Safety Journal 73 (2015) 1–1914

Fig. 17. Typical variation in temperatures in the columns along N–S direction (a) C1, (b) C2, (c) C3 and (d) C4.
Fig. 18. Typical variation in temperatures in the columns along E–W direction (a) C1, (b) C2, (c) C3 and (d) C4.
P. Kamath et al. / Fire Safety Journal 73 (2015) 1–19 15

temperatures on its exposed vertical face than any other roof levelbeams inside the compartment (eventually reaching a maximumof 890 °C). This is consistent with the fire behaviour as shown inFig. 11. Beam B7, which was located at the rear of the compartmentattained the highest temperatures. At 5 mm depth from the ex-posed soffit the temperature was 350 °C after 30 min and rose to840 °C after 40 min of fire exposure (eventually reaching a max-imum of 972 °C). This sudden rise in temperature can be attributedto spalling of the corner cover which exposed the thermocouple.Despite high temperatures at the soffit B7 also experienced a lowtemperature of 120 °C at the mid-depth of the mid-span section.Furthermore, the temperatures measured at the mid-span sectionsof the roof beams were higher than the temperatures measurednear the joints at the corners, where cracks were predominant dueto induced seismic damage. This implies that the pre-damage in-duced at the lateral cyclic loading stage may not have a significantinfluence on the heat transfer near the corners and certainly muchless than the influence of the flow pattern of hot gases in thecompartment (Fig. 11) which seem to be the primary governing
factor determining the temperature evolution in the structuralcross-sections.
3.2.2.3. Columns. The temperatures in the columns were recordedat various sections along their both lateral dimensions designatedas N–S direction and E–W direction henceforth. The variations oftemperature with the depth of the section for all the chosen sec-tions were then plotted. Some typical plots showing such tem-perature variations along the depth of the section at the mid-sections of the columns are shown in the Figs. 17(a–d) and 18(a–d),along N–S and E–W directions, respectively. The maximum tem-peratures attained at different depths at three sections of thecolumns i.e. near the joints and the mid-height section are given inTable 5. It can be observed that the temperatures decreased alongthe section with the increase in the distance from the exposedsurface, as expected. The temperatures decreased to about 100 °Cat a depth of 160 mm along the N–S direction at almost all thesections of the columns. However, in the E–W direction, the rate ofdecrease of temperature with distance from the exposed surfacewas lower and therefore the interior regions of columns in E–Wdirection experienced higher temperatures than in the N–S di-rection. The top sections of the columns attained higher tem-peratures than the bottom and mid sections except for the columnC4, where the mid-section along N–S direction showed highertemperatures than the end sections. In general, the column C4experienced the highest temperatures at all the sections followedby columns C3, C2 and C1. Overall, a maximum temperature of1021 °C was observed on the exposed surface of column C4 at themid-height section. It was observed that the maximum tempera-ture gradients were greater than 3.5 °C/mm for the portions abovethe mid height of the column C4. The degradation of concrete wasalso invariably observed at these locations. Relatively higherthermal damage of top end sections of the columns, especiallycolumns C3 and C4 may also be attributed to the presence of initiallateral load induced cracks and spalling at these locations. How-ever, despite spalling caused by an accelerated heat transfer onpre-damaged surface, the structural stability of the columns re-mained unaffected after the fire test.
3.2.2.4. Plinth level beams. Fig. 19(a–d) shows the variation oftemperatures along the depth at different sections of all the plinthlevel beams. The temperatures at the exposed surface of beam B1increased consistently with the duration of the fire with a strongtemperature gradient establishing along the depth, with the pointfurthest from the exposed surface remaining practically un-affected. However, the beam B3 which was located at the rear ofthe compartment, achieved very high temperatures along its en-tire depth approximately 30 min into the fire. Similarly the entiresection of beam B4 also attained temperatures of over 800 °C ataround 40 min. Beam B2 exhibited the most unusual temperatureprofile, albeit experiencing the lowest temperatures, where themiddle section remained relatively cooler than the periphery. Ofall the beams only Beam B1 appears to present the expectedtemperature profile, suggesting that actual heating profile may besignificantly affected by highly localised and variable fluxes fromthe fire, as mentioned earlier. The maximum temperatures ob-tained at chosen locations of the plinth beams and their corre-sponding durations are presented in Table 6. The results indicatethat the cover concrete of plinth beams experienced considerablyhigh temperatures, which accelerated their deterioration. Whilethe temperatures attained in the core concrete of the plinth beamsB1 and B2 were not severe, the plinth beams B3 and B4 attainedtemperatures of 894 °C and 1037 °C in their core regions, respec-tively. Overall, a maximum temperature of 1111 °C was recordedon the surface of the plinth beam B4 at its left section.
Table 5Maximum temperatures recorded in columns.
Member Direction Depth(mm)
Bottomsection
Mid-heightsection
Top section
Max.temp(°C)
Time(min)
Max.temp(°C)
Time(min)
Max.temp(°C)
Time(min)
C1 N–S 5 585 58 622 52 725 5240 312 62 372 64 486 58
150 78 148 154 156 149 168260 61 260 96 268 95 316295 58 278 76 320 97 220
C2 N–S 5 491 62 563 52 862 5240 371 64 337 64 579 54
150 95 116 139 156 135 154260 65 232 87 266 92 284295 64 238 68 320 84 282
C3 N–S 5 851 42 924 52 947 5240 500 64 587 56 532 58
150 n n 221 128 180 166260 n n 25 718 123 298295 n n 103 286 117 330
C4 N–S 5 842 58 1021 52 959 5240 487 64 649 56 575 58
150 157 150 244 128 183 142260 122 282 28 718 113 232295 122 284 114 286 99 234
C1 E–W 5 484 58 629 58 695 6040 282 62 446 64 415 68
260 75 258 86 266 104 356295 74 268 76 44 98 344
C2 E–W 5 297 62 527 52 583 5840 84 156 364 58 475 58
260 66 266 77 250 85 258295 n n 65 20 81 238
C3 E–W 5 680 50 625 52 889 5440 n n 432 58 352 58
260 n n 91 250 141 54295 n n 78 20 n n
C4 E–W 5 889 54 861 58 918 5840 352 58 610 64 640 60
260 141 54 118 266 125 282295 n n 104 44 121 296
*Could not be recorded due to thermocouple malfunction.
P. Kamath et al. / Fire Safety Journal 73 (2015) 1–1916

3.3. Results of the residual capacity test
Uniaxial monotonic lateral loading applied at this stage to theRC test frame was plotted against its corresponding displacementas shown in Fig. 20. The plot is compared with the loading en-velope of the cyclic lateral loading in the same direction. Thecomparison shows a degradation of both strength and stiffness inthe test frame after exposure to the simulated seismic and fireloading. An initial loss of 44% in the lateral load resisting capacitywas observed at the displacement of 30 mm. At the peak lateral
Fig. 19. Typical variation in temperatures in the plinth beams (a) B1, (b) B2, (c) B3 and (d) B4.
Table 6Maximum temperatures recorded in plinth beams.
Member Direction Depth(mm)
Left section Mid-spansection
Right section
Max.temp(°C)
Time(min)
Max.temp(°C)
Time(min)
Max.temp(°C)
Time(min)
B1 Depth 5 593 58 827 56 447 6225 318 62 397 58 338 64115 79 148 116 162 87 116205 62 260 90 260 59 232225 59 278 88 238 58 238
B2 Depth 5 270 62 508 64 n n
25 n n 608 56 755 55115 76 158 351 62 n n
205 62 260 n n n n
225 60 266 358 720 n v
B3 Depth 5 826 42 829 60 495 5825 491 64 865 60 287 64115 n n 894 60 92 152205 n n n n 72 280225 n n n n 72 284
B4 Depth 5 1111 54 1060 56 448 5825 439 58 1064 56 261 62115 312 66 1037 56 81 170205 177 54 1073 56 70 258225 n n 1076 56 68 268
*Could not be recorded due to thermocouple malfunction.
Fig. 20. Comparison of loading envelopes of seismic loading test and residual ca-pacity test.
P. Kamath et al. / Fire Safety Journal 73 (2015) 1–19 17

displacement of 96 mm, applied in the simulated seismic loadingstage, 10% degradation in lateral load resisting capacity was ob-served. It should be noted that the two plots are not strictlycomparable as one represents one side of a hysteretic backbonecurve and the other represents monotonic pushover. Althoughnumerous cracks and concrete spalling were predominantly ob-served at displacements beyond 100 mm, the frame showed nosign of collapse. The load was released upon reaching the targetdisplacement of 200 mm. A maximum load of 450 kN was re-corded at the target displacement. A residual permanent dis-placement of 27 mm was observed upon the release of the push-over load.
4. Conclusions
The observations from a realistic compartment fire test on afull-scale RC test frame, which was first subjected to simulatedseismic damage, are presented in this paper. Though the failure ofthe displacement transducers and most of the strain gauges duringthe fire test hindered the understanding of real time displace-ments and strains in the frame, the results obtained during theentire test in terms of the residual displacements, temperaturedistributions and the visual inspections provided substantial use-ful information on the behaviour of reinforced concrete framestructures subjected to a fire following an earthquake. Within thescope of the present investigation, the following main conclusionsmay be drawn.
1. FEMA 356 (2000) reports a value of 4% lateral drift at ‘collapseprevention’ level of structural performance under seismic vul-nerability assessment, which was imposed on the RC test framediscussed here. The present test reports that the expected da-mage condition specified by C1-2 and C1-3 of FEMA is con-servative. However, extensive cracks and plastic deformation atprobable hinge locations in beams were observed, confirmingthat the first plastic hinges occurred in beams. Following ob-servations made were contrary to FEMA (in the limited contextof this test):
a. Overall damage of the frame was not severe.b. No large degradation in the overall strength and stiffness was
observed.c. No large permanent drifts were obtained despite inducing a 4%
lateral drift.d. Frame showed no signs of collapse.e. No extensive spalling were observed in the columns and
beams.f. No buckling of reinforcement were observed.2. As designed, flashover was achieved within 5–7 min from ig-
nition. An exceptionally high gas temperature of 1468 °C wasattained in the middle of the compartment. This can be at-tributed to a hydrocarbon fuel (kerosene); a very deep smokelayer (over 2 m) resulting in high emissivity; and a highly in-sulating compartment boundary.
3. The roof slab experienced the greatest fire damage followed bycolumns, roof beams and plinth beams. The beams and col-umns positioned at the rear of the compartment experiencedgreater damage than the ones in the front. The results alsoshow that the position of the opening in the compartment andthe resulting movement of fire plume and hot gases have aconsiderable influence in terms of the evolution of tempera-tures in the structural sections and therefore the location ofdamage which may or may not overlap with the locations ofdamage resulting from the seismic loading. In this test thedamage locations did not overlap. There was no influence ofpre-damage observed in the RC frame in fire test. Presence of
cracking caused by simulated earthquake loading in the RCmembers did not exacerbate the fire damage as was antici-pated. However, damage in beams and columns accelerated theheat transfer through these members. Irrespective of theirpositions, mid sections of the columns and beams attainedhigher temperatures than their end sections because of theirproximity to the fire source.
4. From the temperature histories recorded inside the compart-ment, it is evident that the temperature distribution through-out the compartment is non-uniform because of the highlyvarying surface fluxes imposed by the fire, which confirms thatthe commonly used uniform compartment temperature as-sumption in fully developed fires is a crude representation ofreality.
5. Because of the unusually deep smoke layer the compartmentfire did not conform to the hot upper layer and cool lower layercompartment fire model. The highest temperatures were ob-tained in the middle third of the compartment and the upperlayer showed moderate temperatures. Thus, a three layer pat-tern was observed in the compartment.
6. This study has generated a database of temperatures andthermal gradients in the various sections of the structuralelements of the tested pre-damaged reinforced concrete frame,which provides a useful resource for researchers wishing tovalidate fire and structural simulations.
7. The better than expected fire resistance of the damaged RC testframe suggests that the Indian Standard recommendations[9,13] for seismic resistant design (particularly the re-commendations pertaining to ductile detailing of beam andcolumn reinforcement) are also instrumental in enhancing fireresistance.
Acknowledgements
This work was supported by the UK–India Education and Re-search Initiative (UKIERI). Authors also acknowledge the Depart-ment of Civil Engineering, Indian Institute of Technology Roorkeefor the laboratory facilities to carry out the testing of full-scale RCframe.
References
[1] C. Scawthorn, J.M. Eidinger, A.J. Schiff, Fire Following Earthquake, ASCE Pub-lications, Reston, VA, 2005.
[2] C. Scawthorn, W.-F. Chen, Earthquake engineering handbook, CRC press, BocaRaton, FL, 2002.
[3] L.A. Henao, 5 Dead as magnitude-8.2 quake hits northern Chile, ed., AssociatedPress, Santiago, Chile, AP, 2014.
[4] S. Romero, M. Lacey, Fierce quake devastates Haitian capital, The New YorkTimes, Santo Domingo, Dominican Republic, 2010.
[5] T. UK, Entire Japanese city on fire after earthquake, The Telegraph, Japan, 2011.[6] G. Ibanez, M. Jarroud, Chile fire toll: 12 dead; 2000 homes destroyed, Asso-
ciated Press, Chile, AP, 2014.[7] R. Botting, The impact of post-earthquake fire on the urban environment,
University of Canterbury, Canterbury, New Zealand, 1998.[8] J. Jones, Post earthquake fire results released, Civil Engineering: The Magazine
of the American Society of Civil Engineers (2013) (April 16).[9] BIS, Indian Standard, IS 13920: Ductile detailing of reinforced concrete struc-
tures subjected to seismic forces, Bureau of Indian Standards, New Delhi, India,1993.
[10] BIS, Indian Standard, SP 34: Handbook on concrete detailing and reinforce-ment, Bureau of Indian Standards, New Delhi, India, 1987.
[11] BIS, Indian Standard, IS 456: Code of practice for plain and reinforced concrete,Bureau of Indian Standards, New Delhi, India, 2000.
[12] BIS, Indian Standard, IS 10262: Concrete mix proportioning-Guidelines, Bu-reau of Indian Standards, New Delhi, India, 2009.
[13] BIS, Indian Standard, IS 1893(Part 1): General provisions and buildings: Cri-teria for earthquake resistant design of structures, Bureau of Indian Standards,New Delhi, India, 2002.
P. Kamath et al. / Fire Safety Journal 73 (2015) 1–1918

[14] FEMA, Prestandard and commentary for the seismic rehabilitation of build-ings, Building Seismic Safety Council, Federal Emergency ManagementAgency, Washington DC, 2000 (FEMA-356).
[15] S. Zhu, J.O. Jirsa, A study of bond deterioration in reinforced concrete beam-column joints, Phil M. Ferguson Structural Engineering Laboratory, Universityof Texas, Austin, 1983.
[16] P.H. Thomas, A.J.M. Heselden, Fully-developed Fires in Single Compartments:A Co-Operative Research Programme of the Conseil International Du Bâtiment,Building Research Establishment, Fire Research Station, United Kingdom, 1972.
[17] D.J. White, W.A. Take, GeoPIV: Particle Image Velocimetry (PIV) Software forUse in Geotechnical Testing, Technical Report, Cambridge University En-gineering Department, Cambridge, UK, 2002.
[18] S.W. Han, O.-S. Kwon, L.-H. Lee, Evaluation of the seismic performance of athree‐story ordinary moment‐resisting concrete frame, Earthq. Eng. Struct.Dyn. 33 (2004) 669–685.
[19] M.B. Dwaikat, V.K.R. Kodur, Hydrothermal model for predicting fire-inducedspalling in concrete structural systems, Fire Saf. J. 44 (4) (2009) 425–434.
[20] Y. Anderberg, Spalling phenomena of HPC and OC in: Proceedings of the
International Workshop on Fire Performance of High-Strength Concrete, NIST,Gaithersburg, 1997.
[21] T.Z. Harmathy, Effect of moisture on the fire endurance of building elements,ASTM Special Technical Publication (1965) 74–95.
[22] Z.P. Bazant, M.F. Kaplan, Concrete at High Temperatures: Material Propertiesand Mathematical Models, Longman Group Limited, 1996.
[23] F.-J. Ulm, P. Acker, M. Lévy, The “Chunnel” fire. II: analysis of concrete damage,J. Eng. Mech. 125 (1999) 283–289.
[24] F.-J. Ulm, O. Coussy, Z.P. Bazant, The “Chunnel” fire. I: chemoplastic softeningin rapidly heated concrete, J. Eng. Mech. 125 (1999) 272–282.
[25] V.V. Zhukov, Reasons of explosive spalling of concrete by fire, Beton I zhele-zobeton. Concrete and Reinforcement Concrete, , 1976.
[26] M. Kanéma, P. Pliya, A. Noumowé, J. Gallias, Spalling, thermal, and hydrousbehavior of ordinary and high-strength concrete subjected to elevated tem-perature, J. Mater. Civil Eng. 23 (2011) 921–930.
P. Kamath et al. / Fire Safety Journal 73 (2015) 1–19 19