Embed Size (px)
Citation preview

Edinburgh Research Explorer
Tritium calibration of the LUX dark matter experimentCitation for published version:Collaboration, LUX, Akerib, DS, Araújo, HM, Bai, X, Bailey, AJ, Balajthy, J, Beltrame, P, Bernard, EP,Bernstein, A, Biesiadzinski, TP, Boulton, EM, Bradley, A, Bramante, R, Cahn, SB, Carmona-Benitez, MC,Chan, C, Chapman, JJ, Chiller, AA, Chiller, C, Currie, A, Cutter, JE, Davison, TJR, Viveiros, LD, Dobi, A,Dobson, JEY, Druszkiewicz, E, Edwards, BN, Faham, CH, Fiorucci, S, Gaitskell, RJ, Gehman, VM, Ghag,C, Gibson, KR, Gilchriese, MGD, Hall, CR, Hanhardt, M, Haselschwardt, SJ, Hertel, SA, Hogan, DP, Horn,M, Huang, DQ, Ignarra, CM, Ihm, M, Jacobsen, RG, Ji, W, Kazkaz, K, Khaitan, D, Knoche, R, Larsen, NA,Lee, C, Lenardo, BG, Lesko, KT, Lindote, A, Lopes, MI, Malling, DC, Manalaysay, AG, Mannino, RL,Marzioni, MF, McKinsey, DN, Mei, DM, Mock, J, Moongweluwan, M, Morad, JA, Murphy, A, Nehrkorn, C,Nelson, HN, Neves, F, O`Sullivan, K, Oliver-Mallory, KC, Ott, RA, Palladino, KJ, Pangilinan, M, Pease, EK,Phelps, P, Reichhart, L, Rhyne, C, Shaw, S, Shutt, TA, Silva, C, Solovov, VN, Sorensen, P, Stephenson, S,Sumner, TJ, Szydagis, M, Taylor, DJ, Taylor, W, Tennyson, BP, Terman, PA, Tiedt, DR, To, WH, Tripathi,M, Tvrznikova, L, Uvarov, S, Verbus, JR, Webb, RC, White, JT, Whitis, TJ, Witherell, MS, Wolfs, FLH,Young, SK & Zhang, C 2016, 'Tritium calibration of the LUX dark matter experiment' Physical Review D -Particles, Fields, Gravitation and Cosmology, vol. 93, 072009. DOI: 10.1103/PhysRevD.93.072009
Digital Object Identifier (DOI):10.1103/PhysRevD.93.072009
Link:Link to publication record in Edinburgh Research Explorer
Document Version:Publisher's PDF, also known as Version of record
Published In:Physical Review D - Particles, Fields, Gravitation and Cosmology
General rightsCopyright for the publications made accessible via the Edinburgh Research Explorer is retained by the author(s)and / or other copyright owners and it is a condition of accessing these publications that users recognise andabide by the legal requirements associated with these rights.
Take down policyThe University of Edinburgh has made every reasonable effort to ensure that Edinburgh Research Explorercontent complies with UK legislation. If you believe that the public display of this file breaches copyright pleasecontact [email protected] providing details, and we will remove access to the work immediately andinvestigate your claim.Download date: 17. Mar. 2019

Tritium calibration of the LUX dark matter experiment
D. S. Akerib,1,2,3 H. M. Araújo,4 X. Bai,5 A. J. Bailey,4 J. Balajthy,6 P. Beltrame,7 E. P. Bernard,8 A. Bernstein,9
T. P. Biesiadzinski,1,2,3 E. M. Boulton,8 A. Bradley,1 R. Bramante,1,2,3 S. B. Cahn,8 M. C. Carmona-Benitez,10 C. Chan,11
J. J. Chapman,11 A. A. Chiller,12 C. Chiller,12 A. Currie,4 J. E. Cutter,13 T. J. R. Davison,7 L. de Viveiros,14 A. Dobi,15
J. E. Y. Dobson,16 E. Druszkiewicz,17 B. N. Edwards,8 C. H. Faham,15 S. Fiorucci,11 R. J. Gaitskell,11 V. M. Gehman,15
C. Ghag,16 K. R. Gibson,1 M. G. D. Gilchriese,15 C. R. Hall,6 M. Hanhardt,5,18 S. J. Haselschwardt,10 S. A. Hertel,19,8
D. P. Hogan,19 M. Horn,19,8 D. Q. Huang,11 C. M. Ignarra,2,3 M. Ihm,19 R. G. Jacobsen,19 W. Ji,1,2,3 K. Kazkaz,9
D. Khaitan,17 R. Knoche,6 N. A. Larsen,8 C. Lee,1,2,3 B. G. Lenardo,13,9 K. T. Lesko,15 A. Lindote,14 M. I. Lopes,14
D. C. Malling,11 A. G. Manalaysay,13 R. L. Mannino,20 M. F. Marzioni,7 D. N. McKinsey,19,8 D.-M. Mei,12 J. Mock,21
M. Moongweluwan,17 J. A. Morad,13 A. St. J. Murphy,7 C. Nehrkorn,10 H. N. Nelson,10 F. Neves,14 K. O’Sullivan,19,15,8
K. C. Oliver-Mallory,19 R. A. Ott,13 K. J. Palladino,2,3 M. Pangilinan,11 E. K. Pease,8 P. Phelps,1 L. Reichhart,16
C. Rhyne,11 S. Shaw,16 T. A. Shutt,1,2,3 C. Silva,14 V. N. Solovov,14 P. Sorensen,15 S. Stephenson,13
T. J. Sumner,4 M. Szydagis,21 D. J. Taylor,18 W. Taylor,11 B. P. Tennyson,8 P. A. Terman,20 D. R. Tiedt,5
W. H. To,1,2,3 M. Tripathi,13 L. Tvrznikova,8 S. Uvarov,13 J. R. Verbus,11 R. C. Webb,20 J. T. White,20 T. J. Whitis,1,2,3
M. S. Witherell,10 F. L. H. Wolfs,17 S. K. Young,21 and C. Zhang12
(LUX Collaboration)
1Department of Physics, Case Western Reserve University,10900 Euclid Avenue, Cleveland, Ohio 44106, USA
2SLAC National Accelerator Laboratory, 2575 Sand Hill Road, Menlo Park, California 94205, USA3Kavli Institute for Particle Astrophysics and Cosmology, Stanford University,
452 Lomita Mall, Stanford, California 94309, USA4High Energy Physics, Blackett Laboratory, Imperial College London, London SW7 2BZ, United Kingdom
5South Dakota School of Mines and Technology, 501 East Saint Joseph Street, Rapid City,South Dakota 57701, USA
6Department of Physics, University of Maryland, College Park, Maryland 20742, USA7SUPA, School of Physics and Astronomy, University of Edinburgh,
Edinburgh EH9 3FD, United Kingdom8Department of Physics, Yale University, 217 Prospect Street, New Haven, Connecticut 06511, USA9Lawrence Livermore National Laboratory, 7000 East Avenue, Livermore, California 94551, USA
10Department of Physics, University of California Santa Barbara, Santa Barbara, California 93106, USA11Department of Physics, Brown University, 182 Hope Street, Providence, Rhode Island 02912, USA
12Department of Physics, University of South Dakota, 414E Clark Street, Vermillion,South Dakota 57069, USA
13Department of Physics, University of California Davis, One Shields Avenue,Davis, California 95616, USA
14LIP-Coimbra, Department of Physics, University of Coimbra, Rua Larga, 3004-516 Coimbra, Portugal15Lawrence Berkeley National Laboratory, 1 Cyclotron Road, Berkeley, California 94720, USA
16Department of Physics and Astronomy, University College London,Gower Street, London WC1E 6BT, United Kingdom
17Department of Physics and Astronomy, University of Rochester, Rochester, New York 14627, USA18Sanford Underground Research Facility, South Dakota Science and Technology Authority,
Lead, South Dakota 57754, USA19Department of Physics, University of California Berkeley, Berkeley, California 94720, USA
20Department of Physics, Texas A&M University, College Station, Texas 77843, USA21Department of Physics, University at Albany, State University of New York,
1400 Washington Avenue, Albany, New York 12222, USA(Received 9 December 2015; published 20 April 2016)
We present measurements of the electron-recoil (ER) response of the LUX dark matter detector basedupon 170 000 highly pure and spatially uniform tritium decays. We reconstruct the tritium energy spectrumusing the combined energy model and find good agreement with expectations. We report the averagecharge and light yields of ER events in liquid xenon at 180 and 105 V=cm and compare the results to theNEST model. We also measure the mean charge recombination fraction and its fluctuations, and weinvestigate the location and width of the LUX ER band. These results provide input to a reanalysis of theLUX run 3 weakly interacting massive particle search.
DOI: 10.1103/PhysRevD.93.072009
PHYSICAL REVIEW D 93, 072009 (2016)
2470-0010=2016=93(7)=072009(12) 072009-1 © 2016 American Physical Society

I. INTRODUCTION
The Large Underground Xenon (LUX) experiment is aweakly interacting massive particle (WIMP) search locatedat the 48500 level of the Sanford Underground ResearchFacility (SURF) in Lead, South Dakota [1]. LUX detectsparticle interactions in liquid xenon (LXe) via scintillation(S1) and ionization charge (S2) signals. The LXe isinstrumented as a dual-phase time projection chamber(TPC), providing an energy measurement, position infor-mation in three dimensions, and single-scatter event iden-tification. Electron-recoil (ER) and nuclear-recoil (NR)interactions are distinguished by the ratio of the chargeand light signals (S2=S1). Results from the first LUXscience run (run 3) were first reported in Ref. [2]. Animproved analysis of the run 3 data is reported in Ref. [3].To calibrate the ER response of LUX, external gamma
sources such as 137Cs are occasionally employed, but suchsources are unable to produce a useful rate of fiducialsingle-scatter events in the WIMP energy range of interestdue to self-shielding. Therefore the ER response is moni-tored and calibrated primarily with electron-emitting radio-isotopes that can be dissolved in the LXe. Two suchsources, 83mKr [4,5] and tritium (3H), have been deployed,both providing a large sample of spatially uniform events.In this paper we report results from the calibration of LUXwith tritium, a single-beta emitter with a Q value of18.6 keV electron equivalent [6,7]. Neutron sources anda neutron generator are also employed by LUX to study theresponse to NR events [3].The tritium beta spectrum is well known both theoreti-
cally and experimentally. It has a broad peak at 2.5 keVanda mean energy of 5.6 keV [8–10]. 64.2% of the decaysoccur between 1 and 8 keV, the energy range of interest forWIMP searches in LUX. These characteristics make it anideal source for studying the ER response of the detector.83mKr, which emits 9.4 and 32.1 keV internal conversionelectrons, is well suited for routine monitoring and forcorrecting the spatial and temporal variations of the S1 andS2 signals but is less useful for studies of the S2=S1 ERdiscrimination variable. This is because both conversionelectrons are above the dark matter energy range andbecause the S2 signals from the two electrons generallyoverlap in the detector due to the short half-life of theintermediate state (154 ns). We note that the most importantbackground in LUX is due to Compton scatters, and suchevents are expected to have similar properties to betadecays in the tritium energy range [11].We use tritiated methane (CH3T) as the host molecule to
deliver tritium activity into LUX. Compared to moleculartritium (T2), CH3T has several advantages. It does notadsorb onto surfaces like the T2 molecule, and it does notinterfere with charge transport in LXe. Also, because of its12.3 year half-life, tritium must be removed from thedetector by purification, and methane is amenable tochemical removal with standard noble gas purifiers [12].
Note, however, that diffusion of tritium activity into plasticdetector components during the calibration is an importantconcern, since that activity may later recontaminate theLXe during the WIMP search runs. In this respect, CH3T ispreferable over T2 due to its larger molecular size and lowerdiffusion constant and solubility [13]. We investigated theCH3T contamination risk empirically with a series ofbenchtop tests prior to the first injection into LUX.These tests, which are described in Appendix A, demon-strated that the injection and removal could be done withoutundue risk to the experiment.An initial tritium data set of ∼7000 fiducial events was
obtained in August of 2013, and the results were reported inRef. [2]. Subsequently, in December 2013, we injectedadditional activity with a higher rate and obtained a fiducialtritium data set of 170 000 events. This data set is used tocharacterize the LUX ER band in Ref. [3]. Except whereotherwise noted, in this paper we report results from thelarger December 2013 data set.
II. INJECTION AND REMOVAL OF CH3T
Two CH3T sources with total activities of 3 and 200 Bqwere prepared for use in LUX. Each source is contained ina 2.25 liter stainless steel bottle and is mixed with twoatmospheres of LUX-quality purified xenon. The xenonacts as a carrier gas to extract the source from the bottle.The CH3T was synthesized by Moravek Biochemical [14]and delivered at a specific activity of 0.1 mCi per millimol.The injection system is shown in Fig. 1. A fraction of the
source bottle activity may be extracted by allowing thecarrier gas to expand into one or more expansion volumesconsisting of various sections of evacuated tubing. Theamount of extracted activity is controlled by selecting anexpansion volume of appropriate size. A methane purifier(SAES model MC1-905F [15]) located between the sourcebottle and the expansion volume ensures that only CH3T,CH4, and noble gases are allowed to enter the system. Theextracted activity is then injected into the TPC by divertinga small portion of the LUX xenon gas flow through theexpansion volumes.
FIG. 1. Plumbing diagram of the CH3T injection system forLUX. CH3T is injected downstream of the xenon gas purifier sothat it passes through the detector prior to being removed. Redarrows indicate the direction of flow.
D. S. AKERIB et al. PHYSICAL REVIEW D 93, 072009 (2016)
072009-2
The CH3T appears in the TPC within minutes of theinjection and is removed via the normal action of the LUXxenon purification system, which operates without inter-ruption during the entire procedure. Its centerpiece is a hotzirconium getter (SAES model PS4-MT15-R1 [15]) thatacts upon gaseous xenon and continuously removes allnon-noble species including methane. The xenon gas flowis driven by a diaphragm pump at a rate of ∼27 standardliters per minute (slpm).Prior to the first injection of CH3T activity, we first
confirmed that the LUX getter unit was capable of efficientmethane removal by injecting ∼1 ppm (part-per-milliong=g) of natural methane (CH4) into LUX. As shown inAppendix A, the CH4 concentration in the gas, monitoredwith a mass spectrometer, was observed to decreaseexponentially with a time constant of 5.9� 0.07 h. Theone-pass efficiency of the getter for CH4 removal wasmeasured to be 97% under the LUX flow and temperatureconditions by sampling the gas before and after the getter.On August 8, 2013, an initial injection of 20 mBq of
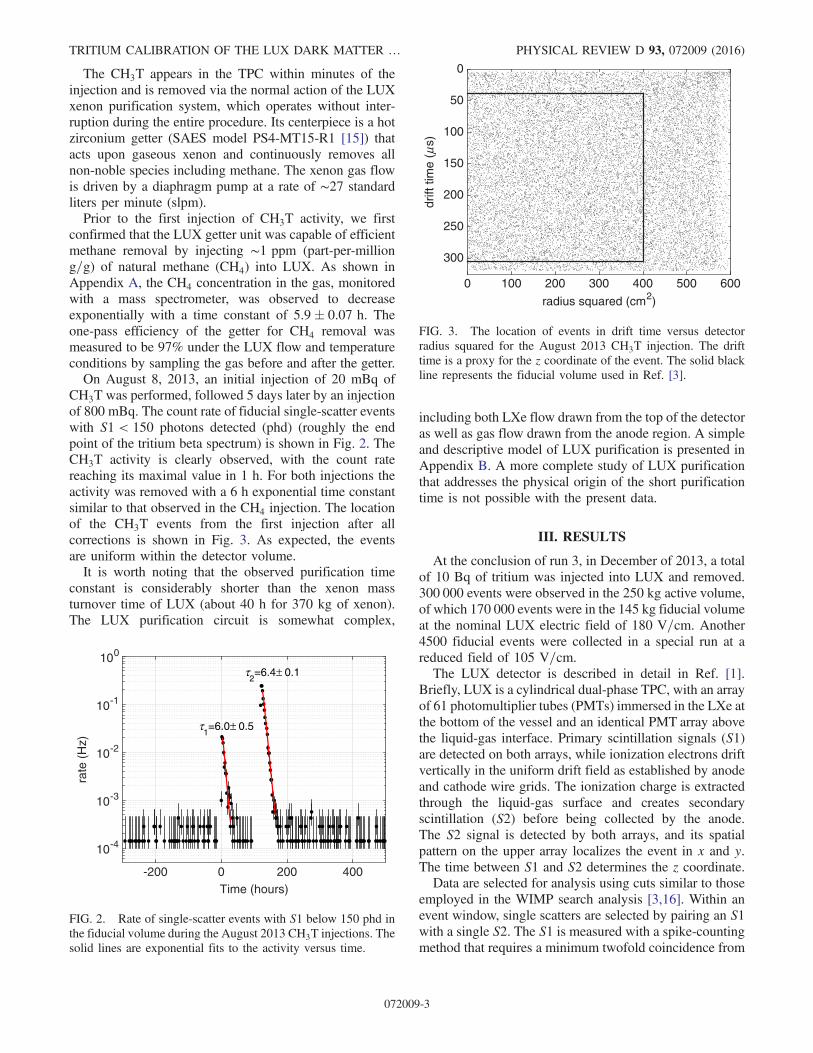
CH3T was performed, followed 5 days later by an injectionof 800 mBq. The count rate of fiducial single-scatter eventswith S1 < 150 photons detected (phd) (roughly the endpoint of the tritium beta spectrum) is shown in Fig. 2. TheCH3T activity is clearly observed, with the count ratereaching its maximal value in 1 h. For both injections theactivity was removed with a 6 h exponential time constantsimilar to that observed in the CH4 injection. The locationof the CH3T events from the first injection after allcorrections is shown in Fig. 3. As expected, the eventsare uniform within the detector volume.It is worth noting that the observed purification time
constant is considerably shorter than the xenon massturnover time of LUX (about 40 h for 370 kg of xenon).The LUX purification circuit is somewhat complex,
including both LXe flow drawn from the top of the detectoras well as gas flow drawn from the anode region. A simpleand descriptive model of LUX purification is presented inAppendix B. A more complete study of LUX purificationthat addresses the physical origin of the short purificationtime is not possible with the present data.
III. RESULTS
At the conclusion of run 3, in December of 2013, a totalof 10 Bq of tritium was injected into LUX and removed.300 000 events were observed in the 250 kg active volume,of which 170 000 events were in the 145 kg fiducial volumeat the nominal LUX electric field of 180 V=cm. Another4500 fiducial events were collected in a special run at areduced field of 105 V=cm.The LUX detector is described in detail in Ref. [1].
Briefly, LUX is a cylindrical dual-phase TPC, with an arrayof 61 photomultiplier tubes (PMTs) immersed in the LXe atthe bottom of the vessel and an identical PMT array abovethe liquid-gas interface. Primary scintillation signals (S1)are detected on both arrays, while ionization electrons driftvertically in the uniform drift field as established by anodeand cathode wire grids. The ionization charge is extractedthrough the liquid-gas surface and creates secondaryscintillation (S2) before being collected by the anode.The S2 signal is detected by both arrays, and its spatialpattern on the upper array localizes the event in x and y.The time between S1 and S2 determines the z coordinate.Data are selected for analysis using cuts similar to those
employed in the WIMP search analysis [3,16]. Within anevent window, single scatters are selected by pairing an S1with a single S2. The S1 is measured with a spike-countingmethod that requires a minimum twofold coincidence from
Time (hours)-200 0 200 400
rate
(H
z)
10-4
10-3
10-2
10-1
100
τ1=6.0± 0.5
τ2=6.4± 0.1
FIG. 2. Rate of single-scatter events with S1 below 150 phd inthe fiducial volume during the August 2013 CH3T injections. Thesolid lines are exponential fits to the activity versus time.
radius squared (cm2)
0 100 200 300 400 500 600
drift
tim
e ( μ
s)
0
50
100
150
200
250
300
FIG. 3. The location of events in drift time versus detectorradius squared for the August 2013 CH3T injection. The drifttime is a proxy for the z coordinate of the event. The solid blackline represents the fiducial volume used in Ref. [3].
TRITIUM CALIBRATION OF THE LUX DARK MATTER … PHYSICAL REVIEW D 93, 072009 (2016)
072009-3

PMTs that are not in neighboring channels. We correct theS1 and S2 signals for spatial and temporal variations suchas the light collection efficiency and the free electronlifetime with 83mKr data. We report the S1 and S2 signalsizes in units of phd [3], a measure which more accuratelyreflects the true number of vacuum ultraviolet quantacompared to the more familiar photoelectron countingby properly accounting for double photoelectron emissionas reported in Ref. [17]. The S2 signal is required to begreater than 165 phd (∼6 extracted electrons) to ensureaccurate x − y position reconstruction. Events are requiredto be within a fiducial volume between 38 and 305 μs indrift time [8.5 and 48.6 cm in the charge drift direction (z)measured from the face of the bottom PMTs] and less than20 cm radius. In addition to the above selection cuts, whichare applied to the WIMP search, in the tritium data we alsoreject events where the S2 signal is truncated by the end ofan event buffer. This pathology is negligible in WIMPsearch data but is present at a small level in the tritium datadue to the larger event rate.
A. Tritium energy spectrum
We interpret the data in terms of the combined energymodel for electron recoils [18], where the total energy of aninteraction is directly proportional to the number of quantaproduced (ionization electrons plus scintillation photons):
Etotal ¼ W · ðnγ þ neÞ; ð1Þ
whereEtotal is the energy of the deposition in keVand nγ andne are the number of photons and electrons, respectively.We employ the combined energy model because it repro-duces well the true energy of the event, while the individualphoton and electron signals are nonlinear in energydue to the effects of recombination. We use a W value of13.7� 0.2 eV=quantum [19]. In LUX nγ and ne are propor-tional to the S1 and S2 signals, with gain factors g1 and g2:
Etotal ¼ W ·
�S1g1
þ S2g2
�; ð2Þ
where S1 and S2 have units of phd and g1 and g2 haveunits of phd=quantum. g1 is the light collection efficiencyreferenced to the center of the detector times the averagequantum efficiency of the PMT arrays, while g2 is theproduct of the electron extraction efficiency at theliquid-gas interface and the average size of the singleelectron response in phd. For the December 2013tritium data set presented here, g1, g2, and the extractionefficiency are measured to be 0.115� 0.005 phd=photon,12.1� 0.9 phd=electron, and 50.9%� 3.8%, respectively.The constraint was set by allowing g1 and g2 to floatand fitting the data to a true tritium spectrum [10]. In theLUX run 3 WIMP search, g1, g2, and the extractionefficiency are measured with monoenergetic source data
and single electron events to be 0.117� 0.003 phd=photon,12.1� 0.8 phd=electron, and 49.1%� 3.2% [3,16], respec-tively, consistent with the values adopted here. The value ofg1 is also consistent with expectations from a Monte Carlosimulation of LUX [16], while the value of the electronextraction efficiency is consistent with benchtop measure-ments [20,21]. The consistency of g1 and g2 with expect-ations provides evidence that the W value adopted here isvalid for the tritium energy range, although an exactdetermination of W is not possible from this data.A scatter plot of ne versus nγ for the tritium data at
180 V=cm is shown in Fig. 4, along with the projectedhistograms on each axis. Contours of constant energy in1 keV intervals are also plotted, derived from Eq. (1).The tritium energy spectrum, obtained by projecting the
data along the lines of constant energy, is shown in Fig. 5.The data are compared to a tritium spectrum with an
applied energy resolution of σE ¼ W ·ffiffiffiffiffiffiffiffiffiffiffiffiffiffiffiffiffiffiffiffiffiffiffiffiffiffiffiffiffiffiffiσðnγÞ2 þ σðneÞ2
q,
where σðnγÞ and σðneÞ represent the detector resolution forphoton and electron counting, respectively. In the fit themodel is normalized to the data. The ratio of the data to thesmeared theoretical spectrum is shown in Fig. 6, along withan empirical fit to an error function. The effective 50%energy threshold for ER events is found to be1.24� 0.026 keV. The excellent agreement between dataand theory from 3 keV to the end point of the tritiumspectrum provides powerful support for the combinedenergy model of Eq. (1).
B. Light and charge yields
The mean light and charge yields of ER events in LUXare obtained by dividing the mean light and charge signalsby the combined energy in each energy bin. The result isshown for 180 and 105 V=cm in Fig. 7, along with NEST
FIG. 4. Scatter plot of ne versus nγ for 170 000 fiducial tritiumevents at 180 V=cm. Lines of constant energy are indicatedassuming a W value of 13.7 eV. The data are projected onto neand nγ histograms on each axis.
D. S. AKERIB et al. PHYSICAL REVIEW D 93, 072009 (2016)
072009-4
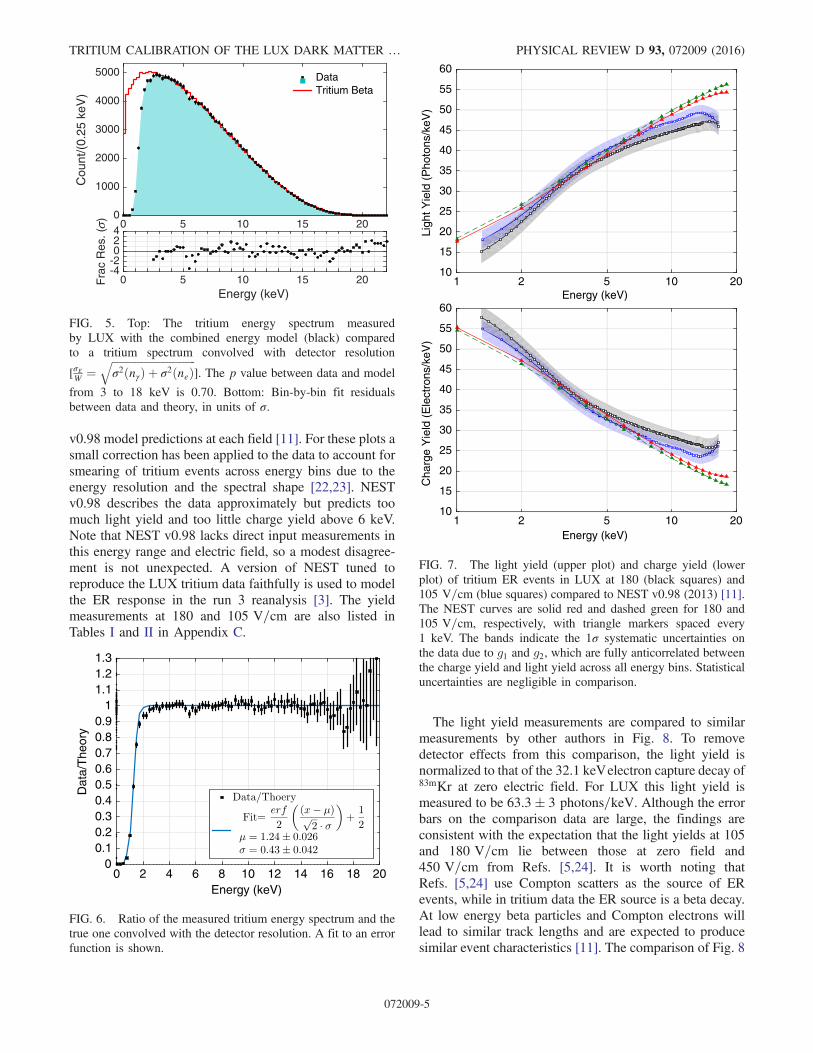
v0.98 model predictions at each field [11]. For these plots asmall correction has been applied to the data to account forsmearing of tritium events across energy bins due to theenergy resolution and the spectral shape [22,23]. NESTv0.98 describes the data approximately but predicts toomuch light yield and too little charge yield above 6 keV.Note that NEST v0.98 lacks direct input measurements inthis energy range and electric field, so a modest disagree-ment is not unexpected. A version of NEST tuned toreproduce the LUX tritium data faithfully is used to modelthe ER response in the run 3 reanalysis [3]. The yieldmeasurements at 180 and 105 V=cm are also listed inTables I and II in Appendix C.
The light yield measurements are compared to similarmeasurements by other authors in Fig. 8. To removedetector effects from this comparison, the light yield isnormalized to that of the 32.1 keVelectron capture decay of83mKr at zero electric field. For LUX this light yield ismeasured to be 63.3� 3 photons=keV. Although the errorbars on the comparison data are large, the findings areconsistent with the expectation that the light yields at 105and 180 V=cm lie between those at zero field and450 V=cm from Refs. [5,24]. It is worth noting thatRefs. [5,24] use Compton scatters as the source of ERevents, while in tritium data the ER source is a beta decay.At low energy beta particles and Compton electrons willlead to similar track lengths and are expected to producesimilar event characteristics [11]. The comparison of Fig. 8
0 5 10 15 20
Cou
nt/(
0.25
keV
)
0
1000
2000
3000
4000
5000 DataTritium Beta
Energy (keV)0 5 10 15 20F
rac
Res
. (σ
)
-4-2024
FIG. 5. Top: The tritium energy spectrum measuredby LUX with the combined energy model (black) comparedto a tritium spectrum convolved with detector resolution
[σEW ¼ffiffiffiffiffiffiffiffiffiffiffiffiffiffiffiffiffiffiffiffiffiffiffiffiffiffiffiffiffiffiffiffiσ2ðnγÞ þ σ2ðneÞ
q]. The p value between data and model
from 3 to 18 keV is 0.70. Bottom: Bin-by-bin fit residualsbetween data and theory, in units of σ.
Energy (keV) 0 2 4 6 8 10 12 14 16 18 20
Dat
a/T
heor
y
00.10.20.30.40.50.60.70.80.9
11.11.21.3
FIG. 6. Ratio of the measured tritium energy spectrum and thetrue one convolved with the detector resolution. A fit to an errorfunction is shown.
Energy (keV) 1 2 5 10 20
Ligh
t Yie
ld (
Pho
tons
/keV
)
10
15
20
25
30
35
40
45
50
55
60
Energy (keV) 1 2 5 10 20
Cha
rge
Yie
ld (
Ele
ctro
ns/k
eV)
10
15
20
25
30
35
40
45
50
55
60
FIG. 7. The light yield (upper plot) and charge yield (lowerplot) of tritium ER events in LUX at 180 (black squares) and105 V=cm (blue squares) compared to NEST v0.98 (2013) [11].The NEST curves are solid red and dashed green for 180 and105 V=cm, respectively, with triangle markers spaced every1 keV. The bands indicate the 1σ systematic uncertainties onthe data due to g1 and g2, which are fully anticorrelated betweenthe charge yield and light yield across all energy bins. Statisticaluncertainties are negligible in comparison.
TRITIUM CALIBRATION OF THE LUX DARK MATTER … PHYSICAL REVIEW D 93, 072009 (2016)
072009-5

provides modest support for this expectation, albeit withlarge experimental uncertainties.
C. Recombination at 180 and 105 V=cm
As shown in Fig. 7, we find that the light yield increasesrapidly between 1 and 6 keVand then becomes less energydependent over the remainder of the tritium spectrum, whilethe charge yield exhibits the complementary behavior. Weunderstand these variations as being due to recombination,the process by which newly liberated ionization electronsare captured by Xeþ ions, creating additional Xe� excitons,and ultimately scintillation photons [25].We model recombination as follows [19,26,27]. Starting
with aW value of 13.7 eV, we assume that α, the initial ratioof excitons to ions prior to recombination, is 0.2 indepen-dent of energy and electric field [28,29]. Then the initialnumber of ions prior to recombination (Nion, equivalent tothe initial number of electrons), and the initial number ofexcitons prior to recombination (Nex), and their sum (thetotal number of quanta), all increase linearly with energy asshown by the solid lines in Fig. 9. Also shown in Fig. 9 arethe total observed number of electrons and scintillationphotons after recombinationmeasuredwith the LUX tritiumdata at 180 V=cm as a function of energy. The sum of theobserved electrons and photons should also increase lin-early with energy, a hypothesis which is tested and con-firmed by the tritium spectrum comparison of Fig. 5.As shown in Fig. 9, we find that at very low energy,
below 3 keV, the number of electrons and photons is similar
to Nion and Nex, respectively, while above 4 keV thenumber of electrons drops below the number of photons,consistent with a large recombination effect at theseenergies and this electric field. The recombination fraction,calculated according to
r ¼ ðnγ=neÞ − α
ðnγ=neÞ þ 1; ð3Þ
is shown explicitly in Fig. 10, measured with both the 180and 105 V=cm tritium data. We find only a small differencein the recombination between these two field values in thisenergy range. It is worth noting that recombination is smallat the very lowest energies where the dark matter search is
FIG. 8. Light yield measurement from LUX tritium datacompared with results from other authors. Left vertical scale:Light yield relative to that of the 32.1 keV decay of 83mKr at zerofield. Right vertical scale: Absolute light yield measurements.Blue squares represent tritium at 105 V=cm, and black squaresare tritium at 180 V=cm. The shaded bands are the systematicerrors on the tritium data. Magenta squares represent zero fieldmeasurements from [24], and green triangles and red starsrepresent zero field and 450 V=cm, respectively, from [5]. Allnontritium data are from Compton scatters.
FIG. 9. Top: The mean number of electrons (red) and scintil-lation photons (blue) produced in LUX at 180 V=cm as afunction of energy. The bands indicate the correlated systematicerrors on g1 and g2. Also shown are the total number of quanta,primary ions, and primary excitons, assuming an exciton-to-ionratio of α ¼ 0.2.
FIG. 10. Recombination fraction of ER events in LXe at 180(black) and 105V=cm (blue), assuming an exciton-to-ion ratio of 0.2.
D. S. AKERIB et al. PHYSICAL REVIEW D 93, 072009 (2016)
072009-6
performed, rapidly approaching zero as the energy dropsbelow 4 keV. As noted before, this behavior is of consid-erable importance for the efficiency of recoil discriminationin LXe [30]. Other authors have used α values between 0.06and 0.2 (see Ref. [31] and references therein). Changing thevalue of α modestly affects the absolute magnitude of theresulting recombination fraction but has only a small effecton the shape as a function of energy.
D. LUX electron recoil band
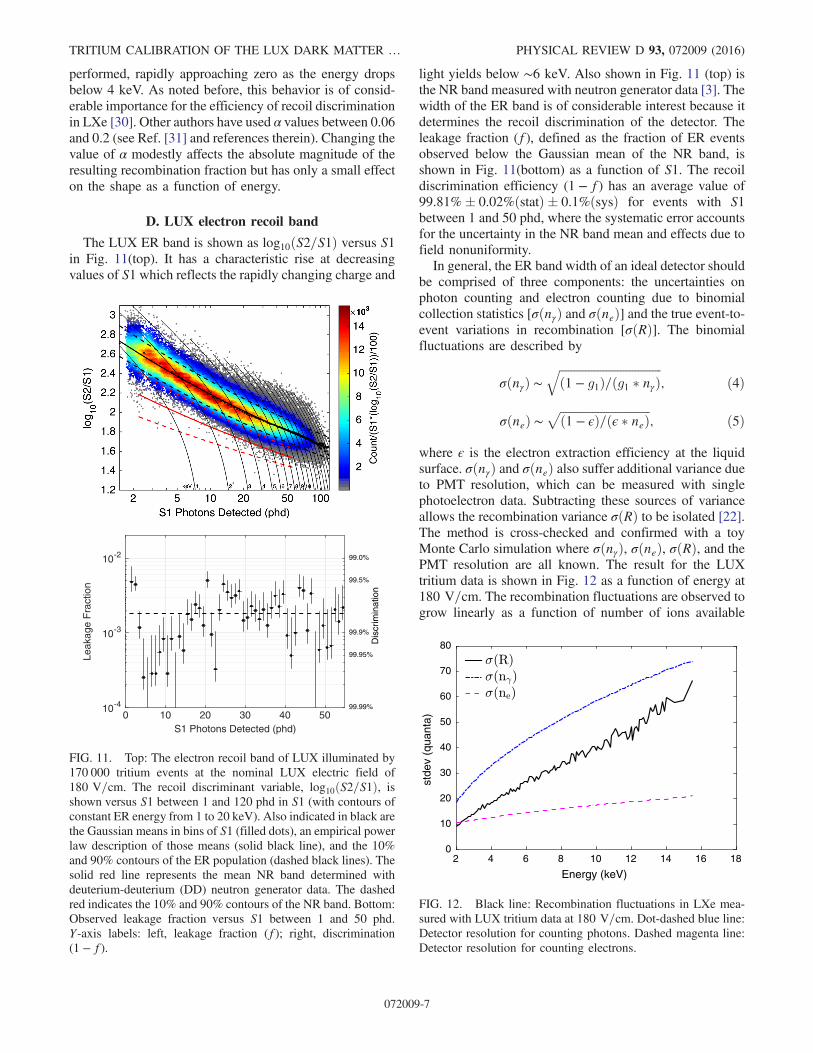
The LUX ER band is shown as log10ðS2=S1Þ versus S1in Fig. 11(top). It has a characteristic rise at decreasingvalues of S1 which reflects the rapidly changing charge and
light yields below ∼6 keV. Also shown in Fig. 11 (top) isthe NR band measured with neutron generator data [3]. Thewidth of the ER band is of considerable interest because itdetermines the recoil discrimination of the detector. Theleakage fraction (f), defined as the fraction of ER eventsobserved below the Gaussian mean of the NR band, isshown in Fig. 11(bottom) as a function of S1. The recoildiscrimination efficiency (1 − f) has an average value of99.81%� 0.02%ðstatÞ � 0.1%ðsysÞ for events with S1between 1 and 50 phd, where the systematic error accountsfor the uncertainty in the NR band mean and effects due tofield nonuniformity.In general, the ER band width of an ideal detector should
be comprised of three components: the uncertainties onphoton counting and electron counting due to binomialcollection statistics [σðnγÞ and σðneÞ] and the true event-to-event variations in recombination [σðRÞ]. The binomialfluctuations are described by
σðnγÞ ∼ffiffiffiffiffiffiffiffiffiffiffiffiffiffiffiffiffiffiffiffiffiffiffiffiffiffiffiffiffiffiffiffiffiffiffið1 − g1Þ=ðg1 � nγÞ
q; ð4Þ
σðneÞ ∼ffiffiffiffiffiffiffiffiffiffiffiffiffiffiffiffiffiffiffiffiffiffiffiffiffiffiffiffiffiffiffið1 − ϵÞ=ðϵ � neÞ
p; ð5Þ
where ϵ is the electron extraction efficiency at the liquidsurface. σðnγÞ and σðneÞ also suffer additional variance dueto PMT resolution, which can be measured with singlephotoelectron data. Subtracting these sources of varianceallows the recombination variance σðRÞ to be isolated [22].The method is cross-checked and confirmed with a toyMonte Carlo simulation where σðnγÞ, σðneÞ, σðRÞ, and thePMT resolution are all known. The result for the LUXtritium data is shown in Fig. 12 as a function of energy at180 V=cm. The recombination fluctuations are observed togrow linearly as a function of number of ions available
Energy (keV) 2 4 6 8 10 12 14 16 18
stde
v (q
uant
a)
0
10
20
30
40
50
60
70
80
FIG. 12. Black line: Recombination fluctuations in LXe mea-sured with LUX tritium data at 180 V=cm. Dot-dashed blue line:Detector resolution for counting photons. Dashed magenta line:Detector resolution for counting electrons.
S1 Photons Detected (phd)0 10 20 30 40 50
Leak
age
Fra
ctio
n
10-4
10-3
10-2
Dis
crim
inat
ion
99.99%
99.95%
99.9%
99.5%
99.0%
FIG. 11. Top: The electron recoil band of LUX illuminated by170 000 tritium events at the nominal LUX electric field of180 V=cm. The recoil discriminant variable, log10ðS2=S1Þ, isshown versus S1 between 1 and 120 phd in S1 (with contours ofconstant ER energy from 1 to 20 keV). Also indicated in black arethe Gaussian means in bins of S1 (filled dots), an empirical powerlaw description of those means (solid black line), and the 10%and 90% contours of the ER population (dashed black lines). Thesolid red line represents the mean NR band determined withdeuterium-deuterium (DD) neutron generator data. The dashedred indicates the 10% and 90% contours of the NR band. Bottom:Observed leakage fraction versus S1 between 1 and 50 phd.Y-axis labels: left, leakage fraction (f); right, discrimination(1 − f).
TRITIUM CALIBRATION OF THE LUX DARK MATTER … PHYSICAL REVIEW D 93, 072009 (2016)
072009-7

for recombination. For energies between 2 and 16 keV thesize of recombination fluctuations can be describedby σðRÞ ¼ ð0.067� 0.005Þ × Nion.We find that at 180 V=cm in LUX, σðnγÞ is the most
important contributor to the ER band width over the entiretritium energy spectrum due to the relatively modest lightcollection (g1 ¼ 0.115). Between 2 and 6 keV, where theWIMP search is most sensitive, σðneÞ and σðRÞ are ofcomparable magnitude and secondary importance. We notethat an ideal detector,with perfect light and charge collection,would have an ER band width determined solely by σðRÞ.The statistical description of the width of the LUX ER
band is relevant to the WIMP-search profile likelihood fit.To study the band width in more detail, in Fig. 13 wehistogram log10ðS2=S1Þ in 16 bins of S1 from 1 to 49 phdwith a bin width of 3 phd. In each bin, we show a Gaussianfit to the data after subtracting the centroid and dividing bythe Gaussian width. We find that the Gaussian fits describethe data well in most S1 bins out to 2σ on the upper side and3σ on the lower side, beyond which non-Gaussian tails arevisible. We have investigated the origin of these tails. Onthe lower side, which is most directly relevant to the WIMPsearch, the largest non-Gaussian tail is found in the lowestS1 bin (1–3 phd). This tail is reproduced in simulation andoriginates from Poissonian fluctuations in the photoncounting statistics. The origin of the non-Gaussian tailson the upper side is less clear. It is worth noting that asimilar effect has been seen in a previous experiment [32].Several outlier events are also evident in Fig. 13,
particularly at low values of log10ðS2=S1Þ. Although theseevents are rare in this data set, their origin is of considerableinterest for understanding the WIMP sensitivity of future
LXe experiments. Therefore, we have investigated whetherthese events are attributable to detector pathologies, tobackgrounds, or to the fundamental recombination physicsof the LXe. In this data set we expect to find about 0.5 low(S2=S1) events due to background ion recoil from 210Pbdecay on the interior TPC walls. These events can have animproperly reconstructed radial position that allows them topass our fiducial cuts. The 210Pb model is based upon astudy of the WIMP search data and is described inRefs. [3,33]. Another possible background is from acci-dental coincidences between two distinct tritium events. Inthis scenario, an S1 from a tritium event below the cathode,and thus not having an S2, is improperly paired with a lowenergy tritium S2 in the fiducial volume for which the S1signal fell below threshold. The S1 only rate during thetritium calibration is found by multiplying the total rate inthe fiducial volume with the ratio of volume between thebottom PMT array and the cathode to the fiducial volume.The S2 only rate is given by the total rate in the fiducialvolume multiplied by the fraction of CH3T events whichfall below the S1 threshold of the detector. An expectationof 2.5 accidental coincidence events in the tritium data isfound by multiplying the S1 only rate with the S2 only rateand integrating over the calibration live time and is found tobe 2.5 events. The tritium data set used here contain 27.5live hours of data, during which time we expect to have 15nontritium events from the LUX ER background ratebetween 1 and 18 keV. These events should occur nearthe mean of the tritium ER band and should not beobservable in this data set. The total background expect-ation for low (S2=S1) events is therefore ∼3, and in Fig. 13we find three highly isolated low (S2=S1) events located in
Cou
nt
100
101
1021-4 phd 4-7 phd 7-10 phd 10-13 phd
Cou
nt
100
101
10213-16 phd 16-19 phd 19-22 phd 22-25 phd
Cou
nt
100
101
10225-28 phd 28-31 phd 31-34 phd 34-37 phd
(log10
(S2/S1) - Center )/σER
-8 -6 -4 -2 0 2 4 6 8
Cou
nt
100
101
10237-40 phd
(log10
(S2/S1) - Center )/σER
-8 -6 -4 -2 0 2 4 6 8
40-43 phd
(log10
(S2/S1) - Center )/σER
-8 -6 -4 -2 0 2 4 6 8
43-46 phd
(log10
(S2/S1) - Center )/σER
-8 -6 -4 -2 0 2 4 6 8
46-49 phd
FIG. 13. Electron recoil population from tritium events in 3 phd bins over the WIMP region of interest (1–49 phd). We fit each bin to aGaussian and subtract the centroid of the Gaussian. The x axis is measured in units of the fitted Gaussian width. The red dashed linerepresents the mean of the NR band in each bin.
D. S. AKERIB et al. PHYSICAL REVIEW D 93, 072009 (2016)
072009-8
the 16–18, 25–28, and 37–40 phd bins. We conclude thatthe number of low (S2=S1) outlier events is consistentwith the background expectation.
IV. SUMMARY
We have characterized the electron recoil response of theLUX dark matter experiment with a tritium calibrationsource. The large data set, high event purity, and the single-site nature of the decay provide a powerful tool to study thedetector and to investigate the fundamental properties ofLXe as a particle detection medium for WIMP searches.We find strong evidence in support of the combined
energy model for ER events in theWIMP energy range, andwe report new measurements of the light and charge yields,the average recombination, and the fluctuations in therecombination as a function of energy. We have determinedthat the width of the ER band in LUX is driven byfluctuations in the number of detected S1 photons. Wefind a small number of outlier events far below the ER bandcentroid out of 170 000 fiducial tritium decays, consistentwith background expectations in this data set.The results presented here are used in an improved
analysis of the run 3 WIMP search data to determine thelocation and width of the LUX ER band and to measure thefiducial volume [3]. Additional tritium data have also beencollected in support of the ongoing LUX run 4 WIMPsearch and are presently under analysis. Furthermore, plansare being made to utilize a tritium source in the future LZexperiment [34], where external gamma sources such as137Cs will produce a negligible rate of single-scatter eventsin the fiducial region.
ACKNOWLEDGMENTS
This work was partially supported by the U.S.Department of Energy (DOE) under AwardsNo. DE-FG02-08ER41549, No. DE-FG02-91ER40688,No. DE-FG02-95ER40917, No. DE-FG02-91ER40674,No. DE-NA0000979, No. DE-FG02-11ER41738, No. DE-SC0006605, No. DE-AC02-05CH11231, No. DE-AC52-07NA27344, and No. DE-FG01-91ER40618; the U.S.National Science Foundation under Grants No. PHYS-0750671, No. PHY-0801536, No. PHY-1004661,No. PHY-1102470, No. PHY-1003660, No. PHY-1312561, No. PHY-1347449, and No. PHY-1505868;the Research Corporation Grant No. RA0350; the Centerfor Ultra-low Background Experiments in the Dakotas(CUBED); and the South Dakota School of Mines andTechnology (SDSMT). LIP-Coimbra acknowledges fundingfrom Fundaçáo para a Ciência e a Tecnologia (FCT) throughProject-Grant No. PTDC/FIS-NUC/1525/2014. ImperialCollege and Brown University thank the United KingdomRoyal Society for travel funds under the InternationalExchange Scheme (IE120804). The United Kingdom groupsacknowledge institutional support from Imperial College
London, University College London and EdinburghUniversity, and from the Science and Technology FacilitiesCouncil for PhD studentship ST/K502042/1 (A. B.). TheUniversity of Edinburgh is a charitable body, registered inScotland, with registration number SC005336. This researchwas conducted using computational resources and services atthe Center for Computation and Visualization, BrownUniversity. We gratefully acknowledge the logistical andtechnical support and the access to laboratory infrastructureprovided to us by the SURF and its personnel at Lead,South Dakota. SURF was developed by the South DakotaScience and Technology Authority, with an important phil-anthropicdonation fromT.DennySanford, and is operated byLawrence Berkeley National Laboratory for the Departmentof Energy, Office of High Energy Physics.
APPENDIX A: STUDIES OF THE REMOVALOF CH3T FROM LXE
Prior to the first injection of CH3T into LUX, weconsidered three risks that such a calibration may poseto the dark matter search: (i) that the xenon purificationsystem may be ineffective for CH3T removal; (ii) that theinterior surfaces of the stainless steel (SS) gas handlingsystem may become permanently contaminated withCH3T; and (iii) that the plastic detector components mayoutgas unacceptable quantities of CH3T after initialexposure.To address the first concern we studied the removal of
natural methane (CH4) from Xe gas with a heated Zr getterand a mass spectrometer. The purification efficiency wasfound to be satisfactory [12]. Furthermore, a test of thecompleted LUX purification system, including the actualgetter unit, was performed several weeks before the firstCH3T injection into LUX. In this test ∼0.1 g of CH4 wasinjected into LUX, and mass spectrometry measurementsof the CH4 concentration in the LUX Xe gas wereperformed over the next several days. The CH4 concen-tration was observed to decrease exponentially with a timeconstant of 5.90� 0.07 h as shown in Fig. 14, confirmingthe effectiveness of the purification system for methaneremoval.The behavior of CH3T in SS plumbing was studied in a
bench test with a custom-built Xe gas proportional tubeoperated at room temperature. Substantial quantities ofCH3T activity were injected, counted, and removed fromthe proportional tube. Initial tests found a small amount ofresidual activity after purification; however, this wasresolved by passing the CH3T through a methane purifier(SAES model MC1-905F). No subsequent contaminationwas observed.We also performed tests of CH3T injection and removal
from LXe with a small detector. One such experiment isshown in Fig. 15, where 68 000 Hz of CH3T was injected,counted, and subsequently removed from LXe. Samples ofLUX polyethylene and teflon were immersed in the LXe in
TRITIUM CALIBRATION OF THE LUX DARK MATTER … PHYSICAL REVIEW D 93, 072009 (2016)
072009-9

this experiment, and their outgassing is evident in Fig. 15.These data placed constraints on the risk of CH3T outgas-sing in LUX. In total over 106 Hz of CH3T activity wasinjected and successfully removed in these experiments.
As a final measure of risk mitigation, the CH3T injectioninto LUXwas performed at the end of run 3 after theWIMPsearch data had been collected.
APPENDIX B: MODEL OF CH3T REMOVAL
We use a simple purification model to predict the CH3Tactivity in LUX after an injection. The model is
dCdt
¼ AVJout −
Cτ; ðB1Þ
where C is the CH3T concentration in the LXe, Jout is theflux of CH3T out of the plastic components due to out-gassing, A is the surface area of the plastic TPC cylinder, Vis the total volume of xenon in the active region, and τ is thecharacteristic removal time of CH3T due to purification(5.9 h). The model assumes perfect mixing of the fluid inthe TPC, similar to what has been observed in LUX. Theinitial concentration is the injection activity divided by thevolume of the active region. We solve the model numeri-cally with the Euler method while simultaneously solvingthe diffusion equation to determine Jout. The results predictthe number of calibration events that may be collected andprovide an estimate of when the CH3T decay rate will besmall enough to allow the WIMP search to resume.We approximate the diffusion into and out of the plastics
as one-dimensional, since most plastics in LUX can beapproximated as a thin cylindrical shell with no dependenceon the azimuthal or z coordinates. Fick’s laws in onedimension are
J ¼ −Ddϕðr; tÞ
dr; ðB2Þ
dϕdt
¼ Dd2ϕðr; tÞ
dr2; ðB3Þ
where J is the flux, ϕðr; tÞ is the CH3T concentration in theplastic at depth r and time t, andD is the diffusion constantin the plastic. The concentration at the LXe-plastic boun-dary is fixed at KC, where K is the unitless solubility ofCH3T in the plastics. These equations are solved numeri-cally and simultaneously with the purification model.D andK are not independently known for CH3T in teflon
or polyethylene at LXe temperature. However, only thecombined quantity G≡ K
ffiffiffiffiffiffiffiffiffiD=π
pis relevant as long as the
diffusing substance does not reach the center of the plasticcomponent (a good assumption for diffusion of CH3T atLXe temperature). Under this condition, there exists ananalytic solution to Fick’s first law, which we evaluate atthe LXe boundary:
JoutðtÞ ¼ −G�Zt
0
ddt0 Cðt0Þffiffiffiffiffiffiffiffiffiffit − t0
p dt0 þ Cð0Þffiffit
p�; ðB4Þ
Time (days) 0 0.5 1 1.5 2 2.5 3
Con
cent
ratio
n pp
b (g
/g)
10-3
10-2
10-1
100
101
102
103
Det. ReturnGetter Out
G=0.0016 cm/day1/2
= 5.9 ± 0.07 hoursτ
FIG. 14. Injection and removal of CH4 in LUX prior to the firstCH3T injection. CH4 is observed with a gas sampling massspectrometry system. The black dashed lines shows an expo-nential fit to the CH4 concentration at the detector return line witha time constant of 5.90� 0.07 h. The red points indicatemeasurements at the getter outlet. We find a 97% one-passremoval efficiency at a flow rate of 27 slpm. The blue curveshows the upper limit on the effect of outgassing from theplastics. The three data points near t ¼ 3 days are consistent withthe limit of detection for methane [∼5 × 10⁻³ ppb (g=g)].
0 0.5 1 1.5 2 2.5 3 3.510
0
101
102
103
104
105
106
Time (Days)
Rat
e (H
z)
FIG. 15. The event rate versus time following a large CH3Tinjection into a benchtop liquid xenon detector. Black points: Theevent rate measured with a dead-time limited digital dataacquisition (DAQ) system. Gray points: True event rate measuredwith a fast analog scalar. In this experiment a maximum activityof 68 000 Hz was detected immediately after the injection,compared to a background count rate of 5 Hz. Initially thepurifier is not included in the recirculation circuit, leading to aconstant count rate. The count rate falls rapidly when the purifieris activated. At 0.5 days an elbow in the count rate is observed,indicating that outgassing of CH3T from the detector plastics hasbecome a limiting factor in the purification rate.
D. S. AKERIB et al. PHYSICAL REVIEW D 93, 072009 (2016)
072009-10
where the sign is reversed because the flux of material isoutward. This result can be derived by applying Duhamel’sprinciple along the infinite half line, and it shows that theoutgassing flux is linear in G. We set an upper limit ofG < 0.0016 cmffiffiffiffiffi
dayp for LUX based upon the data in Fig. 14.
In that data the effect of G would appear as an elbow in theCH4 concentration versus time, as indicated by the blueline. The three data points near t ¼ 3 days constrain themaximum value of G. We interpret this result as an upperlimit because those data points are consistent with CH4
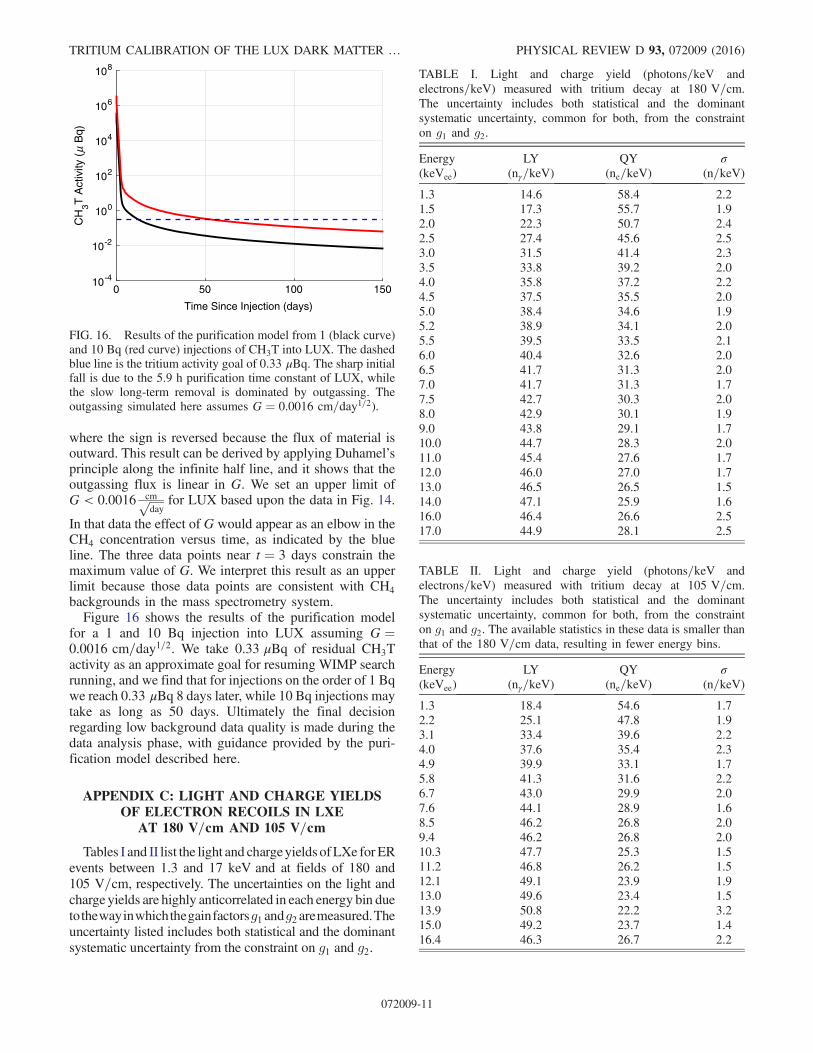
backgrounds in the mass spectrometry system.Figure 16 shows the results of the purification model
for a 1 and 10 Bq injection into LUX assuming G ¼0.0016 cm=day1=2. We take 0.33 μBq of residual CH3Tactivity as an approximate goal for resuming WIMP searchrunning, and we find that for injections on the order of 1 Bqwe reach 0.33 μBq 8 days later, while 10 Bq injections maytake as long as 50 days. Ultimately the final decisionregarding low background data quality is made during thedata analysis phase, with guidance provided by the puri-fication model described here.
APPENDIX C: LIGHT AND CHARGE YIELDSOF ELECTRON RECOILS IN LXE
AT 180 V=cm AND 105 V=cm
Tables I and II list the light and chargeyields ofLXe for ERevents between 1.3 and 17 keV and at fields of 180 and105 V=cm, respectively. The uncertainties on the light andcharge yields are highly anticorrelated in each energy bin duetothewayinwhichthegainfactorsg1 andg2 aremeasured.Theuncertainty listed includes both statistical and the dominantsystematic uncertainty from the constraint on g1 and g2.
Time Since Injection (days)
0 50 100 150
CH
3T A
ctiv
ity (
μ B
q)
10-4
10-2
100
102
104
106
108
FIG. 16. Results of the purification model from 1 (black curve)and 10 Bq (red curve) injections of CH3T into LUX. The dashedblue line is the tritium activity goal of 0.33 μBq. The sharp initialfall is due to the 5.9 h purification time constant of LUX, whilethe slow long-term removal is dominated by outgassing. Theoutgassing simulated here assumes G ¼ 0.0016 cm=day1=2).
TABLE I. Light and charge yield (photons=keV andelectrons=keV) measured with tritium decay at 180 V=cm.The uncertainty includes both statistical and the dominantsystematic uncertainty, common for both, from the constrainton g1 and g2.
Energy LY QY σ(keVee) (nγ=keV) (ne=keV) (n=keV)
1.3 14.6 58.4 2.21.5 17.3 55.7 1.92.0 22.3 50.7 2.42.5 27.4 45.6 2.53.0 31.5 41.4 2.33.5 33.8 39.2 2.04.0 35.8 37.2 2.24.5 37.5 35.5 2.05.0 38.4 34.6 1.95.2 38.9 34.1 2.05.5 39.5 33.5 2.16.0 40.4 32.6 2.06.5 41.7 31.3 2.07.0 41.7 31.3 1.77.5 42.7 30.3 2.08.0 42.9 30.1 1.99.0 43.8 29.1 1.710.0 44.7 28.3 2.011.0 45.4 27.6 1.712.0 46.0 27.0 1.713.0 46.5 26.5 1.514.0 47.1 25.9 1.616.0 46.4 26.6 2.517.0 44.9 28.1 2.5
TABLE II. Light and charge yield (photons=keV andelectrons=keV) measured with tritium decay at 105 V=cm.The uncertainty includes both statistical and the dominantsystematic uncertainty, common for both, from the constrainton g1 and g2. The available statistics in these data is smaller thanthat of the 180 V=cm data, resulting in fewer energy bins.
Energy LY QY σ(keVee) (nγ=keV) (ne=keV) (n=keV)
1.3 18.4 54.6 1.72.2 25.1 47.8 1.93.1 33.4 39.6 2.24.0 37.6 35.4 2.34.9 39.9 33.1 1.75.8 41.3 31.6 2.26.7 43.0 29.9 2.07.6 44.1 28.9 1.68.5 46.2 26.8 2.09.4 46.2 26.8 2.010.3 47.7 25.3 1.511.2 46.8 26.2 1.512.1 49.1 23.9 1.913.0 49.6 23.4 1.513.9 50.8 22.2 3.215.0 49.2 23.7 1.416.4 46.3 26.7 2.2
TRITIUM CALIBRATION OF THE LUX DARK MATTER … PHYSICAL REVIEW D 93, 072009 (2016)
072009-11

[1] D. S. Akerib et al., Nucl. Instrum. Methods Phys. Res., Sect.A 704, 111 (2013).
[2] D. S. Akerib et al., Phys. Rev. Lett. 112, 091303 (2014).[3] D. S. Akerib et al. (LUX Collaboration), arXiv:1512.03506.[4] L. W. Kastens, S. B. Cahn, A. Manzur, and D. N. McKinsey,
Phys. Rev. C 80, 045809 (2009).[5] L. Baudis, H. Dujmovic, C. Geis, A. James, A. Kish, A.
Manalaysay, T. Marrodán Undagoitia, and M. Schumann,Phys. Rev. D 87, 115015 (2013).
[6] ER events and NR events generally have different energyscales in LXe. In this paper we interpret all events using theER energy scale.
[7] S. Nagy, T. Fritioff, M. Björkhage, I. Bergström, and R.Schuch, Europhys. Lett. 74, 404 (2006).
[8] D. P. Gregory and D. A. Landsman, Phys. Rev. 109, 2091(1958).
[9] P. Venkataramaiah, K. Gopala, A. Basavaraju, S. S.Suryanarayana, and H. Sanjeeviah, J. Phys. G 11, 359(1985).
[10] G. Drexlin, V. Hannen, S. Mertens, and C. Weinheimer,Adv. High Energy Phys. 2013, 293986 (2013).
[11] M. Szydagis, A. Fyhrie, D. Thorngren, and M. Tripathi,J. Instrum. 8, C10003 (2013).
[12] A. Dobi, D. S. Leonard, C. Hall, L. J. Kaufman, T.Langford, S. Slutsky, and Y.-R. Yen, Nucl. Instrum.Methods Phys. Res., Sect. A 620, 594 (2010).
[13] H. Miyake et al., J. Vac. Sci. Technol. A 1, 1447 (1983).[14] Moravek Biochemical, Brea, California 92821, USA.[15] SAES Pure Gas, San Luis Obispo, California 93401, USA.[16] D. S. Akerib et al. (to be published).[17] C. Faham, V. Gehman, A. Currie, A. Dobi, P. Sorensen, and
R. Gaitskell, J. Instrum. 10, P09010 (2015).
[18] R. L. Platzman, Int. J. Appl. Radiat. Isot. 10, 116 (1961).[19] C. E. Dahl, Ph.D. thesis, Princeton University, 2009.[20] E. Gushchin, A. Kruqlov, V. Litskevich, A. Lebedev, I.
Obodovskii, and S. Somov, Sov. Phys. JETP 49, 856 (1979).[21] E. Gushchin, A. Kruqlov, and I. Obodovskii, Sov. Phys.
JETP 55, 860 (1982).[22] A. Dobi, Ph.D. thesis, University of Maryland, 2014.[23] We have verified with an internal 83mKr calibration source
that the light yield of LXe is unaffected by the presence ofCH4 at concentrations up to ∼1 part per million. For theCH3T measurements reported here the concentration was<10 × 10−12 g=g.
[24] E. Aprile et al., Phys. Rev. D 86, 112004 (2012).[25] E. Conti et al., Phys. Rev. B 68, 054201 (2003).[26] P. Sorensen and C. E. Dahl, Phys. Rev. D 83, 063501
(2011).[27] M. Szydagis, N. Barry, K. Kazkaz, J. Mock, D. Stolp, M.
Sweany, M. Tripathi, S. Uvarov, N. Walsh, and M. Woods,J. Instrum. 6, P10002 (2011).
[28] T. Doke, A. Hitachi, J. Kikuchi, K. Masuda, H. Okada, andE. Shibamura, Jpn. J. Appl. Phys. 41, 1538 (2002).
[29] E. Aprile, K. L. Giboni, P. Majewski, K. Ni, and M.Yamashita, Phys. Rev. B 76, 014115 (2007).
[30] T. Shutt, C. E. Dahl, J. Kwong, A. Bolozdynya, and P.Brusov, Nucl. Instrum. Methods Phys. Res., Sect. A 579,451 (2007).
[31] Q. Lin, J. Fei, F. Gao, J. Hu, Y. Wei, X. Xiao, H. Wang, andK. Ni, Phys. Rev. D 92, 032005 (2015).
[32] V. N. Lebedenko et al., Phys. Rev. D 80, 052010 (2009).[33] C. Lee, Ph.D. thesis, Case Western Reserve University,
2015.[34] D. S. Akerib et al. (LZ Collaboration), arXiv:1509.02910.
D. S. AKERIB et al. PHYSICAL REVIEW D 93, 072009 (2016)
072009-12


![Edinburgh Research Explorer · contact openaccess@ed.ac.uk ... investigate your claim. Download date: 21 ... This remark was used by Lord Atkin in Donoghue v. Stevenson [1932] A.C](https://img.pdfslide.us/doc/110x75/5b65f3317f8b9a1f738c5717/edinburgh-research-contact-openaccessedacuk-investigate-your-claim-download.jpg)


![Edinburgh Research Explorer · contact openaccess@ed.ac.uk providing details, ... 1994; Bickert and Mackensen, 2003]. In order to investigate the evolution of local and regional d18O](https://img.pdfslide.us/doc/110x75/5ae512557f8b9a87048c1a71/edinburgh-research-explorer-openaccessedacuk-providing-details-1994-bickert.jpg)