Embed Size (px)
Citation preview
Edible Horticulture Skills 2020
Sub-Sector Report: Soft Fruit
A report for the Agriculture and Horticulture Development Board
June 2020
PYE TAIT CONSULTING
Soft Fruit sub-sector report
AHDB
June 2020 Page 2 ISO9001:2015/issue02
Cert No: QEC19593371/0/Q
A report prepared by:
Pye Tait Consulting
Registered in England, Company No: 04001365, VAT No: 755 8312 14
Registered office: Royal House, 110 Station Parade, Harrogate, North Yorkshire, HG1 1EP
Tel: 01423 509433
Email (enquiries related to this report): [email protected]
Email (general enquiries): [email protected]
Website: www.pyetait.com
Soft Fruit sub-sector report
AHDB
June 2020 Page 3 ISO9001:2015/issue02
Contents
1. Introduction ............................................................................................................................. 5
1.1 Response profile ........................................................................................................................... 6
2. Workforce ................................................................................................................................ 8
2.1 Workforce overview...................................................................................................................... 8
2.2 Workforce residency, ethnicity, gender, age ................................................................................ 9
2.3 Workforce projections ................................................................................................................ 11
3. Labour and skills challenge ..................................................................................................... 12
3.1 Vacancies .................................................................................................................................... 12
3.2 Reasons for skills gaps ................................................................................................................. 12
3.3 Skills scoring ................................................................................................................................ 13
4. Workforce training, education, and staff development ............................................................ 16
4.1 Training ....................................................................................................................................... 16
4.2 Apprentices ................................................................................................................................. 18
4.3 Apprenticeship levy..................................................................................................................... 19
4.4 T Levels ........................................................................................................................................ 20
4.5 Qualification requirements ......................................................................................................... 20
5. Future drivers of change ......................................................................................................... 22
6. Summary ............................................................................................................................... 23
Soft Fruit sub-sector report
AHDB
June 2020 Page 4 ISO9001:2015/issue02
List of figures and tables
Figure 1: Business size (large defined as 250+ employees) .................................................................... 6
Figure 2: Affiliation to accreditation schemes ........................................................................................ 7
Figure 3: Working modes ........................................................................................................................ 8
Figure 4: Proportion of Permanent and Seasonal staff .......................................................................... 9
Figure 5: Workforce age profile – Permanent Staff .............................................................................. 10
Figure 6: Workforce age profile – Seasonal staff .................................................................................. 10
Figure 7: Anticipated change in demand for roles ................................................................................ 11
Figure 8: Reasons for skills gaps ............................................................................................................ 13
Figure 9: Current skill level, and predicted future importance (occupations) ..................................... 14
Figure 10: Current skill level, and predicted future importance (seasonal/agency workers) .............. 15
Figure 11: Types of training undertaken (permanent staff) ................................................................. 16
Figure 12: Types of training undertaken (seasonal staff) ..................................................................... 17
Figure 13: Reasons for not using external training ............................................................................... 18
Figure 14: Barriers to recruiting apprentices ........................................................................................ 19
Figure 15: Need for degree level qualification by occupational area ................................................... 20
Figure 16: Drivers of change ................................................................................................................. 22
Table 1: Apprenticeship starts per year ................................................................................................ 19
Soft Fruit sub-sector report
AHDB
June 2020 Page 5 ISO9001:2015/issue02
1. Introduction
The research presented in this dedicated sub-sector report is based on the responses of soft fruit
businesses during the course of the Edible Horticulture Skills Survey 2020.
The skills survey was based on the following research objectives and this sub-sector-report has been
so structured:
1. Estimate current and anticipated future UK workforce numbers in the UK Edible Horticulture sector, including additional and replacement demand
2. Understand the drivers of change affecting Edible Horticulture (including opportunities and constraints to growth) and how these are influencing employers’ skills needs
3. Establish the profile of the Edible Horticulture workforce, including demographic information, ethnicity, qualifications attainment and working patterns
4. Quantify the prevalence of skills shortage and recruitment difficulties at all levels (including hard-to-fill vacancies) and reasons why these are being experienced
5. Quantify current skill levels and the future importance of those skills (using a skills-scoring approach), to determine future critical skills gaps and priority training needs
6. Identify the organisations that employers are using to provide training and highlight any gaps in training provision that can be identified by employers
7. Explore attitude, approaches and barriers to training.
Soft Fruit sub-sector report
AHDB
June 2020 Page 6 ISO9001:2015/issue02
1.1 Response profile
Of the 556 businesses completing the main edible horticulture skills survey, 106 companies work
primarily in the Soft Fruit sector (growing strawberries, raspberries, blackcurrant, blackberries and
all other Rubus and Ribes species and rhubarb). Of these, 23 firms (22%) undertake packhouse
activities as a secondary activity. These 106 companies employ a total of 20,625 staff; this equates to
an average of 195 staff per business. However, removing one much larger company of 4,000
employees equates to an average of 158 employees in the other 105 companies.
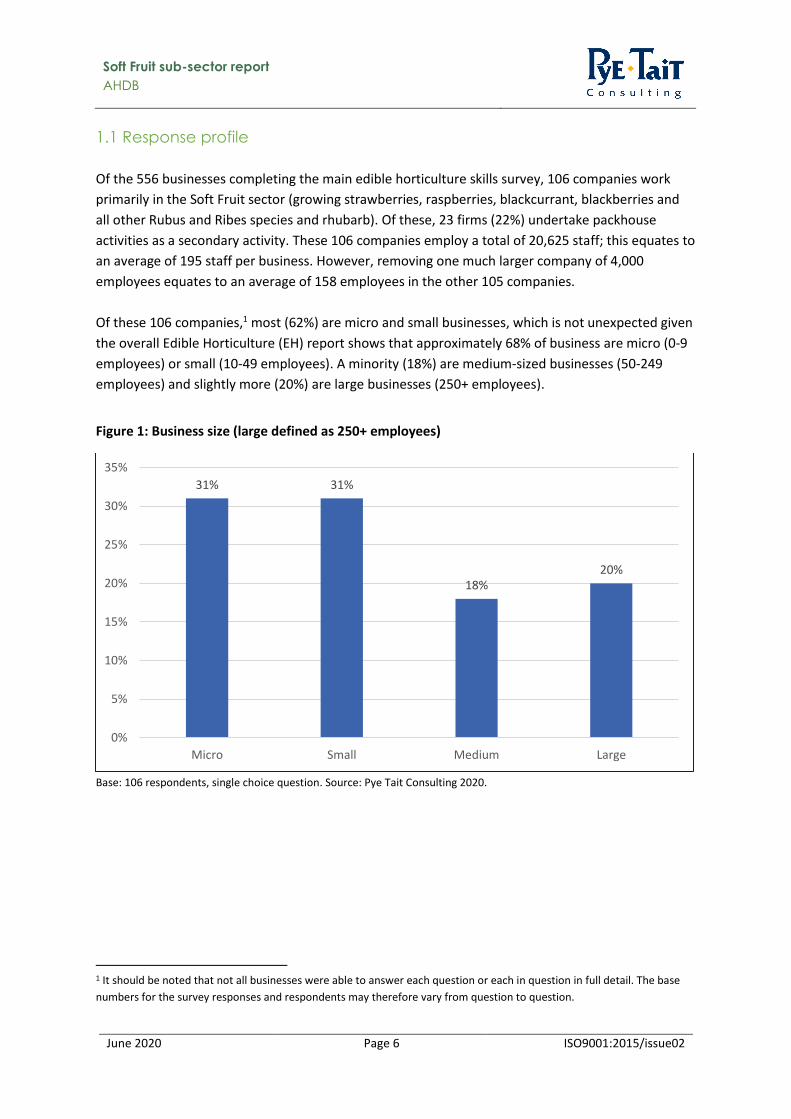
Of these 106 companies,1 most (62%) are micro and small businesses, which is not unexpected given
the overall Edible Horticulture (EH) report shows that approximately 68% of business are micro (0-9
employees) or small (10-49 employees). A minority (18%) are medium-sized businesses (50-249
employees) and slightly more (20%) are large businesses (250+ employees).
Figure 1: Business size (large defined as 250+ employees)
Base: 106 respondents, single choice question. Source: Pye Tait Consulting 2020.
1 It should be noted that not all businesses were able to answer each question or each in question in full detail. The base
numbers for the survey responses and respondents may therefore vary from question to question.
31% 31%
18%20%
0%
5%
10%
15%
20%
25%
30%
35%
Micro Small Medium Large
Soft Fruit sub-sector report
AHDB
June 2020 Page 7 ISO9001:2015/issue02
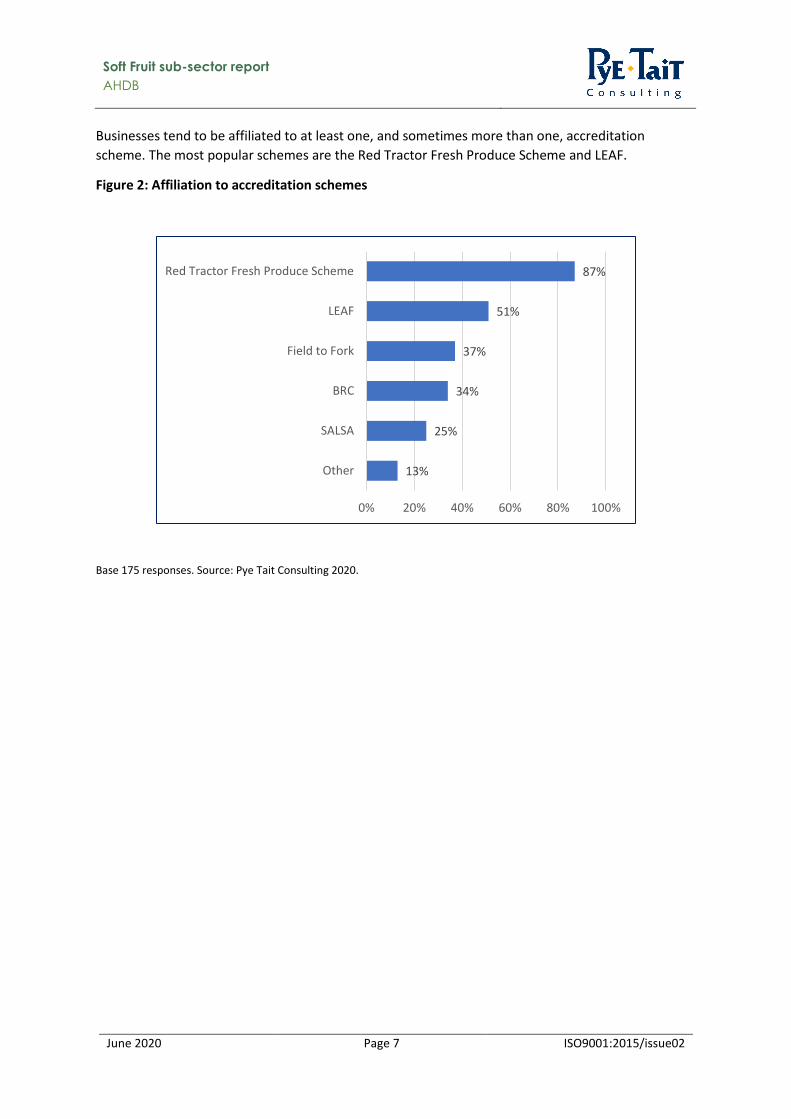
Businesses tend to be affiliated to at least one, and sometimes more than one, accreditation
scheme. The most popular schemes are the Red Tractor Fresh Produce Scheme and LEAF.
Figure 2: Affiliation to accreditation schemes
Base 175 responses. Source: Pye Tait Consulting 2020.
13%
25%
34%
37%
51%
87%
0% 20% 40% 60% 80% 100%
Other
SALSA
BRC
Field to Fork
LEAF
Red Tractor Fresh Produce Scheme
Soft Fruit sub-sector report
AHDB
June 2020 Page 8 ISO9001:2015/issue02
2. Workforce
2.1 Workforce overview
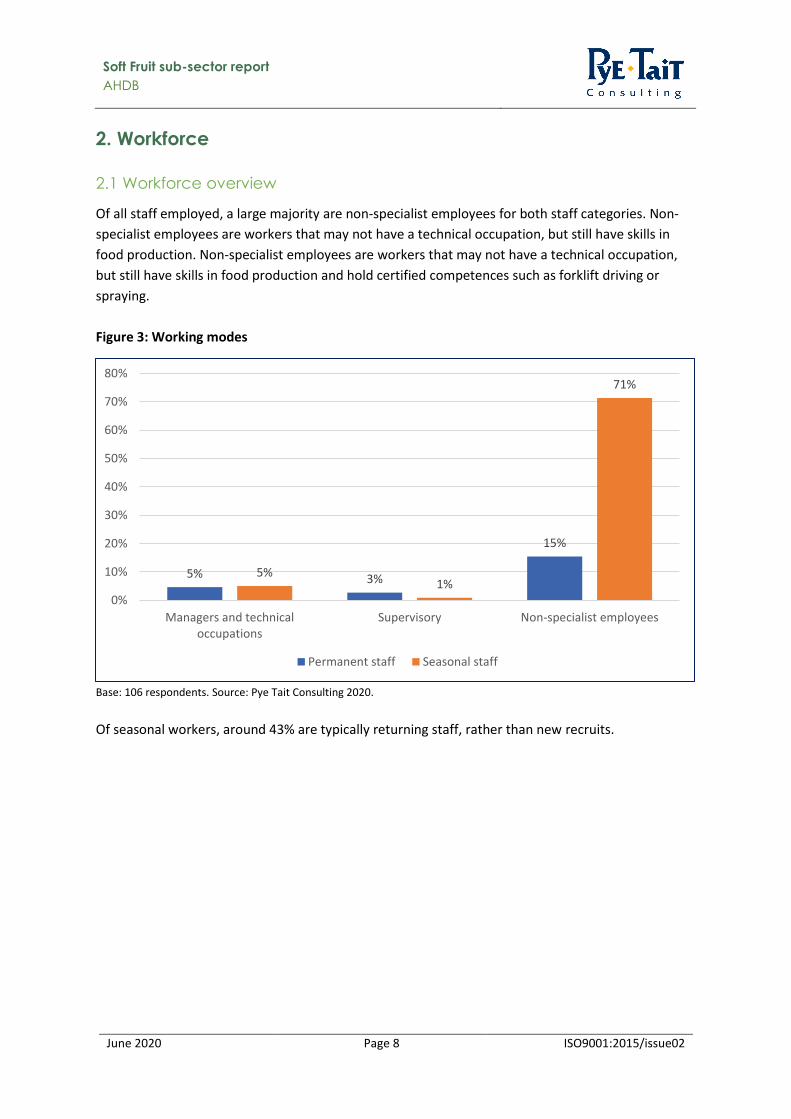
Of all staff employed, a large majority are non-specialist employees for both staff categories. Non-
specialist employees are workers that may not have a technical occupation, but still have skills in
food production. Non-specialist employees are workers that may not have a technical occupation,
but still have skills in food production and hold certified competences such as forklift driving or
spraying.
Figure 3: Working modes
Base: 106 respondents. Source: Pye Tait Consulting 2020.
Of seasonal workers, around 43% are typically returning staff, rather than new recruits.
5% 3%
15%
5%1%
71%
0%
10%
20%
30%
40%
50%
60%
70%
80%
Managers and technicaloccupations
Supervisory Non-specialist employees
Permanent staff Seasonal staff
Soft Fruit sub-sector report
AHDB
June 2020 Page 9 ISO9001:2015/issue02
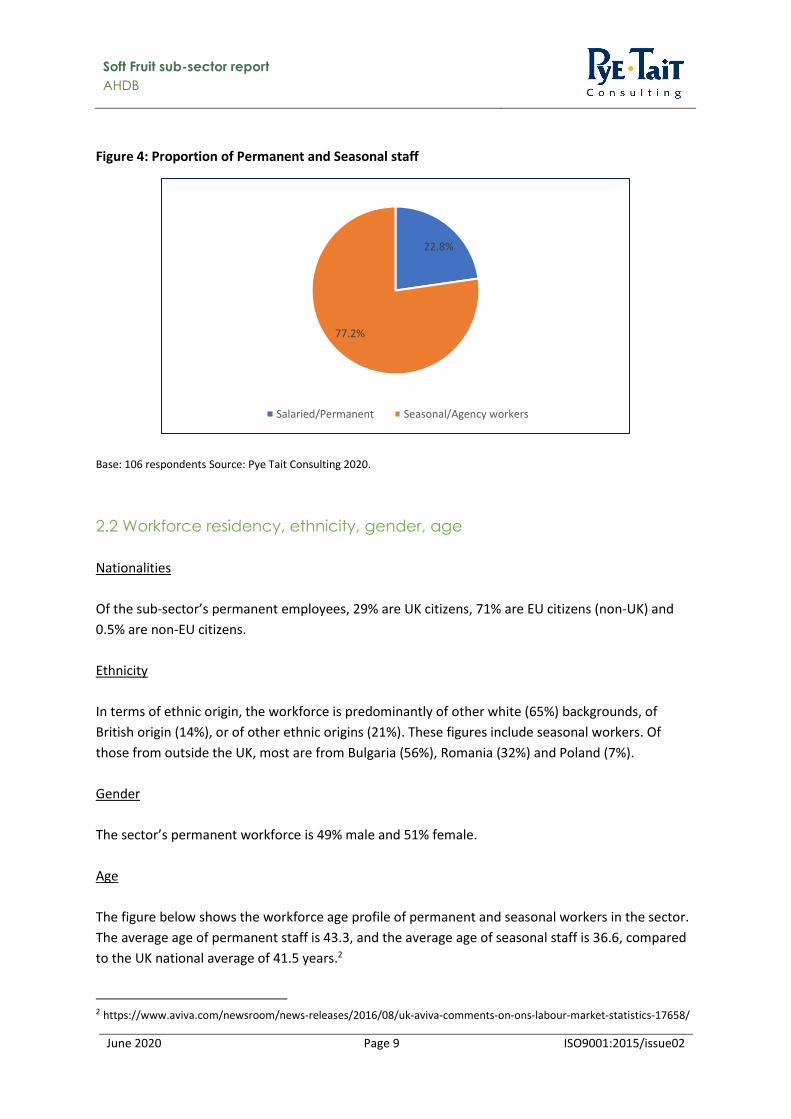
Figure 4: Proportion of Permanent and Seasonal staff
Base: 106 respondents Source: Pye Tait Consulting 2020.
2.2 Workforce residency, ethnicity, gender, age
Nationalities
Of the sub-sector’s permanent employees, 29% are UK citizens, 71% are EU citizens (non-UK) and
0.5% are non-EU citizens.
Ethnicity
In terms of ethnic origin, the workforce is predominantly of other white (65%) backgrounds, of
British origin (14%), or of other ethnic origins (21%). These figures include seasonal workers. Of
those from outside the UK, most are from Bulgaria (56%), Romania (32%) and Poland (7%).
Gender
The sector’s permanent workforce is 49% male and 51% female.
Age
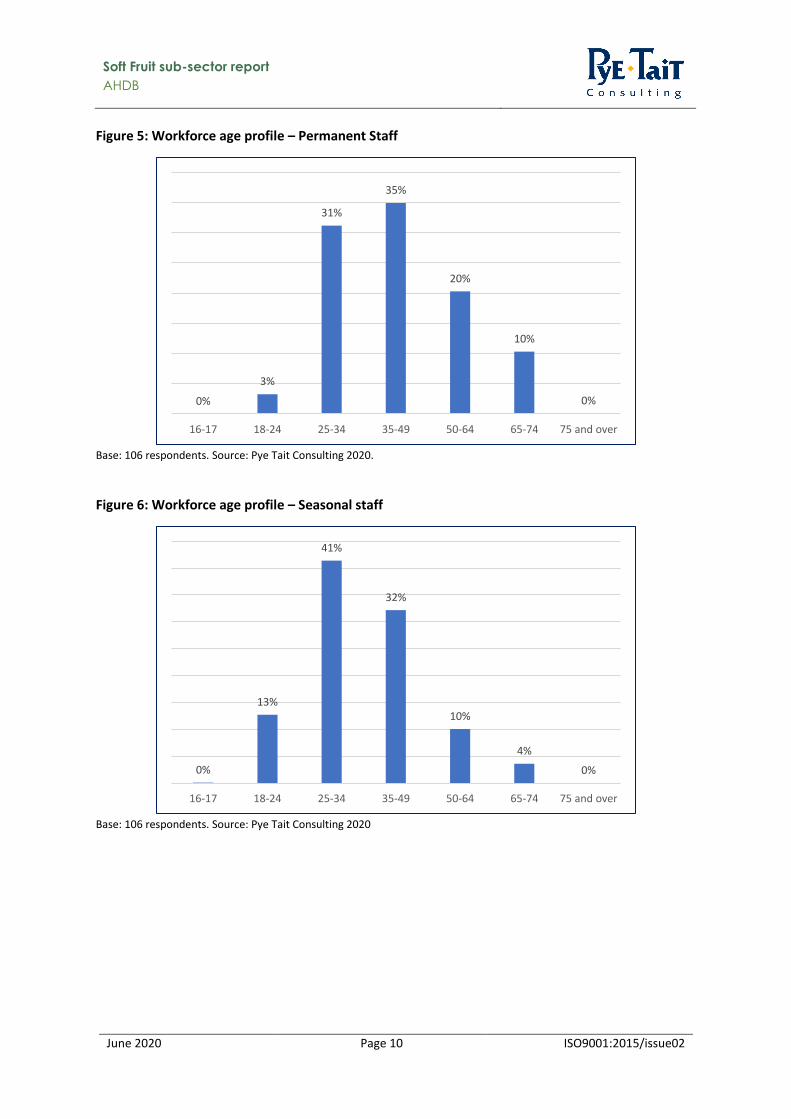
The figure below shows the workforce age profile of permanent and seasonal workers in the sector.
The average age of permanent staff is 43.3, and the average age of seasonal staff is 36.6, compared
to the UK national average of 41.5 years.2
2 https://www.aviva.com/newsroom/news-releases/2016/08/uk-aviva-comments-on-ons-labour-market-statistics-17658/
22.8%
77.2%
Salaried/Permanent Seasonal/Agency workers
Soft Fruit sub-sector report
AHDB
June 2020 Page 10 ISO9001:2015/issue02
Figure 5: Workforce age profile – Permanent Staff
Base: 106 respondents. Source: Pye Tait Consulting 2020.
Figure 6: Workforce age profile – Seasonal staff
Base: 106 respondents. Source: Pye Tait Consulting 2020
0%
3%
31%
35%
20%
10%
0%
16-17 18-24 25-34 35-49 50-64 65-74 75 and over
0%
13%
41%
32%
10%
4%
0%
16-17 18-24 25-34 35-49 50-64 65-74 75 and over
Soft Fruit sub-sector report
AHDB
June 2020 Page 11 ISO9001:2015/issue02
2.3 Workforce projections
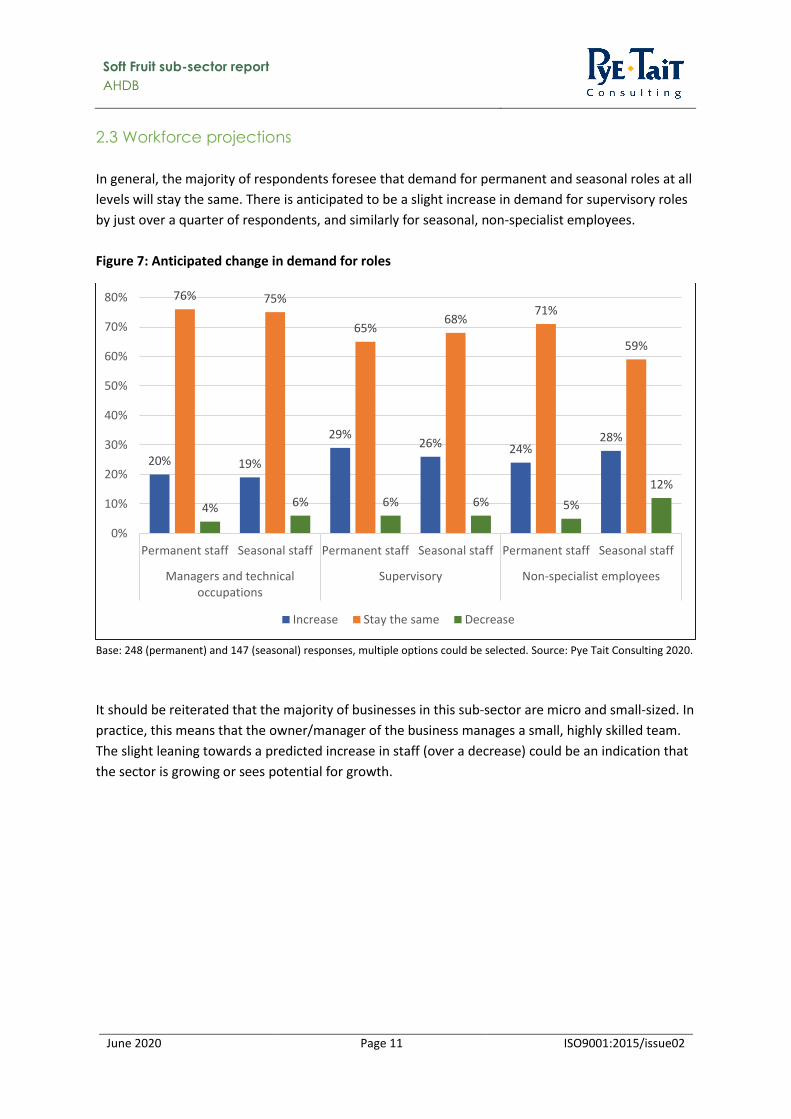
In general, the majority of respondents foresee that demand for permanent and seasonal roles at all
levels will stay the same. There is anticipated to be a slight increase in demand for supervisory roles
by just over a quarter of respondents, and similarly for seasonal, non-specialist employees.
Figure 7: Anticipated change in demand for roles
Base: 248 (permanent) and 147 (seasonal) responses, multiple options could be selected. Source: Pye Tait Consulting 2020.
It should be reiterated that the majority of businesses in this sub-sector are micro and small-sized. In
practice, this means that the owner/manager of the business manages a small, highly skilled team.
The slight leaning towards a predicted increase in staff (over a decrease) could be an indication that
the sector is growing or sees potential for growth.
20% 19%
29%26% 24%
28%
76% 75%
65%68%
71%
59%
4% 6% 6% 6% 5%
12%
0%
10%
20%
30%
40%
50%
60%
70%
80%
Permanent staff Seasonal staff Permanent staff Seasonal staff Permanent staff Seasonal staff
Managers and technicaloccupations
Supervisory Non-specialist employees
Increase Stay the same Decrease
Soft Fruit sub-sector report
AHDB
June 2020 Page 12 ISO9001:2015/issue02
3. Labour and skills challenge
3.1 Vacancies
Respondents were asked how many vacancies they had had over the past year. A third of businesses
report an average of five managerial and a quarter of businesses report an average of six supervisory
vacancies on average per company. In addition, 31 companies (around one in three) reported
vacancies for seasonal workers over the past year, with each of these companies reporting an
average of 203 seasonal vacancies.
Companies were also asked if any vacancies had been particularly difficult to fill. Of the 67
companies who had experienced difficulties in recruitment, 24 noted that managerial positions were
hard to fill, 24 noted that supervisory positions were difficult to fill, and 52 that seasonal worker
positions had been hard to fill.
3.2 Reasons for skills gaps
Companies were asked for reasons why they perceive that skills gaps exist among their workforce. A
broad range of reasons were provided, with external training being too expensive, or being not
sufficiently relevant to the business, being most commonly mentioned by one in four respondents
(25%). A lack of training available locally, or at the right time of year, were both also mentioned by
more than one in five respondents.
Soft Fruit sub-sector report
AHDB
June 2020 Page 13 ISO9001:2015/issue02
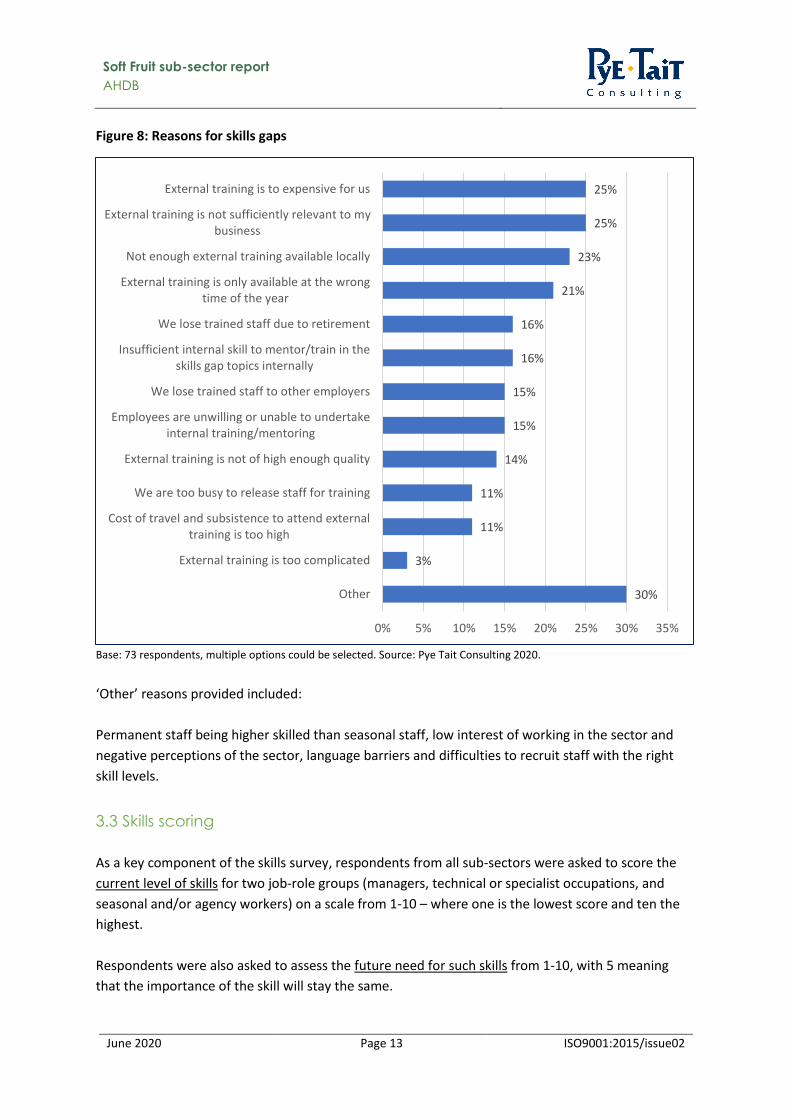
Figure 8: Reasons for skills gaps
Base: 73 respondents, multiple options could be selected. Source: Pye Tait Consulting 2020.
‘Other’ reasons provided included:
Permanent staff being higher skilled than seasonal staff, low interest of working in the sector and
negative perceptions of the sector, language barriers and difficulties to recruit staff with the right
skill levels.
3.3 Skills scoring
As a key component of the skills survey, respondents from all sub-sectors were asked to score the
current level of skills for two job-role groups (managers, technical or specialist occupations, and
seasonal and/or agency workers) on a scale from 1-10 – where one is the lowest score and ten the
highest.
Respondents were also asked to assess the future need for such skills from 1-10, with 5 meaning
that the importance of the skill will stay the same.
30%
3%
11%
11%
14%
15%
15%
16%
16%
21%
23%
25%
25%
0% 5% 10% 15% 20% 25% 30% 35%
Other
External training is too complicated
Cost of travel and subsistence to attend externaltraining is too high
We are too busy to release staff for training
External training is not of high enough quality
Employees are unwilling or unable to undertakeinternal training/mentoring
We lose trained staff to other employers
Insufficient internal skill to mentor/train in theskills gap topics internally
We lose trained staff due to retirement
External training is only available at the wrongtime of the year
Not enough external training available locally
External training is not sufficiently relevant to mybusiness
External training is to expensive for us
Soft Fruit sub-sector report
AHDB
June 2020 Page 14 ISO9001:2015/issue02
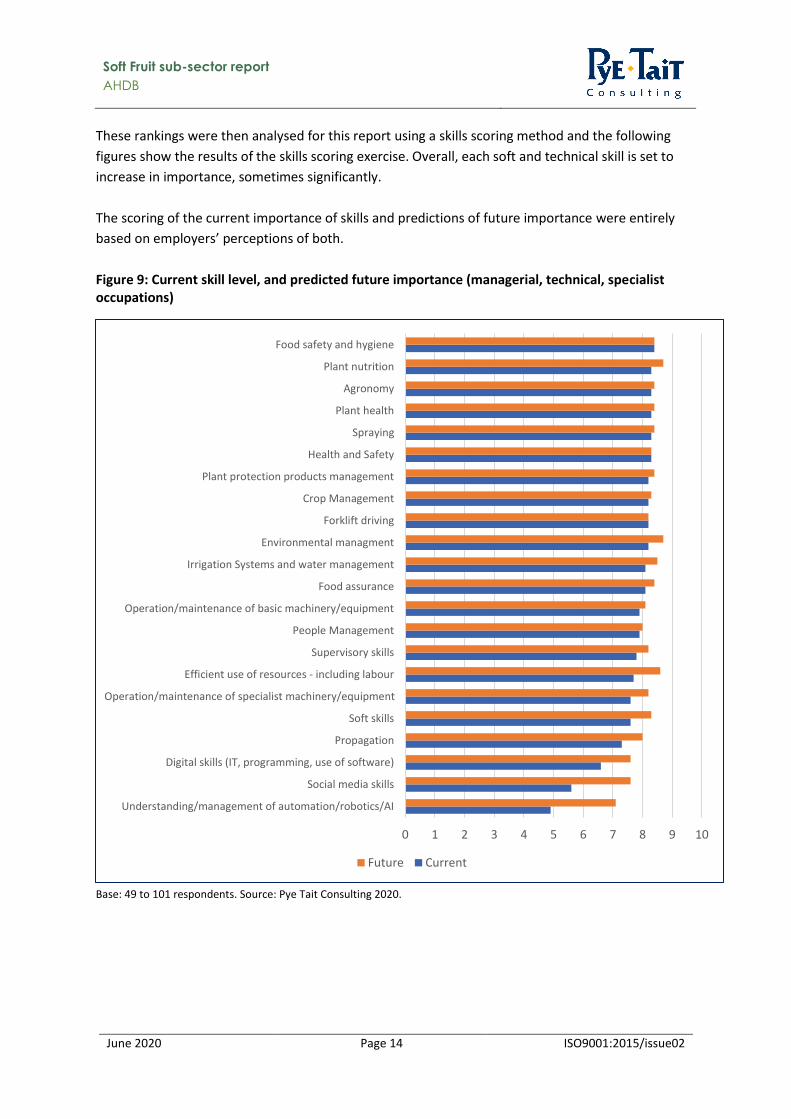
These rankings were then analysed for this report using a skills scoring method and the following
figures show the results of the skills scoring exercise. Overall, each soft and technical skill is set to
increase in importance, sometimes significantly.
The scoring of the current importance of skills and predictions of future importance were entirely
based on employers’ perceptions of both.
Figure 9: Current skill level, and predicted future importance (managerial, technical, specialist occupations)
Base: 49 to 101 respondents. Source: Pye Tait Consulting 2020.
0 1 2 3 4 5 6 7 8 9 10
Understanding/management of automation/robotics/AI
Social media skills
Digital skills (IT, programming, use of software)
Propagation
Soft skills
Operation/maintenance of specialist machinery/equipment
Efficient use of resources - including labour
Supervisory skills
People Management
Operation/maintenance of basic machinery/equipment
Food assurance
Irrigation Systems and water management
Environmental managment
Forklift driving
Crop Management
Plant protection products management
Health and Safety
Spraying
Plant health
Agronomy
Plant nutrition
Food safety and hygiene
Future Current
Soft Fruit sub-sector report
AHDB
June 2020 Page 15 ISO9001:2015/issue02
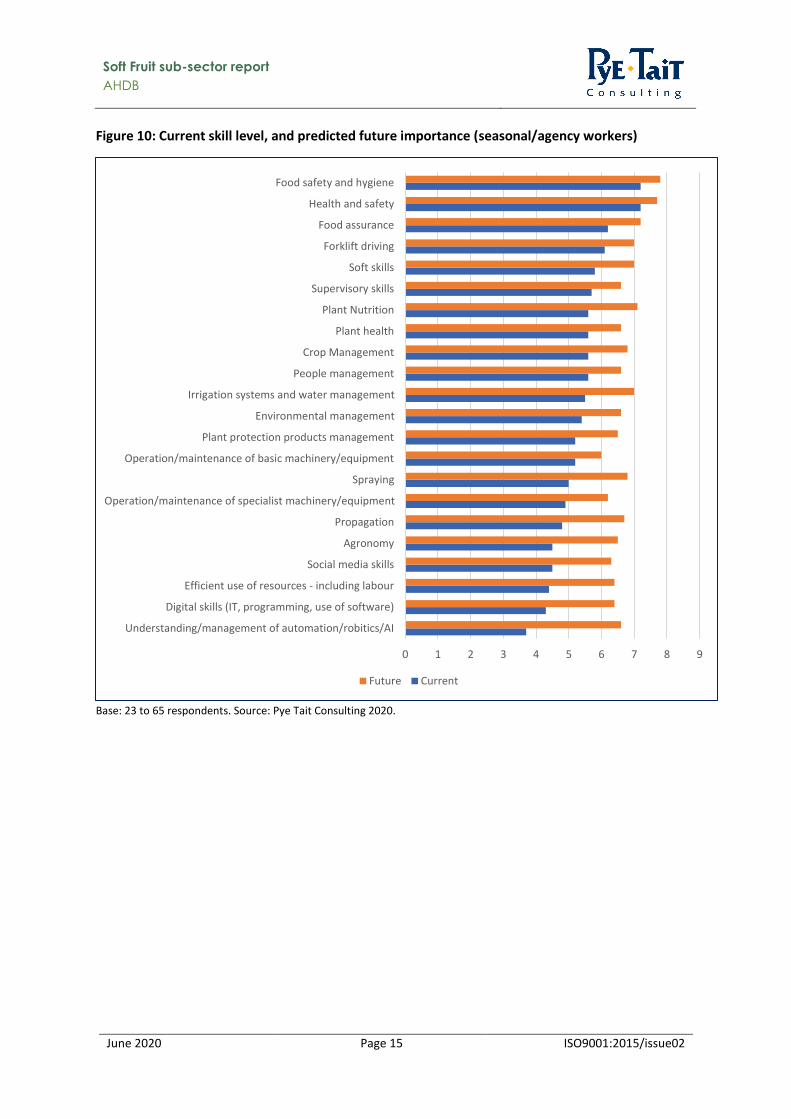
Figure 10: Current skill level, and predicted future importance (seasonal/agency workers)
Base: 23 to 65 respondents. Source: Pye Tait Consulting 2020.
0 1 2 3 4 5 6 7 8 9
Understanding/management of automation/robitics/AI
Digital skills (IT, programming, use of software)
Efficient use of resources - including labour
Social media skills
Agronomy
Propagation
Operation/maintenance of specialist machinery/equipment
Spraying
Operation/maintenance of basic machinery/equipment
Plant protection products management
Environmental management
Irrigation systems and water management
People management
Crop Management
Plant health
Plant Nutrition
Supervisory skills
Soft skills
Forklift driving
Food assurance
Health and safety
Food safety and hygiene
Future Current
Soft Fruit sub-sector report
AHDB
June 2020 Page 16 ISO9001:2015/issue02
4. Workforce training, education, and staff development
4.1 Training
We asked employers what they typically do when it comes to training, both for their permanent and
for their seasonal staff.
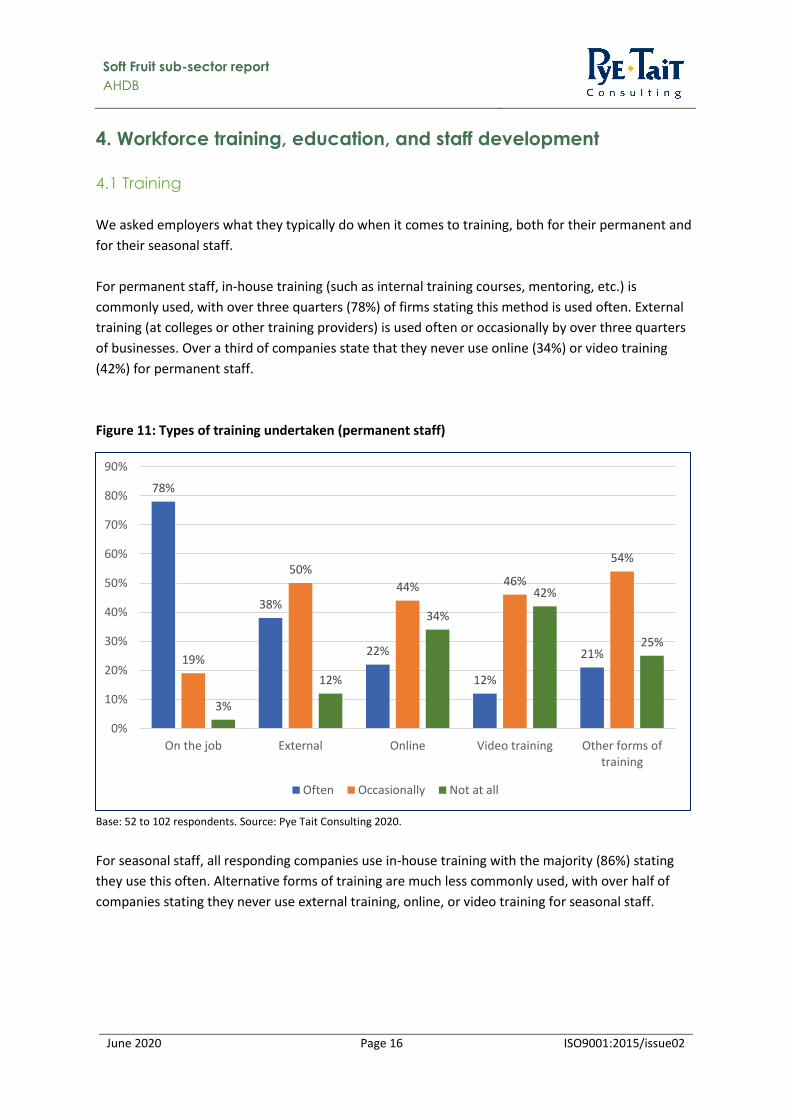
For permanent staff, in-house training (such as internal training courses, mentoring, etc.) is
commonly used, with over three quarters (78%) of firms stating this method is used often. External
training (at colleges or other training providers) is used often or occasionally by over three quarters
of businesses. Over a third of companies state that they never use online (34%) or video training
(42%) for permanent staff.
Figure 11: Types of training undertaken (permanent staff)
Base: 52 to 102 respondents. Source: Pye Tait Consulting 2020.
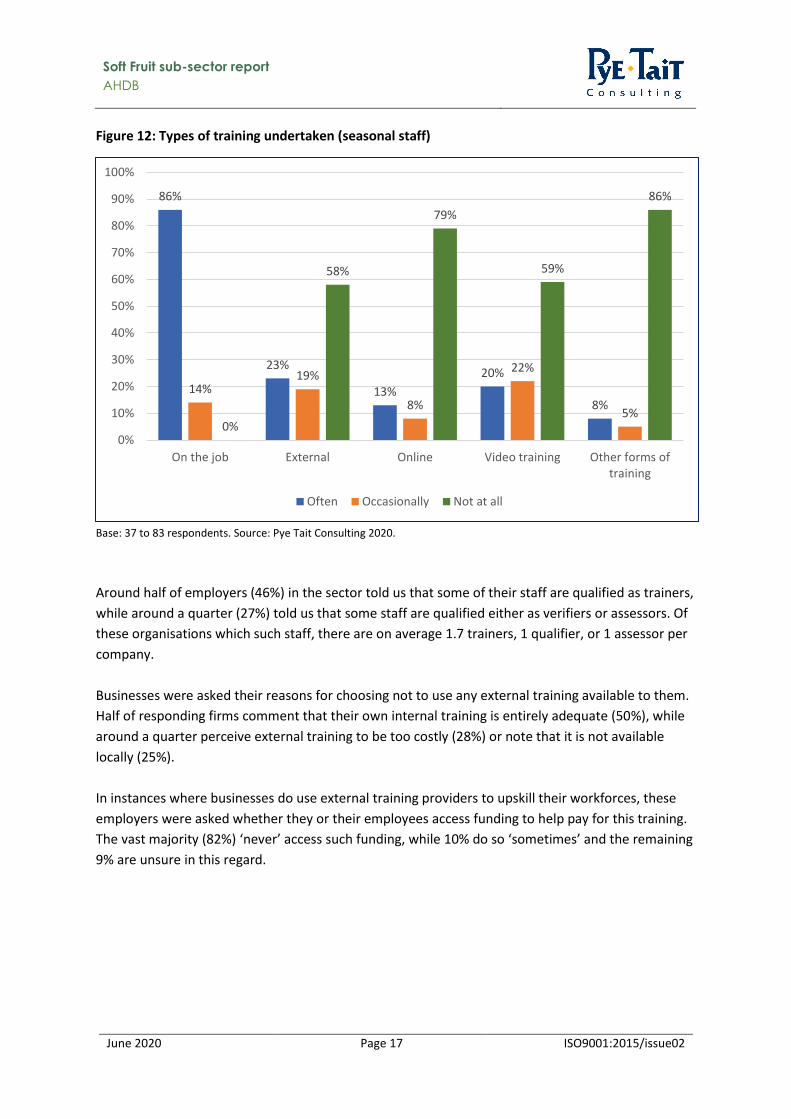
For seasonal staff, all responding companies use in-house training with the majority (86%) stating
they use this often. Alternative forms of training are much less commonly used, with over half of
companies stating they never use external training, online, or video training for seasonal staff.
78%
38%
22%
12%
21%19%
50%
44% 46%
54%
3%
12%
34%
42%
25%
0%
10%
20%
30%
40%
50%
60%
70%
80%
90%
On the job External Online Video training Other forms oftraining
Often Occasionally Not at all
Soft Fruit sub-sector report
AHDB
June 2020 Page 17 ISO9001:2015/issue02
Figure 12: Types of training undertaken (seasonal staff)
Base: 37 to 83 respondents. Source: Pye Tait Consulting 2020.
Around half of employers (46%) in the sector told us that some of their staff are qualified as trainers,
while around a quarter (27%) told us that some staff are qualified either as verifiers or assessors. Of
these organisations which such staff, there are on average 1.7 trainers, 1 qualifier, or 1 assessor per
company.
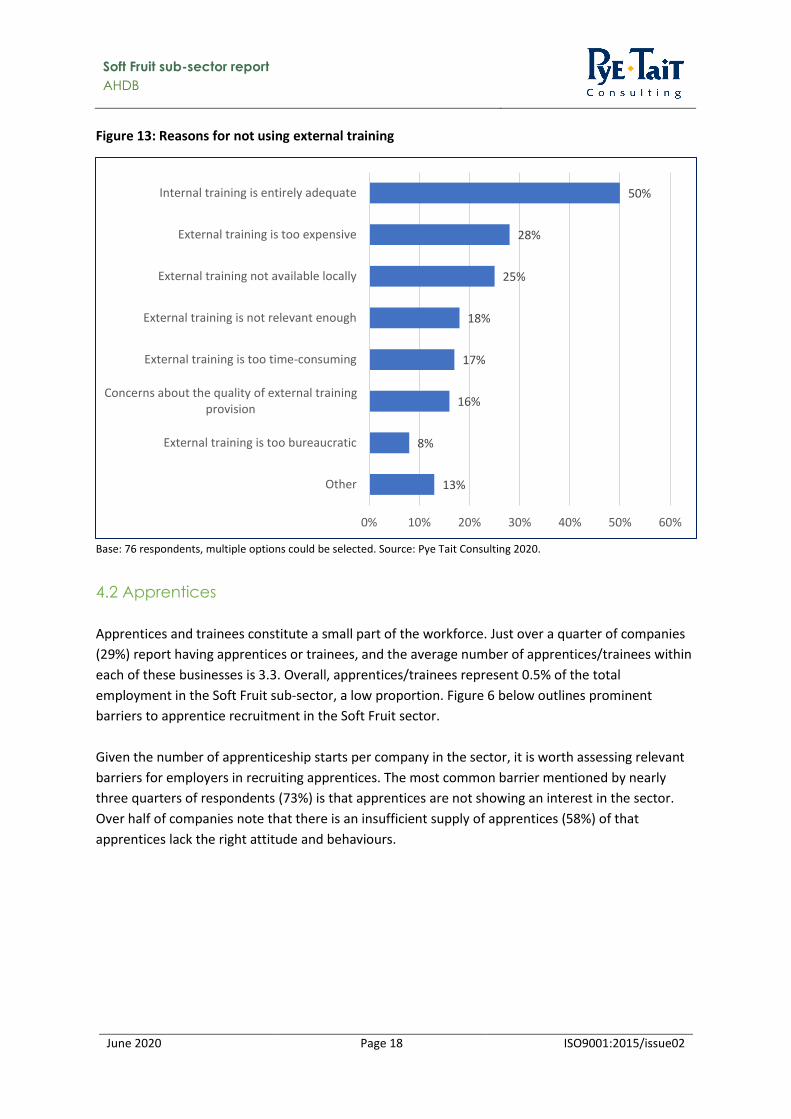
Businesses were asked their reasons for choosing not to use any external training available to them.
Half of responding firms comment that their own internal training is entirely adequate (50%), while
around a quarter perceive external training to be too costly (28%) or note that it is not available
locally (25%).
In instances where businesses do use external training providers to upskill their workforces, these
employers were asked whether they or their employees access funding to help pay for this training.
The vast majority (82%) ‘never’ access such funding, while 10% do so ‘sometimes’ and the remaining
9% are unsure in this regard.
86%
23%
13%
20%
8%14%
19%
8%
22%
5%0%
58%
79%
59%
86%
0%
10%
20%
30%
40%
50%
60%
70%
80%
90%
100%
On the job External Online Video training Other forms oftraining
Often Occasionally Not at all
Soft Fruit sub-sector report
AHDB
June 2020 Page 18 ISO9001:2015/issue02
Figure 13: Reasons for not using external training
Base: 76 respondents, multiple options could be selected. Source: Pye Tait Consulting 2020.
4.2 Apprentices
Apprentices and trainees constitute a small part of the workforce. Just over a quarter of companies
(29%) report having apprentices or trainees, and the average number of apprentices/trainees within
each of these businesses is 3.3. Overall, apprentices/trainees represent 0.5% of the total
employment in the Soft Fruit sub-sector, a low proportion. Figure 6 below outlines prominent
barriers to apprentice recruitment in the Soft Fruit sector.
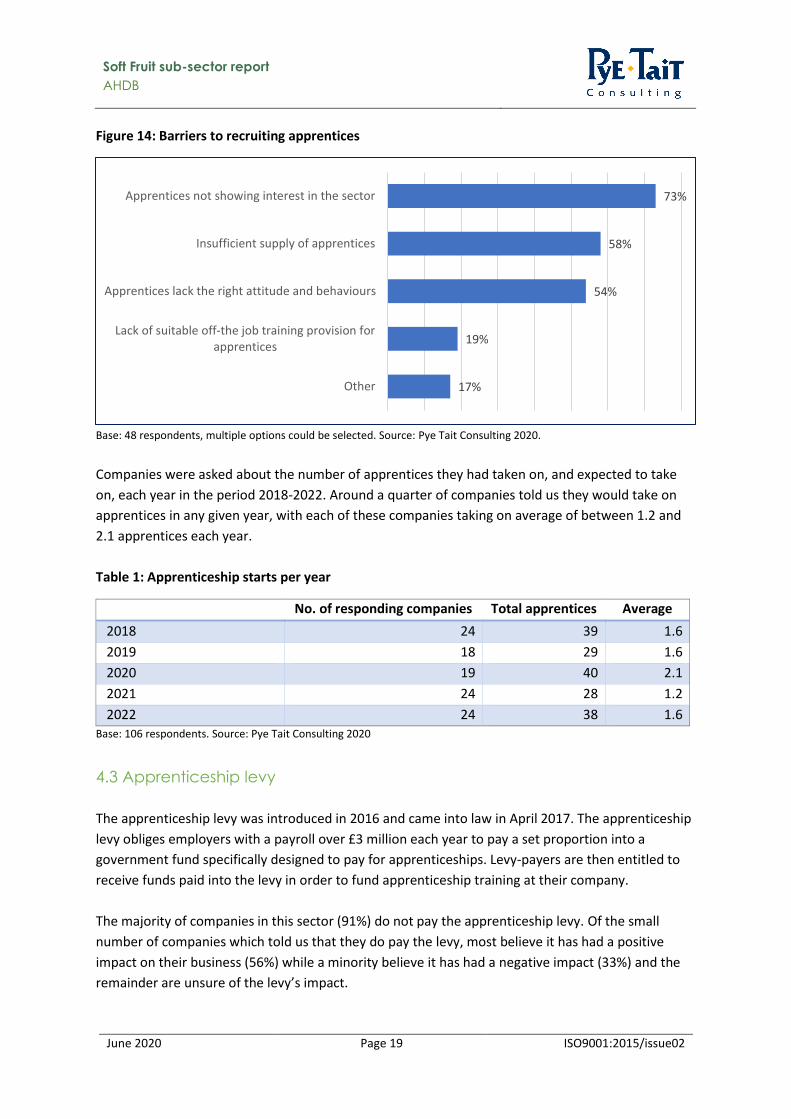
Given the number of apprenticeship starts per company in the sector, it is worth assessing relevant
barriers for employers in recruiting apprentices. The most common barrier mentioned by nearly
three quarters of respondents (73%) is that apprentices are not showing an interest in the sector.
Over half of companies note that there is an insufficient supply of apprentices (58%) of that
apprentices lack the right attitude and behaviours.
13%
8%
16%
17%
18%
25%
28%
50%
0% 10% 20% 30% 40% 50% 60%
Other
External training is too bureaucratic
Concerns about the quality of external trainingprovision
External training is too time-consuming
External training is not relevant enough
External training not available locally
External training is too expensive
Internal training is entirely adequate
Soft Fruit sub-sector report
AHDB
June 2020 Page 19 ISO9001:2015/issue02
Figure 14: Barriers to recruiting apprentices
Base: 48 respondents, multiple options could be selected. Source: Pye Tait Consulting 2020.
Companies were asked about the number of apprentices they had taken on, and expected to take
on, each year in the period 2018-2022. Around a quarter of companies told us they would take on
apprentices in any given year, with each of these companies taking on average of between 1.2 and
2.1 apprentices each year.
Table 1: Apprenticeship starts per year
No. of responding companies Total apprentices Average
2018 24 39 1.6
2019 18 29 1.6
2020 19 40 2.1
2021 24 28 1.2
2022 24 38 1.6 Base: 106 respondents. Source: Pye Tait Consulting 2020
4.3 Apprenticeship levy
The apprenticeship levy was introduced in 2016 and came into law in April 2017. The apprenticeship
levy obliges employers with a payroll over £3 million each year to pay a set proportion into a
government fund specifically designed to pay for apprenticeships. Levy-payers are then entitled to
receive funds paid into the levy in order to fund apprenticeship training at their company.
The majority of companies in this sector (91%) do not pay the apprenticeship levy. Of the small
number of companies which told us that they do pay the levy, most believe it has had a positive
impact on their business (56%) while a minority believe it has had a negative impact (33%) and the
remainder are unsure of the levy’s impact.
17%
19%
54%
58%
73%
Other
Lack of suitable off-the job training provision forapprentices
Apprentices lack the right attitude and behaviours
Insufficient supply of apprentices
Apprentices not showing interest in the sector
Soft Fruit sub-sector report
AHDB
June 2020 Page 20 ISO9001:2015/issue02
4.4 T Levels
T Levels are new qualifications which are being introduced from September 2020. These are
technical courses intended to be equivalent academic A level qualifications. T Levels are two-year
courses which will offer students a mix of classroom learning and on-the-job training during an
industry placement of 45 days. The first three T Levels will be available in September 2020 in
construction, digital, and education, with seven more courses beginning the following year. A T Level
in agriculture, land management and production is set to start in September 2023.
The vast majority of companies in the sector (95%) are unaware of this T Level qualification which is
to be introduced by the Department for Education in 2023.
4.5 Qualification requirements
Businesses were also asked their thoughts on whether they consider a degree level qualification
(level 6 or higher) is necessary for various occupational areas.
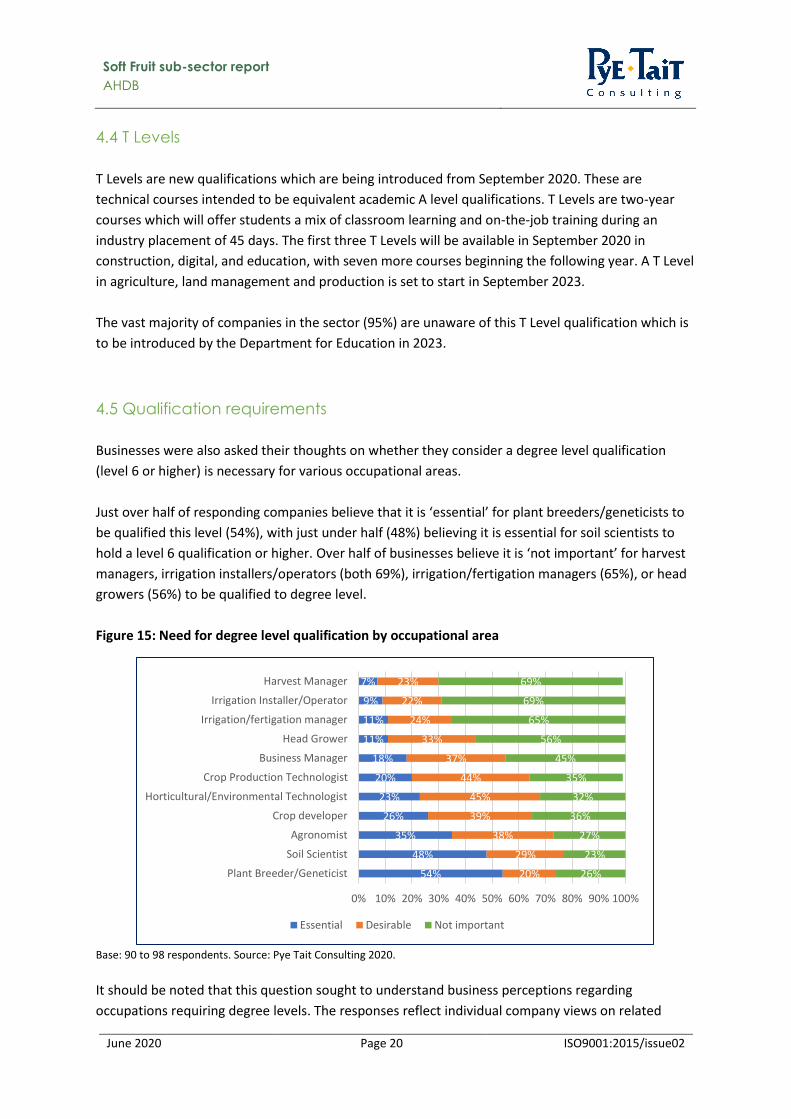
Just over half of responding companies believe that it is ‘essential’ for plant breeders/geneticists to
be qualified this level (54%), with just under half (48%) believing it is essential for soil scientists to
hold a level 6 qualification or higher. Over half of businesses believe it is ‘not important’ for harvest
managers, irrigation installers/operators (both 69%), irrigation/fertigation managers (65%), or head
growers (56%) to be qualified to degree level.
Figure 15: Need for degree level qualification by occupational area
Base: 90 to 98 respondents. Source: Pye Tait Consulting 2020.
It should be noted that this question sought to understand business perceptions regarding
occupations requiring degree levels. The responses reflect individual company views on related
54%
48%
35%
26%
23%
20%
18%
11%
11%
9%
7%
20%
29%
38%
39%
45%
44%
37%
33%
24%
22%
23%
26%
23%
27%
36%
32%
35%
45%
56%
65%
69%
69%
0% 10% 20% 30% 40% 50% 60% 70% 80% 90% 100%
Plant Breeder/Geneticist
Soil Scientist
Agronomist
Crop developer
Horticultural/Environmental Technologist
Crop Production Technologist
Business Manager
Head Grower
Irrigation/fertigation manager
Irrigation Installer/Operator
Harvest Manager
Essential Desirable Not important
Soft Fruit sub-sector report
AHDB
June 2020 Page 21 ISO9001:2015/issue02
degree requirements in general. The responses do not reflect the extent to which the listed
occupations are relevant to the respective edible horticulture sub-sector. For instance, soil scientists
may be less relevant for the Mushroom and Protected Edibles sectors and this role may be known as
“crop nutritionist” in other sectors.
Soft Fruit sub-sector report
AHDB
June 2020 Page 22 ISO9001:2015/issue02
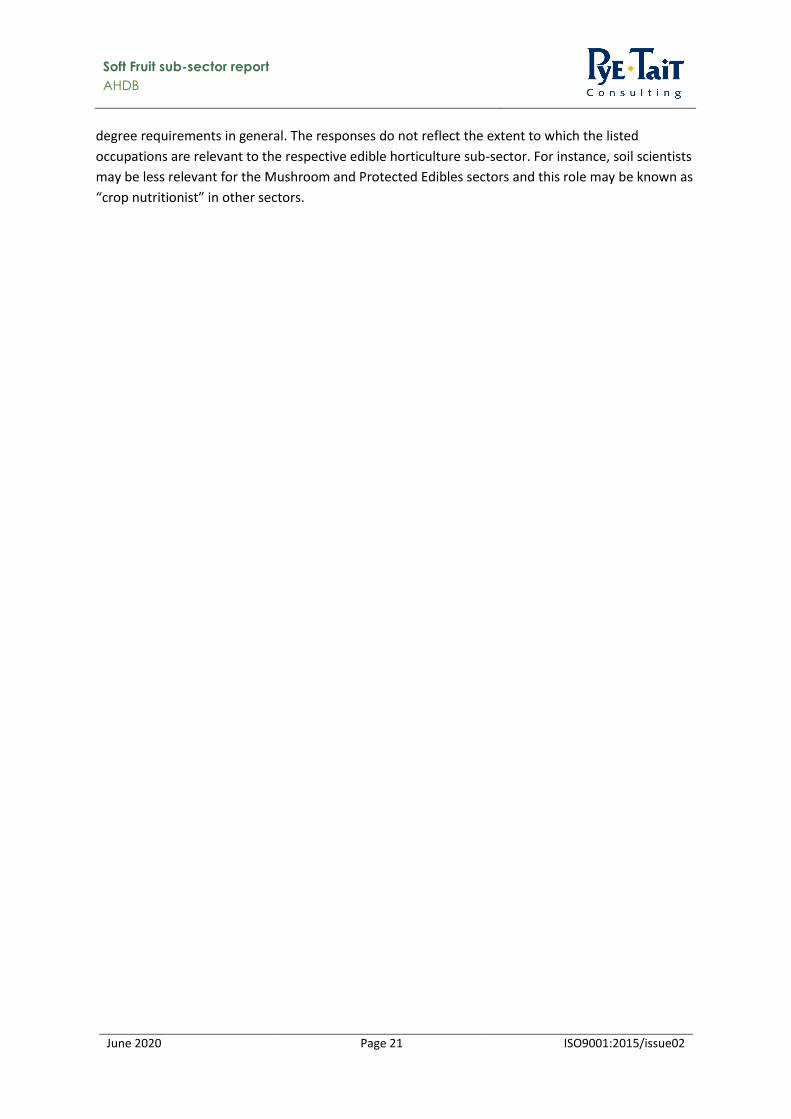
5. Future drivers of change To provide information on their future outlook of the sector, businesses were asked to rate the most
important drivers of future change from their perspective on a scale from 1 (not important) to 10
(very important).
The drivers of change perceived to be most important are pressure on margins, availability of labour
(both 9.6) and consumer demand (9.5). These top three reasons are the same across most EH sub-
sectors, with some variation in order.
Figure 16: Drivers of change
Base: 74 to 98 respondents. Source: Pye Tait Consulting 2020.
6.8
7.3
7.5
7.7
7.9
8.1
8.1
8.3
8.4
8.5
8.5
8.6
8.6
8.7
8.7
8.8
8.8
9.1
9.1
9.5
9.6
9.6
0 1 2 3 4 5 6 7 8 9 10
Overseas markets
Import and Export tariffs
Government support
Supermarkets
Technological developments
Carbon costs
Use of plastics
Biosecurity
Food Security
Environmental issues
Legislation
Biological control agents
Public opinion/understanding of the EH sector
Crop science
Plant breeding
Disease and security/control
Loss of Plant Protection Products
Change in consumer habits
Skills shortages
Consumer demand
Availability of labour
Pressure on margins
Soft Fruit sub-sector report
AHDB
June 2020 Page 23 ISO9001:2015/issue02
6. Summary
Workforce demographics
• The sector is largely made up of micro and small businesses (62%).
• Most workers in the sector (71%) are seasonal, non-specialist employees. The average age of
permanent workers in the sector is 43.3 compared to 36.6 for seasonal workers.
• Most workers are of ‘other white’ ethnic background, with most of these workers
predominantly from Bulgaria or Romania.
Workforce projections
• Demand for occupations is anticipated to remain largely the same in the coming years, with
a slight leaning towards a predicted increase in staff over a predicted decrease in demand.
• Around a quarter of companies taken on apprentices/trainees in any given year. Companies
with apprentices/trainees have, on average, 3.3 such staff and taking on around 1.6 each
year with little change foreseen. Apprentices/trainees comprise 0.5% of the sector
workforce. The most commonly mentioned barrier to recruiting apprentices, by 73% of
businesses, is a lack of interest in the apprenticeships.
Skills
• Skills scoring reveals that each soft or technical skill is set to increase in importance in the
future, sometimes significantly. Food safety and hygiene is the most important skill required
for both permanent and seasonal staff.
• Skills gaps in the workforce are believed to exist for a variety of factors. Most commonly
mentioned was the cost of external training (by 25% of businesses), external training not
meeting business needs (25%), and the lack of training available locally (23%).
Training
• On-the-job training is the most popular method of training both permanent and skilled staff;
video and online training are little utilised. Businesses not using external training do so as
internal training meets their needs (mentioned by half of companies), or it is perceived to be
too expensive (25%). Where businesses do use external training, the majority never access
funding (82%) for upskilling.
Education
• Most companies in the sector (91%) do not pay the apprenticeship levy.
• Most companies in the sector (95%) are unaware of the T Level qualification being
introduced in 2023.
• Degree level qualifications or higher (level 6+) are believed to be essential for plant
breeder/geneticist roles by just over half of employers (54%). A degree is believed to be not
important for harvest manager, irrigation installer/operator (both 69%),
irrigation/fertigation manager (65%), or head grower roles (56%).
Soft Fruit sub-sector report
AHDB
June 2020 Page 24 ISO9001:2015/issue02
Future drivers
• Businesses in the sector foresee that the most important drivers of change in the future are
pressure on margins, availability of labour, and consumer demand.