Embed Size (px)
Citation preview
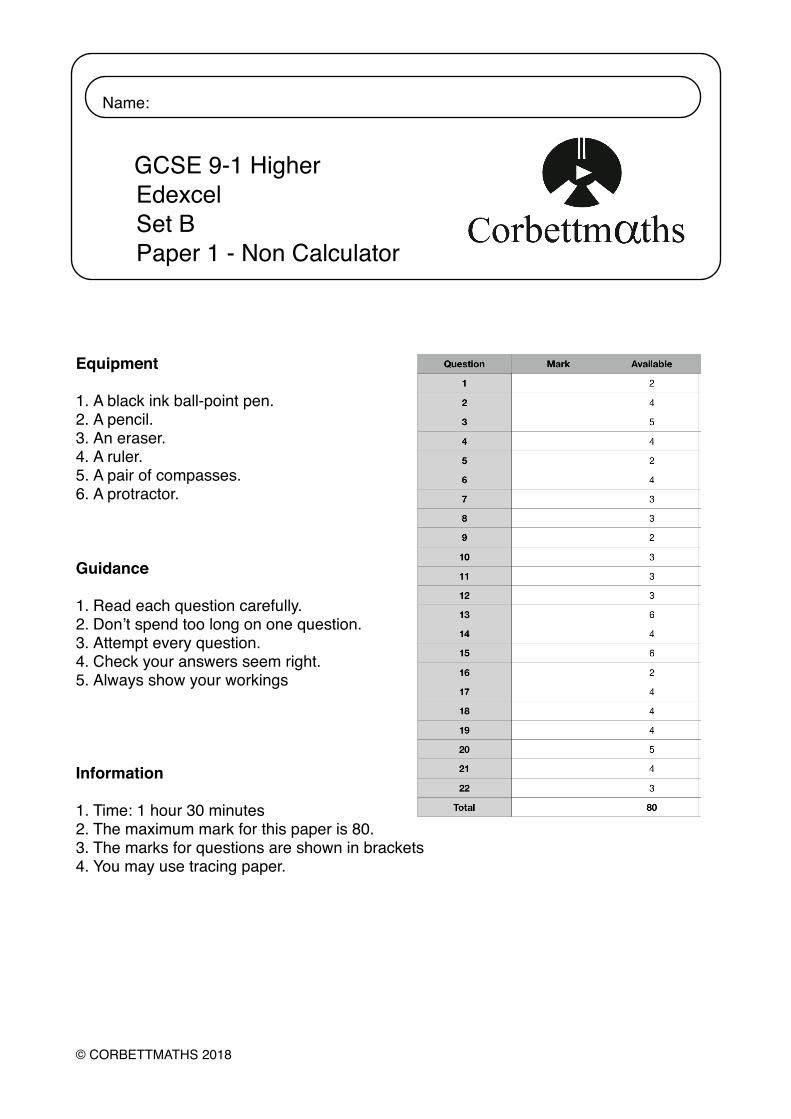
Name:
GCSE 9-1 Higher Edexcel Set B Paper 1 - Non Calculator
Equipment
1. A black ink ball-point pen.2. A pencil.3. An eraser.4. A ruler.5. A pair of compasses.6. A protractor.
Guidance
1. Read each question carefully.2. Don’t spend too long on one question.3. Attempt every question.4. Check your answers seem right.5. Always show your workings
Information
1. Time: 1 hour 30 minutes2. The maximum mark for this paper is 80.3. The marks for questions are shown in brackets4. You may use tracing paper.
© CORBETTMATHS 2018
1. Work out, as a simplified fraction
………………..(2)
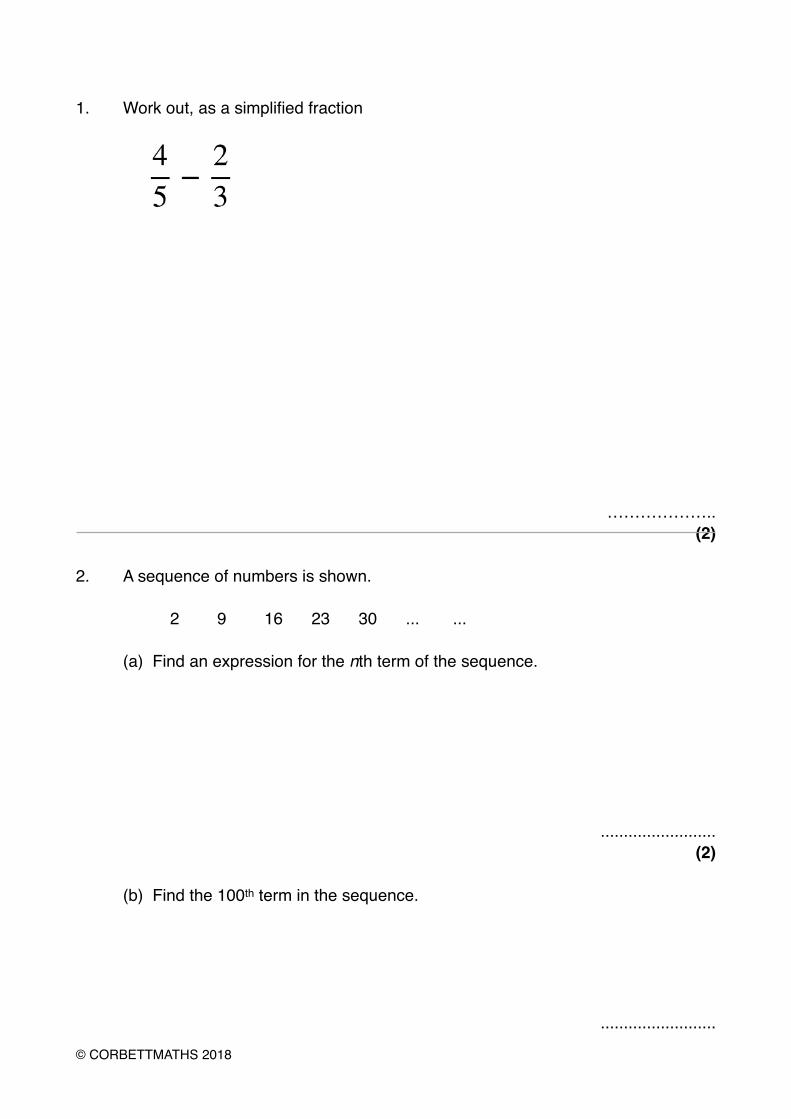
2. A sequence of numbers is shown.
2 9 16 23 30 ... ...
(a) Find an expression for the nth term of the sequence.
.........................(2)
(b) Find the 100th term in the sequence.
.........................
© CORBETTMATHS 2018
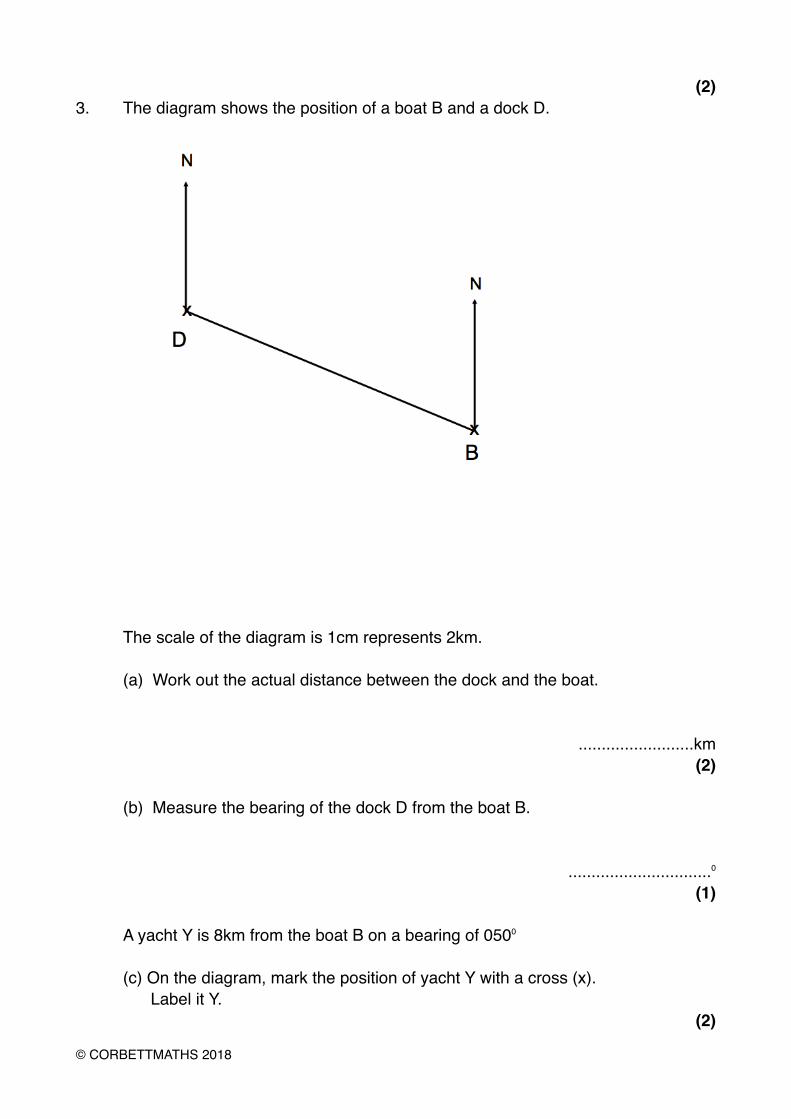
(2)3. The diagram shows the position of a boat B and a dock D.
�
The scale of the diagram is 1cm represents 2km.
(a) Work out the actual distance between the dock and the boat.
.........................km(2)
(b) Measure the bearing of the dock D from the boat B.
...............................⁰(1)
A yacht Y is 8km from the boat B on a bearing of 050⁰
(c) On the diagram, mark the position of yacht Y with a cross (x). Label it Y.
(2)
© CORBETTMATHS 2018
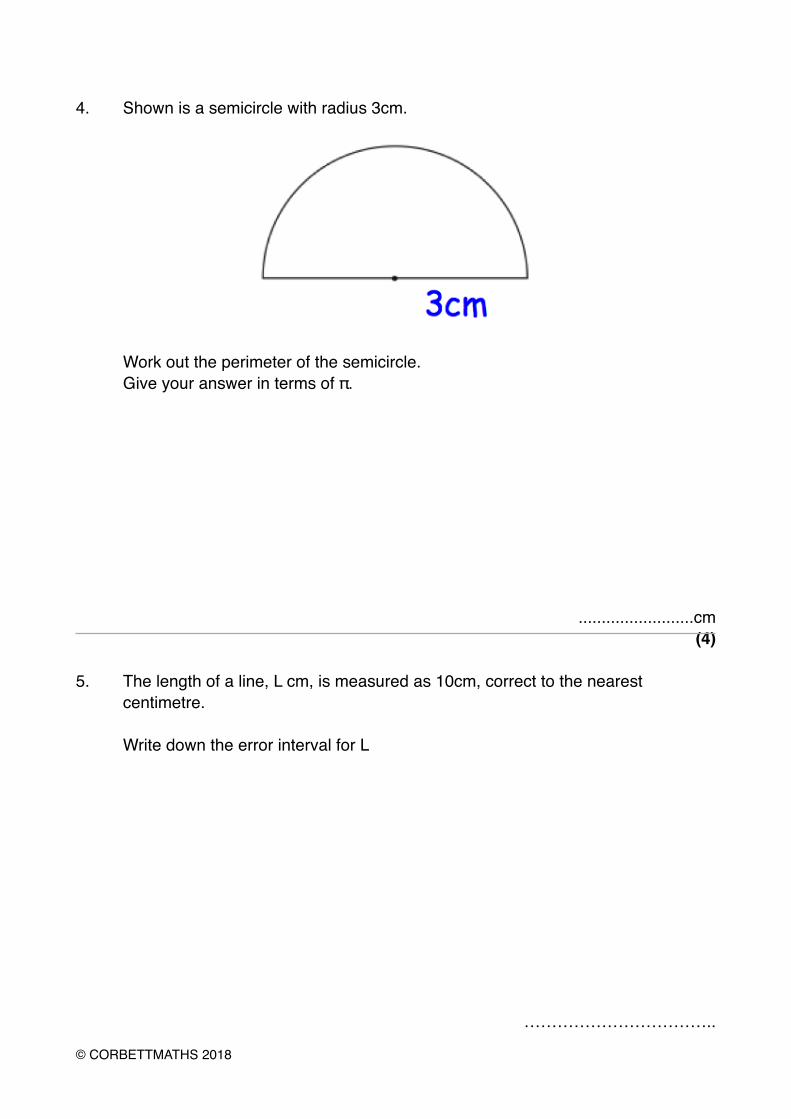
4. Shown is a semicircle with radius 3cm.
�
Work out the perimeter of the semicircle.Give your answer in terms of π.
.........................cm(4)
5. The length of a line, L cm, is measured as 10cm, correct to the nearest centimetre.
Write down the error interval for L
……………………………..
© CORBETTMATHS 2018
(2)6. 80 students at a college study one language.
Some of the students study French.Some of the students study German.The rest of the students study Spanish.
41 of the students are female.Two thirds of the students studying German were female.33 students study French.17 of the 26 students studying Spanish are male.
Work out the number of students studying German that are male.
.........................(4)
© CORBETTMATHS 2018
7. A train has two types of carriage, first class and standard class.
The train has 3 first class carriages.The train has 13 standard class carriages.
There are x seats in each first class carriage and y seats in each standard class carriage.
Write down a formula for T, the total number of seats, in terms of x and y.
.........................(3)
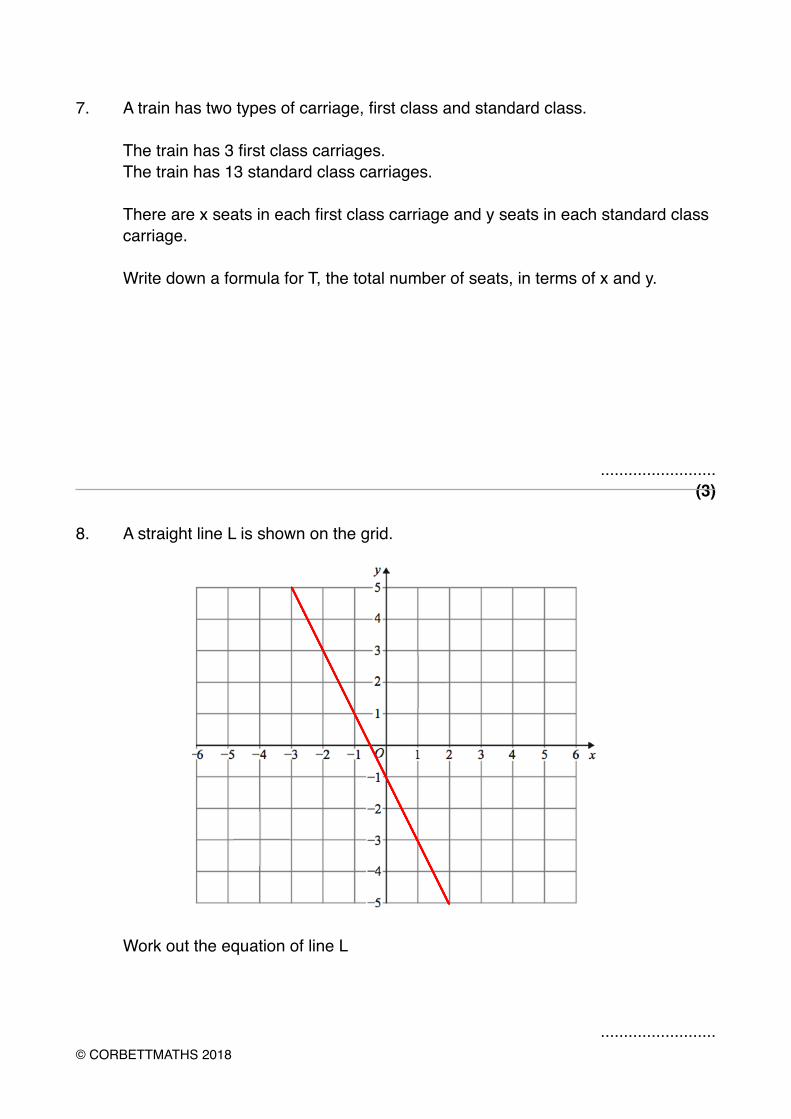
8. A straight line L is shown on the grid.
�
Work out the equation of line L
.........................© CORBETTMATHS 2018
(3)9. Write these numbers in order of size.
Start with the largest number.
…………………………………………………………………………………………………….(2)
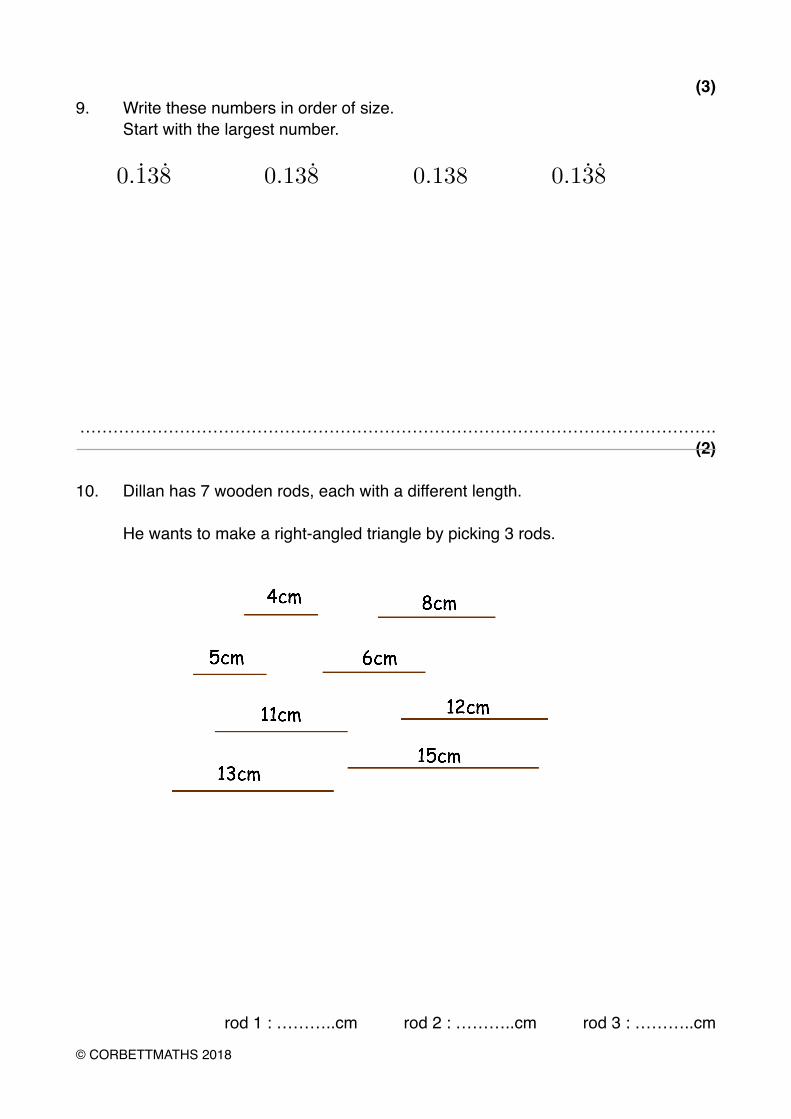
10. Dillan has 7 wooden rods, each with a different length.
He wants to make a right-angled triangle by picking 3 rods.
rod 1 : ………..cm rod 2 : ………..cm rod 3 : ………..cm
© CORBETTMATHS 2018
(3)11. (a) Factorise x² − 25
.....................................(1)
(b) Factorise y² − 12y − 64
.....................................(2)
12. In a school, the ratio of boys to girls is 2:3
20% of the boys are left handed70% of the girls are right handed
What percentage of all the students are left handed?
.........................
© CORBETTMATHS 2018
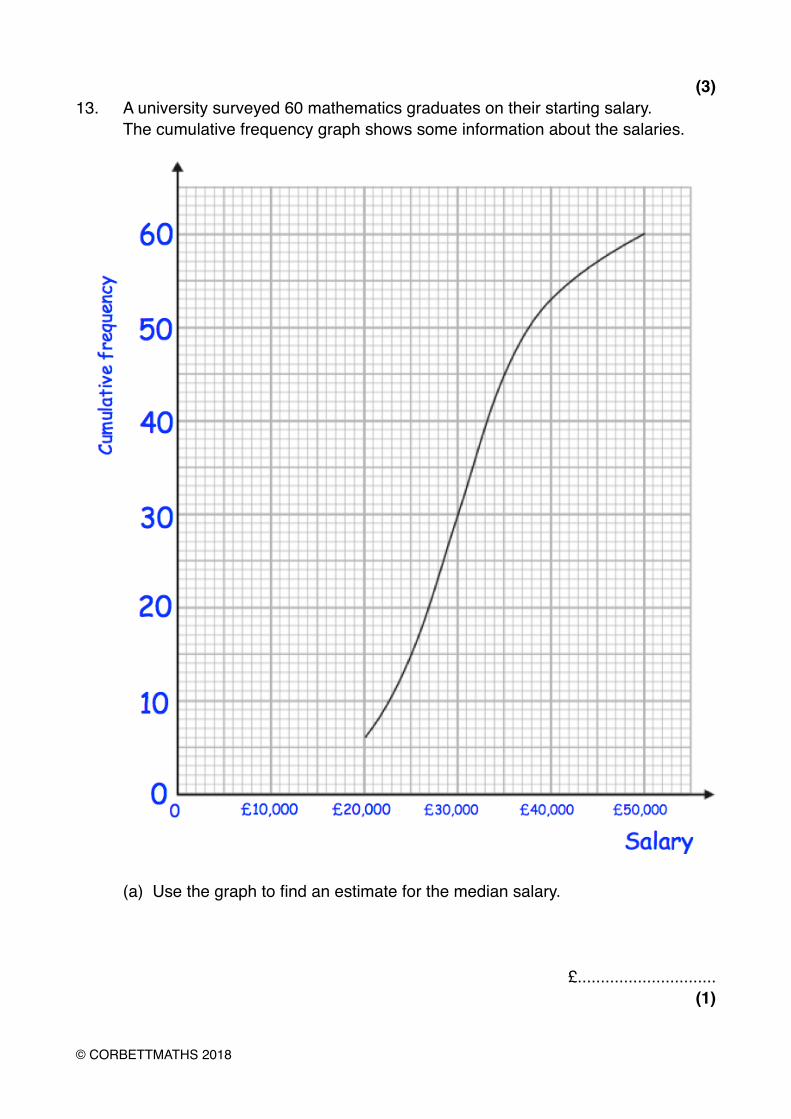
(3)13. A university surveyed 60 mathematics graduates on their starting salary.
The cumulative frequency graph shows some information about the salaries.
�
(a) Use the graph to find an estimate for the median salary.
£..............................(1)
© CORBETTMATHS 2018
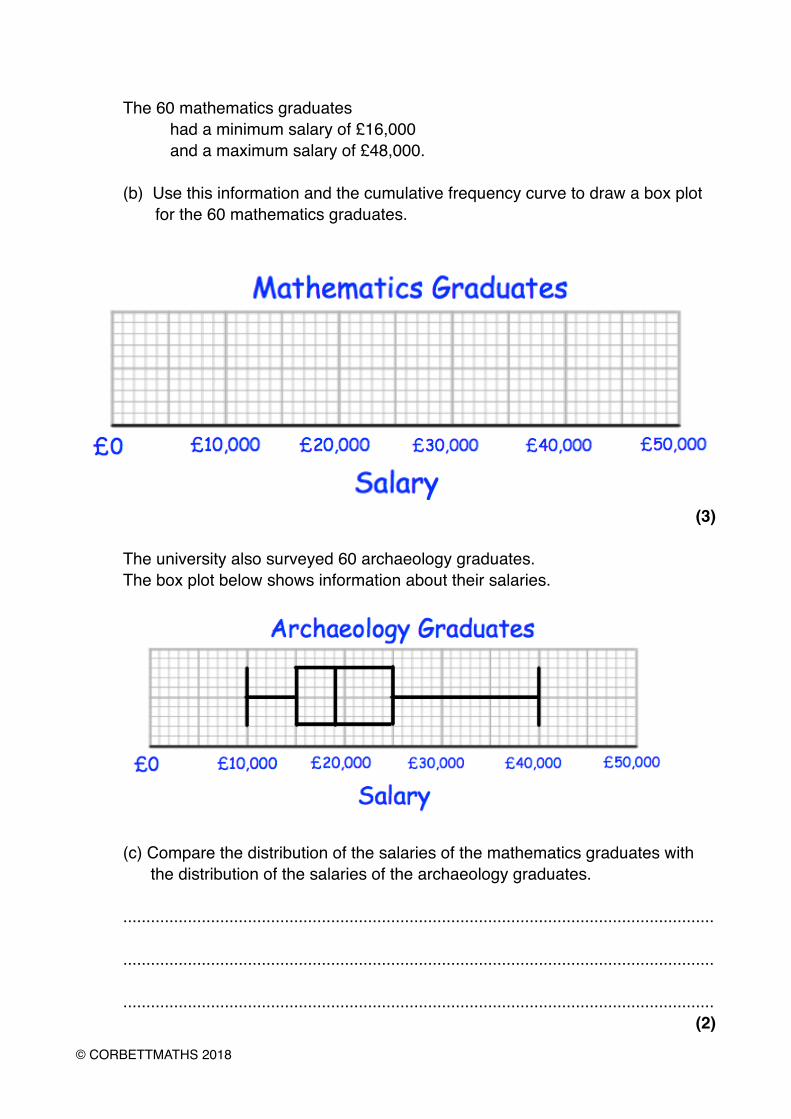
The 60 mathematics graduates had a minimum salary of £16,000and a maximum salary of £48,000.
(b) Use this information and the cumulative frequency curve to draw a box plot for the 60 mathematics graduates.
�(3)
The university also surveyed 60 archaeology graduates.The box plot below shows information about their salaries.
�
(c) Compare the distribution of the salaries of the mathematics graduates with the distribution of the salaries of the archaeology graduates.
................................................................................................................................
................................................................................................................................
................................................................................................................................(2)
© CORBETTMATHS 2018
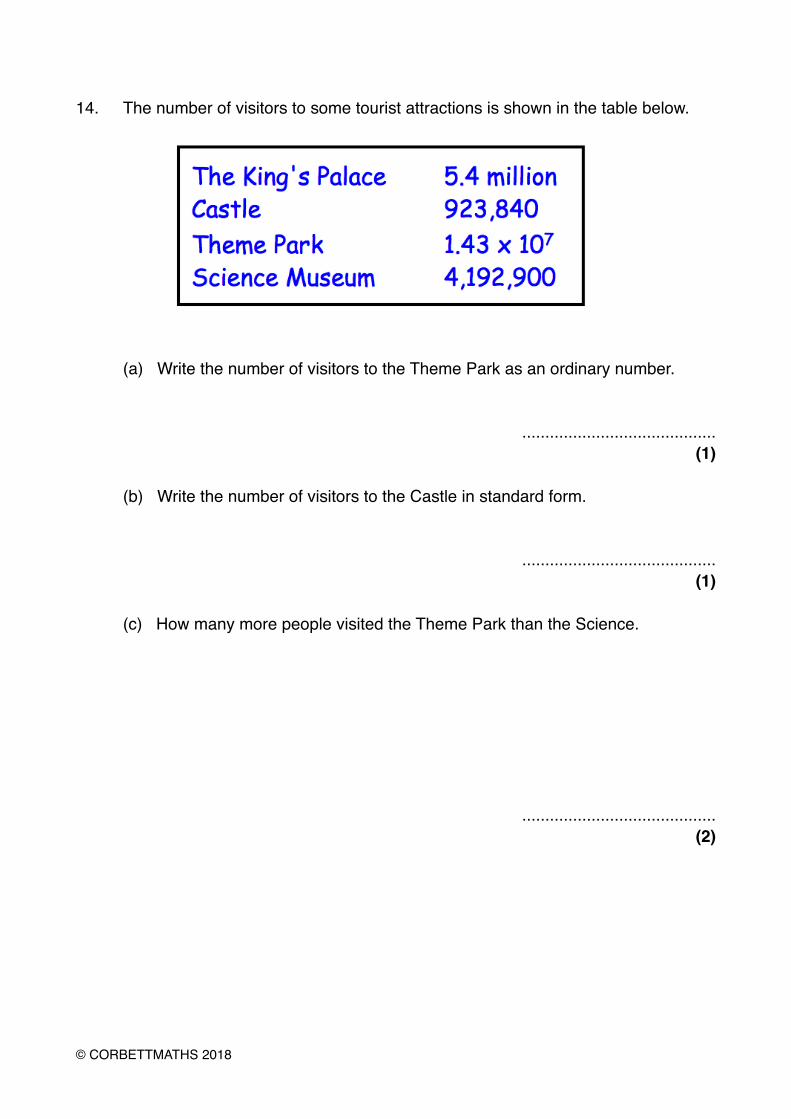
14. The number of visitors to some tourist attractions is shown in the table below.
�
(a) Write the number of visitors to the Theme Park as an ordinary number.
..........................................(1)
(b) Write the number of visitors to the Castle in standard form.
..........................................(1)
(c) How many more people visited the Theme Park than the Science.
..........................................(2)
© CORBETTMATHS 2018
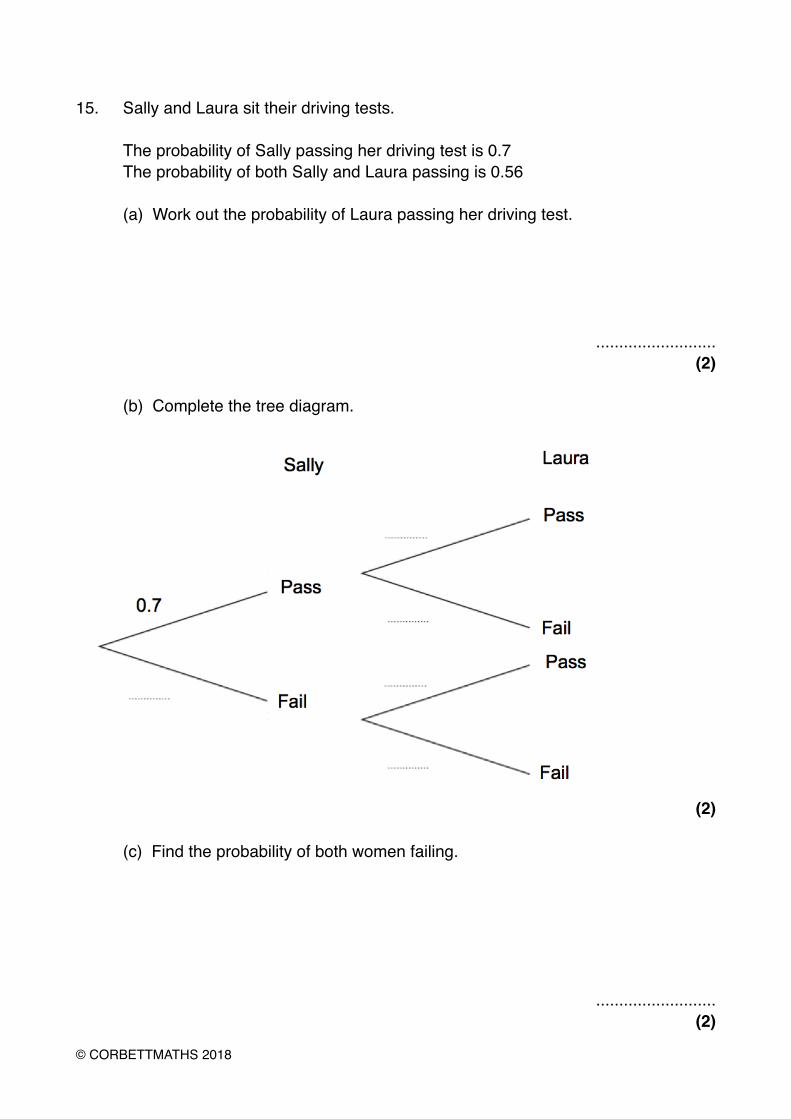
15. Sally and Laura sit their driving tests.
The probability of Sally passing her driving test is 0.7The probability of both Sally and Laura passing is 0.56
(a) Work out the probability of Laura passing her driving test.
..........................(2)
(b) Complete the tree diagram.
�(2)
(c) Find the probability of both women failing.
..........................(2)
© CORBETTMATHS 2018
16. Hannah wants to estimate the number of eels in a lake.She catches and rings 50 eels.She returns the 50 eels to the lake.Hannah then catches 200 eels.Of these 200 eels, 27 are ringed.
Work out an estimate of how many eels live in the lake.
..........................(2)
17. Expand and simplify (3 + √8)(4 + √2)
Give your answer in the form a + b √2 where a and b are integers.
.........................(4)
© CORBETTMATHS 2018
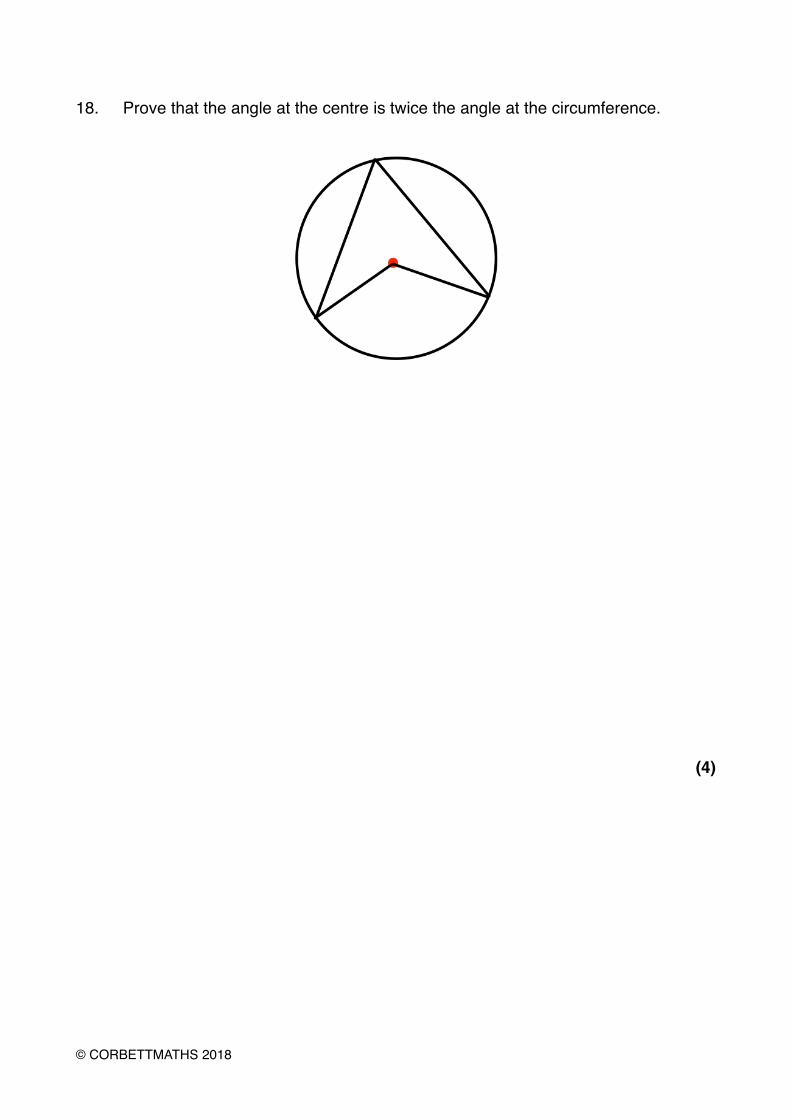
18. Prove that the angle at the centre is twice the angle at the circumference.
(4)
© CORBETTMATHS 2018
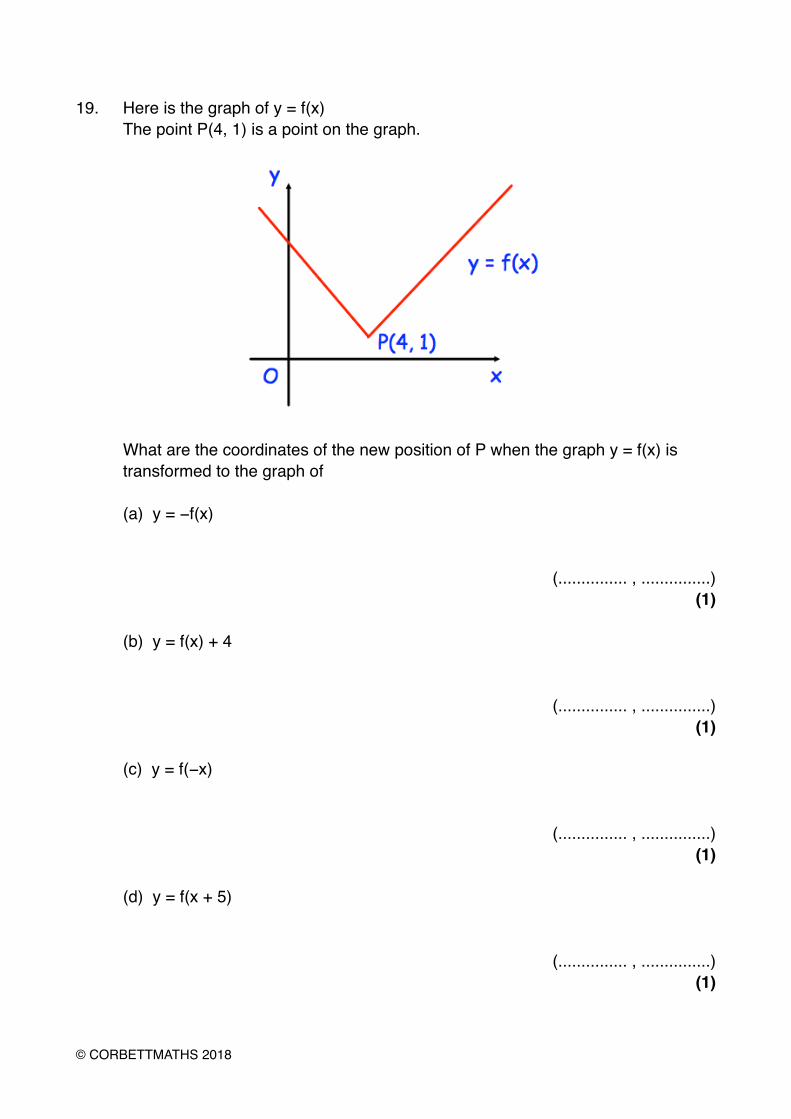
19. Here is the graph of y = f(x)The point P(4, 1) is a point on the graph.
�
What are the coordinates of the new position of P when the graph y = f(x) istransformed to the graph of
(a) y = −f(x)
(............... , ...............)(1)
(b) y = f(x) + 4
(............... , ...............)(1)
(c) y = f(−x)
(............... , ...............)(1)
(d) y = f(x + 5)
(............... , ...............)(1)
© CORBETTMATHS 2018
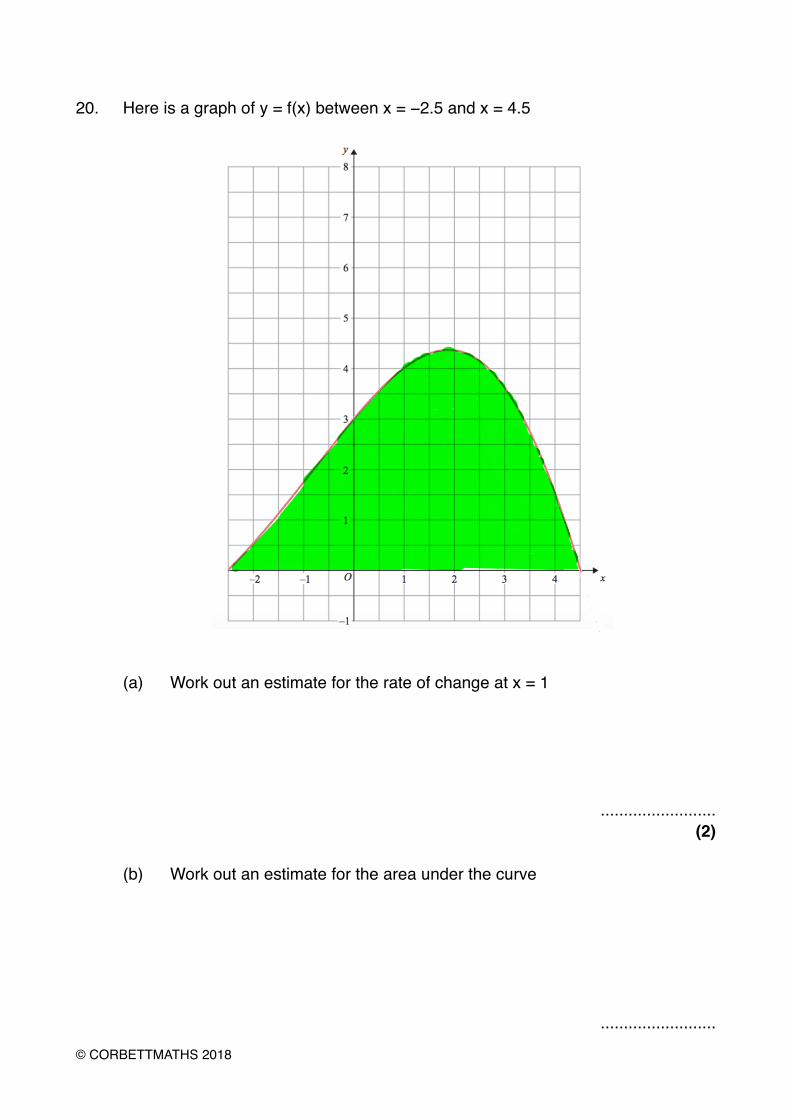
20. Here is a graph of y = f(x) between x = −2.5 and x = 4.5
(a) Work out an estimate for the rate of change at x = 1
.........................(2)
(b) Work out an estimate for the area under the curve
.........................
© CORBETTMATHS 2018
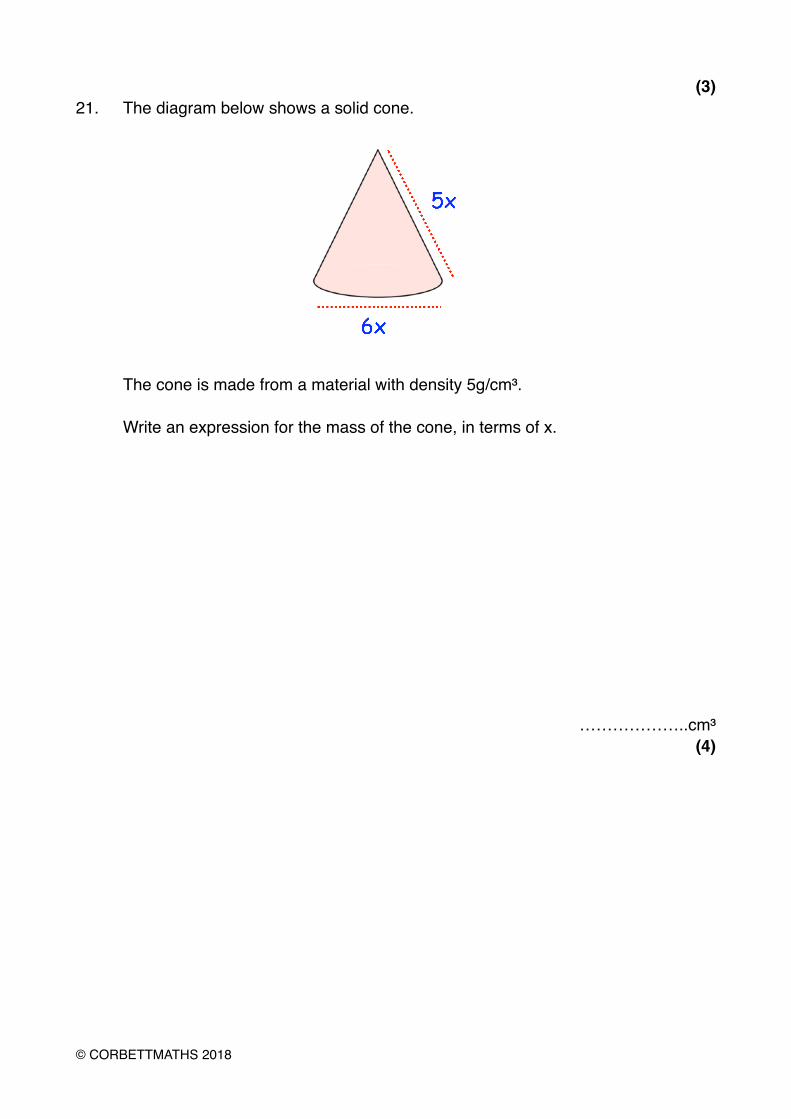
(3)21. The diagram below shows a solid cone.
The cone is made from a material with density 5g/cm³.
Write an expression for the mass of the cone, in terms of x.
………………..cm³(4)
© CORBETTMATHS 2018
22. Write x² + 10x + 7 in the form (x + a)² + b, where a and b are constants.
..............................(3)
© CORBETTMATHS 2018