Embed Size (px)
Citation preview

EdData II
Task Order 11: Gap Analysis: Education Information and Education Policy and Planning in Mozambique Final Report June 2011 EdData II Technical and Managerial Assistance, Task 11 Task Order Number EHC-E-11-04-00004-00 Strategic Objective 3 RTI Project No. 0209354.011 This publication was produced for review by the United States Agency for International Development. It was prepared by RTI International.

Task Order 11: Gap Analysis: Education Information and Education Policy and Planning in Mozambique Final Report June 2011 Prepared for Sandra Bertoli and James Dobson United States Agency for International Development Prepared by Luis Crouch RTI International 3040 Cornwallis Road Post Office Box 12194 Research Triangle Park, NC 27709-2194 RTI International is a trade name of Research Triangle Institute.
The authors’ views expressed in this publication do not necessarily reflect the views of the United States Agency for International Development or the United States Government.

ii Task Order 11: Gap Analysis: Education Information and Education Policy and Planning in Mozambique
Table of Contents Table of Contents ....................................................................................................................... ii Figures....................................................................................................................................... iv Tables ........................................................................................................................................ iv Illustrations ................................................................................................................................ v Abbreviations ............................................................................................................................ vi Executive summary ................................................................................................................... ix 1. Introduction and purpose, methodology ........................................................................... 1 2. Does policy and planning have a good underpinning in data and information? ............... 3
2.1 Access and completion ............................................................................................ 5 An illustration of value-added analysis of access data ............................................ 8
2.2 Quality.................................................................................................................... 11 3. The view from a systems perspective ............................................................................. 16
3.1 General notes on EMIS .......................................................................................... 17 3.2 Infrastructure monitoring ....................................................................................... 18
Policy priorities and indicators tracked.................................................................. 18 Data sources ........................................................................................................... 20 Discussion .............................................................................................................. 28
3.3 Teacher monitoring data systems........................................................................... 30 Policy priorities ...................................................................................................... 30 Data and information coverage on teachers ........................................................... 30 Discussion .............................................................................................................. 43
3.4 Information in budgeting, allocation, and expenditure tracking ............................ 45 Budgets, budget planning, and allocations ............................................................ 45 ESSP II ................................................................................................................... 45 Funding formulas ................................................................................................... 51 Expenditure ............................................................................................................ 52
3.5 Data use in enrollment and completion rates tracking and planning ..................... 58 Data Collection ...................................................................................................... 58 Calculation of access and completion indicators ................................................... 59 Data accuracy ......................................................................................................... 61 EMIS at the provincial and district level and decentralization .............................. 63
3.6 Data use in textbook planning and tracking textbook issues ................................. 63 3.7 Data for setting and tracking coverage of special programs .................................. 66 3.8 Examinations and learning assessments ................................................................ 69
School examinations .............................................................................................. 70 External learning assessments................................................................................ 71
3.9 Labor market data tracking .................................................................................... 72 Policy priorities and indicators tracked.................................................................. 72 Data tracked ........................................................................................................... 72 Data sources ........................................................................................................... 73 Discussion .............................................................................................................. 76
3.10 Data and information on and for governance ........................................................ 76 3.11 The role of civil society around data and indicator usage ..................................... 79 3.12 Summary of data systems: numerical rating .......................................................... 81
4. Action recommendations to USAID and the Government of Mozambique ................... 85 4.1 Some possible principles of assistance .................................................................. 85
Task Order 11: Gap Analysis: Education Information and iii Education Policy and Planning in Mozambique
4.2 Specific ideas ......................................................................................................... 86 Medium- and longer-term ideas ............................................................................. 86 Immediate ideas ..................................................................................................... 92
Appendix 1: Narrative field report, Nampula Province, Monapo and Nampula Districts ...... 96 Appendix 2: Narrative field report, Maputo Province, Matola District ................................ 103 Appendix 3: Discussion of grade 1 over-enrollment issue .................................................... 112 Appendix 4: EMIS year-start form ........................................................................................ 123 Appendix 5: EMIS year-end form ......................................................................................... 127 Appendix 6. Examples of teacher and teaching observation instruments ............................. 129 Appendix 7. List of persons interviewed, contact points ....................................................... 137 Appendix 8. List of documents consulted and compiled ....................................................... 144

iv Task Order 11: Gap Analysis: Education Information and Education Policy and Planning in Mozambique
Figures Figure 1. Grade-age specific enrollment ratios ............................................................... 10 Figure 2. Correlation between change in completion rates and change in
SACMEQ reading score .................................................................................. 13 Figure 3. Mozambique's position in reading relative to GDP per capita ........................ 14 Figure 4. Mozambique's position in reading relative to age dependency ratio ............... 14 Figure 5. Walking time, in minutes, to the nearest primary school, IAF 2008 .............. 26 Figure 6. Percentage of pupils unsatisfied with schooling for various reasons ............. 27 Figure 7. Main reasons for dropping out of school, IAF 2003 ........................................ 28 Figure 8. Expenditures in the sector for general education and higher education
(in volume and percentage), 2005–2009 .......................................................... 53 Figure 9. Pupil-teacher ratio at EP1, 2006 and 2010, and pupil-classroom ratio in
2010, per province ........................................................................................... 54 Figure 10. Net primary education enrollment rate for 6–12 year-old children by
wealth quintile of their families ....................................................................... 56 Figure 11. Benefit incidence: education expenditure allocation by quintile, 2003 ........... 56 Figure 12. Inputs in relation to outputs: per-pupil spending and retention rates,
2003.................................................................................................................. 57 Figure 13. Main budget and expenditure flows ................................................................. 58 Figure 14. Form for capturing enrollment and repeaters by age and grade ...................... 60 Figure 15. Form for capturing newly enrolled children specifically of age 6 ................... 61 Figure 16. Primary school-age population (age 6–12), Mozambique, 2000–2010 ........ 113 Figure 17. Primary pupil enrollment by grade and total, Mozambique, 2000–2010 ..... 114 Figure 18. Primary enrollment by grade vs. population of appropriate age,
Mozambique, 2010 ........................................................................................ 114 Figure 19. Primary grade 1 intake rate, Mozambique, 2000–2010 ................................. 115 Figure 20. Primary school repetition rates by grade, Mozambique, 2001–2010 ............ 119 Figure 21. Primary school dropout rates by grade, Mozambique, 2001–2010 ............... 120
Tables Table 1. Change in Mozambique SACMEQ scores ...................................................... 12 Table 2. Per capita budget allocations as a percentage of the national per capita
budget allocations, 2011 .................................................................................. 47 Table 3. Indicators showing the split between spending on level of education:
primary, secondary, and tertiary, 2006 ............................................................ 55 Table 4. Qualitative-numerical scoring: financial and resource allocations for
main expenditures (teachers and classrooms) .................................................. 81 Table 5. Qualitative-numerical scoring: financial and resource allocations for
special programs .............................................................................................. 82 Table 6. Qualitative-numerical scoring: access/completion for other enrollment-
related indicators .............................................................................................. 83 Table 7. Qualitative-numerical scoring: quality-related processes ................................ 83 Table 8. Qualitative-numerical scoring: learning outcomes .......................................... 84 Table 9. Population of school age, Mozambique (1,000s)........................................... 112
Task Order 11: Gap Analysis: Education Information and v Education Policy and Planning in Mozambique
Table 10. Grade-specific enrollment, Mozambique (1,000s) ....................................... 113 Table 11. Gross intake rate into grade 1, Mozambique ................................................ 115 Table 12. Grade 1 extra students beyond 100%, Mozambique (1,000s) ...................... 116 Table 13. Total un-enrolled susceptible to enrollment, Mozambique, 2004
(1,000s) .......................................................................................................... 117 Table 14. Likelihood of enrollment in grade 1, by age, Mozambique, 2003 ................. 117 Table 15. Repetition rates in Mozambique as implied by EMIS repeater reports ......... 118 Table 16. Dropout rates from the enrollment numbers and repetition rates .................. 120 Table 17. Age-grade enrollment data 2008 .................................................................... 121 Table 18. List of Documents Consulted and Compiled ................................................. 144 Table 19. Databases consulted and inspected, or documentary evidence gathered ....... 148
Illustrations Illustration 1. Not atypical infrastructural conditions............................................................. 16 Illustration 2. Gradient in infrastructure quality ..................................................................... 20 Illustration 3. Need for better teacher practices such as board-book coordination ............... 39 Illustration 4. Books seem nearly ubiquitous now ................................................................. 64 Illustration 5. Possible over-use of cursive and white space .................................................. 66 Illustration 6. Student-level reports in Matola ........................................................................ 78 Illustration 7. Comparative school data .................................................................................. 79
vi Task Order 11: Gap Analysis: Education Information and Education Policy and Planning in Mozambique
Abbreviations ADE Apoio Directo às Escolas (Direct Support to Schools, the school funding
formula and transfer system used to provide expendable materials purchasing funds to schools)
AGEPA Improving Education Management in African Countries (Amélioration de la Gestion dans les Pays Africains)
CNECE Conselho de Exames, Certificaçoes e Equivalencia (Council on Exams, Certification, and Equivalence)
DANIDA Danish International Development Agency
DE/DIPLAC Departamento de Estatística do DIPLAC (Department of Statistics of DIPLAC)
DHS Inquérito Demográfico e de Saúde (Demographic and Health Surveys, household surveys mostly oriented at health issues, but containing some education questions, funded largely by USAID)
DfID U.K. Department for International Development
DIPLAC Direcção de Planificação e Cooperação (Directorate of Planning and Cooperation)
DNEAP Direcção Nacional de Estudos e Análise de Politicas (National Directorate for Studies and Policy Analysis)
DNO Direcção Nacional de Orçamento (National Directorate of Budget)
DNP Direcção Nacional de Planificação (National Directorate of Planning)
DPEC Direcção Provincial de Educação e Cultura (Principal Directorate of Education and Culture)
ECD Early Care and Development or Early Childhood Development (one of many synonyms for pre-school or pre-Grade 1 education and care)
EdData II Education Data for Decision-Making Project (Washington, DC), under which the present document and mission were organized
EFA Education for All
EMIS Education Management Information System
EP Escola Primária
EP1 Escola Primária do 1º grau (1ª à 5ª classe) (1st cycle of Primary Education)
EP2 Escola Primária do 2º grau (6ª e 7ª classe) (2nd cycle of Primary Education)
EPC Escola Primária Completa (1ª à 7ª classe) (Primary Education)
EPDC Education Policy and Data Center (Washington, DC), contributing personnel and insight to the present document

Task Order 11: Gap Analysis: Education Information and vii Education Policy and Planning in Mozambique
EPT Educaçao para Todos (Education for All)
ESG Ensino Secundario Geral (General Secondary Education)
ESG1 Ensino Secundario Geral do 1º grau (8ª à 10ª classe) (1st Cycle General Secondary Education)
ESG2 Ensino Secundario Geral do 2º grau (11ª à 12ª classe) (2st Cycle General Secondary Education)
ESSP Education Sector Strategic Paper
FASE Fundo de Apoio ao Sector da Educação (Education Sector Support Fund)
FTI Fast Track Initiative
GDP gross domestic product
GER Gross Enrollment Ratio for any cycle (school enrollment of any age in a given cycle divided by target population of appropriate age for that cycle)
GIR Gross Intake Ratio
GIS geographic information system
GOM Government of Mozambique
GPS global positioning system
HR human resources
IAF Inquérito aos Agregados Familiares (Household Expenditure Survey)
ICT information and communication technologies
IFP Instituto de Formação de Professores (Teacher Training Institute)
INDE Instituto Nacional de Desenvolvimento da Educação (National Institute of Education Development), the key standards and assessments agency other than for end-of-cycle exams
INE Instituto Nacional de Estatística (National Statistics Institute)
INGO international nongovernmental organization
INSIDA Inquérito National de Prevalencia, Riscos Comportamentais e Informaçao sobre o HIV e SIDA em Moçambique
IOF Household Budget Survey
MAE Ministério da Administração Estatal (Ministry of State Administration)
MDG Millennium Development Goal
MEC Ministério da Educação e Cultura (Ministry of Education and Culture), various acronyms used depending on point in history
MEPT Movimento de Educação para Todos (Education for All Movement, a coalition of civil society organizations working towards Education for All goals)
MICS Multiple Indicator Cluster Survey (Inquérito de Indicadores Múltiplos in Portuguese), household survey financed by UNICEF containing data on various services and status of children
viii Task Order 11: Gap Analysis: Education Information and Education Policy and Planning in Mozambique
MINED Ministry of Education (since January 2010 when MEC split)
MMAS Ministério da Mulher e da Acção Social (Ministry for Women and Social Action)
MOE Ministry of Education (note that various names have been used through history, including MEC for Ministry of Education and Culture)
MOF Ministry of Finance
MTEF Mid-Term Expenditure Framework
MZN Mozambican Meticais (the national currency of Mozambique)
MPD Ministério de Planificação e Desenvolvimento (Ministry of Planning and Development)
NER Net Enrollment Ratio (school enrollment of appropriate age for a given cycle divided by target population of appropriate age for that cycle)
NGO nongovernmental organization
NIR Net Intake Ratio
OVC orphans and vulnerable children
PAF Performance Assessment Framework
PARPA Plano de Acçao para a Reducçao da Pobreza (Plan of Action for Reduction of Poverty) formerly PARPA (last A for “absolute”)
PCR pupil-classroom ration
PEE Plano Estratégico da Educação (Education Strategic Plan)
PTR pupil-teacher ratio
READ Russia Education Aid for Development (a trust fund at the World Bank)
SACMEQ Southern and Eastern African Consortium for Monitoring Education Quality
SAQEM System for the Evaluation of the Quality of Education in Mozambique
SDEJT District Services of Education, Youth, and Technology
SNE Sistema Nacional de Educaçao (Moçambique)
SWAp sector-wide approach
TA technical assistance
TVET technical and vocational education and training
UIS UNESCO Institute for Statistics
UN United Nations
UNESCO United Nations Educational, Scientific and Cultural Organization
UNICEF United Nations Children’s Fund
USAID U.S. Agency for International Development
ZIP Zona de Influência Pedagógica (School clusters)
Task Order 11: Gap Analysis: Education Information and ix Education Policy and Planning in Mozambique
Executive summary The purpose of this paper is to assess Mozambique’s education data and information systems’ ability to help formulate education sector plans and policies. Emphasis is put on existing policy over the last decade or so, with some attention to more recent trends. Thus emphasis is put on basic education, because basic education was the focus of policy attention in the most recent decade or two.
The concept of “data and information” that is used is purposively broad. It includes traditional educational statistics, budget and human resources (HR) information, and learner outcome data systems. We also pay particular attention to evidence on how to improve learning outcomes, given the shifting emphasis in Mozambique from planning for access to planning for quality and learning. It is important to note that the purpose of the exercise was not to analyze data as such, but to analyze data systems. In one or two areas we make a slight exception, because of the importance of the actual data analysis in determining what other data and data systems the sector needs to focus on.
The key information challenge in Mozambique is producing evidence that large, focused efforts to improve literacy instruction in the early grades are capable of success, and that this success can be scaled via well-modeled collaboration between schools, districts, teacher training institutes (Instituto de Formação de Professores [IFPs]), and the Ministry of Education. Specifically, the current use of time on task is very low, only partly because of too many shifts in the schools, but also because of lax time management in general. Instructional methods are weak because they do not focus on processing text, developing text-sound correspondences, and understanding. Learning materials are not optimally provided or designed. Mother-tongue instruction is improving, but can be improved even more, and there is a need to further prove it can work so that a backlash is not produced. And assessment is still not sufficiently practical or linked to teaching improvement. Information, broadly understood to include sharp evidence on these issues, based on scalable interventions on the ground, is greatly needed.
The methodology used included a large number (50–60) of key informant interviews, document reviews, and field visits to provinces, districts, and schools, including discussions with teachers and informal student assessment, as well as some interaction with actual information systems (Excel downloads of basic Education Management Information System [EMIS] data sets, for instance). Interviews went beyond the Ministry of Education (MOE), and included some visits to state and non-state actors.
In general, our finding is that Mozambique’s information systems, as well as Mozambique’s use of information for education policy, are considerably better than those typical of countries at Mozambique’s level of income per capita. But the systems are very uneven. We assigned judgment-based quantitative ratings to the various systems. For purposes of illustration, a “best practice” system would be at 100%, and one with little or no information production or use would be at 0%. We rated Mozambique’s basic information about access, enrollment, and completion to be at approximately 70% and information on budgets and finance to be at around 50% to
x Task Order 11: Gap Analysis: Education Information and Education Policy and Planning in Mozambique
60%. Those form the core of traditional “planning” information. They are the most linked to access and equity, and given Mozambique’s past policy emphases, it stands to reason that these systems would be the most developed. In addition, however, given Mozambique’s interest on special issues and on quality, it was important to have a look at the systems pertaining to special issues and also quality. Information for budgeting and planning of special programs was rated as being a little worse than for basic planning and budgeting (around 40%). Information usage for tracking and affecting learning outcomes and school quality can be judged to be at only around 20%–30%. This will need to be vastly improved if Mozambique is to put a growing emphasis on quality.
In the report, when we note that a system or sub-system is well-designed or works reasonably well, this is not to be taken to mean it cannot be improved. Our judgments are relative to what we have seen in other countries at similar stages of development as Mozambique, and in comparison with other sub-systems in Mozambique. Thus, the focus is on which sub-systems need relatively more work. We do not wish to create the impression that everything is working well. But some aspects are working much better than others (or, in some cases, the theoretical design of the system is good, even if the practice is not so good—but that is a start, as other countries do not have good systems even in theory), both in comparison to each other and in comparison to the same sub-systems in other countries similar to Mozambique.
Even the systems that are performing reasonably well can be improved, of course. Information use related to enrollment, access, and completion, as well as funding and equity, seems strong. However, data use is too “vertical”—information flows from schools and districts up to the ministry. In the context of decentralization, it could be more “horizontal,” with data being used at each sub-national government’s own level. More than a lack of data per se, the skills and habits needed to use data in a horizontal manner are lacking. Decentralized data systems would involve the use of simpler and more powerful data-driven funding formulas or algorithms that would encourage more horizontal discussion and less vertical negotiation, and would perhaps simplify planning. The merits of using simpler targeting data, for instance, could be considered, instead of a special type of data for each type of expenditure and/or special program, something like what the Direct Support to Schools (Apoio Directo às Escolas [ADE]) currently does.
Other routine management systems seem to provide some headaches, but many of these, at the same time, work well as compared to those in other low-income countries. An example would be the HR data systems. Even though there are complaints from key informants that the central level does not have as much information as it ought to, and in anything close to real time, these systems actually appear more robust than similar systems even in wealthier countries. For example, time between contracting and payroll seems reasonable, and payroll arrears and mistakes seem relatively rare. In addition, financial and HR systems seem to collaborate in identifying and weeding out “ghost” teachers. In this sense, ambition to create overly complex “integrated,” “online,” or “real time” systems needs to be carefully considered. A sense of optimality in data systems, as opposed to
Task Order 11: Gap Analysis: Education Information and xi Education Policy and Planning in Mozambique
“maximality,” is important. Furthermore, there is a temptation, which needs to be resisted, to try to resolve what are in essence managerial or governance flaws (or lack of clarity and enforcement in managerial procedures) with software systems. Repeated and ongoing failures to produce sophisticated integrated systems might signal that the problems are not in software engineering per se, but in governance and managerial relationships and accountability. These caveats apply to HR, but also to other systems, which could run the danger of becoming over-specified and over-elaborate. Another example might be attempts to overly develop geo-spatial systems for school mapping, when much of the needed non-school information cannot be geo-referenced anyway (thus limiting the advantage of geo-referencing the school data), or when much of the most-needed analyses are not geo-spatial. Simplicity or optimality, and whether the problems are managerial in nature rather than software-related, are principles that need to be at least considered, when impulse (or software salesmanship) suggests that more and more software and more and more software “integration” are the solution.
But the systems that most need improvement are those related to the tracking of school-based management, especially pedagogical-management processes, and most importantly, the monitoring of children’s learning outcomes and the production of feedback data for teachers based on such monitoring. Mozambique has the rudiments of measurement systems, but their use is insufficiently widespread, and there is very little linkage from measurement systems to teaching improvements systems. In addition, Mozambique has, to a degree unusual in lower-income countries, a well-articulated system of school visits, which seem well-related to in-service training and which do target the schools that perform least well. These systems appear well-engineered, in the flow chart or operations analysis sense: the right parts exist, and they are linked to each other in (more or less) the right ways. This is a good beginning, and, as noted, more developed than in most other lower-income countries. Furthermore, the ratios of support staff to teachers are reasonable (though the logistics and transport are often lacking). But, it would seem (given the evidence in children’s learning outcomes, given observed lessons, and given what key informants said about the quality of training in the IFPs) that the content of what flows in these well-engineered systems is not as good as it ought to be. In addition, much of the information on process is not systematized, even if school visits take place. The results of these are not systematically recorded or analyzed, and there are no useful and periodic surveys of pedagogical process management and content improvement. Most importantly, the results of learning assessments are not usefully disseminated or put into teachers’ hands in a powerfully leveraged manner. The experience of countries such as Kenya, where this has been reasonably well-accomplished, should be studied. This is an important area of needed improvement.
In the context of learning outcomes and quality, there seems to be an increasingly lively debate in Mozambique around the level of schooling quality, and whether this level has dropped in the recent past, either coincidentally or as an actual by-product of the expansion in access to schooling and through-put to grade 6. Our examination of the data suggest that while there has indeed been a drop in the average marks on international assessments such as the Southern and Eastern African Consortium for

xii Task Order 11: Gap Analysis: Education Information and Education Policy and Planning in Mozambique
Monitoring Education Quality (SACMEQ), these drops need to be put into context. First, surely some of the drop (perhaps as much as one third, according to informal analyses done by us) is due to a composition effect. The number of school children reaching grade 6 (and hence being tested), as a proportion of the population, has more than doubled in the last ten years. Thus, the children tested in the last round have a different socioeconomic provenance than the children in the previous round; they most likely have very different incomes, different linguistic habits in the home, and different pre-school exposure to print. Second, in terms of important “macro” (that is, non-pedagogical) determinants of learning outcomes, such as gross domestic product (GDP) per capita or the age-dependency ratio (the number of children per adult), both of which explain a good deal of variation in learning outcomes between countries, Mozambique was not a positive outlier in previous rounds of SACMEQ and is not a negative outlier in the present round. Stated differently, Mozambique achieves about as expected. Lastly, while there is indeed a somewhat negative relationship between rapid expansion of systems in Southern and Eastern Africa and the changes in average learning outcomes, Mozambique’s drop was much larger than can be explained via the increase in grade 6 completion or any other measure of through-put. Thus, it is hard to “blame” the expansion for the drop in average outcomes, except in the most definitional (and hence non-consequential) sense, namely a social composition effect. It therefore seems counterproductive to worry over-much about the drops in learning outcomes, and in particular it seems counterproductive to overly blame these drops on the expansion in coverage. It seems far more productive to worry about the fact that the levels are just so low, full stop, and have been low for a long time, especially if one considers that non-enrolled children were learning little if anything.
Indeed, recent studies, including informal confirmations by this assessment, show that even as late as grade 4 in poorer schools, and as late as grade 3 in “good” public schools (and, admittedly, in poorer regions), around half of children were unable to read at all. In our informal assessment, the only ones who could read were the best in the class as identified by the teachers, and most of these had tutors at home. None of the ones picked, randomly, by us could read. A related factor was that time usage in schools, compared to other countries, was among the worst analyzed. Lessons observed by us and others in Mozambique rely almost entirely on memory and oral recitation, even when the children have reading books literally in front of them, and so could easily focus on the text. In one classroom lesson we observed, none of the four children picked at random from the classroom were able to read the very passage they were practicing in that very lesson. Thus, if Mozambicans want to be productively worried about quality, the focus ought to be on the low levels of learning and the precursors of learning, and not on a fine analysis of, or an over-concern with, recent apparent drops in learning. A deep concern, rather than a panic-driven attitude toward quick fixes, ought to be the driver. In this context, a useful focus would be the foundations of the system, namely literacy and numeracy in the basic grades of the system. All this requires information usage in various senses.
First, it requires (1) the production of simple and powerful evidence that better teaching can dramatically improve outcomes; (2) information about what “better teaching” means in very concrete and simple ways; and (3) the creation of simple
Task Order 11: Gap Analysis: Education Information and xiii Education Policy and Planning in Mozambique
information based on assessments, including those of the National Institute of Education Development (Instituto Nacional de Desenvolvimento da Educação [INDE]) (or improved INDE assessments). Secondly, it requires conveyance of this information to teachers, via in-service and teacher support programs. Those programs, as noted, seem well organized from an administrative or operational point of view; but their pedagogical content needs to be vastly improved. This is why it is important to have a broad understanding of what “information” means if Mozambique is to deal with the quality issue. “Information” in this context means information about, and for, quality improvement; it must include information about evidence-based practice; and it must focus on the teacher (and parents) as the ultimate users.
To address these issues, the U.S. Agency for International Development (USAID) could provide a package of assistance that would include technical assistance (TA), capacity-building and training, and then demonstration of effective classroom practice in an area such as reading in the early grades.
The following areas can be envisaged as medium- and long-term (6 months to several years) areas of work:
1. Systems-level work to support decentralization, improved planning and data usage in planning, data usage per se, creation of demand for data, and EMIS—including capacity building in these key areas at any level (national, district, province)
2. Systems-level work with INDE to develop more practical yet rigorous ways in which assessment can be put directly at the service of teachers and learning
3. Systems-level work with various directorates in charge of general education, including inspections, teacher support and pedagogical direction, and IFPs, to improve the content of what are, currently, apparently successful mechanisms
4. School- and district-level work to provide massive and incontrovertible evidence of the utility of very focused improvements in teaching practice, certain materials provision, and so forth, to rapidly boost literacy in the early grades (This is the main part of the work that should be done.)
5. A certain amount of survey work that could be done immediately or very soon; a special purpose survey, perhaps, in collaboration with EMIS and/or the National Statistics Institute (Instituto Nacional de Estatítica [INE])
In addition, it would be possible for USAID to provide immediate assistance in a few areas such as (a) training to staff in MOE itself on how to access MOE data systems in simple and powerful ways for planning of, e.g., special programs; (b) demand-stimulation exercises such as the production of simple visualization tools that can be used to feed horizontal planning and data uses, or even improved data uses in planning-negotiation settings, possibly including simply tools for analyzing resource allocation (something like a funding formula approach); (c) assistance to the MOE in documenting the good systems that exist (but are very under-documented), and (d) improving links and cross-references to other data systems, especially those producing census and survey information, such as INE. Note that this last activity could link with activity 5 in the medium- and long-term list immediately above. Also

xiv Task Order 11: Gap Analysis: Education Information and Education Policy and Planning in Mozambique
note that activity 1 above could take on, or extend, (a) to (c) of the immediate-term activities listed in this paragraph.
Great care is recommended in designing these activities so that they are very flexible and client-oriented. The experience in use of TA is very uneven. However, senior key informants in Mozambique felt that if they are truly treated as clients, and if the TA is provided in such a manner that they have meaningful choice, they can make good use of such TA. Such TA should be ensconced in the MOE itself. School-level activity could be in a special unit.
Task Order 11: Gap Analysis: Education Information and 1 Education Policy and Planning in Mozambique
Task Order 11: Education Information and Education Policy and Planning in
Mozambique1 Final Report
June 2011
1. Introduction and purpose, methodology The purpose of this paper is to assess whether Mozambique (including cooperating partner agencies working in and on Mozambique) possesses, and can produce and use on an ongoing basis, sufficient information and data to underpin sound processes of policy- and agenda-setting, and to track and evaluate the execution of its own plans and policies in the education sector, but with emphasis on primary education.
Several caveats and ancillary purposes should be noted at the outset.
The concept of “data and information” used in this report is broader than is normally used. We certainly do not mean only “EMIS” and “education statistics,” though those are included. We will be referring to many types of numerical information, including HR data, budget and finance data, labor market information, and learner outcomes data, to mention a few. But in addition, we also consider manuals, communication of procedures down to schools, and administrative reports coming up from schools to be essential data and information, since it is this sort of information that allows for results tracking and for the actual running of the system. Procedural information and management process results information, even if qualitative, are all key informational aspects of how a system runs or does not run. Finally, information in the sense of scientific or quasi-scientific evidence (that is, more than anecdote but not needing as much rigor as fully randomized controlled trials) as to how things can run better is also considered.
Given such a broad purpose, it was impossible for the team to also analyze information or produce original information. And it was certainly not the purpose of the effort. As will be seen, and it is a conclusion that can be advanced, Mozambique is drowning in a large amount of quite analytical and data-intensive reports (often cooperating-partner-induced), and it is not clear that producing yet more data and analytical reports would have been useful. In a few cases, we do present actual data and analyses to illustrate certain points about the current usage and value-addition to the data, but almost always only as illustrations of key points about what further data
1 This paper was authored by Luis Crouch, EdData II Project, as team leader; Chris Cummiskey, EdData II project staff; HyeJin Kim, Education Policy and Data Center (EPDC); Helen Perry, EdData II consultant; and Ben Sylla, EPDC. The work was funded by the USAID EdData II and EPDC projects. The collaboration and accompaniment of Jim Dobson and Tess Robinson of USAID are gratefully acknowledged. Equally, the warmth, patience, and hospitality of Mozambican and development partner key informants are also acknowledged, in particular that of Dr Manuel Rego and Ilídio Buduia. Errors and omissions, which are inevitable in a paper of this type, are the responsibility of the authors and not of any institution with which they are associated.
2 Task Order 11: Gap Analysis: Education Information and Education Policy and Planning in Mozambique
may need to be produced and used. So, to summarize, because it is expected, normally, that a report on information and data would be full of data and tables, it is important to note that this report is not itself a data-analytical report, and there will be only a very small number of actual tables and graphics in it.
Another important caveat is the concept of “optimality” used here. It is our assumption that, in accordance with production theory, “maximal” is in fact nearly never optimal, and that providing data in ways that are below the technical maximum is the socially optimal thing to do, simply because taking a maximalist approach is extremely costly for any benefits garnered. Thus, unlike most reports produced by information technicians, our approach is to suggest restraint in how much and what types of data are produced, and to suggest that, in most cases, more value-addition and more dialogue, but without necessarily more production, might be the best way to go, though it will tend to require more skills and somewhat different approaches.
The client (beneficiary) for this study is the Government of Mozambique (GOM) and, ultimately, in an indirect way, the children of Mozambique (and their parents) as eventually productive citizens and workers, as well as the employers of skilled labor. However, because (to use principal-agent-client nomenclature) the motivating and paying principal for this study is USAID, and because USAID is assessing what investments it wants to consider making in Mozambique, the report does delve somewhat into suggestions for USAID on what sorts of activities it might make sense to consider for Mozambique. At the same time, because the optic of the report is “information,” these sorts of suggestions are couched in terms of information. It will certainly be recommended that there are certain key aspects of information systems support USAID may want to provide (not just EMIS, but managerial information in a broad sense). But USAID may also wish to consider school-level activities that support learning. Yet to the degree that USAID does engage in school-level activities that support learning, it is assumed that these are aimed at producing evidence and information on how things can be improved, and not at all at directly “fixing” education in Mozambique or even in a few districts. It is almost trite to say it, but it is worth repeating nonetheless, that this kind of practice is unsustainable from the point of view of both the developing and the industrialized countries.2 In other words, it is not assumed that as a cooperating partner, USAID will be interested in making up for the raw spending and implementation power that the GOM itself is best placed to deploy, but will be interested, instead, in producing and disseminating information and ensuring dialogue about good practices at school and also higher levels. In that sense, and consistent with our broad use of the term “information,” even school-level improvement activities will be assumed to be mostly about producing information.
2 We realize there is valid disagreement among development economists and other professionals on the possibility that actual spending transfers from the wealthier countries can directly alleviate poverty on the truly massive scale that is needed (the divide exemplified by the relative positions of Jeffrey Sachs and William Easterly, for instance). We believe it cannot, even if the amounts could be generated, because alleviating poverty requires excellent management, not just resources. But even if this were not true, it is simply politically impractical and unwise for the developing countries to assume that the resources will be generated (and hold themselves dependent to that idea) and that the taxpayers of the wealthier countries will ever contribute to the degree that would be needed.

Task Order 11: Gap Analysis: Education Information and 3 Education Policy and Planning in Mozambique
The rest of the report is organized into three large sections, each with various sub-sections.
First, the report looks at data and information from the point of view of Mozambique’s actual policies, policy by policy: do the data and information systems underpin the policies Mozambique has set out, and is setting out, for itself? We generally avoid making policy recommendations. The reasons for this are simple: first, we did not feel it was our mandate, and second, it seems as if the Mozambican state (its technocracy) is already largely overrun with policy suggestions coming from cooperating partners and from its own politicians. Thus, implementing existing policies or those already under active discussion, and the data systems needed to track those, seems like the highest priority, without a report like this one actually suggesting further new policy goals and further data needed to support them. We have attempted to be extremely disciplined about this. In fact, in certain areas we make recommendations regarding the possible need to simplify things (which also makes policy tracking easier and more transparent).
Second, the report turns from policy to systems and takes a look at all the data and information systems using a standard “good practice” systems perspective. That is, in comparison with what most countries do, in terms of systems, what is Mozambique doing? Our conclusions here are very similar to the conclusions in the previous section, but the optic is slightly different, as it reasons explicitly from a systems perspective.
Third, and last, the report makes some specific recommendations for areas in which USAID may wish to support the Mozambican education system in terms of information, keeping in mind that even school-level assistance can be seen (and should be seen) as largely about producing information, producing demonstration effects, and promoting social dialogue about improved practice, all leading to better and more sustainable results in the management of Mozambique’s education sector.
The report used key informants and group discussions at all levels, from the highest to the child (see Appendix 7 for a list of interviewees and contact points). In addition, the report writers read key literature on Mozambique (see Appendix 8 for a list of documents reviewed). We attempt to offer a fresh perspective on the issues rather than simply repeat what other documents say.
2. Does policy and planning have a good underpinning in data and information? The answer to the question above is a qualified “yes.” Yes, in the sense that many key aspects work; many are well-designed as systems and are (in design even though, often, not in practice) based on sound operations analysis. But this is a qualified “yes” because these systems are not as operational, in practice, as could be possible, and in some areas are nearly completely missing.
This section analyzes each key policy area and highlights the steps that would be needed to improve the use of information in the setting and tracking of key policies.

4 Task Order 11: Gap Analysis: Education Information and Education Policy and Planning in Mozambique
Rather than analyze the policies in each 5-year plan, we take the current set of policies that have accumulated over the past two 5-year plans and look at the ones that are likely to be added in the next plan, currently under elaboration. And, in each case, we evaluate whether the information and data systems in place are sufficient to underpin policy-making and policy tracking/evaluation, with an emphasis on simplicity and optimality rather than maximization.
A general comment on goals, with implication for information systems and processing:
The current education policy environment in Mozambique has a number of goals that can be characterized, as over-ambitious. Many of them are slight variants of each other. None of these goals is undeserving, nor would one imply they need not be tracked. However, as analysts, we have the distinct impression that the stakeholders that stand behind each goal/area would like to constantly raise the level at which attention is paid to these indicators. This is unrealistic and in fact is probably bad management.
To take one example, the Memorandum of Understanding of the Education Sector Support Fund (Fundo de Apoio ao Sector Da Educação [FASE]) has a bewildering number of indicators, many of which are only slight variants of each other, can be analytically and relatively inferred from each other, or perhaps should be more a matter for management analysis rather than for real policy tracking. For instance, it is unclear why it is important to calculate, discuss, and hold as a focus of policy attention all of the following: net enrollment ratios, net intake (or grade 1 enrollment of 6 year olds), dropout rates, and completion rates. While these may serve slightly different purposes, they are all quite related to each other. For example, if intake, repetition, and dropout were appropriate, the net enrollment rate would automatically improve. If the latter is not what it should be, looking into its detailed determinants seems more of a technical issue, not a broad policy issue. There seems to be an inappropriate hierarchy (or lack of hierarchy) in the use of indicators. Further, many of these are process factors, many of them are outcomes, many are inputs, and so on. As noted, while all of these should have some attention devoted to them, the attention can be managerial and can be a matter of process analysis, not something that needs to rise to the level of a policy memorandum. One wonders whether the level of indicators being used in Mozambique is maximal rather than optimal, or has the right hierarchical structure, where there are a few indicators that really pertain to outcome and are the issues of policy attention, and then there are indicators that determine the higher-level ones, and those should be, in turn, a matter of managerial attention.
Thus, one suggestion is to attempt to radically simplify the number of indicators tracked at the highest level in a hierarchy, perhaps by having a “budget” of indicators, and thus forcing priorities among them and relegating the rest to process or managerial indicators that are tracked as part of management. It is not clear what the solution is, but it is clear that it is unreasonable to expect the top levels of a system to manage (or govern) to so many indicators.
In what follows, we first take the two most important “groups” of policies, namely access and completion, and then learning quality or outcomes, and explain at some
Task Order 11: Gap Analysis: Education Information and 5 Education Policy and Planning in Mozambique
length the options and possibilities for data tracking of these highest-level goals. In a third section, we take a quick inventory of some of the more specific goals and whether data systems are up to the task of tracking those.
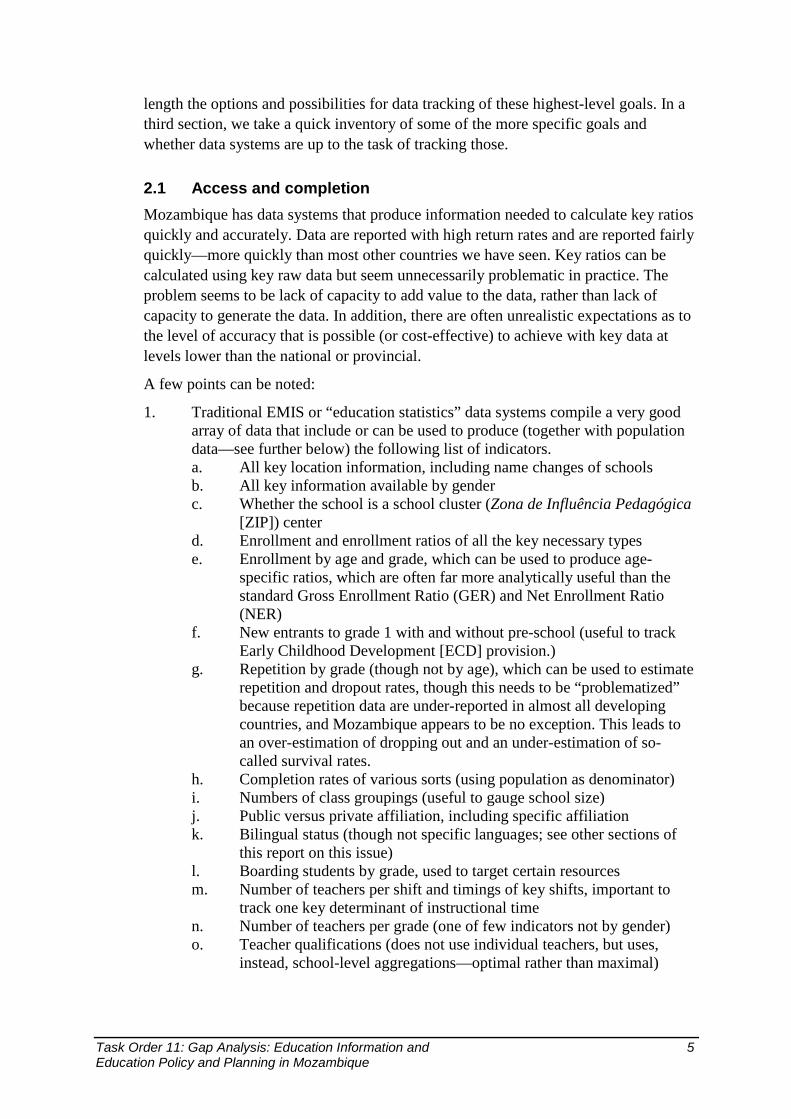
2.1 Access and completion Mozambique has data systems that produce information needed to calculate key ratios quickly and accurately. Data are reported with high return rates and are reported fairly quickly—more quickly than most other countries we have seen. Key ratios can be calculated using key raw data but seem unnecessarily problematic in practice. The problem seems to be lack of capacity to add value to the data, rather than lack of capacity to generate the data. In addition, there are often unrealistic expectations as to the level of accuracy that is possible (or cost-effective) to achieve with key data at levels lower than the national or provincial.
A few points can be noted:
1. Traditional EMIS or “education statistics” data systems compile a very good array of data that include or can be used to produce (together with population data—see further below) the following list of indicators. a. All key location information, including name changes of schools b. All key information available by gender c. Whether the school is a school cluster (Zona de Influência Pedagógica
[ZIP]) center d. Enrollment and enrollment ratios of all the key necessary types e. Enrollment by age and grade, which can be used to produce age-
specific ratios, which are often far more analytically useful than the standard Gross Enrollment Ratio (GER) and Net Enrollment Ratio (NER)
f. New entrants to grade 1 with and without pre-school (useful to track Early Childhood Development [ECD] provision.)
g. Repetition by grade (though not by age), which can be used to estimate repetition and dropout rates, though this needs to be “problematized” because repetition data are under-reported in almost all developing countries, and Mozambique appears to be no exception. This leads to an over-estimation of dropping out and an under-estimation of so-called survival rates.
h. Completion rates of various sorts (using population as denominator) i. Numbers of class groupings (useful to gauge school size) j. Public versus private affiliation, including specific affiliation k. Bilingual status (though not specific languages; see other sections of
this report on this issue) l. Boarding students by grade, used to target certain resources m. Number of teachers per shift and timings of key shifts, important to
track one key determinant of instructional time n. Number of teachers per grade (one of few indicators not by gender) o. Teacher qualifications (does not use individual teachers, but uses,
instead, school-level aggregations—optimal rather than maximal)

6 Task Order 11: Gap Analysis: Education Information and Education Policy and Planning in Mozambique
p. Classrooms by construction type, a rough approximation of infrastructural quality—includes sessions that meet “under a tree” or “in the open air”
q. Workers at school other than teachers r. Numbers of pupils with key textbooks, by grade (for first five grades
only), importantly including mother tongue s. Number of teachers with teacher manuals, including mother tongue t. Orphans (father, mother, and double) u. Reasons for major teacher absenteeism the previous year
2. In addition, at the end of the year the following data are collected: a. Number of students reaching the end of the year by grade b. Number sitting for school exams c. Numbers passing d. Average mark by subject and grade e. Number of teachers at the school by end of year, by broad area of
training f. Causes of student leaving, though it is unclear how inter-year causes
are established, so it is presumed this refers to within-year dropout. Since learners may re-enroll immediately the following year, but on the other hand may disappear between years, it is important not to consider these data as providing a measure of real dropout. This measure can either under-state or over-state real dropouts.
Appendices 4 and 5 show the forms used for these purposes for the primary education level. Forms for other levels do not differ by much.
To calculate key ratios, population data can be used. The INE produces population projections and interpolations according to what appear to be quite sound methods, to the limit of data and enumerator quality. INE has, and has had, assistance from highly skilled counterpart demographers in other countries, including very large teams of such counterparts. The population data provided include the following:
3. Population census data for 1997 and 2007
4. Interpolations down to province and district level by single calendar year and, upon request, by single year of age
5. Projections down to province and district level by single calendar year and five-year age groups and, upon request, by single year of age
6. National and provincial population projections are made using the standard “components” method, which requires making projections or assumptions of fertility, mortality, and migration, and using standard, reliable software. Problems arise with the fact that migration assumptions are notoriously unreliable in almost all developing countries, and particularly in countries that have had serious conflict in the recent past and/or are subject to strong migratory patterns (e.g., not only the usual rural-to-urban patterns but large migratory patterns due to push-pull effects from other large economies such as South Africa). Inconsistencies and irregularities in sub-national projections are to be expected and need not cause undue alarm, as long as approached analytically and carefully.

Task Order 11: Gap Analysis: Education Information and 7 Education Policy and Planning in Mozambique
7. The district-level projections are not made using a components method. Instead, each district’s proportion of provincial totals by five-year age groups is calculated for 1997 and 2007, and then extrapolated forward using the components-based population projection.
8. In all of this, it is wise to prevent undue alarm due to data issues and to be realistic in data usage. Two qualifications or notes can be made. a. First, even serious and careful analysts differ in their projections, and,
thus, it is wise to note that all projections are subject to error. Sensitivity to this factor needs to be stressed and inculcated. If possible, on occasion, error or confidence bands should be shown. The United Nations (UN), for instance, provides high, medium, and low (as well as constant-fertility) projections for Mozambique. The U.S. Bureau of the Census also provides population projections for Mozambique. In the latest projections, even just 10 years out, the difference between the high and low variants within the UN projection is 6%, and the difference between the U.S. Bureau of Census and the UN’s medium variant is also 6%. This variation can make a huge difference to the calculation of NERs and GERs, but this indicates a need for care, not alarm.
b. Second, errors accumulate in the data the further down one goes in the political structure of the country. District data are likely to have quite large error bands. Furthermore, because there is so much cross-district enrollment in countries where enrollment rates are low and schools are scarce (and where enforcement of residential or zoning policies is lax, or the policies do not exist at all), the numerator and denominator do not apply to the same jurisdictions. Thus, one district may appear to have an 80% enrollment ratio, because its children attend school in a neighboring district that may then appear to have a 120% enrollment ratio (either gross or net—does not matter), when both in fact have 100%. Reference to household survey data cannot help in this regard, because it is too costly to conduct household surveys with reasonable confidence intervals down to the district level.
Because of these issues, it is not recommended to calculate district-level enrollment ratios of any sort, especially if they are likely to be used for accountability or for political posturing (either to take credit or give blame). But that raises the issue of how to track and plan and target. The solution or recommendation is that it is not necessary to take a central-planning approach or top-down accountability approach, but instead devolve accountability for making sure all children are enrolled to as local a level as possible, and ensure the use of clever strategies for identifying and enrolling children out of school (such as some of those pioneered by the United Nations Children’s Fund [UNICEF] in Kenya, where children are used to identify other children out of school and to get them into school). In any case, it is unlikely that the district is an appropriate place from which to enforce enrollment and attendance. Thus, if top-down accountability is to be used, it should be used very lightly with respect to calculated ratios, and/or should instead focus on enforcing those enrollment and attendance procedures that are used by the districts and all the way down to schools’ catchment areas. This is a “responsabilization with decentralization” and “accountability-for-process” approach rather than a data-planning approach, but it

8 Task Order 11: Gap Analysis: Education Information and Education Policy and Planning in Mozambique
seems like the most useful approach for the near future, given the large uncertainty over both numerator data (enrollment—because of cross-border enrollment) and denominator (population—because of migration uncertainties). Localized approaches to statistical monitoring can also be used and then aggregated.
In addition to administrative and population projections data, the system has data from household surveys, in particular the Demographic and Health Survey (DHS), funded by USAID, and the Multiple-Indicator Cluster Survey (MICS), funded and coordinated by UNICEF. The EMIS unit at the MOE (or other bodies related to the MOE) has analyzed these surveys and finds general agreement among these data sources.
There is some evidence, though mostly anecdotal or small-sample, that the key data reported by the EMIS system are reasonably accurate. According to EMIS itself, however, more quality checks are warranted because of incentives to misrepresent data built into the system. For instance, given the policy of automatic promotion, it is likely that repetition data are under-reported. In addition, repetition data tend to be under-reported because young children often attend in a very desultory manner, especially in grade 1, as is common in almost all poorer countries. If children barely attend and then re-enroll in the same grade the next year, they are often not classified as repeaters (since the question of whether they were even “in” the grade has only a highly ambiguous answer, unlike the unambiguous answer such a question would have in developed countries where attendance is rather strictly enforced), even if, from a resource allocation point of view, they are in fact repeaters (since they appear twice as new enrollees in the same grade). In addition, the ADE uses an enrollment-driven funding formula, which creates an incentive to exaggerate enrollment. Principals may not wholly invent children, but they may encourage overly young or overly old students to enter or stay, with the expectation of repeating, but do not report them as repeaters. Note that all the data in the appendices and in this paper overall, with respect to the issue of odd enrollment patterns, refer to Mozambique itself. The pattern, however, is quite common in many other countries.
An illustration of value-added analysis of access data There seems to be an insufficient appreciation of the use of simple but powerful value-added applications of simple enrollment and population data, especially those that can link some of the most important issues of enrollment to those that pertain to quality, such as the development of the key grade-transition “survival” skills that can ensure smooth flow out of the early grades, such as reading. The following discussion is meant to be illustrative only, of the sorts of value-added applications that can be used to “problematize” certain issues, and is not meant to provide an authoritative treatment of the issue. The discussion also illustrates data reliability issues.
The assertion to be made here, as an illustrative matter, is that repeater rates are much higher than reported (and certainly much higher than is the policy), that this is linked to poor quality of learning in the earliest grades, and that value-added analysis and comparison of enrollment and population data can be “milked” to dramatically make this point.

Task Order 11: Gap Analysis: Education Information and 9 Education Policy and Planning in Mozambique
Figure 1 shows the ratio of enrollment in each grade to the population appropriate to that age. The figure shows that by 2010, there were 80% more children enrolled in grade 1 than there were in the population of 6 year olds. It is frequently asserted that these kinds of comparisons are not appropriate, because there is little matching of appropriate age for grade to be expected. But that is irrelevant if one thinks in terms of cohorts. If the system is perfectly efficient (no repeaters and no dropouts), the enrollment will match almost exactly the population of appropriate age, even if enrollment takes place a few years early or late and/or even if the initial intake (and thus the enrollment) is distributed across a few age groups. That is because any enrollee, if the system is “perfect,” can only pass through each grade once. Thus, other than a slight lag or maladjustment due to population growth, a grade-for-age profile in a “perfect” system should be essentially flat at 1.0 (or 100%). If the population is growing fast and if there is late intake and thus late enrollment, then naturally the ratios will be slightly less than 1. If the population is growing fast and if there is early enrollment, then the ratios may be a little higher than 1. If there is both early and late enrollment of equal amounts, then the two will balance, and once again the ratios of enrollment to population will be very close to 1. Thus, differences between Mozambique’s profile and a flat profile at 1 invariably signify problems. In Mozambique, the profile has the highest intercept and one of the steepest slopes we have ever seen, and, more significantly, became higher (though a little less steep) over time in the last 10 years.
It is often, but usually erroneously, asserted that the high ratio of enrollment to population in grade 1 represents late enrollment and catch-up in systems that have been reaching out to segments of the population that previously had no schooling. This is certainly possible in a system that is suddenly expanding to reach segments of the population that previously literally had no schooling. In these cases, two or more age groups may enroll at the same time in grade 1, and one could easily expect ratios as high as 2. But this cannot last a very long time, because once the previously un-enrolled groups are enrolled, they cannot continue to come into grade 1. In Mozambique over-enrollment in grade 1 has not only been going on for a long time (at least since 2000, and most likely even earlier), but it has become worse. Appendix 3 shows a detailed discussion of this issue. The “proof” of the issue can be summarized by saying that we estimate that in 2005 there were approximately 1,000,000 children who were un-enrolled, who had never enrolled (by netting out those likely to have been dropouts from previous years), and who had some likely propensity to enroll (a propensity greater than 2%, based on age). But given the very low repetition rate in 2005 in grade 1 (only 8%), the very high intake rate (148%), and the fact that there were only 1,000,000 of school-entry age, if the system was truly only over-enrolling never-enrolled children, then it was enrolling some 480,000 over-aged, never-enrolled children. But clearly, if there were only 1,000,000 or so never-enrolled children susceptible to enroll, then this catch-up could not last more than 2–3 years. Yet five years later, the over-enrollment in grade 1 is actually considerably higher.
In all likelihood this represents an enormous amount of unofficial and unreported repetition, which may have various causes, the most likely one being that children
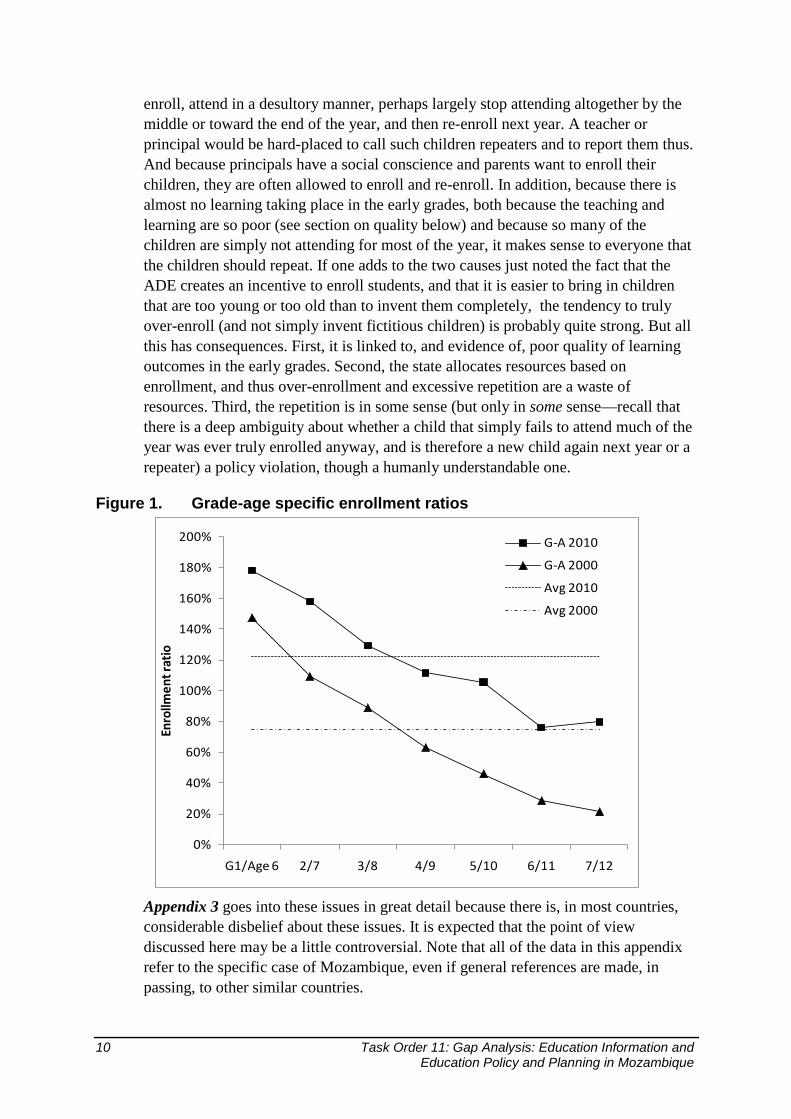
10 Task Order 11: Gap Analysis: Education Information and Education Policy and Planning in Mozambique
enroll, attend in a desultory manner, perhaps largely stop attending altogether by the middle or toward the end of the year, and then re-enroll next year. A teacher or principal would be hard-placed to call such children repeaters and to report them thus. And because principals have a social conscience and parents want to enroll their children, they are often allowed to enroll and re-enroll. In addition, because there is almost no learning taking place in the early grades, both because the teaching and learning are so poor (see section on quality below) and because so many of the children are simply not attending for most of the year, it makes sense to everyone that the children should repeat. If one adds to the two causes just noted the fact that the ADE creates an incentive to enroll students, and that it is easier to bring in children that are too young or too old than to invent them completely, the tendency to truly over-enroll (and not simply invent fictitious children) is probably quite strong. But all this has consequences. First, it is linked to, and evidence of, poor quality of learning outcomes in the early grades. Second, the state allocates resources based on enrollment, and thus over-enrollment and excessive repetition are a waste of resources. Third, the repetition is in some sense (but only in some sense—recall that there is a deep ambiguity about whether a child that simply fails to attend much of the year was ever truly enrolled anyway, and is therefore a new child again next year or a repeater) a policy violation, though a humanly understandable one.
Figure 1. Grade-age specific enrollment ratios
Appendix 3 goes into these issues in great detail because there is, in most countries, considerable disbelief about these issues. It is expected that the point of view discussed here may be a little controversial. Note that all of the data in this appendix refer to the specific case of Mozambique, even if general references are made, in passing, to other similar countries.
0%
20%
40%
60%
80%
100%
120%
140%
160%
180%
200%
G1/Age 6 2/7 3/8 4/9 5/10 6/11 7/12
Enro
llmen
t rat
io
G-A 2010
G-A 2000
Avg 2010
Avg 2000

Task Order 11: Gap Analysis: Education Information and 11 Education Policy and Planning in Mozambique
If over-enrollment in grade 1 due to repetition (rather than late or catch-up enrollment) is the case, then this represents, potentially, a great waste of resources. It also represents a link to the issues of quality and early-grade learning, touched upon in the next section and in many other sections of this report.
Whether one considers this a waste of resources is a matter of perspective and can be tied to the whole issue of ECD provision. If over-enrollment in grade 1 is as high as 70% or so, one could argue that this is not a “waste” but instead that Mozambique is already paying for ECD without realizing it, and providing for an ECD that is inappropriate and of low quality. In that sense, the costs of “future” ECD could be over-estimated (as it is already, in some sense, provided), and it is more a matter of forcing the system to “recognize” that it already pays for ECD and to “officialize” this in some sense. This would include making curricular adaptations that prepare children for grade 1 in a more direct fashion—since the children are already there and are currently repeating grade 1 as a substitute for the lack of ECD.
2.2 Quality Quality is an entirely different matter, in terms of the system’s ability to measure, track, and react. The system does not really have the right indicators yet, or does not use them, to set, monitor, and enforce quality-oriented policies.
There are two separate issues. First, there is not enough information and information use on quality. For instance, there is not enough information tracked about school processes, which would be analyzed at district and national levels as a way to provide input to schools. Similarly there is not enough agile use of learning outcomes information with which to provide feedback to teachers on instructional practice.
This section does not delve into those issues. However, it provides an overall view of the problem of quality, so as to motivate further discussion on the issue of how to use information to address the problem of quality, later on in the report.
The evidence that there are significant problems in quality (proxied by learning outcomes) and that these start early is hard to ignore. There is also some evidence that the quality problem has gotten worse, but that needs to be put into context. To motivate the discussion of quality, in general, and to motivate a sense of why a focus on quality is so important, but at the same time to put things into perspective, we will review what evidence exists that one can quote, and then “problematize” the issue of bringing further data to bear.
In the first place, the most “objective” and rigorous indicator of quality available, namely the SACMEQ results, suggest that learning outcomes have come down on average. This reinforces the conventional notion that quality has gone down.
However, one has to ask oneself whether this apparent decline in quality is a composition effect or not. That is, are children of the same social groups in 2007 learning more, less, or about the same as equivalent children were learning in 2000? It is true that the scores for the children in the lower strata dropped a lot between 2000 and 2007, as Table 1 shows.

12 Task Order 11: Gap Analysis: Education Information and Education Policy and Planning in Mozambique
Table 1. Change in Mozambique SACMEQ scores
Reading Mathematics
2000 2007 2000 2007
Poorest 25% of test takers 511 452 528 471
Wealthiest 25% of test takers 523 522 533 511
Average 517 476 530 484
Change −41 −46
The table suggests that there was no composition change, since scores dropped “within” each income group, and dropped a lot for the poorest. But this would be incorrect. Since the Mozambican education system was in very fast expansion at the time, the wealthiest 25% of the test takers were a less wealthy top percentage of the population, and the poorest 25% of the test takers were very certainly a completely different population in 2007 than in 2000. In fact, the percentage of children making it to grade 6, and therefore sitting for the SACMEQ test, more than doubled between 2000 and 2007, from 33% to 72%—it grew by an astounding 120%. The wealthiest of test takers in both 2000 and 2007 were, with enormous probability, from a segment of the population that would have been enrolled in 2000. Since in 2000 only 33% or so of the population was in grade 6, and these were very much from the top of the income distribution, it stands to reason that the difference in scores between the wealthiest 25% of test takers, and the poorest 25% of test takers would not be that much: even the bottom 25% of test takers were in the top third of society, more or less. But in 2007 the situation had changed a great deal. Given that 72% or so of the right age group were now in grade 6 (as opposed to only 33% in 2000), the social distance between the wealthiest 25% of test takers and the poorest 25% of test takers was now much larger. However, approximate calculation (too detailed to share here) shows that perhaps around only around one-third of the decline in the average test scores was due to this sort of composition effect.
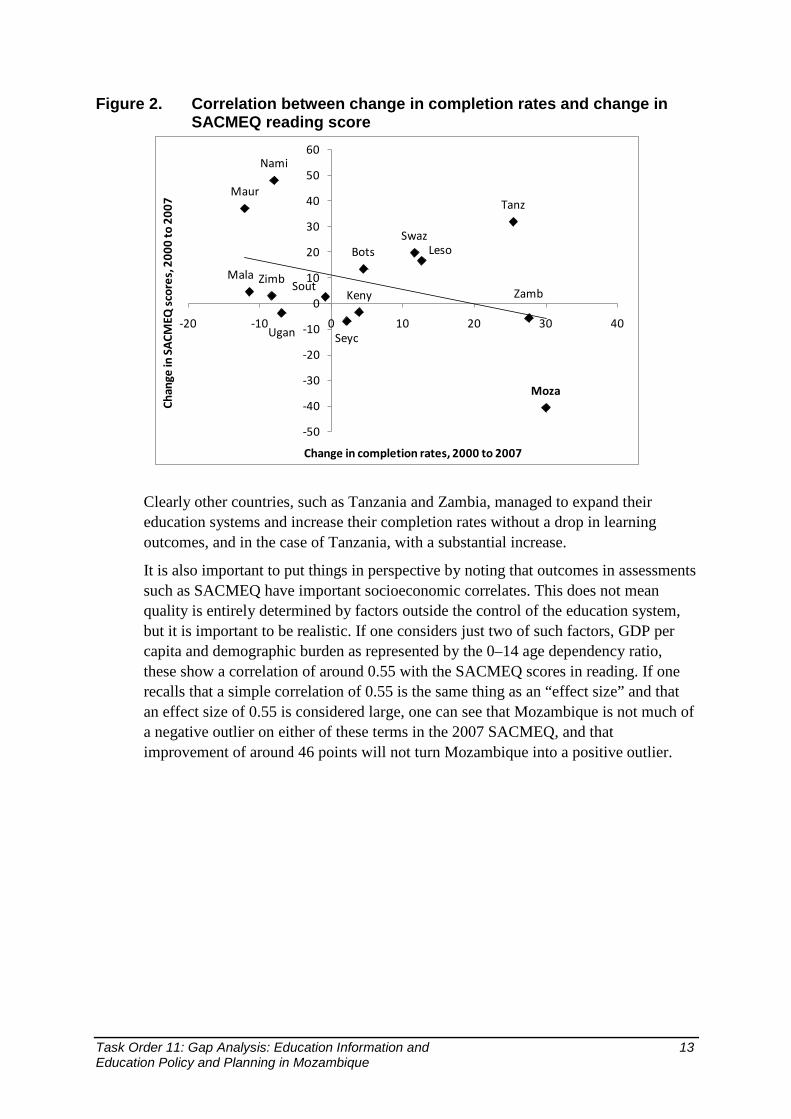
The other possibility is that scores dropped so much because completion rates increased so fast. An analysis across SACMEQ countries does indeed reveal a correlation of 0.37 (reasonably strong for cross-sectional comparisons of this sort) between growth in completion rates between 2000 and 2007 and decline in SACMEQ scores. However, Mozambique’s decline in scores is larger than can be accounted for by this correlation, as Figure 2 suggests.
Task Order 11: Gap Analysis: Education Information and 13 Education Policy and Planning in Mozambique
Figure 2. Correlation between change in completion rates and change in SACMEQ reading score
Clearly other countries, such as Tanzania and Zambia, managed to expand their education systems and increase their completion rates without a drop in learning outcomes, and in the case of Tanzania, with a substantial increase.
It is also important to put things in perspective by noting that outcomes in assessments such as SACMEQ have important socioeconomic correlates. This does not mean quality is entirely determined by factors outside the control of the education system, but it is important to be realistic. If one considers just two of such factors, GDP per capita and demographic burden as represented by the 0–14 age dependency ratio, these show a correlation of around 0.55 with the SACMEQ scores in reading. If one recalls that a simple correlation of 0.55 is the same thing as an “effect size” and that an effect size of 0.55 is considered large, one can see that Mozambique is not much of a negative outlier on either of these terms in the 2007 SACMEQ, and that improvement of around 46 points will not turn Mozambique into a positive outlier.
Bots
Keny
Leso
Mala
Maur
Moza
Nami
Seyc
Sout
Swaz
Tanz
Ugan
ZambZimb
-50
-40
-30
-20
-10
0
10
20
30
40
50
60
-20 -10 0 10 20 30 40
Chan
ge in
SA
CMEQ
sco
res,
200
0 to
200
7
Change in completion rates, 2000 to 2007

14 Task Order 11: Gap Analysis: Education Information and Education Policy and Planning in Mozambique
Figure 3. Mozambique's position in reading relative to GDP per capita
Figure 4. Mozambique's position in reading relative to age dependency ratio
Thus, while there should be some concern at the drop in Mozambique’s learning outcomes, this concern needs to be kept in perspective. About one-third of it may be a composition effect. The rest of it does not appear to be a direct result of expansion per se (as opposed to a composition effect) because the drop in Mozambique’s score is much greater than should be expected.
BotsKeny
Leso
Mala
Maur
Moza
Nami
Seyc
Sout
Swaz
Tanz
Ugan
Zamb
Zimb
400
420
440
460
480
500
520
540
560
580
600
0 5000 10000 15000 20000
SACM
EQ re
adin
g sc
ore,
200
7
GDP per capita in PPP, 2007
BotsKeny
Leso
Mala
Maur
Moza
Nami
Seyc
Sout
Swaz
Tanz
Ugan
Zamb
Zimb
400
420
440
460
480
500
520
540
560
580
600
0 10 20 30 40 50 60
SACM
EQ re
adin
g sc
ore,
200
7
Age 0-14 dependency ratio (proportion to total population), 2007
Task Order 11: Gap Analysis: Education Information and 15 Education Policy and Planning in Mozambique
Where there cannot be any debate is that the level of learning is simply extremely low by any standard, both now and in 2000. A focus on the drop should not distract one from focusing on the fact that the quality is simply very low. That, combined with the fact that the drop is mostly unexplained by the expansion, strongly suggests that the problems are more fundamental. But first it is important to provide a little intuitive and simple data on just how disappointing the results are.
The Aga Khan Foundation recently presented the results of a survey of early readers carried out in Cabo Delgado, admittedly one of the poorest regions in Mozambique. The results showed that 59% of grade 3 children sampled could not read a single word out of simple passages and reading lists.
We ourselves took a much less scientific sample of 15 children in Nampula. The sample included 4 beginning-of-grade-4 children in an outlying rural school (35 or so minutes outside Monapo, Nampula), 4 beginning-of-grade-4 children in a small town school (Monapo itself), 5 beginning-of-grade-3 children in the second-best urban school in Nampula itself (given that it is a better school), and 4 beginning-of-grade-4 children in a poor peri-urban school in Nampula. Thus, this was an intuitively representative sample: some quite deeply rural, some in a somewhat urban town, some in a “good” urban school, some in a poor peri-urban school. All of these children really should be reading reasonably well because in the rural schools students had had three years of education and in the good urban school they had had two years of education. Only 20% (3 out of 15) read reasonably well, and those were children whom the teacher had selected as their best readers and who had outside tutors (i.e., they had home instruction in how to learn to read). Another 27% were very struggling beginning readers—they could read a word or two with considerable struggle. But 53% could not really read anything at all, a very similar percentage to what Aga Khan found in Cabo Delgado. And we re-emphasize that those who could read apparently could read, in part, because they had tutors at home.
Surely there are some obvious reasons why the children are hardly learning. The infrastructural conditions are deplorable, as the photographs in Illustration 1 and Illustration 2 show. Incomes are very low, and parents are often illiterate themselves. The environment is essentially bereft of print. Thus, the children do not come from a culture of literacy. However, several factors probably account for the poor results: the fact that reading is not taught in mother tongue, the lack of dedicated and purposeful time due to multi-shifting and poor time management in general, and the use of poor teaching technique (e.g., lack of coordination of teacher actions and reading from books, infrequent assessment or monitoring of child progress, and insufficient pedagogical use of books—see below). The one factor that does not account for the results is lack of materials; essentially all children in the classrooms from which the assessed children were pulled had school books. However, the home and community environments seem to be very print-poor. In SACMEQ 2000, for instance, even in grade 6 (which represented a relative elite because the poorest children seldom made it to grade 6) some 20% of children came from homes with no books at all, and another 50% came from homes with less than 10 books; according to MICS 2008, on average there are zero pre-school books in the Mozambican home. But the bottom line

16 Task Order 11: Gap Analysis: Education Information and Education Policy and Planning in Mozambique
is that the one relatively favorable factor, the presence of books, cannot overcome the five negative factors (low instructional time, poor teaching technique, infrequent monitoring, lack of mother-tongue instruction, and possibly lack of quality of the books themselves).
Illustration 1. Not atypical infrastructural conditions
However, as will be noted below, the actual pedagogy matters, and this is not all that dependent on resources. During one observed reading lesson (and this is confirmed by many other observers), the teacher was observed spending a great deal of time copying to the board, in cursive, a passage from a book all the children already had in front of them, in print, thus confusing the children and wasting time. Memorized choral repetition and recitation of the passage without apparent connection to the text (without processing the text) was the norm; the children were not engaged with the print or with the board, though they were highly active and enthused. “Comprehension” questions referred to a graphic illustration loosely related to the passage, thus minimizing the children’s understanding of the fact that the passage itself held meaning. Furthermore, the “comprehension” answers were memorized, thus not requiring much, if any, processing. Four children picked at random from the classroom could not read the very passage they were “reading” that day, or any passage earlier in the book. These issues are not expensive to fix, but they do require focus and determination, and they require that data and information about how children perform be adroitly used.
3. The view from a systems perspective In this section we review the situation taking one system at a time. The optic here is “how does Mozambique do in comparison to other developing countries?” The reasoning is based on good practice, system by system, and not necessarily reasoning back from the policies as was done above.

Task Order 11: Gap Analysis: Education Information and 17 Education Policy and Planning in Mozambique
At the end of this section some of the key systems or issues are given a numerical score. This is not done for each system, just for key ones, so that Mozambique can have a sense of what are some possible improvement agendas.
The list of “system areas” chosen is not capricious; it is driven by the policies that Mozambique has chosen. Increasing access and completion both in terms of numbers and in terms of the adequacy of the facilities, and improving equity, require a focus on infrastructure and teachers: thus a focus on those two “systems” areas. Increasing quality requires a focus not only on assessments but on the use of assessments by school and teacher supervision systems: thus an emphasis on looking at those systems. All require money, good management, governance, and policy setting, which explains why we look at the data and information systems in those areas.
3.1 General notes on EMIS While our view of data is meant to be broad and systemic, it seems reasonable to start with an overview of data in the narrow and traditional sense, namely the data produced by the EMIS system. In Mozambique, the EMIS survey has been distributed and collected since 1975 with a well-established system. The national EMIS is a unit in the Directorate of Planning and Cooperation (Direcção de Planificação e Cooperação [DIPLAC]) at MINED (acronym for MOE since January 2010) and has three staff, including the head of the unit, a statistician, and a database administrator/ information technology specialist. The EMIS unit in DIPLAC first distributes surveys to schools; then District Directorates collect survey forms from schools and send them on to the provincial DIPLAC office, where data are entered into the computer. Provincial DIPLAC/EMIS sends data to the national DIPLAC/EMIS on a CDROM or flash drive, and then the national EMIS compiles data in an Access database. The Access databases have time-series data at the most decentralized level of schools and are aggregated at district, provincial, and national levels. These are more complete and manipulable than many such systems common in other countries at Mozambique’s level of development. The normal processing time from the distribution of the survey to the production of the national database is six months.
In terms of quality control and accuracy of data, the survey form itself is simple, clear, and short (four pages at the most per school level). It is true that there are not any manuals, instructional guidelines, or code books that accompany the survey, but the survey itself contains notes on indicators for common definitions, a legend for abbreviations, and some instructional explanations written clearly and concisely. (This is not to say that this is enough.) The national EMIS sets some ranges in the data entry system that Provincial Directorates use, which give warning signs when an abnormal number is entered. However, these ranges are not documented or disseminated, and the system does not require any further quality control action. While the national EMIS does not have a systematic way of checking data quality (a task that could be assisted by USAID fairly quickly), the Provincial Directorate annually visits a few randomly selected schools to check the accuracy of data nationwide. A sample study conducted by the United Nations Educational, Scientific and Cultural Organization (UNESCO) indicated that the EMIS data were fairly
18 Task Order 11: Gap Analysis: Education Information and Education Policy and Planning in Mozambique
accurate (in at least a few districts, not a nationally representative random sample). With the most decentralized unit at the school level, EMIS data systems cannot be linked to other data systems to identify, track, and cross-check teacher deployment, payroll, and teacher performance.
The national EMIS publishes and disseminates data in three formats: (1) annual EMIS statistics brochure, (2) Excel pivot table, (3) EMIS database on MOE website. First, DIPLAC produces an annual national statistics brochure with data at the national and provincial level for the government, donors, and other users. The production takes approximately three months, and it gets done systematically in a timely manner. The EMIS brochures have data at the national and provincial level in table format with some graphs. Each provincial DIPLAC has three to four EMIS staff and is responsible for producing a similar EMIS brochure with data at the district level. However, Provincial Directorates are not required to report to the national DIPLAC, and it is not clear which province actually produces its own EMIS brochure. Provincial DIPLAC is also responsible for training and promoting districts’ and schools’ utilization of data in their planning and budgeting. National DIPLAC organizes and gathers provincial DIPLACs to meet annually to determine financial needs and plan budget allocation based on EMIS data and available financial resources.
The EMIS produces Excel files with pivot tables that automatically import time series data linked to Access databases, which is designed to help the Ministry staff with analysis and planning. This file is shared on the MOE’s intranet; however, it is not clear who is informed and uses this tool—EMIS itself notes that usage is not what they would like it to be, though our own use of the tool suggests it is very simple and user-friendly. The EMIS database is also published on MOE’s website under Statistics section. Unfortunately, the database is not updated and only has data from 2004–2005. The database contains information at the school level, which is not necessarily useful or pertinent to most web users. A simple downloadable Excel file with data tables on key indicators may be of better use to the public.
3.2 Infrastructure monitoring
Policy priorities and indicators tracked In order to expand school infrastructure to accommodate the surge in demand for primary education, Mozambique has made building school classrooms a significant priority—perhaps within the top three priorities of the sector. The 2006–2011 Strategic Plan document addresses infrastructure through a discussion of the challenge of expanding classroom counts:
The availability of classrooms could not keep pace with the increase of admissions. Between 1999 and 2005 the percentage of classrooms in poor construction remained steady at around 56%. In 2005, 7% of pupils in EP1 were in classes in the third shift. Efforts to accelerate the pace of school construction were considerably enhanced by a combination of interventions, including the program of building schools, community mobilization for contribute to local resources, and support from cooperating partners. However,
Task Order 11: Gap Analysis: Education Information and 19 Education Policy and Planning in Mozambique
in practice, construction of classrooms is still very expensive, and often poorly monitored, with the resulting quality. In addition, construction is not always sensitive to gender issues in relation to services, such as water and sanitation facilities.
The strategic plan goes on to articulate several goals to guide investment in infrastructure, including the following:
• Target the production of classrooms so that every school can offer a “complete primary” school with seven grades.
• Target classroom production in order to eliminate classrooms hosting multiple classes, eliminate third shifts, target classroom with pupil-teacher ratios (PTR’s) of greater than 80, and add classrooms in districts with GERs lower than 80% (p. 25).
• Specifically, build 4,100 classrooms annually in order to reduce the average pupil-classroom ratio (PCR) from 90:1 to 78:1 (p. 26). This goal was revised downwards to 1,400 classrooms in 2010.
Key international planning documents are aligned with priorities highlighted in national plans. The Fast Track Initiative Performance Assessment Framework (FTI PAF), for example, lists the following goal with relation to infrastructure:
1.6: # classrooms constructed (low cost) for EP1 and EP2. Set target #s for each year, with note that strategies should target reducing disparities across region and gender.
In a system of scarcity where only a relatively small proportion of infrastructure issues can be addressed, there seems to be good concordance between the infrastructure priorities identified in major planning documents; the infrastructure issues featured most prominently in national reports such as the annual school census report and the strategic plan evaluation; and the priorities articulated by national, provincial, and district planners.
Allocation of school infrastructure on a fair basis would seem to be imperative in Mozambique. As in many recently post-colonial societies, Mozambique shows a sharp gradient in inequality of infrastructural resources, as Illustration 2 shows (both public schools—admittedly perhaps about as extreme as one could find). Citizens are aware of this, so it is important not only to be fair in the allocation of new infrastructure, but to be seen to be fair.

20 Task Order 11: Gap Analysis: Education Information and Education Policy and Planning in Mozambique
Illustration 2. Gradient in infrastructure quality
Data sources
EMIS
In Mozambique, several overlapping data systems exist to track the equity and allocation of school infrastructure items such as facilities and furniture. The most familiar tracking system is the EMIS annual school census, which provides hard counts of numbers of the most fundamental infrastructure: schools, classrooms, and shifts per classroom.
EMIS has a long, successful history in the country and has become a part of institutional culture, to the point where schools are said to automatically submit their school figures, even if they have not received the forms and paperwork from the district office. Since the school census questionnaire is so stable from year to year, school administrators who lack a form will simply refer to the previous year’s form and write out their figures for the current year. EMIS administrators at the central level attribute the success of the system to their efforts to keep it simple and straightforward. The census enumeration date of March 3 has been kept for so long that census data are generally referred to as “dados Tercer Março.”
EMIS data can be disaggregated according to criteria such as location (province, district, ZIP, neighborhood), ownership (public, private, community), level of education offered (primary, secondary, professional, adult education and literacy), number of classrooms according to quality of their construction (cement, tijolo, matiquado, open air, “other”), number of grades covered, and numbers of shifts. EMIS also conducts a short end-of-year census, but it is not relevant to infrastructure.
The EMIS could be used to annually publish reports that include the changes in the stock of classrooms, as a control or cross-check on the “flow” of construction. If there are issues of data uncertainty or dispute among various data users and producers as to the data on changes in the stock of schools (i.e., if the changes in stock measured year-to-year do not tally with the data on the flow into the stock produced by the schools program), it would be good to carry out some analysis into how data differences arise. It may be that some data are more useful than others for different
Task Order 11: Gap Analysis: Education Information and 21 Education Policy and Planning in Mozambique
purposes, and that it is all a matter of perspective. At present, EMIS does not publish figures on new or existing classrooms as part of their annual statistical report.
Though EMIS is sufficient for addressing the basic planning needs of the Ministry, some directorates need data that are not covered in the EMIS. As a result, these directorates have developed parallel data collection systems to gather the additional data that they need. For example, the Directorate for Technical and Vocational Education uses a separate questionnaire of their own to track the condition of specialized facilities such as laboratories and workshops, and the specific technical capabilities of their teachers. The result is a somewhat fractured system in which the central EMIS database contains a comprehensive picture of the system at a low level of detail, and other directorates keep their own infrastructure counts at levels of detail that support their needs. This system may be an efficient use of government resources because it allows each directorate to focus on collecting the information most closely related to their mission and makes it easier for directorates to target their questionnaires properly (i.e., if the school census form included fields on laboratories, then every non-technical school would need to respond that they have none). Furthermore, it is a general feature of education systems that data produced by the users of the data tends to be better data (e.g., gathered faster, and more fit-to-purpose); such data can then flow to central data systems as by-products of the needs of the actual users, and the centralization can happen later. On the obverse side, however, separate data gathering can be an imposition on the schools and can be relatively inefficient. How this cost-benefit equation actually works out in Mozambique, or whether an explicit cost-benefit analysis has been done, is something we did not have time to assess, but it is a relatively easy assessment for the EMIS itself to make.
Geographic information systems (GIS)
In an effort to gain more detailed information on the specific facilities at each school, DIPLAC has developed a separate school census called “Carta Escolar,” which plans to track detailed school information on a five-year basis. The program was piloted in Inhambane province in 2001 and expanded to cover the other provinces, with the idea that the detailed census will be sent out to the full set of schools in a province once every five years. The Carta Escolar program seems to have lost momentum for technical capacity reasons—provinces lack sufficient software and hardware to run GIS analyses, and all levels of government lack the human resources to perform GIS analyses. In addition, it may be that this effort is overkill for now, given the other constraints on staff. Currently, the provinces have insufficient human and financial resources to collect the Carta Escolar data and have even less technical capacity to process and analyze these data. Furthermore, there may be simpler ways to get this kind of analysis done.
It is possible that a vast percentage of the analyses that need to be done using Carta Escolar data do not have geo-spatial referencing as a key feature, particularly if other features of the social landscape are not themselves usefully geo-referenced and there are no plans (or it would be too difficult) to access those other data in a geo-referenced manner. These analyses could be carried out using existing technologies

22 Task Order 11: Gap Analysis: Education Information and Education Policy and Planning in Mozambique
such as Microsoft Excel of Access that Ministry staff are already familiar with. For example, prioritization of districts on a PCR density basis may not require global positioning system (GPS) coordinates and an analytical approach specifically capable of using spatial coordinates. Similarly, a prioritization of schools in need of upgraded sanitation facilities need not rely on geographic coordinates either. Localization or site-selection of individual schools might benefit from GPS coordinates; for example, if a school is very crowded, one can make a decision whether to add to it or build another one, based on where the population is coming from and based on effective distance (e.g., information about roads and physical barriers)—but for that one needs other social and geographical data that may or may not exist, rather than just the education data. But site-selection can also be done using localized (decentralized) “human sensing,” which may be even more accurate and may be able to handle more, and subtler, information than a central or even provincial GIS could. In that case, rather than centralized planning using software, what the central Ministry would need to do is to set criteria for the use of localized “human sensing” and then make sure they are being followed.
Carta Escolar data are not currently being analyzed at the national level, though a demonstration analysis of the data has been performed by an outside contractor. All provinces collect questionnaires, but many reportedly do not perform the data entry needed to transfer collected information from paper to digital format. It seems likely that this is due to the large amount of information collected on the forms.
In any case, school construction planners noted that if Carta Escolar data are collected only on a five-year basis, they will not be timely. Schools are being built at such a rapid pace that data would become obsolete quickly.
Carta Escolar uses a pair of forms to collect data on each school. One form is completed by the school headmaster and the other form is completed by a trained enumerator. Between the two forms, the following fields of information are collected: GIS location; EMIS code; name and street address of school; ZIP; access to, source of, and quality of water for school; access to, source of, and quality of electricity for school; number, type, and quality of construction of teacher homes; number and quality of bathrooms, latrines, and urinals; presence of canteen, playing fields, and gymnasium; presence of, installation date of, and data capacity of Internet connection; names of communities served by the school, including the walking distance to each and the numbers of pupils and teachers from each community who attend the school; counts of pupils and teachers by the mode of transportation used to reach the school (seven categories); counts of 11 types of furniture according to their physical condition and whether or not they are missing; presence of library books, lab equipment, and administrative equipment, according to their quality and physical condition and whether or not they are used often; counts of rooms (by five categories) according to their rehabilitation needs (six categories of need); counts of pedagogical kits (three categories), in existence and missing; and estimated number of school-aged children in the vicinity of the school who are currently out of school. Non-infrastructure data collected on the form, such as detailed teacher data, are not listed here.

Task Order 11: Gap Analysis: Education Information and 23 Education Policy and Planning in Mozambique
The sheer volume of data collected through the form is a burden to directors, enumerators, and analysts, and only a small fraction of these data are crucial to planning with regards to high priority areas such as the placement of new school and classrooms. As will be discussed in the following section on expenditure and budget systems, the MOE already has good systems in place for the “human sensing” of communities’ and schools’ relative needs with regard to lower priority (but still very important) policy issues such as school furniture. Rather than attempt to track these issues through a central database, it may be possible to find an efficient balance between central monitoring (which ensures equitable distribution) and local decision making (which makes use of more nuanced “human sensing” of local needs). In such a system, the governance structure needed to allocate and place classrooms would be as follows: (a) allocate classrooms in an efficient and transparent manner from central points in the system (e.g., even from Maputo), using simpler and more traditional databases that have considerable information; (b) set principles to be followed in localized site selection (a very different issue from allocation to the local level); and then (c) enforce localized accountability for site selection on an audit or quality assurance basis.
Finance—expenditure and budget systems
In addition to the data collection systems described above, the administrative hierarchy of the education system is used to transmit information and needs upwards and downwards over the course of the budget planning cycle.
To plan the allocation of infrastructure for the next year, province-level planners report infrastructure needs using a combination of both EMIS data and community information passed up through the school system hierarchy (which is an example of what we have called “human sensing” above). As an example of this second source, both province- and district-level planners describe a system in which school headmasters collaborate with community members and local authorities (presumably through school councils) to poll the numbers of children who might be expected to enter grade 1 in the next year. They also put together an estimate of school needs for additional classrooms and schools or other notable needs based on existing conditions of poor infrastructure, not just anticipated enrollment needs.3 Information collected by school representatives is consolidated and communicated to district-level officials in a district planning meeting and passed to provincial planners in a similar fashion. Provincial planners use these data to prepare a budget plan and submit it for consideration in a meeting between planners from each province and representatives from the central ministries of education, planning, and finance. This is where the balance of allocations for the next year is agreed upon.
3 And one has to note that, at least at the primary level, as the system finalizes dealing with the problem of the never-previously enrolled, attention will have to turn more and more to improving infrastructural conditions. Thus, forecasting growth (a classical “planning” function) will become less important as a practice, and prioritizing need (an “allocation” or equity function) will gain prominence. In fact, already, according to some of the planners, equity in addressing backlogs in quality of infrastructure already takes higher priority than forecasting for enrollment growth.
24 Task Order 11: Gap Analysis: Education Information and Education Policy and Planning in Mozambique
It seems clear that, informationally, this is a traditional bottom-up and then top-down negotiation-based process, rather than a more “modern” decentralized one where allocations are made top-down and then decisions are made “horizontally,” so that planning and priority setting take place at each level (though supervised), not between levels. It may well be that for now, in Mozambique, given the lack of planning skills at the sub-national level, this process is indeed optimal. However, it has to be noted that this process is not really decentralization, and the system ought to at least be thinking about how to create a more decentralized process, if one is to be consistent with the apparent policy directions of the country.
Once a decision on allocations to each province is made at the national level, allocations to each district are made by the provinces. When asked about the process, provincial education planning officers were unclear on exactly how the balance of allocations had been reached, but they believed the allocations were based primarily on three considerations: demand (as demonstrated by overcrowded classrooms or high PTR), lack of access (as demonstrated by low GERs or by estimates by communities of un-served children), and the capacity of provinces to build classrooms (as demonstrated by the proportion of schools authorized for construction that were actually built).
The allocation process for school materials such as furniture was less clear than that for classrooms. Planners at the provincial level reported that furniture allocation decisions were made at the district level. Planners at the district level reported that furniture allocations were made at the provincial level. District and school representatives agreed that, in reality, furniture is allocated to newly constructed schools only. If previously existing schools need new furniture or furniture repairs, it is up to the headmaster or the community council to identify a solution. This may well be optimal from a planning and resource use point of view. The lack of furniture observed in so many schools is due simply to the enormousness of need relative to resources available, and not necessarily due to an inefficient planning or data-use process. Heartbreaking as it may be, the whole process may be an optimal compromise between needs, resource availability, and prioritization of the most important inputs.
The office of infrastructure provisions within DIPLAC is responsible for coordinating school construction activities. This includes construction using pooled FASE funds as well as construction using Ministry funds. Each provincial education Ministry office has approximately three to four dedicated infrastructure provision staff to coordinate construction activities that are managed at the province level. Each provincial education Ministry office also hosts an employee of the central office of infrastructure provisions who acts as an interface between the provincial and national offices and ensures that provincial and national school building activities are in harmony. The central office collaborates with province offices to select potential locations for new construction schools. They attempt to select locations based on estimates of the locations of un-served populations, but their selections are not as grounded in fact as they would like them to be. They believe that maps linking the locations of schools to the locations and relative sizes of population centers would improve their processes

Task Order 11: Gap Analysis: Education Information and 25 Education Policy and Planning in Mozambique
considerably—or at least ensure fairness and accountability. To do this, the planning department would need to be able to generate maps using basic information on existing schools, as well as population data from another source, and the latter would also need to be geo-referenced or mapped.
The status of individual construction projects is managed at the provincial level in Excel databases. The national office maintains a central database that receives updates from the provinces on a monthly basis. The national office would like to move to a web-based tracking system so that they can consistently have access to the most recent information possible when monitoring the status of projects.
When school construction projects are not completed, the infrastructure office tracks vendors and service providers who do not honor their contractual commitments, and this office has begun to work with the Attorney General’s office to hold these parties responsible. The office is in a state of continuous assessment and revision of practices and strategies to improve the efficiency of their work, and they described several newly implemented strategies for holding vendors responsible. The office expressed a strong desire for more reliable and objective measures to use for site selection for new construction of schools. Without access to mapped information on the geo-location of existing schools and population centers, they worried that their current site selection process does not always result in optimal placements.
Household surveys
Though they are not designed for infrastructure analyses, household surveys conducted through INE produces relevant data. Because household surveys are based on a sampling methodology, they cannot be used for decisions on site selection. However, they can be used as an independent measure of progress in making schools accessible to the population.
The Household Expenditure Survey (Inquérito aos Agregados Familiares [IAF]) 2008 tabulates population characteristics against the amount of time needed to travel to public facilities, including the nearest primary school. A copy of the questionnaire for this survey was not obtained, but it seems likely that the traveling time was estimated by an adult respondent rather than measured directly, and thus, may need to be interpreted cautiously. IAF data could be disaggregated by household characteristics and by region, but not by province. It would be possible to triangulate these data with the data collected through the Carta Escolar to get a general sense of whether information from the two sources are aligned.

26 Task Order 11: Gap Analysis: Education Information and Education Policy and Planning in Mozambique
Figure 5. Walking time, in minutes, to the nearest primary school, IAF 2008
IAF 2003 is dated and should not be used for current planning, but the types of data generated through this questionnaire are instructive as examples of the potential value of household survey data to education policymakers. For example, the survey, which uses a questionnaire modeled after the World Bank Core Welfare Indicators Questionnaire, tabulates parents’ perceptions of the problems children have with school. For household members aged 6+ who are currently attending school, it asks for the main problems with the school the household member is attending. Response options (multiple responses are allowed) include no problem, lack of materials, lack of books, lack of teachers, inferior quality of facilities, and “other problems.” The report tabulates findings based on this question as follows:
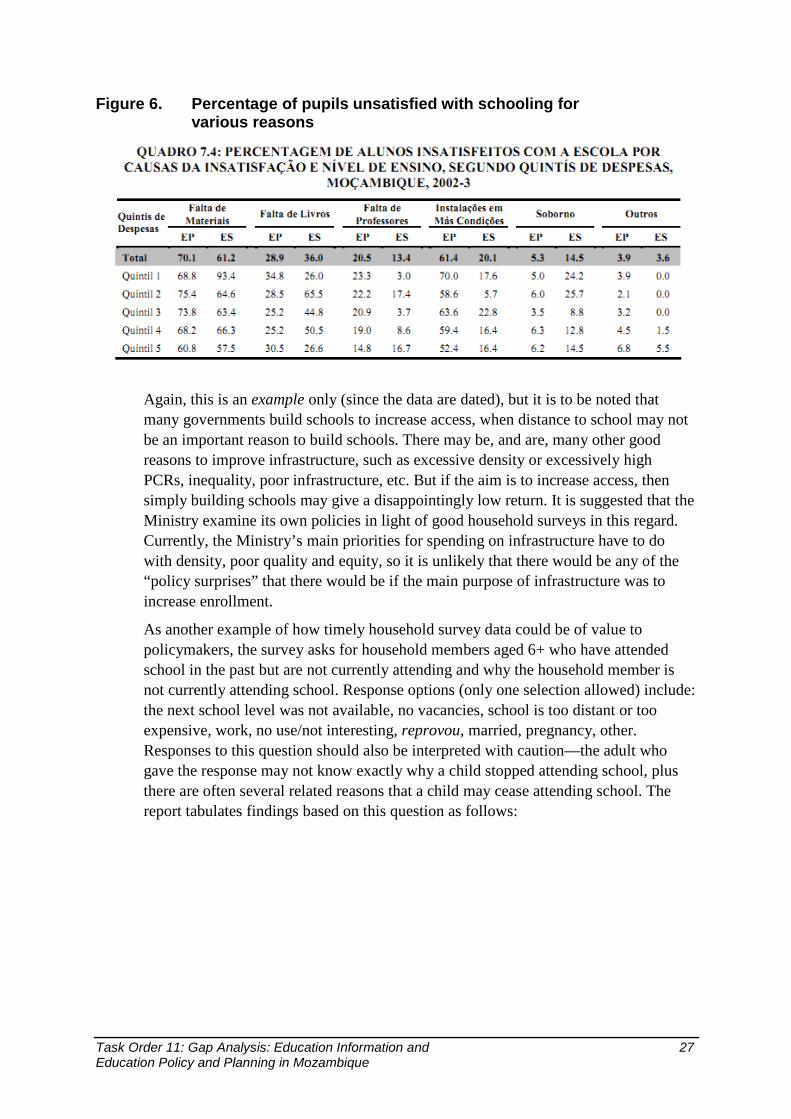
Task Order 11: Gap Analysis: Education Information and 27 Education Policy and Planning in Mozambique
Figure 6. Percentage of pupils unsatisfied with schooling for various reasons
Again, this is an example only (since the data are dated), but it is to be noted that many governments build schools to increase access, when distance to school may not be an important reason to build schools. There may be, and are, many other good reasons to improve infrastructure, such as excessive density or excessively high PCRs, inequality, poor infrastructure, etc. But if the aim is to increase access, then simply building schools may give a disappointingly low return. It is suggested that the Ministry examine its own policies in light of good household surveys in this regard. Currently, the Ministry’s main priorities for spending on infrastructure have to do with density, poor quality and equity, so it is unlikely that there would be any of the “policy surprises” that there would be if the main purpose of infrastructure was to increase enrollment.
As another example of how timely household survey data could be of value to policymakers, the survey asks for household members aged 6+ who have attended school in the past but are not currently attending and why the household member is not currently attending school. Response options (only one selection allowed) include: the next school level was not available, no vacancies, school is too distant or too expensive, work, no use/not interesting, reprovou, married, pregnancy, other. Responses to this question should also be interpreted with caution—the adult who gave the response may not know exactly why a child stopped attending school, plus there are often several related reasons that a child may cease attending school. The report tabulates findings based on this question as follows:

28 Task Order 11: Gap Analysis: Education Information and Education Policy and Planning in Mozambique
Figure 7. Main reasons for dropping out of school, IAF 2003
Within the context of the period when the survey was conducted, the implications were clear. Expense and lack of interest in education were, by far, the most important barriers to school participation. According to these data, the 2004 government effort to eliminate basic school costs was targeted toward one of the more important barriers to participation over which the government had some degree of direct influence. That was a rational policy response at the time. Though this survey question has not been repeated since 2002, its potential value to policymakers should be clear as a means to determine whether, for example, cost is truly no longer a barrier to participation at the basic school level, as well as the extent to which “distance to school” continues to be perceived as a major factor.
Census, HR/teacher management, Exams
Data gathered from these sources appear not to figure directly into infrastructure tracking.
Discussion
• Reconsider strategy for geographic data. For the great majority of data collected through Carta Escolar, more conventional software such as Microsoft Access and Excel are appropriate and require considerably less investment and training to be used. For issues such as site selection for new schools where geographic information may be helpful, geographic knowledge gathered through “human sensing” may not only be more technologically realistic, but also more attuned to nuanced understanding of local needs.
• A periodic, more detailed census of schools would be helpful for maintaining a catalog of urgent maintenance needs among school facilities. However, the amount of data collected should be kept small to avoid imposing undue burden on headmasters, data entry clerks, and analysts. These data need not be analyzed in cartographic format. Ranking priorities for maintenance and upgrades is a task better performed in a spreadsheet or relational database.

Task Order 11: Gap Analysis: Education Information and 29 Education Policy and Planning in Mozambique
• Develop a transparent and objective system for fairly distributing new construction of schools across provinces and districts according to their need. This can be developed in Excel and draw from the EMIS data contained in the MS Access database. The algorithm for establishing need in each geographic area could be as follows: − For each school within the geographic area, establish three counts:
Number of grades (if any) that would need to be added to make the school a “Primária Completa” (a new classroom is needed for each added grade), count the number of third shift classes that need to be brought into a first or second shift (a new classroom is needed so the earlier shifts can have enough rooms for each class), and count the number of classes which currently have a PCR of more than 80 (a new room is needed to absorb the new students when an existing class is broken in two). Take the sum of all of these and then divide by two (assuming that due to double-shifting each classroom can serve two classes). The resulting number is the total need for each geographic area.
− Budget constraints in Mozambique dictate that it is not possible to meet the total need for new schools. However, the total need established in the first step can be used to identify the ratios of relative need across geographic entities. For example, if Province A has a total need of 650 schools and Province B has a total need of 350 schools, but the national budget allows for only 100 schools, the provinces can be allocated 65 and 35 schools respectively. This practice is used in other countries and serves to make sure that all sub-national governments feel transparently and fairly treated, and it removes discussion away from fruitless complaints about the total, which is not decided by the national Ministry, and toward a discussion of a fair allocation of what is available.
− Infrastructure constraints in Mozambique mean that it simply may not be possible to build all of the schools that are allocated to a geographic entity. The budget-adjusted allocations developed in step 2 should be further adjusted to account for a measure of the total capacity to build in each geographic entity. An entity’s capacity to build for the current year should be based on their demonstrated capacity to build during the previous year while allowing for a reasonable amount of growth and learning from one year to the next (maybe a 5% annual increase in capacity). For example, if Province C was allocated 70 schools in the previous year, but completed only 62, then their allocation for the current year should not be allowed to exceed 65 (62 * 1.05). If Province D was allocated 100 schools and built all the schools they were allocated, then their new maximum allocation could be increased to 105 in the current year. If this prevents one province from building the budget-adjusted number of classrooms allocated to it, the extra rooms should be allocated to the provinces with extra capacity, in order of greatest need.

30 Task Order 11: Gap Analysis: Education Information and Education Policy and Planning in Mozambique
3.3 Teacher monitoring data systems
Policy priorities “The Government’s vision puts quality and equity in basic education at the centre of its education policy. Improvement in access cannot happen without a substantial improvement in quality.”—Mozambique’s Strategic Plan of Education and Culture
In Education Sector Strategic Paper (ESSP) I and ESSP II 2005–2011, policy priorities have been given consistently to both access and quality, but with a growing emphasis on learning quality. Specifically on teachers, ESSP II sets out a framework for reducing the numbers of teachers without pre-service training and providing in-service opportunities to all teachers. It also highlights the need to reform existing curriculum and to deliver teaching and learning materials to classrooms in a timely manner. In the working draft of ESSP III 2012–2015, more specific policy priorities are being discussed to improve classroom teaching and student learning. These include the following:
• Improving the quality of learning in pre-service training • Providing in-service training to those already teaching in schools • Monitoring student performance by evaluating teachers and school principals • Increasing instructional hours from 600 to 900 hours per year, ideally 1,024
hours • Revising the curriculum for better results in the areas of skills in reading,
writing, and numerical computations • Expanding bilingual education
The number of teachers has increased in all school levels from 2004 to 2010, with an increase in the proportion of trained teachers from approximately 60% to 78%. New teachers hired from 2006 to 2010 more than doubled, from 4,000 to 9,800, with a decline in PTR from 75 to 66. The Mozambican education system also introduced teacher and school management training, increased pedagogical supervision, and provided teacher manuals. Despite the effort, Mozambique is still struggling with low education quality without a clear indication of (improvement in) student learning.
Data and information coverage on teachers Data and information on teachers can be found in almost all sub-sectors and all regional offices of the education sector. Here, we survey data on teachers collected from EMIS and sub-sectoral surveys at the central MINED and information on teachers that is pertinent to teaching conditions and teaching quality at decentralized regional directorates (province, district, school).
EMIS school survey
As noted elsewhere in this report, the EMIS in the MOE distributes surveys and collects data from schools at the beginning and end of the school year. The EMIS has aggregate (that is, school aggregates, not teacher unit records) data on the number of
Task Order 11: Gap Analysis: Education Information and 31 Education Policy and Planning in Mozambique
teachers by (1) certification level, (2) grade taught, (3) teaching subject and grade, and (4) number of shifts taught (and hours per shift). Teacher attrition data (during the previous year) is also counted, but only for major causes such as death, frequent absence due to health, and leaving the teaching profession. Minor or regular absenteeism due to other reasons is not reported in the EMIS. In the EMIS survey distributed at the end of the school year, the number of teachers with or without pedagogical training is reported (but using different conceptual categories than at the beginning of the year, which uses more refined categories). The upper primary school survey collects information on teachers with teaching manuals by subject, including mother tongue. The EMIS teacher data are collected by types of school (private or public) but not by teacher status (permanent or contractual) or locality of school (urban or rural).4 Some data are reported by gender—teacher attrition in previous year, teachers by pedagogical training—whereas others are not. The EMIS also collects students and repeaters data by gender from each IFP at the beginning of the school year. With these absolute data, PTRs, percent teachers by qualification level, teacher attrition rates, percent teachers with pedagogical training, teachers by number of shifts taught, and some other ratios can be calculated. In the EMIS statistics brochure that is printed every year for circulation, the following indicators are published by school level and gender (where available) at national and provincial levels: PTRs; teachers by type of pedagogical training (qualification); teachers that left school last year due to death, illness, or abandonment of profession; and enrollees and repeaters in teacher training institutes. Mozambique EMIS holds decades of data that allow trend evaluations over time.
The EMIS has the most standardized data collected on teachers at decentralized levels that are used to project teacher needs and financial allocations at all regional level offices (national, province, and district). The national- and provincial-level teacher data are widely used and cited in planning reports and analyses, but more decentralized data at district and school levels are not as widely disseminated, analyzed, or utilized. EMIS data are used by the Teacher Training Division at the central MOE to project teacher needs and spaces for new enrollees and new hires from IFPs. The data on teachers without pedagogical training are used to project resource needs for in-service training. The ESSPs point to the issues of teacher attrition and unqualified teachers in schools affecting learning conditions and outcomes, but whether all regional directorates use existing data to project the actual teacher needs is not clear. At the national level, as the FTI planning report indicates, the HR management system has improved and can be used to replace those teachers that are leaving the profession. The financing model used by FTI and the MOE takes information such as teacher qualification level and attrition rates in the formulas into account in projecting teacher needs by school type and level at the national level. However, the assessment team was not able to identify if provincial and district
4 In Mozambique, all teachers start off as contract teachers, and all of them are eligible to become permanent civil servants in principle. Civil servants and contract teachers are paid with the same salary based on their qualification level and years of service. The difference, or disadvantage, of being on a temporary contract is not receiving the benefit of a pension plan, opportunities to participate in in-service training or career progression, and inability to take leadership as school or pedagogical directors.

32 Task Order 11: Gap Analysis: Education Information and Education Policy and Planning in Mozambique
directorates use such data or tools for equitable teacher allocation, which would enable regional offices to analyze and identify schools, districts, and provinces that need support in improving teaching and learning conditions. The indicators that can be used in addition to teacher qualification level and attrition rate are the number of shifts taught by teachers and teachers with or without teacher manuals or pedagogical training. In almost all directorates and regional offices, while data are often used and planners are aware of data, the culture of documentation of the system or processes (e.g., how to use the data in a systematic way, in such a manner that usage is regularized and institutionalized) is somewhat absent.
Teacher personnel database and payroll system
The HR Department handles the personnel information for both teachers and administrative staff. In Mozambique, the Ministry of Finance (MOF) handles the payroll system of all government employees, and the MOE HR only reports and sends personnel information to the MOF. The MOE HR used to collect information on teachers directly from schools—name, national identification number, teaching certification level, function in school, name of the school where he/she teaches, etc.—and had a database with both teaching and administrative staff information. With decentralization of HR to the districts in 2008, the personnel database system was taken to district directorates to be managed autonomously. Since then, the provincial HR has been receiving a paper form of teacher registry from districts, mainly because of the lack of computers or electricity at district directorates, to enter information into a database. Whereas the provincial directorate reported that they update the HR database and send it to the national HR every three months, the national HR currently only manages a database (in a true database sense) for the ministry staff at the MOE. The decentralization brought all HR functions down to the district level, but without any uniform system to manage across districts vertically or regional levels horizontally. Therefore, the database or teacher registry received by provincial HRs from district HRs is diverse in its format, with the same situation for the information reported to the national HR by provincial HRs. While it is more efficient and sensible to allow districts to develop and use a system that works for them in maintaining and updating the HR database, it may be worth pursuing dissemination of a uniform data entry system, whether in paper or electronic form, to standardize the information better at the aggregate level, if teacher personnel information at the unit of an individual teacher is to be useful in policy planning.
While some aspects of HR are decentralized to the district level, this decentralization involves only the mechanical processing of payroll—for instance, districts do not actually select or interview their teachers, nor do they process personnel actions, for now. Actual personnel actions still pass through the provincial directorate, and the actual choice of teachers is up to the province, which sends lists of selected teachers to the districts. Nonetheless, the fact that payroll is processed and verified at the district level does allow Mozambique to monitor “ghost” teachers and other payroll inefficiencies to a degree unusual in any other countries in our experience. In addition to the fact that payroll processing creates information that is close to the source, and hence makes it more feasible to detect “ghosts,” Mozambique carries out external
Task Order 11: Gap Analysis: Education Information and 33 Education Policy and Planning in Mozambique
audits by the provincial directorate of the Ministry of Planning and Finance by visiting schools to check the physical presence of teachers at unannounced times, at least as reported to us. This external auditing is conducted in all schools nationwide. In Nampula province, approximately 2%–3% of teachers are reported to have been absent during this inspection, which includes those that were sick on the inspection day. It is up to the teachers and schools to prove their presence. Although teacher allocation and salary disbursement records are neither tracked nor reported systematically or electronically to the national HR, the district and provincial directorates seem to hold a record of this information in a format that is convenient for their use.
One of the challenges faced at districts with HR decentralization is the teacher salary disbursement. While the payroll system is decentralized to the district level, not all districts and teachers hold a bank account or have a bank nearby. For some teachers in remote areas, or those districts without any banks nearby, it could take more than three days for teachers to travel to get to a bank in another district, work with the system to be identified and be paid, and travel back to their home, each month. There is usually a lag of about three months between a teacher’s contracting and the processing of paperwork so they can start to be paid by payroll. Once on the payroll, the system seems to work without any considerable delay or problem, other than the cumbersome need to travel to collect payment. Based on the interviews with teachers at schools visited, salary disbursement was not a major concern. In comparison to other countries in Africa, the payroll system seems to work reasonably well in Mozambique.
Teacher training and deployment
The Teacher Training Division under the MOE’s HR collaborates with the provincial directorate’s Department of Pedagogy and IFP to project teacher needs, to allocate teachers to each province and district, and to calculate financial and resource needs for pre-service and in-service training. All three units use EMIS data to project and plan, but the physical and budgetary space available to train and deploy sufficient teachers has been largely constrained by the lack of financial resources, from a macroeconomic point of view—the needs are simply too great compared to what the country can afford at present. In Nampula province, 1,500 out of 2,500 proposed new teachers were hired this year due to the financial constraint. However, it is reported that most IFPs offer more spaces and allow more students to enroll than institutes can afford with the budget allocated from the government, which increases the pool of teachers for deployment.
The provincial directorate HR collaborates with IFPs in recruiting and selecting new teachers for each district, but it is the district directorate that handles the contracts for teachers. In addition to the list of teachers provided by the IFP in the province, information from other provincial IFPs is used to assign teachers, as sometimes IFPs in some provinces produce too many teachers, and IFPs in other provinces produce too few teachers. “Trading” of teachers is done in coordination or with information provided by the national Teacher Training Division at the MOE. There is no “market”

34 Task Order 11: Gap Analysis: Education Information and Education Policy and Planning in Mozambique
for teachers, so information on surpluses and scarcities has to be centrally and bureaucratically handled.
Pre-service teacher training
There are mainly two types of teacher training: pre-service training for student teachers in IFPs and in-service training for teachers already teaching in schools, nowadays also provided mostly by the IFPs (as well as nongovernmental organizations [NGOs]). Information is also used in selecting and training student teachers for pre-service training. To improve teacher quality, IFPs have been asked to raise the entrance requirement from 10 years of education with a 10/20 performance mark to 10 years of education with a 12/20 performance mark, which was implemented in 2011. The IFPs had recently been training more teachers than the system could employ (due to financial constraints), which created a pool of “surplus” teachers, which could, in turn, allow the system to raise the bar on entrance, that is, select the better qualified teachers. This is commendable. In many other countries that produce great surpluses of teachers, there is no merit-based selection, and allocation to jobs then has to rely on extremely inefficient factors such as seniority since training or random and political factors, which has the distinctly perverse result of putting into schools teachers who have forgotten what they were trained to do or who have no real desire to teach. Mozambique seems to be avoiding (for now) this trap. Similarly, only the top students in IFPs have been deployed to schools. At the provincial directorate of Nampula, we observed several IFP graduates who were waiting around the office to try to secure a job.
Starting in 2012, teacher certification requirements will include one year of distance learning in addition to two years of pre-service training in IFP. The increase in standards has not yet reduced the excess supply of teachers (relative to budget, not to need!), but it is expected to raise teacher quality. It is to be noted that the rationale for raising the bar was to increase quality, but this could not have occured unless there was a surplus relative to budget (raising the bar is not practical if there is an absolute scarcity of teachers, as it only results in more scarcity). While there has been an effort to improve teaching quality with initiatives implemented from ESSPs of the past decade, there has not been any direct measurement of teaching quality and student learning to know the exact progress of education quality in relation to teacher qualification, except for SACMEQ and the national assessment conducted by INDE, for the latter of which results are not released, as far as we could judge.
Despite a system in place with enrollment selection criteria and curriculum designed for pre-service training, it is not clearly recorded whether IFPs have been following the national guidelines; whether teachers are learning and being trained adequately; and whether there has been a positive impact of the IFPs’ raised entrance pre-requisite on improving the quality of teacher selection, teacher training, and (eventually) student learning. This suggests insufficient analytical attention to the implications of big policy changes. With decentralization, IFPs became more autonomous and collaborated more directly with provincial directorates, which made it more difficult for the MOE’s Teacher Training division to monitor and supervise IFPs and provincial directorates on teacher-related matters. At the moment, it is difficult for the

Task Order 11: Gap Analysis: Education Information and 35 Education Policy and Planning in Mozambique
MOE to know whether the national guidelines on enrollment selection criteria are followed at IFPs. Some uncertainty seems to prevail on the ability of central government to track and then enforce guidelines on other teacher training issues—all relating to certain ambiguities introduced by decentralization, and which remain part of the unfinished task of decentralization.
In addition, based on interviews with people who have visited schools in very poor and rural areas, the level of education after 10 years of schooling in Mozambique is not what one would expect in aspiring student teachers, and some untrained teachers are not even literate to teach in classrooms, but they do. Therefore, student teachers enrolled in IFPs, either with or without the national standard pre-requisites met, could still have very low effective education levels (as opposed to simply years of schooling and even a mark on an exam). Exacerbating the situation is the poor teaching quality and ineffective pedagogical methods used to teach student teachers in IFPs, which then transfer to children’s learning in classrooms when these IFP graduates are deployed to schools. In IFP classrooms observed by the MOE’s Teacher Training division, some lecturers arrived to classrooms late; some read the textbook to student teachers for 45 minutes (without any students having a textbook in hand); and the majority of lectures used “read and write” pedagogical methods rather than methods that result in interaction, active learning, or real skills transfer. Clearly, in Mozambique, teachers are teaching as they are taught, and they are taught in ways that do not increase practical skills, and this raises concerns for both pre-service and in-service training. As a policy recommendation going forward, it may be more difficult to attempt to change behavior quickly only (or mainly) through improved pre-service training. First, IFPs themselves may be more resistant (this is only a hypothesis) to change, even if not consciously so, and second, the percentage of teachers who enter the profession each year, relative to those who are already in service, is relatively low, so the process would take a long time. This argues for intense and specific in-service work to radically change how teaching is done (starting perhaps with early grade reading). To the degree that IFPs can be actively involved in this, it will affect how they carry out pre-service training. In addition, direct assistance to pre-service training ought to be considered.
To address various quality control issues in pre-service training at IFPs, MOE’s Teacher Training division is currently conducting a qualitative survey of IFPs to get a clearer picture of the qualification level of lecturers and student teachers; the quality of teacher training, including pedagogical methods and contents; and the operation of IFPs in terms of how well the system is working and following the national guidelines. In-service teacher training
In-service training is offered to teachers who are already teaching in schools. For those who have not received any proper pedagogical training, in-service training offers opportunities to learn pedagogical methods. For others with pedagogical training, it allows them to refresh or update their teaching practices, away from a chalk-and-copy method. In Mozambique, all IFPs deliver in-service training, but some institutes do better and more than others, depending on budgetary allocations. Our admittedly small sample showed that most teachers claimed to have received some in-service training. However, other evidence shows that about 30% of all
36 Task Order 11: Gap Analysis: Education Information and Education Policy and Planning in Mozambique
teachers do not receive either pre-service or in-service training, and that there are big gaps in provision of in-service training across provinces.
The EMIS data system captures the number of teachers without pedagogical training at school level. With this information, headmasters’ evaluation and supervision records, and previous in-service training records, IFPs and district offices identify teachers that need in-service training the most, and this information is used in driving the “ask” for budget or in-service training spots. In providing in-service training, IFPs attempt to offer equal opportunities to all teachers who need to both learn and update their pedagogical methodology. The new IFP graduates are not included in the pool for in-service training immediately upon graduation because it is assumed that they are both up-to-date with specific curricular knowledge and are adequately trained in general. Whereas this selection process is commonly understood by officials who are involved in the decision-making process, the data and information on processes are not captured systematically, nor is the process as totally transparent and easy to explain or understand as it could be.
As seems to be the case with a lot of other allocations, a great deal of negotiation is involved. Though there seems to be a general perception of fairness, it is difficult to know whether in fact there is fairness, since it is difficult (if not impossible) to check actual allocations against simple and clear criteria. In general, however, some factors that are used as criteria are very visible, such as PTRs that have come down much faster in the provinces that, a few years back, had the highest PTRs. This confirms the general sense that the system is reasonably fair. But it would be even better to have simple, transparent allocation systems that could be checked quickly against need and against actual allocations, in something closer to real time. These allocations could then more easily be the subject of discussion in civil society or parliamentary-type bodies at all levels.
The IFP of Nampula expressed that the IFPs have the human resources to provide in-service training to all teachers who need it if they had sufficient financial resources. In reality, the lack of funding does not allow IFPs to send trainers to and have all teachers travel to district capitals for training. The IFP in Nampula, for instance, is currently conducting one in-service training per year to trainers at the district level, who then will train selected teachers in that district. The IFPs seem to have a system in place to carry out training in a multi-step cascade method, which is not found to be as effective as a one-step cascade method (or no cascade). However, as noted in the pre-service training section, the content of the training—the pedagogical methods—needs to be studied and adjusted first to provide an effective training that would bring impact in student learning at the classroom level. If the methods are ineffective, then it does not matter whether there is no cascade or a flat cascade.
Financing teacher training
The provincial and district directorates generally seem to receive less funding and have fewer teachers deployed than needed and asked for (approximately 60% of requested amount and number allocated generally in Nampula province). Neither provincial nor district directorates seem to contest the fairness of financial allocations
Task Order 11: Gap Analysis: Education Information and 37 Education Policy and Planning in Mozambique
in comparison to other provinces or districts. However, they do seem to negotiate based on an absolute sense of their need. The higher levels do not provide enough explanation on the rationale for funding or allocation formulas, nor is there a tradition of relative comparison of shares.
The provincial directorate allocates government funding received from the MOF directly to IFPs, which is spent mostly on the operation of pre-service training in IFPs. A second source of funding for IFPs is FASE, which DIPLAC allocates directly to IFPs, to be spent mostly on in-service training (approximately 3%–4% of FASE funding goes to in-service teacher training). Funding is allocated via what seems an unnecessarily complex (and relatively un-transparent) process of bottom-up “asking,” top-down “granting,” and negotiation and trading. The Division of Teacher Training at the MOE advises IFPs in projecting available spaces for pre- and in-service training based on expected student enrollment, number of existing teachers, and financial resources available for the school year; meetings are held; final amounts or spaces are handed down. Although the exact formula was not shared or found (and may not exist as such) because it was said to be handled by the administration office of IFPs, IFP officials in Nampula had data tables in hand and were able to do quick calculations at the meeting to find out the number of spaces granted financially for teacher training compared to what had been requested, as well as the number of teachers trained through pre-service and in-service over the past few years. It also seemed that HR officers and other planners at both provincial and district directorates felt that their eventual shares (in comparison to others, or the allocated amount as a percentage of the “asked” amount) was basically fair—or at any rate there is no tradition and not enough data “feedback” to encourage contesting shares.
Evaluation of teacher performance and teacher training
In Mozambique, there have been some forms of teacher evaluation done at the school and provincial level, although the MOE has not had a systematic way of measuring or tracking teacher performance or classroom observations. It was reported by various personnel at the Ministry that the headmasters evaluate teacher performance and provide feedback at the school level, which is then followed up by supervision, but more in a non-systematic and subjective manner than in an objective manner according to (good) standards. To address and improve the issue of the low education quality, the MOE’s Teacher Training division is developing a database with the Department of Technology to store and track information on deployment of IFP graduates and progress of teacher performance over time. It was noted that this effort was to be conducted on all teachers nationwide. The evaluation form is already designed, and the Department of Pedagogy at the provincial directorate will carry out this evaluation in collaboration with IFPs. The evaluation will have two components: one on teacher performance, which will be followed up by supervision of headmasters, and another on classroom observations. The evaluation form was not shared, but it was reported that it, and a manual, do exist.
The MOE’s Teacher Training division is also developing a new survey to collect information on how well in-service training is working—the evaluation of the system itself. It will look at the in-service training units in IFPs, in terms of their planning,

38 Task Order 11: Gap Analysis: Education Information and Education Policy and Planning in Mozambique
monitoring, and evaluation capacity; material and financial needs; and the content of the pedagogical methods used for training. This new survey is scheduled to be distributed in April 2011, and the results are expected in May 2011. A survey such as this would be useful in learning how well current pedagogy and curriculum are working in the Mozambican education system to identify the areas for improvement and to experiment and transform instructional methods so they become more effective and result in improved student learning.
In addition to the evaluation system being developed by the national MOE, the provincial directorates have a Department of Inspection that is designed to inspect schools, in terms of conditions of school infrastructure, material needs, teacher presence, and school operations. In theory or in design, the Department of Pedagogy receives these inspection reports and provides support to supervisors and teachers at the school level. While the provincial directorate does this, there is no systematic capture of information on school and teaching conditions and the process of teaching and learning (that is, on how well teachers are teaching), by surveys or by inspection. Nevertheless, the system does have a fairly organized process of inspections and support, more so than most other countries in the developing world. (The content of such support, though, obviously needs improvement, as can be seen from the quality of the learning outcomes and teaching processes actually deployed.) And no reports are prepared that characterize the teaching and learning processes on an occasional or sample, but systematic, basis, so that one can judge whether teaching is improving.
Our case study of Nampula province yielded some contradictory evidence on the amount of staff available for school support and inspection. There are 25 pedagogical support staff at the Department of Inspection, which leaves each staff with approximately 90 primary schools to inspect annually; this is too much. However, we were also told that pedagogical support staff have only 10–15 schools per staff member. If this is true, that number is not too high, and it could allow for considerable time spent checking up on and/or counseling schools. However, regardless of the numbers, what emerged is that there are also serious financial and managerial constraints in transport: there is insufficient money and insufficient tradition, logistics, and management systems for handling transport and deployment. As a result, inspections and support are often hampered more by the lack of transport and agility than by sheer shortages of personnel. (They are also hampered by the skills and focus of the personnel.) Nevertheless, there is an evaluation system in place that seems well organized from an operations management point of view (at least in theory), which is better than most education systems have. One needs to work on a better allocation of resources (fewer inspectors with means of transportation and maintenance), the content and skills needed for the inspections and the support, as well as on the logistical management and transport finances to make inspections work better in practice.
It should be noted that there is indeed a great need for teacher observation and improved teaching in classrooms. Casual observation carried out by this team, of a teacher selected as a good one by a principal, showed little coordination of teacher behavior with the presence of books, resulting in ineffective pedagogical practice and

Task Order 11: Gap Analysis: Education Information and 39 Education Policy and Planning in Mozambique
inefficient use of instructional time. As an example, with reading materials in the children’s hands (though one should note that at least the children had plenty of materials, which is more than one can say about other countries), the teacher copied what was already in the text, in print, to the board, in cursive, which discourages student engagement with either the board or the printed matter (see Illustration 3) and results in a waste of time. Most of what passed for reading was choral repetition (not choral reading processing, since the children’s eyes were not on the text or the board). An assessment of the children in the classroom on the lesson they were engaged in showed they could not read that very lesson.
Illustration 3. Need for better teacher practices such as board-book coordination
Teacher monitoring, coaching, and supervision should use high-quality forms that assess both the delivery of specific aspects of lessons (e.g., forms for how teachers teach something like grade 1 or grade 2 reading) as well as general ability of the teacher to engage the pupils. This is a key aspect of what one means by “information.” While this information does not come from EMIS or household surveys, it is perhaps one of the most important types of information an education system, especially a developing education system, can use. Examples of such forms are provided in Appendix 6. These are samples only; there is no recommendation implied that these are appropriate for Mozambique.
Instructional hours
The number of instructional hours is critical in student learning, given the fact that good learning cannot be accomplished only by having good teachers, infrastructure, and learning materials. Sufficient time needs to be spent in classrooms for children to learn and gain the skills that they need from school. The EMIS survey asks for the number of hours in each shift by school level, which depends on the number of shifts that the school has, but this is more of an official number of expected hours of time on task. These data are not found in the published EMIS database or reports, but the education sector planning documents as well as analysis reports cite 600 hours per year as the national average instructional hours in Mozambique. The ideal number of hours set by the government is 1,024, almost double the reported national average, and the ESSP III has a target set at 900 hours. Currently, there is no survey or
40 Task Order 11: Gap Analysis: Education Information and Education Policy and Planning in Mozambique
evaluation system that records the actual hours of time-on-task at the school level. It has to be noted that actual, effective hours are a different matter from the number of hours available. The latter can be increased by, for instance, reducing the number of shifts. The former requires effective management and supervision.
According to a school effectiveness study conducted by the Education Quality Improvement Project 2 and the Aga Khan Foundation in Cabo Delgado province, if time is prorated to day-equivalents, the actual days of time on task came to an average of 30 days out of 183 official school days, which is alarmingly low. The equivalent hours, applying the same ratio, would be approximately 150 hours per year rather than the reported 600 hours and the expected 900 hours. Out of five expected hours in school on a daily basis, only about 50% of the school time was spent in classrooms (2.5 hours), and a large portion of the rest 50% of non-classroom time was wasted by late start or early dismissal. Compared to other countries that participated in this study, Mozambique scored the lowest on time on task.
Bilingual education
In Mozambique, Portuguese is the official national language and is spoken as a lingua franca by about 40% of the population, with about 6.5% using it as their mother tongue. Among school-entrance-age children, only 5% speak Portuguese as their mother tongue, and the rest speak one of 20 Bantu languages or another local language. From 1983 to 2003, Portuguese was the only language of learning in the education system, which left the majority of children entering school to immediately face the challenge of learning a new language. If all subjects, including, vitally, early reading, are also taught in a language that is relatively new to most children, learning in school is most likely greatly challenged with a language barrier even from the start. One has to note that this same population of children could read and write more proficiently in their mother tongue and learn better and more if they were taught in their own language.
The Mozambican education system has acknowledged this challenge and initiated pilot work in bilingual education with 1,350 students in 2003. The work was conducted by INDE, Progresso (a Mozambican NGO), the Danish International Development Agency (DANIDA), and a few other partnering organizations. The pilot work was evaluated, and the evaluation results favored bilingual education. By 2008, bilingual education was reaching 21,500 pupils in 75 out of some 12,000 primary schools nationwide. The challenge was then with nationwide implementation and with training sufficient teachers through pre- and in-service training to meet the demand for bilingual education, when there were already scarce resources to train teachers. The new teacher training curriculum that is under development at IFPs will include modules to train bilingual education teachers. Mozambique is implementing a model for bilingual education with 16 options/languages that are spoken all over the country, which teaches early grades (primary grades 1–3) in the local language with an introduction of Portuguese oral and written courses, and gradually transits the instructional language to Portuguese from primary grade 4, with the local language as a discipline in the curriculum. Bilingual education is also offered in rural areas, especially to grade 1 students who are assumed to not understand or speak
Task Order 11: Gap Analysis: Education Information and 41 Education Policy and Planning in Mozambique
Portuguese. However, this is not compulsory as of now, and parents have to show interest in enrolling their children in a bilingual system. For improved early literacy skills, in 2008, Save the Children began an Early Literacy Program (Literacy Boost) in 10 schools in Gaza province, reaching 7,800 pre-school and primary school-age children (age 3–10). The main thrust of the program involves teacher training and ongoing support for formal classroom teachers in primary school, and recruitment and training for community members to work with pre-school children. This program was taught in Shangana and Portuguese, and the evaluation results show that the literacy skills improved more significantly for those who were taught in their mother tongue in early childhood development.
Some confusion over many of these issues seems to prevail, and it certainly affected our ability to get precise and clear data and information on the issues, both in terms of what is currently happening and what the options may be for the future (or on an ongoing basis). For instance, there seems to be some confusion over the very definition of a bilingual teacher: is it one who has been certified as such or has a title or some other formal bureaucratic recognition as such; or is it one who, through some training, or through the possession of a language, is effectively equipped to teach in a bilingual program; or is it, indeed, one who, for one reason or another, finds himself or herself teaching in a bilingual education program or pilot project after some training? It may be that some of the confusion we faced has to do with issues of definition and policy clarity. If there are these sorts of confusions in the policies and definitions, it would be good to clarify them.
Furthermore, and much more importantly, there may be policy or pedagogical lack of clarity as to what a formally recognized bilingual teacher (or one “allowed” to informally work in this area) ought to know, depending on the nature of the program they are supposed to be working in and the approach to bilingual education being used, particularly in early reading, by the Mozambican education system (or by particular programs and projects aimed at defining the overall approach). It is not at all our intent to trivialize the issue here. But if the most important point of early reading instruction in mother tongue (not instruction in the mother tongue per se, as a subject) needs to focus on some simple oral comprehension and initial decoding, it is not clear that the teacher has to be a particularly good native speaker or necessarily highly proficient in the language in question. The matter needs to be approached in a manner that is as practical and simple as good research allows, without falling into the quick expedient of instituting more simplicity than is possible, or instituting crash programs that will then give bilingual education a bad name and cause a setback. Without falling into the realm of shoddy programs, though, it is worth thinking about some simple issues, such as how much vocabulary is needed to teach (and learn) to decode in the mother tongue to the point where comprehension can ensue, and skills then transfer to Portuguese. It may be smaller than is commonly thought. After all, early reading books ought not to introduce too many vocabulary words anyway. Similarly, if two mother tongues are sufficiently close phonemically and in key vocabulary needed for comprehension of simple stories, it is not clear that one needs highly specialized teachers in schools where more than one mother tongue is present (if these are relatively similar). Striking this balance is key, is not easy, and is more

42 Task Order 11: Gap Analysis: Education Information and Education Policy and Planning in Mozambique
often influenced by ideology or uninformed conventional wisdom than by practicality and science. On the other hand, as noted, it is also important to avoid over-simplifying and undervaluing the importance of bilingual education or embarking in badly designed crash programs.
The INDE has been taking the lead in developing the curriculum, in piloting bilingual education studies in partnership with aid agencies and NGOs, and developing capacity by training teachers through IFPs. Since 2007, all IFPs started offering an introduction to Bantu languages and pedagogical methodology courses on bilingual education. However, they do not (yet) offer a specialization as such (and this may explain some of the confusion we faced); there is some training, but not a specialized program as such. Currently, INDE and MINED are collaborating in expanding bilingual programs by re-writing training curriculum and training selected teachers and volunteers (again leading to informality of definitions which may cause confusion as to numbers and intensity of programs). The current plan by the Ministry is to gradually expand bilingual education nationwide according to the parents’ demand and the availability of teachers and learning materials. However, with the goal of promoting national unity, introduced by the government, IFP graduates are currently often being assigned to locations that are not of their origin or mother tongue. Similarly, some cross-regional assignment takes place because planning and allocation are not perfect, and some IFPs produce more teachers than are needed locally, while others under-produce. While promoting national unity is a laudable goal, this diversification in allocation of teachers to locations of non-origin also challenges teachers to learn and to teach in a new language (even if fairly close ones), which would likely affect student learning in early grades. Experimental work carried out by Carol Benson in Mozambique (2000) showed that bilingual schools had more dynamic classroom interactions and higher learning achievement than monolingual schools, which is in accordance with evidence from other countries. At the same time, if the practical option is tofocus on early reading skills, which may require only a limited vocabulary, then the “national unity” assignment policy may not be totally incompatible with one of using mother tongue in particular for initial reading skills. On the other hand, there is also evidence that longer and deeper instruction may also be beneficial. Work carried out by Jessica Ball for UNESCO (2010) suggests that children need at least six years of education in their mother tongue to become fluent bilingual speakers and readers. Sorting out the practicalities of these issues, and the tradeoff involved in getting started with an approach that is sufficient but not perfect while also working on perfecting the approach over time, versus waiting for perfection before getting started, are all key matters beyond the scope of our work, but should be noted.
It is also critical to note that without properly trained teachers with good pedagogy practiced in classrooms for actual learning and skilling, whether taught in mother tongue or in Portuguese, children in Mozambique could continue to experience difficulties developing literacy skills and learning skills consequently, unless teaching quality improves with sufficient teachers that are able to teach bilingually proficiently. The issue of proficiency in teaching reading should not be overshadowed by the choice or depth of use of bilingualism. If teachers continue to teach (reading, say) as
Task Order 11: Gap Analysis: Education Information and 43 Education Policy and Planning in Mozambique
poorly as they currently seem to do, shifting to mother tongue will not accomplish much in any case.
Finally, it will be important to develop the informational resources to deal with all this. The Mozambican education system currently does not have a way to assess or capture the variety and prevalence of mother tongues at school or district level, nor is there a serious evidentiary base on how well mother-tongue instruction is working (or will work as it is more widely implemented), or how to make it work well. It will be useful for the Ministry to develop a system that measures and tracks student performance with bilingual education, as well as the processes of bilingual education systems development itself, to learn its effectiveness and needs in Mozambique and be a useful resource to those countries that may be faced with the same challenge.
Discussion Based on ESSPs, other analysis and planning reports by donor agencies, interviews conducted at the MOE, and site visits in Nampula province, it is clear that Mozambique has been implementing appropriate policy suggestions based on internal discussions and the advice of cooperating partners. This shows the system is capable of creating the good practice of feedback loops at the national level, even without a coherent and integrated system overall that makes all decision making simpler and transparent at all levels and keeps track of teacher information needed to improve quality. The basic systems in place have most of the operational characteristics needed, even if the pedagogical content is not as good as it ought to be, as discussed in other sections and as evidenced by the low levels of learning outcomes in children.
There seems to be a coordination and feedback loop across sub-nation and sub-sectors of the system, although the data in such loops may not be as systematically presented, recorded, or tracked as desirable, and even if perhaps the allocations are not as formula-based or explicitly algorithm-based as they could be (to increase transparency and encourage own-level planning and resource allocation). The majority of decisions and plans seem to be made based on data and by consensus of those involved. The officials working in school, district, province, and national directorates do seem to negotiate more based on a sense of their absolute needs than on a sense of their fair share, and seem to “upward delegate” the fairness of their shares of need to the higher levels of government, while mostly making claims with regard to their absolute needs. This is of course better than not relying on data at all, but is not as transparent and efficient as it could be.
In general, EMIS provides the basic and perhaps most fundamental data on teachers that are necessary for planning. However, there are some characteristics of data that are not being utilized or studied. The EMIS system seems to be functioning well, producing data in timely manner and incorporating suggestions that are mutually agreed to by EMIS and operational units. At the same time EMIS has kept its surveys simple and easy by not making them too extensive, which may help with data accuracy and certainly helps with speed and percentage of returns. A few sub-sectors at the MOE have developed their own surveys to collect information that is pertinent to teachers according to their needs, which seems to be a good practice, so that it is

44 Task Order 11: Gap Analysis: Education Information and Education Policy and Planning in Mozambique
more manageable in terms of carrying out plans autonomously from data collection to analysis with close communication with survey respondents.
In Mozambique, information exists and is recorded in some form in most directorates that deal with teacher data or information. Systems for visiting schools and transferring information between inspection and support visits, or between in-service training and follow-up, are well designed in theory, and in some areas are in fact implemented. However, implementation may not be as intense as desirable, either due to lack of personnel or due to an imbalance between types of personnel (“inspection” functions versus “support” functions and personnel versus non-personnel expenditures—e.g., if personnel do not have a budget to get to schools, the personnel are superfluous in practical terms). Actors are aware of available data and pertinent information for their specific job functions. Thus, in a flow-chart or diagrammatic sense (theory) and to some extent in practical terms (that is, subject to budget and budget-balance limitations), basic systems are in place, in theory if not always in practice. However, when it comes to quality control, there are problems exist. First, there is little systematic analysis and tracking (at some relatively central level with the capacity to analyze and make policy suggestions) of what the systems actually do and what results they produce. In addition, the pedagogical content of the systems (e.g., systems of teacher in-service support and follow-up), judging both by the style of teaching in the IFPs and the style of teaching by teachers themselves, is clearly inadequate. A relentless focus on what actually happens on the ground and the effectiveness of teacher behavior (i.e., use of time, reduction in memorized repetition instead of decoding and comprehension in reading), however, is something that will take some time to achieve and must start immediately.
A few specific suggestions on information gathering on teachers and its utilization follow:
• Better use of EMIS’ detailed and disaggregated level data for projecting more accurate teacher needs (i.e., teacher attrition, number of shifts taught, percent of unqualified teachers)
• Dissemination and use of uniform format of HR database at the national, provincial, and district offices for better aggregation and use of data
• Documentation of formulas or tools used to project and calculate financial and HR allocations
• Evaluation of and feedback loop on the content and effectiveness of pedagogical methodology taught through IFPs in classroom settings
• Development of the teacher evaluation system that will be carried out regularly and be followed up with supervision that truly improves teaching and learning
• More cost-effective allocation of financial resources for school inspections to have both the means of transportation and skills needed to carry out school inspections on a regular basis

Task Order 11: Gap Analysis: Education Information and 45 Education Policy and Planning in Mozambique
• Serious monitoring and enforcement of instructional hours and time on task, accompanied with classroom observations to ensure classroom teaching standards
• Documentation and tracking of the processes of systems development and the progress and achievement in student learning with bilingual education
• Development of technical and analytical capacity at all regional directorates, especially at provinces and districts with decentralization, to cultivate a culture of policy dialogue and evidence-based education planning
3.4 Information in budgeting, allocation, and expenditure tracking
Budgets, budget planning, and allocations Data used in the budget and planning process is extensive, with indicators for targeting development priorities drawn from an effective EMIS system and budgets drafted with cost inputs drawn from a well-developed government financial accounting system, e-SISTAFE. Mozambique’s ESSP directs the annual budget cycle and has clearly drafted priorities based on input, quality, expenditure, and outcomes indicators, most of which are tracked annually.
ESSP II The country’s education development is guided by the GOM’s overarching Strategy for the Reduction of Absolute Poverty (PARPA) which seeks to ensure “that all citizens—boys, girls, women, and men wherever they may be—have the opportunity to acquire the basic knowledge and skills necessary to contribute to and benefit from national development” (ESSP II, 2005). Aligning with the PARPA objectives is the ESSP, which is currently drawing to the end of its second cycle—ESSP II 2006–2010/11. Both the education targets in the PARPA and the ESSP are prioritized on the basis of indicators that are tracked annually.
The ESSP II document includes a review of the achievements of the ESSP I, the goals and progress toward the Millennium Development Goals (MDGs), the PARPA, and Education for All/Fast-Track Initiative (EFA/FTI). The ESSP also locates its projected funding needs within the national Mid-Term Expenditure Framework (MTEF)
Indicators for increasing access to and quality of primary schooling to be tracked by the ESSP and the PARPA are the following:
• Number of pupils • Net enrollment rate • Gross enrollment rate • Primary school completion rate by gender • Dropout and repetition rate by gender • Use of double or triple shifts • Net enrollment rate of 6-year-olds in first grade • Percentage of girls admitted other than 6 years of age • Percentage of schools with complete primary cycle

46 Task Order 11: Gap Analysis: Education Information and Education Policy and Planning in Mozambique
• Pass rate, 5th and 7th grade • Performance of students in Portuguese and Maths5 • Teachers’ qualification levels • PTR • PCR • Textbook to pupil ratio6
Indicators for literacy and post-primary education are also tracked for budget prioritization:
• Literacy − Illiteracy rate − Number of literacy program participants
• Post-primary education (excluding Higher Education) − Students − Gross enrollment rate − Gender parity − Transition rate
The following key financing indicators are tracked annually: • Percent for education in total government expenditures • Percent for primary education in education expenditures • Percent for primary education in FASE expenditure • Percent non-salary recurrent expenditures
Other ESSP targets include increasing access to adult and non-formal education; increasing access to secondary education, including technical and vocational education and training (TVET); improving the quality of teacher training; increasing access to education for learners with special needs; improving gender equity; providing a sector-wide response to HIV/AIDS; increasing access to school sports; and increasing access to information and communication technologies (ICT).
Provincial priorities
While inequality in provinces’ poverty levels and education access and attainment are addressed in the ESSP and targets are set for eliminating these access and attainment inequalities, the ESSP document does not include tables of longitudinal data with which to monitor these interprovincial indicators. In general there is some ad hoc and ex-post analysis of reductions in inequalities (e.g., in the FTI funding application document noted immediately below), but as noted, these tend to be somewhat ad hoc and ex-post; explicit and ex-ante inequality targeting and use of simple and
5 The performance indicators in italics (learner outcomes) are currently composed of test results run by the school internally. Plans are in progress to improve external assessment processes. (See section on Examinations and Assessments.) 6 All indicators except the last 4 are tracked by gender.

Task Order 11: Gap Analysis: Education Information and 47 Education Policy and Planning in Mozambique
transparent formulas and algorithms with an inequality or poverty orientation is an area that needs work.
The Programme Document for the Funding Request to the Catalytic Fund (FTI) (MOE, 2010) includes longitudinal interprovincial comparative indicators, data for which are readily available at the MOE and in other institutions. And indeed, they are used by a number of agencies both within the MOE and externally, such as those from the Ministry of Development Planning’s National Directorate for Studies and Policy Analysis (Direcção Nacional de Estudos e Análise de Politicas [DNEAP]) to produce occasional reports which provide policy tracking information on these issues. It was not clarified by the team whether tracking such as that done by DNEAP is systematically included into the national budget negotiation process or more of an ad hoc review; it seems more the latter.
While interprovincial expenditure equity is not explicitly utilized during the budget prioritization process, the drivers of expenditure equity, such as PTRs, textbook provision, the ADE, and so forth, are fairly explicitly equity-targeted and tracked. Budget and expenditure data is readily available to analyze interprovincial (vertical) and inter-level (horizontal) equity issues.
The following table is an indicative analysis of interprovincial equity in the per capita pupil budget allocations. Drawn from the Nota Explicativa PdA 2011 (versao COPA – DPECs), 17 de Dezembro de 2010 (Explanatory note on the PdA, 2011) which provides budget allocation data to the district level, this example illustrates the wealth of extremely timely and accurate data that is collected and utilized by the MOE in Mozambique.
Table 1. Per capita budget allocations as a percentage of the national per capita budget allocations, 2011
Budget allocations on Provincial Directorate for Education and
Culture (DPEC) and the District Services of Education, Youth, and
Technology (SDEJT) (excludes FASE)
Budget allocations for SDEJT only (excludes FASE)
Province
Per capita spending
(primary and secondary
pupils)
Percentage of national per
capita
Per capita spending
(primary and secondary
pupils)
Percentage of national per
capita
Niassa 2,062 95% 1,510 93%
Cabo Delgado 2,639 121% 2,172 134%
Nampula 1,848 85% 1,280 79%
Zambézia 1,562 72% 1,301 81%
Tete 2,368 109% 1,939 120%
Manica 2,598 119% 2,010 124%
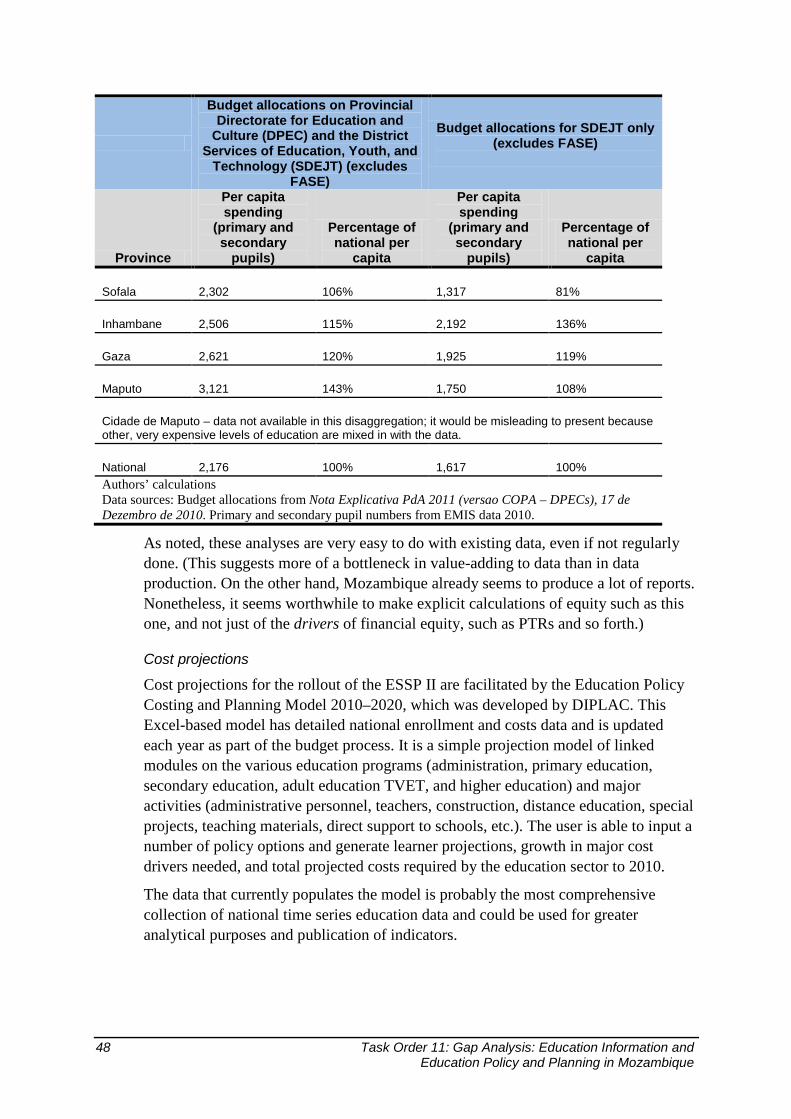
48 Task Order 11: Gap Analysis: Education Information and Education Policy and Planning in Mozambique
Budget allocations on Provincial Directorate for Education and
Culture (DPEC) and the District Services of Education, Youth, and
Technology (SDEJT) (excludes FASE)
Budget allocations for SDEJT only (excludes FASE)
Province
Per capita spending
(primary and secondary
pupils)
Percentage of national per
capita
Per capita spending
(primary and secondary
pupils)
Percentage of national per
capita
Sofala 2,302 106% 1,317 81%
Inhambane 2,506 115% 2,192 136%
Gaza 2,621 120% 1,925 119%
Maputo 3,121 143% 1,750 108%
Cidade de Maputo – data not available in this disaggregation; it would be misleading to present because other, very expensive levels of education are mixed in with the data.
National 2,176 100% 1,617 100% Authors’ calculations Data sources: Budget allocations from Nota Explicativa PdA 2011 (versao COPA – DPECs), 17 de Dezembro de 2010. Primary and secondary pupil numbers from EMIS data 2010.
As noted, these analyses are very easy to do with existing data, even if not regularly done. (This suggests more of a bottleneck in value-adding to data than in data production. On the other hand, Mozambique already seems to produce a lot of reports. Nonetheless, it seems worthwhile to make explicit calculations of equity such as this one, and not just of the drivers of financial equity, such as PTRs and so forth.)
Cost projections
Cost projections for the rollout of the ESSP II are facilitated by the Education Policy Costing and Planning Model 2010–2020, which was developed by DIPLAC. This Excel-based model has detailed national enrollment and costs data and is updated each year as part of the budget process. It is a simple projection model of linked modules on the various education programs (administration, primary education, secondary education, adult education TVET, and higher education) and major activities (administrative personnel, teachers, construction, distance education, special projects, teaching materials, direct support to schools, etc.). The user is able to input a number of policy options and generate learner projections, growth in major cost drivers needed, and total projected costs required by the education sector to 2010.
The data that currently populates the model is probably the most comprehensive collection of national time series education data and could be used for greater analytical purposes and publication of indicators.

Task Order 11: Gap Analysis: Education Information and 49 Education Policy and Planning in Mozambique
The budget process
The national budget process is led by MOF, and sector plans for education are developed by the national MOE as a process of budget requests forwarded from the school level upwards. Budget requests are submitted by schools to the district education offices, combined, including budget requests for the district office expenses, and forwarded to the provincial education offices. Provincial budget requests combine the district office budget request, include provincial budget requests, and are forwarded to the national MOE. The national MOE compiles the provincial budget requests and enters them into the e-SISTAFE accounting system. It seems apparent that though there is a will to decentralize, most planning and budget setting is still of a fairly traditional bottom-up, top-down, negotiated process, rather than one that uses simple and powerful funding formulas and then encourages horizontal (own-level) prioritization and target setting. It may be that, given the shortage of skills at the provincial level, this is all that can be expected for now.Education budget requests are submitted according to the framework stipulated by MOF, which requires the following disaggregation:
• Summary economic classification and sub-classification. Economic classifications are salaries and remuneration, other staff expenditure goods, services, transfers, and capital goods.
• Program and sub-program by level of education and economic classification • Program and sub-program by level of education and source of funds. These
are internal funding sources, external funding sources, FASE, and other sources of cash and goods.
• Activities. The 14 major activities are salaries and remuneration, construction, refurbishment and maintenance, distance education, HIV/AIDS prevention and mitigation, social action, institutional functioning, school books, materials and equipment, direct support to schools, teacher training and capacity building, examinations, school sport, and HR development. However, budget requests have to be disaggregated by sub-activity.
• Separate budget requests for the hiring of new staff. The number of new staff to be hired is authorized by the national MOF.
Budget requests are submitted with a far greater level of detail expected than is available in the expenditure reports (as will be seen in the following section). According to senior MOE staff interviewed, the submission of sub-activity level budget items by economic classification is extremely time consuming; limits the flexibility of changing budget line items because these become delayed in the process of approval by MOF; and ultimately, since these items are not tracked in the expenditure reports, is somewhat superfluous. It also tends to encourage a negotiation mentality rather than a planning or MTEF mentality.
The planning cycle in Mozambique starts shortly after the March 3 EMIS data has been collected, captured (at the district office), and checked by the district office. Schools begin the planning process by compiling their expected learner numbers for the next school year. These are constructed as a combination of the enrollment from

50 Task Order 11: Gap Analysis: Education Information and Education Policy and Planning in Mozambique
the current school year and discussions with community leaders as to whether they expect the number of new entrants to increase for any particular reason, plus some analysis of the inertia in past enrollment trends. It appears to be fairly data-driven, though the data-driven aspects are somewhat expert-based and expert-negotiated rather than simple and transparent (except for the notable and meritorious exception of the ADE).
On the basis of estimated enrollment, schools submit their requests for teachers, classrooms, and general funding requirements to the district office, where they are compiled into the district budget.
District budgets are then discussed at a provincial budget meeting, and the province compiles the provincial budgets, which are submitted to both the MOE and the provincial MOF.
Budget requests from schools, districts, and provinces are loosely based on “need,” which is generally understood as the extent to which a school may be disadvantaged in relation to the district average in its inputs such as teachers, classrooms, and number of shifts taught. While keenly aware of their position in relation to district indicators and to some extent aware of what the national targets are for reducing pupil/classroom, teacher, or textbook ratios, there does not appear to be a process of reporting the MTEF to the schools, districts, and to some extent provinces, or of making the allocation processes as transparent as possible. One possible reason for relative lack of transparency is complexity. The multitude of programs, each with its own priorities, and the complexity of the decision rules involved might make it very difficult to be fully transparent, as transparency (or meaningful transparency) requires simplicity (e.g., simplicity of budget allocation formulas, or the actual existence of explicit formulas).
The budget allocation process begins with a national meeting of all government departments led by MOF. Having received confirmation of the national education budget allocations, the national MOE then allocates
• the provincial budget ceilings in coordination with the national Ministry of Planning,
• the ADE budget for each school, • the number of new educators that each province may allocate, and • the number of new classrooms that the province may build (based on a
combination of need and ability in previous years to build classrooms).
The provincial administration then allocates • the budget for each school, • the new educators for schools, • the number of classrooms to be built by each district, • the ADE budget for each school, and • other FASE budgets to either districts or schools.

Task Order 11: Gap Analysis: Education Information and 51 Education Policy and Planning in Mozambique
In conclusion, data available for the budgeting process is extensive. This is due to both the effectiveness and timeliness of the EMIS data as well as the scope and capacity of the financial management systems implemented by the MOF and managed by the MOE at the national, provincial, and district level. In some cases, it appears that more data is required for the budget process than is always cost effective to produce. Certainly more data is available than is cost effective to analyze.
However, highly specific indicators for targeting and tracking policy priorities are incorporated into the budget and planning processes. Some indicators, which could be illustrative and for which there is data available, are not systematically tracked—the most notable being per capita and expenditure equity between provinces.
Funding formulas Currently there are a number of different methods used to allocate funding to education programs and projects. These range from simple per-pupil allocations (as in the case of textbooks) to the bottom-up budget requests that are based on input requests (predominently aimed at decreasing PTRs) and top-down allocations whose method is not absolutely clear. This latter, which allocates the largest percentage of education funding through teacher salaries and school expenses, is particularly opaque. While notionally based on the policy targets of improving access and learner outcomes, allocations appear to be the result of several intersecting pressures, namely the need to maintain historical levels of finance while redressing under-resourced areas; political imperatives to decentralize while ensuring the implemetion of national policies; and maintaining prudent fiscal accountability and control under a situation of extreme fiscal austerity. These somewhat difficult to reconcile tensions give rise to funding formulas or methods that are opaque on the one hand and overly complex on the other.
The budget allocation process is extremely data intensive—including a combination of historical expenditure, per pupil allocations, PTRs (or PCRs), and community indicators—depending on which expenditure program or project is being funded. In all sectors and levels of education management interviewed (including schools), there was a high level of awareness of the data and indicators that were used to input into the budget requests. However, without exception, no one could articulate any clear structure or proceedure for how the budget allocations were derived. In addition, even where funding formulas were on a simple per capita basis, very few of the school managers interviewed knew this to be the case. While most managers agreed that funding was determined by the extent to which a school may be over the district, provincial, or national average—especially with regard to PTR and class size—none were aware of any specific formula used by the national MOE to allocate budgets.
Similarily, school building allocations are based on a combination of historical expenditure patterns (in this case, the proven ability to actually build classrooms) and need (broadly measured by the PCR). Again, in relation to classroom building, the criteria, while clearer than those for school funding, were not entirely clear. Discussions of enhancing the GIS system so that a more complex targeting indicator could be derived have been addressed earlier in this report. And, as noted, this process
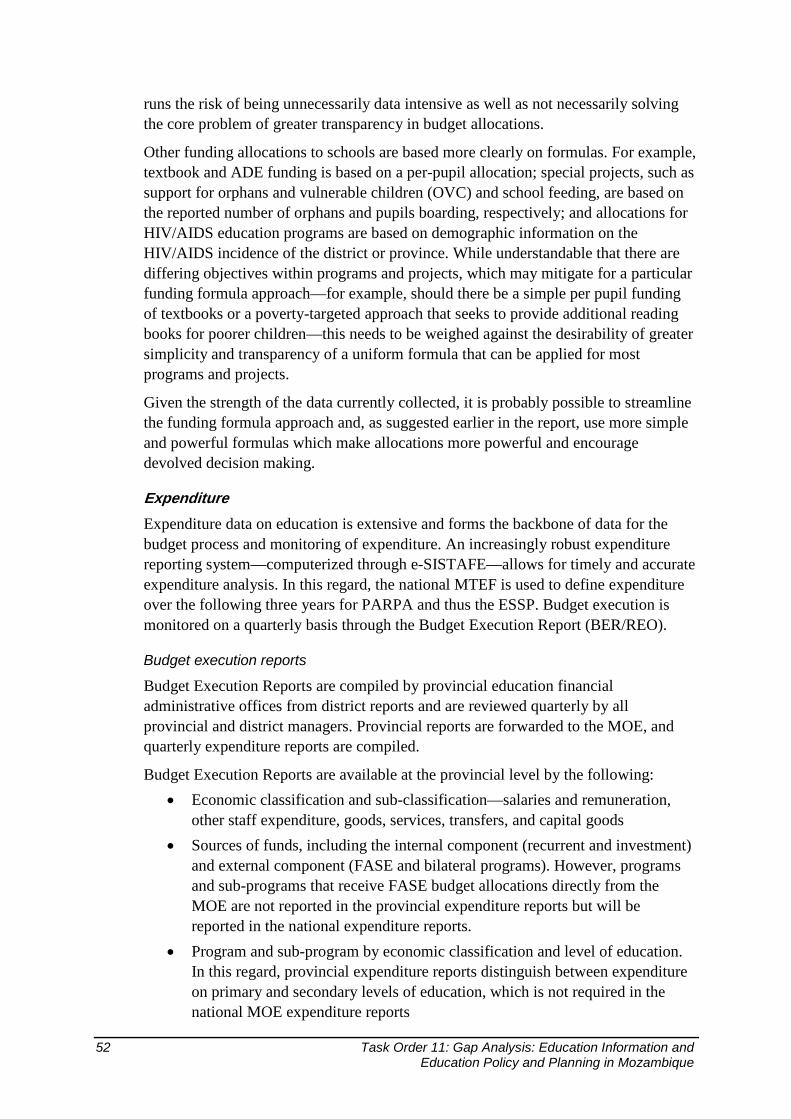
52 Task Order 11: Gap Analysis: Education Information and Education Policy and Planning in Mozambique
runs the risk of being unnecessarily data intensive as well as not necessarily solving the core problem of greater transparency in budget allocations.
Other funding allocations to schools are based more clearly on formulas. For example, textbook and ADE funding is based on a per-pupil allocation; special projects, such as support for orphans and vulnerable children (OVC) and school feeding, are based on the reported number of orphans and pupils boarding, respectively; and allocations for HIV/AIDS education programs are based on demographic information on the HIV/AIDS incidence of the district or province. While understandable that there are differing objectives within programs and projects, which may mitigate for a particular funding formula approach—for example, should there be a simple per pupil funding of textbooks or a poverty-targeted approach that seeks to provide additional reading books for poorer children—this needs to be weighed against the desirability of greater simplicity and transparency of a uniform formula that can be applied for most programs and projects.
Given the strength of the data currently collected, it is probably possible to streamline the funding formula approach and, as suggested earlier in the report, use more simple and powerful formulas which make allocations more powerful and encourage devolved decision making.
Expenditure Expenditure data on education is extensive and forms the backbone of data for the budget process and monitoring of expenditure. An increasingly robust expenditure reporting system—computerized through e-SISTAFE—allows for timely and accurate expenditure analysis. In this regard, the national MTEF is used to define expenditure over the following three years for PARPA and thus the ESSP. Budget execution is monitored on a quarterly basis through the Budget Execution Report (BER/REO).
Budget execution reports
Budget Execution Reports are compiled by provincial education financial administrative offices from district reports and are reviewed quarterly by all provincial and district managers. Provincial reports are forwarded to the MOE, and quarterly expenditure reports are compiled.
Budget Execution Reports are available at the provincial level by the following: • Economic classification and sub-classification—salaries and remuneration,
other staff expenditure, goods, services, transfers, and capital goods • Sources of funds, including the internal component (recurrent and investment)
and external component (FASE and bilateral programs). However, programs and sub-programs that receive FASE budget allocations directly from the MOE are not reported in the provincial expenditure reports but will be reported in the national expenditure reports.
• Program and sub-program by economic classification and level of education. In this regard, provincial expenditure reports distinguish between expenditure on primary and secondary levels of education, which is not required in the national MOE expenditure reports

Task Order 11: Gap Analysis: Education Information and 53 Education Policy and Planning in Mozambique
• New staff hired. A separate expenditure report is available for the hiring of new staff since the number of new staff to be hired each year is authorized by the national MOE.
• While expenditure is reported by economic classification and sources of funds, including internal funding sources, external funding sources, FASE, and other sources of cash and goods, no specific programs that receive FASE budget allocations directly from the MOE are reported in the provincial expenditure reports.
Expenditure reports drafted by the national MOE are presented at a higher level of aggregation and only report on programs. This affects especially the ability to offer a differentiated analysis of primary and secondary education expenditure. While it is pragmatic to simplify the expenditure reports at the national level and only report on programs, this has been identified as a shortcoming of the use of expenditure data on schools for monitoring purposes.
The following graph is shown as an example of an extremely useful indicator that is limited by the lack of disaggregated expenditure data available by primary and secondary education. This graph was published in the Programme Document for the Funding Request to the Catalytic Fund (FTI) (MOE, 2010), tracking expenditure on general and higher education. The report comments that
although official information regarding expenditure on other levels of education is not available at present, it is estimated on the basis of sector-level information that more than 50% of the education budget was spent on primary education (FTI MOE, 2010:72).
Figure 8. Expenditures in the sector for general education and higher education (in volume and percentage), 2005–2009
Source: FTI (MOE, 2010:72)
Expenditure indicators
Regular monitoring of expenditure indicators is required for the MTEF process and budget planning process. The following key financing indicators are tracked annually:
• Education expenditure as a percentage of GDP • Share of education sector expenditure as part of the state budget

54 Task Order 11: Gap Analysis: Education Information and Education Policy and Planning in Mozambique
• Comparison between budget allocations and budget execution • Expenditure by level of education (schools, TVET, and higher education) • Expenditure on salaries and non salaried component of education • Expenditure of external support and comparison with total state expenditure in
education • Execution of FASE and bilateral budgets • Expenditure on externally funded programs
Unit expenditure comparisons
As mentioned above, while data exists, unit expenditure comparison analysis is scarcely performed—either at the horizontal or vertical level.
While interprovincial expenditure on equity is not explicitly tracked, proxy indicators on expenditure equity, such as provincial level PTRs and PCRs by level of education, are tracked regularly. These have wide awareness at national, provincial, and district level and are used extensively in budget planning and monitoring. As an example of the way in which this is currently published, the figure below was extracted from the Programme Document for the Funding Request to the Catalytic Fund (FTI) (MOE, 2010). These indicators are also explicitly included in the budget process.
Figure 9. Pupil-teacher ratio at EP1, 2006 and 2010, and pupil-classroom ratio in 2010, per province
Source: FTI (MOE, 2010:42)
The data suggest a clear reduction in PTR disparity and exemplifies a good process of using data for targeting need. (Note mislabeling in the original graphic. The higher bars refer to 2006.)
In terms of vertical equity in education expenditure, while data exists for this analysis, it is not readily available from the annual expenditure reports. As mentioned above, disaggregation of education by primary and secondary spending is not available in the

Task Order 11: Gap Analysis: Education Information and 55 Education Policy and Planning in Mozambique
national expenditure reports, and data on higher education spending requires additional analysis if it is to be analyzed in per capita terms. These data have been collected and analyzed, and they are available in Education Policy Costing and Planning Model 2010–2020. However, tracing these indicators in public MOE documents proved extremely challenging. The following table from the UNESCO Institute for Statistics (UIS) gives 2006 data, and even this source does not have data available for tertiary education enrollment.
Table 3. Indicators showing the split between spending on level of education: primary, secondary, and tertiary, 2006
Indicators 2006
Enrollment in primary. Public. All programs. 4,086,981
Enrollment in total secondary. Public. All programs. 318,070
Enrollment in tertiary. Public. All programs 32,081*
Educational expenditure in primary as % of total educational expenditure 57.6%
Educational expenditure in secondary as % of total educational expenditure 29.3%
Educational expenditure in tertiary as % of total educational expenditure 12.1%
Public expenditure per pupil as a % of GDP per capita. Primary 14.8%
Public expenditure per pupil as a % of GDP per capita. Secondary 85.0%
Public expenditure per pupil as a % of GDP per capita. Tertiary
Total expenditure on educational institutions and administration as a % of GDP. Public sources. Primary 2.8%
Total expenditure on educational institutions and administration as a % of GDP. Public sources. Secondary and post-secondary non-tertiary 1.5%
Total expenditure on educational institutions and administration as a % of GDP. Public sources. Tertiary 0.6%
Sources: UIS www.uis.unesco.org, downloaded on 03/05/2011. Higher education enrollment from the Education Policy Costing and Planning Model 2010–2020 (MOE, 2010).
Spending incidence
While the MOE does not collect data on the incidence of spending across income quintiles, other government agencies have engaged in several studies that have collected education spending incidence data.
Most importantly, IAFs, Household Budget Surveys (IOFs), and Labor Force Surveys conducted every five years by INE would yield the data needed for education spending incidence studies. See section “Access and Completion” above for details on the data available for education analysis.

56 Task Order 11: Gap Analysis: Education Information and Education Policy and Planning in Mozambique
Other reports and surveys, most notable of these the recent Report on the MDGs 2010 (GOM, 2010), report on education attainment by income quintiles. Based on data collected during the Multiple Indicator Cluster Survey 2008 (INE, 2008), the Report on the MDGs 2010 includes both education attainment data and other social issues which would affect school-aged children, such as malnutrition and HIV/AIDS prevalence rates, by income quintile. Some education attainment data is available by wealth quintile, as shown in Figure 10.
Figure 10. Net primary education enrollment rate for 6–12 year-old children by wealth quintile of their families
Source: Report on the MDGs (GOM, 2010: 41)
In terms of spending incidence analyses, while the household data exists in the various household surveys conducted, unit cost expenditure is more difficult to access, and as far as can be ascertained, a report by the World Bank on poverty, gender, and social assessment using data from the IAF 2003 appears to be the most recent spending incidence analysis done of the education sector. Figure 11 shows the distribution of spending across income quintiles.
Figure 11. Benefit incidence: education expenditure allocation by quintile, 2003
Source: World Bank (2008) Mozambique Beating the Odds: Sustaining Inclusion in a Growing Economy: A Mozambique Poverty, Gender and Social Assessment.
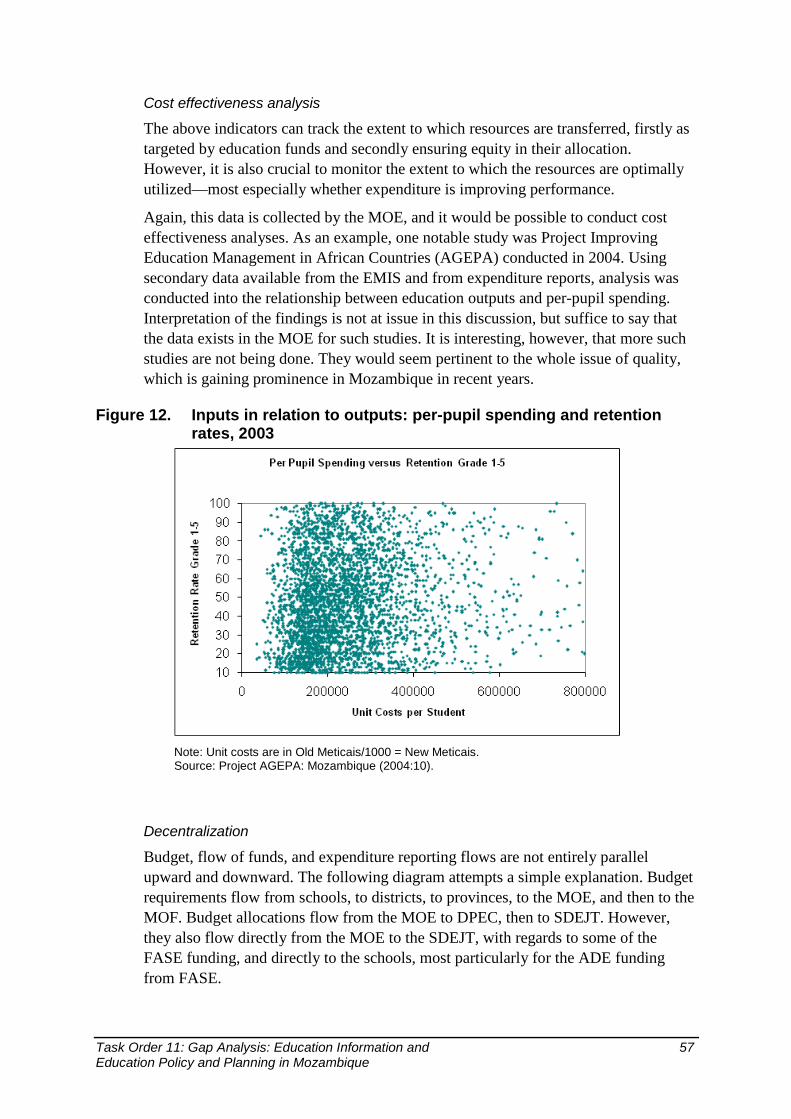
Task Order 11: Gap Analysis: Education Information and 57 Education Policy and Planning in Mozambique
Cost effectiveness analysis
The above indicators can track the extent to which resources are transferred, firstly as targeted by education funds and secondly ensuring equity in their allocation. However, it is also crucial to monitor the extent to which the resources are optimally utilized—most especially whether expenditure is improving performance.
Again, this data is collected by the MOE, and it would be possible to conduct cost effectiveness analyses. As an example, one notable study was Project Improving Education Management in African Countries (AGEPA) conducted in 2004. Using secondary data available from the EMIS and from expenditure reports, analysis was conducted into the relationship between education outputs and per-pupil spending. Interpretation of the findings is not at issue in this discussion, but suffice to say that the data exists in the MOE for such studies. It is interesting, however, that more such studies are not being done. They would seem pertinent to the whole issue of quality, which is gaining prominence in Mozambique in recent years.
Figure 12. Inputs in relation to outputs: per-pupil spending and retention rates, 2003
Note: Unit costs are in Old Meticais/1000 = New Meticais. Source: Project AGEPA: Mozambique (2004:10).
Decentralization
Budget, flow of funds, and expenditure reporting flows are not entirely parallel upward and downward. The following diagram attempts a simple explanation. Budget requirements flow from schools, to districts, to provinces, to the MOE, and then to the MOF. Budget allocations flow from the MOE to DPEC, then to SDEJT. However, they also flow directly from the MOE to the SDEJT, with regards to some of the FASE funding, and directly to the schools, most particularly for the ADE funding from FASE.

58 Task Order 11: Gap Analysis: Education Information and Education Policy and Planning in Mozambique
Figure 13. Main budget and expenditure flows
It is not entirely clear what role is played by the provincial parliaments and administrative authorities with regard to either budget allocations or expenditure reports. Some provincial parliaments are constitutionally enabled to vote on the sector budgets and presumably require expenditure reports.
It is also not clear what role the provincial finance offices play with regard to reporting on education finance. It seems that this relationship is part collegial—offering assistance as required—and part legal. However, it appears that the provincial directorate for education is primarily responsible for compiling the education expenditure reports, and meetings take place regularly between the provincial and district financial staff to track expenditure and discuss problems.
The provincial education expenditure reports are then forwarded quarterly to the MOE.
3.5 Data use in enrollment and completion rates tracking and planning
Children’s access to schools and completion of school levels are measured by the MOE’s EMIS program, which collects annual censuses twice a year, in March and December. The Ministry collects data from all primary, secondary, and vocational schools. Information about pre-primary schools is not collected because they are under the supervision of the Ministry for Women and Social Action (Ministério da Mulher e da Acção Social [MMAS]).
Data Collection The data collection process is very well organized and done in a timely fashion. The March 3 questionnaire is collected at the district and then compiled at the province
Ministry of Education Ministry of Finance
Provincial Directorate for Educationand Culture (DPEC)
District Services of Education, Youthand Technology (SDEJT)
Key
Budget requirements
Budget allocations and flow of funds
Expenditurereports
Schools

Task Order 11: Gap Analysis: Education Information and 59 Education Policy and Planning in Mozambique
level within 10 days. The data are entered at the province level and analyzed at the national level within four months of data collection. Although the MOE has a well-organized system of data collection and processing, there is pressure from donor agencies to collect data earlier. Much of this pressure is due to the fact that the academic year now starts in the middle of January (it previously started in the middle of February), so it is believed that data could be collected in the beginning of February. The MOE feels that the March 3 data is still appropriate because (1) this date has been used for several years and is engrained in school administrations’ consciousness nationwide, and (2) there is a lag time between the official opening of school and when students (and in some cases, teachers) actually show up for school in a “stabilized” manner. Furthermore, there appears to be some debate as to whether it is even a good idea to start school as early as the middle of January.
Calculation of access and completion indicators Each March, all school directors indicate the total number of students attending each class by age and gender. According to the EMIS policy, the school director should report the number of children according to the age the student will turn during the academic year (not the age of the child at the March 3 census). This potentially allows the MOE to calculate the GER, NER, Gross Intake Ratio (GIR), and the Net Intake Ratio (NIR), by gender.
As seen in Figure 15, the March 3 form clearly allows the NIR to be calculated according to international standards because there is a very specific data entry table that uses a precise definition.7 The NER, GER, and GIR, however, may have minor errors based on one’s interpretation of how to fill out the basic data collection form and what the age composition of the “less than six” category is in grade 1.
For the rest of the indicators, there may be some minor problems, depending on one’s interpretation of the form.
First, the GER may be slightly under-estimated. We can see in Figure 14 some cells are blocked out with diagonal lines in all grades past 1. The blocking of the left side cells is due to the government policy restricting children from attending a school level when they are younger than the regulated age. While the data form allows for the entry of children “age 6 or less” in grade 1, it does not permit entry of the “age 6 or less” in grade 2, 7-year-olds in grade 3, etc. Thus, children in these age groups may be under-reported. This may be exacerbated by the fact that the definition of children of age 6 (but only age 6) in the form is “children who turn 6 the year the form is collected.” Thus, given that the form is collected in early March, a large portion of first graders may be 5 years old but are reported to be 6 years old, because they turn 6
7 Definitions according to UIS, which should be the ones used by all countries, can be found at http://www.uis.unesco.org/glossary. According to the UIS, the GER is the total enrollment in a specific level of education, regardless of age, expressed as a percentage of the eligible, official school-age population corresponding to the same level of education in a given school year; the NER is the enrollment of the official age group for a given level of education expressed as a percentage of the corresponding population; the GIR into first grade is the total number of new entrants in the first grade of primary education, regardless of age, expressed as a percentage of the population at the official primary school-entrance age; and the NIR is the new entrants in the first grade of primary education who are of the official primary school-entrance age, expressed as a percentage of the population of the same age.

60 Task Order 11: Gap Analysis: Education Information and Education Policy and Planning in Mozambique
in the academic calendar year. This convention may or may not be followed for later grades and ages. However, it is unknown whether any of this would present a large error because it is not known to what degree allowing younger than the recommended age-for-grade policy is enforced. If it is very carefully enforced, then the error incurred by not allowing them to be reported in grades 2 onward may not play a significant role. Alternatively, the children may be reported as being older than they are, in which case the GER will not be in error (though the age data will be). So, a lot depends on what the principals actually do. Although the age policy is logical, EMIS perhaps ought not to assume that it is universally followed and should allow the school directors to report the number of children younger than the recommended age. All of these factors mean that the GER may be under-estimated overall.
The GIR may be unclear because, as can be seen in Figure 15, the March 3 form collects data only on newly enrolled 6-year-olds. Yet the GIR refers to new enrollees of any age. And as can be seen in Figure 14, this part of the form does not ask about new enrollees, though this number could theoretically be backed out from the number of repeaters in that grade. So there is no explicit question that asks about new enrollees, but of any age, in grade 1.
For the NER, there may be some ambiguity because in first grade there is no specific field for the actual number of children aged 6; there is an estimate for the number of new age-6 children that could come from a different table, and an estimate for the total number of children aged 6 or less. But there is no fixed and specific way to report the actual total number of age-6 children. This probably results in a minor error.
It also may be that we are misunderstanding the form and the instructions for filling out parts of the forms shown in Figures 14 and 15.
Figure 14. Form for capturing enrollment and repeaters by age and grade

Task Order 11: Gap Analysis: Education Information and 61 Education Policy and Planning in Mozambique
Figure 15. Form for capturing newly enrolled children specifically of age 6
GERs are larger than 100% mostly because children older and younger than the theoretical age limits are enrolled, because of early and late entry but also, most likely, because of repetition, which is probably larger than is reported (see discussion of grade 1 over-enrollment in Section 2 and in Appendix 3). It is also important to note that in countries where access to schooling is incomplete, GERs and NERs below province level, and sometimes even at province level, may not be accurate because the denominator (enrollment) takes place in one jurisdiction, and the denominator (population) is registered in a different one. This difference happens when children attend school in a different district from where they live, and it can happen if, for instance, the rural part of a poorer district borders the urban part of a richer district, and the latter has more complete or less-crowded schools. Children may also stay with relatives, in a district other than where they officially live to attend school and are not registered by the census as being “real” population in the districts where they stay. Comparisons with household surveys are a useful way to assess these issues, but these comparisons are perhaps not sufficiently carried out in Mozambique because of lack of staff time and necessary skills in data analysis and data sourcing, or lack of awareness that it may be important.
EMIS calculates a completion rate using the end of the year (“December”) questionnaire, which collects (by grade and gender) the total number of students, total number who passed the grade, and the number of children by the score of the final grade for each subjected studied. The gross completion rate is calculated as the final number of passing students divided by the population of the appropriate age for that class. Typical international practice is to estimate the completion rate using beginning-of-year enrollment, subtracting an estimated number of repeaters (using previous year’s data), and dividing by the appropriately aged population. Because EMIS conducts a beginning-of-year and end-of-year census, it has the ability to calculate a more accurate and thus more appropriate completion rate than what is the international practice.
Data accuracy Although the data processing is efficient and well organized, the data have, according to reports from EMIS itself, never been thoroughly verified. Their accuracy thus is not fully known. There are two types of verification EMIS may consider: data report verification and data entry verification.
Data report verification involves using enumerators at the district level to conduct an unannounced school inspection comparing the number of students present with the number of students filled in the March 3 census. It is possible that, because school directors fill out the EMIS questionnaire and because their ADE funds are directly

62 Task Order 11: Gap Analysis: Education Information and Education Policy and Planning in Mozambique
tied to enrollment (schools receive $3–$5 per child per year), they may find it difficult to resist exaggerating their enrollment. It is also possible that the school directors simply copy previous years’ EMIS forms. Although the EMIS data allows for time series checks, there is no indication that the EMIS team looks into such data quality checks. UNICEF conducted a pilot study verifying 35 schools. It found that disagreements between the numbers of children reported in the EMIS forms were not large enough to importantly affect planning decisions. However, findings and methodology have not yet been reported, and a sample of 35 schools is not sufficient to draw sound inference. The implementation of report verification could contribute a significant burden at the district level and a mild burden at the national level. It may be useful to conduct data verification only for a small but nationally representative sample, and then induce either provincial or district verification samples only if data are found to be seriously wrong. There are other complex issues in data verification, however, since any school will experience a normal amount of absenteeism. Thus, a verification against March 3 enrollment that failed to find the right number of students could be excused by the principal as simply being due to absences that day. And, indeed, many children are not only absent on any given day but have stopped attending; yet they were indeed enrolled. Thus, for a verification, one would have to pre-define an acceptable level of absence or “within-year” dropout, or one would have to conduct extremely expensive verifications against student’s homes.
Data entry verification helps assure the information on the questionnaires is accurately entered into the computers. Because questionnaires are paper based, staff at the province level must enter the data, and it is human nature to occasionally enter incorrect information. The EMIS data entry system does have several built-in data checks, but a check they may want to consider is a warning for the data operator if the current year’s class enrollment is larger or smaller than 15% of the previous year’s cohort. For instance, if the data entry typed in 310 for third graders in 2010 but the school had 120 second graders in 2009, the system will warn the operator that the class increased by 158%. This would help prevent grievous data entry errors but does not catch all possible mistakes. By having another data operator enter the same data independent of the first data entry, the two data sets can be compared and the difference between the sets could be fixed by referring to the paper questionnaire. This verification would greatly reduce the erroneous data entry but would heavily increase the burden on education staff at the province and national levels and may significantly delay the dissemination of both EMIS annual reports. If MOE were interested in this verification process, it would need to increase the number of staff at the national and possibly the provincial level, or outsource the double-entry for verification.
As for completeness, the EMIS reports a very high rate of success for returns from schools because of the simplicity of the forms, the consistency in its application over the years, and the fact that schools and districts all understand that the data actually get used for planning and resource allocation. However, we found no evidence that for the few percent of missing data there is a systematic process of imputation.

Task Order 11: Gap Analysis: Education Information and 63 Education Policy and Planning in Mozambique
Since 1997, the MOE has been trying to construct a GIS mapping database, Carta Escolar, which also collects data on enrollment figures. The success of this database has been extremely limited because of financial and technical capacity limitations at the provincial level. Ideally, enumerators at the district and/or provincial level physically go to all primary and secondary schools with two forms: one is to be filled out by the enumerator and collects information regarding school accessories, and the second is to be filled out by the school director and collects information on school construction and assets. Rating school infrastructure quality is extremely subjective if done by the principals themselves. If they believe they may get more money if they report infrastructure as poor, they may negatively exaggerate the infrastructure quality. If they believe they will be held accountable for maintenance, they may positively exaggerate the quality. Thus, outside enumerators are needed. But outside enumerators are also subjective and would need training, using photographs, to improve inter-rater reliability to an acceptable level. If the schools are photographed, however, inter-rater reliability issues can be reduced by enabling planners to look at the data later. It is not clear that such a massive exercise (photographing every single school) is a good use of planners’ time.
EMIS at the provincial and district level and decentralization All data are entered at the provincial level via an EMIS-specific system using an Access database. Even though the data entry system has built-in consistency checks, they are not properly documented for the provincial staff (as indeed is the case with many EMIS processes which may be good but lack documentation). All provinces have the capacity to enter data, but few (if any) have the capacity to conduct other data entry checks, data consistency checks, or data editing/imputation. Provinces are unable to analyze their own data as well. Currently there is no documentation or manual to instruct the provinces’ staff on these highly technical skill sets. There is an annual EMIS training for the provinces, but it deals little with technical support and more with general planning. These issues, along with a high turnover of personal at the provincial level, make it extremely difficult for provinces (much less districts) to check the quality of and analyze their own data. This clearly means that decentralization will suffer, since true decentralization requires not just “bottom-up and then top-down” vertical allocation, but real prioritization at one’s own (“horizontal”) level.
There is a wish to decentralize data entry further, to the district level, but many districts lack computers or even electricity. Those could “upward re-delegate” their data entry to the provinces. It is possible that data entry at the district level could speed up entry and could devolve responsibility for error trapping. But it is also clear that at the district level there would be little ability to analyze data. The cost-benefit analysis of these issues needs to be more thorough.
3.6 Data use in textbook planning and tracking textbook issues In accordance with the GOM’s decree of free primary education for all Mozambicans, the MOE provides free textbooks for grades 1–7. All primary schools receive the same textbooks, written in Portuguese, according to grade and subject taught.

64 Task Order 11: Gap Analysis: Education Information and Education Policy and Planning in Mozambique
Theoretically there is a 100% replacement rate for grades 1–2 textbooks and a 35% replacement rate for grades 3–7. In actuality, there are obvious problems with schools receiving too many books, not enough books, and/or no books at all. But given the complexity of planning and mass movement of over 12 million books to be distributed to more than 10,000 primary schools around the entire country, there are relatively few problems with textbook allocation and distribution.
Textbook distribution is a great success. Though there are some spotty problems, in general, in most schools and most children have books. As will be seen in other sections, whether teachers have the skills needed to teach in a situation where books exist is another matter—some seem to still teach as if there were no books.
Illustration 4. Books seem nearly ubiquitous now
The number of textbooks to be distributed is determined at the school level based on the total number of students reported in the previous year’s March 3 EMIS school census. The annual March 3 census also collects information about how many students currently have textbooks. This information could be used to help determine more accurate book allocations, specifically to grades 3–7, which could prevent flooding some schools with too many textbooks. This would save a tremendous amount of money, paper, and energy. It could also be used to help pinpoint areas that are in greater need of particular books.
Provision for the printing and distribution of textbooks comes from the Ministry’s FASE fund. MOE directly pays Mozambican companies (or locally based subsidiaries of international companies) to print books and another distributor to deliver the books. There seem to be two models of delivery: one where the distributor delivers right to schools and a more decentralized model where the districts are funded to appoint their own contractors to deliver to schools, with funds allocated directly to the district from FASE.
Task Order 11: Gap Analysis: Education Information and 65 Education Policy and Planning in Mozambique
The textbook policy seems very straightforward and rather efficient. A future challenge would be to deal with local-language production and distribution. Since 2003, education policy states that, in theory, schools should teach reading, writing, and mathematics in their local language as well as in Portuguese. There are over 20 languages commonly spoken throughout Mozambique, some of which do not have a formalized written language. To put this policy into practice would be quite a challenge from a data and logistics point of view. From 1993 to 1997 pilot studies were conducted in Gaza and Tete through the Bilingual Educational Project (PEBIMO). Although some results were positive, augmenting the production of bilingual textbooks was not revisited until 2010, when the MOE along with the World Bank called for bids to produce nearly 500,000 books in 134 different titles. The FASE (FASE 325/10/ICB-8/UGEA/B) has set aside money for these books, but it was not clear what information was used to know the appropriate number of books, by language, that should be printed and delivered to the specific areas, because the MOE currently does not collect information on the local language in either of its censuses. However, we were informed that there are 16 mother-tongue textbooks published as of today, which are distributed and taught in all provinces in a small number of schools in INDE’s pilot studies of bilingual education. If the MOE would like to know the actual number of students by local language (and thus be able to gauge the demand of books by language and area), it could do one of four things: (1) collect local-language information in the March 3 questionnaire, (2) link the Carta Escolar (the GIS) question with census data to know which language is spoken in the local community, (3) conduct a special census or study, or (4) use census information down to the lowest tabulable level on uses of local language. Collecting local-language information on the March 3 questionnaire could prove burdensome on EMIS because a change to the questionnaire would be needed. And the current challenges of the Carta Escolar prohibit timely and comprehensive data collection. A special survey would be one possible answer (and perhaps one was indeed done). Use of census information would be the least expensive, but least accurate, method. If none of these things are being done, then the issue of having an informational base for optimal local-language publishing and distribution does appear unresolved. In that case, further research is needed.
Although the government provides funding for secondary and vocational education, there is no policy for free universal education at these levels; so the MOE does not allocate specific funds for textbooks at these levels of education.
One area of concern with textbooks used in Mozambique, at least those examined for Portuguese in the early grades, is that the pedagogical model is perhaps not the one most suitable for children from a print-poor background. For example, according to Helen Abadzi of the World Bank’s FTI, who has studied textbook design extensively, Mozambican books attempt to teach students to write in cursive very quickly, in sections of the books where the context is printed letter, which can be too challenging to children just learning to read. Illustration 5 shows a child’s “sketch” of letters, words, and sentences, which often distracts young children from learning to process the text that is being written and forces them to concentrate, too early, on the physical aspect of writing as a sort of elaborate “art.” This is not to downplay the importance

66 Task Order 11: Gap Analysis: Education Information and Education Policy and Planning in Mozambique
of clear handwriting, but it is to question the importance of (particularly) elaborate cursive, so early, and so much in the context of print.
Another concern from our school visits was very dense and high level of content covered in the curriculum and the books. It was clear in our observation that the level of math topics for early grade students was too difficult for ultimately any students in a typical classroom to understand and learn—the teachers and the books simply were not starting from where the students were, leaving them behind immediately, and thus teaching only to the relative elite in the class. Some of the textbooks used in classrooms also were very heavy and dense to complete at a reasonable pace and to promote actual learning at the same pace. At the same time, while too dense with concepts and a variety of activities to be done on the same page, there is a relatively wasteful use of white space (areas with neither print nor text), perhaps more color than is necessary, and perhaps larger graphic elements than needed (children have much more visual acuity than is thought, and their visual acuity for graphics is much higher than for text, so they do not need the graphics to be as large as is commonly thought, relative to the text font—and sometimes the text font is too small—thus showing a disproportion of size relative to research-based children’s need, and based instead too much on adult conventional wisdom). Finally, there do not seem to be enough simple, fun, narrative stories in the books to encourage pleasure and automaticity, and there is perhaps overmuch emphasis on dry analytical issues. In order for early grade education (bilingual or not) to be successfully practiced for learning and skilling, Mozambique could take the opportunity to study effective textbooks developed in other countries in a similar context and improve the value-for-money of textbooks by making them more consistent with what scientific research has to say about effective instruction, instead of relying on what seems to be appealing.
Illustration 5. Possible over-use of cursive and white space
3.7 Data for setting and tracking coverage of special programs The coverage of many special programs, such as school feeding, HIV/AIDS issues, and OVC, is an increasing priority for the MOE. Special programs were set up to help students in need finish primary schooling or simply have a better schooling experience or better outcomes. The MOE collects, processes, and analyzes its own

Task Order 11: Gap Analysis: Education Information and 67 Education Policy and Planning in Mozambique
data as well as uses other national surveys to help estimate the needs of vulnerable children. All provisions provided by the MOE for these programs come from two funding sources: the FASE and ADE. The MOE has been transferring the funding responsibility from the FASE funds to ADE funds. Even though the MOE does not cover all areas of special programs, it systematically uses quality available data to know, inform, and act in several (but not all) areas of special programs.
The Ministry does not collect its own data on HIV/AIDS but uses household survey data such as the Inquérito National de Prevalencia, Riscos Comportamentais e Informaçao sobre o HIV e SIDA em Moçambique (INSIDA 2009), conducted by the Ministry of Health (Ministério de Saúde) along with several donor agencies. The data from these surveys are used to allocate FASE funds to the provinces to help prevent the spread of the HIV/AID epidemic to school employees, to educate students in HIV/AIDS prevention, and to further the implementation of strategic planning in School Health (Saúde Escolar). Although the province has the discretion to allocate funds to the districts, there are tight regulations as to how the money should be spent for each specific HIV/AIDS education program.
In 2007, EMIS began collecting annual data on the total number of orphans at the class level for primary and secondary education. (The MOE does not collect orphan data for vocational schools, but this is a relatively minor sector and is not critical to overall funds targeting.) Orphans are defined as children without a mother, children without a father, and children without both a mother and a father. The data, which are collected in the March 3 EMIS questionnaire, currently count the total number of orphans by class (not age). The data are analyzed by the MOE at the province level, but the MOE does not compare these results with other in-country surveys (such as the 2009 INSIDA). But because the Ministry does not restrict the definition to students 18 years or younger (as many household surveys do) and because it does not collect the age of the orphans, it is currently not possible to compare EMIS’s orphan prevalence with household surveys. The EMIS also collects information on boarding students in the March 3 EMIS questionnaire for primary and secondary education. These data are in principle used to target certain funds such as nutrition or food funds. The MOE does not use other household studies to compare the proportion of boarding students at the provincial level (although this would be difficult to do because some boarders may live in one province and board in another).
In the past, the FASE was MOE’s main source of provisions for special programs, but in 2006 it created the ADE pilot to allocate money directly to the schools in accordance with its process of decentralization. In 2009, the ADE pilot turned nationwide, replacing the FASE as the main source of provisions. Using the previous year’s March 3 census, the MOE uses the number of orphans reported as a proxy for vulnerable children and the number of boarders as a proxy for school feeding programs. Now, about US$2 for each orphan and about US$1.5 for each boarder is directly allocated to the schools to spend at their own discretion. Although the schools are given the discretion to spend the ADE funds for special programs, they must follow a set of rules and regulations established by the MOE and are held accountable for their spending at both the community and district level.

68 Task Order 11: Gap Analysis: Education Information and Education Policy and Planning in Mozambique
Although orphans and boarders may not be the best proxies for allocating provisions directly to schools with students most in need of assistance, the indicators are easily collected and can be verified by inspection if needed. In addition, allocating funding in this manner aligns with the MOE’s desire to decentralize funds directly to the schools.
That said, orphan assessment is not a perfect indicator for vulnerable children because it is not very accurate (for instance, financially well-to-do family members may take in orphans without requiring monetary assistance) or complete (children of the unemployed and/or physically handicapped parents may be in greater need than orphans). Similar arguments could be made about boarders: not all boarders need financial assistance, and tracking boarders is not necessarily telling of the schools’ need to help feed malnourished students. Therefore, it may be in the MOE’s interest to increase its support to districts that are in intense poverty, as a more general approach to assisting those in need.
Research in other countries suggests that OVC, for instance, are not particularly disadvantaged if their caregivers, whoever they are (grandparents, relatives), are funded (or have the funds) or if schools are forced to earmark special support for them. OVC poverty may be a more limiting constraint than OVC status per se. Another way of saying this is that poverty itself is a large part of the “V” in OVC. Thus, proxies for poverty, which are collected in the population census and can be aggregated into poverty indices, may be good all-purpose indicators for the numbers of students who are in greater need of assistance.
It may be wise, and less cumbersome, to use poverty as a targeting criterion for a variety of special needs. This requires less gathering of highly specialized data and can create a simpler, more all-purpose, and more transparent process. Note that whether to use an all-purpose indicator such as poverty as a way of targeting funds for special needs is a completely separate issue from whether one earmarks those funds. One can use a general-purpose indicator to target special funds and still require that those funds be earmarked, i.e., spent on specific categories of special needs. Or one can allow districts (or provinces) to set their own priorities within a set of special needs (no earmarks within the special programs, just an earmark for special programs in general). Or any mix, including no earmarks whatsoever and just target-setting for dealing with problems (i.e., no input control, just accountability for progress). The point being that the funding targeting and expenditure tracking are quite different issues, and the use of data needs to be considered for both purposes, with a view to simplification and decentralization. In a more decentralized, non-earmarked scenario, the districts would then have the discretion of school allocation and would be held accountable by the communities within the district as well as the province or even the national level. These are all options to be considered.
The view from the Nampula case study on the issue of special funds for special programs was of interest. It turns out that both the province of Nampula and two districts within Nampula were happy with how efficient and affective ADE had been since the start-up in 2009, but they expressed concerns about some parts of the FASE money set aside for special programs. The Province of Nampula and the two districts

Task Order 11: Gap Analysis: Education Information and 69 Education Policy and Planning in Mozambique
agreed (all three independently of each other) that insufficient funds are given for too highly specified tasks and require too much accountability to be effectively spent. This suggests, as noted above, that earmarking and also targeting (and recall that these are separate issues) for such small amounts may well not be worth the cost. For example, it was indicated that Nampula city received the equivalent of US$1,000 to be allocated to secondary school education for HIV/AIDS prevention. The city has 13 secondary schools educating about 47,000 students. The funds were so insufficient that it was more burdensome to receive the money and account for it than to go without. According to the provinces and two districts, the money coming from the FASE fund could be better used if it was given in a lump sum and the districts and schools were allowed to spend the money as they see fit. Similar comments were made about donor programs that require separate accountability or at least managerial action, and are such tiny amounts that distribution costs actually exceed the benefits of the packages.
3.8 Examinations and learning assessments A substantial amount of data on learner achievement is collected in Mozambique, predominantly through the national examinations set by the Exams Council (Conselho de Exames, Certificacoes e Equivalencia [CNECE]) for grades 5, 7, 10, and 12; and pupil assessments done by class teachers each term. The target population is universal (though the CNECE exams have to be written only by students whose class marks are above and below certain thresholds). Summary data, by way of subject averages of year-end examinations, are collected from schools at the end of each year and entered into the EMIS system. Since all school examinations up to grade 10 are proctored and marked at the school level, the validity and reliability and therefore utility of these data are somewhat questionable.
Independent learning assessments conducted on nationally representative samples have been conducted fairly regularly by INDE, either as part of their own program or in conjunction with regional initiatives such as SACMEQ. MOE and INDE are currently in the process of developing a comprehensive learning assessment approach which plans to roll out testing for all grades 3 and 5 pupils in the near future.
A number of NGOs or international organizations, such as UNICEF and the Aga Khan Foundation, have conducted assessments on small samples of schools—most predominantly within their project areas. While not nationally or regionally representative and often, because of the nature of the NGO’s project, conducted in an unrepresentatively weak subset of schools, these assessments are important for both their contributions to developing assessment test methodologies and contributing quantitative and qualitative analysis to a prospective assessment program that may be run by the MOE in the future. In addition, the World Bank’s Russia Education Aid for Development (READ) trust fund will soon help with the development of an oral reading assessment for the early grades.

70 Task Order 11: Gap Analysis: Education Information and Education Policy and Planning in Mozambique
School examinations There are two broad processes that currently collect data on student performance at the school level. The first is part of the school, ZIP, and district process of improving school performance, and the second is the national examination process run by the CNECE.
At the school level, term results of school evaluation processes and year-end examination results (either set by the schools or nationally) are collected and analyzed with regard to evaluating school quality. Each term, district-wide meetings are held with schools to review their end-of-term evaluations and identify problem areas. A similar process takes place with district pedagogical officers reporting to the provincial pedagogical section. On the basis of the ZIP, district, and provincial process, pedagogical officers develop plans to assist schools to improve their performance.
School meetings are held termly with parents to explain school performance. However, only the examination results of grades 10 and 12 are actually published; comparisons made with other secondary schools are available for public scrutiny—although only posted on the school notice boards.
No longitudinal analysis is done of these school results for tracking school performance over time.
Data on the examinations process that is run by the CNECE for grades 5, 7, 10, and 12 is collected by the EMIS system via the end-of-year submission from schools. In terms of exams, this instrument collects data on the following:
• The number of students sitting for school exams • The number of pupils passing • The average mark by subject and grade
These data, however, are not analyzed in any systematic report and appear to suffer from the same fate as other under-analyzed data—the most significant being a lack of capacity and a skepticism about the quality of the data and therefore the utility of its potential to be diagnostic. Much of this skepticism arises from the fact that the examinations, while being set by an external body, the CNECE, are being proctored and marked at the school level. In addition 66.6% of the final mark is made up of the term mark, and the veracity of this is questioned.
The high-stakes examinations in grades 10 and 12 are somewhat monitored by external bodies and may hold greater utility for assessing learner achievement. The grade 12 CNECE examination, set as a multiple choice exam, is proctored at the school level and marked centrally by optical mark readers. This examination may offer a more robust learner and system quality indicator. However, only students who achieved more than 50% or less than 75% in their school-based year mark sit for this examination. Students who achieve higher than 75% pass grade 12 with their year mark. In addition, the student’s year mark constitutes 66.6% of their final mark. As a result, it would not be possible to use only the examination result as an indicator of performance. All school and examination results for grade 12 students would need to
Task Order 11: Gap Analysis: Education Information and 71 Education Policy and Planning in Mozambique
be collected and statistically analyzed if they are to yield indicators of learner and system achievement. This analysis is currently not done.
External learning assessments In this section we define “external” as completely external to the school in terms of proctoring, marking, and the weight of school-based assessment. INDE has the mandate, among other tasks, to engage in the external assessment of learning quality in Mozambique. To this end, the following assessment programs have been conducted on a sample basis:
• Assessment Project 1998 and 2000 • SACMEQ II 2000 • National Assessment 2006 • SACMEQ III 2007 • National Assessment
Data from these assessments have been broadly analyzed and disseminated in a variety of published reports. An evaluation of the utilization of these reports has been done by READ in the report Improving Learning Assessment Systems in READ Countries: Self-Diagnosis and Action Plan (2009). This is worth quoting at some length because it offers a somewhat concurrent evaluation of the issues of data use in Mozambique as this report does:
The reports based on SACMEQ and the 2000 National Assessment were distributed primarily to top MEC [Ministry of Education and Culture] officials. There were also some workshops at the central level. As noted before, for the 2006 National Assessment only a draft report is available at INDE; it has not been officially approved by MEC.
The reports do not reach districts or provinces, though there are cases when verbal feedback is provided, presumably for interested parties. Perhaps most importantly, there is no evidence that any specific action with respect to the education sector is based on these reports.
There are a number of possible explanations for why these results are not being translated into action by MEC officials. One is that the content of the findings is not conducive to easy and/or quickly implemented policies. Or the format of the reports may make it hard for MEC officials to understand the main findings. Some suggestions include using a “sleeker” report format, or brochures and other kinds of summaries (as in SACMEQ). There are also concerns that government officials may need some training in how to understand the results of these kinds of reports, or receive more detailed presentations. (READ 2009:22)
Currently under development is a program to build a national school-based assessment process that, among other evaluation instruments, will conduct an assessment of the learning achievements of all learners in grades 3 and 5 (to be rolled out to other grades in the longer term). It is the intention of INDE to engage in
72 Task Order 11: Gap Analysis: Education Information and Education Policy and Planning in Mozambique
extensive analysis of the pupil performance data and engage in policy processes aimed at improving the quality of education in Mozambique. It is too early in the process to reflect on what format this will take.
3.9 Labor market data tracking
Policy priorities and indicators tracked The education sector interacts with the labor market in a number of ways: (1) general education is the primary mechanism for creating the literate and educated individuals that constitute a “skilled” or “semi-skilled” labor force; (2) the education sector, through its teacher corps, is one of the most significant employers of the skilled labor force; and (3) specialized technical and vocational education streams (in Mozambique these streams are referred to collectively as “professional education”) are used to help create very specific skill sets required by the economy.
The Poverty Reduction Strategy Paper reinforces the general need for a literate and educated society for a number of reasons, including workforce and economic development.
The 2006–2011 Strategic Plan for MEC includes a section addressing the needs of the technical and vocational education sector. The strategic plan is written with primary concern for increasing the volume of education provided through professional education; addressing gender and regional disparities in professional education coverage; working with employers, unions, and other stakeholders to adapt curricula to address market conditions; improving the quality of learning conditions and educators; and addressing efficiency and cost-effectiveness concerns.
The government is engaged in a 15-year reform program called Programa Integrado de Reforma da Educação Profissional (PIREP), which was initiated in 2006 with funding from multilateral and bilateral donors. The vision of this reform program is to transform the professional education system into a more demand-driven system with curriculum, assessments, and certifications designed to address the needs of employers in a variety of sectors.
Data tracked The 2006 PAF document lists the overall objective for professional education as transforming the sector into a “demand-led system.” Progress indicators include the following:
1. Establish an ANEP law
2. Establish occupational standards for increasing numbers of the 20 occupations covered by professional education
3. Increase the number and percentage of teachers who have received proper CBT training
4. Increase the number and percentage of training programs that are standards-based
Task Order 11: Gap Analysis: Education Information and 73 Education Policy and Planning in Mozambique
Of the goals listed in the 2006 PAF, the first item does not require statistical tracking, and the second and fourth can be easily tracked without the need for a data management system—central ministry officers could easily recall that standards-based training programs had been introduced in 6 of 38 professional training institutes thus far and list the sectoral areas for which occupational standards had been developed. The third item is tracked via the directorate’s data management system.
More importantly than the goals listed in the PAF document, the professional development system needs to be able to read signals from the labor market on the skill sets that are required and to track whether or not the education system is giving people the skill sets desired by the labor market. From what we could tell, Mozambique does not have an agile and profound way to do this yet.
Data sources In the Third National Poverty Assessment (Sept 2010), “unskilled labor” is described as labor with less than a complete primary education, “semi-skilled” as labor with at least a complete primary but less than a complete secondary education, and “skilled” as those with a complete secondary education or greater. By this simple measure, household surveys are sufficient to measure the skill level of the labor force, and EMIS counts are sufficient to measure the annual production of human capital. According to data from IAF/03 and IOF/08, the stock of semi-skilled and highly-skilled labor roughly doubled over the five-year period.
These same household surveys provide sufficient data for analyses of returns on investment in education, which could be used to measure general productivity of the education sector for the labor force, but there is no evidence of recurrent analysis of rates of return, success in labor market placement, or analysis of unemployment data by level and type of education. In that sense, the demand side is not truly measured. The current data systems do allow one to track the production or supply side, at least in terms of numbers produced.
Systematic data sources
Counts of pupils, teachers, and graduates generated through the EMIS system are useful for tracking the production and consumption of a generally skilled labor force. EMIS tracks labor production through counts of pupils completing levels of general education, professional education by broad focus area (industrial, commercial, agricultural), production of teacher training programs, literacy, and adult education.
As noted, the education sector is itself one of the biggest users of trained labor. EMIS also tracks the MOE’s consumption of labor, numbers of teachers by broad level of training, and attrition by cause (death, illness, retirement). The teacher training department has the practice of projecting near-term teacher need based on current number of pupils.
The HR department maintains data on teachers and their levels of training, which can be used as a measure of HR consumption. Teacher training institutes maintain records of their graduates and the skills they have obtained, which are a measure of HR production and can be tabulated against consumption for an idea of the degree to
74 Task Order 11: Gap Analysis: Education Information and Education Policy and Planning in Mozambique
which the education system is able to meet its own needs. These information management systems are discussed in greater detail elsewhere in the report.
Additionally, the professional education directorate conducts an information management census of its own to track specialized data that are not tracked through the general EMIS system. This data system can track the number of graduates entering the labor market with specific professional diplomas and certifications.
The household surveys office within INE has conducted its own line of household surveys that cover labor force surveys, among other topics. Data viewed in the IOF 08/09 report seem to be available and cross-referable on the level of education completed, employment status, and sector of employment, in addition to other data commonly available from household surveys. Data viewed in the IAF 02–03 report indicate that observations are cross-referable by level of education completed, level of education currently attending, employment status, and sector of employment. In 2003/2004, INE conducted a labor force survey called the Inquérito Integrado à Força de Trabalho (IFTRAB). Though we did not obtain a report or a copy of the questionnaire for this survey, a description of the survey obtained from the INE website leaves no doubt that it would be a rich source of data on the characteristics and needs of the labor force. These data are disaggregable by province and for urban and rural areas, but not by district.
DHS 2002–2003 includes questions on attainment, employment, and sector of employment for samples of adult men and women; it is not known whether the upcoming DHS (2009–2010) will include these questions as well. The MICS 2008 survey addresses only child employment.
Household survey data can probably be considered to be reliable, and a five-year cycle is a reasonable expectation for household surveys. Though a shorter time interval might be preferable in ideal circumstances, a five-year turnaround is probably the best that could be expected for a country with Mozambique’s overall data capacity. Enumeration and data processing time required for household surveys may delay the release of official data by up to two years from the initiation of the enumeration period. As with the interval, the timeliness of data is not perfect, but is probably fairly good for the circumstances.
Reports for IOF reference values obtained through previous studies suggest some amount of cross-checking of results. Data are disaggregated by province, region (North, Center, South), area, and wealth quintile, and are presented in the report graphs and tables in a manner that encourages cross-comparison. All three of the survey series are written so that data internal to each series are comparable across time. Data from the three series should not be compared against each other in a rigorous way.
The 2007 National Census also offers considerable data on employment and education status, including literacy; languages spoken; school attendance; educational attainment; main activity over a fixed one week period (including worked, did not work but had a job, helped within the household, searched for new work, domestic work [farming, sales, child care], searched for first work, student, retired,

Task Order 11: Gap Analysis: Education Information and 75 Education Policy and Planning in Mozambique
incapacitated); type of work performed in the past week; type of work normally performed; type of employer (12 possible response categories); and number of hours worked in the past week. These responses can be disaggregated according to a wealth of personal and household characteristics, (though not household income or expenditures) and can be disaggregated down to the most specific administrative or geographic unit. The census could be a source of considerable useful information for labor planners, and though detailed data on each province are available in an off-the shelf publication for Maputo Province, potential data users are invited to approach INE for special data requests.
The professional education directorate in the national ministry is aware of the survey and census datasets that exist and recognizes them as a potential wealth of information on the labor market. They do not, however, use these data for the purposes of planning or targeting programs because they lack the capacity to extract detailed data themselves and they do not appear to be receiving detailed data directly from INE.
Administrative processes
As part of the technical and vocational education reform plan, the professional education directorate has begun to work with important labor force stakeholder groups (labor unions and major employers) to ensure that the professional training system is calibrated to produce graduates with skill sets that are a close match for the specific needs of particular industries. Taking ICT as an example of a skills area, this collaboration does not help the ministry (or individual training institutes) decide how many ICT professionals to train, nor does it help assure that that curriculum is actually learned, but it does help to ensure that the curriculum used to train ITC professionals nominally has the right areas. To actually assess whether the trained professionals are acquiring the right skills, the system would need to track actual employee and employer happiness with the professionals produced by the institutes, using indicators such as time-to-first-job, income, job performance satisfaction, etc. This would require some systematic surveys, not just casual observation.
Labor market surveillance
Currently, there is some tracking of labor market outcomes. For instance, there are a small number of professional training institutes that do track their graduates, following up with them at intervals to determine whether their training paid off. Similarly, many professional training institutes have working relationships with major employers in their vicinity and gather information on labor force needs through relationships with major employers such as the national power company, and they may also pick up signals from the labor market through internship placements. Some schools work with Instituto Nacional Do Emprego e Formação Profissional (INEFP) employment centers to gather information on the types of job openings on the market and how quickly they are being filled.
As part of the technical and vocational education reform plan, the professional development programs within the MOE and the professional development programs within the Ministry of Labor will both begin to base their planning based on data
76 Task Order 11: Gap Analysis: Education Information and Education Policy and Planning in Mozambique
generated through a Labor Market Observatory that is being established with the support of the International Labour Organization (ILO). It is expected that this observatory will generate data projecting specific labor skills in specific places. Whether it will actually track the labor-market uptake of graduates is unclear.
Much could be done to systematize and regularize this kind of labor market surveillance approach. The first graduates educated through the programs based on standards-based training will enter the labor force at the end of the coming year. There are plans to track these students and evaluate the success of the program. This is promising and should be monitored.
Discussion If properly analyzed, existing data from household surveys can be used to gain a good general sense of the status and needs of the labor force. The more detailed data available through census and labor force studies can be used for more detailed needs assessments. It may not be realistic for the MOE to obtain the technical specialists needed to extract these data from the datasets. However, it would be entirely reasonable for the Ministry to link with INE or specialists within the Ministry of Labor to obtain these data.
The professional education system is already on track to begin tracking the workforce success of their graduates at the end of the current school year. Steps should be taken to ensure that these data continue to be collected and that they are analyzed to revise and reconsider specific workforce development activities. The Labor Market Observatory that is expected to become operational in the future should also be a good resource.
3.10 Data and information on and for governance In the area of governance, we once again refer to information and data in two senses: information flowing out to Conselhos de Escola (School Councils) (and other bodies representative of citizens with regard to schooling) regarding their composition, rules of operation, and duties and powers; but also information flowing back to the Ministry (or other higher spheres of government) regarding whether these Conselhos are operating as per policy. A related matter would be whether their operation-as-per-policy is having the intended effect on various, more fundamental values such as citizen empowerment, parental satisfaction, and school achievement. Functioning-per-policy and effect-as-intended are quite different issues, of course, each requiring different ways to assess, though both are worth knowing.
With respect to governance, our assessment is that the effort to disseminate information on the Conselhos de Escola has been fairly good, but there are small gaps. For instance, it is not clear that such information is readily available on a demand basis and to all district and province offices. A quick check of the main library at the MOE showed that it was not available there.
The feedback loop from the school level back to the State as to whether the Conselhos are operating as intended and whether they are having the intended effect is also not
Task Order 11: Gap Analysis: Education Information and 77 Education Policy and Planning in Mozambique
as active as it should be. We could find no systematic survey either of Conselho functioning or of the effect of proper functioning on any objective indicators such as learning achievement or citizen satisfaction.
Information on whether Conselhos are functioning as per intention would be relatively easy to obtain, at least in theory. It would be relatively easy to do a survey to assess whether the norms or regulations are being followed, since regulations are normally clear, and the needed questionnaires almost write themselves, based on the regulations (e.g., are the right electoral procedures being followed, are minutes being kept, are school budgets being posted, etc.). Furthermore, it is a simple matter to simply ascertain these things using simple Yes/No or Likert-type scales: no inference is required. At the other extreme, one would assess whether well-constituted councils (well constituted as per policy, or well constituted in common-sense terms as defined immediately below) result in more efficient budgeting or more learning outcomes or some other “final” outcome. One supposes that inspections check on these governance issues, but as noted elsewhere, inspection records are not kept in databases, to our knowledge, so it would be difficult to assess whether governance rules are being followed. Other countries, such as Kenya and South Africa, have carried out surveys to determine these sorts of factors.
An intermediate governance indicator to evaluate, and in some ways the most important, is simply whether schools are increasingly well-governed, in the simple sense that parents feel satisfied, feel agency over their own schools. It is important to note that this is definitely not the same as assessing whether the Conselhos are operating as-per-policy. They may be operating as-per-policy and yet parents may not feel represented. Or they may often not be constituted or functioning as-per-policy, and yet parents may be quite happy, feel well represented, and feel that they have agency over their children’s destiny. If the ultimate purpose of school governance policy, as per the Conselhos de Escola, is to foster local participation and localized democratic governance, then this intermediate level, under discussion here, may well be the most important one to assess. In many countries, technocrats (and especially technicians from foreign cooperating agencies) try to assess the impact of governance on “objective” indicators, such as efficiency of spending or learning outcomes, when the original policy intent was to create citizen empowerment and to use schooling as centers of community development—policy objectives are in some ways more profound (or are perceived that way by policy makers who strongly believe—often with good reason—that they represent the interests of the people) than either spending efficiency or learning outcomes. But that, in a sense, constitutes an “unfair” way to assess Conselhos.
Thus, in principle, a good information system should address all three aspects of feedback back from the grassroots to the state: functioning-as-per-norm, happiness and good governance, and “objective” outcomes or results. In addition, information systems or communications systems ought to do a good job of getting information out to the grassroots about how to proceed with governance. Our assessment of the situation in Mozambique is that the latter has been achieved to some degree but could be better, whereas the former is barely beginning.

78 Task Order 11: Gap Analysis: Education Information and Education Policy and Planning in Mozambique
Comparative information for policy-makers and the “governors” of the system, at least on performance, is not as widely available as it could be. Policy-makers seem to seek out information, but information on performance, and especially comparative information, does not seem to have as much currency as possible.
It was also clear from school visits that there is an enormous difference between “good” urban public schools, which display a truly large amount of information that parents can access, and rural or small-town schools, where little information was visible even where space would allow it.
At Matola #2 Secondary school, which is considered by district officials to be a very well-run secondary school, sheets and sheets of paper had been posted behind glass in public areas where they can be viewed by interested members of the public. The same was true in Nampula District, Escola Completa 25 de Junho. Among the information noticed to be posted were the names, grades, and places of origin of pupils enrolled in the school; lists of the grades 10 and grade 12 examination results achieved by each pupil who took the exams; lists of standard fees; and lists of the books required for various classes.
Information is presented by student, presumably to create student-level pressure or accountability to study, as well as comparing schools to each other, presumably to put pressure on the teachers and principals to teach better. All this represents a high level of accountability, but it seems common only in the more urban schools. Illustrations 6 and 7 show some good examples.
Illustration 6. Student-level reports in Matola

Task Order 11: Gap Analysis: Education Information and 79 Education Policy and Planning in Mozambique
Illustration 7. Comparative school data
Overall, it seems that there are public forums to gather data on schools and how they are performing, and the overall school hierarchy have an internal process in place for comparing, evaluating, and improving their pedagogical processes. There does not appear, however, to be a standard form or format used for this purpose, nor are these practices necessarily general. In short, practices for comparison and accountability are already in place and need not be reinvented—there are already good practices in the society. However, they may need to be systematized or generalized and made more effective. In addition, putting accountability pressure on teachers, if there is no capacity to respond with improved “supply” (as noted in the section on quality, Section 3.3, and as could be demonstrated via the activities in the recommendations section, Section 4) will not yield the improvements in outcomes Mozambique needs.
3.11 The role of civil society around data and indicator usage It is difficult to generalize about all of civil society. However, the main civil society organization involved with education would seem to be the Education for All Movement (Movimento de Educação para Todos [MEPT]). This organization is largely an advocacy organization for educational improvement. It also implements a small number of project activities as a way of linking its policy advocacy to “ground truth.” In discussion of their approach and use of information, the following interesting points emerged:
80 Task Order 11: Gap Analysis: Education Information and Education Policy and Planning in Mozambique
1. Access is one of MEPT’s key areas of advocacy. Their advocacy for access and inputs is only partly due to a policy concern with access, as such. It is also partly due to the fact that because international indicators have been designed and popularized for access and completion, this is an issue around which mobilization is easier. This highlights the importance of international organizations and cooperating partners in defining and popularizing outcomes and quality indicators.
2. MEPT is data-intensive, and most of its advocacy has specific indicators. Advocacy around measureable policy goals include the following (shown as an example to highlight the rather advanced use of numerical indicators, as compared to other NGO coalitions): a. Standard EFA Dakar goals. b. Securing 20% of the national budget for education c. Securing specific and numerical salary goals for literacy workers d. Securing a specific numerical target for literacy program budget in the
MOE e. A qualitative indicator for the re-introduction of pre-school programs into
the MOE and away from the MMAS f. A goal is to establish a specific numerical indicator of quality and to get
this introduced into the PARPA. However, since PARPA has a policy goal “budget” of only three goals per sector, MEPT recognizes that there may be a policy struggle, because one of the current goals will have to be removed. It was not clear which one was the candidate, but MEPT seemed adamant that a quality goal was needed.
g. MEPT also notes that it is important to track indicators that are precursors of quality, not just the learning outcome, but not at the same high level. Thus, they build advocacy around issues such as the campaign for 900 instructional hours per year, in particular, by tracking the indicator of schools that still have three shifts.
h. Another qualitative goal is to promote the idea of more school-based management and accountability, including more discretionary use of funding. However, this in turn implies another policy goal of theirs, namely competitive and qualifications-based selection of principals. It also includes advocacy so that schools can become formal budget units.
i. Finally, for their own work and as a base for some of their advocacy, MEPT is developing quality assurance checklists and indicators of an “effective schools” sort.
As noted, this represents a rather advanced set of goals (in comparison with similar coalitions in other countries), many of them based on numerical indicators, and many oriented at improved use of data itself.
It is also clear that the State, though at first leery of civil society participation in planning and policy accountability, now considers MEPT a worthwhile policy commentator. As a result, MEPT feels heard, and the State considers them de facto development partners. It is likely that their serious focus on measurable indicators as a basis for the policy targets has played a role in their being taken seriously.
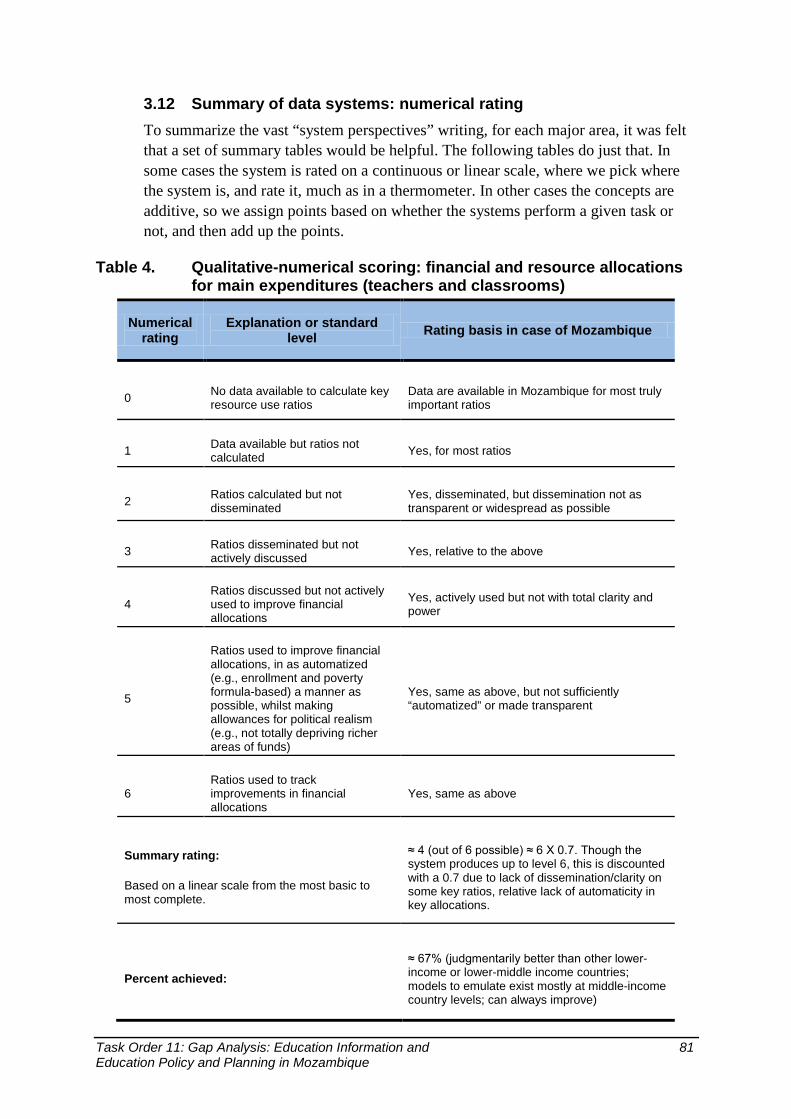
Task Order 11: Gap Analysis: Education Information and 81 Education Policy and Planning in Mozambique
3.12 Summary of data systems: numerical rating To summarize the vast “system perspectives” writing, for each major area, it was felt that a set of summary tables would be helpful. The following tables do just that. In some cases the system is rated on a continuous or linear scale, where we pick where the system is, and rate it, much as in a thermometer. In other cases the concepts are additive, so we assign points based on whether the systems perform a given task or not, and then add up the points.
Table 4. Qualitative-numerical scoring: financial and resource allocations for main expenditures (teachers and classrooms)
Numerical rating
Explanation or standard level Rating basis in case of Mozambique
0 No data available to calculate key resource use ratios
Data are available in Mozambique for most truly important ratios
1 Data available but ratios not calculated Yes, for most ratios
2 Ratios calculated but not disseminated
Yes, disseminated, but dissemination not as transparent or widespread as possible
3 Ratios disseminated but not actively discussed Yes, relative to the above
4 Ratios discussed but not actively used to improve financial allocations
Yes, actively used but not with total clarity and power
5
Ratios used to improve financial allocations, in as automatized (e.g., enrollment and poverty formula-based) a manner as possible, whilst making allowances for political realism (e.g., not totally depriving richer areas of funds)
Yes, same as above, but not sufficiently “automatized” or made transparent
6 Ratios used to track improvements in financial allocations
Yes, same as above
Summary rating:
Based on a linear scale from the most basic to most complete.
≈ 4 (out of 6 possible) ≈ 6 X 0.7. Though the system produces up to level 6, this is discounted with a 0.7 due to lack of dissemination/clarity on some key ratios, relative lack of automaticity in key allocations.
Percent achieved: ≈ 67% (judgmentarily better than other lower-income or lower-middle income countries; models to emulate exist mostly at middle-income country levels; can always improve)

82 Task Order 11: Gap Analysis: Education Information and Education Policy and Planning in Mozambique
Table 5. Qualitative-numerical scoring: financial and resource allocations for special programs8
Numerical rating
Explanation or standard level Rating basis in case of Mozambique
0 No data available to calculate key resource use ratios
Lacking precise targeting information for a lot of special programs but aware of problem and good initial use of proxies
1 Data available but ratios not calculated
Ratios and percentages calculated for at least some programs
2 Ratios calculated but not disseminated
Ratios disseminated and discussed but a habit of contestation and discussion still nascent
3 Ratios disseminated but not actively discussed
Ratios disseminated and discussed but a habit of contestation and discussion still nascent
4 Ratios discussed but not actively used to improve financial allocations
Ratios disseminated and discussed but a habit of contestation and discussion still nascent
5 Ratios used to improve financial allocations.
Ratios used to some degree to drive allocations but not consistently for all programs
6 Ratios used to track improvements in financial allocations
Same as above
Summary rating:
Based on a linear scale from the most basic to most complete.
≈ 3.5 (out of 6 possible) ≈ 6 X 0.6, where 0.6 used due to use only for some programs and only proxies
Percent achieved: ≈ 40% (judgmentarily better than other lower-income or lower-middle income countries; models to emulate exist mostly at middle-income country levels)
8 These programs include a great variety of special programs such as OVC, HIV/AIDS, literacy workers, school feeding, school health, etc. One issue might be that many of these are highly correlated with each other, and many (if not all) are a general manifestation of poverty, so one has to wonder, particularly in a country that is decentralizing, why not target resources mostly based on poverty rather than based on all these specific manifestations of poverty. If one did this, it would, however, raise the issue of how one balances the need to track these special programs, each of which has a special interest group or vision or national priority behind it, with the need to allow local (decentralized) prioritization of needs within a poverty-sensitive envelope provided by a poverty-sensitive, formula-based allocation. The solution is, probably, to carry out a very serious initial exercise to assess variation in these needs, assess whether these have a general "principal component" that is poverty, target to districts based on poverty (as well as enrollment), allow for 5-year prioritization that is truly decentralized, based on block transfers to deal with this large variety of problems. Thus, there is a mix of bottom-up planning with top-down allocation based on need. This would be designed to create freedom while at the same time lowering transactions and negotiating costs and allowing central determination of allocation on a transparent and fair basis. This exercise would require conceptual sophistication in original design, but would be much simpler to implement than the current system.
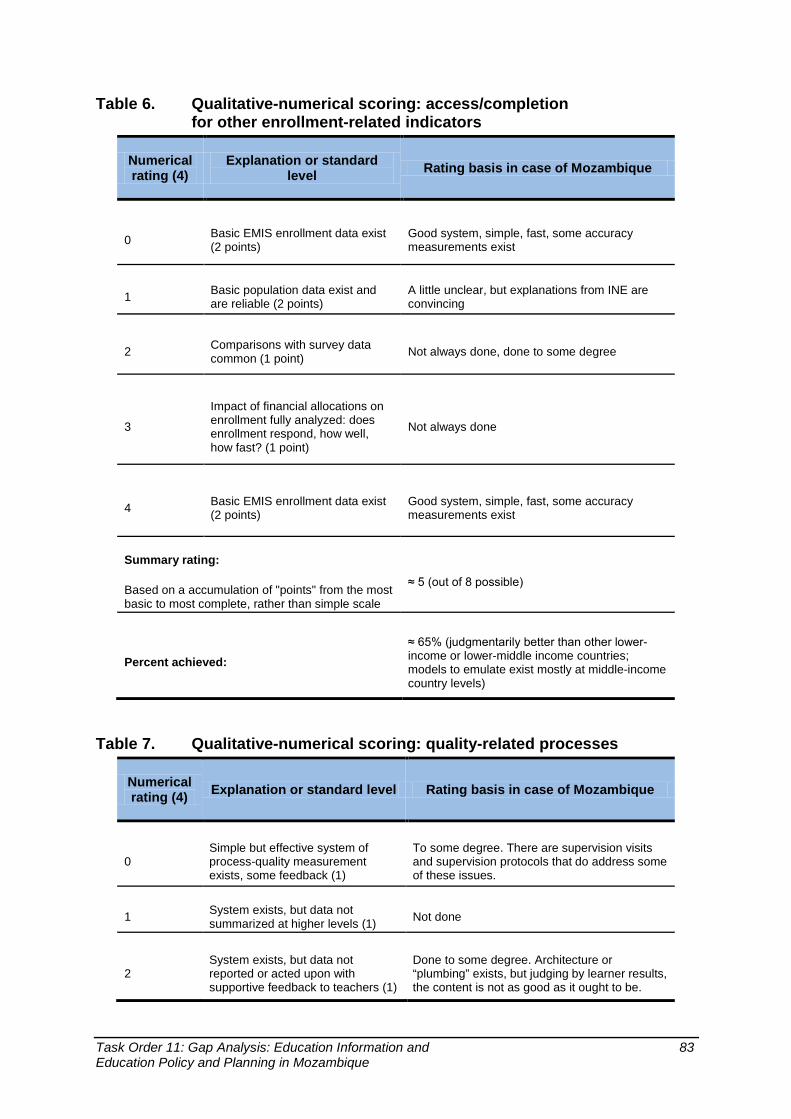
Task Order 11: Gap Analysis: Education Information and 83 Education Policy and Planning in Mozambique
Table 6. Qualitative-numerical scoring: access/completion for other enrollment-related indicators
Numerical rating (4)
Explanation or standard level Rating basis in case of Mozambique
0 Basic EMIS enrollment data exist (2 points)
Good system, simple, fast, some accuracy measurements exist
1 Basic population data exist and are reliable (2 points)
A little unclear, but explanations from INE are convincing
2 Comparisons with survey data common (1 point) Not always done, done to some degree
3
Impact of financial allocations on enrollment fully analyzed: does enrollment respond, how well, how fast? (1 point)
Not always done
4 Basic EMIS enrollment data exist (2 points)
Good system, simple, fast, some accuracy measurements exist
Summary rating:
Based on a accumulation of "points" from the most basic to most complete, rather than simple scale
≈ 5 (out of 8 possible)
Percent achieved: ≈ 65% (judgmentarily better than other lower-income or lower-middle income countries; models to emulate exist mostly at middle-income country levels)
Table 7. Qualitative-numerical scoring: quality-related processes
Numerical rating (4) Explanation or standard level Rating basis in case of Mozambique
0 Simple but effective system of process-quality measurement exists, some feedback (1)
To some degree. There are supervision visits and supervision protocols that do address some of these issues.
1 System exists, but data not summarized at higher levels (1) Not done
2 System exists, but data not reported or acted upon with supportive feedback to teachers (1)
Done to some degree. Architecture or “plumbing” exists, but judging by learner results, the content is not as good as it ought to be.

84 Task Order 11: Gap Analysis: Education Information and Education Policy and Planning in Mozambique
Numerical rating (4) Explanation or standard level Rating basis in case of Mozambique
3
Systems of measurement and support exist, but no real demand-side or accountability pressure systems exist or are effective (1)
Not done, anecdotal evidence of a lack of accountability exists. Learner outcome results, as well as spot-check by NGOs, suggest very little application of time-on-task and serious teaching methods. Shifts system is a constraint but not enough of an excuse.
4
Discussion in media, popular press regarding quality issues (half points for discussion at all, full points for well-informed discussion) (1)
Not as active as it could be. Discussion in media seemed relatively uninformed by the MOE’s own analysis of the issues.
5
Ability exists to do research into quality-determining factors, and to have dialogue and norms based on these (1)
There is capacity for analytical research, but it is thin and not necessarily directed to this priority.
Summary rating:
Based on a accumulation of "points" from the most basic to most complete, rather than simple scale
2 (out of 6 possible, since some of these exist but are sometimes weak)
Percent achieved:
≈ 20%–33% (judgmentarily a little better than other low-income countries, since many lack any system of even nominally effective quality assurance, some downgrading because of anecdotal evidence of extremely poor teaching and low accountability in the classroom)
Table 8. Qualitative-numerical scoring: learning outcomes
Numerical rating
Explanation or standard level Rating basis in case of Mozambique
0 No exam or assessment system exists
System exists, both exams and assessments, but exams are too school-based and arbitrary
1 Exists but data are not analyzed beyond providing average passes Simple averages are all that is provided.
2 Data analyzed for error patterns but not disseminated to teachers, supervisors
Appears not be seriously analyzed
3 Disseminated, but without suggestions for how to improve See above

Task Order 11: Gap Analysis: Education Information and 85 Education Policy and Planning in Mozambique
Numerical rating
Explanation or standard level Rating basis in case of Mozambique
4 Disseminated with suggestions to improve and similar-concept item banks
Does not seem to be the case.
5 Data used to track improvements
To some degree, but basis of comparison not sufficiently sensitive to key issues, not clear that equating for item difficulty in national assessments is rigorously done, and explanations of "declining quality" in terms of composition effect not well-disseminated
Summary rating:
Based on a accumulation of "points" from the most basic to most complete, rather than simple scale
≈ 2 (out of 6 possible, since only the first level, and arguably a little of the last level, exists)
Percent achieved:
≈33% (judgmentarily a little better than other low-income countries, many of which lack something like a national assessment, though many have exit exams and participate in regional assessments)
4. Action recommendations to USAID and the Government of Mozambique
4.1 Some possible principles of assistance Before setting out specific ideas, it may be useful to lay out some general principles that make sense to us given the various interviews we have had and given the scope of work of our mission:
1. Given the large-scale presence of cooperating partners in Mozambique, it would be beneficial to join efforts with others as much as possible. This does not mean necessarily engaging in joint funding of activities, but it does mean putting as little pressure as possible on existing systems with complex new ideas that require a lot of high-level managerial attention. To the degree possible, getting behind existing efforts such as POEMA makes sense. In addition, it appears that, if well-managed, highly selective, and client-oriented, TA of the type provided by DANIDA and JICA (cited merely as an example) might be welcome. The emphasis needs to be on the skill, seniority, flexibility, and client orientation of such TA. If procured via the customary USAID contractor mechanisms, it is unlikely (but not impossible) that the right sort of TA could be provided, because such mechanisms are often large and cumbersome and the targets are too inflexible. (Hard targets are useful and possible in school-level components of such projects; they are less desirable in
86 Task Order 11: Gap Analysis: Education Information and Education Policy and Planning in Mozambique
policy-reform and systems-change assistance.) Flexibility and creativity will need to be exercised. For instance, it may be necessary to provide formal opportunities to test long-term technical assistants before one commits to them. In addition, it is recommended that TA be housed or ensconced with the MOE, not in a special project unit. Coordinators of the school-level work (see below) and a chief of party (in the traditional USAID project mode) may profitably be placed outside the Ministry in a special unit. But staff whose main function is TA and capacity building should be housed within the MOE if at all possible.
2. TA will need to be combined with semi-formal capacity-building. When TA is provided, the temptation is to provide capacity building only informally and “on-the-job.” However, while totally necessary, such a style of capacity-building is often insufficient, and some degree of formality (actual training, involving lectures, laboratories with computers, and seminar/workshop types of discussion, as well as real-data projects) is likely to be needed, in one- or two-week trainings. These will, of necessity, be different for higher-level MOE personnel than for others (i.e., district personnel). The InWent experience in applied education finance and statistics is a useful one; it derives indirectly from trainings offered to South African provincial department officials in the late 1990s at the University of the Witwatersrand. InWent is currently involved in Mozambique-specific training in this area as part of POEMA.
3. Unnecessary complexity should be avoided. There is a temptation in Mozambique to develop complex systems, particularly with institutions such as INDE. If at all possible, emphasis should be on practicality and fast demonstration of utility of innovations, not on design of complex systems that are theoretically good but take years to come to fruition. Complex integrated systems should be tried only with extreme care and with some initial skepticism, since there is a temptation to solve, with complex so-called “integrated” databases, what are at heart management and policy problems.
4. Our mission emphasized “information” but in a broad sense. In the specific ideas that follow, all of the activities can be said to be about information, but, again, some in a narrow and traditional sense (really databases), and some in a broad sense (e.g., evidence of improvement and “demonstration effect”).
4.2 Specific ideas This section is divided into medium- (6 months to 1 year) and longer-term (more than 6 months from now) ideas, as well as immediate ideas which could conceivably be started and even finished in less than 6 months.
Medium- and longer-term ideas In this section, five specific ideas are proposed for consideration by USAID and the GOM to be discussed in more detail immediately below, but listed briefly first for the sake of logic:
1. Systems-level work to support decentralization, improved planning and data usage in planning, data usage per se, creation of demand for data, and EMIS
Task Order 11: Gap Analysis: Education Information and 87 Education Policy and Planning in Mozambique
itself, including capacity building in these key areas at any level (national, district, provincial)
2. Systems-level work with INDE to develop more practical yet rigorous ways in which assessment can be put directly at the service of teachers and learning
3. Systems-level work on assessment with various directorates in charge of general education, but including inspections, teacher support and pedagogical direction, and IFPs, to improve the content of what are, currently, apparently successful mechanisms. (That is, there are well-designed mechanisms for follow-up visits to schools, but the pedagogical content of these visits is not of sufficient quality.)
4. School- and district-level work to provide massive and incontrovertible evidence of the utility of very focused improvements in teaching practice, certain materials provision, and so forth
5. A certain amount of survey work that could be done immediately or very soon; a special purpose survey, perhaps in collaboration with EMIS or INE. Specific ideas for these surveys are included below.
The evidence base for these ideas would be based on recent experience of USAID; the U.K. Department for International Development (DfID); and home-grown international NGO (INGO) or NGO projects in India, South Africa, and other countries. Specifically, projects such as Liberia’s EGRA Plus and LTTP2, Kenya’s EMACK2, South Africa’s DDSP and IEP (all USAID funded), as well as Breakthrough to Literacy (BTL-DfID), inform these suggestions. Recently, INGOs such as Save the Children have been implementing projects using their Literacy Boost approach, including in Mozambique (but in many other countries as well), that show promising large and fast increases in early literacy, using some of these approaches. Similarly, NGOs such as Molteno in South Africa or Pratham in India have produced remarkable increases, sometimes in a matter of months, using cost-effective techniques such as those outlined here. Naturally, what is proposed here is our own interpretation of the lessons emerging from the various projects. On average, these projects have produced improvements that range from 100% to 400% in key reading skills, in a time frame that goes from a few months to 3–5 years. These large increases are predicated on starting from a very low base, which is the case in Mozambique as well. Such increases are not possible if the base is already high. Literature on these experiences could be provided to USAID or the GOM upon request. It is expected, however, that usage of such literature would be up to an actual design team, which would presumably work with USAID (or a design team from within USAID itself) at an actual project design stage, which this study is not.
To help orient thinking around this, the following characterization can be offered. Activities 1–3 are possibly relatively inexpensive in total, but can provide high leverage and are needed to generate the sustainability of activity 4, which would be the most budget-consuming but would be the one that would most contribute to producing the sorts of fast results that both USAID and the GOM would presumably want. The rest of the activities are needed so that those fast results become sustainable. Activity 5 is a good idea to generate immediate improvements in certain areas, to generate good will, and also to lay the basis for activity 4. All but activity 4

88 Task Order 11: Gap Analysis: Education Information and Education Policy and Planning in Mozambique
can be considered “systems-level.” However, as noted, the “school level” is where most of the budget should go. Finally, these activities need not all be “outsourced” as one single project. They should be, however, a single “virtual” project in USAID’s mind, and USAID (and the GOM) should require close collaboration between implementers. For instance, it could be that activity 1 can best be discharged by supporting an existing effort such as POEMA, while a specialist contractor carries out 5, and a traditional “NGO project” carries out 2, 3, and 4, possibly with support from an INGO. Mixes are certainly possible, in that an INGO could provide extra technical support to an effort such as POEMA, if the latter is seen to be taking the lead.
It is likely that the “lead” TA would be the TA in task 1 above. This person should ideally be the closest link to the higher levels in the MOE and should be a mentor and advisor to the other potential TAs.
If INDE is already receiving TA in more psychometric and highly technical areas from other cooperating partners, then the TA in activity 3 could be merged with the TA in activity 2, and only one TA need be provided, with an emphasis in the application of testing. If there is insufficient TA for INDE, then activities 2 and 3 do probably need to be separated, and activity 2 can emphasize the more technical and psychometric or measurement issues, whereas activity 3 can emphasize the application at the classroom level—the use of measurement for improvement.
More specific discussion of activities follows.
Activity 1 involves long-term TA in systems-level work to support decentralization, improved planning (and data usage in planning, data usage per se, creation of demand for data, EMIS itself). The following points characterize the activity. Evidently, no one person could do all these things. Some selection would have to be made.
• Coordinate with DIPLAC • Provide assistance in development of funding algorithms, especially simplified
and powerful ones that make allocations more transparent and encourage decision-making to devolve downward, under supervision
• Coordinate work of forecasting and planning • Develop analysis of educational effectiveness and equity, by linking with TA
in activities 2 and 3 • Coordinate with governance activities in decentralization to ensure that data
are used in horizontal or own-level planning • Provide opinion on appropriate level of complexity in other data systems
linked to policy, planning, and finance, such as HR, school mapping and GIS, EMIS, etc.
• Develop protocols for improving governance and data usage in comparative analysis especially comparing results to inputs, and across geographical-political jurisdictions (e.g., comparing learning outcomes per unit of input across provinces and districts)
• Develop protocols for school reporting to communities especially on issues of finance and learning outcomes

Task Order 11: Gap Analysis: Education Information and 89 Education Policy and Planning in Mozambique
• Provide support in producing interesting discussion points and data presentation formats in key policy forums; help create demand side for data usage
• Collaborate with activities such as POEMA in providing capacity in planning and analysis techniques
• Collaborate with professional development directorate and Ministry of Labor, perhaps private sector, in developing measures of labor-market and cost-effectiveness of technical-vocational schools, link to EMIS, INE, if appropriate
• Provide capacity building and skills in statistical analysis and higher value-added data techniques
• Coordinate specialist short-term TA as needed, in these areas, including EMIS, finance, decentralization, forecasting and projections
• The ideal profile for this activity would be an education economist, planner, or general education statistician.
Activity 2 would involve long-term TA (or a mix of appropriate short-term TA) with INDE in support of their development needs in statistical and psychometric analysis as well as assessment strategy. The following points characterize the activity.
• Ensure sufficient rigor of assessment instruments, especially in terms of inter-temporal comparability.
• Develop practical suggestions for how data produced by assessments can be used in the classroom and coordinate linkages with general education, school inspections, teacher support visit teams, and IFP in-service and pre-service training.
• Ensure that assessment and exams of various sorts are linked to each other, while tempering ambition regarding complexity of integration.
• Within the context of later-grade, use written assessments and help develop oral assessments that can be used to provide early guidance, particularly in reading.
• Focus on capacity to do the above in mother tongue. • Develop capacity building and training approaches to allow data users to
better understand implications of various assessments. • Liaise with activity 1 in producing data on school efficiency and outcomes
“production.” • Liaise with activity 3 in providing teacher training and support implications of
assessment results. • The likely profile for this activity would be a psychometrics expert or
assessment systems expert who has experience, not just with the narrower technical aspects, but with systems building. If the READ trust or others donors are already providing this sort of TA, it could be eliminated from USAID’s list of interests.

90 Task Order 11: Gap Analysis: Education Information and Education Policy and Planning in Mozambique
Activity 3 would involve helping inspection, support, and training systems focus on the skills that are needed in the classroom. The following points characterize the activity.
• Collaborate closely with the school-level work discussed in activity 4 to develop simple protocols for applying school-level assessment of students, particularly in fields of focus such as early reading.
• Work with curricular experts to make sure that practices that are more productive than those currently used in Mozambique, particularly in a focus field such as early reading, find their way into teaching practice.
• Collaborate with general education, inspection, and school support groups in the MOE to develop supervision and observation protocols that closely target sharper pedagogical skills, again using early reading as a possible case in point.
• Develop simple methodologies for improving teacher capacity, including train-the-trainer systems, possibly coordinating with use of technology such as video for improving actual behavior in the classroom.
• Focus on how the provision of the various components of a package such as that discussed in activity 4 can be integrated via supervision and teacher support, to make sure that books are actually used, for instance.
• Collaborate with the MOE to ensure that the practices that are demonstrated in activity 4 are integral to the MOE’s views and thus maximize chances of sustainability and replicability.
• Experiment with competitive criteria for selecting and evaluating principals. • The likely profile for the TA involved in this activity would be teacher
training and supervision, but with a focus on actual change of classroom behavior.
• In a summary sense, activity 3 is the closest link between the MOE and the school-level work. The activity is key to sustainability of the latter, in that respect.
Activity 4 would involve direct work with schools, but in close coordination with the other activities, especially with activity 3. The activity could involve the following:
• Collaborate with general education specialists at the MOE in agreeing on curriculum-compatible measures that could be used to rapidly ramp up learning achievement in reading. This would include specific lessons and scope-and-sequence specification that can scaffold weak teachers through a whole year or two of lessons needed to impart literacy.
• Create consensus that at least in schools where the sharper approach is piloted, a fixed amount of time is to be devoted to explicit reading lessons.
• Tie this to supervision and teacher support protocols. • Model the above by actually deploying inspection and teacher support teams
in a selected number of districts or ZIPs within districts. Ensure involvement of principals.
Task Order 11: Gap Analysis: Education Information and 91 Education Policy and Planning in Mozambique
• To the degree possible, work with actual teacher supervisors and ZIPs. • Link to IFPs’ in-service and pre-service training. • Design a high-fidelity cascade approach and ensure that there are instruments
for assessing the fidelity. • Identify and train both coaches and master teachers to ensure modeling,
including use of video. • Experiment with technologies such as video clips for micro-teaching so that
there is no fidelity loss in any cascade model that is used. • Underwrite and evaluate these experiences in mother tongue efforts. • Ensure supply of books that have “fun” purposes, not just curricular purposes. • Collaborate with activity 2 in modeling and using assessment tools for
targeting performance in early grade reading and/or mathematics that are consistent with broader INDE plans but have specific expression at the teacher level, but can also generalize to reporting progress to policy makers in a concrete goal such as early literacy.
• Ensure rigorous evaluation using methods that are as close as possible to randomized controlled trials, depending on interpretation of USAID’s current evaluation policy. If these techniques can be considered “known” and “already-demonstrated,” then the demands are less rigorous. Collaborate with activity 1 statistician or education economist in designing and following up to ensure rigor of evaluation.
Finally, activity 5, which could be developed with Washington-provided funds, could carry out a special purpose survey which could involve the following, among other things:
• Provide numerical verification of key EMIS data. • Model quality-control small-sample surveys such as Lot Quality Assurance
Sampling (LQAS), and create alliances between EMIS and pedagogical interests in the Ministry.
• Provide evidence on the issue of a grade 1 “bulge” and the problem of informal repetition.
• Provide key new information on determinants of access and enrollment, to see whether distance to school continues to be an issue.
• Model and provide data to see whether targeting based on poverty is a simpler and more feasible idea, even for special programs, than targeting based on each specific need.
• Provide evidence on implementation of governance changes such as Conselhos da Escola.
• Provide models of teacher quality supervision using improved instruments.

92 Task Order 11: Gap Analysis: Education Information and Education Policy and Planning in Mozambique
Immediate ideas The medium- and long-terms activities outlined above would require a certain investment of planning and coordination prior to being brought into effect. Though these longer-term projects are the most appropriate for addressing the major needs identified in this report, the evaluation team did also identify real needs that could be addressed through activities that do not require as much of an investment of time or effort in planning to serve their purpose. The short-term activities identified in this section focus on some element of developing MOE human capital in the area of data management and analysis. A shortage of human capital for data activities was a refrain common in many of the interviews we conducted—though most data systems work; either there are insufficient data users to make the best use of the data generated, or data users have insufficient knowledge to make the most of the data available to them.
Short-term training programs could be carried out in any number of ways to broaden and/or deepen data capacity at the national or subnational levels. If designed in anticipation of a broader technical support activity, short-term training programs could support the overall effort. If conducted even in the absence of any larger strategy, human capital development programs would strengthen the technical capacity of targeted areas of the Ministry in a manner analogous to the way general education programs benefit overall national populations.
The areas of potential activity listed here have been purposely chosen as simple, limited-scope projects that would not require a large commitment of resources from USAID, but could have a noticeable effect within the Ministry. Each area of activity is described here in broad terms—the scope of any individual activity or combination of activities could be expanded or contracted according to the priorities of USAID. In an effort to deliver these potential activities as promptly and cost effectively as possible, they are envisioned as targeting the national Ministry offices, though it would be possible to conduct similar activities at the provincial or district levels as part of a more ambitious initiative.
Although USAID could draw from a number of resources to support these initiatives, the Education Policy and Data Center (EPDC) is well positioned to provide the type of short-term assistance described here. EPDC has staff time and funding available through a fixed-line-item on its Economic Growth and Trade- (EGAT-) funded budget to support a pair of 2-week missions to Mozambique between March and September 2011. EPDC staff who took part in the evaluation activities that led to the creation of this report are familiar with the data capacity needs of the Ministry and possess a depth of experience in education data analysis and management that could be brought to bear on capacity development activities in Mozambique.
Idea 1. Develop Capacity for Data Use: Strengthen the Ministry’s capacity to use and analyze existing data using existing resources. The Ministry of Education has a well-designed and established system for data collection and report production, particularly through the EMIS system. Among data producers, there is strong evidence that data are disseminated and are easy to use. However, there is a gap in data use between
Task Order 11: Gap Analysis: Education Information and 93 Education Policy and Planning in Mozambique
“data producers,” those who produce and are able to generate data from databases, and “data users,” those who need data to carry out their duties in the Ministry.
To strengthen data use by Ministry staff and alleviate the amount of time data producers spend on routine data requests, one should consider developing and delivering a set of capacity development activities aimed at demystifying data and teaching data users easy ways to access and analyze data themselves. Following a brief assessment of needs at the Ministry, it would be possible to develop and roll out a set of training sessions on topics ranging from basic to advanced. Possible training areas could include the following:
• How to locate and use EMIS data pivot tables on the Ministry’s intranet • Simple Excel functions that can be used to tabulate, sort, filter, and calculate
data • Principles for designing simple but effective visual displays of data • Demonstration of the use of data visualization for analysis and planning in
context
Depending on the needs of the Ministry and the level of investment by USAID, training sessions could be rolled out as a one-time activity, or could be developed collaboratively with Ministry trainers for continued delivery. Training sessions could be complemented with written training materials and tutorials.
Idea 2. Strengthen Key Data Tools: Assist in developing data dissemination and analysis tools to meet the Ministry’s needs and to stimulate demand for data analysis and policy dialogue. While the MOE has good systems in place producing statistical documents (such as the annual EMIS reports) and for planning and policy formulation, these essential functions tend to exist in separate spheres with little overlap. Data documents, for example, are largely expository and provide little analysis or evaluation; planning and policy activities, while informed by data, are not sufficiently documented or transparent.
To demonstrate the power of data-driven analysis and stimulate demand for data use among policy makers, it would be possible to work with the Ministry to identify opportunities to strengthen existing documents or create new documents to showcase the potential for indicators and visualizations in practical data analysis. Through careful collaboration with key DIPLAC or other Ministry personnel, the tools produced would be aimed to meet an immediately relevant need of the Ministry. A carefully collaborative process would also ensure that analytic and visualization skills are transferred to the Ministry through training and documentation. Moreover, if the tools and analyses were targeted to influence actual planning/policy activities, they may serve as a way to stimulate demand for data-driven analysis within the Ministry.
One possible activity would be to develop a set of simple, visual materials to complement the other planning documents used at the annual national budget planning meetings, where resource allocations for education are determined. By placing pertinent data in front of participants in the meeting, one could make it easier for the planners to draw from data when debating needs and allocations. By targeting key policymakers with data in a setting where data can be used to justify a stronger

94 Task Order 11: Gap Analysis: Education Information and Education Policy and Planning in Mozambique
budget allocation, the activity could possibly stimulate demand for data within the system.
Additional ideas for potentially useful collaborations include the following: • A spreadsheet resource allocation matrix to formalize algorithms used to
determine the relative distribution of resources from provinces to districts or from districts to schools
• Help redesign the “EMIS pivot table” spreadsheets housed on the Ministry intranet to make them more accessible, useful, and user-friendly to non-DIPLAC users within the Ministry.
• Design or identify information that could go on the Ministry website for dissemination to the public.
Idea 3. Document the EMIS System. Document already-existing data processes to increase process transparency and preserve knowledge for future system users. DIPLAC and other data producers within the MOE have developed remarkable systems for collecting and aggregating data that could be used for policy decision-making. However, much of the knowledge of the processes and data-checks for these systems is not documented but rather exist in the heads of technical experts. As the current cadre of technical experts nears retirement age, it will become increasingly important to ensure that their knowledge is preserved so that successful collection and analysis processes are not compromised during the transition process.
To ensure a successful transition to sustain the existing EMIS system, we recommend working with the Ministry to develop a process for documenting the expertise and knowledge of key technical experts at the national and provincial levels. Priority areas of information to be documented include the following:
• National level: processes for merging provincial data, data checks, verification, and cleaning; using EMIS data to generate a pivot table in Excel and to produce annual statistical reports
• Provincial level: processes for collecting, inputting, and verifying data and reporting data to the national EMIS unit
Idea 4. Connect with External Data Sources: Help the Ministry access valuable education data from non-Ministry sources. There are a number of data sources that contain data directly relevant to education but are not being used to the full potential within the Ministry. Prominent among these are census, household, and labor force survey datasets. Census and household survey data could be useful to the Ministry in several ways: (1) as a periodic cross-check against data being generated through EMIS and other internal sources; (2) as a status update for planners and strategists on issues such as overall school participation and the determinants of patterns of attendance and non-attendance; (3) as a source of information on important sub-populations such as non-attending children, special needs groups, and the labor force; and 4) in linking to quality information from surveys such as SACMEQ. Policymakers within the Ministry are aware of the potential utility of information from these datasets, but they have access to data no more detailed than the general reports and have not yet utilized these data to any degree.
Task Order 11: Gap Analysis: Education Information and 95 Education Policy and Planning in Mozambique
To demonstrate the potential value of census and household survey data, one could support an effort to draw linkages between the MOE and INE, which is home to Mozambique’s institutional knowledge and expertise in these areas. Depending on the level of involvement available from INE, it may be possible to encourage a direct relationship between technical experts from the two institutions. If INE staff are less available, it would be possible for external consultants to support the Ministry to explore and extract relevant data from census and household survey datasets. This second type of collaboration would serve the dual purposes of generating useful policy data for the Ministry and building an understanding of what types of knowledge could be expected from these data sources so the Ministry can continue developing a relationship with the national statistical office in the long run.

96 Task Order 11: Gap Analysis: Education Information and Education Policy and Planning in Mozambique
Appendix 1: Narrative field report, Nampula Province, Monapo and Nampula Districts
Dates of visit: February 28 to March 2, 2011
Visitors: Ilídio Buduia, MOE
Luis Crouch, EdData II
Chris Cummiskey, EdData II
Jim Dobson, USAID
HyeJin Kim, EPDC
Purpose of travel was to develop a ground sense from a province, two districts, and four schools of how key data functions assist in policy formulation and tracking at levels lower than the national level. This was seen as particularly relevant given the policy of decentralization, and for the analysts, particularly those based outside Mozambique, the visit allowed them to see the ground-level reality.
This trip report does not narrate all key events and items in the conversations point by point but highlights only the ones that are useful in illustrating key points made elsewhere in the body of the report. It also emphasizes reflections motivated by the interviews as opposed to a straight narrative.
In that sense, key points that are made repetitive by virtue of having been made earlier are skipped from later conversations. They are somewhat addressed if their repeated emphasis is telling.
Anselmo Castillo, Chief of Planning, Education Department, Nampula Province
Aderito Cabrial, Chief of Staff, Provincial Education Director’s Office, Nampula Province The Provincial Director was unable to meet with the team, so this first meeting served as an introduction and also as an opportunity to discuss key planning issues.
The hypothesis that planning in Mozambique is still somewhat a traditionalist bottom-up and top-down process, rather than a truly decentralized one, was reinforced by various statements pertaining to how the province views resource allocation. In general, a process of petitioning based on assessed need at district and then provincial
Task Order 11: Gap Analysis: Education Information and 97 Education Policy and Planning in Mozambique
level is followed with an allocation that is eventually much smaller than the request. Nampula “requested” some 2,500 new teachers and was “granted” only 1,470 or so. Similarly, it “requested” some 225 new classrooms and was “granted” only some 150. (Note the consistency, in that the grant/request ratio is nearly 60% for both.) It is also interesting to note that the provincial authorities do not really see the district as having the official duty to “request” anything, and the district is essentially given funds and/or posts based on higher-level judgments. This perception occurs in spite of decentralization.
The provincial authorities in planning do not seem to be concerned about analyzing their allocations in comparison to that of other provinces or on the basis of objective indicators of their needs relative to that of others. This tends to confirm a general impression of lower levels of government not having a demand for data analysis that allows them to compare their situation and to make an independent judgment regarding the fairness of allocations. Instead they seem to more or less accept allocations coming from higher levels as fair. Whether such a belief is justified is relatively difficult to assess because funding or allocation of resources, such as new classrooms or teachers, does not follow a simple or clear formula but rather a process of apparently somewhat complicated weighting of various priorities.
When districts within Nampula were queried about similar issues, they also tended not to contest their relative allocations or analyze comparative allocations based on needs databases.
Districts, in turn, develop a sense of need based on projections and analyses coming from the schools themselves, based on growth of enrollment. This appears to be another factor why data use in a planning sort of mentality, rather than a fairness sort of mentality, seems pervasive. However, since enrollment is likely to cease growing so fast (at least at the primary level), concern will shift more toward fairness of allocation to redress crowding and distance. It seems clear that over the next few years, as both the real situation changes (at least in primary education) and as decentralization deepens, there will be a need to develop data usage of a more shared sort, where transparent criteria to fairly address need, rather than bottom-up and then top-down planning projections, will be more and more needed.
In fact, the notion of whether allocations are “fair” or not generally was taken to mean whether the allocations are fair in some ultimate or absolute sense, and the response tended to be that, of course, allocations are not fair in some ultimate sense, given the great need and that it is too bad the budget is limited. This, again, tends to confirm the hypothesis that planning is seen as a sort of bottom-up, top-down process, involving negotiation and mutual give-and-take rather than a process involving simple allocations on the basis of shares of revenue.
Given the massive and pervasive need at the most elemental level (see illustrations elsewhere in this report) and the absolute poverty that prevails, however, this attitude is easy to understand. When poverty is so crushing as to be an absolute rather than a relative concern (that is, when there is more of a concern with absolute poverty than with inequality), perhaps it makes sense to be concerned with the absolute amount of allocations than with their horizontal fairness. Nonetheless, it is clear that a real spirit

98 Task Order 11: Gap Analysis: Education Information and Education Policy and Planning in Mozambique
of decentralization, taken to imply more localized empowerment, priority setting, and decision making based on simple allocation rules and transparent data, as opposed to vertical negotiation, is not yet common.
However, it is also clear that the planning authorities, both at provincial and national levels, are quite aware that more could be done with these aspects by promoting feedback and sharing of data. It is clear that data are used, and rather intensely, but more, again, in a bottom-up and then top-down planning mode than in a data-sharing and formula-funding approach that encourages localized decision-making. (The one exception being the ADE, discussed later.)
The provincial use of data seems quite good. The province verifies EMIS data using a 3% to 4% random sample. In addition, they seemed aware of all their key ratios without needing to look them up. The planners confirm that use of data by politicians is quite active, given the prominence of education as a social delivery promise. This increases demand for data and accountability. Provincial assembly and provincial administrators seem to demand data. At the provincial level, NGOs also demand data, but only for execution of their own programs, not in policy advocacy.
Provincial officials express need for training because of constant shifting of staff. GIS and school mapping seems somewhat dysfunctional. More training is needed in simple technical capacities (but as applied to education), such as in Excel, than in management of bureaucratic systems and knowledge of norms.
Documentation of bureaucratic systems is of fairly good quality, but often out of date.
José Adolfo, Chief of Human Resources, Nampula Province Mr. Adolfo confirms that though HR is decentralized to districts, most real functions are still performed at the provincial level. Districts “own” the payroll in a mechanical sense. Province actually assigns new teachers (that is, specific teachers to specific posts, not just the number of posts) and executes most personnel actions needed to get staff on payroll as well as to execute other personnel actions, such as the change in a teacher’s professional status, which necessitates a change in pay. In addition, province carries out a good bit of supervision and monitoring of districts. Decentralization theoretically is good, but lack of capacity (knowledge and systems) is too great and has not been addressed because of a lack of training budget. In essence, decentralization is on paper only, and there is not much decentralization of actual decisions. However, he did note that even if on paper, decentralization does create more localized accountability, e.g., in dealing with ghost teachers. He also notes that having decentralization exist, but on paper only, creates an extra workload, because maintaining payroll at the district level but having all real decisions and paperwork at the provincial level just creates extra work.
Thus, there exists a great need for capacity building, echoing previous comments.
Because banking is itself not sufficiently decentralized, teachers in some districts have to spend up to three days per month getting their pay.
Task Order 11: Gap Analysis: Education Information and 99 Education Policy and Planning in Mozambique
He confirms the “trade in teachers” because some IFPs produce more than is needed, others less, so there is a top-down planning or reassignment of teachers, even though IFPs are in principle decentralized.
Province was not able to show the actual HR database they use, as the needed personnel were not available.
He states there is a surprise audit to weed out ghosts, perform physical counts, and eliminate personnel who do not appear; they have to ask to be re-instated. Asked various times, at various levels, and the story seems consistent.
In general he confirms the notion that allocations to districts, and from the national level to provinces, are generally treated as fair or are not contested via comparisons between provinces or between districts; instead, contestation is around the amount asked for and the amount allocated, which displaces the debate toward the total allocation rather than its horizontal fairness. It could be that the allocations are horizontally fair. (Macrodata seem to confirm this idea, because PTRs have come down faster in provinces where they were highest.) However, it does seem as though horizontal or own-level planning and contestation are not very practiced.
Fernando Salinas Casi-Casi, Chefe, Departamento Direcção Pedagógica (DDP) Main duties over the year seemed to be distribution of circulars pertaining to teaching and learning, checking on student presence and attendance, assessment of teachers’ skill levels and implementation, assessment of whether school year-start norms and procedures are being followed, and control and supervision of exams. They do not perform an inspection function, though. Inspection function encompasses visits to schools; checks on whether there are issues; and transmission of reports to province head of education, with copy to DDP. But inspection is not regular and appears to be done only when needed at the request of the province head of education.
In general the main problem with reaching schools is lack of non-personnel budget. For example, in some years they have had only one car, and sometimes a car might not work for months. Serious problems of logistics and management exist.
They do not work with school councils on council-school relations, nor do they work on, nor does there seem to be, a school report card that is used to report to councils.
Ermelinda Macusa, Chefe, Provincial DAF, Nampula (with large team) Functions include issues such as payroll supervision, financial management of special projects or efforts such as FASE, supervision that districts are executing projects or payments such as ADE according to norms, and management of regular (state-based rather than FASE) investment funds (e.g., furniture purchases). Inspect to make sure schools follow ADE and make only the approved purchases.
100 Task Order 11: Gap Analysis: Education Information and Education Policy and Planning in Mozambique
Direcção Distrital Monapo In allocations of teachers or classrooms, they generally get much less than asked for. No real explanation of why they get what they get. But allocations are generally seen as fair. They confirm that it encourages people to ask for more than they need, because the more you ask the more you get. Upon asking, they seemed generally aware of key ratios and seemed to trust that allocations are prioritizing the right things, even without formula-based allocation. However, as usual (“the person in charge is not here”—same as reason given at the provincial level on HR database), data on allocations could not be made available, to see whether the allocations truly were obeying some principle. Note that it is the province that tells them how to allocate or what to allocate to schools (though this assertion seems to have been contradicted later), so there does not seem to be much decentralized decision making in effect. (This confirms the conversation with the provincial level.) They do allocate classroom construction based on cascading priorities: (a) crowding, (b) whether the school is complete, and (c) conditions. So, there is not much use of distance or out-of-school as a criterion (except for completion). The allocations are made (in principle) in a participatory manner, involving several meetings of local councils. ADE distribution was discussed; manuals were very clear and readily available; they were able to show the manuals to us immediately. There seems to be far more transparent than teacher or classroom allocation. This may be because it is a donor-only fund, or because, after all, money is easier to allocate on a per-student basis than teachers or classrooms. The process of purchasing with ADE funds was described and sounds transparent. However, transparency seems to be assured through participation and not through data display and availability of ongoing contestation. Thus, for instance, a parent accompanies the school officials to make the purchases in the city. And to control collusion and ensure fair procurement, they can buy only from pre-approved stores.
Patacue Primary School This is a quite rural primary school in Monapo district, about 30 minutes drive, on a good dirt road, from the Monapo district office. The school is not nearly as rural as schools can be, but it is rural. Terrible school infrastructure exists, as is common in Mozambique. Almost all, if not all, classes are under trees and very large, especially in grade 1 or so. Incomplete construction of new classrooms is in evidence, apparently abandoned or temporarily abandoned, confirming impression of lackadaisical contracting or poor (undercapitalized, under-skilled, under-funded, or dishonest, or all three) contractors. There is lots of absenteeism (15 out of 52 in one random class missing in the attendance register), but attendance register is kept and up to date. There is a big enrollment dropoff: twice as many children in grade 1 as in grade 5. It is not clear whether this is true dropout or just over-enrollment in grade 1, difficult to say from the school data. They receive their ADE and are happy with it because it makes supplies more agile. They buy the right things with it; the respondent was very aware of money, what the purchases were, etc. DDP had visited three times last year, so apparently visits do happen. Respondent was able to articulate well how the visits

Task Order 11: Gap Analysis: Education Information and 101 Education Policy and Planning in Mozambique
articulate with in-service training. In-service training was also provided. The classes that were visible were on task.
We assessed readers, but only the children chosen by the teacher could read anything at all, and very little at that. Those chosen by the visitors could not read at all.
Escola Primaria Completa de Monapo This is a much larger, concrete school in Monapo district capital, built by the private sector (local agribusiness) years ago. However, while some of the infrastructure was solid, much was dilapidated, un-maintained, and a roof did not exist for quite a few classrooms, and even here there were outdoor classes. There was no furniture at all, as was common in many schools visited. Books were present, but 30% of students had none. Books were delayed this year (our visit was early in the year). Principal was well informed and had all key records, more so, it seemed to us, than in rural areas of other countries. They receive regular visits from DDP and also there is in-service training for teachers—almost all. Most of the classes visited were on task. Children assessed were in grade 4. Only those identified by teachers could read at all, and even then just barely.
Nampula District Office We heard the same stories regarding allocations: they often get about ½ of what they ask for, but there seems little own-level planning and little contestation or comparison to other districts. They seem to rely on top-down allocation based on bottom-up requests and seem to accept that top-down allocations are fair. Attention was, as usual, on overall lack, not fairness of the allocation. ADE is well known and used. They complain about small allocations that require lots of work. Books are relatively well supplied this year except for spotty problems, such as the whole district missing one subject in one grade.
Escola Primaria Completa 25 de Junho This is a very large school, downtown urban, with good infrastructure from colonial days. It is reputedly one of the best two primary schools in the city. They confirm that teachers have received DDP visits and training, and these are coordinated. They are well aware of ADE numbers and allocation formula. They confirm that the payroll works smoothly. Assessed readers: only the three with tutors could read well, and they were picked by the teacher; the ones chosen at random by the visitors could not read at all or barely. Note that these three were the only pupils we assessed in the entire province who could read well. Note: in the rest of the province, we assessed in grade 4; here, because it was an urban school and the second best in the city, we assessed grade 3 (beginning of). Yet only three out of five could read.
Escola Primaria Completa Armando Pajare This is a poor, peri-urban school in Nampula, chosen to complement the “good” urban school above. This was a huge school, one of the largest primary schools I have ever

102 Task Order 11: Gap Analysis: Education Information and Education Policy and Planning in Mozambique
seen, if not the largest. It was the size of a medium-sized business enterprise, with 157 employees, 145 of them teachers, and four shifts (including evening school). The infrastructure, as usual, was very dilapidated or non-existent in many cases, with one block of classrooms under construction and looking good, another block under construction and apparently paralyzed, confirming the impression that much construction seems mismanaged or naively entered into. As usual, though, most children had their books. ADE was known by the school head, and he had his books and accounts in hand and apparently well maintained (by sight). They confirm that most if not all teachers got some in-service training, and there was coordination between training and school support visits (fourth school to say so). One complaint about ADE was relative lack of flexibility, for instance in using money for repairs. But flexibility, for example, in allowing for school-based targeting for OVC was much appreciated. At this school, one lesson by a principal-chosen “good” teacher was observed, and results are commented on in the main body of this report. None of the children chosen to see if they could read the very lesson they were on were able to read it. (This was grade 2, though.)
Task Order 11: Gap Analysis: Education Information and 103 Education Policy and Planning in Mozambique
Appendix 2: Narrative field report, Maputo Province, Matola District
Dates of visits: February 28 and March 1, 2011
Visitors: Helen Perry, USAID Evaluation Team, EdData II
Teresa Robinson, USAID
Ben Sylla, USAID Evaluation Team, EPDC
Visited: Province of Maputo
Director of Planning: Mr. Simão Director of Pedagogy: Mr. Silvestri Dava Director of Finance Director of Human Resources: Abilio Chilambo
District of Matola
Director Mrs. Ines Sembine
Matola Secondary School, Director Mr. Henrique Quinto Matola Secondary School enrolls approximately 9,000 pupils and operates in four 5-hour shifts—two day shifts, an evening shift, and a night shift finishing at 10:00 p.m. By all appearances, it was an effectively managed school and ranked 7th out of the 19 (or so) schools in the district on the grade 12 examinations. The school was renovated approximately five years ago and was a well-constructed three-story concrete building with large classrooms. In consultation with the pedagogical staff and the community, it was agreed that because they have large classrooms, it was acceptable to have a maximum of 75 students per class. While the classrooms were physically large, there were not enough desks to accommodate all the students, and those without desks sat on the floor.
The school receives a monthly budget allocation from the district. While budget requests are developed by the school each year based on need, the basis of their allocations is not clear—the director assumed that the allocations were based on the size of the school. During the previous school year, for instance, monthly government support amounted to approximately 45,000 MZN, but just the monthly utility bills came to 40,000 MZN for electrical and 30,000 MZN for water. The school’s non-teacher expenses are met mainly from school enrollment fees. These are used to pay

104 Task Order 11: Gap Analysis: Education Information and Education Policy and Planning in Mozambique
for water, electricity, library books, non-pedagogical staff (ground staff, administration, and technicians), and extracurricular school activities (sports and competitions).
The school also has a small stream of revenue from the vendors who operate the school canteen and bookshop.
Matola C Primary School, Director Mrs. Christina Rogerio Matola C Primary School is a concrete structure with 14 classrooms and another 12 classes under trees. It enrolls 3,118 pupils in three 3.5-hour shifts. The first shift begins at 6:30 in the morning, and the last ends at 3 in the afternoon.
The school is a Primária Completa, offering all seven grades of primary. The number of classes enrolled in each grade this year ranges from a low of six grade 1 classes, to a high of nine grade 5 classes. Overall, the school encompasses 52 classes, 62 teachers, and 10 non-pedagogical staff.
No classroom furniture exists because, according to the director, the school buildings had not been rehabilitated and so the school was not eligible to receive classroom furniture. There appeared to be no system at the school for allocating the under-tree classes, but most of these classes were grade 2. The school is adamant that the under-tree children perform worse than their classroom counterparts, but they do not see the necessity for rotating classes from under trees to classrooms.
EMIS In general there is a relatively high level of data use for both planning and monitoring at all levels of the provincial administration and at schools. The EMIS March 3 data collection is thoroughly validated and utilized for planning from the school level up. In each planning forum, summary data is presented to each level with comparisons available for scrutiny by all participants. Schools, districts, and the province were aware of how their indicators, such as the PTR, PCR, condition of classrooms, and exam results, compared to other schools as well as the average scores of the district and province.
Planning The planning cycle and budget applications were based on school-level EMIS data that was transparent to all participants. However, the process of the calculation of budget allocations by the MOE was less clear. Most participants were aware that there were insufficient funds to meet the budget requirements proposed but assumed that the allocations were based on the “size of the school.” In this regard, each participant had access to the budget allocations of all other equivalent institutions, and there did not appear to be any discontent at the various allocations. (as was found in Nampula as well).

Task Order 11: Gap Analysis: Education Information and 105 Education Policy and Planning in Mozambique
Budget allocations The provincial administrators had more insight into the rationale behind budget allocations in terms of FASE and ADE allocations. Ordinary school budget allocations were based on previous years’ allocations, and the provincial finance director was attempting to investigate a formula for allocating the ordinary schools’ budget based on number of students and school facilities available, such as electricity and water. In terms of the FASE school building budget allocation, the provincial directorates were aware that the budget allocation included the combined factors of classroom need with ability to spend in the allocation of classrooms. They were aware that the allocation of ADE was based on an equal per-pupil formula, the size of which depended on the amount of money available. Neither the district office nor the schools appeared to be aware that a per-pupil allocation was the basis of the ADE funding.
Monitoring educational quality The province and district administrations engaged each year in a well-established process of school performance monitoring. Each term, district-wide meetings were held with schools to review their end-of-term test results and to discuss areas where problems were identified. A similar process took place with district pedagogical officers reporting to the provincial pedagogical section. On the basis of this, the ZIP, district, and provincial pedagogical officers developed a plan to assist schools to improve. The extent to which these initiatives to improve school performance were actually implemented was monitored both by pedagogical officers visiting schools and reports to future district or provincial meetings.
Access and completion Enrollment: The majority of data used by the provincial office on enrollment is gathered through the March 3 EMIS form. These forms are collected, captured, and checked by the district office. Data are then passed up to the provincial office, where they are compiled and sent to the national Ministry. The provincial office has a “planning brigade” that visits schools to check the consistency of data.
Population and projections: While none of the schools, districts, or provinces refer specifically to Census-collected population data, schools estimate their enrollment for the following year based on their current learner numbers, growth from previous years, and a discussion with local community leaders as to any expected changes in the school-age population.
Student attendance: Student attendance records are tracked daily in “class books” kept by teachers; these are forwarded to the school director, who monitors them and is required to evaluate them in the termly district meetings that monitor school quality.
School dropout: Both Matola Secondary School and Matola C Primary School used the school enrollment data to monitor children leaving the school during the year.
Construction of indicators: PTR, PCR, pass rates, and to some extent completion rates were calculated and widely used by all levels of provincial government and schools. All levels were aware of the provincial and district averages and could compare their

106 Task Order 11: Gap Analysis: Education Information and Education Policy and Planning in Mozambique
schools to the provincial average. During the budget and pedagogical evaluation processes, this information was compiled by provincial and district administrators and circulated by way of reports to all schools.
Budgets and budget planning The planning cycle in the Province of Maputo starts shortly after the March 3 EMIS data has been collected, captured (at the district office), and is checked by the district office. Schools compile their expected learner numbers for the next school year. These are constructed as a combination of the enrollment from the current school year and discussions with community leaders as to whether they expect the number of new entrants to increase for any particular reason.
On the basis of estimated enrollment, schools submit their requests for teachers, classrooms, and general funding requirements to the district office, where they are compiled into the district budget.
District budgets are then discussed at a provincial budget meeting, and the province compiles the provincial budgets, which are submitted to both the MOE and the MOF.
The national MOE then allocates • the provincial budget ceilings in coordination with the national Ministry of
Planning, • the ADE budget for each school, • the number of new educators that each province may allocate, and • the number of new classrooms that the province may build (this is based on a
combination of need and ability in previous years to build classrooms).
The provincial administration then allocates • the general budget for each school, • the new educators for schools, • the number of classrooms to be built by each district, and • the ADE budget for each school.
Funding formula While none of the provincial, district, or school personnel were aware of any specific formula used by the national MOE to allocate budgets, they all agreed that the budget allocation requests put forward by schools, districts, and provinces were based on need—determined by the extent to which a school may be over the district, provincial, or national average—especially PTR and class size. It was readily agreed that some schools had large classrooms and that it was acceptable to have a maximum of 75 students per class. However, there were not enough desks to accommodate all students, and those without desks sat on the floor.
At all levels of the system, it was accepted that there were insufficient funds to cover all needs and that when budgets were allocated, they were done so fairly by the MOE on the “basis of school size.”
Task Order 11: Gap Analysis: Education Information and 107 Education Policy and Planning in Mozambique
Expenditure reporting Expenditure reports are compiled and reviewed quarterly. These reports are available by economic classification—salaries and remuneration, other staff expenditures, goods, services, transfers, and capital goods—and sub-classification. They are also available by program level of education and economic classification, including a separate account for the hiring of new staff. Since the number of new staff to be hired are authorized by the national MOE, this sub-program is directly monitored. While expenditure is reported by economic classification and sources of funds, including internal funding sources, external funding sources, FASE, and other sources of cash and goods, no specific sub-programs that receive FASE budget allocations directly from the MOE are reported in the provincial expenditure reports.
Teachers Two databases on educators exist. Systaff is managed by the DOF and is used exclusively to pay salaries of educators. Data on educators is forwarded to the provincial office and loaded onto Systaff.
The second database is maintained by the districts, is relatively new, and has recently been populated with educator data. It is an Excel platform and contains data for teachers on personal information, qualifications, teaching level, tax identification number, salary, district, school, leave, and in-service training. The database notes the name of the school each teacher is associated with, but this information is not tracked according to the EMIS number of the school. The database is used to track teachers as they are transferred from one school to another.
These district databases are sent to the provincial HR and updated each year before the budget process.
Full reports of qualifications, the school level at which teachers teach, salary, district, and the school teachers teach in are printed at the provincial level and forwarded to both the provincial administration and the MOE during budget discussions.
Student teacher ratios: these are readily available as explained above.
Teacher attendance and absenteeism: this is available as explained above and used in termly analysis of student/school performance.
Teaching load/hours: these are monitored at the school level in terms of shifts allocated to teachers.
Participation in professional development: this information appeared to be kept by schools, used when allocating staff to any in-service training, and discussed in school performance meetings. While there is a field available for in-service training received, it was not clear whether the districts captured this information.
Classroom observation data on classroom practice: this was discussed in termly school performance meetings and by pedagogical teams visiting schools. However, it did not appear to be systematically recorded or kept for time-series analysis of school performance.
108 Task Order 11: Gap Analysis: Education Information and Education Policy and Planning in Mozambique
Infrastructure Infrastructure planning appeared to focus primarily on need for additional classrooms. Characteristics of existing facilities and concerns such as sanitation facilities, furniture, and other infrastructure needs did not appear to be an issue of focus, perhaps because there tends to be insufficient budget for both classroom construction and any other needs. District- or province-supported repairs or maintenance were only considered in the process of school rehabilitation.
Province and district offices were aware of disparities in PCR across their jurisdictions. The province reported an average district PCR of 50–55, noting that the lowest PCR district was at 22:1, while the urban area of Matola was at greater than 60:1. They pointed out that equitable distribution is difficult in a district covering both urban and rural areas because some rural schools only produce small numbers of pupils.
Furniture and equipment are only taken into consideration when a new school is constructed or when a whole-school rehabilitation is carried out. Requests for furniture purchase or replacements are not considered in the budget process. Schools are left to their own devices to purchase or repair furniture, and because of this many schools go without classroom furniture. Matola Secondary has a workshop, funded from school fees, where furniture was mended; they did not appear to think that school fees could ever stretch to purchase furniture. However, a program was under way to rehabilitate the school computer center for which school funds were being used. In Matola C Primary school, there was no furniture available for pupils.
Information on distance to school per se is not systematically collected by district or provincial offices, but population density does seem to be a major factor in decisions on site selection for new schools. When classrooms for a new school are allocated to a district, the district works with local communities to receive a plot of land for the school. Locations are based on surrounding population density.
Use of facilities: enrollments by shift are systematically reported in the EMIS March 3 forms.
Materials Textbooks are provided to primary schools directly by the MOE. These arrive on time for the new school year but are often in short supply. Requests for more books have always been met within one month.
Secondary schools are not provided with textbooks. Students either provide their own or use textbooks that have been bought with school fees and reside on site in the library—no books may be taken out of the library. Rough estimates of available textbooks in the library are about 15 to 20 per subject per grade (for all students—recall there were 9,000 in Matola Secondary School). No estimate was available of how many children had purchased their own books.
Task Order 11: Gap Analysis: Education Information and 109 Education Policy and Planning in Mozambique
Examination results Examination results appear to be the primary measure of quality of education used at all levels of management. Examination results used to measure outcomes include both end-of-term and end-of-year scores. Results are compiled and analyzed in a bottom-up fashion that follows the hierarchy of the school management system: at the end of every term, teachers compile exam results and meet to discuss results with their pedagogical directors at the school. Pedagogical directors discuss their outcomes with their ZIP pedagogical directors, and ZIP pedagogical directors with their district pedagogical directors, and so on. At the provincial level, school quality controls seem more concerned with outcomes measured through major end-of-year examinations at grade 5 and grade 7.
Each term, district-wide meetings were held with schools to review their end-of-term test results and to discuss areas where problems were identified. A similar process took place with district pedagogical officers reporting to the provincial pedagogical section. On the basis of this, the ZIP, district, and provincial pedagogical officers developed a plan to assist schools to improve. School meetings are also held on a termly basis to apprise parents of school performance.
The provincial pedagogical office compiles and tracks term and annual school results, using them as a tool for identifying high- and low-performing schools. Members of the pedagogical team will travel to the school and meet with school representatives to discuss the challenges and successes faced by particular schools and will often work with low-performing schools to help identify solutions to the problems they are facing. They provide a combination of surveillance and pedagogical support to the schools. The pedagogical office also provides ongoing seminars and professional development programs through ZIPs.
Only the examination results of grade 10 and 12 are actually published. Comparisons made with other secondary schools and are available for public scrutiny, although they are only posted on the school notice boards. (Sources in the national MOE comment that grade 10 and 12 results receive press attention, but this was not followed up with the province or district).
No longitudinal analysis of examination results or tracking of school performance over time is performed.
Decentralization Budget, flow of funds, and expenditure reporting flows are not entirely parallel upwards and downwards.
Budget requirements flow from schools, to districts, to provinces, to the MOE.
Budget allocations flow from the MOE to the provincial authority, to the provincial MOE, and then the district MOE and schools.
It was not entirely clear if the MOE district administrative staff report on expenditure to the provincial education finance department (and not to the district authority) or if they report to both. Regardless, it appears that the provincial MOE is primarily
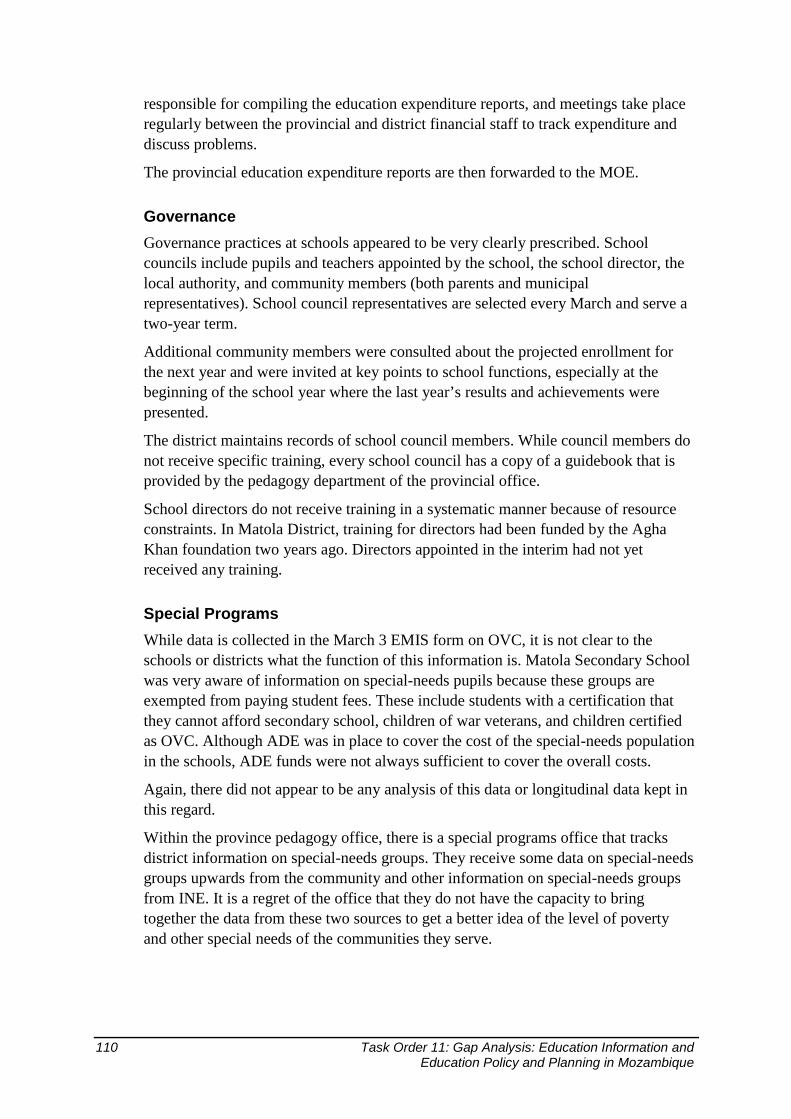
110 Task Order 11: Gap Analysis: Education Information and Education Policy and Planning in Mozambique
responsible for compiling the education expenditure reports, and meetings take place regularly between the provincial and district financial staff to track expenditure and discuss problems.
The provincial education expenditure reports are then forwarded to the MOE.
Governance Governance practices at schools appeared to be very clearly prescribed. School councils include pupils and teachers appointed by the school, the school director, the local authority, and community members (both parents and municipal representatives). School council representatives are selected every March and serve a two-year term.
Additional community members were consulted about the projected enrollment for the next year and were invited at key points to school functions, especially at the beginning of the school year where the last year’s results and achievements were presented.
The district maintains records of school council members. While council members do not receive specific training, every school council has a copy of a guidebook that is provided by the pedagogy department of the provincial office.
School directors do not receive training in a systematic manner because of resource constraints. In Matola District, training for directors had been funded by the Agha Khan foundation two years ago. Directors appointed in the interim had not yet received any training.
Special Programs While data is collected in the March 3 EMIS form on OVC, it is not clear to the schools or districts what the function of this information is. Matola Secondary School was very aware of information on special-needs pupils because these groups are exempted from paying student fees. These include students with a certification that they cannot afford secondary school, children of war veterans, and children certified as OVC. Although ADE was in place to cover the cost of the special-needs population in the schools, ADE funds were not always sufficient to cover the overall costs.
Again, there did not appear to be any analysis of this data or longitudinal data kept in this regard.
Within the province pedagogy office, there is a special programs office that tracks district information on special-needs groups. They receive some data on special-needs groups upwards from the community and other information on special-needs groups from INE. It is a regret of the office that they do not have the capacity to bring together the data from these two sources to get a better idea of the level of poverty and other special needs of the communities they serve.
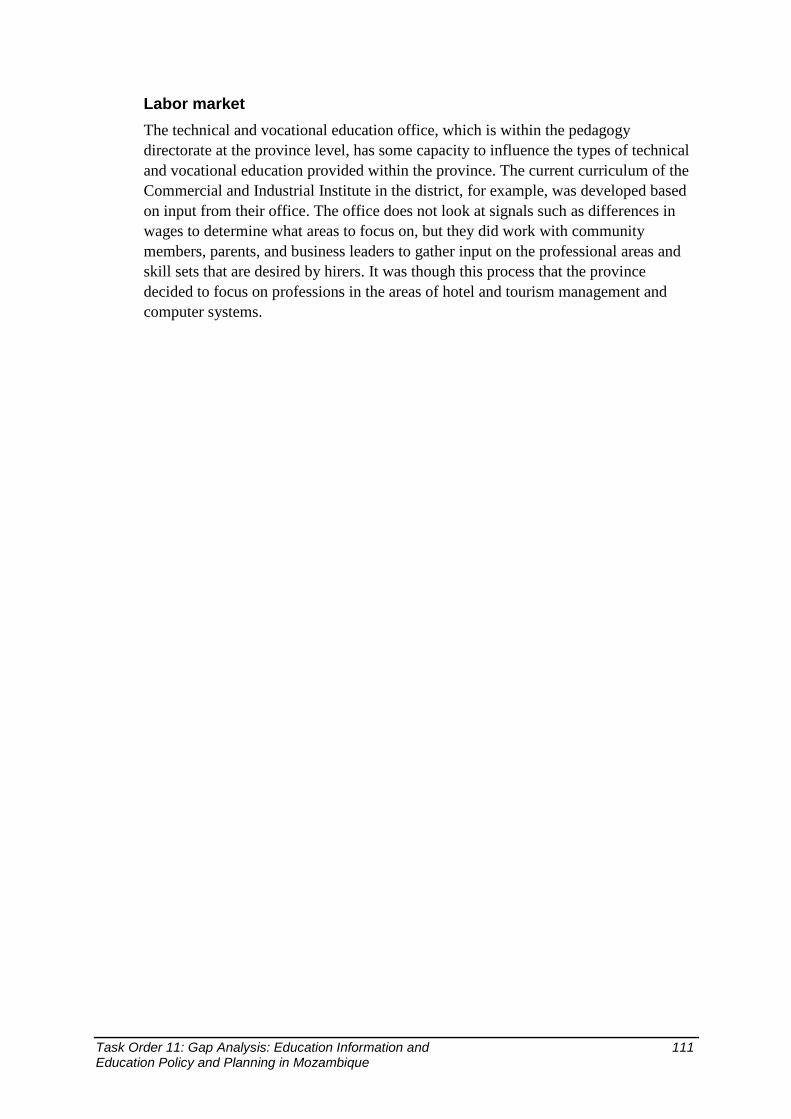
Task Order 11: Gap Analysis: Education Information and 111 Education Policy and Planning in Mozambique
Labor market The technical and vocational education office, which is within the pedagogy directorate at the province level, has some capacity to influence the types of technical and vocational education provided within the province. The current curriculum of the Commercial and Industrial Institute in the district, for example, was developed based on input from their office. The office does not look at signals such as differences in wages to determine what areas to focus on, but they did work with community members, parents, and business leaders to gather input on the professional areas and skill sets that are desired by hirers. It was though this process that the province decided to focus on professions in the areas of hotel and tourism management and computer systems.

112 Task Order 11: Gap Analysis: Education Information and Education Policy and Planning in Mozambique
Appendix 3: Discussion of grade 1 over-enrollment issue
This appendix contains an illustration of over-enrollment rate in grade 1 and under-reported repetition rates in primary education, especially grade 1. All of the absolute numbers presented here are in the unit of thousands for simplification of presentation and readability. The data presented here are of Mozambique, with UN population and MINED EMIS data of 2000–2010; therefore, all information reflects the historical progress of enrollment expansion in Mozambique itself—none of the data refer to any other country. In addition to data from the EMIS and the population projections, which could skew the results if the population data are unreliable, we also present data from the MICS 2008, which has the virtue of having enrollment data and population data from the same source.
Step 1 Let us look at primary school-age population data (rounding to thousands). Comparing enrollment to population data is very instructive. We have kept the data in thousands to make the argument easier to follow.
Table 9. Population of school age, Mozambique (1,000s) Age 2000 2001 2002 2003 2004 2005 2006 2007 2008 2009 2010
6 533 549 566 583 600 617 634 651 668 684 701
7 513 530 546 562 579 595 611 628 644 660 677
8 497 512 528 543 559 574 590 605 621 636 652
9 482 497 511 526 540 555 569 584 598 613 628
10 469 483 496 510 524 537 551 565 578 592 606
11 457 470 483 496 509 521 534 547 560 573 586
12 445 457 470 482 494 507 519 531 544 556 568
Data source and methodology: UN medium variant population projections with Beers-based disaggregation by age and interpolation.
The same data can be shown graphically.
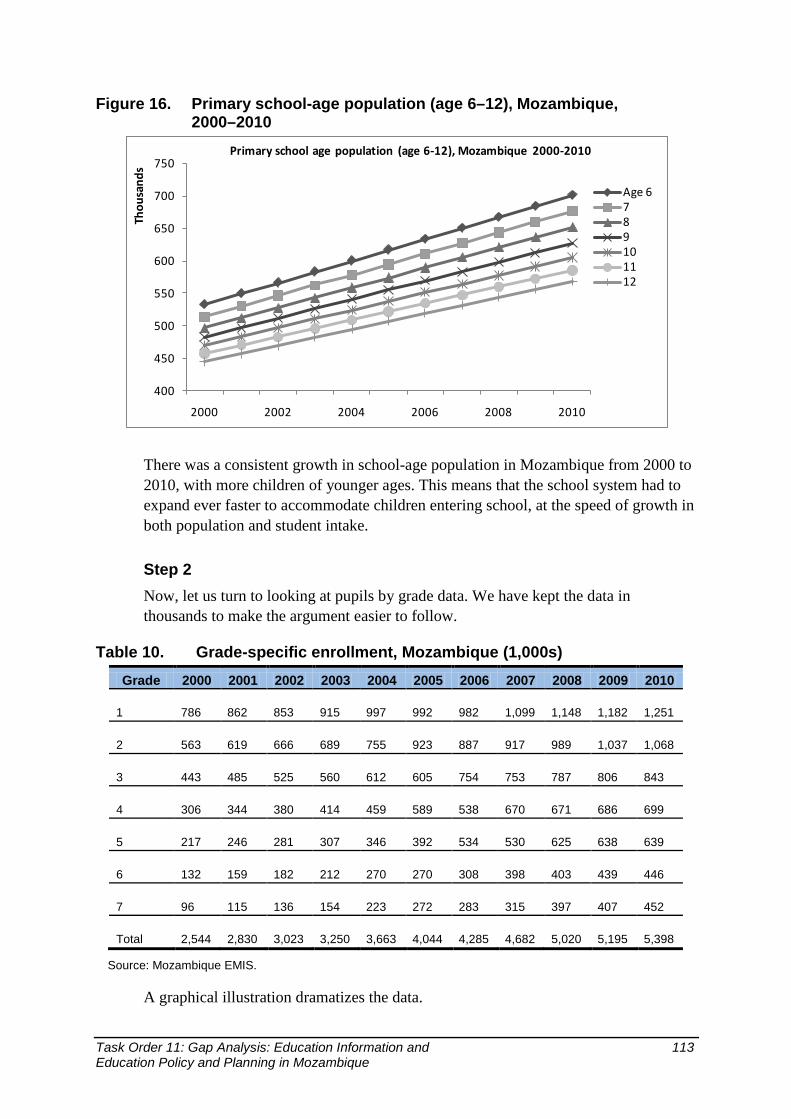
Task Order 11: Gap Analysis: Education Information and 113 Education Policy and Planning in Mozambique
Figure 16. Primary school-age population (age 6–12), Mozambique, 2000–2010
There was a consistent growth in school-age population in Mozambique from 2000 to 2010, with more children of younger ages. This means that the school system had to expand ever faster to accommodate children entering school, at the speed of growth in both population and student intake.
Step 2 Now, let us turn to looking at pupils by grade data. We have kept the data in thousands to make the argument easier to follow.
Table 10. Grade-specific enrollment, Mozambique (1,000s) Grade 2000 2001 2002 2003 2004 2005 2006 2007 2008 2009 2010
1 786 862 853 915 997 992 982 1,099 1,148 1,182 1,251
2 563 619 666 689 755 923 887 917 989 1,037 1,068
3 443 485 525 560 612 605 754 753 787 806 843
4 306 344 380 414 459 589 538 670 671 686 699
5 217 246 281 307 346 392 534 530 625 638 639
6 132 159 182 212 270 270 308 398 403 439 446
7 96 115 136 154 223 272 283 315 397 407 452
Total 2,544 2,830 3,023 3,250 3,663 4,044 4,285 4,682 5,020 5,195 5,398
Source: Mozambique EMIS.
A graphical illustration dramatizes the data.
400
450
500
550
600
650
700
750
2000 2002 2004 2006 2008 2010
Primary school age population (age 6-12), Mozambique 2000-2010
Age 6789101112
Thou
sand
s

114 Task Order 11: Gap Analysis: Education Information and Education Policy and Planning in Mozambique
Figure 17. Primary pupil enrollment by grade and total, Mozambique, 2000–2010
As can be seen in the graph above, the total number of primary school children has been growing, but the distribution of students across grades is very wide, with a large cohort in grade 1 and a much smaller cohort in grade 7, consistently. We see that the absolute number of both population and student enrollment has been growing, fairly drastically in the last decade, but we need to look at student enrollment in relation to population to have a clearer understanding on the huge intake and enrollment of early grades in primary school. This is shown below, and the comparison is dramatic.
Figure 18. Primary enrollment by grade vs. population of appropriate age, Mozambique, 2010
As it turns out, there are far more children in the early primary grades than there are in the appropriately-aged population for each grade. This can be explained by the enrollment of over- and under-age children, but can only be sustained if this enrollment results from repetition because, as will be explained further in the
0
1
2
3
4
5
6
0
200
400
600
800
1000
1200
1400
2000 2001 2002 2003 2004 2005 2006 2007 2008 2009 2010
Mill
ions
Primary pupil enrollment by grade and total, Mozambique 2000-2010
Grade 1 2 3 4 5 6 7
Thou
sand
s
0 200 400 600 800 1000 1200 1400
Grade 1
2
3
4
5
6
7
Primary enrollment by grade vs. official school age population
Enrollment
Population

Task Order 11: Gap Analysis: Education Information and 115 Education Policy and Planning in Mozambique
following sections, if one starts by pulling from an old or existing stock of older children, as the system catches up and reaches out to previously unserved areas, the system would run out of previously unenrolled older children very soon, in only a few years—at most four or five in the case of Mozambique.
Step 3 We now look at the gross intake into grade 1 in Mozambique in 2000–2010. It is the non-repeating primary school enrollment in grade 1 divided by the official school-age population for grade 1.
Table 11. Gross intake rate into grade 1, Mozambique
2000 2001 2002 2003 2004 2005 2006 2007 2008 2009 2010
Grade 1 111% 118% 111% 120% 130% 148% 149% 163% 166% 167% 172%
Figure 19. Primary grade 1 intake rate, Mozambique, 2000–2010
The Mozambique education system has been expanding consistently for at least two decades since the end of the war in 1992. In fact, the EMIS data of the 1990s show a consistent growth in pupil enrollment. Here, we have the gross intake rate of primary grade 1, which is the ratio of non-repeating students enrolled in grade 1 to the official school-entrance-age population. As shown in the graph above, Mozambique started a little above 100% in 2000, so taking as many school entering-age population as there are to enter the school system, but it continued to rise for another ten years until it reached 172% in 2010. This is impossible to maintain for a long time because the system would simply run out of children. This would be true if the system was “catching up,” but it may only take a few years to reach out and intake all of the out-of-school children who are school age. So if the country has already expanded the education system for several years until it achieves 100% intake rate, what could really be happening to have the intake rate continue to rise consistently and remain
0%
20%
40%
60%
80%
100%
120%
140%
160%
180%
200%
2000 2001 2002 2003 2004 2005 2006 2007 2008 2009 2010
Primary grade 1 intake rate, Mozambique 2000-2010

116 Task Order 11: Gap Analysis: Education Information and Education Policy and Planning in Mozambique
very high for several more years? Could it be the over-age children entering or returning to the school system? Or is it explained by the under-age children entering school at an early age? Let us look at the population and out-of-school children data more closely to find out.
Step 4 Now, we look at how many children would have newly entered the school system from 2005 to 2009 in just five years, if the intake rates above truly resulted in new enrollment. So, with the given estimated intake rate (most likely over-estimated) on the basis of repetition rates (under-estimated), the following extra students (that is, above 100% of those enrolled as a proportion of the school-entrance age) are enrolled as new enrollees in grade 1, each year:
We pick 2005 as the start of this hypothetical process somewhat arbitrarily: sufficiently before the present to prove our point.
Table 12. Grade 1 extra students beyond 100%, Mozambique (1,000s)
2005 2006 2007 2008 2009
New enrollees per year beyond population of appropriate age, i.e., catch-up enrollees 294 308 410 443 457
Cumulative by 2009
1,913
Calculated as (grade 1 intake rate—100%)* official school-entrance-age population (age 6)
So in the five years from 2005 to 2009, there were 1,913 extra students beyond the official school-entrance-age population that appear to have entered the school system as new students. But is that possible? That is, how many might even have been available to enroll in 2005 or so?
Step 5 Now, let us look at the out-of-school population (in thousands) at the start of this process. This is done by subtracting the totals enrolled in school for a given age, at any grade, in 2004, from the population of that age. We do it only up to age 12, on the assumption that the likelihood to enroll in primary school past age 12 is minute (this assumption is defended below.) To control for the fact that some of these out-of-school children may have been enrolled and dropped out of the school system at some point, the dropout rate was applied to total enrollment of the previous year and subtracted from the total un-enrolled out-of-school population, since those who dropped out are not susceptible to enrollment as new students in grade 1. The dropout rate for primary school in 2004 was around 9%, based on EMIS data. If we account for that, then there would have been only around 1,273 total un-enrolled primary school-age population, minus 9% of total primary enrollment, which turns out to be around 943 (in thousands) un-enrolled, non-dropout primary-school-age population available in Mozambique to newly enter into the school system.

Task Order 11: Gap Analysis: Education Information and 117 Education Policy and Planning in Mozambique
Table 13. Total un-enrolled susceptible to enrollment, Mozambique, 2004 (1,000s)
Age Enrolled Population Un-enrolled
6 236 583 347
7 386 562 177
8 400 543 143
9 369 526 157
10 387 510 123
11 328 496 168
12 322 482 159
Total un-enrolled (out-of-school population) 1,273
But the number 1,273 (in thousands) has to be discounted, as the children it represents are not all never-enrolled. Some of the out-of-school children are in fact dropouts from a previous grade rather than never-enrolled (and hence susceptible to being new enrollees in grade 1); we make the assumption that 10% are dropouts from a previous grade so the 1,273 (in thousands) has to be reduced by 10% times the enrollment the previous year (2003), which yields 944 (in thousands). The choice of age 12 as limiting the range of ages susceptible to new enrollment in grade 1 is defended via the fact that even as early as 2003, very few children over age 12 enroll in grade 1. The table below shows, for example, that in 2003, the likelihood of 12-year-old children enrolling in grade 1 is, in fact, very low, at only 3% and diminishes quickly thereafter. So one can safely discard population older than 12 as being in the pool to be enrolled.
Table 14. Likelihood of enrollment in grade 1, by age, Mozambique, 2003
Age Enrollment in grade 1, 2003
Population 2003
Likelihood to enroll in grade 1, 2003
6 and less 229 583 39%
7 294 562 52%
8 184 543 34%
9 99 526 19%
10 58 510 11%
11 26 496 5%
12 13 482 3%
It turns out that a total of 1,913 extra entrants to grade 1 (in thousands) is far more than the maximum out-of-school population of 944 (in thousands) susceptible to over-

118 Task Order 11: Gap Analysis: Education Information and Education Policy and Planning in Mozambique
age enrollment in 2004. In fact, the proposed intake rate was more than enough to "take up" almost twice as much as the non-enrolled population that existed in 2004!
Note that only age 6 and older out-of-school population is considered here, even though of course there may be enrollment of younger-age children. This is because we are reasoning in cohort terms—once a group of children enter into the school system, they either flow through the system with some or no repetition or drop out of the system—and one can only be new to the system once (technically). The point is that once someone is enrolled, they cannot be new to the system again, which leaves only truly never-enrolled under-age, on-time, and over-age children eligible to newly enter the school system. Therefore, if the school system is taking more than available and existing on-time and over-age school-age population into the school system, the only explanation would be under-age enrollment and under-reported repetition rate.
So, what is really happening in the primary grade 1 enrollment rate?
Now that we have figured that there are more new entrants into the Mozambican education system than population could possibly allow, let us rationalize consistently the growing intake rate above 100% of the last decade. Here are a few hypothetical but proven reasons from other countries that have experienced similar expansion of school access, which are presumably applicable to Mozambique.
1. Children are entering school at an earlier age than the official school age as a way of child care, but are counted as a new pupil in grade 1 every year until they officially register in grade 1 to progress through the system in consecutive years.
2. Repetition is under-counted, for the very reason cited above, and those early starters or young children “sitting in” in classes and repeating grade 1 multiple years are not being counted as repeaters in the school system. In addition, repeaters are often and generally under-reported in the school survey.
3. In Mozambique, population projections were about 6% lower than the actual Census 2007 results, which would have boosted up any population denominator-driven indicators, such as intake and enrollment rates, to higher than actual values.
Step 6 Let us turn to repetition rate to see what we find in data.
Table 15. Repetition rates in Mozambique as implied by EMIS repeater reports
Grade 2000 2001 2002 2003 2004 2005 2006 2007 2008 2009 2010
1
27% 26% 25% 24% 8% 4% 4% 3% 4% 4%
2
26% 25% 24% 23% 17% 8% 9% 8% 10% 11%
3
26% 25% 24% 24% 7% 5% 4% 5% 5% 5%
4
22% 22% 21% 21% 17% 4% 5% 4% 5% 5%
5
20% 21% 19% 19% 16% 9% 13% 13% 15% 15%
Task Order 11: Gap Analysis: Education Information and 119 Education Policy and Planning in Mozambique
Grade 2000 2001 2002 2003 2004 2005 2006 2007 2008 2009 2010
6
24% 24% 20% 24% 3% 2% 2% 2% 3% 4%
7
30% 28% 24% 34% 12% 11% 11% 11% 13% 16%
Source: calculated from EMIS data, taking repeaters as a percentage of enrollees the year before.
A graphical look illustrates the trends very clearly.
Figure 20. Primary school repetition rates by grade, Mozambique, 2001–2010
Note the consistently high repetition rates for all primary grades in 2001–2004. From 2005, repetition rates dropped dramatically for all grades, but especially for grades 1, 3, 4, and 6 where students are automatically promoted to the next grade without any pass/fail system. So it could be that formally reported repetition has dropped, but that there is a great deal of informal repetition, in which case repeaters are reported as new since they cannot be reported as real repeaters. As explained earlier on, this unrealistically high grade 1 intake rate, counting many unofficial young children sitting in schools, would boost the gross enrollment rate for other primary grades if the same is happening in upper grades with unofficial repeaters. But as we saw in the unsustainable high intake rate, as one soon runs out of non-enrolled children to intake, the only conclusion one can draw is that there is a very high informal repetition rate.
Step 7 It is interesting to look also at the implications for the dropout rate. If the repetition rate is under-reported, then the dropout rate will tend to be over-reported. Using the standard methodology, the rates below are the dropout rates that can be calculated from the enrollment and repetition rate data.
0%
5%
10%
15%
20%
25%
30%
35%
40%
2001 2002 2003 2004 2005 2006 2007 2008 2009 2010
Primary school repetition rates by grade, Mozambique 2001-2010
Grade 1 2 3 4 5 6 7

120 Task Order 11: Gap Analysis: Education Information and Education Policy and Planning in Mozambique
Table 16. Dropout rates from the enrollment numbers and repetition rates Grade 2000 2001 2002 2003 2004 2005 2006 2007 2008 2009 2010
1
13% 15% 13% 11% 13% 14% 11% 14% 15% 15%
2
8% 10% 11% 7% 8% 13% 10% 10% 12% 12%
3
12% 12% 12% 10% 9% 10% 10% 10% 12% 12%
4
11% 12% 12% 10% 10% 12% 10% 12% 14% 16%
5
21% 20% 19% 9% 8% 13% 13% 13% 17% 17%
6
11% 11% 13%
6% 5% 6% 6% 9% 8%
Calculated using classical methodology based on enrollment and repetition rates in two grades in sequential years.
Figure 21. Primary school dropout rates by grade, Mozambique, 2001–2010
Unlike the very low repetition rates in grade 1 below 5%, dropout rates in grade 1 are relatively higher than other early primary grades’ rates, which probably indicates another source or error—under-reported repetition rate with repeaters misclassified as dropouts. In fact, this seems likely, as the dropout rates that are calculated based on the repetition rates result in a total cumulative dropout of 10%–15% per grade and cumulative from grade 1 to grade 6, that is itself inconsistent with the fact that by 2010, the ratio of total enrollment in grade 6 to appropriate-age population was above 70% (see Step 2). This seems unlikely with the high dropout rates the (probably under-reported) repeater data imply.
0%
5%
10%
15%
20%
25%
2001 2002 2003 2004 2005 2006 2007 2008 2009 2010
Primary school dropout rates by grade, Mozambique 2000-2010
Grade 1 2 3 4 5 6
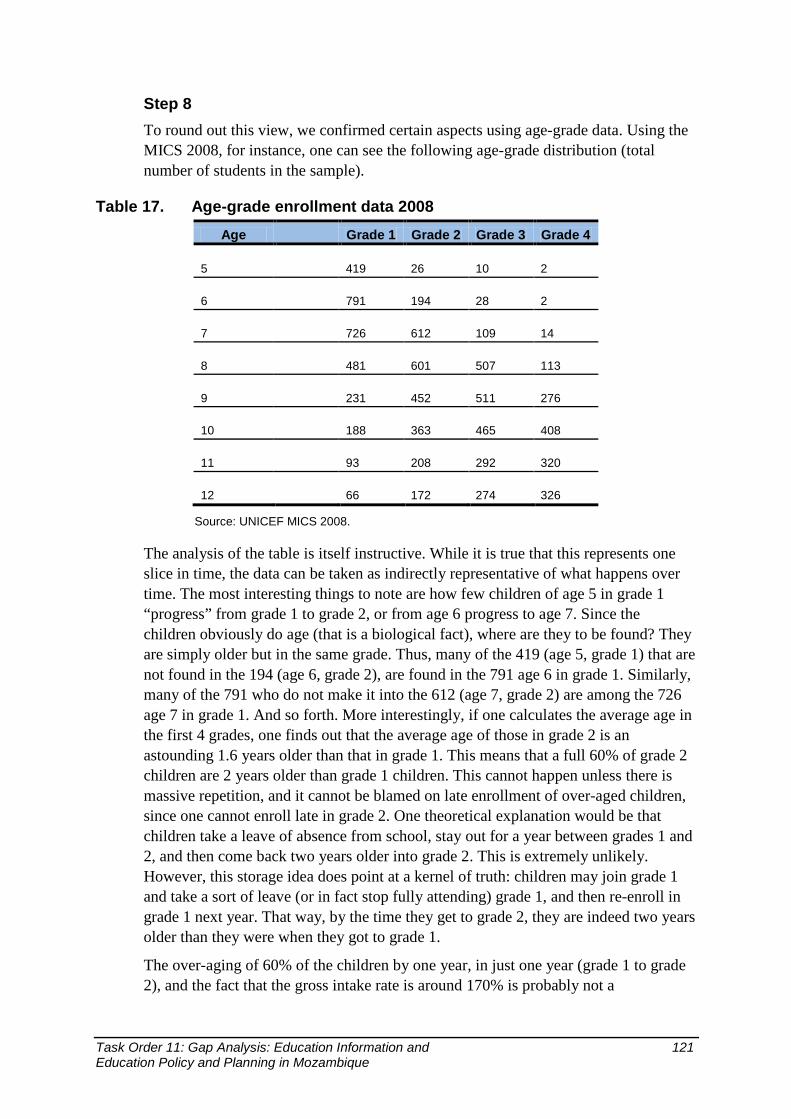
Task Order 11: Gap Analysis: Education Information and 121 Education Policy and Planning in Mozambique
Step 8 To round out this view, we confirmed certain aspects using age-grade data. Using the MICS 2008, for instance, one can see the following age-grade distribution (total number of students in the sample).
Table 17. Age-grade enrollment data 2008 Age
Grade 1 Grade 2 Grade 3 Grade 4
5
419 26 10 2
6
791 194 28 2
7
726 612 109 14
8
481 601 507 113
9
231 452 511 276
10
188 363 465 408
11
93 208 292 320
12
66 172 274 326
Source: UNICEF MICS 2008.
The analysis of the table is itself instructive. While it is true that this represents one slice in time, the data can be taken as indirectly representative of what happens over time. The most interesting things to note are how few children of age 5 in grade 1 “progress” from grade 1 to grade 2, or from age 6 progress to age 7. Since the children obviously do age (that is a biological fact), where are they to be found? They are simply older but in the same grade. Thus, many of the 419 (age 5, grade 1) that are not found in the 194 (age 6, grade 2), are found in the 791 age 6 in grade 1. Similarly, many of the 791 who do not make it into the 612 (age 7, grade 2) are among the 726 age 7 in grade 1. And so forth. More interestingly, if one calculates the average age in the first 4 grades, one finds out that the average age of those in grade 2 is an astounding 1.6 years older than that in grade 1. This means that a full 60% of grade 2 children are 2 years older than grade 1 children. This cannot happen unless there is massive repetition, and it cannot be blamed on late enrollment of over-aged children, since one cannot enroll late in grade 2. One theoretical explanation would be that children take a leave of absence from school, stay out for a year between grades 1 and 2, and then come back two years older into grade 2. This is extremely unlikely. However, this storage idea does point at a kernel of truth: children may join grade 1 and take a sort of leave (or in fact stop fully attending) grade 1, and then re-enroll in grade 1 next year. That way, by the time they get to grade 2, they are indeed two years older than they were when they got to grade 1.
The over-aging of 60% of the children by one year, in just one year (grade 1 to grade 2), and the fact that the gross intake rate is around 170% is probably not a

122 Task Order 11: Gap Analysis: Education Information and Education Policy and Planning in Mozambique
coincidence: both probably refer to an informal repetition that is much greater than officially reported.
It may be thought that the problem is falsely attributed to repetition when perhaps the issue arises from the tendency of parents, in survey responses, to attribute ages 5, 10, 15, etc., to their children, by rounding out their ages. This could produce a bias. However, a regression analysis of the age data in MICS 2008 reveals at most a 5% over-reporting of age 5.
So, what does it all mean? 1. The under-age enrollment is presumably very high in Mozambique, with
many of them potentially sitting in and repeating the first grade multiple years. This is most likely due to poor instruction in the early grades and/or poor school preparedness. In some sense Mozambique is already paying for ECD, by over-enrolling massively in grade 1. But it does so in a pedagogically unsound way, by making children informally repeat grade 1.
2. The consistently rising intake rates should not be perceived only as an expansion of school access with new entrants, but with many repeaters and unofficial enrollees.
3. The high intake rates above 100% or even 150% do not necessarily mean that all out-of-school children are being reached.
4. When the actual demography of student enrollment (under-age, over-age, repeaters, dropouts, returners) is better identified and understood, policy implications and decisions may be different.

Task Order 11: Gap Analysis: Education Information and 123 Education Policy and Planning in Mozambique
Appendix 4: EMIS year-start form

124 Task Order 11: Gap Analysis: Education Information and Education Policy and Planning in Mozambique
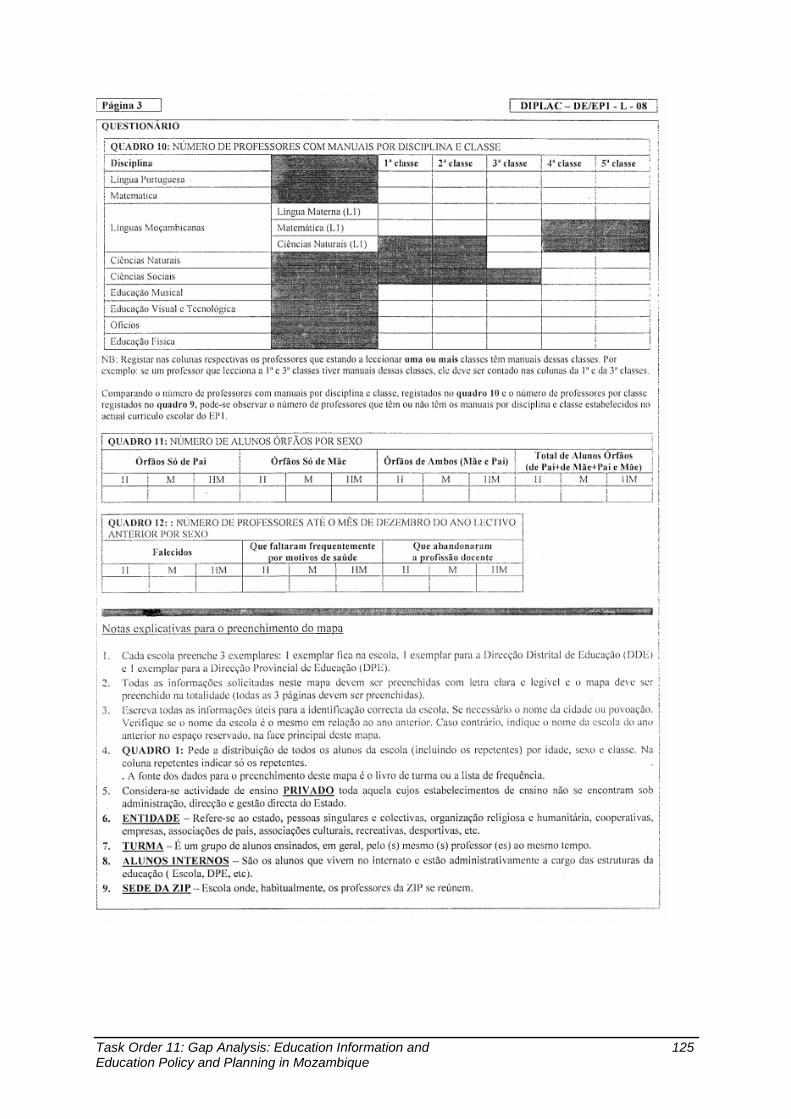
Task Order 11: Gap Analysis: Education Information and 125 Education Policy and Planning in Mozambique
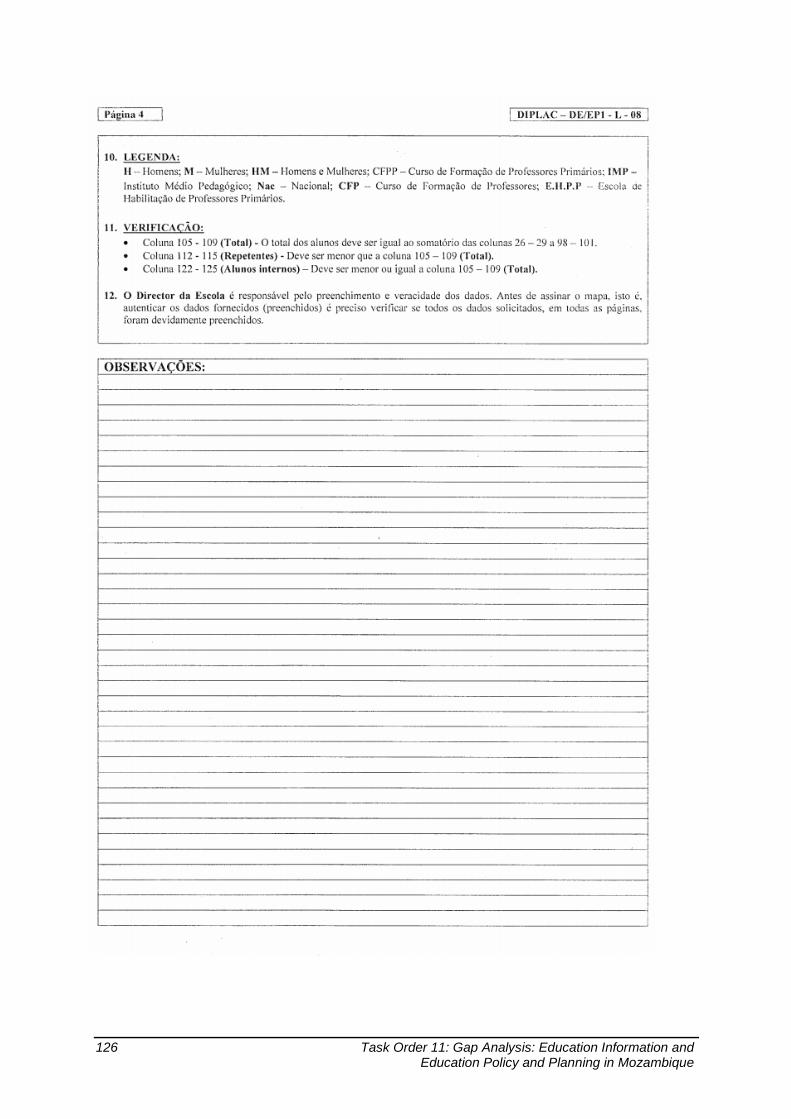
126 Task Order 11: Gap Analysis: Education Information and Education Policy and Planning in Mozambique
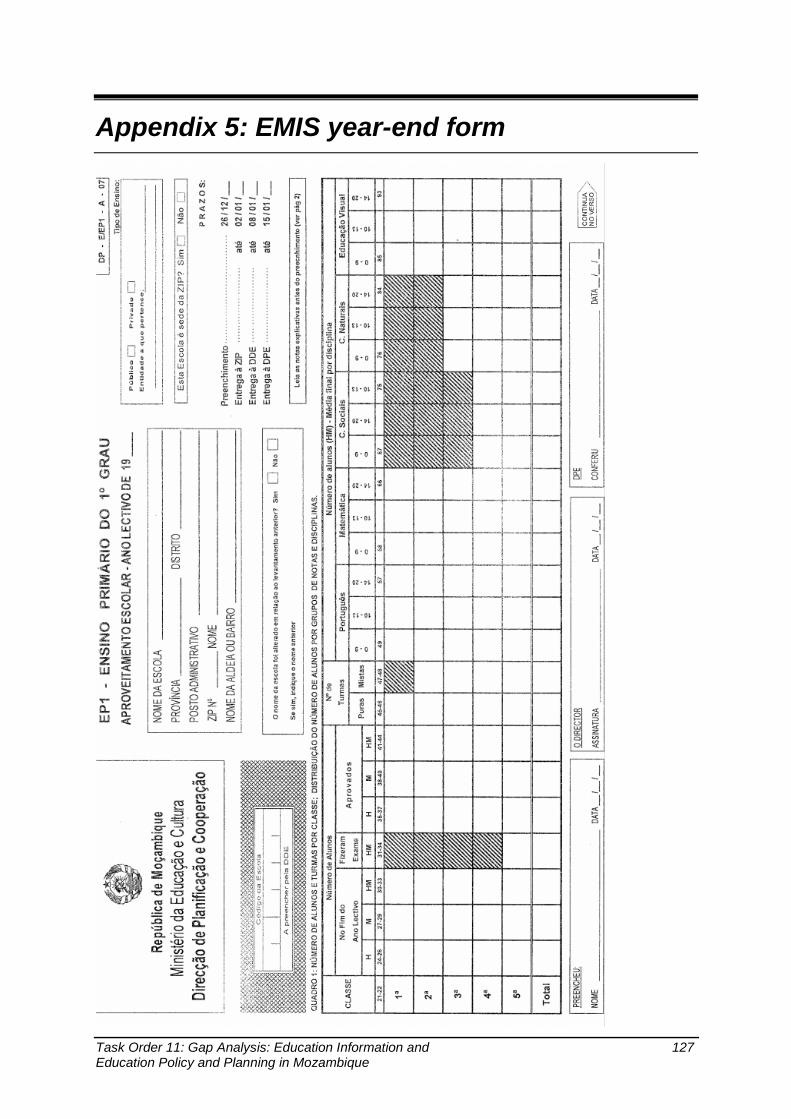
Task Order 11: Gap Analysis: Education Information and 127 Education Policy and Planning in Mozambique
Appendix 5: EMIS year-end form
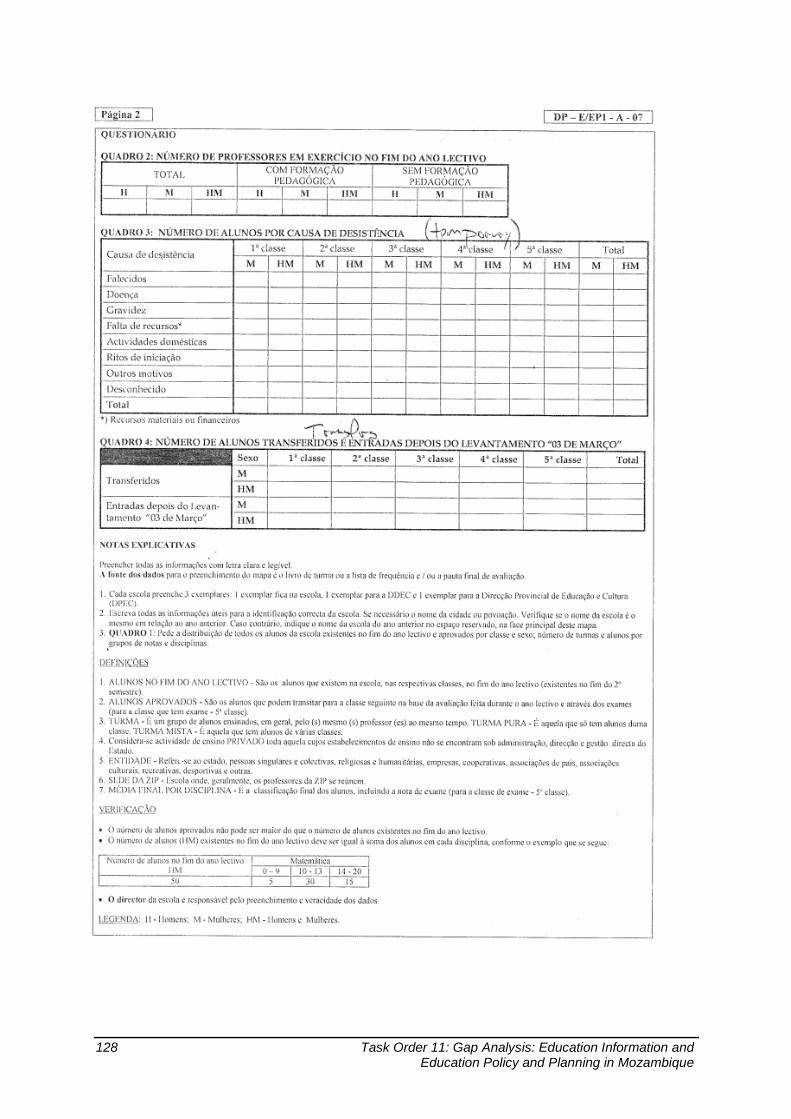
128 Task Order 11: Gap Analysis: Education Information and Education Policy and Planning in Mozambique
Task Order 11: Gap Analysis: Education Information and 129 Education Policy and Planning in Mozambique
Appendix 6. Examples of teacher and teaching observation instruments
These examples may go to an extreme, but they point toward the kinds of observation (and hence the kind of lessons) that can produce learning outcome increases in children. These are geared toward the early-grade reading.
These are samples only; there is no recommendation implied that these are appropriate for Mozambique.
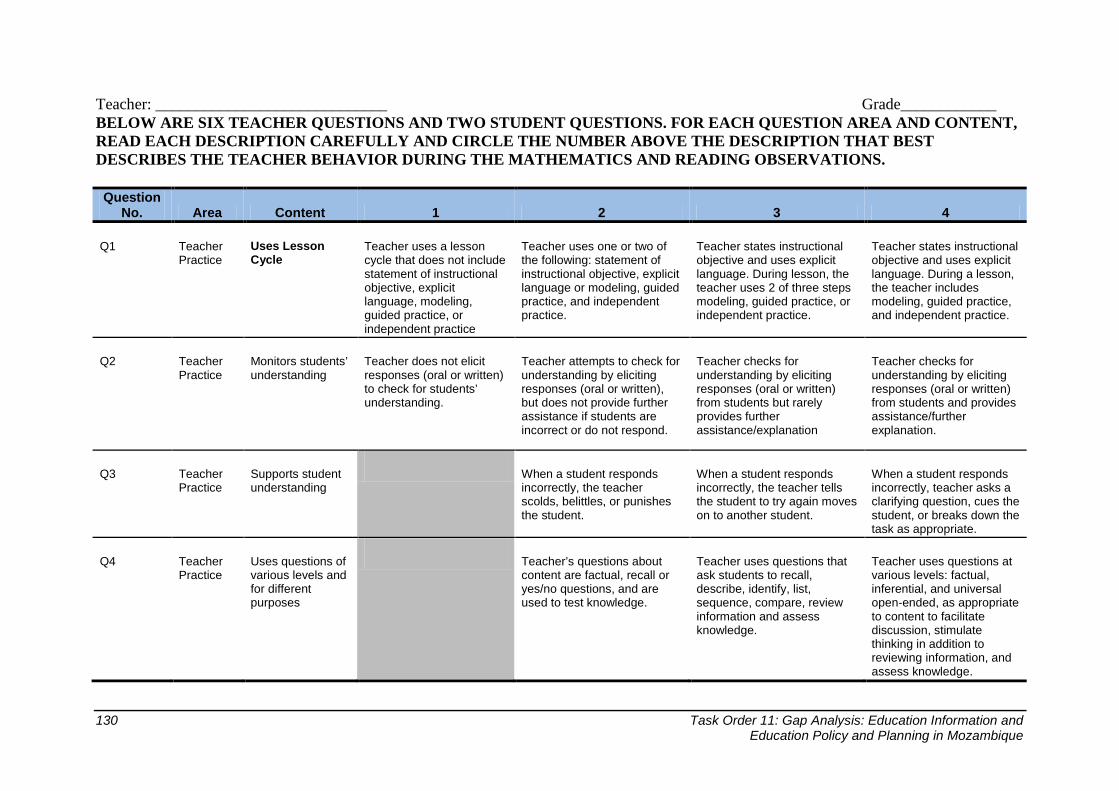
130 Task Order 11: Gap Analysis: Education Information and Education Policy and Planning in Mozambique
Teacher: _____________________________ Grade____________ BELOW ARE SIX TEACHER QUESTIONS AND TWO STUDENT QUESTIONS. FOR EACH QUESTION AREA AND CONTENT, READ EACH DESCRIPTION CAREFULLY AND CIRCLE THE NUMBER ABOVE THE DESCRIPTION THAT BEST DESCRIBES THE TEACHER BEHAVIOR DURING THE MATHEMATICS AND READING OBSERVATIONS.
Question No. Area Content 1 2 3 4
Q1 Teacher Practice
Uses Lesson Cycle
Teacher uses a lesson cycle that does not include statement of instructional objective, explicit language, modeling, guided practice, or independent practice
Teacher uses one or two of the following: statement of instructional objective, explicit language or modeling, guided practice, and independent practice.
Teacher states instructional objective and uses explicit language. During lesson, the teacher uses 2 of three steps modeling, guided practice, or independent practice.
Teacher states instructional objective and uses explicit language. During a lesson, the teacher includes modeling, guided practice, and independent practice.
Q2 Teacher Practice
Monitors students’ understanding
Teacher does not elicit responses (oral or written) to check for students’ understanding.
Teacher attempts to check for understanding by eliciting responses (oral or written), but does not provide further assistance if students are incorrect or do not respond.
Teacher checks for understanding by eliciting responses (oral or written) from students but rarely provides further assistance/explanation
Teacher checks for understanding by eliciting responses (oral or written) from students and provides assistance/further explanation.
Q3 Teacher Practice
Supports student understanding
When a student responds incorrectly, the teacher scolds, belittles, or punishes the student.
When a student responds incorrectly, the teacher tells the student to try again moves on to another student.
When a student responds incorrectly, teacher asks a clarifying question, cues the student, or breaks down the task as appropriate.
Q4 Teacher Practice
Uses questions of various levels and for different purposes
Teacher’s questions about content are factual, recall or yes/no questions, and are used to test knowledge.
Teacher uses questions that ask students to recall, describe, identify, list, sequence, compare, review information and assess knowledge.
Teacher uses questions at various levels: factual, inferential, and universal open-ended, as appropriate to content to facilitate discussion, stimulate thinking in addition to reviewing information, and assess knowledge.

Task Order 11: Gap Analysis: Education Information and 131 Education Policy and Planning in Mozambique
Question No. Area Content 1 2 3 4
1 2 3 4
Q5 Teacher Practice
Maintains student engagement
Teacher unaware of students’ level of engagement. Teacher continues instruction even when students are engaged in other activities.
Teacher is aware of students’ level of engagement and interrupts instruction to call students by name if they are not engaged.
Teacher is aware of students’ level of engagement and redirects inattentive students without interrupting instruction by moving close to them, making eye contact, or other similar actions.
Teacher uses a variety of techniques for maintaining student engagement such as “all student responses“ or “think-pair-share.” Teacher is aware of students’ level of engagement and redirects inattentive students without interrupting instruction.
Q6 Teacher Practice
Classroom Management
There is no evidence of classroom rules or expectations.
Teacher response to inappropriate behavior is punitive.
Rules and expectations are displayed but the teacher does not apply them consistently.
Rules and expectations are displayed and the teacher applies a consistent and positive approach for classroom management throughout the lesson.
Q7 Student Participation Students participate when called on but do not volunteer.
Students participate when called on and some students volunteer.
Students participate actively (including showing a willingness to ask and answer questions, make guesses.)
Q8 Student Discussion Students do not engage in discussions.
Student engagement in discussions is limited to responding to questions when called on.
Students’ engagement in discussion is limited to some students initiating topics, posing and responding to questions.
Students state their opinions and defend them. Students use appropriate interaction patterns to agree or disagree.
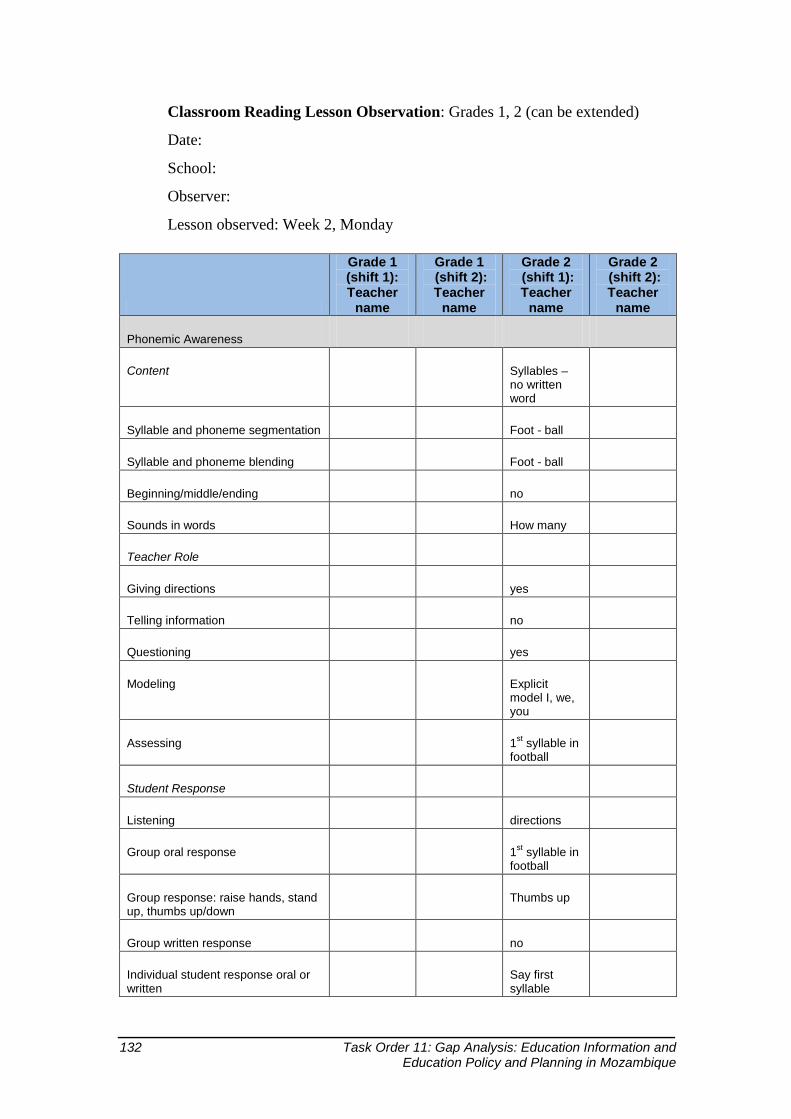
132 Task Order 11: Gap Analysis: Education Information and Education Policy and Planning in Mozambique
Classroom Reading Lesson Observation: Grades 1, 2 (can be extended)
Date:
School:
Observer:
Lesson observed: Week 2, Monday
Grade 1 (shift 1): Teacher
name
Grade 1 (shift 2): Teacher
name
Grade 2 (shift 1): Teacher
name
Grade 2 (shift 2): Teacher
name
Phonemic Awareness
Content Syllables – no written word
Syllable and phoneme segmentation Foot - ball
Syllable and phoneme blending Foot - ball
Beginning/middle/ending no
Sounds in words How many
Teacher Role
Giving directions yes
Telling information no
Questioning yes
Modeling Explicit model I, we, you
Assessing 1st syllable in football
Student Response
Listening directions
Group oral response 1st syllable in football
Group response: raise hands, stand up, thumbs up/down
Thumbs up
Group written response no
Individual student response oral or written
Say first syllable
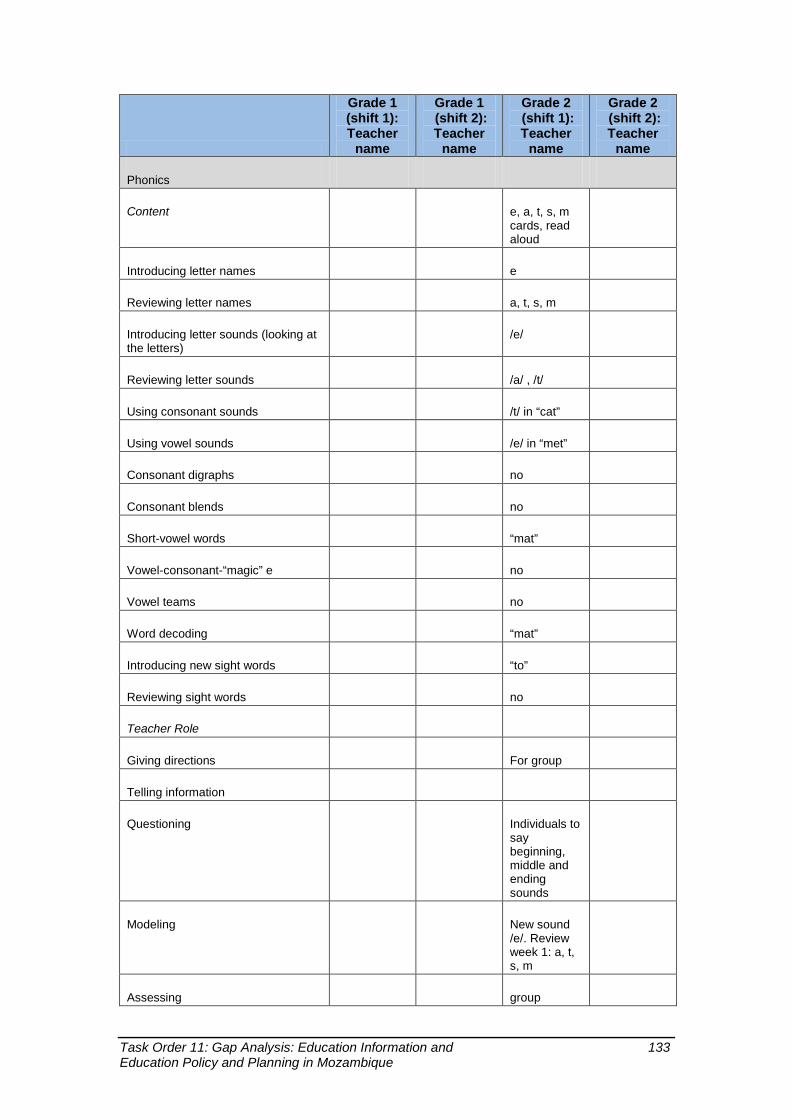
Task Order 11: Gap Analysis: Education Information and 133 Education Policy and Planning in Mozambique
Grade 1 (shift 1): Teacher
name
Grade 1 (shift 2): Teacher
name
Grade 2 (shift 1): Teacher
name
Grade 2 (shift 2): Teacher
name
Phonics
Content e, a, t, s, m cards, read aloud
Introducing letter names e
Reviewing letter names a, t, s, m
Introducing letter sounds (looking at the letters)
/e/
Reviewing letter sounds /a/ , /t/
Using consonant sounds /t/ in “cat”
Using vowel sounds /e/ in “met”
Consonant digraphs no
Consonant blends no
Short-vowel words “mat”
Vowel-consonant-“magic” e no
Vowel teams no
Word decoding “mat”
Introducing new sight words “to”
Reviewing sight words no
Teacher Role
Giving directions For group
Telling information
Questioning Individuals to say beginning, middle and ending sounds
Modeling New sound /e/. Review week 1: a, t, s, m
Assessing group

134 Task Order 11: Gap Analysis: Education Information and Education Policy and Planning in Mozambique
Grade 1 (shift 1): Teacher
name
Grade 1 (shift 2): Teacher
name
Grade 2 (shift 1): Teacher
name
Grade 2 (shift 2): Teacher
name
Student Response
Listening yes
Reading orally no
Individual oral response Yes: 1st sound, blend and segment
Group oral response no
Individual written response no
Group written response no
Group response: raise hands, stand up, thumbs up/down
Yes. 1st sound of mat is /m/.
Fluency
Content Flashcards, read aloud
Flash cards with letter names A,t,s,m, e
Flash cards with letter sounds A,t,s,m,e
Flash cards with sight words to
Reading orally teacher
Teacher Role
Giving directions yes
Telling information Read aloud
Questioning Yes about letter names and sounds
Modeling Read aloud
Assessing Questioning about how to read with fluency
Student Response
Listening yes

Task Order 11: Gap Analysis: Education Information and 135 Education Policy and Planning in Mozambique
Grade 1 (shift 1): Teacher
name
Grade 1 (shift 2): Teacher
name
Grade 2 (shift 1): Teacher
name
Grade 2 (shift 2): Teacher
name
Reading orally no
Individual oral response flashcard
Group oral response flashcard
Individual written response no
Group written response no
Group response: raise hands, stand up, thumbs up/down
flashcards
Vocabulary/Comprehension
Content Read aloud: Bendu
Learning new definitions Basket, coconut
Providing context for new words yes
Using new words in personal lives
Setting a purpose About Bendu
Prediction Yes. What is story going to be about
Visualization No
Self-monitoring No
Using fix-up strategies No
Self-questioning No
Using prior knowledge No
Summarization No
Personal response No
Story elements What happens?
Expository text structure no
Teacher Role
Giving directions To listen

136 Task Order 11: Gap Analysis: Education Information and Education Policy and Planning in Mozambique
Grade 1 (shift 1): Teacher
name
Grade 1 (shift 2): Teacher
name
Grade 2 (shift 1): Teacher
name
Grade 2 (shift 2): Teacher
name
Telling information Defining words
Questioning prediction
Modeling Why Q
Assessing Comp. Q
Student Response
Listening yes
Individual oral response Hand raised
Every pupil response Group answer to comp Q
Every pupil response, oral oral
Every pupil response, written no
Other comments and observations:
Second week of program. Teacher is using the explicit teaching model. Some students cannot see the front of the room well. No use of pocket chart—need to show teacher how to use it. Teacher should read more fluently and with more expression. Need to practice that.

Task Order 11: Gap Analysis: Education Information and 137 Education Policy and Planning in Mozambique
Appendix 7. List of persons interviewed, contact points
Last name First name Department Title E-mail [REDACTED] Telephone
[REDACTED]
Adelino Constancio Ministry of Education, DIPLAC EMIS Statistician
Adriano Antonio National Statistics Office, Census Associate Director
Agotinho Mariano Teacher Training Institute of Nampula, Pedagogy Studies
Deputy Chief
Alberto Moises Ministry of Planning and Development, National Directorate of Planning
Chief
Aldolfo Jose Provincial Directorate of Education, Human Resources, Nampula Province
Chief
Amani Todd USAID Mission Director
Aruia Matlombe Ministry of Education, School Mapping GIS Questionnaire Developer
Assale João Ministry of Education, Implementation of Sector Strategic Plan
Executive Secretary
Banze Eurico Ministry of Education, Special Program Director
Botas Gilberto Professional Schools Director
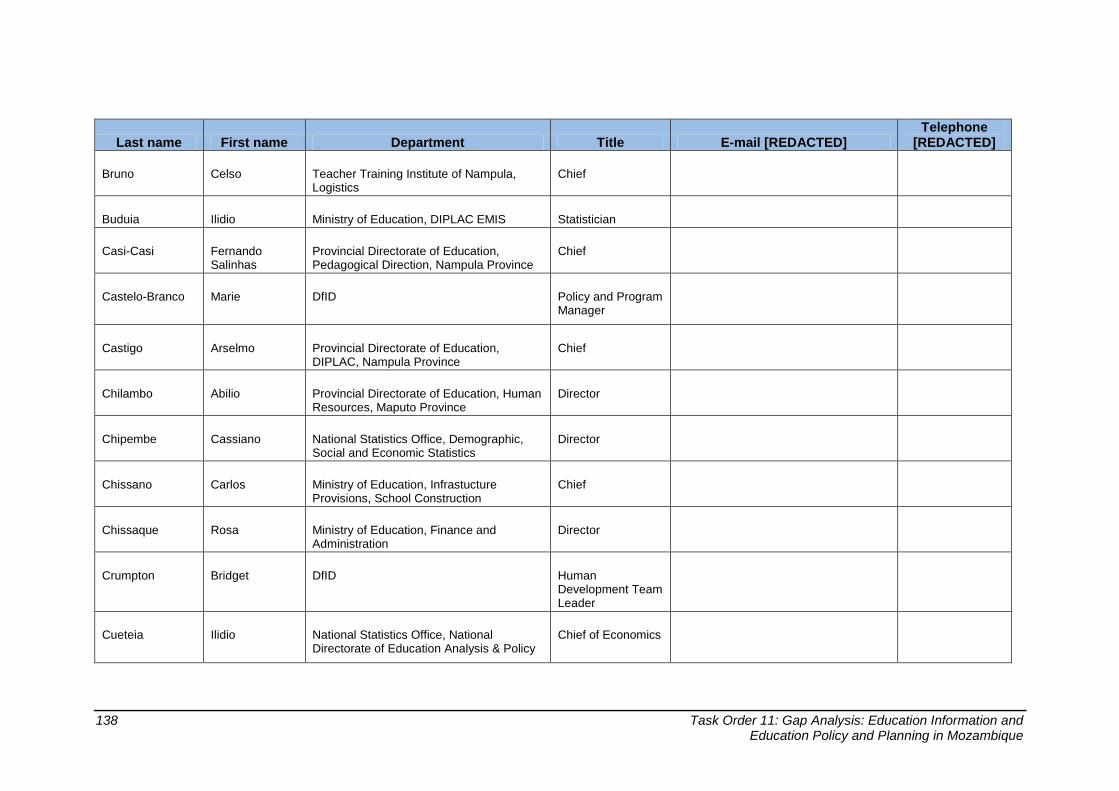
138 Task Order 11: Gap Analysis: Education Information and Education Policy and Planning in Mozambique
Last name First name Department Title E-mail [REDACTED] Telephone
[REDACTED]
Bruno Celso Teacher Training Institute of Nampula, Logistics
Chief
Buduia Ilidio Ministry of Education, DIPLAC EMIS Statistician
Casi-Casi Fernando Salinhas
Provincial Directorate of Education, Pedagogical Direction, Nampula Province
Chief
Castelo-Branco Marie DfID Policy and Program Manager
Castigo Arselmo Provincial Directorate of Education, DIPLAC, Nampula Province
Chief
Chilambo Abilio Provincial Directorate of Education, Human Resources, Maputo Province
Director
Chipembe Cassiano National Statistics Office, Demographic, Social and Economic Statistics
Director
Chissano Carlos Ministry of Education, Infrastucture Provisions, School Construction
Chief
Chissaque Rosa Ministry of Education, Finance and Administration
Director
Crumpton Bridget DfID Human Development Team Leader
Cueteia Ilidio National Statistics Office, National Directorate of Education Analysis & Policy
Chief of Economics

Task Order 11: Gap Analysis: Education Information and 139 Education Policy and Planning in Mozambique
Last name First name Department Title E-mail [REDACTED] Telephone
[REDACTED]
Dava Silvestri Provincial Directorate of Education, Pedagogy, Maputo Province
Director
David Chyumone Ministry of Education, Human Resources, Information
Chief
Dobson Jim USAID (Education) Director
dos Santos Carlos UNICEF Education Specialist
Duate Laura National Statistics Office, Economic and Social Statistics
Chief
Eruegio Remigio Ministry of Education, Textbook Distribution Chief
Fanciso Antonio Mize CIDA Education Specialist
Gabriel Aderito Provincial Directorate of Education, Nampula Province
Director/Chief of Cabinet
Gani Ali Teacher Training Institute of Nampula, Pedagogy Studies
Deputy Chief
Ibein Adelman Ministry of Planning and Development, National Directorate of Planning
TMSA
Jaime Justino District Directorate of Education, Planning and Statistics, Monapo District
Chief
Jaze Alfredo Ministry of Education, Human Resources Database Manager
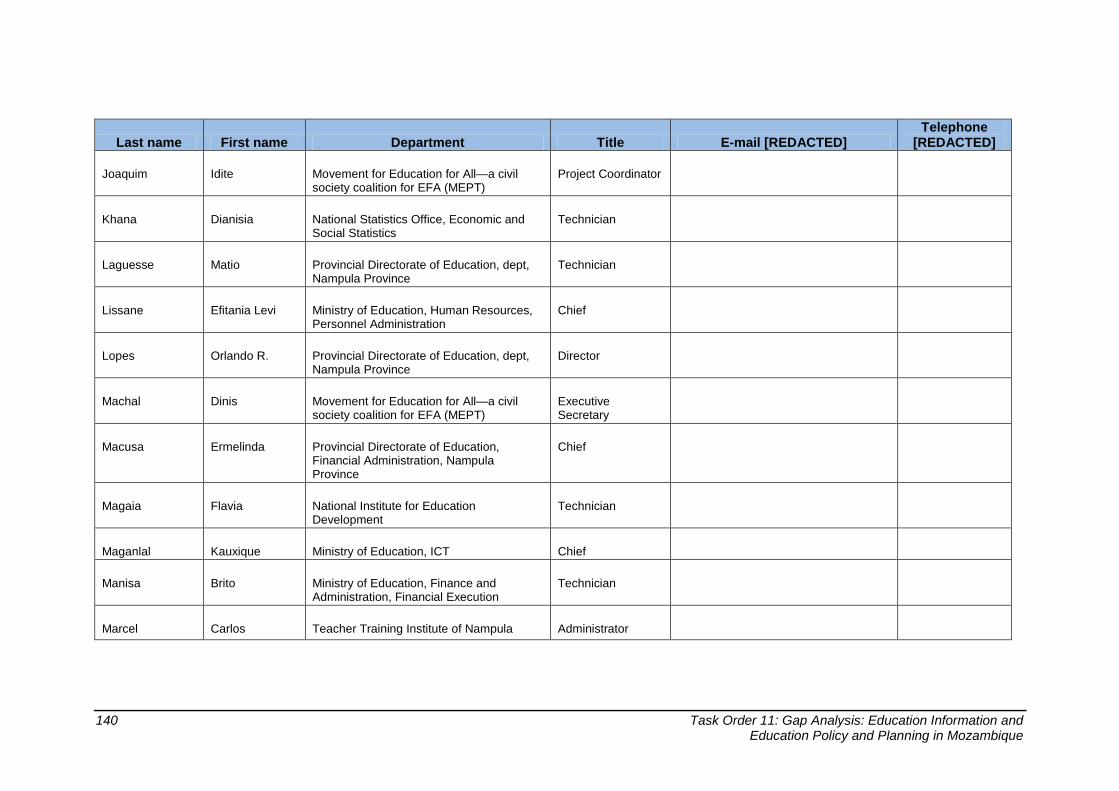
140 Task Order 11: Gap Analysis: Education Information and Education Policy and Planning in Mozambique
Last name First name Department Title E-mail [REDACTED] Telephone
[REDACTED]
Joaquim Idite Movement for Education for All—a civil society coalition for EFA (MEPT)
Project Coordinator
Khana Dianisia National Statistics Office, Economic and Social Statistics
Technician
Laguesse Matio Provincial Directorate of Education, dept, Nampula Province
Technician
Lissane Efitania Levi Ministry of Education, Human Resources, Personnel Administration
Chief
Lopes Orlando R. Provincial Directorate of Education, dept, Nampula Province
Director
Machal Dinis Movement for Education for All—a civil society coalition for EFA (MEPT)
Executive Secretary
Macusa Ermelinda Provincial Directorate of Education, Financial Administration, Nampula Province
Chief
Magaia Flavia National Institute for Education Development
Technician
Maganlal Kauxique Ministry of Education, ICT Chief
Manisa Brito Ministry of Education, Finance and Administration, Financial Execution
Technician
Marcel Carlos Teacher Training Institute of Nampula Administrator
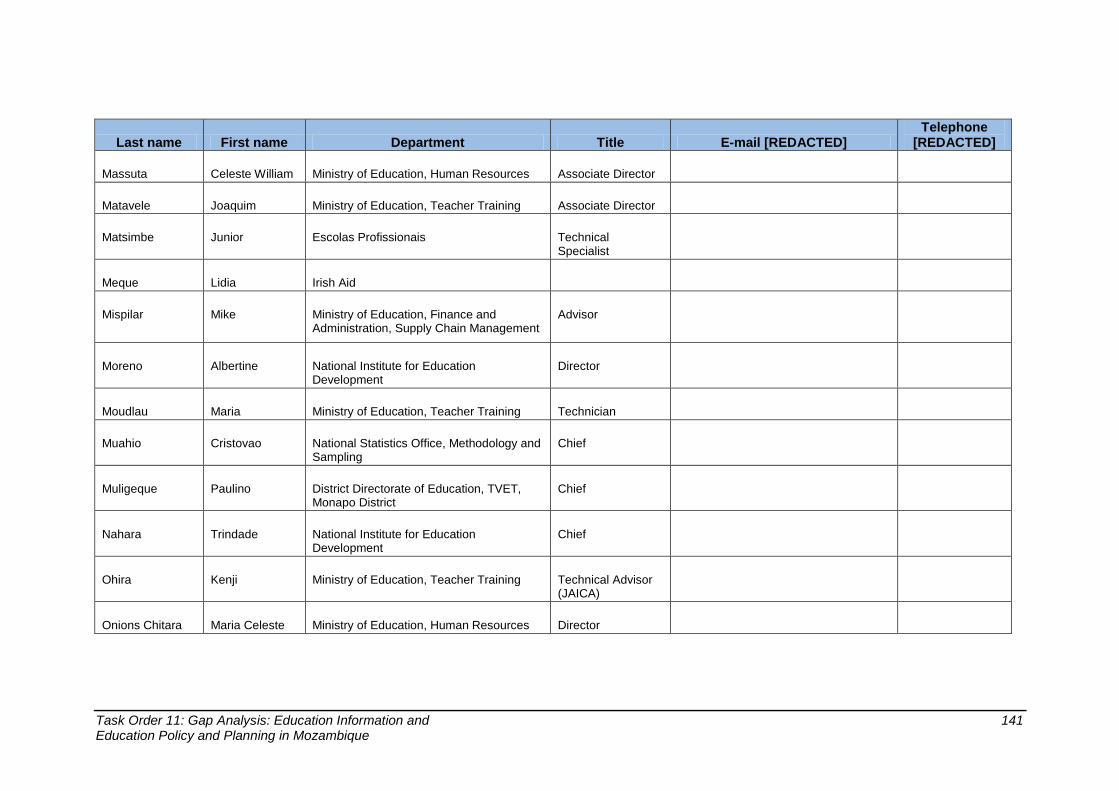
Task Order 11: Gap Analysis: Education Information and 141 Education Policy and Planning in Mozambique
Last name First name Department Title E-mail [REDACTED] Telephone
[REDACTED]
Massuta Celeste William Ministry of Education, Human Resources Associate Director
Matavele Joaquim Ministry of Education, Teacher Training Associate Director
Matsimbe Junior Escolas Profissionais Technical Specialist
Meque Lidia Irish Aid
Mispilar Mike Ministry of Education, Finance and Administration, Supply Chain Management
Advisor
Moreno Albertine National Institute for Education Development
Director
Moudlau Maria Ministry of Education, Teacher Training Technician
Muahio Cristovao National Statistics Office, Methodology and Sampling
Chief
Muligeque Paulino District Directorate of Education, TVET, Monapo District
Chief
Nahara Trindade National Institute for Education Development
Chief
Ohira Kenji Ministry of Education, Teacher Training Technical Advisor (JAICA)
Onions Chitara Maria Celeste Ministry of Education, Human Resources Director

142 Task Order 11: Gap Analysis: Education Information and Education Policy and Planning in Mozambique
Last name First name Department Title E-mail [REDACTED] Telephone
[REDACTED]
Pinto Palmira Ministry of Education, Secondary Education
Associate Director
Quintu Quintu District Directorate of Education, Matola District, Matola Secondary School
Director
Rego Manuel Ministry of Education, DIPLAC Director
Robinson Tess USAID (Education) Education Officer
Rogerio Christina District Directorate of Education, Matola District, Matola C. Primary School
Director
Salles Valeria Development Facilitator (MSS) Consultant (GTZ)
Sembine Ines District Directorate of Education, Matola District
District Director
Shiau Anna Ministry of Education, Finance and Administration, Budgetary Execution
Technician
Sive Reinaldo Jorge Movement for Education for All—a civil society coalition for EFA (MEPT)
Chairperson
Soverano Antiua Ministry of Education, Primary Education Director
Tanane Izda Provincial Directorate of Education, dept, Nampula Province
Technician
Tavaucha Agusto District Directorate of Education, Nampula City
Director

Task Order 11: Gap Analysis: Education Information and 143 Education Policy and Planning in Mozambique
Last name First name Department Title E-mail [REDACTED] Telephone
[REDACTED]
Utui Andre Ministry of Education, Department of Planning
Chief
Vogelaar Jeannette Ministry of Education, DIPLAC Technical Advisor (DANIDA)
William Luis Ministry of Education, Finance and Administration
Procurement Coordinator
Claudio National Statistics Office, National Directorate of Education Analysis & Policy
Director of Economics
Ribeiro Ministry of Education, School Mapping ARCGIS consultant
Simoa Provincial Directorate of Education, Planning, Maputo Province
Director
Zita National Statistics Office, National Directorate of Education Analysis & Policy
Demographics Technical Expert
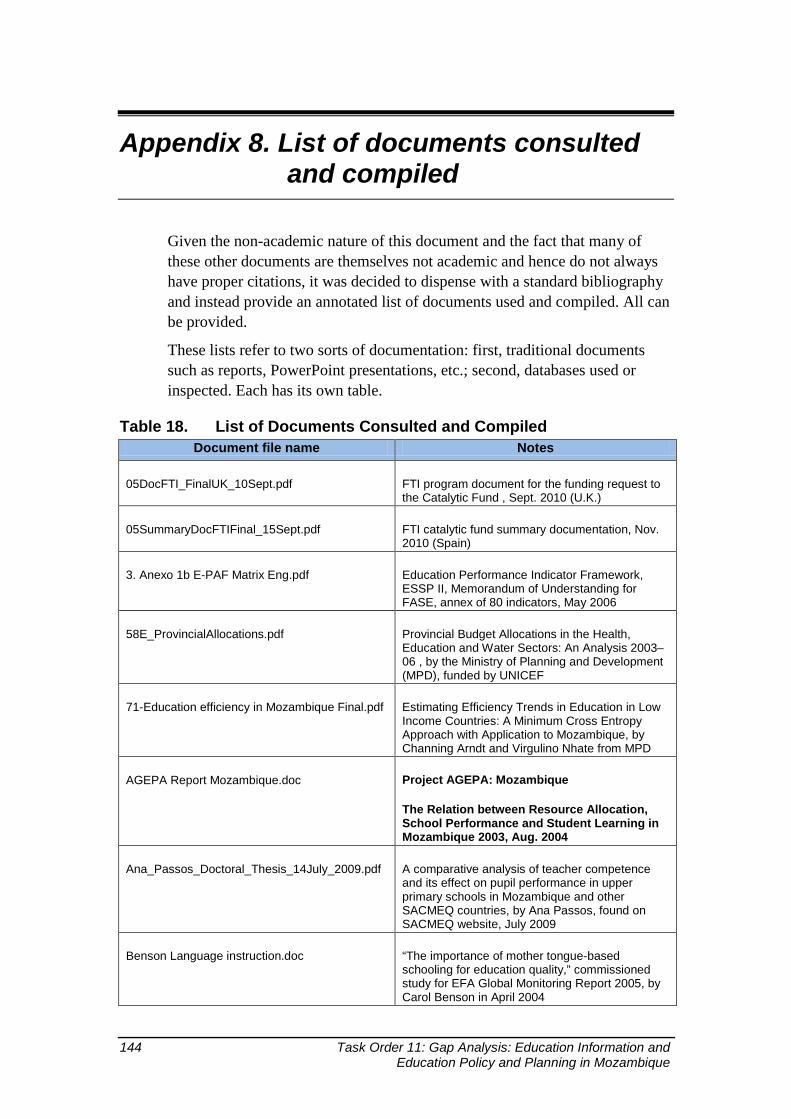
144 Task Order 11: Gap Analysis: Education Information and Education Policy and Planning in Mozambique
Appendix 8. List of documents consulted and compiled
Given the non-academic nature of this document and the fact that many of these other documents are themselves not academic and hence do not always have proper citations, it was decided to dispense with a standard bibliography and instead provide an annotated list of documents used and compiled. All can be provided.
These lists refer to two sorts of documentation: first, traditional documents such as reports, PowerPoint presentations, etc.; second, databases used or inspected. Each has its own table.
Table 18. List of Documents Consulted and Compiled Document file name Notes
05DocFTI_FinalUK_10Sept.pdf FTI program document for the funding request to the Catalytic Fund , Sept. 2010 (U.K.)
05SummaryDocFTIFinal_15Sept.pdf FTI catalytic fund summary documentation, Nov. 2010 (Spain)
3. Anexo 1b E-PAF Matrix Eng.pdf Education Performance Indicator Framework, ESSP II, Memorandum of Understanding for FASE, annex of 80 indicators, May 2006
58E_ProvincialAllocations.pdf Provincial Budget Allocations in the Health, Education and Water Sectors: An Analysis 2003–06 , by the Ministry of Planning and Development (MPD), funded by UNICEF
71-Education efficiency in Mozambique Final.pdf Estimating Efficiency Trends in Education in Low Income Countries: A Minimum Cross Entropy Approach with Application to Mozambique, by Channing Arndt and Virgulino Nhate from MPD
AGEPA Report Mozambique.doc Project AGEPA: Mozambique
The Relation between Resource Allocation, School Performance and Student Learning in Mozambique 2003, Aug. 2004
Ana_Passos_Doctoral_Thesis_14July_2009.pdf A comparative analysis of teacher competence and its effect on pupil performance in upper primary schools in Mozambique and other SACMEQ countries, by Ana Passos, found on SACMEQ website, July 2009
Benson Language instruction.doc “The importance of mother tongue-based schooling for education quality,” commissioned study for EFA Global Monitoring Report 2005, by Carol Benson in April 2004

Task Order 11: Gap Analysis: Education Information and 145 Education Policy and Planning in Mozambique
Document file name Notes
Bilingual ed Moz.pdf Bilingual Education in West Africa: Does It Work? by Matt Havens, 2002
Bilingual Education in Mozambique.doc A study done on Mozambique bilingual education, by IBIS Mozambique, Dec. 2005
Bilingual Education- Mozambique-presentation.pdf
A PowerPoint presentation on history and status of bilingual education, by Eduardo Mondlane University
Childhood Poverty in Mozambique.pdf Childhood Poverty in Mozambique: A situation and trend analysis, by UNICEF, 2006
DHS 2009 HIV AIDS.pdf DHS Survey on HIV/AIDS, 2009
DQAF_MOZAMBIQUE_Draft_0[1].3 Data Quality Assessment Framework (DQAF) Report: Analysis of qualitative aspects of the education statistical system in Mozambique, a UIS study, 2009 or 2010
Education Policy Costing Model Draft V1A 15 Sept 10.xls
Financial costing model used by FTI and MOE (Developer: Philip Cole)
EE Cultura_versão jan.pdf Evaluation of MOE ESSP II 2006–2011 by MOE and an org, funded by FASE, Jan. 2011
Elma ECD-Literacy Boost Mozambique Endline Report_Final.pdf
“Endline report of early literacy among pre-school and primary school in Elma-supported schools, Gaza Province, Mozambique,” Save the Children program evaluation written in April 2010
ESTRATEGIA__SEscolar_ 30March DMC Teo.doc
School health strategy and HIV/AIDS, by MOE’s Special Program Directorate
Estrategia_II-Alfa-VersaoFinal-24[1].11.2010.doc Education strategic plan 2010–2015 on literacy and adult education, by MOE, Nov. 2010
Estudo Específico Desenvolvimento do Curriculo do ensino Primário_versão revista2.pdf
Evaluation of strategic plan ESSP 2006–2010 on curriculum reform in primary education, by MOE and an org, Dec. 2010
Estudo Específico Formação Professores_Versão Revista2.pdf
Study of strategic plan ESSP 2006–2010 on reform of teacher training in primary education, by MOE and an org, Dec. 2010
IndicadoresEduc2004-10_V1[1].pdf An indicator book on primary and secondary education with key data for provinces and districts, by MOE, Aug. 2010
INE_PEEE_08_12.doc A short version of ESSP 2008–2012, by MOE
Inquerito Indicadores Multiplos MICS 2008.pdf MICS study in Portuguese, by INE and MICS
Local Govt. & Fiscal Descentralisation in Moz.ppt A PowerPoint on history and status of decentralization on governance and budget, by MPD
MDG Mozambique Report 2010.pdf Evaluation of MDG on-target status of Mozambique, 2010
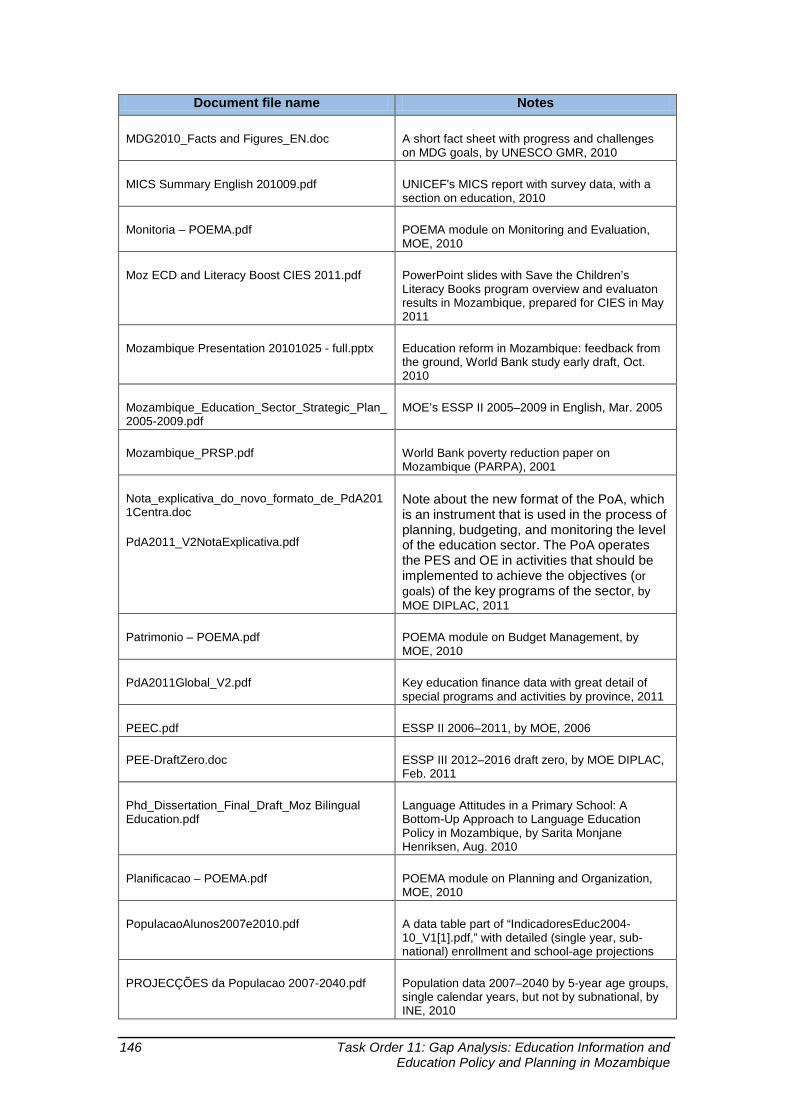
146 Task Order 11: Gap Analysis: Education Information and Education Policy and Planning in Mozambique
Document file name Notes
MDG2010_Facts and Figures_EN.doc A short fact sheet with progress and challenges on MDG goals, by UNESCO GMR, 2010
MICS Summary English 201009.pdf UNICEF's MICS report with survey data, with a section on education, 2010
Monitoria – POEMA.pdf POEMA module on Monitoring and Evaluation, MOE, 2010
Moz ECD and Literacy Boost CIES 2011.pdf PowerPoint slides with Save the Children’s Literacy Books program overview and evaluaton results in Mozambique, prepared for CIES in May 2011
Mozambique Presentation 20101025 - full.pptx Education reform in Mozambique: feedback from the ground, World Bank study early draft, Oct. 2010
Mozambique_Education_Sector_Strategic_Plan_2005-2009.pdf
MOE’s ESSP II 2005–2009 in English, Mar. 2005
Mozambique_PRSP.pdf World Bank poverty reduction paper on Mozambique (PARPA), 2001
Nota_explicativa_do_novo_formato_de_PdA2011Centra.doc
PdA2011_V2NotaExplicativa.pdf
Note about the new format of the PoA, which is an instrument that is used in the process of planning, budgeting, and monitoring the level of the education sector. The PoA operates the PES and OE in activities that should be implemented to achieve the objectives (or goals) of the key programs of the sector, by MOE DIPLAC, 2011
Patrimonio – POEMA.pdf POEMA module on Budget Management, by MOE, 2010
PdA2011Global_V2.pdf Key education finance data with great detail of special programs and activities by province, 2011
PEEC.pdf ESSP II 2006–2011, by MOE, 2006
PEE-DraftZero.doc ESSP III 2012–2016 draft zero, by MOE DIPLAC, Feb. 2011
Phd_Dissertation_Final_Draft_Moz Bilingual Education.pdf
Language Attitudes in a Primary School: A Bottom-Up Approach to Language Education Policy in Mozambique, by Sarita Monjane Henriksen, Aug. 2010
Planificacao – POEMA.pdf POEMA module on Planning and Organization, MOE, 2010
PopulacaoAlunos2007e2010.pdf A data table part of “IndicadoresEduc2004-10_V1[1].pdf,” with detailed (single year, sub-national) enrollment and school-age projections
PROJECÇÕES da Populacao 2007-2040.pdf Population data 2007–2040 by 5-year age groups, single calendar years, but not by subnational, by INE, 2010
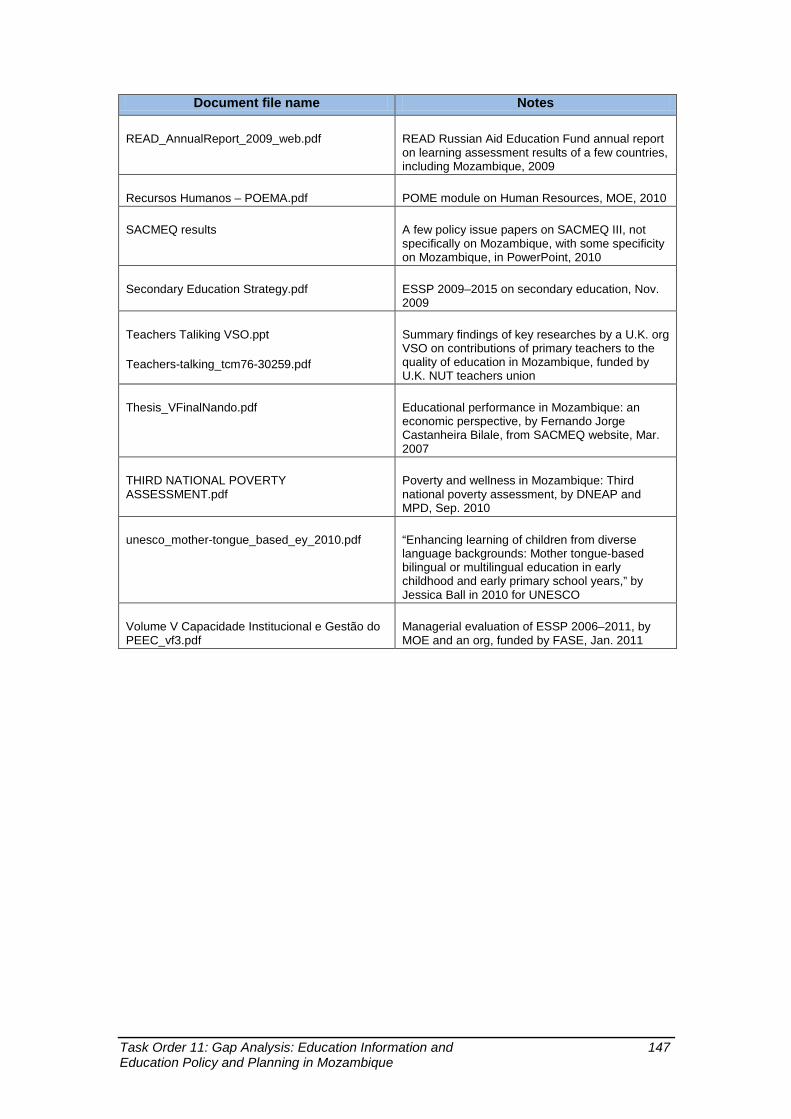
Task Order 11: Gap Analysis: Education Information and 147 Education Policy and Planning in Mozambique
Document file name Notes
READ_AnnualReport_2009_web.pdf READ Russian Aid Education Fund annual report on learning assessment results of a few countries, including Mozambique, 2009
Recursos Humanos – POEMA.pdf POME module on Human Resources, MOE, 2010
SACMEQ results A few policy issue papers on SACMEQ III, not specifically on Mozambique, with some specificity on Mozambique, in PowerPoint, 2010
Secondary Education Strategy.pdf ESSP 2009–2015 on secondary education, Nov. 2009
Teachers Taliking VSO.ppt
Teachers-talking_tcm76-30259.pdf
Summary findings of key researches by a U.K. org VSO on contributions of primary teachers to the quality of education in Mozambique, funded by U.K. NUT teachers union
Thesis_VFinalNando.pdf Educational performance in Mozambique: an economic perspective, by Fernando Jorge Castanheira Bilale, from SACMEQ website, Mar. 2007
THIRD NATIONAL POVERTY ASSESSMENT.pdf
Poverty and wellness in Mozambique: Third national poverty assessment, by DNEAP and MPD, Sep. 2010
unesco_mother-tongue_based_ey_2010.pdf “Enhancing learning of children from diverse language backgrounds: Mother tongue-based bilingual or multilingual education in early childhood and early primary school years,” by Jessica Ball in 2010 for UNESCO
Volume V Capacidade Institucional e Gestão do PEEC_vf3.pdf
Managerial evaluation of ESSP 2006–2011, by MOE and an org, funded by FASE, Jan. 2011

148 Task Order 11: Gap Analysis: Education Information and Education Policy and Planning in Mozambique
Table 19. Databases consulted and inspected, or documentary evidence gathered
Document file name Notes
Census 2007 (Censos), INE
2007 Census Questionnaire.pdf Questionnaire
Demographic and Health Survey 2003 (DHS), USAID
MOZ DHS 03.pdf Report w/ questionnaire
EMIS school survey, MINED
Primary EMIS Questionnaire.pdf
Primary EMIS Questionnaire - end of year.pdf
Questionnaires
Alunos_1992-2003.xls
Alunos_2004-2010.xls
Idade_2004-2010.xls
Idades_1992-2003.xls
PopProjProv2007-11.xls Profs_2004-2009.xls
Qry_Alu_escolas_2004-2009.xls
Data files
EMIS Verif.xls Data verification file
Household Survey 2008 (IOF - INQUÉRITO SOBRE ORÇAMENTO FAMILIAR), INE
QDESPESAS DIARIAS IOF 2008.xls
QUESTIONÁRIO AG FAMILIAR IOF2008 ABRIL.xls
QUESTIONÁRIO DESP E RECEITAS IOF2008 ABRIL.xls
Questionnaires
MANUAL DO INQUIRIDOR IOF2008.doc Manual
IOF2008_9.pdf Report
Household Survey 2002 (IAF - INQUÉRITO AOS AGREGADOS FAMILIARES), INE
IAF 2002 Community.pdf
IAF 2002 HH questionnaire income and expenditures.pdf
IAF 2002 IAF_relf.pdf
IAF 2002 questionnaire general.pdf
Questionnaires
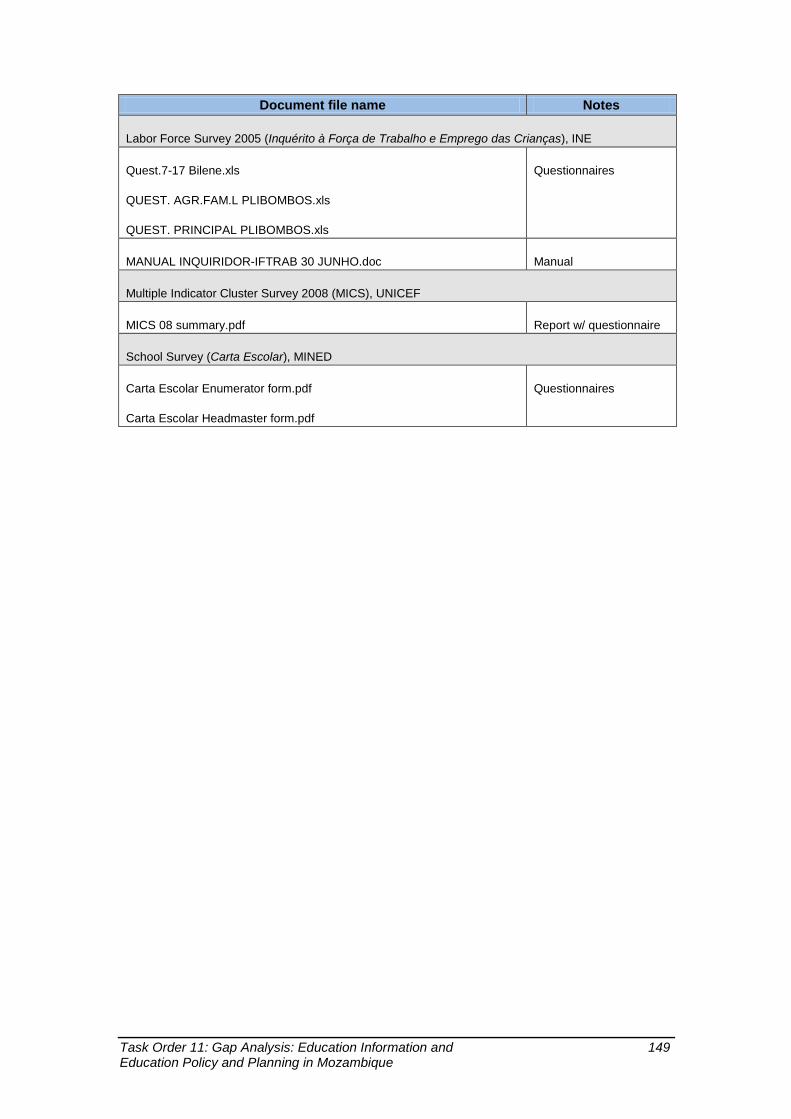
Task Order 11: Gap Analysis: Education Information and 149 Education Policy and Planning in Mozambique
Document file name Notes
Labor Force Survey 2005 (Inquérito à Força de Trabalho e Emprego das Crianças), INE
Quest.7-17 Bilene.xls
QUEST. AGR.FAM.L PLIBOMBOS.xls
QUEST. PRINCIPAL PLIBOMBOS.xls
Questionnaires
MANUAL INQUIRIDOR-IFTRAB 30 JUNHO.doc Manual
Multiple Indicator Cluster Survey 2008 (MICS), UNICEF
MICS 08 summary.pdf Report w/ questionnaire
School Survey (Carta Escolar), MINED
Carta Escolar Enumerator form.pdf
Carta Escolar Headmaster form.pdf
Questionnaires