Embed Size (px)
Citation preview

EdData II
PhilEd Data: Strengthening Information for Education, Policy, Planning and Management in the Philippines Component 2: Early Grade Reading Assessment Results (Grades 3 English and Filipino, Grade 1 Ilokano) Updated version
EdData II Technical and Managerial Assistance, Task Number 17 Contract Number: AID-492-M-12-00001 August 31, 2013
This publication was produced for review by the United States Agency for International Development. It was prepared by RTI International.

PhilEd Data: Strengthening Information for Education, Policy, Planning and Management in the Philippines Component 2: Early Grade Reading Assessment Results (Grades 3 English and Filipino, Grade 1 Ilokano) Updated version
Education Data for Decision Making (EdData II) Task Order No. 17 Prepared for Mirshariff Tillah, Contracting Officer’s Representative (COR) USAID/Philippines Office of Education [email protected] Prepared by Sarah Pouezevara, Joe DeStefano and Chris Cummisky 3040 Cornwallis Road Post Office Box 12194 Research Triangle Park, NC 27709-2194 RTI International is a trade name of Research Triangle Institute.
The author’s views expressed in this publication do not necessarily reflect the views of the United States Agency for International Development or the United States Government.

Philippines EGRA Report – Final - 31 Aug., 2013 1
Table of Contents
List of Tables ............................................................................................................................. 2
List of Figures ............................................................................................................................ 3
Abbreviations ............................................................................................................................. 4
Acknowledgments...................................................................................................................... 6
Map of the Philippines ............................................................................................................... 7
I. Introduction ............................................................................................................................ 8
Language and Literacy in the Philippines .............................................................. 8
Reading Reform Programs ..................................................................................... 9
Purpose of the 2013 Early Grade Reading Assessments ...................................... 10
About the Early Grade Reading Assessment Tool ............................................... 11
II. Outcomes Summary ..................................................................................................... 14
Overview .............................................................................................................. 14
III. Outcome Details, by Language .................................................................................... 21
Filipino Results ..................................................................................................... 21
English Results ..................................................................................................... 35
Ilokano Results ..................................................................................................... 47
IV. Conclusions and policy implications ................................................................................. 58
Annex 1: Description of the Sample ........................................................................................ 64
Student Characteristics ......................................................................................... 64
School Characteristics .......................................................................................... 64
Annex 2: Sampling, Weighting and Limitations ..................................................................... 66
Sampling ............................................................................................................... 66
Weighting ............................................................................................................. 67
Limitations ............................................................................................................ 68
Annex 3: Reading Comprehension Distribution Scores .......................................................... 71
Annex 4: Dictation scoring rules ............................................................................................. 73
Annex 5 : Correlations between subtests in English and Filipino ........................................... 76

Philippines EGRA Report – Final - 31 Aug., 2013 2
List of Tables Table 1: EGRA instrument subtests in the Philippines ............................................................ 12
Table 2: Mean ORF and comprehension scores ...................................................................... 14
Table 3: Scores in Filipino by top and bottom quintiles (Filipino).......................................... 15
Table 4: Scores in English by top and bottom quintiles (Filipino) .......................................... 15
Table 5: Average ORF and reading comprehension by grouped Region ................................ 17
Table 6: Results according to Philippines national ORF benchmarks ..................................... 18
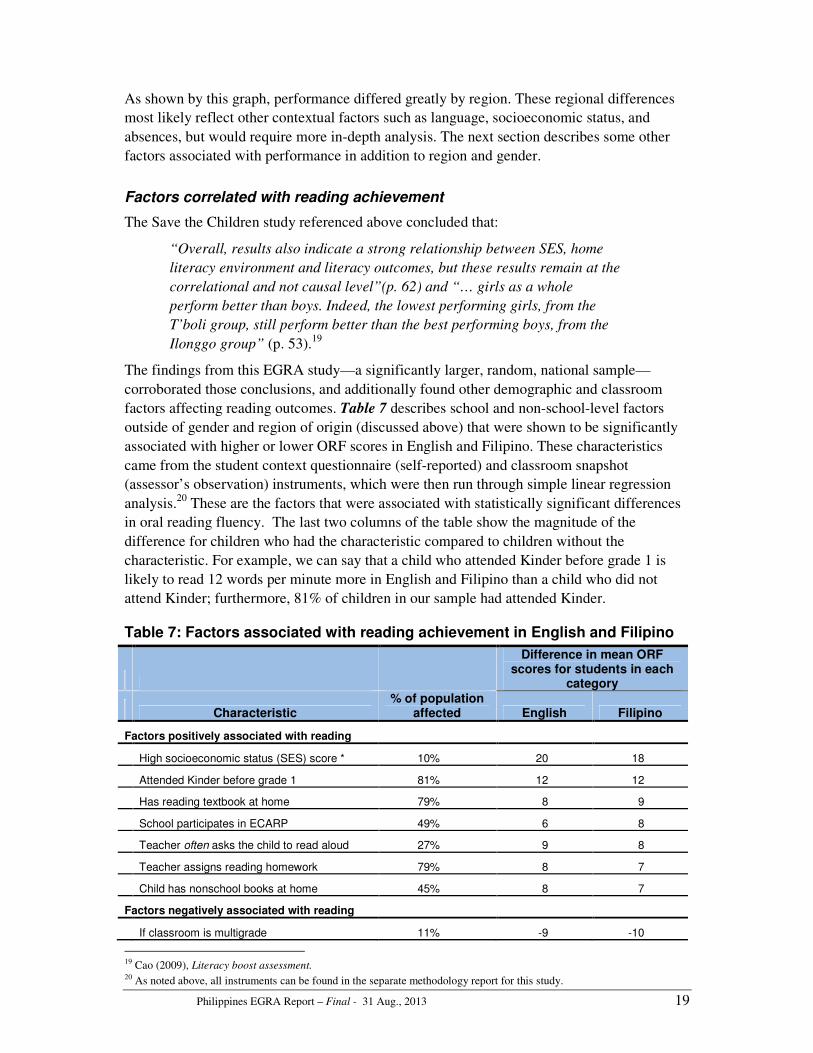
Table 7: Factors associated with reading achievement in English and Filipino ...................... 19
Table 8: Filipino results on all subtests, differentiated by gender ........................................... 21
Table 9: Filipino phonemic awareness –and frequency of incorrect responses ....................... 22
Table 10: Filipino familiar word reading – items and frequency of incorrect responses
(first 10 words) ........................................................................................................ 25
Table 11: Filipino nonword reading – items and frequency of incorrect responses (first
10 words) ................................................................................................................. 26
Table 12: Filipino prosody – distribution of scores ................................................................. 29
Table 13: Comparison of average reading and listening comprehension scores for
Filipino .................................................................................................................... 31
Table 14: Frequently missed Filipino dictation words, by error type ...................................... 33
Table 15: English results on all subtests disaggregated by gender .......................................... 36
Table 16: Items and percent of incorrect responses on English initial-sound
segmentation (phonemic awareness) subtest .......................................................... 37
Table 17: English familiar word reading – items and percent of incorrect responses
(first 10 words) ........................................................................................................ 38
Table 18: English nonword reading – items and frequency of incorrect responses (first
10 words) ................................................................................................................. 39
Table 19: English prosody – distribution of scores ................................................................. 41
Table 20: Comparison of average reading and listening comprehension scores for
English .................................................................................................................... 43
Table 21: Frequently missed English dictation words, by error type ...................................... 44
Table 22: Ilokano results on all subtests disaggregated by gender .......................................... 48
Table 23: Items and frequency of incorrect responses on Ilokano differentiating initial
sounds (phonemic awareness) subtest ..................................................................... 48
Table 24: Ilokano familiar word reading – items and frequency of incorrect responses
(first 10 words) ........................................................................................................ 51
Table 25: Descriptive statistics for children ............................................................................ 64
Table 26: Descriptive statistics about schools ......................................................................... 65
Table 27: Participation in reading programs (grade 3) ............................................................ 65
Table 28: Summary of sample stage selection for grade 3 ...................................................... 66
Table 29: Summary of sample stage selection for grade 1 ...................................................... 67
Table 30: Final sample for grades 1 and 3: Divisions, districts, and schools .......................... 67
Table 31: Distribution of Filipino reading comprehension scores by number of
questions attempted ................................................................................................. 71
Table 32: Distribution of English reading comprehension scores by number of
questions attempted ................................................................................................. 71
Table 33: Distribution of Ilokano reading comprehension scores by number of
questions attempted ................................................................................................. 72
Table 34: Dictation scoring rules for English and Filipino...................................................... 73
Table 35: Sample of a scored English dictation sentence ........................................................ 75
Philippines EGRA Report – Final - 31 Aug., 2013 3
List of Figures
Figure 1: Boys’ and girls’ performance in ORF ...................................................................... 16
Figure 2: Achievement across regions in fluency and accuracy according to
benchmarks ............................................................................................................. 18
Figure 3: Filipino correct letter sounds per minute – distribution of responses by range
of correct words per minute .................................................................................... 23
Figure 4: Performance on the first 50 Filipino letter sounds ................................................... 24
Figure 5: Filipino ORF – distribution of scores (number and weighted percents), by
range of fluency....................................................................................................... 27
Figure 6: Filipino ORF text...................................................................................................... 28
Figure 7: Filipino ORF scores for children who were over-age in grade 3 ............................. 29
Figure 8: Distribution of Filipino dictation scores ................................................................... 32
Figures 9a and 9b: Relationship between Filipino dictation and comprehension ................... 33
Figure 10: Filipino percentile distributions on all subtests ...................................................... 35
Figure 11: Performance on the first 50 English letter sounds .................................................. 38
Figure 12: English ORF – distribution of scores by range of fluency ..................................... 40
Figure 13: English ORF text .................................................................................................... 41
Figure 14: Distribution of English dictation scores ................................................................. 44
Figures 15a and 15b: Relationship between English dictation and comprehension ................ 45
Figure 16: English percentile distributions on all subtests ...................................................... 47
Figure 17: Distribution of Ilokano scores on differentiating initial sounds (phonemic
awareness) subtest ................................................................................................... 49
Figure 18: Performance on the first 30 Ilokano letter sounds .................................................. 50
Figure 19: Ilokano familiar words – distribution by range of correct words per minute ......... 50
Figure 20: Correct nonwords and Ilokano ORF ...................................................................... 51
Figure 21: Correct familiar words and Ilokano ORF ............................................................... 51
Figure 22: Ilokano letter sounds and nonwords ....................................................................... 51
Figure 23: Ilokano letter sounds and familiar words ............................................................... 51
Figure 24: Ilokano nonword reading – distribution of scores by range of correct words
per minute................................................................................................................ 52
Figure 25: Ilokano ORF text .................................................................................................... 53
Figure 26: Grade 1 performance on Ilokano ORF subtest, first 30 words ............................... 53
Figure 27: Ilokano reading and comprehension data ............................................................... 55
Figure 28: Ilokano listening comprehension distribution of scores ......................................... 56
Figure 29: Comparison of Filipino scores across regions ........................................................ 59
Figure 30: Comparison of English scores across regions ........................................................ 59

Philippines EGRA Report – Final - 31 Aug., 2013 4
Abbreviations
ARMM Autonomous Region of Muslim Mindanao
BEAM Basic Education Assistance for Mindanao
BEIS Basic Education Information System
BPA Blanket Purchase Agreement
CALABARZON Cavite, Laguna, Batangas, Rizal, and Quezon (Southern Tagalog
Mainland)
CAR Cordillera Administrative Region
CEM Center for Educational Measurement
CI confidence interval
COR Contracting Officer’s Representative
cwpm correct words per minute
DepEd Philippine Department of Education
ECARP Every Child a Reader Program
EdData II USAID Education Data for Decision Making II
EFA Education for All
EGRA Early Grade Reading Assessment
ELSA Education Livelihood Services Alliance
EQuALLS 2 Education Quality and Access for Learning and Livelihood Skills project
IEA International Association for the Evaluation of Educational Achievement
K–12 kindergarten to grade 12
L1, L2, L3 first, second, or third language
MANCOM DepEd Management Committee
MIMAROPA Occidental Mindoro, Oriental Mindoro, Marinduque, Romblon and
Palawan (Southern Tagalog Islands)
MIT Massachusetts Institute of Technology
MLE multilingual education
MMPO Metro Manila Program Office (Save the Children)
MT mother tongue
MTB-MLE mother-tongue-based multilingual education
NAEP National Assessment of Educational Progress
NAT National Achievement Test
NCES U.S. National Center for Education Statistics
NCR National Capital Region
NETRC National Educational Testing and Research Center
ORF oral reading fluency
PA phonemic awareness
PhilEd Data Strengthening Information for Education, Policy, Planning and
Management in the Philippines (EdData II Task 17)
PISA Program for International Student Assessment \
PRIME Philippines’ Response to Indigenous Peoples’ and Muslim Education
RTI RTI International (trade name of Research Triangle Institute)
Philippines EGRA Report – Final - 31 Aug., 2013 5
SCMPO South Central Mindanao Program Office (Save the Children)
SEAMEO Southeast Asian Ministers of Education Organization’s Regional Center
INNOTECH for Educational Innovation and Technology
SES socioeconomic status
SOCCSKSARGEN South Cotabato, Cotabato, Sultan Kudarat, Sarangani and General
Santos City (Central Mindanao)
STRIVE Strengthening Implementation of Visayas Education
TEPT Test of English Proficiency for Teachers
TNS Taylor Nelson Sofres
USAID United States Agency for International Development

Philippines EGRA Report – Final - 31 Aug., 2013 6
Acknowledgments This study was carried out under a technical assistance contract awarded to RTI International
from USAID under the Education Data for Decision Making (EdData II) Blanket Purchase
Agreement (BPA) mechanism to support the Philippine Department of Education (DepEd)
Education to strengthen their ability to generate and use education data. The Strengthening
Information for Education Policy, Planning and Management in the Philippines (PhilEd Data)
project began in June 2012 and includes support to DepEd’s ongoing efforts to improve
analysis and use of existing assessment results and develop strategies for new national
assessments aligned with the curricular reforms under way.
The PhilEd Data team consists of three core institutional partners: RTI International, the
Southeast Asian Ministers of Education Organization’s Regional Center for Educational
Innovation and Technology (SEAMEO INNOTECH), and the Center for Educational
Measurement (CEM)—along with Taylor Nelson Sofres (TNS) Global, which managed the
field research for this early grade reading assessment.
RTI gratefully acknowledges the support of the previous Undersecretary for Programs and
Projects, Dr. Yolanda S. Quijano, who was instrumental in supporting Early Grade Reading
(EGRA) activities, mobilizing support from regional DepEd officials, and ensuring
cooperation from sampled schools. Additionally, we welcome the new Undersecretary, Dr.
Dina Ocampo, and look forward to working together to discuss the results of this activity and
the policy implications. We particularly recognize the individual members of the DepEd
EGRA team, who also supported planning and implementation of this research; and the
experts who contributed to instrument adaptation and training and to the finalization of this
report, including the TNS program manager for this study.
Dr. Rosalina Villaneza Ms. Yammie Tolentino
Dr. Paraluman Giron Dr. Roderick Aguirre
Mr. Galileo Go Ms. Marie Christine Reyes
Ms. Angelika Jabines Mr. Firth McEachern
Ms. Joycelyn Tuguinayo
Ms. Ligaya Ilagan
We are, of course, most grateful to all of the DepEd and TNS assessors, and TNS field
managers too numerous to name who gave so much of their time to conduct this important
fieldwork on time despite the challenges of national data collection in a country so
geographically complex. Additionally, we thank SEAMEO INNOTECH, and particularly
Ms. Sylvette Gunigundo, for hosting the assessor training workshops in Manila and San
Fernando (La Union) and ensuring that everything ran smoothly. RTI is represented locally
by Mr. Rufino Jamilano, who was invaluable during the coordination and implementation of
the events.
Please address questions or comments on this report to: [email protected]

Philippines EGRA Report – Final - 31 Aug., 2013 7
Map of the Philippines
Sampled grade 3 students by grouped (super-) region..

Philippines EGRA Report – Final - 31 Aug., 2013 8
I. Introduction The development of education in the Philippines has reached a critical juncture. The
Department of Education (DepEd) is planning to build the classrooms and hire the additional
teachers needed to make the final push toward reaching its Education for All (EFA) targets
and Millennium Development Goal for Education by 2015. At the same time, the 2011 Sector
Assessment1 documented the recent deterioration of quality and a persistent dropout problem
evidenced by declining cohort survival rates. Rising to the challenge of improving quality,
DepEd has launched a complete restructuring of elementary and secondary education that
includes adding two years to the secondary cycle and overhauling the curricula for all
subjects from kindergarten to 12th grade (the K to 12 reform program). One major area of
curriculum reform involves introducing mother tongue-based, multilingual education (MTB-
MLE) as an approach to improving student acquisition of literacy in the early grades of
elementary school.
The MTB-MLE program was designed by executive order in 2009 to institutionalize mother-
tongue instruction in the early grades of elementary education across the school system. A
Strategic Plan for implementation was completed in 2010. The Strategic Plan laid out specific
activities to be undertaken, including advocacy; pre- and in-service teacher training; materials
development; policy development and resource mobilization; and assessment, monitoring,
and evaluation.2 The implementation of MTB-MLE means that students have to establish
strong reading skills in grades 1 through 3 so that those skills can be transferred into English
and Filipino, which are the official languages of instruction after grade 33.
Language and Literacy in the Philippines
The Philippines is a multilingual and multiethnic society with between 120 and 171 distinct
languages in the country. The Tagalog-based Filipino is widely understood and used in all
domains of life, but Filipino is considered a second language for many, while Tagalog is
considered a mother tongue. Census data suggest that while no language enjoys a majority
advantage in the country, 65 out of 76 million Filipinos are able to speak Filipino as a first or
second language.4 Eight languages are considered “major” languages (based on census data
and numbers of speakers). These are (1) Bikol, (2) Cebuano, (3) Hiligaynon, (4) Ilokano, (5)
Kapampangan, (6) Pangasinan, (7) Tagalog, and (8) Waray or Samarnon. Although many
indigenous languages are spoken at home and in communities, printed materials are primarily
in English (commerce, advertising, bureaucracy) and Filipino (newspapers, public service
messages, entertainment).
1 Buendia, R., Gregorio, J., Molera, R. A., Flor, B. G., Vergel de Dios, B., Ganibe, J.W., Balonkita, A. G., Dawang, C., &
Mirandilla, N. (2011). Philippine Education Sector Assessment Project. Report prepared for USAID by International
Technology Management Corporation. Manila, Philippines. 2 Mother-Tongue-Based Multilingual Education Strategic Plan. Manila: Department of Education, Republic of the
Philippines, 13 February 2010. 3 At the time this study was designed and implemented, the mother tongue was expected to be used only from Kindergarten
to Grade 3, requiring proficiency in three languages within this time frame; however, the Enhanced Basic Education Act of
2013 tasks the Department of Education to formulate a mother tongue transition program from Grades 4-6. This is expected
to lengthen and facilitate the transition from mother tongue to English and Filipino, but implementation details of this
transition had not been determined at the time this report was finalized. 4 Nolasco, R. M. (2008). The prospects of multilingual education. Report of the Komisyon sa Wikang Filipino [Commission
on the Filipino Language]. Retrieved from
http://www.seameo.org/_ld2008/doucments/Presentation_document/NolascoTHE_PROSPECTS_OF_MULTILINGUAL_E
DUCATION.pdf

Philippines EGRA Report – Final - 31 Aug., 2013 9
The promotion of Tagalog as a national, unifying language dates back to 1937, but it wasn’t
until 1957 that Filipino was officially declared the national language. The distinction between
Tagalog and Filipino is constantly evolving, since Filipino is meant to be enriched by
vocabulary from other indigenous languages. In practice, there is very little difference in
lexicon and no difference in grammar5 between the two languages, but Filipino is treated as a
language that is distinct from that which is spoken by the Tagalog ethnic group. While
Filipino is designated as the “national” language, the 1974 bilingual education policy
institutionalized English and Filipino as languages of instruction and the 1987 Constitution
declares both Filipino and English as “official” languages. In school, this meant that
students—regardless of home language—began their primary education in a dual-language
immersion model where English was used as the language of instruction for science, math,
and technology subjects; and Filipino for social science, civic education, sports, and the arts.
Use of local mother tongues was tolerated as necessary in order to facilitate understanding of
the subjects. Yet English is a second language for most Filipinos. A 2008 survey by Social
Weather Stations indicated that about three fourths of Filipino adults said they could
understand and read English, while less than half (46%) said they could speak it and 8% said
they were not competent in any way.6
Recognizing how difficult it is for a child to learn when the language(s) of instruction is(are)
not their mother tongue, at least a dozen mother-tongue pilot programs have been
implemented and evaluated in the Philippines over the past 60 years.7 These as well as
international experiences have demonstrated the benefits of early grade instruction in mother
tongue, and have confirmed that literacy skills in a mother tongue transfer to second (L2) and
third (L3) language reading. As a result, the current policy8 stipulates the use of mother
tongues in grades K–3 as media of instruction and languages of literacy development in
grades 1 and 2. English and Filipino are gradually introduced orally and then literacy
development transitions to English and Filipino in grades 2 and 3, preparing children for fully
bilingual English and Filipino instruction by fourth grade. The government has identified an
initial 16 major languages to use as mother tongues in the early grades and is investing
heavily in teacher training, curricular reform, and materials development. With the advent of
MTB-MLE, students will need to successfully learn to read in mother tongue by the end of
grade 1 or early in grade 2 so that they can transfer that skill to English and Filipino in grade
3 and beyond.
Reading Reform Programs
Alongside the major curricular reforms being undertaken by the government under the K–12
program and MTB-MLE initiatives, the government has, for many years, been supporting
education quality reform initiatives aimed at improving literacy outcomes. Some of these are
large-scale, donor-funded programs and others are smaller, school-based initiatives. For
5 Nolasco, R. M. (2007, August 24). Filipino and Tagalog: Not so simple. Dalityapi Unpoemed. Retrieved from
http://www.dalityapi.com/2007_08_01_archive.html 6 Nolasco (2008), The prospects of multilingual education. 7 See, for example, the presentation Mother-tongue-based multilingual education (MTB-ME), prepared by the DepEd
Management Committee (MANCOM), September 2009. Retrieved from
http://www.depedro7.com.ph/uploadedFiles/file/Whats%20New/EXECON%209-17-09/Mother%20Tongue-
based%20Multilingual%20Education%20%28MT-MLE%29.pdf 8 See Republic Act 10157, known as the “Kindergarten Education Act,” of January 20, 2012. Retrieved from
http://www.lawphil.net/statutes/repacts/ra2012/ra_10157_2012.html

Philippines EGRA Report – Final - 31 Aug., 2013 10
example, the Every Child a Reader Program (ECARP) provides catalyst funds to schools to
support literacy improvement programs across a range of proven strategies:
• Reading remediation activities such as specialized training to teachers who then offer
on-on-one assistance to struggling readers outside of class time.
• Specific classroom instructional strategies such as word walls, pair and group
reading, read-alouds.
• Increasing time for students to practice reading such as Drop Everything and Read
initiatives in various forms, in-classroom mini-libraries, all-school reading times 15
minutes each day, weekly library hours.
• Encouraging parents to be engaged in their children’s learning by reviewing
assessment results together, inviting parents and other community members to come
into the school for storytelling and read-alouds, and encouraging parents to have their
children read at home.
“Read-a-thon,” “Read more, be more,” National Literacy Month (November), and others are
smaller advocacy initiatives encouraged by DepEd but led by schools themselves or local
nongovernmental organizations to encourage children to spend more time reading age-
appropriate books in school and out of school through a variety of fun and competitive
activities.
Additionally, many initiatives address specific education challenges in the regions. Examples
include USAID’s Education Quality and Access for Learning and Livelihood Skills
(EQuALLS2) Project which focuses on improving access to and quality of education in
grades 1-3 and out-of-school youth, specifically in the ARMM and Regions 9 and 12 in
Mindanao; the Basic Education Assistance for Mindanao (BEAM), Strengthening
Implementation of Visayas Education (STRIVE), and Philippines’ Response to Indigenous
Peoples’ and Muslim Education (PRIME) are regional initiatives supported by AusAID. As
the present report was being finalized, USAID launched a new 5-year program focusing on
improved reading outcomes—USAID/Basa. These and other programs too numerous to
mention here reflect an awareness of the need to provide targeted reading interventions to
specific subpopulations with different needs.
Purpose of the 2013 Early Grade Reading Assessments
To support quality implementation of the abovementioned reforms, the Department of
Education recognizes the importance of measuring reading performance and progress over
time. The MTB-MLE Strategic Plan established benchmarks for performance and stressed the
need to “establish achievement, persistence, dropout and other baselines for all schools where
MTB-MLE is implemented” as well as “comparative achievement studies” that would
document how well schools are performing one year after implementation of MTB-MLE.
The 2013 EGRA studies described here had two basic objectives supporting the Strategic
Plan:
• Objective 1: To establish a scientific, national baseline of reading performance in
English and Filipino in third grade. The cohort of children tested in school year 2012–
2013 reached third grade prior to the implementation of K to 12 and MTB-MLE. So
this assessment provides a “pre K to 12, pre MTB-MLE” baseline.

Philippines EGRA Report – Final - 31 Aug., 2013 11
• Objective 2: To assess mother-tongue reading acquisition in a region in the country
where the MTB-MLE approach had been piloted since 2011–2012. This would
provide some initial data on how well children were being taught to read in a mother
tongue supported by the national curricular reforms.
Although previous efforts have been made to institute classroom-based measures of reading
ability (e.g., the Philippine Informal Reading Inventory), there is currently no systematic way
of measuring and aggregating early reading outcomes across schools in the Philippines. The
National Assessment Test (NAT) begins measuring English and Filipino achievement in
grade 3, and then again in grade 6, but the NAT is more of a language/language arts test than
a reading test. Moreover, since it is delivered as a written test, it automatically assumes some
reading ability on the part of the children. As a result, there is no reliable measure of what
early literacy skills children are acquiring.
The present report describes the results of two reading assessments that were carried out to
measure performance of a representative national sample of children reading English and
Filipino at the end of grade 3 (Objective 1, above) and a regional sample of children reading
Ilokano in grade 1 (Objective 2, above). The first included a national sample of 2,463
students, selected in a stratified, random framework to be representative of six geographic
areas: North Luzon, Metro Manila, South Luzon, Visayas, Mindanao, and the Autonomous
Region of Muslim Mindanao (ARMM). The second was a regional sample of 494 children in
50 schools selected randomly in Region 1 from all schools who reported having begun
implementation of Ilokano instruction in school year 2012–2013 or 2011–2012. Additional
details about the sample and the sampling methodology appear in Annexes 1 and 2.
Although the purposes are different, the basic methodology was the same for both studies. In
neither case was the study comparative or experimental, i.e., comparing schools with MTB-
MLE against schools without it, or comparing performance at two different points in time.
However, as an initial baseline it will allow such comparative studies to be undertaken in the
future. For Ilokano, the assessment measured how well the current curriculum and its
implementation were giving children the foundational skills needed to acquire literacy, and as
such, whether established benchmarks were realistic and aligned to the language context. For
English and Filipino, the grade 3 assessment provided a reference for the extent to which the
existing system of bilingual immersion had prepared children to “read to learn” in the higher
grades using these two standard languages of instruction. In the future, follow-on assessments
conducted with the same rigor can compare results to this baseline to understand whether
beginning to read in their mother tongue leads to similar or improved levels of proficiency in
English and Filipino.
In both cases, the exercise also served to build the capacity of the Department of Education to
develop early grade reading assessment instruments and conduct rigorous, sample-based
assessments, and is expected to support their efforts to conduct additional evaluations of early
grade reading.
About the Early Grade Reading Assessment Tool
In November 2006, USAID and the World Bank supported RTI and a team of reading experts
to develop a 15-minute, individual oral assessment of five core skills that are considered to be
the building blocks of reading: phonemic awareness, alphabetic principle, fluency,
vocabulary, and comprehension. The purpose was to give low-income countries a tool for

Philippines EGRA Report – Final - 31 Aug., 2013 12
systematically measuring how well children read in the early grades. The resulting tool
became known as the Early Grade Reading Assessment, or EGRA, which translates the five
core skills into observable tasks: recognizing letters of the alphabet, distinguishing sounds
within words, reading simple words, and understanding sentences and paragraphs. Because
the assessment components are aligned with essential and teachable reading skills, the results
provide clear guidance for changing instructional methods and offer hope of improvement.
Measurements of how quickly and accurately children can read a text out loud, and how
much of it they understand, also align with a scientific and a popular understanding of what it
means to be able to read. The key differences between EGRA and other kinds of national
diagnostic tests are that:
• The assessment is aligned to essential and teachable components of reading and to the
expectations of the local curriculum, but it is curriculum independent. The same
instrument and items can be used to compare results across different curricula,
instructional methods, or grades.
• It is orally administered by a trained assessor to one child at a time.
• There are timed subtests that provide measures of fluency (the number of items
answered correctly per minute).
An adaptation process conducted in the Philippines, involving the Department of Education
and language specialists from around the country, served to ensure that the instruments used
for this exercise:
• were culturally appropriate
• corresponded to the grade-level material students were expected to be able to read
• reflected the way the language was being used locally in reading materials for the
target grade level
• reflected the way that reading is typically taught
• took into consideration the linguistic structure of the language
• addressed issues of mother-tongue interference, local dialects, and pronunciation.
The instruments developed were pilot tested with more than 150 students and analyzed using
“Rasch analysis” to ensure that items measured a range of skills and were neither too easy nor
too hard for the target population.9 The final instruments included the subtests summarized in
Table 1.
Table 1: EGRA instrument subtests in the Philippines
Subtest Skill Description
The child is asked to… Grade(s)
implemented
Initial-sound segmentation (Filipino and English only)
Phonemic awareness …say the first sound heard in a word pronounced by the assessor. For example, “Tell me the first sound you hear in the word ‘bat’” (Answer is “b”).
Grade 3
Differentiating initial sounds (Ilokano only)
Phonemic awareness … say which word, of three pronounced by the assessor, begins with a different sound. For example, “Tell me which word begins with a different sound: bat, ball, car.”
Grade 1
9 For more information or data on the Rasch analysis for this study, please contact [email protected].

Philippines EGRA Report – Final - 31 Aug., 2013 13
Subtest Skill Description
The child is asked to… Grade(s)
implemented
(Answer is “car”)
Letter-sound identification
Alphabetic principle—letter-sound correspondence
… say the sound each letter makes, while looking at a printed page of 100 letters of the alphabet in random order, upper and lower case. Timed.
Grade 1 Grade 3
Familiar word reading
Fluency—automatic word recognition
… read a list of 50 common words printed on a page. For example, “stop,” “the,” “was.” Timed.
Grade 1 Grade 3
Nonword reading Alphabetic principle—letter sound correspondence and Fluency—automatic decoding
… read a list of 50 non-words printed on a page. Words are constructed from actual orthography, but are not real words. For example “jaf,” “tob.” Timed.
Grade 1 Grade 3
Oral reading fluency
Fluency—automatic word reading in context
…read a short story out loud (up to 60 words in length) printed on a page. Timed.
Grade 1 Grade 3
Prosody (Filipino and English only)
Comprehension … complete the oral reading fluency subtest while the assessor scores expressiveness and size of word groups read.
Grade 3
Reading comprehension
Comprehension … respond to 5 questions that the assessor asks about the short story.
Grade 1 Grade 3
Listening comprehension
Language comprehension and vocabulary
…listen to a story that the assessor reads out loud, then answer questions about the story.
Grade 1 Grade 3
Dictation (Filipino and English only)
Alphabetic principle … write a short sentence that the assessor says out loud.
Grade 3
These subtests can be characterized as “fluency” measures based on whether they are timed
or untimed. A timed subtest is administered over a one-minute period in which the child reads
as many letters, words, or sentences possible. The assessor notes which letters or words are
read incorrectly, and at the end of a minute, the assessor notes how many letters or words
total were read. The result is calculated and expressed as “correct items per minute.”
Nonfluency subtests include untimed sets of questions.10
The results are calculated and
expressed as “percentage of items correct out of total possible.”
Each third grade child was assessed in both English and Filipino, whereas grade 1 children
were assessed only in Ilokano. In addition to the reading assessment, children were asked a
series of questions about their home and school environment. These questions were designed
to gather contextual information that can help explain variations in reading ability. A short
classroom and school snapshot also gathered basic information about school enrollment, class
sizes, availability of textbooks, and progress in the reading curriculum at the time that the
EGRA took place. The data was gathered using the Tangerine®
tool for mobile data
collection. For full methodological details related to data collection—including assessor
training, fieldwork procedures, and quality control—please refer to a separate report prepared
by TNS, Methodological Report for the Early Grade Reading Assessment (April, 2013).11
10 Although the child was given a limit of time in which to answer the questions—for example, 3 or 5 seconds—this is not
considered a timed subtest resulting in a measure of fluency. The time limit serves only to limit the overall duration of the
test, and to create consistency among assessors in administering the test. 11 For a copy please contact [email protected].

Philippines EGRA Report – Final - 31 Aug., 2013 14
II. Outcomes Summary
Overview
The ultimate purpose of any reading assessment is to answer a seemingly simple question:
“Are students learning to read and understand text appropriate to their grade level?” To
answer that question, EGRA uses research-based measures of oral reading fluency (accuracy
and speed) and comprehension. The other subtests, as outlined above, measure underlying
skills leading to fluency—phonemic awareness, decoding, alphabetic principle—and can be
useful for understanding more specifically what children can and can not do, and thus
explaining reading and comprehension outcomes. This section provides an initial broad
overview of performance across all three languages, and as an initial introduction refers only
to oral reading fluency (ORF12
) and comprehension outcomes. Section III provides more
detailed results on all subtests, for all languages. Section IV presents the conclusions of this
study. Discussion of the sampling methodology and the limitations of the data collection
methods used are shared in annexes to the main report. Examples of the instruments are
available in the full methodology report for this assessment.13
Average scores in reading and comprehension
Mean ORF scores for each language, along with the proportion of children who achieved
80% comprehension or better, are provided in Table 2. Children were asked comprehension
questions based on the amount of text they read in one minute; thus, a child who read
slowly—i.e., 20 correct words per minute (cwpm) or less—may have been asked only two
questions out of five possible. Only the children who completed the reading passage within a
minute were asked all five questions. Therefore, there are two ways to describe
comprehension: either as a percentage of questions answered correctly out of the total
questions possible (five, in this case), or as a percentage of questions asked. Both
measurements are shown in Table 2.
Table 2: Mean ORF and comprehension scores
Grade and language
Mean ORF (cwpm)
% achieving 80% comprehension (out of total
of 5 questions possible)
% achieving 80% comprehension (out of total
attempted)
Grade 3 – Filipino 68 64% 67%
Grade 3 – English 67 17% 18%
Grade 1 – Ilokano 18 8% 14%
cwpm = correct words per minute.
Although English and Filipino oral reading fluency were essentially equivalent,
comprehension scores were much lower for English, indicating a lack of oral language and
12 Oral Reading Fluency (ORF), for the purposes of this report, is shorthand for the number of correct words per minute on a
connected-text reading passage, i.e., a short story, and shouldn’t be confused with more academic definitions of ‘reading
fluency’ which include rate, accuracy and expression. 13 Flores, J., Tolentino, Y. (2013). Methodological report for the Early Grade Reading Assessment. Report prepared for
USAID PhilEd Data. Manila: TNS and RTI International.

Philippines EGRA Report – Final - 31 Aug., 2013 15
vocabulary background in English. As mentioned in the background section above, English
was an L2 for most of these children, and this survey found that only 2.5% of children spoke
English in the home (based on students’ self-reporting). For Ilokano children, the low
comprehension score aligns with the low reading fluency demonstrated.
Note that the differences in the two measures of comprehension were not large for grade 3,
since most children read to the end of the 59-word story. For Ilokano, however, most children
did not complete the story and the actual number of questions which they were asked varied.
Therefore, the first measurement—percentage correct out of total questions possible—likely
underrepresents children’s actual levels of comprehension. Nonetheless, the low levels of
ORF and comprehension in Ilokano are surprising given that 75% of students reported
speaking Ilokano as their mother tongue. More details on distribution of scores on ORF and
comprehension are presented in the sections that follow.
In the grade 3 sample, all children were administered both the English and the Filipino
assessment. Therefore, we can also see whether strengths and weaknesses in reading persist
across languages, or whether they are related to the language. Tables 3 and 4, below show
the average scores for the top and bottom 20% of readers in Filipino in other subtests,
including English subtests.
Table 3: Scores in Filipino by top and bottom quintiles (Filipino)
Ranking of Filipino ORF
Filipino letter sounds
(correct per minute)
Filipino non-word reading (correct per
minute)
Filipino familiar word
reading (correct per
minute)
Filipino
reading comp. (% correct)
Bottom 20% 13 12 23 32%
Top 20% 30 46 74 92%
Table 4: Scores in English by top and bottom quintiles (Filipino)
Ranking of Filipino ORF
English ORF (correct
words per minute)
English letter
sounds (correct per
minute)
English non-word
reading (correct per
minute)
English familiar
word reading
(correct per minute)
English
reading comp. (% correct)
Bottom 20% 22 14 7 18 6%
Top 20% 104 29 44 71 55%
These tables confirm that children who are strong readers in Filipino also tend to be strong
readers in English, except in the area of English reading comprehension, where even the top
performers in all other skill areas are still only averaging 55% comprehension.
Gender and age
An important and statistically significant finding is that girls were doing better than boys
across languages, subtests, and regions. For example, on average compared to boys, girls read
about 25% more fluently in English and Filipino in grade 3 and 45% more fluently in Ilokano
in grade 1. Figure 1 shows the differences in ORF for girls and boys on all three subtests.

Figure 1: Boys’ and girls’ performance in ORF
The reasons for this gender gap have not yet been uncovered by this research, but it is useful
to note that consistent gender differences in reading and math are found internationally, such
that this is not necessarily a reflection of inequities in the system.14
Importantly, a consistent finding across all groups assessed was that children who are overage
for their grade—in this case, older than 9 in Grade 3 and older than 7 in Grade 1—have lower
scores on key measures of fluency and comprehension, and this is statistically significant.
This concerns 10% of the Grade 1 population and 32% of the Grade 3 population. Children
may be overage because they started school late, or because they have repeated a grade; in
either case, these are children who are struggling academically to begin with, and being in a
classroom with younger peers and content that is not tailored to their needs may be
exacerbating this situation.
Regional variation
The 1987 Constitution emphasizes the right to free, relevant, integrated basic and secondary
education for all Filipino citizens, and it sets out a number of strategies for achieving equity
and reaching poor, traditionally underserved populations. These include support for
nonformal, indigenous alternatives to public education, such as madrasah education;
equitable investment in school infrastructure; a national system of early childhood education;
and financial subsidies for the most underprivileged. Yet this study has shown significant
disparities among regional populations in the Philippines, particularly the Mindanao and
ARMM regions Table 5.
14 For example, a meta study of data from the Program for International Student Assessment (PISA) showed that 15-year-old
boys scored lower in reading in all nations in all four PISA assessments (2000, 2003, 2006, 2009), whereas boys scored
higher than girls in mathematics: Stoet, G., & Geary. D. C. (2013). Sex differences in mathematics and reading achievement
are inversely related: Within- and across-nation assessment of 10 years of PISA data. PLOS ONE, 8(3): e57988.
A 1990s international reading literacy study including data from the Philippines showed that at the 9-year-old level, girls
had higher achievement than boys in all countries for narrative passages, and in 24 countries for expository passages:
International Association for the Evaluation of Educational Achievement (IEA). (n.d). Reading Literacy Study. Informational
website, http://www.iea.nl/reading_literacy_study.html.
0
20
40
60
80
100
Boys Girls Boys Girls Boys Girls
Filipino English IlokanoO
ral
Re
ad
ing
Flu
en
cy

Philippines EGRA Report – Final - 31 Aug., 2013 17
Table 5: Average ORF and reading comprehension by grouped Region
Filipino English
Region ORF Comprehension ORF Comprehension
Metro Manila 80 84% 83 40%
Visayas 69 68% 69 38%
South Luzon 69 84% 74 30%
North Luzon 68 73% 67 31%
Mindanao 62 69% 62 28%
ARMM 56 61% 56 25%
National average 68 73% 67 32%
* Comprehension scores are percentage of questions answered correctly out of total possible.
The differences in regional averages were statistically significant. Further analysis of the
characteristics of strong versus weak readers15
indicated that a child in the ARMM region
was about five times more likely than his or her peers in Metro Manila (the highest
performing region) to be a weak reader in Filipino and six times more likely to be a weak
reader in English. In Mindanao, the odds were closer to three times for both languages.
Considering the findings of both gender and regional differences, it is important to recognize
that boys in ARMM were at a significant disadvantage; whereas the mean Filipino ORF for
boys in Metro Manila was 76, the mean for boys in ARMM was 47 and in Mindanao, 54.
This study therefore supports previous findings from other institutions that noted barriers to
education for children in ARMM and Mindanao: lack of educational infrastructure, poverty,
instability, lack of parental support, and cultural biases.
“…the legal bases to expand access to basic education are in place.
However, it is noted that dropout and participation rates remain high, and
lack of teachers and educational resources are still widespread in
Mindanao. These problems are most acute in the provinces of ARMM,
especially those affected by conflict” (p. 40).16
A smaller-scale study by Save the Children17
using an approach similar to EGRA also found
that students in the South Central Mindanao region scored much lower than students in Metro
Manila on all components of the test, in grade 1 and grade 3 alike.
Achievement according to benchmarks
The Philippines Department of Education has set specific and ambitious benchmarks for each
grade level and language using accuracy and ORF as the key indicators of reading progress.18
Table 6 shows the results of English, Filipino and Ilokano assessments in terms of the ORF
and accuracy benchmarks set by DepEd.
15 For the purposes of this study, a “weak reader” is defined as one who read less than 30 cwpm. 16 SEAMEO INNOTECH. (2007). Policy research on access to quality basic education for Muslim learners: Final report.
Prepared for the Education Livelihood Services Alliance (ELSA), USAID Education Quality and Access for Learning and
Livelihood Skills (EQuALLS) project. Manila: USAID. Retrieved from http://pdf.usaid.gov/pdf_docs/PNADK756.pdf 17 Cao, Y. (2009). Literacy boost assessment: Philippines Country Office, MMPO/SCMPO. Manila: Save the Children
Philippines Country Office. Retrieved from http://resourcecentre.savethechildren.se/node/6862. 18 Department of Education. (2012). K to 12 Curriculum Guide: English, January 31, 2012; and Department of Education
(2012). K to 12 Curriculum Guide: Filipino, January 31, 2012. The procedure used to determine benchmarks is not
documented.

Philippines EGRA Report – Final - 31 Aug., 2013 18
Table 6: Results according to Philippines national ORF benchmarks
Grade and language ORF
benchmark % meeting
ORF Accuracy
benchmark % meeting accuracy
% meeting both
Grade 3 – Filipino 80 cwpm 36% 95-100% 74% 35%
Grade 3 – English 60 cwpm 61% 95-100% 30% 28%
Grade 3 English and Filipino 35% 28% 20%
Grade 1 – Ilokano 60 cwpm < 1% 95-100% 23% <1%
The majority of children were not meeting the benchmarks, with the exception of English
reading fluency (for which the reading benchmark is set lower than for Filipino fluency) and
Filipino accuracy. Testing the same grade 3 children in English and Filipino allowed us to
determine the number of children who had met all fluency and accuracy benchmarks for both
English and Filipino. This was the case for only 20% of children.
Only a handful of children in the Ilokano sample met the grade 1 benchmark, set at the same
level as for grade 3 English. Benchmarks usually are set by observing data from a large
number of readers and studying the relationships between ORF and comprehension for that
language. Large-scale assessments such as this one can be used to take a data-based approach
to setting targets and monitoring them for all languages. The more detailed results presented
in Section III can help determine what Ilokano learners were capable of after one year of
instruction, but more longitudinal research will be needed to determine how children perform
in grades 2 and 3 and what type of learning progression can be expected. Yet even if the
grade 1 mother-tongue reading benchmark were set at 40 correct words per minute
(considering, among other things, the complexity and word length of the Ilokano language),
then only 13% would have met the target at the time of this assessment, which is still a
considerable minority.
Figure 2 presents the proportions of children, by region, who met the benchmarks in English
and Filipino.
Figure 2: Achievement across regions in fluency and accuracy according to benchmarks
0%
20%
40%
60%
80%
100%
ORF Accuracy Both ORF Accuracy Both
% Meeting English Standards % Meeting Filipino Standards
North Luzon Metro Manila South Luzon Visayas Mindanao ARMM
Philippines EGRA Report – Final - 31 Aug., 2013 19
As shown by this graph, performance differed greatly by region. These regional differences
most likely reflect other contextual factors such as language, socioeconomic status, and
absences, but would require more in-depth analysis. The next section describes some other
factors associated with performance in addition to region and gender.
Factors correlated with reading achievement
The Save the Children study referenced above concluded that:
“Overall, results also indicate a strong relationship between SES, home
literacy environment and literacy outcomes, but these results remain at the
correlational and not causal level”(p. 62) and “… girls as a whole
perform better than boys. Indeed, the lowest performing girls, from the
T’boli group, still perform better than the best performing boys, from the
Ilonggo group” (p. 53).19
The findings from this EGRA study—a significantly larger, random, national sample—
corroborated those conclusions, and additionally found other demographic and classroom
factors affecting reading outcomes. Table 7 describes school and non-school-level factors
outside of gender and region of origin (discussed above) that were shown to be significantly
associated with higher or lower ORF scores in English and Filipino. These characteristics
came from the student context questionnaire (self-reported) and classroom snapshot
(assessor’s observation) instruments, which were then run through simple linear regression
analysis.20
These are the factors that were associated with statistically significant differences
in oral reading fluency. The last two columns of the table show the magnitude of the
difference for children who had the characteristic compared to children without the
characteristic. For example, we can say that a child who attended Kinder before grade 1 is
likely to read 12 words per minute more in English and Filipino than a child who did not
attend Kinder; furthermore, 81% of children in our sample had attended Kinder.
Table 7: Factors associated with reading achievement in English and Filipino
Difference in mean ORF scores for students in each
category
Characteristic % of population
affected English Filipino
Factors positively associated with reading
High socioeconomic status (SES) score * 10% 20 18
Attended Kinder before grade 1 81% 12 12
Has reading textbook at home 79% 8 9
School participates in ECARP 49% 6 8
Teacher often asks the child to read aloud 27% 9 8
Teacher assigns reading homework 79% 8 7
Child has nonschool books at home 45% 8 7
Factors negatively associated with reading
If classroom is multigrade 11% -9 -10
19 Cao (2009), Literacy boost assessment. 20 As noted above, all instruments can be found in the separate methodology report for this study.

Characteristic
If teacher assigns no homework (English or Filipino) **
Missed 2, 3, or 5 days of school last week
Is over-age
Takes more than an hour to get to school
* For SES, the questionnaire asked whether the child had certain items at home tsuch as television, interior toilet, car, etc. For analysis, these child had, regardless of which ones they were, as an indicator of wealth may not be equally valid in urban and rural settings so the results should be read with caution.
** Note that the actual numbers reported in these categories were small, as indicated band N=33 for ‘assigns no homework’ and ‘takes more than an hour to get to school’statistical significance is present, the association should be read with caution.
Of particular interest is the magnitude of differences caused by factors that negatively
affected reading. Additionally, some of
grade 3—affected a large proportion
the Philippines is 8 or 9 years old;
grade 3, and they scored 14–15 words per minute less in
than children who were the appropriate age.
Socioeconomic status also was corre
basic indicators of wealth; however,
by students of objects they have in the home. These objects, such as
television, computer, may indicate wealth in certain populations
example, in metro Manila it would not be uncommon for a poor family living in the slums to
have access to a electricity). Interestingly, class size was not significantly correlated with
reading achievement in any language in this study in
factors are discussed in further detail, by language, in Section III.
For a complete description of the sample
Practicing EGRA administration during
Difference in mean ORF scores for students in each
category
% of population affected English
If teacher assigns no homework (English or 4% -14
or 5 days of school last week 27% -12
32% -15
than an hour to get to school ** 2% -20
* For SES, the questionnaire asked whether the child had certain items at home that are associated with wealth, such as television, interior toilet, car, etc. For analysis, these were reduced to a value of how many total items the
rdless of which ones they were, and this became a proxy for wealth. However, using these items as an indicator of wealth may not be equally valid in urban and rural settings so the results should be read with
Note that the actual numbers reported in these categories were small, as indicated by the percentages. N=83for ‘assigns no homework’ and ‘takes more than an hour to get to school’, respectively. So although
he association should be read with caution.
ticular interest is the magnitude of differences caused by factors that negatively
, some of the factors—for example, the age of children in
a large proportion of the population. The expected age of a grade
the Philippines is 8 or 9 years old; nearly a third of the children were 10 years old or above
15 words per minute less in English and Filipino reading fluency
re the appropriate age.
correlated with reading achievement in an initial review of
basic indicators of wealth; however, the measurement is a rough estimate based self reports
of objects they have in the home. These objects, such as electricity, car,
television, computer, may indicate wealth in certain populations but not in others (for
example, in metro Manila it would not be uncommon for a poor family living in the slums to
Interestingly, class size was not significantly correlated with
reading achievement in any language in this study in grade 3 or in grade 1. These and other
discussed in further detail, by language, in Section III.
or a complete description of the sample characteristics, see Annex 1.
Practicing EGRA administration during assessor training, January 2013. Photo: S. Pouezevara.
Difference in mean ORF for students in each
category
Filipino
-16
-13
-14
-19
hat are associated with wealth, many total items the
However, using these items as an indicator of wealth may not be equally valid in urban and rural settings so the results should be read with
y the percentages. N=83 . So although
ticular interest is the magnitude of differences caused by factors that negatively
for example, the age of children in
grade 3 child in
re 10 years old or above in
reading fluency
lated with reading achievement in an initial review of
the measurement is a rough estimate based self reports
car,
but not in others (for
example, in metro Manila it would not be uncommon for a poor family living in the slums to
Interestingly, class size was not significantly correlated with
These and other
2013. Photo: S. Pouezevara.
Philippines EGRA Report – Final - 31 Aug., 2013 21
III. Outcome Details, by Language The data collected by this study from nearly 3000 children in two grades and three languages
resulted in a large body of data that can be analyzed in multiple ways, both for each language
an comparatively between languages. In an attempt to present the most important information
clearly yet comprehensively for this preliminary report, we have separated the discussion of
results by language; then within each language by subtest. For each language a broad
overview is presented of results and factors associated with the results. The discussion of
each subtest includes some item analysis as well as distribution of scores and discussion of
factors that resulted in large differences in real scores. Finally, some discussion and
conclusion for each language is offered before moving on to the next language or section.
Where interesting comparisons between the languages were found, they are addressed within
the discussion of the results. Section IV then concludes with some broad cross-language
findings and recommendations.
Filipino Results
Students presented reading stimuli in the Filipino language at the end of grade 3
demonstrated relatively high fluency and comprehension across subtests, with the exception
of letter-sound identification. The prevalence of zero scores was low, except for listening
comprehension, which registered more than 10% zero scores. Zero scores indicate children
who did not respond correctly to any stimuli. Some children obtained zero scores because
they just did not say anything at all, but we cannot know if they did not respond because they
could not, or because they were unwilling to do so.
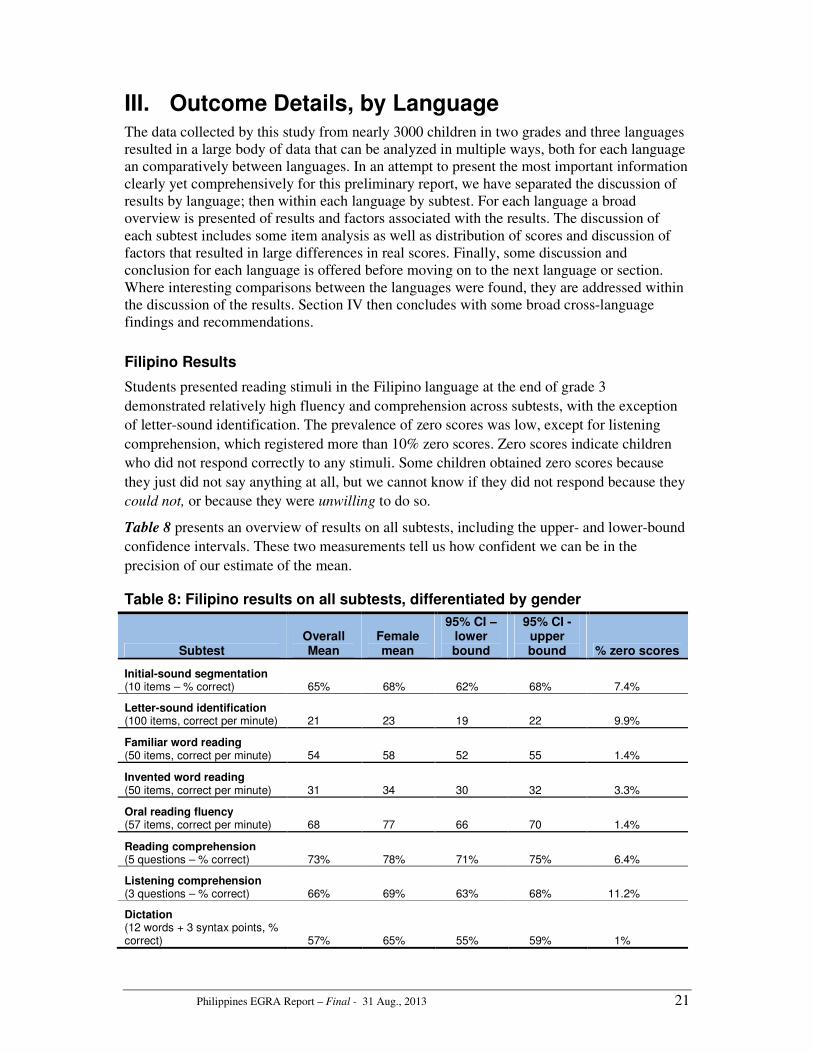
Table 8 presents an overview of results on all subtests, including the upper- and lower-bound
confidence intervals. These two measurements tell us how confident we can be in the
precision of our estimate of the mean.
Table 8: Filipino results on all subtests, differentiated by gender
Subtest Overall Mean
Female mean
95% CI – lower bound
95% CI - upper bound % zero scores
Initial-sound segmentation (10 items – % correct) 65% 68% 62% 68% 7.4%
Letter-sound identification (100 items, correct per minute) 21 23 19 22 9.9%
Familiar word reading (50 items, correct per minute) 54 58 52 55 1.4%
Invented word reading (50 items, correct per minute) 31 34 30 32 3.3%
Oral reading fluency (57 items, correct per minute) 68 77 66 70 1.4%
Reading comprehension (5 questions – % correct) 73% 78% 71% 75% 6.4%
Listening comprehension (3 questions – % correct) 66% 69% 63% 68% 11.2%
Dictation (12 words + 3 syntax points, % correct) 57% 65% 55% 59% 1%
Philippines EGRA Report – Final - 31 Aug., 2013 22
In addition to the low letter-sound identification mean score (21 letters per minute), it is
surprising that the listening comprehension mean percent score (66%) was lower than
reading comprehension mean percent score (73%), and that the percent of zero scores was
higher (11.2% vs. 6.4%, respectively).
The factors outlined above, in Section II, Outcomes Summary, also were found to influence
scores on all of these subtests. Specific, notable, changes in scores due to certain factors
appear in the next sections, which provide more details on each of these subtests. Unless
otherwise mentioned, all results pertaining to correlations are statistically significant with at
least p<0.05 (95%), but often with p<0.001 (99.9%).
Initial-sound segmentation
This subtest measured phonemic awareness (PA), or a general appreciation of the sound
structure of language, as demonstrated by the awareness of sounds at three levels of structure:
(1) syllables, (2) onsets and rimes, and (3) phonemes. A phoneme is the smallest
linguistically distinctive unit of sound in a word. The child was asked to repeat the first sound
he or she heard in a word pronounced by the assessor. The words used in the Filipino
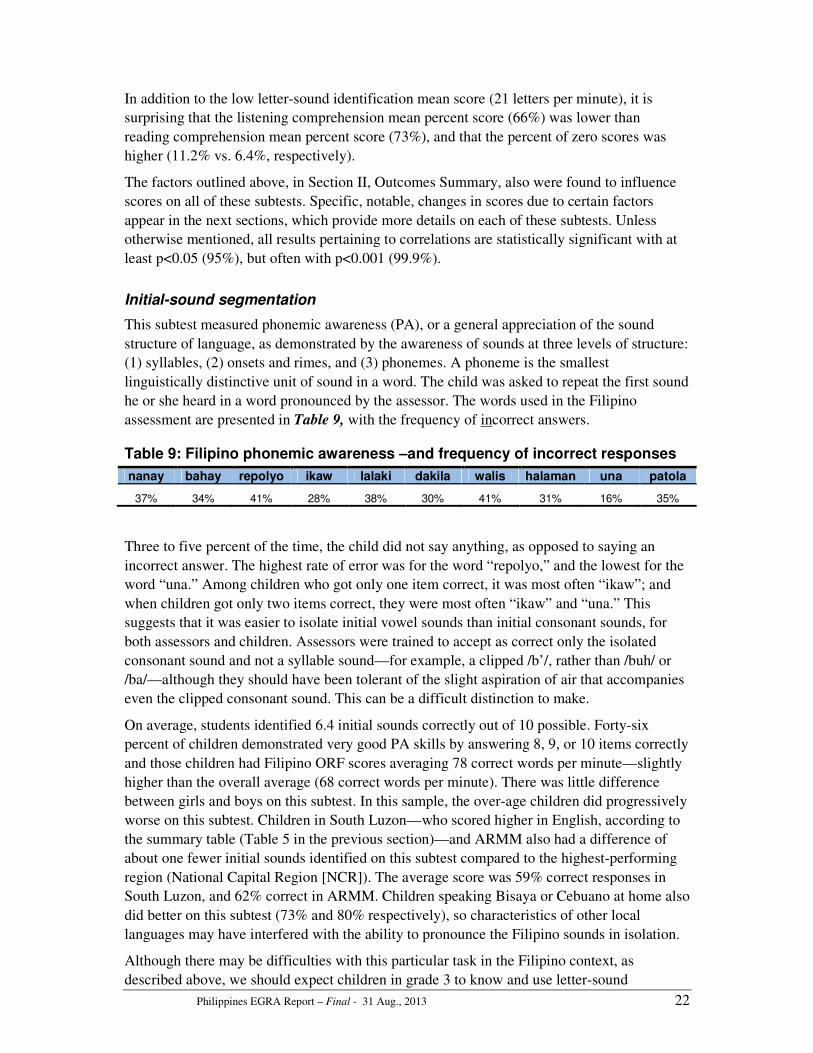
assessment are presented in Table 9, with the frequency of incorrect answers.
Table 9: Filipino phonemic awareness –and frequency of incorrect responses
nanay bahay repolyo ikaw lalaki dakila walis halaman una patola
37% 34% 41% 28% 38% 30% 41% 31% 16% 35%
Three to five percent of the time, the child did not say anything, as opposed to saying an
incorrect answer. The highest rate of error was for the word “repolyo,” and the lowest for the
word “una.” Among children who got only one item correct, it was most often “ikaw”; and
when children got only two items correct, they were most often “ikaw” and “una.” This
suggests that it was easier to isolate initial vowel sounds than initial consonant sounds, for
both assessors and children. Assessors were trained to accept as correct only the isolated
consonant sound and not a syllable sound—for example, a clipped /b’/, rather than /buh/ or
/ba/—although they should have been tolerant of the slight aspiration of air that accompanies
even the clipped consonant sound. This can be a difficult distinction to make.
On average, students identified 6.4 initial sounds correctly out of 10 possible. Forty-six
percent of children demonstrated very good PA skills by answering 8, 9, or 10 items correctly
and those children had Filipino ORF scores averaging 78 correct words per minute—slightly
higher than the overall average (68 correct words per minute). There was little difference
between girls and boys on this subtest. In this sample, the over-age children did progressively
worse on this subtest. Children in South Luzon—who scored higher in English, according to
the summary table (Table 5 in the previous section)—and ARMM also had a difference of
about one fewer initial sounds identified on this subtest compared to the highest-performing
region (National Capital Region [NCR]). The average score was 59% correct responses in
South Luzon, and 62% correct in ARMM. Children speaking Bisaya or Cebuano at home also
did better on this subtest (73% and 80% respectively), so characteristics of other local
languages may have interfered with the ability to pronounce the Filipino sounds in isolation.
Although there may be difficulties with this particular task in the Filipino context, as
described above, we should expect children in grade 3 to know and use letter-sound

correspondences to decode. The
these two skills.
Letter-sound identification
This subtest involved presenting the child with a grid made up of all of the letters of the
alphabet, in upper and lower case, in random order, an
with which they are found in the language. The child
letter makes in Filipino—not the name, but the sound.
provide any response at all, or made
subtest was timed to one minute and the result
sounds per minute. Knowledge of letter
powerful predictor of later reading fluency
orthographies like Filipino.22
Figure
scored within defined ranges of letter
percentages shown above each bar in the graph are the weighted percentages, while the
number shown in the vertical axis is the number sampled.
Figure 3: Filipino correct letter sounds per minute by range of correct words per minute
Almost 10% of the children discontinued the
(or any answer) to the first 10 letters
number of letters attempted was 32, so most children got a chance to identify all of the letters
of the alphabet, with the exception of x, z
Figure 4 shows the number of children who attempted each item and the proportion who
answered correctly or incorrectly.
the item answered incorrectly were: T, ng, p, b, y, g, j, h, q, w, c, and ñ.
proportions of correct responses usually
sounds are the same, so children who interpreted the
names got these answers correct anyway.
first 10 items, as required by the administration procedures
items attempted began to drop according to the rate of
21 Adams, M. J. (1990). Beginning to read: Thinking and learning about print.
Institute of Technology (MIT) Press. 22 A language has a “transparent orthography” when each l
10%
16%
26%
21%
0
100
200
300
400
500
600
700
Number of correct letter sounds per minute
The results for the next two subtests provide more insight on
presenting the child with a grid made up of all of the letters of the
alphabet, in upper and lower case, in random order, and repeating according to the frequency
with which they are found in the language. The child was asked to provide the sound that the
not the name, but the sound. If the child gave the name,
made an incorrect sound, the item was marked wrong. The
s timed to one minute and the result was a fluency calculation of correct letter
Knowledge of letter-sound correspondence has been shown to be a
reading fluency,21
particularly in languages with transparent
Figure 3 shows the number and percentage of children who
cored within defined ranges of letter-sound fluency (correct letter sounds per minute).
percentages shown above each bar in the graph are the weighted percentages, while the
number shown in the vertical axis is the number sampled.
rrect letter sounds per minute – distribution of responses per minute
lmost 10% of the children discontinued the subtest because they gave no correct answers
(or any answer) to the first 10 letters, resulting in a zero score for that subtest. The average
number of letters attempted was 32, so most children got a chance to identify all of the letters
, with the exception of x, z, and ñ, which appeared later in the item grid
shows the number of children who attempted each item and the proportion who
answered correctly or incorrectly. Items for which more than 40% of children who attempted
the item answered incorrectly were: T, ng, p, b, y, g, j, h, q, w, c, and ñ. Letters with higher
proportions of correct responses usually were vowels, probably because vowel names and
sounds are the same, so children who interpreted the subtest incorrectly and were giving letter
names got these answers correct anyway. We can see that all of the children attempted the
first 10 items, as required by the administration procedures; but thereafter, the total number of
p according to the rate of response.
Beginning to read: Thinking and learning about print. Cambridge, Massachusetts:
A language has a “transparent orthography” when each letter is associated with a unique sound, and vice versa.
21%
14%
7%
3%1% <1%
Number of correct letter sounds per minute
next two subtests provide more insight on
presenting the child with a grid made up of all of the letters of the
repeating according to the frequency
s asked to provide the sound that the
the name, did not
s marked wrong. The
a fluency calculation of correct letter
sound correspondence has been shown to be a
particularly in languages with transparent
of children who
sound fluency (correct letter sounds per minute). The
percentages shown above each bar in the graph are the weighted percentages, while the
distribution of responses
correct answers
The average
number of letters attempted was 32, so most children got a chance to identify all of the letters
later in the item grid.
shows the number of children who attempted each item and the proportion who
n who attempted
Letters with higher
vowels, probably because vowel names and
incorrectly and were giving letter
We can see that all of the children attempted the
the total number of
: Massachusetts
etter is associated with a unique sound, and vice versa.

Philippines EGRA Report – Final - 31 Aug., 2013 24
Figure 4: Performance on the first 50 Filipino letter sounds
We would expect that by grade 3, children would know letter names and sounds
automatically, without having to reflect or hesitate for an instant. In fact, this is the skill that
is required to become a fluent reader. At a rate of 1 letter per second—which is still relatively
hesitant—a child should be able to attempt at least 60 letters in a minute. With a 10% error
rate, that would still be a letter-sound fluency of 50 letters per minute. The average of this
group was only 21 correct letter sounds per minute. The rate of response (60 divided by the
number of items attempted, or 32, in this case) was almost one letter every 2 seconds, which
shows that either this skill had not been internalized, or children were uncomfortable with the
test procedure and were hesitant to answer. Children who answered more than 50 items
correctly averaged 91 words per minute on Filipino ORF, and 41 correct invented words per
minute, both of which were much higher than the national averages of 68 and 31,
respectively. In fact there was a correlation between automaticity of letter-sound recognition
and the more complex skills of decoding and reading connected text despite any potential
limitations to the test procedure (such as language interference, or assessor error—see section
“Limitations”, in Annex 2).
The scores on this subtest were not affected much by gender, age, or region. Statistically
insignificant differences of only three to five letter sounds emerged when the data were
disaggregated by various groups.
Familiar word reading
The Filipino familiar word subtest consisted of 50 words, in random order, presented on a
page of 10 rows of 5 words each. The words were selected based on their frequency in the
Filipino language, according to analysis and research provided by Filipino language
specialists. As with other timed subtests, the child was given a minute in which to read as
many words as possible (in the order that they appeared on the page). Incorrect answers or no
response at all were counted as incorrect, and the final result was a score of “correct words
per minute.” Children may have read these words through decoding, but we expected that
they would recognize them through prior experience with reading them in the classroom.
Fluent reading depends on progressing from decoding to acquiring automaticity in word
reading, and we should expect to see a higher reading fluency on the familiar word reading
subtest than on the nonword reading subtest.
0
500
1000
1500
2000
2500
a n k T m s ng p e b L n a d y g i n f r u a j i o h u q o w c V t R M z S E P D Y O L g B ñ F C n i
Incorrect Correct

Philippines EGRA Report – Final - 31 Aug., 2013 25
In fact, the average rate of fluency for this grade 3 national sample was 54 correct familiar
words per minute—slightly more for females (58) and much higher for children in Metro
Manila (62). Both fluency and accuracy were much higher for this subtest than for nonword
reading, judging by the low rate of error on the first 10 words, as shown in Table 10. More
than half of the children read all 50 words in the minute given for the subtest (the average
was 44 words attempted), and the average accuracy score (number of items correct out of
number of items attempted, regardless of time) was 86%.
Table 10: Filipino familiar word reading – items and frequency of incorrect responses (first 10 words)
halos kami pero gawa mo tawag sagot mabilis pa lamang
6% 4% 7% 4% 3% 5% 3% 4% 1% 5%
The only words for which more than 10% of the children who attempted the word read it
incorrectly were “kailangan” (14%) and “hangang” (14%). The word with the final “ng” also
proved difficult in the nonword reading subtest and the “ng” sound in the letter-sound
identification subtest also had a high rate of error. On the other hand, the words “lamang,”
“tanong” and “ang” did not have exceptionally high rates of error (i.e., under 5%);
explanation of these results could be the subject of discussion for teachers and linguists in
order to determine if there is a problem in the way this phoneme is taught, if there are
regional differences in the way the sound is pronounced, or if it is simply a limitation in the
way that assessors hear and score the word.
Over-age children in grade 3 were reading on average 48 familiar words per minute, and
children in ARMM or children in multigrade classrooms were reading 47 words per minute.
Children who were never asked to read aloud in class were at 46 words per minute on
average. Unlike the nonword reading subtest, familiar word reading fluency was more closely
related to home language. Children who reported speaking Tagalog or Filipino at home were
reading 57 correct words per minute. This is not much more than the average, but it is
statistically significant. Similarly, when the community language (as reported by school
directors) was Tagalog or Filipino, the average was 58 correct words per minute, possibly
reflecting the influence of community media and the print environment on familiar word
reading. Interestingly, Cebuano speakers scored even higher than the Tagalog or Filipino
speakers—58 cwpm. Where Tausug was listed as the community language, results were
much lower (43 cwpm).
Nonword reading
This subtest consisted of 50 words, in random order, presented on a page of 10 rows of 5
words each. The words were invented words, with no meaning in Filipino, but with word
structure (onset, rime, consonant clusters, etc.) that matched the actual orthography of the
language. Thus the words were plausible Filipino words, but we can be certain that the child
was attempting to read and decode them in Filipino for the first time. In other words, the
subtest measured decoding ability, an important skill for becoming a fluent reader. As with
other timed subtests, the child was given a minute in which to read as many words as possible
(in the order that they appeared on the page). Incorrect answers or no response at all were
counted as incorrect, and the final result was a score of “correct words per minute.” The first

Philippines EGRA Report – Final - 31 Aug., 2013 26
10 words of the subtest are provided in Table 11, with the percentage of incorrect responses
for each word. All children attempted the first five words.
Table 11: Filipino nonword reading – items and frequency of incorrect responses (first 10 words)
paw sibus pla nomi goong talis lat tahumu panwa ayt
8% 13% 20% 14% 29% 7% 5% 13% 10% 25%
The average number of words attempted was 36, and more than half of the sample read 39
out of 50 words. In all, 13% of the children attempted all 50 words, while 3.3% discontinued
the subtest because they read no items correctly out of the first 5 words. The average rate of
fluency (number of correct items read per minute) for grade 3 was 31—slightly more for
females (34). The average number of items correctly decoded (accuracy) was 61% (number
of correct items out of total attempted). Other patterns mentioned previously also were
present in this subtest: Metro Manila had the highest fluency at 36 cwpm, while Mindanao
and ARMM had the lowest fluency at 28 and 29 cwpm, respectively; over-age children,
children in multigrade classrooms, and children who did not attend Kindergarten before grade
1 all scored lower (on average 27 cwpm). Interestingly, children who said they speak Filipino
or Tagalog at home had only a slight advantage in this skill.
In order to read texts of increasing complexity, children will always face new words that they
must decipher using decoding skills. Therefore, this is one of the standard subtests in all
EGRA studies. The correlation to ORF is also clear: Children who read nonwords with
accuracy of 80% or more had an average Filipino ORF of 97 cwpm, while those reading with
accuracy of 20% or less had an average Filipino ORF of 16 cwpm.
Oral reading fluency (ORF)
The ultimate goal of reading instruction is not speed, but fluency—a measure of both rate and
accuracy—which is subsequently related to comprehension. A sufficiently high rate of
reading is important in order to free cognitive resources to focus on word meaning and
comprehension strategies; error-prone and hesitant readers apply their short-term memory
capacity in decoding and word identification and have little left for synthesizing the meaning
of the text from start to finish.
Thus, oral reading fluency was the summative outcome measure that provided an overall
picture of whether the child had learned and was able to apply the prereading and early-
reading skills described by the subtests above. For the familiar word reading subtest, words
were unrelated to one another and out of context. By contrast, this subtest asked children to
read a short story so that in addition to decoding and automatically recognizing words,
children also could draw inferences and anticipate words based on the context of the sentence
and story.
Filipino third graders were reading, on average, 68 words per minute, but with a wide
distribution of skills as shown in Figure 5. Nearly half (49%) of students were situated
around this mean, or between 50 and 90 cwpm, 26% of children read more than 90 cwpm,
and 25% less than 50 cwpm (weighted percentages).
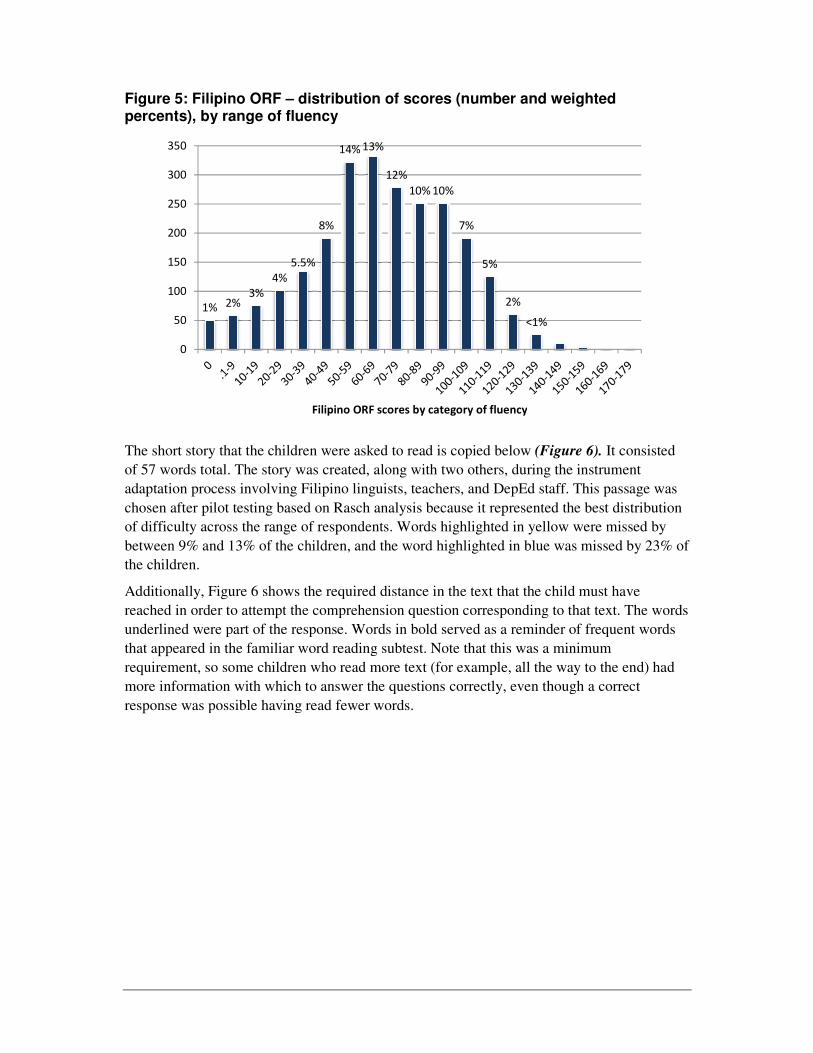
Figure 5: Filipino ORF – distribution of scorespercents), by range of fluency
The short story that the children were asked to read is copied below
of 57 words total. The story was created, along with two others, during the instrument
adaptation process involving Filipino linguists, teachers
chosen after pilot testing based on Rasch
of difficulty across the range of respondents.
between 9% and 13% of the children, and the
the children.
Additionally, Figure 6 shows the required distance in the text that the child must have
reached in order to attempt the comprehension question corresponding to that text. The words
underlined were part of the response
that appeared in the familiar word reading subtest.
requirement, so some children who read more text (for example, all the way to the end)
more information with which to answer the questions correctly, even though a correct
response was possible having read fewer words.
1% 2%3%
4%
5.5%
8%
0
50
100
150
200
250
300
350
Filipino ORF scores by category of fluency
distribution of scores (number and weighted , by range of fluency
The short story that the children were asked to read is copied below (Figure 6). It consisted
words total. The story was created, along with two others, during the instrument
adaptation process involving Filipino linguists, teachers, and DepEd staff. This passage was
ilot testing based on Rasch analysis because it represented the best distribution
of difficulty across the range of respondents. Words highlighted in yellow were missed by
and 13% of the children, and the word highlighted in blue was missed by 23% of
shows the required distance in the text that the child must have
e comprehension question corresponding to that text. The words
part of the response. Words in bold served as a reminder of frequent words
in the familiar word reading subtest. Note that this was a minimum
children who read more text (for example, all the way to the end)
more information with which to answer the questions correctly, even though a correct
possible having read fewer words.
8%
14% 13%
12%
10% 10%
7%
5%
2%
<1%
Filipino ORF scores by category of fluency
(number and weighted
It consisted
words total. The story was created, along with two others, during the instrument
and DepEd staff. This passage was
nalysis because it represented the best distribution
ords highlighted in yellow were missed by
missed by 23% of
shows the required distance in the text that the child must have
e comprehension question corresponding to that text. The words
a reminder of frequent words
s a minimum
children who read more text (for example, all the way to the end) had
more information with which to answer the questions correctly, even though a correct

Philippines EGRA Report – Final - 31 Aug., 2013 28
Figure 6: Filipino ORF text
As indicated by the shaded words above, only five words were missed by noticeably more
children than the other words—between 9% and 23%. As noted, the word “isigang” was the
most frequently missed word. However, it is important to note that most of these frequently
missed words were key for answering the comprehension questions correctly. During the
instrument adaptation process, the technical team was careful to work with linguists and then
regional language speakers to ensure that all words were common across all regions. The
word “isigang” is a particular way to prepare fish, and it may be that despite this review, in
some areas of the country, this particular dish is uncommon or referred to by a different term.
Again, factors consistently associated with higher or lower scores included gender, region,
age, and type of classroom (multigrade or not; see Section II, Outcomes Summary, for more
details). Note that the characteristic of “being over age” was calculated by grouping children
into one of two categories: (1) child was 10 years or older, or (2) child was 8 or 9 years old.
The difference between the means of these two groups was 14 words per minute in favor of
children who were not over-age. However, this mean masks even larger differences in age
ranges when they are not grouped together. For example, a 10-year-old or 11-year-old in
grade 3 on average read 15.5 fewer words of connected text per minute than an 8-year-old; a
12-year-old in grade 3 on average read 19 fewer words per minute; and a 13-year-old on
average read 27 fewer words per minute. Figure 7 shows the difference in mean Filipino
ORF scores for children in different age groups, as well as the percentage of the population in
each age category.

Figure 7: Filipino ORF scores for children who
*** Statistically significant to the p<.001 level
Reading prosody
In the Philippines, for the first time,
in addition to comprehension. The reading passage that was used (see Figure 6) provides
several opportunities to read with expression by marking p
comma, by demonstrating a difference between direct and indirect speech, and by showing
expression indicated by an exclamation point (“Naku!”) or a question mark (“Puwede…?”).
The results are provided in Table
shows the number and percentage of students in that category, and the mean ORF for children
in that category. By definition, category 1 readers are slow readers. However, it is possible
for a fast reader to read without any
and does not suggest causality.
Table 12: Filipino prosody –
Level
1 Reads primarily word-by-word.phrases may occur—but these are infrequent and/or they do not preserve meaningful syntax.
2 Reads primarily in two-word phrases with some threegroupings. Some word-by-word reading may be present. may seem awkward and unrelated to larger context [i.e., punctuation] passage.
3 Reads primarily in three- or fourgroupings may be present. However, the majority of phrasing seems appropriate and preserves the syntax [i.e., punctuation] of the author. or no expressive interpretation is present.
4 Reads primarily in larger, meaningful phrase groups. Although some regressions, repetitions, and deviations from text may be present, these do not appear to detract from the overall structure of the story. Preservation of the author’s syntax is consistent.expressive interpretation.
Source: Adapted from Daane, M. C., Campbell, J. R., Grigg, W. S., Goodman, M. J., Oranje, A., & Goldstein, A Fourth-grade students reading aloud: NAEP 2002 special Department of Education, Institute of Education Sciences, National Center for Education StatisticsAssessment of Educational Progress (NAEP). Retrieved from http://nces.ed.gov/pubs
23.9% 45.4%
0
10
20
30
40
50
60
70
80
8^
Nu
mb
er
of
corr
ec
t w
ord
s p
er
min
ute
an
d w
eig
hte
d %
of
chil
dre
n in
ea
ch c
ate
go
ry
ORF scores for children who were over-age in grade
level; * statistically significant to the p<.05
In the Philippines, for the first time, the EGRA study team used a measure of reading prosody
The reading passage that was used (see Figure 6) provides
several opportunities to read with expression by marking pauses indicated by a period or a
a difference between direct and indirect speech, and by showing
indicated by an exclamation point (“Naku!”) or a question mark (“Puwede…?”).
Table 12. For each of the four categories of prosody,
the number and percentage of students in that category, and the mean ORF for children
category. By definition, category 1 readers are slow readers. However, it is possible
without any prosody, so this table only indicates the range of abilities
– distribution of scores
Definition N %
word. Occasional two-word or three-word but these are infrequent and/or they do not preserve
273 10%
word phrases with some three- or four-word word reading may be present. Word groupings
may seem awkward and unrelated to larger context [i.e., punctuation] 659 27%
our-word phrase groups. Some small groupings may be present. However, the majority of phrasing seems appropriate and preserves the syntax [i.e., punctuation] of the author. Little or no expressive interpretation is present. 997 42
Reads primarily in larger, meaningful phrase groups. Although some regressions, repetitions, and deviations from text may be present, these do not appear to detract from the overall structure of the story. Preservation of the author’s syntax is consistent. Some or most of the story is read with
487 21
Source: Adapted from Daane, M. C., Campbell, J. R., Grigg, W. S., Goodman, M. J., Oranje, A., & Goldstein, Agrade students reading aloud: NAEP 2002 special study of oral reading. NCES 2006-469. Washington, DC: U.S.
Department of Education, Institute of Education Sciences, National Center for Education Statistics (NCES), National Assessment of Educational Progress (NAEP). Retrieved from http://nces.ed.gov/pubsearch/pubsinfo.asp?pubid=2006469
45.4%
16.8% 6.7% 4.5%
9 10*** 11*** 12*Age of the grade 3 child (self-reported)
grade 3
used a measure of reading prosody
The reading passage that was used (see Figure 6) provides
auses indicated by a period or a
a difference between direct and indirect speech, and by showing
indicated by an exclamation point (“Naku!”) or a question mark (“Puwede…?”).
categories of prosody, the table
the number and percentage of students in that category, and the mean ORF for children
category. By definition, category 1 readers are slow readers. However, it is possible
the range of abilities
% Mean ORF
10% 25
27% 55
42% 77
21% 93
Source: Adapted from Daane, M. C., Campbell, J. R., Grigg, W. S., Goodman, M. J., Oranje, A., & Goldstein, A. (2005). Washington, DC: U.S.
, National earch/pubsinfo.asp?pubid=2006469
1.8%
13***
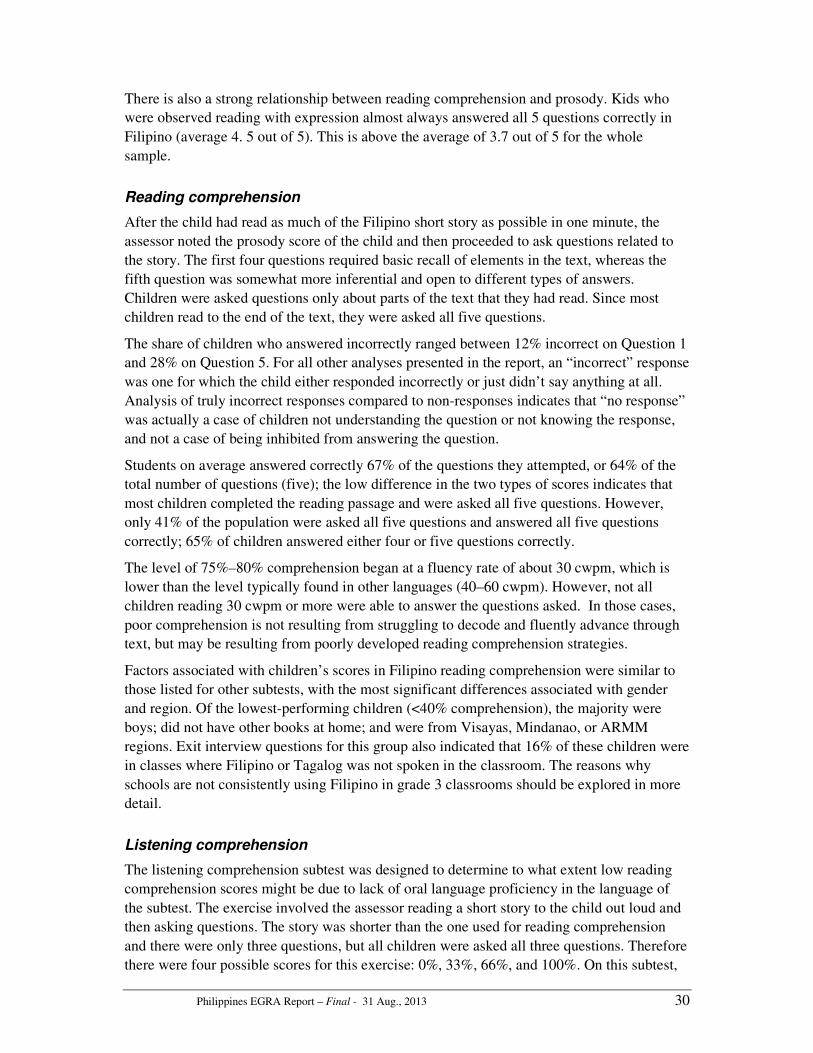
Philippines EGRA Report – Final - 31 Aug., 2013 30
There is also a strong relationship between reading comprehension and prosody. Kids who
were observed reading with expression almost always answered all 5 questions correctly in
Filipino (average 4. 5 out of 5). This is above the average of 3.7 out of 5 for the whole
sample.
Reading comprehension
After the child had read as much of the Filipino short story as possible in one minute, the
assessor noted the prosody score of the child and then proceeded to ask questions related to
the story. The first four questions required basic recall of elements in the text, whereas the
fifth question was somewhat more inferential and open to different types of answers.
Children were asked questions only about parts of the text that they had read. Since most
children read to the end of the text, they were asked all five questions.
The share of children who answered incorrectly ranged between 12% incorrect on Question 1
and 28% on Question 5. For all other analyses presented in the report, an “incorrect” response
was one for which the child either responded incorrectly or just didn’t say anything at all.
Analysis of truly incorrect responses compared to non-responses indicates that “no response”
was actually a case of children not understanding the question or not knowing the response,
and not a case of being inhibited from answering the question.
Students on average answered correctly 67% of the questions they attempted, or 64% of the
total number of questions (five); the low difference in the two types of scores indicates that
most children completed the reading passage and were asked all five questions. However,
only 41% of the population were asked all five questions and answered all five questions
correctly; 65% of children answered either four or five questions correctly.
The level of 75%–80% comprehension began at a fluency rate of about 30 cwpm, which is
lower than the level typically found in other languages (40–60 cwpm). However, not all
children reading 30 cwpm or more were able to answer the questions asked. In those cases,
poor comprehension is not resulting from struggling to decode and fluently advance through
text, but may be resulting from poorly developed reading comprehension strategies.
Factors associated with children’s scores in Filipino reading comprehension were similar to
those listed for other subtests, with the most significant differences associated with gender
and region. Of the lowest-performing children (<40% comprehension), the majority were
boys; did not have other books at home; and were from Visayas, Mindanao, or ARMM
regions. Exit interview questions for this group also indicated that 16% of these children were
in classes where Filipino or Tagalog was not spoken in the classroom. The reasons why
schools are not consistently using Filipino in grade 3 classrooms should be explored in more
detail.
Listening comprehension
The listening comprehension subtest was designed to determine to what extent low reading
comprehension scores might be due to lack of oral language proficiency in the language of
the subtest. The exercise involved the assessor reading a short story to the child out loud and
then asking questions. The story was shorter than the one used for reading comprehension
and there were only three questions, but all children were asked all three questions. Therefore
there were four possible scores for this exercise: 0%, 33%, 66%, and 100%. On this subtest,

Philippines EGRA Report – Final - 31 Aug., 2013 31
the average score was 66%—or two out of three questions; but 11% of students did score
zero. A closer look at the data reveals a correlation between reading comprehension and
listening comprehension of 0.43. On average, children who did better on listening
comprehension did have higher average reading comprehension scores, as shown in Table 13.
Table 13: Comparison of average reading and listening comprehension scores for Filipino
Listening comprehension score (no. correct out of 3 questions)
0/3 1/3 2/3 3/3
Average reading comprehension score
41% 66% 75% 85%
Again, a review of the difference between “no response” and “incorrect” responses suggests
that the zero scores are, in fact, children who did not understand the story or the question, as
opposed to children who just did not participate in the assessment by staying silent.
Children who reported speaking either Tagalog or Filipino at home had slightly higher scores
(76% and 77% respectively), but the same was true for children who reported speaking
Ilokano at home, so this is hard to explain, but other co-factors may have been at work here
that were independent of language. Children who reported speaking Cebuano, Bisaya, or
Tausug also had much lower scores—38%, 59%, and 51% respectively.
Other factors correlated with higher or lower scores were consistent with those mentioned
earlier—gender, region, age, socioeconomic status, teaching behaviors such as reading aloud,
etc. These factors are not intuitively linked to listening comprehension, so a more likely
explanation is that a group of students was struggling overall with school (possibly because
of compounding disadvantages), causing them to perform poorly on all aspects of the
assessment.
Dictation
The dictation subtest measures a combination of skills. The child must listen to a short
sentence read by the assessor, and then write it accurately on paper. Therefore “reverse”
decoding skills are required to transcribe the written sounds on paper. Automatic word recall
(as opposed to word recognition demonstrated by previous subtests) is also required for
common words like ‘ang’, ‘sa’, ‘na’. Listening comprehension and knowledge of vocabulary
and grammar are also necessary in order to choose the right word forms based on the
meaning of the entire sentence. The total number of words written reflects a type of writing
fluency, since children are given a limited amount of time in which to write the sentence (see
Annex 4 for more details about the dictation subtest and scoring mechanisms). Children are
also expected to use proper syntax and writing conventions such as capital letters and a
period.
The sentence used in the Filipino dictation exercise is the following:
Niligpit namin ang mga nagkalat na laruan at nagwalis kami sa kuwarto.
Words were scored as either ‘correct’ (1 point), ‘partially correct’ (.5 points) or
‘incorrect/missing’, for a total possible score of 12. There were also 3 points possible for

Philippines EGRA Report – Final - 31 Aug., 2013 32
including a capital letter, a period, and all spaces. A half point was given for having some
spaces present, but not all. The distribution of scores, excluding the capital, period and space
values, is provided in Figure 8, below.
Figure 8: Distribution of Filipino dictation scores
A total of 5.2% of students scored zero on this exercise, meaning they did not write anything
at all on the page, or all of the words written were incorrect. 19% of students got a perfect or
near perfect score (>11 points). 58% of children wrote at least 10 of the 13 words in the time
allowed, while the remainder wrote 9 or less (or none). 35% of children wrote correctly at
least 90% of the words they attempted, while 5% wrote correctly all of the words they
attempted23
. Although a small majority of children started the sentence with a capital letter
(53%), only 43% used all correct spacing, and only 15% ended the sentence with a period.
As in other subtests, girls perform better than boys, with a mean score of 8.5. Similarly,
children from wealthier families (mean=8.0), children living in Metro Manila (mean=8.5)
also do better than those in the lowest SES category or those living in other regions. Not
surprisingly, children have a much greater chance of succeeding on this task if they speak
Filipino or have Filipino reading materials at home.
Writing ability is also significantly associated with ORF scores (r2=.476), reading
comprehension and listening comprehension. Figures 9a and 9b, below, show the correlation
between reading and listening comprehension to accuracy in dictation (the number of words
written correctly out of the total number of words written; excludes missing words). For
example, children who answered all listening comprehension questions correctly—thus
demonstrating strong oral proficiency in the language—wrote 20% more words correctly than
their peers who answered no listening comprehension questions correctly.
23 The “correct” response is the form of the word that is written here. It is acknowledged that there may be more than one
acceptable variation for certain words such as “kuwarto”, but for the purposes of this assessment, only one form was
considered correct. See Annex 4 for more details about how words were scored.
0
5
10
15
20
25
30
0 .5 - 2 2.5 - 4 4.5 - 6 6.5 - 8 8.5 - 10 10.5 -
12
12.5 -
14
14.5 -
15
% o
f sa
mp
le i
n e
ach
ra
ng
e
Range of points earned
Including syntax points
Excluding syntax points

Philippines EGRA Report – Final - 31 Aug., 2013 33
Figures 9a and 9b: Relationship between Filipino dictation and comprehension
The scoring method distinguished not only between correct and incorrect transcriptions, but
also different types of writing errors. Two types of ‘partially correct’ responses were
distinguished as either having adequate phonological representation of the words, allowing it
to be plausibly deciphered as the word it is meant to be or being a homophone or otherwise
semantically acceptable word—spelled correctly—but used in place of the intended word.
For example, in the first category, “Anng” could be substituted for “ang” and be considered
partially correct. In the second category, “naman” could be substituted for “namin”. This
method provides broad insight into the types of errors present, and whether they are related to
some type of phonological deficiency related to oral language capacity or rather due to errors
in meaning and visual representations. Table 14, below, shows the four words with the most
frequent rate of error, and the type of error remarked.
Table 14: Frequently missed Filipino dictation words, by error type
Variations on incorrect spelling
Error type Missing
Incorrect- no resemblance to
the word
Correctly spelled, but wrong word
(i.e., homonym)
Spelled incorrectly, but
resembles word phonetically Correct
Niligpit 2% 30% 4% 9% 57%
nagkalat 27% 12% 15% 2% 62%
laruan 20% 11% 2% 28% 49%
kuwarto 28% 15% 1% 47% 12%
These 6 words were written incorrectly by more than 30% of the children. In the case of
‘laruan’ and ‘kuwarto’, the error was related to orthographic issues; that is, the student used
phonetically plausible spellings, but that violate normal rules. The word ‘kuwarto’ was
problematic because the ‘rule’ in this case is ambiguous or contested. Alternative spellings
given by students for this word include: kuarto, kwarto, kowarto, kwurto, cowarto, karto,
kuwalto, kuwartu, quarto, kwuarto, kawarto. For ‘laruan’, the alternatives given include:
larowan, laro-an, laroan, larwan, laran, laroun. Both of these words seem to cause difficulty
because of the u-(w)-a combination whose orthographic representation is not consistent.
While this type of error was also found with Niligpit (niligpet, niligppit, nilegpet, neligpet,

Philippines EGRA Report – Final - 31 Aug., 2013 34
linigpit, nilikpit, niligbet) and nagkalat (nagklt, nagklat, ngkalat, nangkalat), it was also
common to find that the required word was replaced with another correctly spelled word,
often through a morphological error like omitting or replacing the prefix (ligpit, iniligpit,
iligpit, liniligpit or nagkalat, kalat, makalat, magkalat).
Additional detailed linguistic analysis would be needed to distinguish between specific types
of spelling pattern or linguistic errors common to the Filipino language (i.e., omissions,
transpositions, morphological errors, etc.). This could further inform improvements in
instruction.
Summary of Filipino reading performance
To summarize, Filipino reading abilities at the end of grade 3 were strong for many children,
but 65% of children are not meeting the fluency and accuracy benchmarks. The extremes that
affected the overall averages were the high-performing children in Metro Manila and low-
performing children in ARMM and Mindanao. Socioeconomic status also was a factor—
probably also linked to regional differences (i.e., urban vs. rural; children in Manila also had
higher SES). While this survey was not meant to evaluate classroom practices directly, there
were some indications that Filipino was not being consistently used in the classroom to the
extent intended, and the regional variations may also be explained by a combination of
community, home, and school language usage that undermines Filipino competency. Other
more in-depth studies that measure the actual language use in the classroom may be of
interest to DepEd moving forward.24
What this EGRA study does show is how prereading skills contribute to later oral reading
fluency. Annex 5 provides specific details on subtests that are highly correlated to each
other. All of the skills measured by EGRA are also teachable skills, so it will be important to
ensure that children have a strong foundation in phonemic awareness and letter-sound
correspondence well before grade 3—and that they are distinguishing them correctly in
Filipino, English, and other local languages, all of which share the same alphabet but may
have different letter-sound correspondences and points of articulation. However, for future
grade 3 studies, it probably would be more informative to drop the phonemic awareness and
letter-sound tasks and instead focus on higher-order skills such as comprehension and
dictation. We were able to establish that children were decoding, and therefore had implicit
letter-sound knowledge; and that low-performing children most likely had other barriers to
learning other than lack of these basic skills. The key question remains whether or not the
children’s levels of reading fluency, as measured by this study, will be sufficient for
understanding and learning independently from a variety of academic texts. A future EGRA
might consider two reading and comprehension texts—one narrative and one expository—
and a comprehension method based on silent reading.
24 See, for example, results from Kenya and Uganda of a study using classroom observations of language and instructional
use: Piper, B. (2011). Kenya Early Grade Reading Assessment findings report. Prepared for the William and Flora Hewlett
Foundation under the program Monitoring of Learning Outcomes in Sub-Saharan Africa. Research Triangle Park, North
Carolina: RTI International and East African Development Consultants. Retrieved from
https://www.eddataglobal.org/countries/index.cfm?fuseaction=pubDetail&ID=275
Piper, B. (2010). Uganda Early Grade Reading Assessment findings report: Literacy acquisition and mother tongue.
Prepared for the William and Flora Hewlett Foundation under the program Monitoring of Learning Outcomes in Sub-
Saharan Africa. Research Triangle Park, North Carolina: RTI International and Makerere University Institute for Social
Research. Retrieved from https://www.eddataglobal.org/countries/index.cfm?fuseaction=pubDetail&ID=293

Philippines EGRA Report – Final - 31 Aug., 2013 35
The final graphic for this section, Figure 10, presents the percentile distribution of all of the
fluency subtests, which may be useful for DepEd in reviewing benchmarks and standards, or
eventually for teachers who conduct similar classroom-based measures and can see where
their children fall relative to the larger national population. These percentiles should not be
confused with percentage correct scores, nor do the units represent the same child’s scores on
the different subtests. The percentile distribution shows the number of correct items per
minute associated with each percentile ranking, with examples of where the 50th percentile
falls for each subtest. For example, the 50th percentile is defined by an ORF of 68 cwpm, 55
familiar words per minute, 34 invented words per minute, and 19 letter sounds per minute.
Figure 10: Filipino percentile distributions on all subtests
English Results
Children’s English reading ability closely matched Filipino reading ability, with the notable
exception that many fewer children were able to respond correctly to reading and listening
comprehension questions in English. Results from the nonword reading and dictation subtests
reconfirmed that children were decoding and encoding using letter-sound correspondences.
However, the simple transcription of the English phrase used in the dictation subtest often did
not correspond to the correct word choice or orthography, suggesting dependency on
memorizing sight words, but low grammar/vocabulary knowledge and self-monitoring
ability, stemming from a lack of exposure to English and poor oral language ability. These
results are discussed in more detail in the sections that follow.
Table 15 summarizes the English results on all subtests.
0
20
40
60
80
100
120
140
160
1 3 5 7 9 11 13 15 17 19 21 23 25 27 29 31 33 35 37 39 41 43 45 47 49 51 53 55 57 59 61 63 65 67 69 71 73 75 77 79 81 83 85 87 89 91 93 95 97 99
Letter sounds Correct words Invented words ORF

Philippines EGRA Report – Final - 31 Aug., 2013 36
Table 15: English results on all subtests disaggregated by gender
Subtest Overall Mean
Female mean
95% CI – lower bound
95% CI – upper bound
% zero scores
Initial-sound segmentation (10 items - % correct) 55% 57% 51% 58% 17%
Letter-sound identification (100 items, correct per minute) 22 24 21 24 6%
Familiar word reading (50 items, correct per minute) 51 55 50 53 2%
Nonword reading (50 items, correct per minute) 26 29 25 28 6%
Oral reading fluency (59 items, correct per minute) 67 75 65 69 1%
Reading comprehension (5 questions – % correct) 32% 39% 30% 34% 37%
Listening comprehension (3 questions – % correct) 33% 37% 30% 36% 45%
Dictation (13 words, + 3 grammar points - % correct) 54% 60% 52% 56% 4%
Similar to the results of the Filipino language assessment, girls did better on all subtests, and
this was statistically significant. There were also low percentages of zero scores on the
prereading skills tests, with the exception of initial-sound segmentation; and very high zero
scores on reading and listening comprehension. Almost half of the students answered all three
questions incorrectly (or provided no answer at all) on the listening comprehension subtest. It
is important to recall that each child participated in both the English assessment and the
Filipino assessment. The order in which the subtests were presented was alternated, so there
should be no measurement bias caused by one subtest always being the first or last. The
assessors were trained to be very careful about specifying which language each subtest was
in. For example, the script for the assessors contained the read-aloud instruction “Here is a
page full of words in English,” or “Please tell me the sound this letter makes in English.”
Each of these subtests is reviewed in more detail below. As described in Section II Outcomes
Summary, many factors were consistently associated with lower scores, including gender,
region of origin, socioeconomic status, language background, and classroom characteristics.
The English results were consistent with this pattern; therefore, it can be assumed that unless
otherwise noted, the same patterns were present within each subtest. When the real scores
varied dramatically from the mean, or when findings were otherwise unusual or notable—
such as relationships to language background—they are pointed out below. However,
absence of specific reference to the factors associated with performance on each subtest does
not mean they were not present.
Finally, the purpose and procedure of each subtest were described in the Filipino Results
section above, and are not repeated here. For further details about the EGRA test and
administration procedures, see the USAID EdData II project website: www.eddataglobal.org.

Philippines EGRA Report – Final - 31 Aug., 2013 37
Initial-sound segmentation
This English subtest followed the same procedure as in Filipino: The child was asked to
repeat the first sound in a given word. The words of the subtest are provided in Table 16,
with the frequency of incorrect answers.
Table 16: Items and percent of incorrect responses on English initial-sound segmentation (phonemic awareness) subtest
at so chalk very blue for man clap ear go
50% 33% 57% 41% 51% 25% 31% 48% 27% 41%
The average number of correct responses was 5.5 out of 10, compared to the Filipino mean of
6.5 out of 10—reflecting the higher percentage of zero scores. All children attempted the first
five items, but per the testing protocol, children who answered all of the first five questions
incorrectly discontinued the subtest. The reasons children had difficulty with this subtest may
have been related to unfamiliarity with the concept of phonemes as distinct from their co-
articulation with other vowels or blending with other consonants—for example, the first
sound in “blue” is not /bl/ but /b/ and the first sound in “man” is not /ma/ but “m.” Another
reason may have been the inability to correctly reproduce the sound; although assessors were
trained to be tolerant of regional accents, a child who answered that the first sound in the
word “chalk” is /sh/ would have been judged incorrect even if the “ch” sound was one that
was not present in the local language.
Girls did slightly better than boys on this subtest (4.5 percentage points); over-age children
scored almost 1 correct answer less on average. Interestingly, children from ARMM and
Mindanao—who scored lower on all of the Filipino subtests—did as well on this subtest as
children from Metro Manila, and children in Visayas had 1.5 more correct items than
counterparts in Manila. Children in communities for which Tagalog was listed as the
community language also scored much lower (46%). All of these findings most likely reflect
local language interference more than instructional deficiencies, except that as in other areas,
children who did not have homework assigned by their teacher also did worse on this subtest
(43% correct responses).
Letter-sound identification
Performance on letter-sound identification in English was very similar to the results for
Filipino: The average fluency rate was 22 correct items per minute, and the number of
children who attempted each item, as depicted in Figure 11, below, declined at a similar rate
for both languages. Although the data were not analyzed at the student level on a comparative
basis (i.e., does a given child miss both the Filipino letter and the English letter), it would be
possible, and the similarity in performance between the two languages suggests children may
not have been distinguishing at all between letter sounds in English and Filipino.
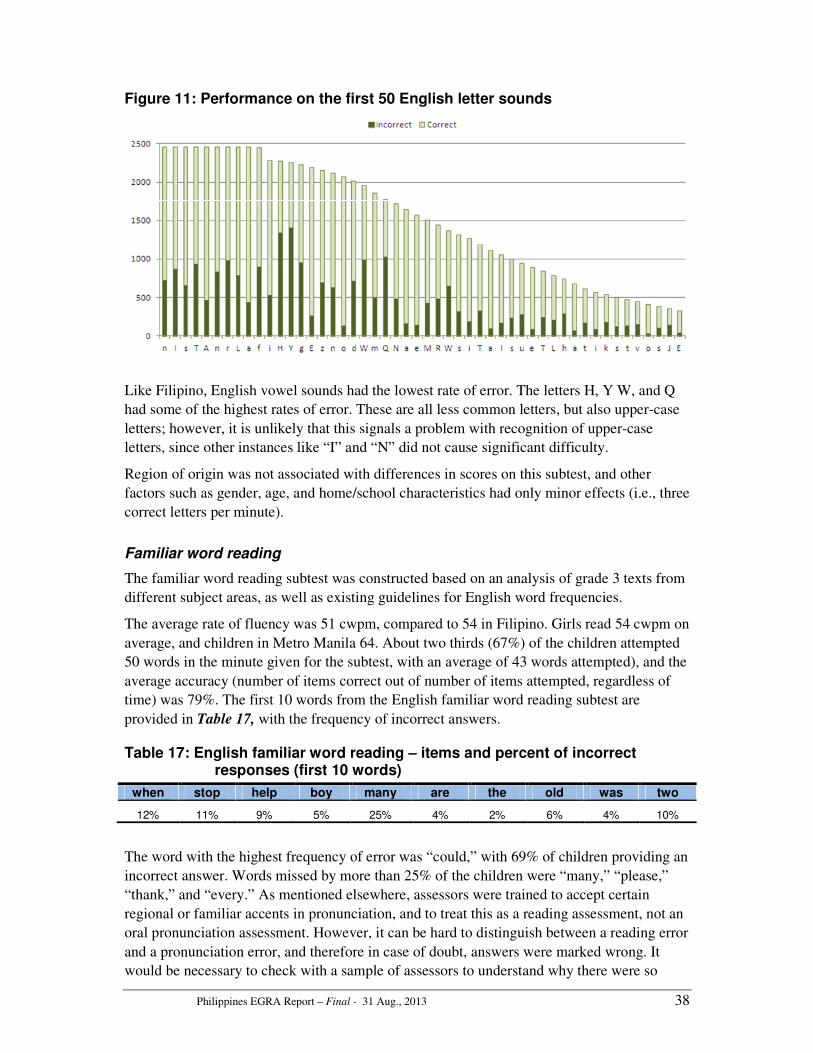
Philippines EGRA Report – Final - 31 Aug., 2013 38
Figure 11: Performance on the first 50 English letter sounds
Like Filipino, English vowel sounds had the lowest rate of error. The letters H, Y W, and Q
had some of the highest rates of error. These are all less common letters, but also upper-case
letters; however, it is unlikely that this signals a problem with recognition of upper-case
letters, since other instances like “I” and “N” did not cause significant difficulty.
Region of origin was not associated with differences in scores on this subtest, and other
factors such as gender, age, and home/school characteristics had only minor effects (i.e., three
correct letters per minute).
Familiar word reading
The familiar word reading subtest was constructed based on an analysis of grade 3 texts from
different subject areas, as well as existing guidelines for English word frequencies.
The average rate of fluency was 51 cwpm, compared to 54 in Filipino. Girls read 54 cwpm on
average, and children in Metro Manila 64. About two thirds (67%) of the children attempted
50 words in the minute given for the subtest, with an average of 43 words attempted), and the
average accuracy (number of items correct out of number of items attempted, regardless of
time) was 79%. The first 10 words from the English familiar word reading subtest are
provided in Table 17, with the frequency of incorrect answers.
Table 17: English familiar word reading – items and percent of incorrect responses (first 10 words)
when stop help boy many are the old was two
12% 11% 9% 5% 25% 4% 2% 6% 4% 10%
The word with the highest frequency of error was “could,” with 69% of children providing an
incorrect answer. Words missed by more than 25% of the children were “many,” “please,”
“thank,” and “every.” As mentioned elsewhere, assessors were trained to accept certain
regional or familiar accents in pronunciation, and to treat this as a reading assessment, not an
oral pronunciation assessment. However, it can be hard to distinguish between a reading error
and a pronunciation error, and therefore in case of doubt, answers were marked wrong. It
would be necessary to check with a sample of assessors to understand why there were so

Philippines EGRA Report – Final - 31 Aug., 2013 39
many errors on a word such as “many,” and if other errors were more often a case of
struggling to decode, total silence, or common mispronunciations due to language
interference (i.e., “thank” being pronounced as “tank”). Considering that the overall fluency
and accuracy were high, it probably was not a case of poor decoding or word recognition, and
a large proportion of the percentages shown in Table 17 above can be accounted for by the
general population of children in difficulty because of region and socioeconomic status.
Consistent with findings in Filipino, children in all regions outside of Metro Manila scored
below the national average in English, with ARMM being the lowest at 44 cwpm. Over-age
children also scored 44 cwpm on average, and children in multigrade classrooms, 42 cwpm.
The following familiar words also reappeared in the English oral reading fluency passage; the
rate of error is in parentheses after the word: “are” (5%), “going” (15%), “the” (3%), “play”
(3%), “where” (11%), “but” (14%), “two” (11%), “they” (3%).
Nonword reading
Nonword reading in languages with transparent orthographies usually measures decoding
through direct letter-sound correspondences. English is not a transparent language, and this
English subtest also measured knowledge of orthography rules such as the “silent e” that
changes a vowel sound from short to long. Therefore it is not surprising that nonword fluency
was lower and the number of zero scores higher in English than Filipino.
The average number of words attempted was 37, and more than half of the population read 41
out of 50 words. A third (32%) of the children attempted all 50 words, while in 6% of the
cases, the assessor discontinued the subtest because the child read no items correctly out of
the first five words. The average rate of fluency (number of correct items read per minute)
was 26—slightly more for females (29). Accuracy was 49% (number of correct items out of
total attempted). Therefore it is interesting that although the mean fluency scores for English
and Filipino were similar—26 and 31, respectively—in English, children were actually
reading faster, but with more errors. The first 10 words from the nonword subtest are
provided in Table 18, with the frequency of incorrect answers.
Table 18: English nonword reading – items and frequency of incorrect responses (first 10 words)
nale oad nat murst brish zom quith niph jaf fing
26% 34% 16% 44% 37% 36% 66% 48% 17% 17%
In addition to “quith,” “grike,” “onny,” the words “fute,” and “kise” had error rates of more
than 50%, but all of these latter words appeared after the 25th word in the subtest, when
about 20% of children had already discontinued.
Regional differences were not large, but where Tausug was recorded as the language of the
community, children scored much lower—15 cwpm on average. Note that only four children
out of the entire sample of nearly 2,500 children reported speaking English at home.
Oral reading fluency
Filipino third graders were reading English at an average of 67 cwpm; girls scored higher at
75 cwpm. As was the case with Filipino reading, the English EGRA yielded a wide range of
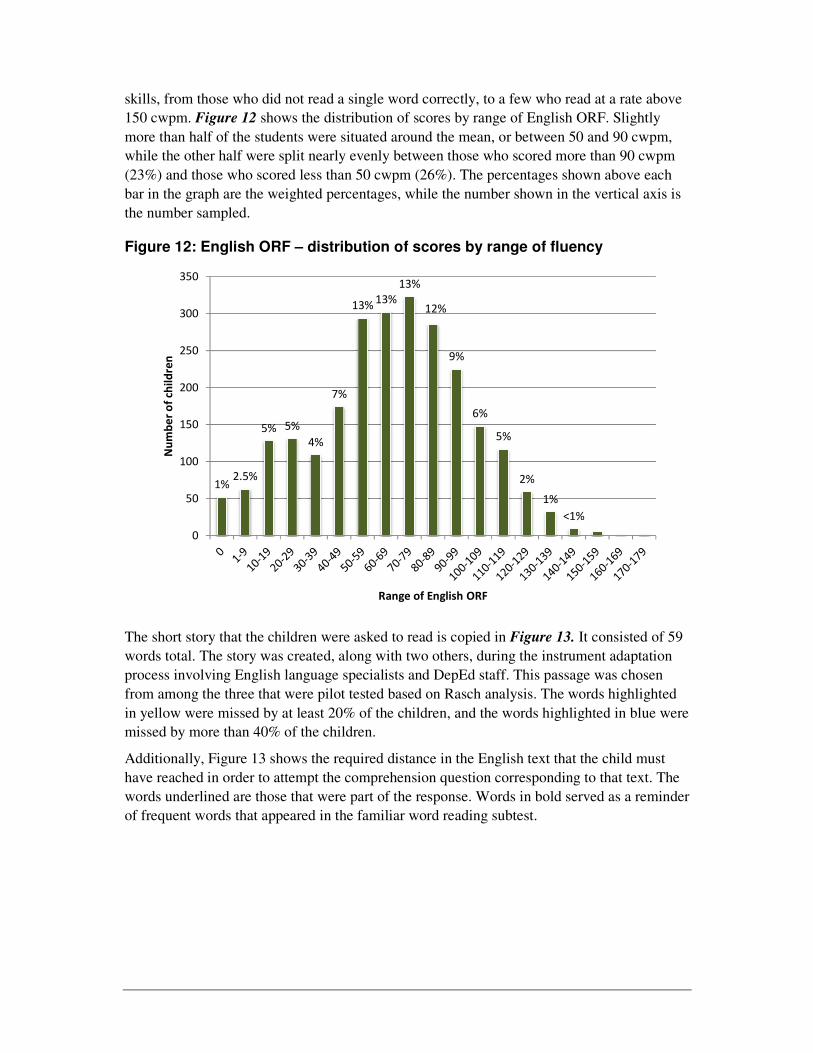
skills, from those who did not read a single word correctly, to a few who read
150 cwpm. Figure 12 shows the distribution of scores by range of
more than half of the students we
while the other half were split nearly evenly between those who score
(23%) and those who scored less than 50 cwpm (26%).
bar in the graph are the weighted percentages, while the number shown in the vertical axis is
the number sampled.
Figure 12: English ORF – distribution of
The short story that the children were asked to read is copied in
words total. The story was created, along with two others, during the instrument adaptation
process involving English language specialists and DepEd staff. This passage was chosen
from among the three that were pilo
in yellow were missed by at least
missed by more than 40% of the children.
Additionally, Figure 13 shows the required distance in the
have reached in order to attempt
words underlined are those that we
of frequent words that appeared in the familiar word reading subtest.
1%2.5%
5% 5%
4%
0
50
100
150
200
250
300
350
Nu
mb
er
of
chil
dre
n
from those who did not read a single word correctly, to a few who read at a rate
shows the distribution of scores by range of English ORF.
were situated around the mean, or between 50 and 90 cwpm,
nearly evenly between those who scored more than 90 cwpm
less than 50 cwpm (26%). The percentages shown above each
bar in the graph are the weighted percentages, while the number shown in the vertical axis is
distribution of scores by range of fluency
The short story that the children were asked to read is copied in Figure 13. It consist
words total. The story was created, along with two others, during the instrument adaptation
process involving English language specialists and DepEd staff. This passage was chosen
pilot tested based on Rasch analysis. The words highlighted
at least 20% of the children, and the words highlighted in blue were
missed by more than 40% of the children.
shows the required distance in the English text that the child must
the comprehension question corresponding to that text. The
were part of the response. Words in bold served as
in the familiar word reading subtest.
4%
7%
13%13%
13%
12%
9%
6%
5%
2%
1%
<1%
Range of English ORF
at a rate above
ORF. Slightly
re situated around the mean, or between 50 and 90 cwpm,
more than 90 cwpm
The percentages shown above each
bar in the graph are the weighted percentages, while the number shown in the vertical axis is
It consisted of 59
words total. The story was created, along with two others, during the instrument adaptation
process involving English language specialists and DepEd staff. This passage was chosen
ords highlighted
of the children, and the words highlighted in blue were
text that the child must
the comprehension question corresponding to that text. The
served as a reminder
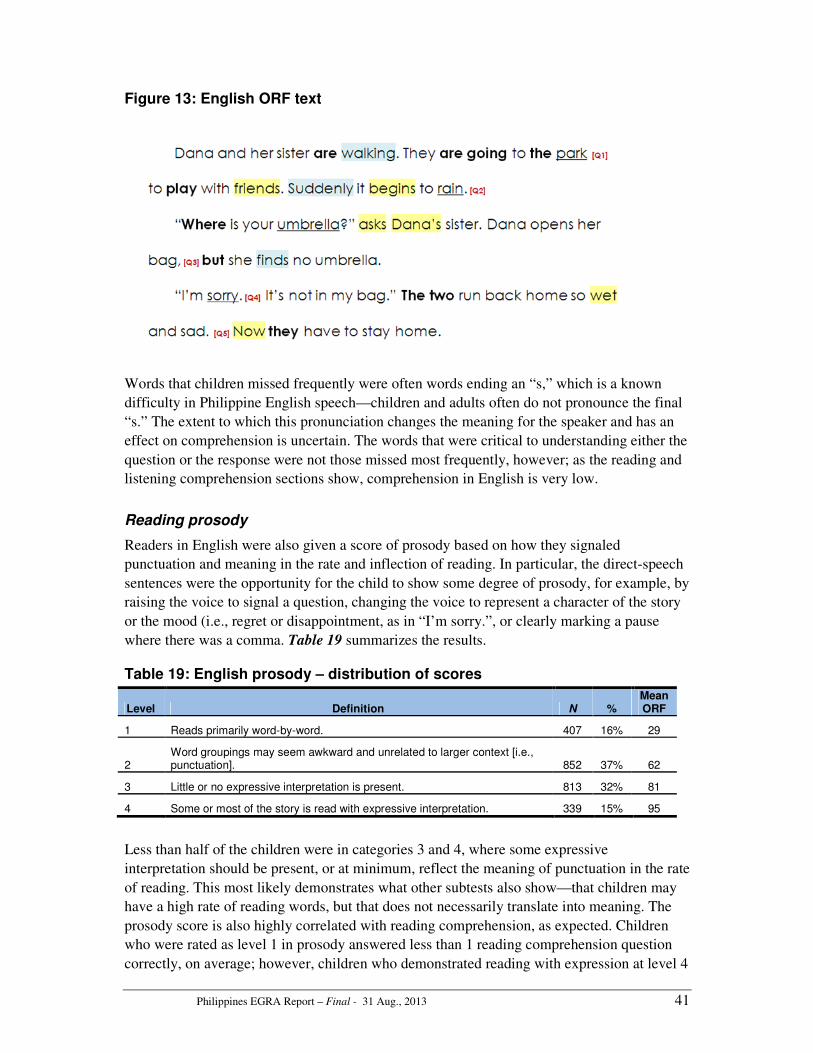
Philippines EGRA Report – Final - 31 Aug., 2013 41
Figure 13: English ORF text
Words that children missed frequently were often words ending an “s,” which is a known
difficulty in Philippine English speech—children and adults often do not pronounce the final
“s.” The extent to which this pronunciation changes the meaning for the speaker and has an
effect on comprehension is uncertain. The words that were critical to understanding either the
question or the response were not those missed most frequently, however; as the reading and
listening comprehension sections show, comprehension in English is very low.
Reading prosody
Readers in English were also given a score of prosody based on how they signaled
punctuation and meaning in the rate and inflection of reading. In particular, the direct-speech
sentences were the opportunity for the child to show some degree of prosody, for example, by
raising the voice to signal a question, changing the voice to represent a character of the story
or the mood (i.e., regret or disappointment, as in “I’m sorry.”, or clearly marking a pause
where there was a comma. Table 19 summarizes the results.
Table 19: English prosody – distribution of scores
Level Definition N % Mean ORF
1 Reads primarily word-by-word. 407 16% 29
2 Word groupings may seem awkward and unrelated to larger context [i.e., punctuation]. 852 37% 62
3 Little or no expressive interpretation is present. 813 32% 81
4 Some or most of the story is read with expressive interpretation. 339 15% 95
Less than half of the children were in categories 3 and 4, where some expressive
interpretation should be present, or at minimum, reflect the meaning of punctuation in the rate
of reading. This most likely demonstrates what other subtests also show—that children may
have a high rate of reading words, but that does not necessarily translate into meaning. The
prosody score is also highly correlated with reading comprehension, as expected. Children
who were rated as level 1 in prosody answered less than 1 reading comprehension question
correctly, on average; however, children who demonstrated reading with expression at level 4

Philippines EGRA Report – Final - 31 Aug., 2013 42
answered, on average, 3 reading comprehension questions correctly. The next section
describes the reading comprehension results in more detail.
Reading comprehension
Children were asked up to five questions related to the short story that they read (Figure 13
above), and the number of questions answered correctly was divided by five to get a score as
a percentage of correct responses out of the total possible. The average score was 32%.
Because children were reading, on average, at a rate of more than 60 cwpm, the majority
were asked all five questions. Of those asked all five questions, however, only 13% answered
them all correctly. This is equivalent to 3.5% of the entire sample when we factor in zero
scores. This is in sharp contrast to the 41% of children who answered all five questions
correctly in Filipino. 15% answered four or five questions correctly in English.
The low average reflects the high proportion of children who did not answer the questions
correctly, either because they did not say anything at all or because they gave an incorrect
response. Analysis of response types indicates that, compared to Filipino, a much larger
proportion of children provided no answer to all of the questions they were asked—in many
cases, even all five questions. This suggests that many students were reading with enough
fluency to be asked all five questions, but were inhibited from answering for some reason,
maybe because they did not understand the question that was asked. (Children who actually
said “I don’t know” were scored as “incorrect,” not “no response.”)
Question 5 (“Why were Dana and her sister sad?”) was the hardest, which was expected
because it was somewhat inferential, and several possible responses could have been correct.
Question 3 (“What was Dana looking for in her bag?) was the easiest, with the largest share
of children answering this question correctly.
Regardless of the number of questions a child attempted, the largest proportion of children
answered none correctly, with the exception of children who were asked five questions. The
largest proportion of children (27%) answered only one question, followed by children who
answered two out of five questions correctly (21%). This is the opposite of what we expected
to find, which is that as children acquire more fluency (and thus read to the end of the
passage and are asked more questions), they are also able to understand better and answer the
questions correctly. This indicates a notable problem with either accuracy or oral language
comprehension; in other words, children are decoding correctly or recognizing words by
sight, but they are not registering the meaning of those words.
Either case is probably due to lack of sufficient exposure to English in a variety of contexts
(spoken, written, heard), and possibly also a lack of experience with this type of activity.
Unfortunately, the subtest does not allow us to know whether the problem was listening
comprehension or reading comprehension; in other words, did the child understand the
question (asked orally by the assessor) but not know the response—a reading comprehension
problem—or did the child not understand the question and therefore could not respond—a
listening comprehension problem?
Consistent with other findings, English reading comprehension scores were lowest in ARMM
and Mindanao (25% and 28%, respectively), and higher than average in Visayas and Metro
Manila (38% and 40%, respectively), but even the highest average score for Metro Manila
was equivalent to only three out of five questions answered correctly.
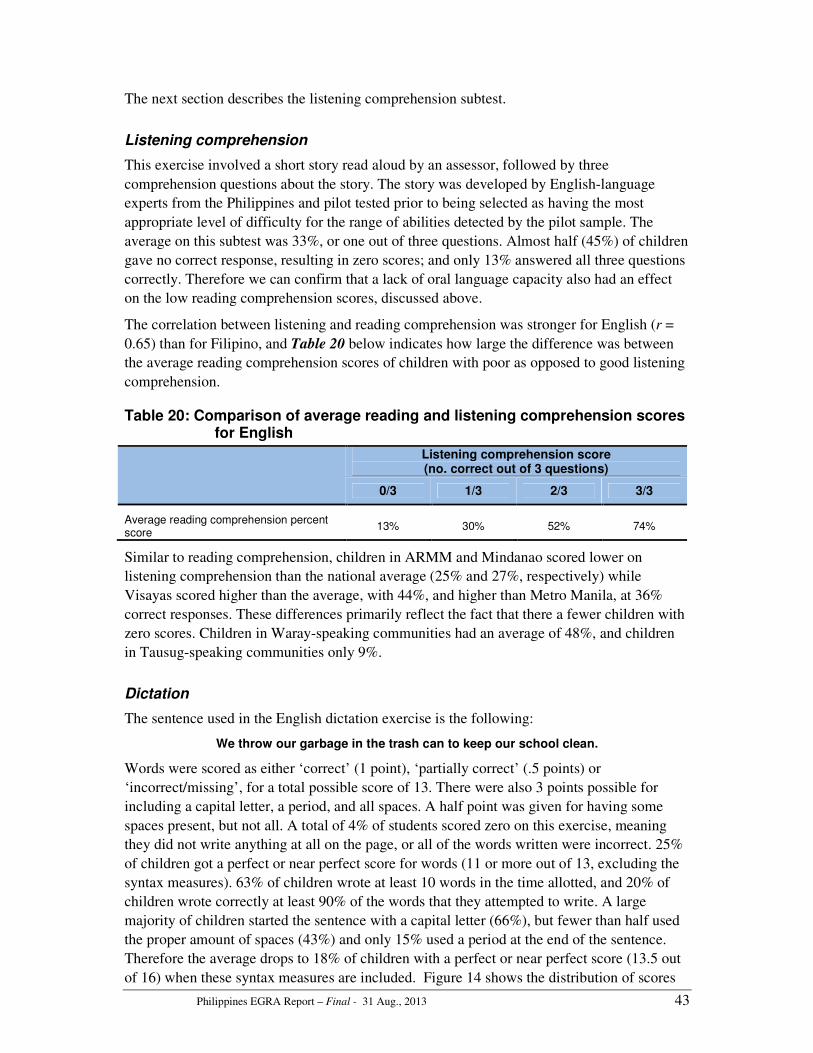
Philippines EGRA Report – Final - 31 Aug., 2013 43
The next section describes the listening comprehension subtest.
Listening comprehension
This exercise involved a short story read aloud by an assessor, followed by three
comprehension questions about the story. The story was developed by English-language
experts from the Philippines and pilot tested prior to being selected as having the most
appropriate level of difficulty for the range of abilities detected by the pilot sample. The
average on this subtest was 33%, or one out of three questions. Almost half (45%) of children
gave no correct response, resulting in zero scores; and only 13% answered all three questions
correctly. Therefore we can confirm that a lack of oral language capacity also had an effect
on the low reading comprehension scores, discussed above.
The correlation between listening and reading comprehension was stronger for English (r =
0.65) than for Filipino, and Table 20 below indicates how large the difference was between
the average reading comprehension scores of children with poor as opposed to good listening
comprehension.
Table 20: Comparison of average reading and listening comprehension scores for English
Listening comprehension score (no. correct out of 3 questions)
0/3 1/3 2/3 3/3
Average reading comprehension percent score
13% 30% 52% 74%
Similar to reading comprehension, children in ARMM and Mindanao scored lower on
listening comprehension than the national average (25% and 27%, respectively) while
Visayas scored higher than the average, with 44%, and higher than Metro Manila, at 36%
correct responses. These differences primarily reflect the fact that there a fewer children with
zero scores. Children in Waray-speaking communities had an average of 48%, and children
in Tausug-speaking communities only 9%.
Dictation
The sentence used in the English dictation exercise is the following:
We throw our garbage in the trash can to keep our school clean.
Words were scored as either ‘correct’ (1 point), ‘partially correct’ (.5 points) or
‘incorrect/missing’, for a total possible score of 13. There were also 3 points possible for
including a capital letter, a period, and all spaces. A half point was given for having some
spaces present, but not all. A total of 4% of students scored zero on this exercise, meaning
they did not write anything at all on the page, or all of the words written were incorrect. 25%
of children got a perfect or near perfect score for words (11 or more out of 13, excluding the
syntax measures). 63% of children wrote at least 10 words in the time allotted, and 20% of
children wrote correctly at least 90% of the words that they attempted to write. A large
majority of children started the sentence with a capital letter (66%), but fewer than half used
the proper amount of spaces (43%) and only 15% used a period at the end of the sentence.
Therefore the average drops to 18% of children with a perfect or near perfect score (13.5 out
of 16) when these syntax measures are included. Figure 14 shows the distribution of scores

Philippines EGRA Report – Final - 31 Aug., 2013 44
Figure 14: Distribution of English dictation scores
Words that were most often written correctly (by more than 50% of the children) are “we”,
“in”, “the”, “can”, “to”, “keep”, “our”, and “school” . Note, however that the word “our”
appears twice, and in the first instance, fewer than half of the children wrote it correctly. 30%
fewer children attempted the end of the sentence and so those who did were likely those who
spelled ‘our’ correct the first time as well. Also, it was common for students to write several
words as a unit, without a space; for example, “wethrow”/ “wetro”/ “werow”. In such cases,
the words were scored individually, as if there were a space, and then a point was taken off
during the grammar scoring. Therefore although the word “we” appears as a word that was
most often written correctly, it could be argued that it was really incorrect much more often
since it was not always separated as an individual unit. The same issue was found with the
words “trash can”, which were often written as one unit: “trashcan” / “trascan” / “traskan”,
etc. Annex 4 provides more information about the dictation scoring, including examples of
the variations in spelling that were found. For these four words in particular, the error types
are outlined in Table 21.
The words “throw”, “trash”, “our” and “garbage” were the words that children had the most
difficulty with. More than 40% of the children wrote these words incorrectly, according to
one of the variations described in Table 21, below.
Table 21: Frequently missed English dictation words, by error type
Variations on incorrect spelling
Error type Missing
Incorrect- no resemblance to
the word
Correctly spelled, but wrong word
(i.e., homonym)
Spelled incorrectly, but
resembles word phonetically Correct
throw 14% 20% 17% 33% 16%
trash 27% 17% 4% 30% 21%
our 21% 7% 16% 19% 37%
garbage 20% 17% 2% 24% 36%
Most often, incorrectly-written words were spelled using some close phonological
representation of the word (i.e., ‘whe’, ‘awer’, ‘tras’ or ‘trow’), often showing, as the latter
0
5
10
15
20
25
0 .5 - 2 2.5 - 4 4.5 - 6 6.5 - 8 8.5 - 10 10.5 -
12
12.5 -
14
14.5 -
16
% o
f sa
mp
le i
n e
ach
ra
ng
e
Total number of points earned
Including syntax points
Excluding syntax points

Philippines EGRA Report – Final - 31 Aug., 2013 45
two examples do, difficulty with phonemic awareness possibly stemming from inability to
hear or pronounce certain phonemes. This may be related to how well the assessors
themselves articulate certain phonemes such as the “the”, or to the fact that Filipino is a much
more transparent orthography with strong 1 to 1 correspondence between letters and sounds,
unlike English. On the other hand, there were also a lot of words spelled correctly, but it was
the wrong word in the context of the sentence. For example, for “our”, it was often written as
“are”, but we also found “or”, “ore”, “hour”, “ours”, “awe”, “aware”, “your” and even “how
were” or “awe were”. For “throw”, we found “true”, “through”, “trough”, “two”, “code”,
“crow”, “draw”, “flow”, “for”, “go”, “grow”, and “row”. This shows significant ability to
recall familiar words—even ones with complex spelling patterns—but lack of awareness of
the meaning of the word in context. This may suggest that teaching relies on memorizing
sight words, but lacks attention to meaning of words and the influence of grammar on word
choice.
Dictation is associated with oral reading fluency (r2=0.543), and with both reading and
listening comprehension. Children who demonstrated oral language ability by answering all
three listening comprehension questions correctly also wrote correctly 30% more of the
words which they attempted.
Figures 15a and 15b: Relationship between English dictation and comprehension
Thus the dictation exercise confirms much of what the other subtests show—that children are
learning to read English both phonetically or through recognizing sight words, but they are
not attaching meaning to the words in context. The structure of the dictation exercise asks the
children to listen to the sentence once, then to write it (with spaced repetition of the sentence
in 3-4 smaller chunks), then to listen to the sentence one more time to review and correct any
errors. Children did not exhibit strategies for self-monitoring and correction based on
knowledge of word meaning, even if receptive language processing and transcribing into
written word was relatively fluent. Additional detailed linguistic analysis would be needed to
distinguish between specific types of spelling pattern or linguistic errors common to the
Filipino language (i.e., omissions, transpositions, morphological errors, etc.). This could
further inform improvements to instruction.

Philippines EGRA Report – Final - 31 Aug., 2013 46
Summary of English reading performance
To summarize, English reading performance was nearly equivalent to Filipino reading
performance in terms of fluency, decoding, and accuracy of reading words in isolation, but
differed significantly in comprehension tasks where students scored much lower. Children
appear to have been only decoding or recalling words from memory, but without registering
their meaning. Similar to Filipino, there were important inequalities among children, with
some able to perform well above benchmarks, but others unable to demonstrate even pre-
reading skills by the end of third grade. The factors of socioeconomic status, age, gender,
region, and linguistic background all were consistently correlated with reading achievement,
as were certain school-level characteristics.
This assessment did not seek detailed information on teacher qualifications or teaching
strategies beyond a few self-reported questions from the children about whether teachers
engaged them in reading and speaking activities. It is important to remember that the
correlations reported here are not exhaustive, and there may be other school or teacher-level
factors with even more influence on reading outcomes than SES and language background.
According to a 2013 study by the National Educational Testing and Research Center
(NETRC) 25
, teachers’ English proficiency was rated low to moderate on measures of
“structure,” “written expression,” and “reading comprehension.” Only in Visayas, Ilocos,
NCR, and Cordillera Administrative Region (CAR) was teachers’ mean performance on the
Test of English Proficiency for Teachers (TEPT) rated moderate; these are the regions where
children in this study performed better than others. Visayas and Caraga regions also
surpassed the 75% minimum criterion in the NAT English reading comprehension test. As a
result of the data from the NAT and TEPT, and as reconfirmed here, DepEd recognizes the
need to strengthen teachers’ abilities to use English proficiently and to teach using the
language.
Based on the skills measured in this English EGRA, and the level of the actual items
(frequent words, simple narrative story, simple short sentence to write), it is unlikely that
these children will be prepared for independently learning higher-level academic content in
English without the continued scaffolding appropriate for second-language learners (or third-
language, in this case). Research by Thomas and Collier in the United States with English-
language learners found that students who had completed at least two to three years of
schooling in their L1 required five to seven years to reach the 50th percentile in English as L2
when taught in L2; students who completed no schooling in L1 required at least seven to ten
years, and students taught bilingually in L1 and L2 usually needed 4 to 7 years to catch up
with native English-speaking peers.26
Considering children in the Philippines have been
immersed in academic English for only 3 years, and few use English outside the home, it is
commendable that so many are actually meeting the fluency benchmarks, but if not
accompanied by comprehension, then these levels of fluency are of little use.
25 Data from the national studies reference in this paragraph come from a presentation, “Multi-Literacy and Numeracy
Program” (DRAFT). Personal Correspondence. April, 2013. 26 Please see the following: (1) Thomas, W. P., & Collier, V. P. (1997). School effectiveness for language minority students.
Washington, DC: National Clearinghouse for English Language Acquisition. Retrieved from
www.ncela.gwu.edu/ncbepubs/resource/effectiveness/index.html. (2) Thomas, W. P., & Collier, V. P. (2002). A national
study of school effectiveness for language minority students’ long-term academic achievement. Santa Cruz, California, and
Washington, DC: Center for Research on Education, Diversity & Excellence. Retrieved from
www.crede.ucsc.edu/research/llaa/l.l_final.html

Philippines EGRA Report – Final - 31 Aug., 2013 47
Figure 16 shows the percentile distributions for English measures of fluency. It tells us, for
example, that the 50th percentile is defined by an ORF of 69 cwpm, 53 familiar words per
minute, 27 nonwords per minute, and 20 letter sounds per minute. Recall from the Filipino
results section that these percentiles should not be confused with percentage correct scores,
nor do the units represent the same child’s scores on the different subtests. The percentile
distribution shows the number of correct items per minute associated with each percentile
ranking, with examples of where the 50th percentile falls for each subtest.
Figure 16: English percentile distributions on all subtests
Ilokano Results
The Ilokano assessment differed from the English and Filipino in several key areas:
• The sampling was purposeful, starting from selection of a subset of schools that had
reported to regional authorities that they started implementing Ilokano as the mother
tongue in the 2012 or 2011 school year. Within that sample, school and student
selection was random.
• Grade 1 children were assessed rather than grade 3.
• The initial sound segmentation (phonemic awareness) subtest was a different format,
and there were no dictation or prosody measurements.
Otherwise, the methodology was the same (see Section I, About the EGRA Tool, for more
details) and the sample of 500 children in 50 schools was large enough to draw inferences at
the regional level for schools that had been implementing Ilokano as language of instruction
and teaching reading in Ilokano.
The results show that average reading ability was still far from the established benchmark,
and there was a wide range of ability—from zero to +60 cwpm. Nearly half the children were
reading less than 10 cwpm on the oral reading passage, and the average was 18. As in the
English and Filipino results described in the previous sections, girls achieved higher average
scores than boys across all subtests, and girls outnumbered boys in the highest percentiles,
whereas boys outnumbered girls in the lowest percentiles. Table 22 summarizes the Ilokano
results across subtests, and the sections that follow provide more details on each subtest.
0
20
40
60
80
100
120
140
160
1 3 5 7 9 11 13 15 17 19 21 23 25 27 29 31 33 35 37 39 41 43 45 47 49 51 53 55 57 59 61 63 65 67 69 71 73 75 77 79 81 83 85 87 89 91 93 95 97 99
Co
rre
ct ite
ms
pe
r m
inu
te
Percentile
ORF Familiar words Letter Sounds Invented words

Philippines EGRA Report – Final - 31 Aug., 2013 48
Table 22: Ilokano results on all subtests disaggregated by gender
Subtest Overall Mean
Female mean
95% CI – lower bound
95% CI – upper bound
% zero scores
Differentiating initial sounds (10 items – % correct) 41.9% 41.8% 38.9% 44.9% 7.8%
Letter-sound identification (100 items, correct per minute) 14.5 16.7 12.3 16.8 9.2%
Familiar word reading (50 items, correct per minute) 21.6 25.7 18.4 24.7 20.2%
Nonword reading (50 items, correct per minute) 18.3 21.7 15.2 21.4 32.0%
Oral reading fluency (37 items, correct per minute) 18.2 21.9 15.47 20.91 17.0%
Reading comprehension (5 questions – % correct) 22.9% 27.2% 18.7% 27.1% 45.5%
Listening comprehension (3 questions – % correct) 45.4% 45.9% 41.5% 49.4% 17.8%
A high proportion of children scored “zero” on tests of higher-order reading skills, such as
decoding invented words, reading a short story, and comprehending what they read. The
following sections look in detail at the items and factors that may have been associated with
performance on each subtest, as well as relationships between subtests.
Differentiating initial sounds (phonemic awareness)
Recall that grade 3 children in English and Filipino were asked to isolate the first sound they
heard in a given word. Grade 1 children were given a different version of the subtest to
measure phonemic awareness skills; they were asked to repeat the word that began with a
different sound. That is, the assessor would say three common words: “Tasa, mita, mata—
which word begins with a different sound?” The correct response would be “tasa.” There
were 10 total questions. A child who did not answer any of the first five questions correctly
received a zero score and this subtest was discontinued. This was the case for fewer than 8%
of the children.
Table 23 provides an overview of the initial sound combinations for each of the 10 questions,
and the frequency of incorrect responses for each question. For example, the first question
included the words “baka,” “bulsa,” “kama.”
Table 23: Items and frequency of incorrect responses on Ilokano differentiating initial sounds (phonemic awareness) subtest
b-b-k m-a-m p-l-p d-t-t t-t-n s-s-d b-p-p g-s-s k-k-w l-t-l
48% 46% 68% 80% 34% 32% 85% 60% 35% 69%
Students demonstrated a wide range of ability on this subtest, with some items proving much
harder than others. It is important to note that on a test with this format, it would be possible
to get a score of 30% (3 of 10) just by, for example, always repeating the last word that the
assessor said without considering the beginning sound at all. Therefore the mean of 45% was
only slightly more than random guesswork. Figure 17 shows the distribution of scores from 0

to 10, and the percentages of the total sample that each category represents
the children were in the range of
children showing strong ability to differentiate between beginning sounds.
Figure 17: Distribution of Ilokano scores on (phonemic awareness) subtest
The next subtest, letter-sound identification, provide
which children were mastering letter sounds.
Letter-sound identification
According to the Ilokano K–12 competencies, children in
all of the letters of the alphabet, in both upper an
letters of the alphabet.” As described in earlier sections,
asking children to give the sound of the letters presented in random order on a page,
containing both upper- and lowercase letters.
The mean at the end of grade 1 wa
higher (16.7). On average, children attempted 29
seconds for the child to provide the letter sound,
46%. The first 30 letters on the page provided to the child included all of the letters of the
alphabet, with the exception of c, q, v, and x, so according to the goals of the MTB
curriculum, children should have
first 30 letters, and the proportion of correct and incorrect responses.
8%
3%
0
20
40
60
80
100
120
0 1
Nu
mb
er
of
chil
dre
n a
nd
we
igh
ted
%
tha
t th
is n
um
be
r re
pre
sen
ts
to 10, and the percentages of the total sample that each category represents. More than half of
re in the range of three to five correct answers, with only about 10% of the
lity to differentiate between beginning sounds.
: Distribution of Ilokano scores on differentiating initial sounds subtest
sound identification, provided more information about the extent to
mastering letter sounds.
12 competencies, children in grade 1 should be able to “Identify
all of the letters of the alphabet, in both upper and lower case,” and “Give the sounds of all
As described in earlier sections, this subtest measured this skill by
asking children to give the sound of the letters presented in random order on a page,
rcase letters.
was 14.5 correct letter sounds per minute, with girls slightly
On average, children attempted 29 letters, which means it took about
seconds for the child to provide the letter sound, but there was a high rate of error
The first 30 letters on the page provided to the child included all of the letters of the
alphabet, with the exception of c, q, v, and x, so according to the goals of the MTB
e known these by the end of grade 1. Figure 18 shows
first 30 letters, and the proportion of correct and incorrect responses.
8%
18%
21%
18%
10%
6% 5%
2%
2 3 4 5 6 7 8 9
Number of questions answered correctly
More than half of
, with only about 10% of the
differentiating initial sounds
more information about the extent to
1 should be able to “Identify
and “Give the sounds of all
this skill by
asking children to give the sound of the letters presented in random order on a page,
minute, with girls slightly
about two
a high rate of error—about
The first 30 letters on the page provided to the child included all of the letters of the
alphabet, with the exception of c, q, v, and x, so according to the goals of the MTB-MLE
shows the
1%
10

Figure 18: Performance on the first 30 Ilokano letter sounds
According to this item-level analysis, the
vowel sounds, but not consonants.
sounds and not consonants, or because children actually
the letter sounds (the names of vowels often overlap with the sound the letter makes, which is
not the case with consonants).
Familiar word reading
The list of familiar words included in
and teaching specialists from DepEd, based on frequent words in Ilokano reading materials
used by teachers and produced by DepEd.
tongue instruction specify that at the end of
automaticity 100 first grade high
not specifically defined, a good estimate is that it should take
read a word and transition to the next; this would be a fluency of 60 words per minute with
no errors, or 40–60 words with some errors.
read per minute in this study was 21
out of the first five, resulting in a zero score.
consider only the children who did complete the subtest and had some measurable skills, the
average increases to 27 correct words per minute.
by category of correct response, with weighted percentages represented
Figure 19: Ilokano familiar words minute
0%
20%
40%
60%
80%
100%
a i N g K R u
Pe
rce
nt
of
sam
ple
th
at
att
em
pte
d t
he
ite
m
20%
15.5%
0
20
40
60
80
100
0 1
2.1 7.2
Nu
mb
er
of
chil
dre
n a
nd
we
igh
ted
% t
ha
t th
is
rep
rese
nts
Range of correct familiar words per minute, and average ORF of children
ORF
erformance on the first 30 Ilokano letter sounds
level analysis, the majority of children succeeded at identifying
vowel sounds, but not consonants. This may be because of an instructional focus on vowel
s and not consonants, or because children actually were giving the letter names and not
the letter sounds (the names of vowels often overlap with the sound the letter makes, which is
The list of familiar words included in the Ilokano assessment were developed by language
and teaching specialists from DepEd, based on frequent words in Ilokano reading materials
used by teachers and produced by DepEd. The K–12 competencies established for
tongue instruction specify that at the end of grade 1, children should be able to “Read with
tomaticity 100 first grade high-frequency/sight words.” Although “with automaticity
not specifically defined, a good estimate is that it should take no more than one second to
read a word and transition to the next; this would be a fluency of 60 words per minute with
60 words with some errors. The average number of correct familiar words
was 21, but 20% of children couldn’t read one word correctly
, resulting in a zero score. If we exclude the zero scores from analysis and
consider only the children who did complete the subtest and had some measurable skills, the
correct words per minute. Figure 19 shows the distribution of scores
by category of correct response, with weighted percentages represented for each
Ilokano familiar words – distribution by range of correct words per
T A m S n P L d A b L ng o n H U f E Y j
Correct Incorrect
15.5%16.5%
13%15.5%
8.5%7%
3%<1%
1-9 10-19 20-29 30-39 40-49 50-59 60-69 70
7.2 15.6 24.8 33.5 40.4 47.8 56.5 59.4
Range of correct familiar words per minute, and average ORF of children
in each category
at identifying only
an instructional focus on vowel
giving the letter names and not
the letter sounds (the names of vowels often overlap with the sound the letter makes, which is
assessment were developed by language
and teaching specialists from DepEd, based on frequent words in Ilokano reading materials
etencies established for mother-
children should be able to “Read with
with automaticity” is
second to
read a word and transition to the next; this would be a fluency of 60 words per minute with
The average number of correct familiar words
children couldn’t read one word correctly
If we exclude the zero scores from analysis and
consider only the children who did complete the subtest and had some measurable skills, the
shows the distribution of scores
each category.
distribution by range of correct words per
G k w
<1%
70-79
59.4
Range of correct familiar words per minute, and average ORF of children
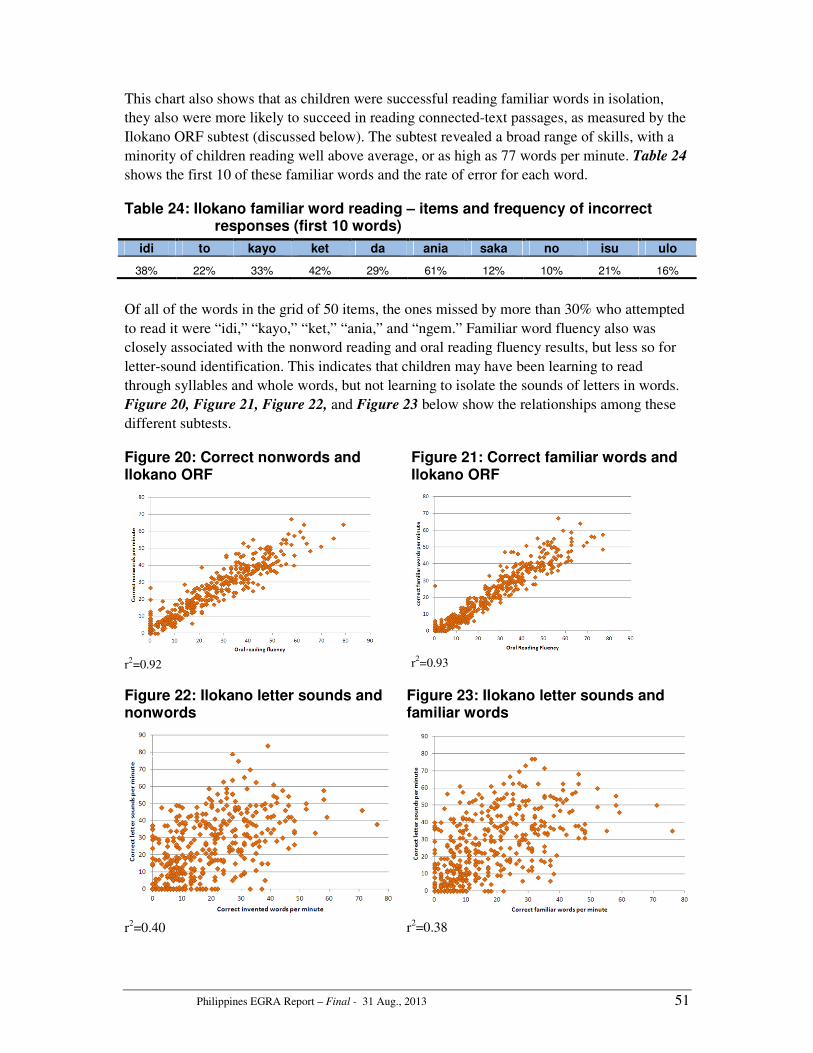
Philippines EGRA Report – Final - 31 Aug., 2013 51
This chart also shows that as children were successful reading familiar words in isolation,
they also were more likely to succeed in reading connected-text passages, as measured by the
Ilokano ORF subtest (discussed below). The subtest revealed a broad range of skills, with a
minority of children reading well above average, or as high as 77 words per minute. Table 24
shows the first 10 of these familiar words and the rate of error for each word.
Table 24: Ilokano familiar word reading – items and frequency of incorrect responses (first 10 words)
idi to kayo ket da ania saka no isu ulo
38% 22% 33% 42% 29% 61% 12% 10% 21% 16%
Of all of the words in the grid of 50 items, the ones missed by more than 30% who attempted
to read it were “idi,” “kayo,” “ket,” “ania,” and “ngem.” Familiar word fluency also was
closely associated with the nonword reading and oral reading fluency results, but less so for
letter-sound identification. This indicates that children may have been learning to read
through syllables and whole words, but not learning to isolate the sounds of letters in words.
Figure 20, Figure 21, Figure 22, and Figure 23 below show the relationships among these
different subtests.
Figure 20: Correct nonwords and Ilokano ORF
r
2=0.92
Figure 21: Correct familiar words and Ilokano ORF
r
2=0.93
Figure 22: Ilokano letter sounds and nonwords
r2=0.40
Figure 23: Ilokano letter sounds and familiar words
r2=0.38

Nonword reading
Grade 1 children read, on average, 18 correct
lower than for familiar words; girls read 22 correct
very high rate of zero scores on this subtest, and the mean accuracy score (correct items out
of items attempted) was 35%. Figure
correct words per minute, including zero scores.
children in each range. For example, children who
per minute had a score of 4 cwpm on the oral reading fluency measure to be discussed later.
Once again, we find a range of scores, from little
more than 40 cwpm. The reasons for the range of scores
next section—oral reading fluency
Figure 24: Ilokano nonword reading words per minute
Oral reading fluency
The Ilokano reading passage followed the same format as the
subtests, but it was shorter, with only 47 words. It is important to recognize that Ilokano is an
agglutinative language, meaning words are formed by combining morphemes (small units of
meaning) to change a word’s meaning to signify
reason, many Ilokano words are very long. The average word length of this story was
letters, but some words were as long as 12 letters.
was used. Words in bold also appeared in the
highlighted in yellow (e.g., “bimmangonda,
who attempted to read them, and words highlighted in
those who attempted them. All children attempted the first
discontinued for any child who did not p
The average number of correct words per minute on this subtest was
of words attempted was 24.5, while the average accuracy rate was 40%.
32%
12%
15%
0
20
40
60
80
100
120
140
160
180
0 1-9 10
0.9 4.0 10.4
Nu
mb
er
of
chil
dre
n a
nd
we
igh
ted
%
rep
rese
nte
d b
y t
his
nu
mb
er
Range of correct nonwords per minute and average ORF
ORF
, on average, 18 correct nonwords per minute, which was only slightly
familiar words; girls read 22 correct nonwords per minute. There was also a
very high rate of zero scores on this subtest, and the mean accuracy score (correct items out
Figure 24 shows the distribution of scores across ranges of
correct words per minute, including zero scores. Additionally, it shows the mean ORF for
children in each range. For example, children who correctly read between 1 and 9
4 cwpm on the oral reading fluency measure to be discussed later.
Once again, we find a range of scores, from little to no fluency at all, to children who read
more than 40 cwpm. The reasons for the range of scores are explored in more detail in the
oral reading fluency.
Ilokano nonword reading – distribution of scores by range of correct
The Ilokano reading passage followed the same format as the English and Filipino
, but it was shorter, with only 47 words. It is important to recognize that Ilokano is an
agglutinative language, meaning words are formed by combining morphemes (small units of
to change a word’s meaning to signify tense, possession, plurality, etc.
reason, many Ilokano words are very long. The average word length of this story was
letters, but some words were as long as 12 letters. Figure 25 shows the reading passage that
was used. Words in bold also appeared in the familiar word reading subtest. Words
bimmangonda,” “klase”) were missed by more than half of those
who attempted to read them, and words highlighted in blue were missed by 30% to
those who attempted them. All children attempted the first eight words; the subtest
discontinued for any child who did not provide a correct answer among the first
The average number of correct words per minute on this subtest was 18. The average number
of words attempted was 24.5, while the average accuracy rate was 40%.
15%
11%14% 10%
4%
<1%
10-19 20-29 30-39 40-49 50-59 60-69 70-
10.4 20.5 30.6 37.5 44.2 48.8 56.0
Range of correct nonwords per minute and average ORF
s only slightly
There was also a
very high rate of zero scores on this subtest, and the mean accuracy score (correct items out
shows the distribution of scores across ranges of
Additionally, it shows the mean ORF for
read between 1 and 9 nonwords
4 cwpm on the oral reading fluency measure to be discussed later.
to no fluency at all, to children who read
explored in more detail in the
distribution of scores by range of correct
English and Filipino ORF
, but it was shorter, with only 47 words. It is important to recognize that Ilokano is an
agglutinative language, meaning words are formed by combining morphemes (small units of
plurality, etc. For this
reason, many Ilokano words are very long. The average word length of this story was five
shows the reading passage that
Words
) were missed by more than half of those
% to 50% of
subtest was
rovide a correct answer among the first eight words.
18. The average number
-79
56.0

Philippines EGRA Report – Final - 31 Aug., 2013 53
Figure 25: Ilokano ORF text
Figure 26 further shows the rates of error on the first 30 words. While most children were
successful reading short, one- or two-syllable words like “a,” “ti,” “iti,” and “ni,” words with
multiple syllables proved much more difficult, and the words at the beginning of the passage
had a high rate of error. This naturally affected comprehension, which we will see in the next
section.
Figure 26: Grade 1 performance on Ilokano ORF subtest, first 30 words
The factors associated with low reading scores were similar to those found in the English and
Filipino data set, although this sample was not structured to capture differences based on
region or subregion.
• Girls performed better on all subtests except differentiating initial sounds (phonemic
awareness) and listening comprehension, and the difference was around 7 words per
minute faster in ORF, familiar words, and nonwords.
0
50
100
150
200
250
300
350
400
450
500
Na
sap
a
a
bim
ma
ng
on
da
To
ma
s
ke
n
Ro
be
rt.
um
un
a
ga
min
ng
a
ald
aw ti
kla
se
Inb
ag
a
ni
To
ma
s a
ma
bu
ten
g
isu
na
Sa
an
a a
ka
ya
t
iti
ma
pa
n
idia
y
esk
ue
la
ng
a
ag
ma
ym
ay
sa
Incorrect Correct

Philippines EGRA Report – Final - 31 Aug., 2013 54
• There were not as many over- or under-age children in the Ilokano classrooms, but
where 5- or 9-year olds were present in grade 1, their scores also tended to be lower.
• Children in multigrade classrooms averaged only 9.5 correct words per minute.
• Children who missed two or three days of school the week prior to the assessment
read 15 words per minute, compared to the average of 18.
• Children from wealthier homes, as measured by the wealth index (see note to Table 7
for explanation) or by the fact that the father was a professional or overseas foreign
worker and not an informal laborer or unemployed, also achieved higher ORF scores.
There were also some important findings regarding the language environment of the children
in the sample. Children who came from a Pangasinan-speaking household scored less than 8
words per minute. Also, children in classrooms where the teacher never read Ilokano stories
aloud, nor asked the children to read Ilokano stories aloud, scored under 12 words per minute,
compared to children in classrooms where the teacher often asked the children to read out
loud—where the average was 20 correct words per minute. Fortunately, less than 10% of
children reported “never” in these categories, but it is important to note that some classrooms
were not providing adequate support for early reading.
Additionally, as shown in Figure 20 through Figure 23 (scatterplots of relationships among
the Ilokano subtests), prereading skills such as automatic word recognition and letter-sound
correspondence were strongly correlated with reading fluency on a passage of connected text.
Although this relationship was not quite as linear for letter sounds as it was for familiar words
and nonwords, children who identified fewer than 20 correct letters per minute had an
average ORF of 12 cwpm. However, children reading more than 20 correct letters per minute
averaged 35 on Ilokano ORF. Similarly, children who did well on letter sounds and familiar
words also did better on reading comprehension.
Reading comprehension
Given the low reading fluency and high rate of error described in the above section, it is not
surprising that Ilokano comprehension levels were low, even if most children were reading in
their native language. If children struggle to process each word in a sentence, they will not
have sufficient cognitive resources for making meaning out of the text. The average reading
comprehension score was 23%, reflecting the low average reading fluency (18 cwpm). Only
four children in the entire sample (<1%) were asked all five questions and answered them all
correctly. As shown in the Figure 27 graph labeled “Comprehension Score,” the ability of
children to answer correctly all questions that they attempted increased as their ORF
increased. This pattern was more evident in Ilokano than in either English or Filipino (see
tables in Annex 3, particularly the column representing children who answered 100% of
questions correctly, according to how many they answered).

Philippines EGRA Report – Final - 31 Aug., 2013 55
Figure 27: Ilokano reading and comprehension data
The children who answered either four or five questions correctly read on average 44 correct
words per minute. Although speed is important, so is accuracy; therefore increased levels of
fluency are necessary, but not sufficient, for comprehension. To clarify this point, 57% of
children who read above 40 words per minute could not answer at least 4 out of 5 questions
correctly. This may have been due to accuracy issues—i.e., they didn’t understand one of the
key words in the story or in the question asked by the assessor—or they may have had low
oral language ability in Ilokano. As mentioned above, some children in this sample said they
did not speak Ilokano at home even though they had been placed in an Ilokano school. Or
they may have spoken Ilokano at home but the specific background knowledge required for
the story comprehension was not part of their habitual context. Additionally, all of the
children were very young (average age 6.6 years), and may have been inhibited for a variety
of reasons from answering questions, especially if this is something that is rarely asked of
them in class. In some cases (Questions 1, 2, 5) the instances of “no answer” were greater
than the instances of “incorrect” answers; however, there were also as many or more children
responding with correct answers. Therefore it is possible that some children in grade 1 were
acquiring and demonstrating reading and comprehension skills in Ilokano, but many other
children also were being left behind, for a combination of the reasons outlined above.
Listening comprehension
The listening comprehension subtest is a way of confirming whether or not children are
having difficulty with reading comprehension because of issues with oral language capacity.
The short story read to the children consisted of 38 words, including a dialogue between two
children. Three direct-recall questions were asked based on the story, so there were four
possible scores a child could get: 0%, 33%, 67%, or 100%. The average on the Ilokano
subtest was 45%, and there was no significant difference between boys and girls. The
distribution of scores is presented in Figure 28, with the weighted percentages for each
category.

Figure 28: Ilokano listening comprehension
Again, many children did not answer any questions correctly
Although not presented in graphic format in this section, fewer children gave no answer than
gave an incorrect answer for questions 1 and 2,
question 3. Therefore there is no reason to believe that incorrect answers were due to an
unwillingness to respond rather than inability to do so.
Figure 28 also shows that Ilokano
had a linear relationship to ORF—
cwpm on average while children who answered
correctly read 27 cwpm on average.
• A category of children was
factors—SES, absences, classroom practices, etc.
subtests of this assessment and probably across other subject areas
• Some children may have
did not speak Ilokano at home, or because of
pronunciation and vocabulary. There may also
use in the home versus in school and lack of background knowledge and vocabulary
required for answering listening comprehension questions.
• The Ilokano MTB-MLE program is not being
intensity and methods across schools, so some
getting more academic exposure to the language and possibly more opportunities to
engage in active listening and recall in the classroom.
• Implementation of the MTB
of teacher training, materials
teachers in these classrooms may
Ilokano or have given up trying and revert
approach.
18%
0
20
40
60
80
100
120
140
160
180
200
0Nu
mb
er
of
chil
dre
n a
nd
we
igh
ted
% t
ha
t
this
nu
mb
er
rep
rese
nts
Number of questions answered correctly and average ORF of
ORF 11
: Ilokano listening comprehension distribution of scores
t answer any questions correctly, resulting in a zero score
Although not presented in graphic format in this section, fewer children gave no answer than
gave an incorrect answer for questions 1 and 2, but more children gave no answer for
Therefore there is no reason to believe that incorrect answers were due to an
unwillingness to respond rather than inability to do so.
Ilokano listening comprehension scores, like many other subtests,
—children who answered no questions correctly read only
cwpm on average while children who answered three listening comprehension questions
cwpm on average. This suggests several possible explanations:
was in difficulty academically because of a combination of
SES, absences, classroom practices, etc.—and this affected them
subtests of this assessment and probably across other subject areas, too.
Some children may have had low oral language skills in Ilokano either because they
not speak Ilokano at home, or because of subregional differences in Ilokano
ation and vocabulary. There may also have been different styles of language
use in the home versus in school and lack of background knowledge and vocabulary
required for answering listening comprehension questions.
MLE program is not being implemented with the same degree of
intensity and methods across schools, so some of these children may have been
getting more academic exposure to the language and possibly more opportunities to
engage in active listening and recall in the classroom.
ementation of the MTB-MLE program has been inadequately carried out
of teacher training, materials, and ongoing support to teachers. As a result
in these classrooms may be struggling to provide reading instruction in
up trying and reverted to the old Filipino/English bilingual
38%
34%
10%
1 2 3
Number of questions answered correctly and average ORF of
children in that category
16 22 27
, resulting in a zero score.
Although not presented in graphic format in this section, fewer children gave no answer than
nswer for
Therefore there is no reason to believe that incorrect answers were due to an
, like many other subtests,
children who answered no questions correctly read only 11
hension questions
This suggests several possible explanations:
in difficulty academically because of a combination of
them across all
either because they
in Ilokano
different styles of language
use in the home versus in school and lack of background knowledge and vocabulary
implemented with the same degree of
may have been
getting more academic exposure to the language and possibly more opportunities to
MLE program has been inadequately carried out in terms
result, some
struggling to provide reading instruction in
to the old Filipino/English bilingual

Philippines EGRA Report – Final - 31 Aug., 2013 57
Summary of Ilokano findings
The findings indicate that on average, grade 1 children are not attaining the benchmarks or
curricular goals outlined for the MTB-MLE program; however, since those benchmarks were
not developed from actual performance data, they may not be appropriately aligned to the
grade level or linguistic characteristics of Ilokano, and should be revisited. Even basic skills
such as letter-sound knowledge of all the letters of the alphabet have not been mastered by all
children equally. The average scores mask large differences in ability, from children who
demonstrated no reading skills at all, to children who could read up to 70 correct words per
minute. The points listed above, explaining the low listening comprehension results, also
provide a reasonable explanation of overall findings from the grade 1 study; individual
factors, language factors, and implementation factors could have been responsible for these
differences.
Individual factors. The schools in the sample demonstrated a range of achievement, as
opposed to all the high achievers being in a few schools and all of the low achievers in a few
schools. This indicates that achievement was dependent on factors not related to school, as
there was as much of a range in scores within schools as between schools. Some of these non-
school-related factors have been mentioned throughout this report—gender, SES, and
attendance being the most prominent. For grade 1, self-reported absences were high, with
38% of children having been absent two or three days the week prior to data collection.
Among children who scored above 30 cwpm, the percentage reporting being absent the
previous week was much lower. Children from wealthier families were reading better than
children from less wealthy families.
Language factors. Children who said they spoke Pangasinan at home, and heard Pangasinan
spoken at home by others, were more likely to be in the low-achieving group. Our study did
not investigate why these children were in schools teaching Ilokano, but these children and
others speaking other indigenous languages at home may actually have had Ilokano as L2 and
therefore had not had enough exposure to oral or written Ilokano to be able to succeed at
these prereading tasks. Even within the Ilokano-speaking community in Region 1, variations
in pronunciation and vocabulary could have given some children an advantage on this
assessment. More in-depth studies need to be carried out by language experts to understand to
what extent this may be a problem in implementing standardized tests of Ilokano across the
region. Additionally, how language is taught and how reading is taught should be reviewed to
determine, for example, whether phonemic awareness is being taught in grade 1, including
learning letter sounds, manipulating sounds in words, exploring rhymes, etc. These are all
activities that can be done orally to support beginning reading as well as oral language
development for Ilokano- and non-Ilokano-speaking children.
Implementation factors. The MTB-MLE program is new, and has made important progress
in developing and distributing materials and teacher training. However, there may be
challenges to implementation that this study was not designed to uncover that would explain
why some children reached the targets and others did not. Schools have received the MTB-
MLE reading materials (according to the students assessed, and it is known that only Term 1
materials had been received even though the assessment was done in Term 3), yet 5% of
children said they had never used the book in class. Many more were not using the MTB-
MLE math materials (23%). More importantly, about 30% of students in the sample said their
teacher mostly spoke a language other than Ilokano. The sample schools were drawn from

those who reported at division level that they
confirmed with them the day of the as
among schools in the thoroughness with which they are implementing Ilokano instruction
Additionally, schools choose the language of instruction based on the majority of pupils
enrolled, but there are still cases where some children are enrolled in a school that chose to
implement a MT different than theirs
MT instruction began in grade 1, but children who attended preschool (Kinder) would have
heard English or Filipino as the language of instruction. The sample included 10 “pioneering
schools” who began MT implementation on a pilot basis a year prior to the rest of the
schools, of which 40 were sampled.
doing significantly better than nonpioneering schools
four items on the fluency subtests for the pioneering schools, but the sample size
allow us to detect statistical significance in this gain.
certain that the initiative and some
average scores were still well below the benchmarks. This study only provide
about what was actually happening in the cl
students themselves, so it would be important to conduct follow
for example, how much Ilokano is being used in the classroom, how much time in the school
day is dedicated to activities that support reading, whether a range of effective activities
being used, whether teachers are teaching the pre
to letter names), whether the MT materials are using a style of language that is too advanced
for beginners, etc.
Children in a Vigan City school engaged in Ilokano reading instruction. Photos: S. Pouezevara.
IV. Conclusions and Policy ImplicationsOne of the key takeaways from this study is
achievement between boys and girls, and across regions.
present again the same data that were
differences among regional populations.
are well-known— instability, poverty, geography, lack of access to early childhood
education, etc.—and many programs are in place to try to address these factors. However,
understanding which factors are having the most influence and what specifically can be done
most effectively and efficiently to address the achievement gaps will be critical going
forward.
reported at division level that they were implementing Ilokano, and this was again
confirmed with them the day of the assessment. It appears that there may be wide variations
thoroughness with which they are implementing Ilokano instruction
Additionally, schools choose the language of instruction based on the majority of pupils
still cases where some children are enrolled in a school that chose to
different than theirs. Finally, a key implementation issue to address is that
in grade 1, but children who attended preschool (Kinder) would have
rd English or Filipino as the language of instruction. The sample included 10 “pioneering
schools” who began MT implementation on a pilot basis a year prior to the rest of the
schools, of which 40 were sampled. Pioneering schools that had been in the prog
doing significantly better than nonpioneering schools; the mean scores were higher by
items on the fluency subtests for the pioneering schools, but the sample size
allow us to detect statistical significance in this gain. So even in those schools where we are
some training to implement MTB-MLE were in place, the
re still well below the benchmarks. This study only provided a few clues
s actually happening in the classroom, and these were mainly reported by the
students themselves, so it would be important to conduct follow-up activities to determine,
for example, how much Ilokano is being used in the classroom, how much time in the school
ies that support reading, whether a range of effective activities
being used, whether teachers are teaching the pre-reading skills of letter sounds (as opposed
whether the MT materials are using a style of language that is too advanced
Children in a Vigan City school engaged in Ilokano reading instruction. Photos: S. Pouezevara.
and Policy Implications One of the key takeaways from this study is the existence of important inequities in
achievement between boys and girls, and across regions. Figure 29 and Figure 30
were presented previously, but in a format that shows the
differences among regional populations. The challenges in these lowest-performing regions
instability, poverty, geography, lack of access to early childhood
and many programs are in place to try to address these factors. However,
understanding which factors are having the most influence and what specifically can be done
most effectively and efficiently to address the achievement gaps will be critical going
were implementing Ilokano, and this was again
wide variations
thoroughness with which they are implementing Ilokano instruction.
Additionally, schools choose the language of instruction based on the majority of pupils
still cases where some children are enrolled in a school that chose to
. Finally, a key implementation issue to address is that
in grade 1, but children who attended preschool (Kinder) would have
rd English or Filipino as the language of instruction. The sample included 10 “pioneering
schools” who began MT implementation on a pilot basis a year prior to the rest of the
been in the program were not
re higher by two to
items on the fluency subtests for the pioneering schools, but the sample size did not
o even in those schools where we are
in place, the
a few clues
re mainly reported by the
up activities to determine,
for example, how much Ilokano is being used in the classroom, how much time in the school
ies that support reading, whether a range of effective activities is
reading skills of letter sounds (as opposed
whether the MT materials are using a style of language that is too advanced
Children in a Vigan City school engaged in Ilokano reading instruction. Photos: S. Pouezevara.
important inequities in
30 below
presented previously, but in a format that shows the
performing regions
instability, poverty, geography, lack of access to early childhood
and many programs are in place to try to address these factors. However,
understanding which factors are having the most influence and what specifically can be done
most effectively and efficiently to address the achievement gaps will be critical going
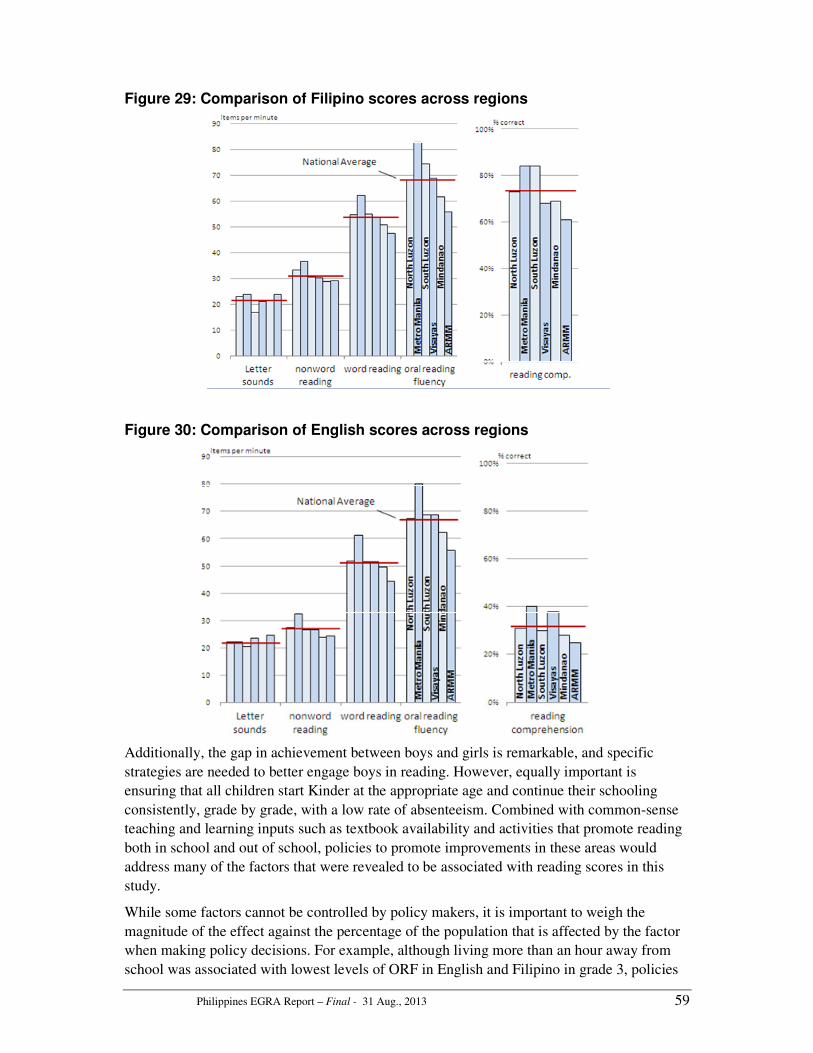
Philippines EGRA Report – Final - 31 Aug., 2013 59
Figure 29: Comparison of Filipino scores across regions
Figure 30: Comparison of English scores across regions
Additionally, the gap in achievement between boys and girls is remarkable, and specific
strategies are needed to better engage boys in reading. However, equally important is
ensuring that all children start Kinder at the appropriate age and continue their schooling
consistently, grade by grade, with a low rate of absenteeism. Combined with common-sense
teaching and learning inputs such as textbook availability and activities that promote reading
both in school and out of school, policies to promote improvements in these areas would
address many of the factors that were revealed to be associated with reading scores in this
study.
While some factors cannot be controlled by policy makers, it is important to weigh the
magnitude of the effect against the percentage of the population that is affected by the factor
when making policy decisions. For example, although living more than an hour away from
school was associated with lowest levels of ORF in English and Filipino in grade 3, policies

Philippines EGRA Report – Final - 31 Aug., 2013 60
to build schools in rural areas would affect only 2% of the population, and may not, therefore,
be as cost-effective as interventions that target changes in larger populations. On the other
hand, one third of the children in grade 3 classrooms sampled were over-age, indicating a
wide prevalence of children who start late or policies that encourage holding children back to
repeat a grade. It may be worthwhile to look into ways in which classrooms can be made
more homogenous (including avoiding multigrade classrooms) in order to better address the
needs of over-age students.
The reasons why children were over-age were not uncovered by this study, but the children
likely started late or were required to repeat a grade or grades. However, the correlation
between age in grade and reading fluency supports findings in other international literature
and other EGRA studies. Children who are required to repeat a grade by definition are
experiencing difficulty in school, possibly because of other characteristics such as poverty,
high absenteeism, etc. Therefore, they likely were poor readers before being asked to repeat a
grade. What is important to note, however, is that repeating a grade does not usually help to
raise the level of achievement of the child. See, for example, research from Senegal by Glick
and Sahn,27
which recommended “alternative measures to improve the skills of lagging
children” than repeating (p. 93); or the literature review by CfBT Education Trust on grade
repetition in sub-Saharan Africa, which concluded that “The majority of the studies
undertaken to explore the effects of repetition on learning suggest that the practice does more
harm than good (p. 5).”28
The issue of age is just one factor that creates classrooms that are very diverse, both
linguistically and demographically. This presents a significant challenge for teachers trying to
match their instruction to learners’ needs when those needs are necessarily so different. It has
been found to be the case in other countries that teachers typically teach to those at the top of
the class—teachers may always call on children they know have the ability to answer and as
long as some children have understood and mastered the lesson, they will continue to move
on, leaving others behind. Finding time and resources to intervene with remedial instruction
for those who need it is a worldwide challenge, but it is one that the Philippines will need to
address, given the large percentages of children who are being left behind, according to this
study. In fact, a 1999 study published in the World Bank Economic Review found that out of
four experiments to improve education quality in the Philippines, the one that was found to be
the most promising was to provide teachers with learning materials, “which helped them to
pace lessons according to students’ differing abilities (p. 493).”29
A key question at the grade 3 level is whether, in either language, children are ready to read
to learn in the more cognitively complex forms of the language used in subject areas like
science and mathematics, and whether they are prepared to do so through independent study
as well as classroom instruction. The results of this study raise important doubts about
whether the reading skills of grade 3 students are strong enough to “read to learn” in grade 4
and beyond. What is clear is that multilingual education goals of the curriculum are very
27 Glick, P., & Sahn, D. (2010). Early academic performance, grade repetition, and school attainment in Senegal: A panel
data analysis. The World Bank Economic Review, 24(1): 93–120. Washington, DC.: World Bank. 28 Ndaruhutse, S. (2008). Grade repetition in primary schools in sub-Saharan Africa: An evidence base for change. Reading,
Berkshire, UK: CfBT Education Trust. Retrieved from
http://www.cfbt.com/evidenceforeducation/pdf/Grade%20Repetition_FINAL_8FEB08.pdf 29 Tan, J., Lane, L., & Lassibille, G. (1999). Student outcomes in Philippine elementary schools : An evaluation of four
experiments. The World Bank Economic Review, 13(3): 493–508. Washington, DC.: World Bank.

Philippines EGRA Report – Final - 31 Aug., 2013 61
ambitious and will require a great deal of highly contextualized language input, in a
language-rich environment, supported by trained teachers throughout the primary grades.
A one-day event was held in Manila to present the results of this study to DepEd staff,
including regional representatives who participated in data collection, local academic experts
in language, curriculum and instruction, including those who helped develop the instruments,
and other stakeholders such as international organizations and donor institutions. Some of the
recommendations made by this group after reviewing and discussing the results include:
- ensuring that pre-service training addresses specific strategies for reading instruction
in this multilingual context and that the results are shared and discussed at the pre-
service level
- ensuring that the study is used to inform instruction, by building capacity of teachers
to understand and use the data
- that the benchmarks be revisited in light of the results, taking into consideration
evidence-based expectations for the children and the linguistic characteristics of the
language (i.e., average word length.)
The actual use of EGRA was discussed and debated and it should be determined whether it
will continue to be used as a national, sample-based diagnostic and measurement of the
effectiveness of MTB-MLE, or if it will be modified for use as a classroom-based formative
assessment. It has been communicated that in its current form, EGRA is a sample-based
diagnostic; for it to be used as a classroom-based assessment significant modifications would
be required. In its present form, EGRA can continue to be used for system level monitoring
of the impact of implementing MTB-MLE – either in terms of students learning to reading in
mother tongues or in terms of their transitioning their literacy skills to Filipino and English.
Further analysis of these data. The data collected by this study represent hundreds of
individual variables for each language and thus many possible levels of analysis. Further
analysis could be done in areas such as:
• More detailed, word-level analysis of dictation data.
• More cross-language analysis per child—i.e., did children who did well in Filipino
also do well in English? Did children present the same error types across subtests?
• More detailed analysis the relationships between home and school environment, and
particularly the language environment, and results. This is especially pertinent for the
Ilokano data in which more detailed questions about language spoken at home and in
the community were asked of children.
Additionally, whereas this report presents a great deal of data and attempts to provide
explanations and interpretations based on that data, the validity of this interpretation depends
on participation of local experts—linguists, teachers, DepEd officials—who know more
about how teachers are trained, what materials are in circulation, and what actually happens
in classrooms. Therefore teachers and curriculum specialists should be encouraged to review
the results with a critical eye on how teaching practices, linguistic characteristics, and
classroom environments may explain some of the results. Some of this dialogue began at a
high-level presentation of the EGRA results that took place in Manila on July 25, 2013.
Issues raised by participants at that time have been integrated into this report, but secondary
analysis and interpretation of the results is encouraged as well.

Philippines EGRA Report – Final - 31 Aug., 2013 62
Potential follow-on studies. Interpreting these results, and monitoring the implementation of
MTB-MLE, will also benefit from more in-depth studies that measure the actual language use
in the classroom. See, for example, studies done in Africa using classroom observations of
instruction and language use.30
These studies provide detailed information about how much
time in the day was being spent—across curricular subjects—by teachers and students using
different languages, as well as what types of activities teachers and children were engaged in
(i.e., reading silently, reading out loud, etc.). These results can also be associated with
reading outcomes measured by EGRA and help determine how variations in instructional
practice can influence reading outcomes. Given the overall low levels of performance
measured in the Ilokano portion of this survey, and the large variations seen in the Ilokano
reading data, such further study would prove especially useful. However, in any evaluation
of reading performance in mother tongues, one must first determine whether MTB education
was actually being implemented in the schools in the way it was intended by the program.
Similarly, such a study could also look into teacher competencies in the language of
instruction. As discussed briefly above, national studies of teacher competency in English
have shown low levels of proficiency; additionally, across the Philippines, different linguistic
backgrounds affect how English is spoken and understood.
Theories of language acquisition, which inform different models of bilingual education, stress
the importance of “comprehensible input”,31
which means not only that the speaker needs to
be speaking clear and correct language, but also that whatever is said needs to be appropriate
to the level of language that children are capable of understanding, with gradual additions to
increase vocabulary and comprehension. This “input +1” model is similar to the concept of
leveled readers for children learning to read: Providing texts that are too difficult for a child
will result only in frustration and failure, but providing decodable texts reinforces the
concepts the child has already learned and creates confidence and ability to attack
increasingly difficult texts. To summarize, teachers’ competency needs to be measured not
only by their own language speaking and reading competency but also by the extent to which
they know how to adjust their language use to match the level of the children in the
classroom and provide comprehensible input that results in “comprehended intake.”
The results presented in this report are the first of their kind on this scale for the Philippines,
and represent a baseline against which progress can be measured in the future. It will also be
interesting for the Ilokano group to determine intergrade progression in mother-tongue
reading by assessing grade 2 learners as well as grade 1 learners. This could be done, for
example, in January 2014 using the same instrument in both grade 1 and grade 2, then in
2015 in grade 2 and grade 3, again using the same instrument. In the future, it is
recommended to limit this externally administered, sample-based EGRA to grade 2 students
who are a bit more mature and may be less intimidated by the procedure.
Similarly, a study completed in grade 3 after the MTB-MLE implementation had been under
way for several years would help detect whether children were able to acquire English and
30 Studies were conducted by RTI in Mali, Senegal, Kenya, and Uganda with funding from the William and Flora Hewlett
Foundation. See the two Piper reports cited earlier, as well as Varly, P. (2010). The monitoring of learning outcomes in Mali:
Language of instruction and teachers’ methods in Mali grade 2 curriculum classrooms. and Varly, P. (2010). The
monitoring of learning outcomes in sub-Saharan Africa: Senegal languages of instruction and teachers’ methods in senegal
grade 3 classrooms. Both prepared for the William and Flora Hewlett Foundation under the program Monitoring of Learning
Outcomes in Sub-Saharan Africa. Research Triangle Park, North Carolina: RTI International. Retrieved from
https://www.eddataglobal.org/ 31 Krashen, S. (1982). Principles and Practice in Second Language Acquisition. New York: Pergamon Press.

Philippines EGRA Report – Final - 31 Aug., 2013 63
Filipino competency on the foundation of their mother-tongue literacy as fast as, or faster
than, in the previous structured bilingual immersion method. Again, before definitive
conclusions are drawn about the effectiveness based only on student outcome measures, more
detailed studies need to be carried out to determine whether mother-tongue literacy was
actually taught and acquired by the children. Thus, for example, in 2015 the children who
were tested in Ilokano will be completing grade 3. At this time, a measurement of Ilokano,
English, and Filipino literacy could be conducted with each child to determine proficiency
across languages.
Note that for repeated use of the EGRA instrument, the items will have to be changed and
equivalency studies conducted to ensure that the measurements are the same, yet the items
cannot be known by teachers in advance such that they can artificially prepare students for
success on the assessment. More details will be provided on this and other considerations for
comparability and scale-up in a separate EGRA toolkit that is under development for DepEd
Philippines.
Finally, the results concerning of over-aged students and the gender gap deserve further
attention. The issue of over-aged students should be looked into in more detail to identify the
reasons why overage children are present and why they are not succeeding—are they children
who started late, repeated a grade, and if so was this due to some kind of learning disability or
other factors that could be addressed through policy actions. Studies to find out more about
the origins of, and how to address, the gender and age gap would also be of interest. Why are
there so many overage children in the early grades? What is preventing boys from achieving
as high as girls? Does the gender gap widen or disappear with age? How is it reflected in
retention and completion rates?
This proposed list of follow-on studies is not exhaustive, and there are certainly many other
qualitative and quantitative studies that could add important contextual information with
which to improve the interpretation of these findings and to improve implementation of
programs to address them.

Philippines EGRA Report – Final - 31 Aug., 2013 64
Annex 1: Description of the Sample
Student Characteristics
As demonstrated above, descriptive statistics can be used to explain differences in reading
ability, where differences exist either in characteristics of the sample or in reading ability.
This type of analysis has some natural limitations. For example, results cannot be taken to
mean that the relationships are necessarily causal or exhaustive—certain factors may simply
vary along with learner achievement, and other intervening factors exist that were not
measured in this study. Also most of the information is self-reported, and therefore is only
indicative and not definitive, since unstated interpretations and biases may be introduced in
respondents’ answers. Nevertheless, the demographic and descriptive information gathered
by the instruments allows us to generate a probable picture of Philippine schools today, and
particularly grade 3 classrooms, but also among the grade 1 classrooms that are the first to
implement MTB-MLE. Table 25 provides an overview of key characteristics of students
based on weighted percentages and averages.
Table 25: Descriptive statistics for children
Characteristic Grade 3 (English
and Filipino) Grade 1 (Ilokano)
Average age, years 9.3 6.6
Is over-age for the grade level 31% 11%
Child is female (% of sample) 50% 45%
Child is in a multigrade classroom 11% 7.8%
Child was not absent last week 50% 41%
Child was absent 2–3 days last week 21.5% 38%
Child is repeating the grade 6.3% 6.8%
Child attended Kindergarten before grade 1 81% 88%
Child mainly speaks the language of the EGRA at home
English – 2.5%
Filipino/Tagalog – 28% 74%
Has other reading materials in the home 47% 76%
Takes more than an hour to get to school 1.5% (not asked)
School Characteristics
The same questionnaire included information about practices in the classroom, and data
gathered from school records provided details about class size. The results are summarized in
Table 26.

Philippines EGRA Report – Final - 31 Aug., 2013 65
Table 26: Descriptive statistics about schools
Characteristic Grade 3 (English
and Filipino) Grade 1 (Ilokano)
Average class size 19.9 29
Teacher mainly uses the language of the EGRA in class
English – 77%
Filipino/Tagalog – 90% 71.5%
Teacher never assigns reading homework 3% n/a
Teacher assigns English reading homework 79% n/a
Teacher assigns Filipino reading homework 79% n/a
Child has English reading textbook 79% n/a
Child has Filipino reading textbook 76% n/a
Teacher often asks the child to read aloud in E, F, or I 27% , 27% 6%
Child has math textbook 53% n/a
School heads were asked if they were participating in any particular reading improvement
programs. The cumulative answers for the grade 3 sample are presented in Table 27.
Regression analysis was done to see if participating in any of these programs was correlated
with reading ability. The results indicate that students in schools that self-reported
implementing ECARP had a higher average oral reading fluency in both English and Filipino,
and this difference was statistically significant. The intensity of implementation or the actual
activities engaged in were not specifically defined or measured by this question; it was a yes-
or-no question answered by head teachers, and the findings need to be interpreted with this
caveat in mind. However, reporting participation in the program would indicate an awareness
of the program, its objective (“every child a reader”), and thus a commitment to the national
goals of improving reading. Schools who self-reported participating in more than one
program were also associated with larger ORF scores.
Table 27: Participation in reading programs (grade 3)
Reading program
No. of schools that participate in this program
(children)
Weighted % of schools
participating in this program
(children) Average ORF p-value
Read-a-thon 186 (1909) 80% (77%) E: 68 F: 69
0.181 0.224
ECARP 119 (1201) 51% (49%) E: 70 F: 72
0.018* 0.000***
Festival of Talents 121 (1228) 49% (50%) E: 69 F: 70
0.149 0.138
Read more, be more 43 (437) 15% (18%)
E: 68 F: 68
0.834 0.993
Other (1043) (42%) E: 65 F: 67
0.305 0.339
*p <0.05, *** p < 0.001

Philippines EGRA Report – Final - 31 Aug., 2013 66
Annex 2: Sampling, Weighting and Limitations
Sampling
Grade 3 sample
Selection of the 2013 Philippine EGRA sample involved a stratified three-stage sample of
divisions, schools, and grade 3 students. Table 28 provides a quick summary of the sampling
methodology, followed by further explanations in the text.
Table 28: Summary of sample stage selection for grade 3
Stage no. Stage item Stratified by Selection probability Total no. of
items sampled
1 Divisions Super-regions Probability proportional to grade 1 enrollment
56
2 Schools <None> Probability proportional to grade 1 enrollment
241
3 Grade 3 students Gender Equal probability selection 2,410
The 2010-2011 Basic Education Information System (BEIS) Elementary School census data
were used as the list frame for sampling divisions and schools. The initial list of schools
contained 38,351 public elementary schools. After removal of 196 schools that had zero
grade 1 enrollments,32
a total of 38,155 schools remained in the final sample frame.
Stage 1 – Selection of divisions: The 2010–2011 BEIS data were aggregated to the division
level, then stratified by the six super-regions. With the exception of the National Capital
Region, divisions were sorted by region, then 10 divisions were selected proportional to total
grade 1 enrollment using systematic random sampling. Because the NCR Grouped region
contains only 16 divisions, and encompasses a small geographical area, all divisions were
automatically selected.33
Stage 2 – Selection of schools: Schools from each selected division were selected with
probability proportional to the grade 1 enrollment. About 40 schools were selected for each
super-region;34
in total, 241 schools were selected. For each selected school, two replacement
schools were selected in the event the original sampled school was not able to be assessed
(for example, the school was permanently closed, or did not contain any grade 3 students).
Stage 3 – Selection of students: Grade 3 students were selected the day the assessment team
arrived at the school. All grade 3 students within the selected school were stratified by
gender. Five males and five females were then selected with equal probability. If the school
had fewer than 10 students, all of the students were automatically selected.
32 Because the BEIS sample frame was two years old, a zero enrollment of grade 1 students two years ago meant that there
would currently be a zero enrollment of grade 3 students. 33 Another reason all divisions in the NCR were automatically selected in the sample: Selecting the divisions proportional to
grade 1 enrollment using the systematic sampling process meant that 7 of the 10 divisions were automatically selected. 34 Forty-one schools were selected from the super-region: Visayas (regions R6, R7, R8).

Philippines EGRA Report – Final - 31 Aug., 2013 67
Grade 1 sample
The sample selection of the 2013 Philippine grade 1 Ilokano EGRA sample involved a
stratified two-stage sample of schools and grade 1 students (Table 29).
Table 29: Summary of sample stage selection for grade 1
Stage no. Stage item Stratified by Selection probability Total no. of
items sampled
1 Schools Ilokano pilot school Probability proportional to grade 1 enrollment
50
2 Grade 1 students Gender Equal probability selection 500
The 2010–2011 BEIS Elementary School census data were used as the list frame for
sampling schools. After exclusion of schools that (1) were known to not teach in Ilokano
(n = 549), (2) had participated in the Ilokano EGRA pilot study (n = 4), (3) participated in the
grade 3 national EGRA study (n = 9), and (4) had zero grade 1 enrollments, a total of 1,786
public elementary schools in the Ilokano Region remained in the list frame.
Stage 1 – Selection of schools: Ten schools that had participated in the Ilokano mother-
tongue pioneering study were randomly selected and 40 schools that did not participate in the
pioneering study were randomly selected. All schools were selected proportional to the grade
1 enrollment using systematic random sampling.
Stage 2 – Selection of students: Grade 1 students were selected the day the assessment team
arrived at the school. All grade 1 students within the selected school were stratified by
gender. Five males and five females were then selected with equal probability. If the school
had fewer than 10 first graders, all of the first graders were automatically selected.
Weighting
Sample weights were created by the inverse of the probability of selections. The school
weights were scaled to the total number of schools in the strata. Student weights were scaled
to the total number of enrolled boys and girls at the Regional level.
The final sample of schools and students, with the weighted percentages, is provided in
Table 30.
Table 30: Final sample for grades 1 and 3: Divisions, districts, and schools
Grade 1 Sample
Schools Students
Division N Weighted
value Weighted percent N
Weighted value
Weighted percent
Alaminos City 2 35 2.0 22 1822 2.6
Candon City 1 6 0.3 10 449 0.6
Ilocos Norte 7 333 18.6 72 10325 14.8
Ilocos Sur 10 554 31.0 80 13462 19.3
La Union 9 150 8.4 92 12642 18.1
Laoag City 2 63 3.5 20 2335 3.3
Pangasinan I:Lingayen 5 174 9.8 50 9243 13.2
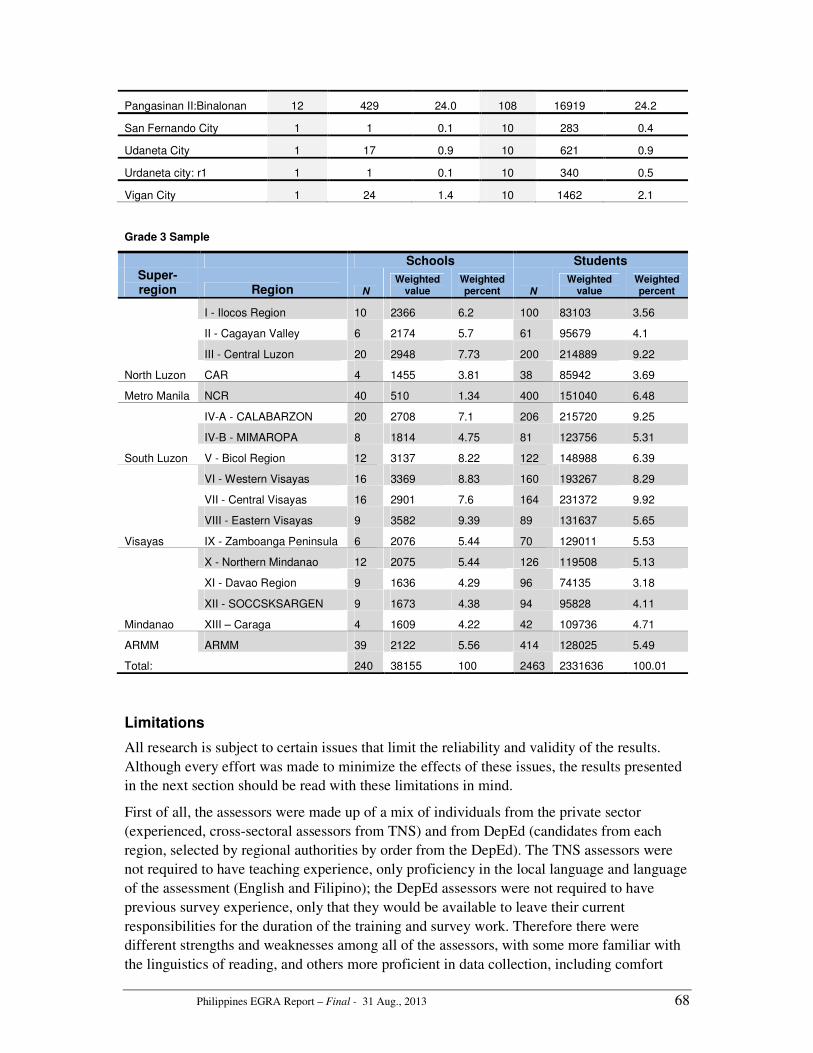
Philippines EGRA Report – Final - 31 Aug., 2013 68
Pangasinan II:Binalonan 12 429 24.0 108 16919 24.2
San Fernando City 1 1 0.1 10 283 0.4
Udaneta City 1 17 0.9 10 621 0.9
Urdaneta city: r1 1 1 0.1 10 340 0.5
Vigan City 1 24 1.4 10 1462 2.1
Grade 3 Sample
Schools Students Super-region Region N
Weighted value
Weighted percent N
Weighted value
Weighted percent
North Luzon
I - Ilocos Region 10 2366 6.2 100 83103 3.56
II - Cagayan Valley 6 2174 5.7 61 95679 4.1
III - Central Luzon 20 2948 7.73 200 214889 9.22
CAR 4 1455 3.81 38 85942 3.69
Metro Manila NCR 40 510 1.34 400 151040 6.48
South Luzon
IV-A - CALABARZON 20 2708 7.1 206 215720 9.25
IV-B - MIMAROPA 8 1814 4.75 81 123756 5.31
V - Bicol Region 12 3137 8.22 122 148988 6.39
Visayas
VI - Western Visayas 16 3369 8.83 160 193267 8.29
VII - Central Visayas 16 2901 7.6 164 231372 9.92
VIII - Eastern Visayas 9 3582 9.39 89 131637 5.65
IX - Zamboanga Peninsula 6 2076 5.44 70 129011 5.53
Mindanao
X - Northern Mindanao 12 2075 5.44 126 119508 5.13
XI - Davao Region 9 1636 4.29 96 74135 3.18
XII - SOCCSKSARGEN 9 1673 4.38 94 95828 4.11
XIII – Caraga 4 1609 4.22 42 109736 4.71
ARMM ARMM 39 2122 5.56 414 128025 5.49
Total: 240 38155 100 2463 2331636 100.01
Limitations
All research is subject to certain issues that limit the reliability and validity of the results.
Although every effort was made to minimize the effects of these issues, the results presented
in the next section should be read with these limitations in mind.
First of all, the assessors were made up of a mix of individuals from the private sector
(experienced, cross-sectoral assessors from TNS) and from DepEd (candidates from each
region, selected by regional authorities by order from the DepEd). The TNS assessors were
not required to have teaching experience, only proficiency in the local language and language
of the assessment (English and Filipino); the DepEd assessors were not required to have
previous survey experience, only that they would be available to leave their current
responsibilities for the duration of the training and survey work. Therefore there were
different strengths and weaknesses among all of the assessors, with some more familiar with
the linguistics of reading, and others more proficient in data collection, including comfort
Philippines EGRA Report – Final - 31 Aug., 2013 69
with the electronic (tablet) environment. Initially, more candidates were selected for training
than needed for fieldwork, to ensure that there could be a selection process based on
demonstrated capacity, but in the end some invited candidates did not show up and others
declined to participate. Therefore all of the remaining trained assessors were used, regardless
of demonstrated capacity. Those who appeared to have more difficulty with the test
administration procedures or the tablet functionality were given extra support by supervisors
during fieldwork. Quality control was also assured during the data collection period by
reviewing the results that had been uploaded on a nightly basis, and identifying assessors that
may not have been following the administration procedures correctly. These individuals were
given extra support and supervision.
Next, the effect of the complex multilingual environment described in the introductory
section, above, is that there is a range of proficiency in spoken English and Filipino among
the assessors. A key criteria for assessor selection was that they be proficient in the local
language(s) of the regions to which they would be assigned. This is to ensure that the
instructions to the child can be given in a language the child understands. However,
interferences related to the assessors mother tongue result in differences in the way certain
sounds are pronounced and heard; for example, known interferences include “v” being
pronounced as “w” and “f” being pronounced as “v” and vice versa. Some of this interference
is also more pronounced for borrowed letters/sounds to which there is less exposure. To
mitigate the effects of various interferences for the Grade 3 national sample, assessors were
assigned to administer the test in only one language—either English or Filipino—rather than
administering both languages to the same child. Those who were most proficient in English
were assigned to the English assessment and those more proficient in Filipino assigned to the
Filipino assessment. Nevertheless, the accuracy of the letter-sound identification and
phonemic awareness exercises are affected by lower inter-rater reliability than the other
subtests for this reason, despite best efforts during training to ensure consistency.
Moreover, as mentioned above, the study used an electronic method of data collection known
as Tangerine®
that allows assessors to note the child’s responses on a small tablet computer
and thus the data is automatically entered into a database and synchronized on a daily basis
with the other assessments across the sample. This has considerable advantages, notably
eliminating the time and cost associated with manual data entry from paper forms into a
database, and the potential data entry errors that are made at this stage. The quality of data
collection is also improved because of internal logic checks done by the software that will
prevent missing, inconsistent, or illegible data, and because data can be reviewed as it is
being collected and any issues addressed before data collection is complete. On the other
hand, while many errors are prevented by the electronic method, others are introduced when
assessors have not had enough practice or are uncomfortable with the hardware. One specific
issue raised during feedback from assessors was that sometimes the button to activate the
timer (start or stop) did not respond immediately causing a few seconds to be added or
removed from the results of a timed subtest. Observation during training and also feedback
from assessors suggests that this was a factor due to user behavior—i.e., not being ready to
start/stop the timer, not using the appropriate force and duration of the screen tap, not having
clean fingers, etc.—and not a limitation of the hardware or software itself. Either way, it is
possible that the accuracy of the timed tests could be compromised by this issue. It is
important to note, however, that this issue is also present during paper data collection when
assessors are required to manipulate a timer separately from the paper on which responses are

Philippines EGRA Report – Final - 31 Aug., 2013 70
recorded. Timed surveys are always a challenge, and the appropriate response is to read the
results keeping in mind that differences in results of less than 5 items per minute are probably
not indicating real differences in capacity, only natural variations in the sample; rather it is
the differences on a magnitude of 5-10 items per minute or more that are indicative of real
differences in reading ability, especially at the Grade 3 level.
Finally, a universal challenge with one-to-one assessments of this type is that it is an
unfamiliar exercise for children, administered by a stranger, and therefore a certain amount of
anxiety is natural and may affect the child’s performance. Every effort is made to make the
child feel comfortable before beginning the assessment (such as a period of small talk), and
each subtest is introduced with several practice questions and responses. However, especially
in the case of the grade 1 students who may be as young as 6 years old, this stressful
environment may contribute to lower scores.

Philippines EGRA Report – Final - 31 Aug., 2013 71
Annex 3: Reading Comprehension Distribution Scores The following tables provide additional details on the distribution of reading comprehension
scores. Unlike the values provided in the main body of this report, these tables exclude ‘zero’
scores and shows the distribution of scores according to how many questions a child
attempted rather than the total number of questions possible (5). According the standard
rules of EGRA administration, a child is only asked questions that correspond to text he or
she has actually read. Thus, a child who only attempted two questions (because they read too
slowly to advance in the text far enough to be asked two questions) has three possible
scores—0% (0 of 2 question answered correctly), 50% (1 of 2 questions answered correctly)
or 100% (2 of 2 questions answered correctly). Table 29 shows that the distribution of scores
for Filipino reading comprehension, for children who only attempted 2 questions, is 41% who
answered 0 of 2 questions correctly, 39% who answered 1 of 2 questions correctly, and 20%
who answered 2 of 2 questions correctly. This allows us to see in what category the majority
of students fall according to what they actually attempted to do.
Table 31: Distribution of Filipino reading comprehension scores by number of questions attempted
Q’s aske
d N
Percentage of questions answered correctly
0 20 25 33 40 50 60 67 75 80 100
1 39 74% 26%
2 71 41% 39% 20%
3 127 20% 27% 33% 20%
4 241 10% 9% 21% 29% 30%
5 1,929 <1% 1% 6% 13% 27% 53%
* Based on unweighted scores. ** Of children who got all questions correct.
Table 32: Distribution of English reading comprehension scores by number of questions attempted
Q’s aske
d N
Percentage of questions answered correctly*
0 20 25 33 40 50 60 67 75 80 100
1 62 95% 5%
2 124 90% 8% 2%
3 99 81% 18% 0% 1%
4 161 65% 24% 8% 2% 1%
5 1,951 9% 27% 21% 15% 15% 13%
* Based on unweighted scores. * Average ORF of children who got all questions correct in each category (weighted values).

Philippines EGRA Report – Final - 31 Aug., 2013 72
Table 33: Distribution of Ilokano reading comprehension scores by number of questions attempted
Q’s aske
d N
Percentage of questions answered correctly*
0 20 25 33 40 50 60 67 75 80 100
1 18 100% 0%
2 85 71% 26% 2%
3 205 32% 36% 16% 16%
4 62 5% 5% 23% 32% 35%
5 45 2% 7% 18% 33% 31% 9%
* Based on unweighted scores.
What is particularly striking from these tables is that no matter how far they read in the text,
and subsequently, how many questions they were asked, most children could not answer even
one question correctly in English. In Filipino and Ilokano, as children were asked more
questions, they were also increasingly likely to answer most of them correctly.

Philippines EGRA Report – Final - 31 Aug., 2013 73
Annex 4: Dictation scoring rules Typically, words in the dictation subtest are scored word-by-word as either correct, incorrect,
or partially correct (RTI, 2009). The definition of ‘partially correct’ is left to be determined in
each case based on the features of the language and the purpose. Initial review of the
dictation passages for Filipino and English gathered during pilot testing showed a range of
errors that seemed important to distinguish for the purposes of this evaluation. Thus, for both
English and Filipino, a 5 point scale was used to score each word, corresponding to the
following:
Table 34: Dictation scoring rules for English and Filipino
Value Definition
4 Correct word, spelled correctly
3 Correct word, spelled incorrectly; that is, phonetically or common spelling errors, but the word is still readable in context
2 Incorrect word, spelled correctly; that is, another real word in the language that is spelled correctly, but it is not the correct word in the context of the sentence
1 Incorrect word, spelled incorrectly; that is, anything that is indecipherable as the word in context
0 Word was not written at all
Value English examples in each category
4 (correct sentence)
We throw our garbage in the trash can to keep our school clean.
3 whe, wi, wirow, wit (note: this word often joined with the next, as in ‘wetro’, or ‘wirow’)
tro, trow, troe, frow
awer, awor, awere, ower
grabage, garveg(e), garbadge, garbich, garbeych, carbage, garbag, garbeig, garbej, garbij, garbigz, garbits,
da
tras, trush, truch (note: trash can often spelled as one word both correctly (‘trashcan’) or incorrectly (‘traskan’).
kan
kip, cip, kipe, ceap, kif
2 wet, with, way
draw, through, true, threw, row (wit row), sow
are, hour, aware
cabbage, garage, garden
hen, and, end, to, into
tar
cape
1 trogh
Gradbreijs, grarge, grbger, garbis, garverst, garcced, gabe, gardaced, grarvae, garrist, garvet
ne, eng, wen, eno, ni
ta
tra
Philippines EGRA Report – Final - 31 Aug., 2013 74
Value Filipino examples in each category
4 (correct sentence)
Niligpit namin ang mga nagkalat na laruan at nagwalis kami sa kuwarto.
3 niligpet, niligppit, nilegpet, neligpet, linigpit, nilikpit, niligbet
namen, nmin, numin, namn
anng
manga
nagklt, nagklat, ngkalat, nangkalat
larowan, laro-an, laroan, larwan, laran, laroun
nagwales, nagwallis, nagwals, nagwalies, nangwalis
kame, kamy
kuarto, kwarto, kowarto, kwurto, cowarto, karto, kuwalto, kuwartu, quarto, kwuarto, kawarto
2 Naligpit, ligpit, iniligpit, iligpit, liniligpit, ni
naming, naman, na
ng, na, aming,
maga, mang, nga
nagkalat, kalat, makalat, magkalat
laro
nawalis
kura
1 Nilipi, lelepet, inilingpit, nilugpit, niglit, niligpig, niligbit, nilidpit, nilikpud
nami, namon, name, nanin, narin, mamin, namim
ag, ana, anag, agr
mag
nag, nagkalan, nagalat, nagkala, lalat, nangkalat, nagkal, nagkalata
laran, laroa, lakuhan, raroan
ta
nagwali, agwalis, nagwlis, nagyalis
Recognizing that there is much subjectivity involved in scoring the words according to one of
the above definitions, optimal consistency was ensured by involving only one person in
scoring the dictation data for English, and one for Filipino. Although this adds considerably
to the time needed to prepare the data for analysis, there is less chance that multiple
individuals will score words differently. Even for the one individual, a scorecard was kept
with examples from each category so that when in doubt a consistent rule could be applied.
Nevertheless, it is still a subjective measure, and there are some elements that can’t be scored
accurately, for example, when words aren’t separated by a space, the assessor must judge if
the words are spelled correctly but just missing the space or if the pupil may have been
treating several words as one linguistic unit and therefore this is incorrect. Similarly, some
children wrote whole strings of words that didn’t obviously correspond to any of the words in
the dictation sentence, so the scoring was just done on a one-to-one basis with everything else
counting as missing. For example:
In this sentence: are gar bug to tep are school calen the person scoring the exercise might
score it like this, which requires some assumptions.

Philippines EGRA Report – Final - 31 Aug., 2013 75
Table 35: Sample of a scored English dictation sentence
we throw our garbage in the trash can to keep our school clean
- - are gar bug - - - - to tep are school calen
0 0 3 1 0 0 0 0 4 1 2 4 3
More challenging are sentences like this: wetro awal EntaSKinlskol , or like this: we Rue
awer in kras areban. Furthermore, not all errors could be scored according to this
methodology. When words were inserted they were just ignored, though technically this is an
error, as in “to keep our school to clean”. When words were present but in the wrong order,
they were scored as if they were in the right order, as in “to keep our clean school.” For the
English words “trash can” which were often written without the space, the words were scored
individually and the point was taken off of the syntax measurement (spaces present? all,
some, none) by scoring it as ‘some’.
The detailed scoring above allows for in-depth item analysis of word-level difficulties, but
given the limitations to accurate scoring described above, the raw scores were collapsed into
three values corresponding to the more standard approach (correct, partially correct or
incorrect) as well as missing, when providing an actual ‘score’ for the dictation subtask. This
combination of complex item-level scoring as well as the simplified task-level scoring allows
us to do several things:
- frequency of responses (word errors) by type (using the initial raw scores)
- composite accuracy score made up by adding the values assigned to the raw scores
- writing ‘fluency’ score based on the number of words written out of the total possible
Note that the task was not timed as precisely as the reading tasks, but was generally limited to
around 1.5 minutes. The instructions for the task are as follows:
Read the following sentence ONCE, at about one word per second:
• We throw our garbage in the trash can to keep our school clean.
Then, give the child a pencil and paper. Read the sentence a second time, pausing 5
seconds between groups of words words.
• We throw [5] our garbage [5] in the trash can [5] to keep [5] our
school clean.
Wait up to 15 seconds (if the child has not finished) and read the whole sentence
• We throw our garbage in the trash can to keep our school clean.
The pupils wrote the sentence on paper, but then the assessors transcribed the words into
Tangerine so that scoring was actually done off of an electronic copy of the sentence.
Therefore another source of inconsistency or measurement error could have been from
assessors making mistakes when transcribing the sentences into the electronic tool. After all
scoring was done, a quality control check was done to verify a sample of paper forms against
what was transcribed into Tangerine, ensuring that at least one paper per assessor was
reviewed. There were some transcription errors noted, but for the most part these errors didn’t
change the point value of the scoring.

Philippines EGRA Report – Final - 31 Aug., 2013 76
Annex 5 : Correlations between subtests in English and Filipino The EGRA tool allows us to measure a range of progressively more complex reading skills.
Doing this for every child in the sample allows us to analyze the relationships between
different subtests, which can then be used to inform instruction. Tables 36 - 38 show
comparisons between the subtests using different types of measurements.
- Beta (β): This is the ratio of change at the mean, and tells us for every 1 increment in
x there is ‘beta’ increment in y; for example, with every 1 additional nonword read
correctly in English, on average, the correct words per minute increases by 1.6 on a
connected-text passage in English (see Table 36)
- the Pearson correlation (Pearson’s r): implies that there is a linear relationship
between x and y. The correlation coefficient ranges from −1 to 1. A value of 1
implies that a linear equation describes the relationship between X and Y perfectly,
with all data points lying on a line for which Y increases as X increases. A value of
−1 implies that all data points lie on a line for which Y decreases as X increases. A
value of 0 implies that there is no linear correlation between the variables.35
Usually a
Pearson correlation stronger than .6 is considered of interest. The strongest
correlations have been indicated in bold text in the tables, for easy reference.
- If X is the only variable in the model: Y=X, then the �� is simply the square of the
Pearson’s r. However, if there are many variables in the model, the �� is the square
of the coefficient of multiple correlation. This means that if a model includes more
variables which help correlate with increases in Y, than the �� will increase.
Therefore, the last column in the series of table shows the Coefficient of
determination �� and indicates how well data points fit a line. It can be seen as the
proportion of total variation of Y explained by the model36
. �� has a range from 0 to
1. A value of 0 implies that the linear changes in Y are completely random and are
not explained by X. A value of 1 implies that the model perfectly explains the linear
change in Y. In general, values above .6 are considered very strong.
Note that correlations for Ilokano are provided in the section on Ilokano results, above.
Table 36: Correlations between subtests in English
Outcome variable (Y) Independent variable (X) beta person_corr r2_model
Eng - Phonemic Awareness clspm 1.380 0.605 0.366
Eng - Phonemic Awareness cwpm 0.510 0.357 0.127
Eng - Phonemic Awareness cnonwpm 0.870 0.406 0.165
Eng - Phonemic Awareness orf 0.370 0.336 0.113
Eng - Phonemic Awareness list comp 0.340 0.361 0.130
Eng - Familiar words (cwpm) clspm 0.700 0.439 0.193
Eng - Familiar words (cwpm) cnonwpm 1.180 0.781 0.610
35 Wikipedia: Pearson correlation:
http://en.wikipedia.org/wiki/Pearson_product-moment_correlation_coefficient 36 Wikipedia: Coefficient of determination
http://en.wikipedia.org/wiki/Coefficient_of_determination
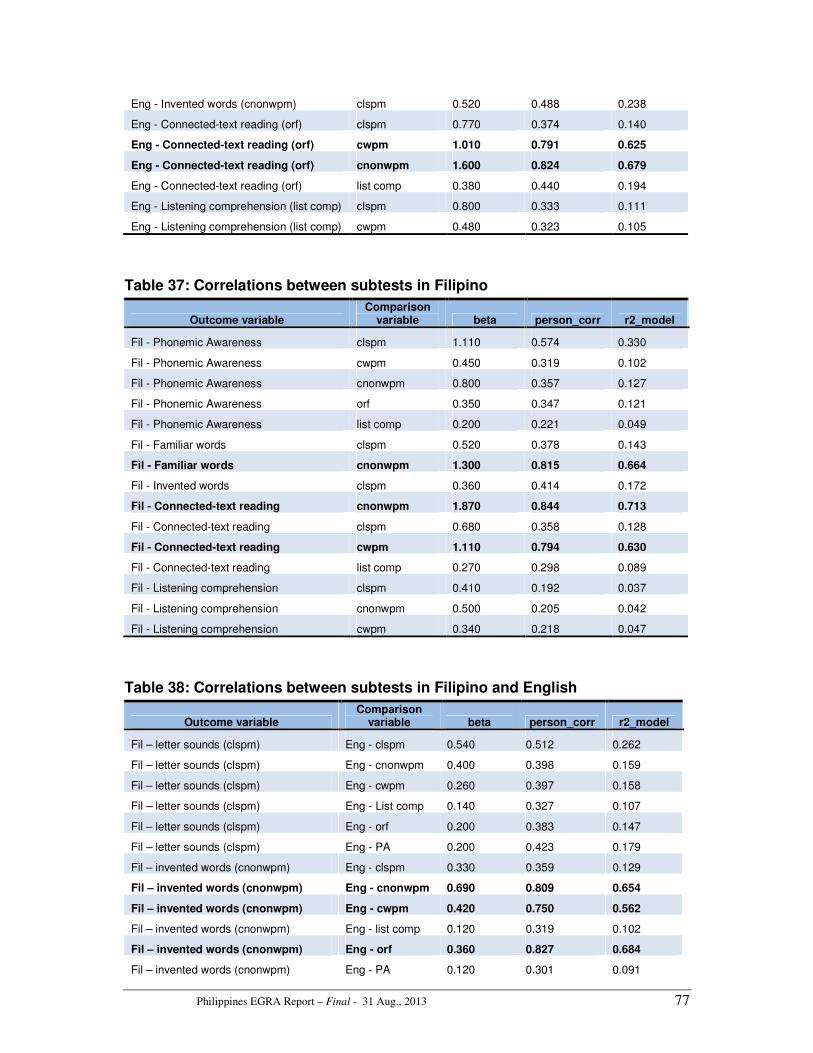
Philippines EGRA Report – Final - 31 Aug., 2013 77
Eng - Invented words (cnonwpm) clspm 0.520 0.488 0.238
Eng - Connected-text reading (orf) clspm 0.770 0.374 0.140
Eng - Connected-text reading (orf) cwpm 1.010 0.791 0.625
Eng - Connected-text reading (orf) cnonwpm 1.600 0.824 0.679
Eng - Connected-text reading (orf) list comp 0.380 0.440 0.194
Eng - Listening comprehension (list comp) clspm 0.800 0.333 0.111
Eng - Listening comprehension (list comp) cwpm 0.480 0.323 0.105
Table 37: Correlations between subtests in Filipino
Outcome variable Comparison
variable beta person_corr r2_model
Fil - Phonemic Awareness clspm 1.110 0.574 0.330
Fil - Phonemic Awareness cwpm 0.450 0.319 0.102
Fil - Phonemic Awareness cnonwpm 0.800 0.357 0.127
Fil - Phonemic Awareness orf 0.350 0.347 0.121
Fil - Phonemic Awareness list comp 0.200 0.221 0.049
Fil - Familiar words clspm 0.520 0.378 0.143
Fil - Familiar words cnonwpm 1.300 0.815 0.664
Fil - Invented words clspm 0.360 0.414 0.172
Fil - Connected-text reading cnonwpm 1.870 0.844 0.713
Fil - Connected-text reading clspm 0.680 0.358 0.128
Fil - Connected-text reading cwpm 1.110 0.794 0.630
Fil - Connected-text reading list comp 0.270 0.298 0.089
Fil - Listening comprehension clspm 0.410 0.192 0.037
Fil - Listening comprehension cnonwpm 0.500 0.205 0.042
Fil - Listening comprehension cwpm 0.340 0.218 0.047
Table 38: Correlations between subtests in Filipino and English
Outcome variable Comparison
variable beta person_corr r2_model
Fil – letter sounds (clspm) Eng - clspm 0.540 0.512 0.262
Fil – letter sounds (clspm) Eng - cnonwpm 0.400 0.398 0.159
Fil – letter sounds (clspm) Eng - cwpm 0.260 0.397 0.158
Fil – letter sounds (clspm) Eng - List comp 0.140 0.327 0.107
Fil – letter sounds (clspm) Eng - orf 0.200 0.383 0.147
Fil – letter sounds (clspm) Eng - PA 0.200 0.423 0.179
Fil – invented words (cnonwpm) Eng - clspm 0.330 0.359 0.129
Fil – invented words (cnonwpm) Eng - cnonwpm 0.690 0.809 0.654
Fil – invented words (cnonwpm) Eng - cwpm 0.420 0.750 0.562
Fil – invented words (cnonwpm) Eng - list comp 0.120 0.319 0.102
Fil – invented words (cnonwpm) Eng - orf 0.360 0.827 0.684
Fil – invented words (cnonwpm) Eng - PA 0.120 0.301 0.091

Philippines EGRA Report – Final - 31 Aug., 2013 78
Fil – familiar words (cwpm) Eng - clspm 0.460 0.321 0.103
Fil – familiar words (cwpm) Eng - cnonwpm 0.970 0.712 0.507
Fil – familiar words (cwpm) Eng - cwpm 0.720 0.804 0.646
Fil – familiar words (cwpm) Eng - List comp 0.160 0.264 0.070
Fil – familiar words (cwpm) Eng - orf 0.540 0.768 0.590
Fil – familiar words (cwpm) Eng - PA 0.170 0.267 0.071
Fil – list comp Eng - clspm 0.280 0.126 0.016
Fil – list comp Eng - cnonwpm 0.440 0.209 0.044
Fil – list comp Eng - cwpm 0.270 0.196 0.038
Fil – list comp Eng - list comp 0.250 0.273 0.075
Fil – list comp Eng - orf 0.280 0.259 0.067
Fil – list comp Eng - PA 0.140 0.140 0.020
Fil – connected-text reading (orf) Eng - clspm 0.640 0.316 0.100
Fil – connected-text reading (orf) Eng - cnonwpm 1.470 0.773 0.597
Fil – connected-text reading (orf) Eng - cwpm 0.900 0.716 0.513
Fil – connected-text reading (orf) Eng - list comp 0.320 0.377 0.142
Fil – connected-text reading (orf) Eng - orf 0.870 0.888 0.789
Fil – connected-text reading (orf) Eng - PA 0.260 0.299 0.089
Fil - Phonemic Awareness (PA) Eng - clspm 0.650 0.317 0.101
Fil - Phonemic Awareness Eng - cpm 0.600 0.313 0.098
Fil - Phonemic Awareness Eng - cwpm 0.390 0.310 0.096
Fil - Phonemic Awareness Eng - List comp 0.240 0.282 0.079
Fil - Phonemic Awareness Eng - orf 0.350 0.357 0.127
Fil - Phonemic Awareness Eng - PA 0.380 0.419 0.176