Embed Size (px)
Citation preview

A Motion Sensitive PC Interface ELEN E3390 Electronic Circuit Design Lab
Edward Chiang
Justin Foster Hua Gao
Eric Zhang
May 11, 2007

1 Abstract The goal of this project was to create a motion-based interface for a PC. One triple-axis accelerometer mounted on each of two hand-held controllers outputs voltage proportional to the acceleration of the devices. The acceleration levels of the x- and z-axes for each controller are used to amplitude modulate two sinusoids produced by local oscillators operating at 1 kHz and 4 kHz. Once modulated, the two sinusoids are summed together. The final signals for both controllers are piped into separate channels of the PC's line-in port. The analog signal is digitized through the A/D converters of the sound card processor. A java program implements real-time digital filters to separate the two channels of acceleration data for each controller. While there are many computer applications for the input acceleration data, in this project, we have created a video game that demonstrates successful motion capture.

2.1 Analog Components Block Diagram
Z-axis X-axis
Accelerometer
4 kHz Local Oscillator
1 kHz Local Oscillator
Σ
Z-axis X-axis
Accelerometer
1 kHz Local Oscillator
4 kHz Local Oscillator
Σ
Upconverter(Amplitude Modulation)
Player 1
Player 2
Preamp. Postamp.
Line-in
Line-in
User Interface

2.2 Digital Components Block Diagram
Line-in
Line-in
8-bit A/D Converter
(44.1 kSamples / sec)
IIR Chebyshev II Lowpass Filter
(5th order, -50dB @ 4 kHz)
IIR Chebyshev II Highpass Filter
(5th order,-50dB @ 1 kHz)
Peak Detector
Peak Detector
Computer IIR Chebyshev II Lowpass Filter
(5th order, -50dB @ 4 kHz)
8-bit A/D Converter
(44.1 kSamples / sec)
IIR Chebyshev II Highpass Filter
(5th order, -50dB @ 1 kHz)
Peak Detector
Peak Detector
Sound Card Input (Sampling)
Digital Signal Processing
Game Software
Graphical User Interface

3 Hand-held Controller
1.65V
3.3V Integrator
LED Control
To Main Circuitry
From Accelerometer
In order to allow the users to effectively input their hand motions into the computer, we produced two hand-held controllers. Each of the controllers included one triple axis ADXL330 3G accelerometer, of which we used two axes. The ADXL330 outputs three voltages which vary proportional to the acceleration the chip experiences in its x- y- and z-axes. We send each of the accelerometer output voltages through an op-amp buffer in order to isolate the signal and ensure that the remainder of our circuit has an adequate current source. From there the signal is spliced into two paths. One path goes to the main circuitry. In order to send two axes of acceleration data for two controllers (four channels of total information) over the stereo line-in input on the computer, we had to up-convert the signals. For each controller, the x and y axes outputs are used to modulate 1 and 4 kHz carriers, respectively. These AM modulated signals are then summed together and sent through one channel of the stereo line-in input. The same operations are performed on the accelerometer outputs on the second controller, and then sent through the other stereo line-in channel. The details of these operations will be discussed in later sections. The outputs of the accelerometers are also used to drive two banks of 11 LEDs per controller. These LEDs track the controller’s vertical and horizontal movement. Since acceleration is a very fast changing signal, we first passed the acceleration information through a lossy integrator to obtain velocity data which we use to drive our LED banks. Additionally, due to the fact that we are running off of a single 3.3V rail, we had to bias our input signal around 1.65V before sending it through the integrator. After the integrator circuit, we send the acceleration information for each axis to a set of comparators which ultimately drive the LEDs.
3.3V
LED Control

4 AM Modulator / Upconverter At first, we attempted to use a four-quadrant Gilbert cell multiplier to achieve amplitude modulation of our signal. Unfortunately, we were never able to get it working with any sort of stability, and the signal we got out of it was unpredictably distorted. We tried many methods to try to get it to work. We tried several biasing schemes and we tried using it as a linear multiplier instead of a current switcher between the two output collectors. In all of our attempts, the output was never stable and any movement of wires from the power supply or movement of the probe cables resulted in large shifts in harmonic components of our output. After several weeks, we decided to use a different approach to upconvert the accelerometer signal. The new scheme is shown below.
9V
Bandpass Filter Lowpass FilterHighpass
Filter
From Local Oscillator From
Controller
The local oscillator generates a square wave at the carrier frequency and turns the switch on and off. The voltage that passes through the second buffer is a chopped version of the accelerometer output, where half of the time the output is ground, and the other half of the time it is the accelerometer. Mathematically, this is equivalent to multiplying the accelerometer output with a square wave swinging between 0 and 1. Since the square wave can be expanded as an infinite sum of odd harmonic sinusoids, the chopped output will have a component that is the product of the accelerometer output and a sinusoid at the carrier frequency (1st harmonic). This, together with the pure first harmonic sinusoid, forms the amplitude modulation components – the carrier signal and the two sidebands. Therefore, we filter out the other harmonics and DC components and we center the output around a 4.5V DC offset. An example waveform is shown below, which assumes a sinusoidal modulating signal.
Chopped Signal Filtered Signal Exhibiting Amplitude Modulation
( ) ( )mod mod1 cos 2 square waveA m f tπ+ ×⎡ ⎤⎣ ⎦ ( ) ( )mod mod 01
1 cos 2 cos 2n carn
A m f t a a n f tπ π∞
=
= ⎡ ⎤+ × + ×⎡ ⎤⎣ ⎦ ⎢ ⎥⎣ ⎦∑
= ( ) ( ) ( )0 1 modcos 2 cos 2 cos 2 ... higher harmonicscar carA f t A f t f tπ π π+ + +
= ( ) ( )( ) ( )( )0 1 mod mod1cos 2 cos 2 cos 2 ... higher harmonics2car car carA f t A f f t f f tπ π π⎡ ⎤+ + + − + +⎣ ⎦
Carrier Sidebands

5 Local Oscillator 3.3V3.3V The local oscillator is made up of a sinusoidal oscillator which passes through a hard limiter, thus producing a square wave. The sinusoidal oscillator circuit uses a cross-coupled RTL inverter architecture and a tuned filter at either 1 kHz or 4 kHz. The resistors in series with the bases of the transistors serve to allow the collectors to swing a larger range in voltage (so that its not limited to VBE,on as its max voltage). With the LC filter in place, the collector voltages are positive half-wave rectified sinusoids that are out of phase with each other. This means that when one collector voltage is “low” (VCE,sat), the other collector is exhibiting the positive half-cycle of a sinusoid. Thus, we use a difference amplifier so that the output is a scaled version of one collector subtracting the other, which consequently is a full-wave sinusoid. As it states above, the signals are AC coupled into the difference amplifier. The reason for this is that we are using a single supply to power the op amp. As such, we can not achieve a DC coupled inverting amplifier (which would involve negative voltages), which is required in the difference amp as shown above. Instead, we use capacitors to couple in the collector voltages into a properly biased resistor network which is used with the difference amplifier so that no negative voltages are involved. The output of the difference amplifier, a full-wave sinusoid at 1 kHz or 4 kHz, is then AC coupled into a hard-limiter, which outputs a square wave that swings between ground and 9V. This is implemented with an op amp which is used as a comparator. The compared voltage is set by a potentiometer which controls the duty cycle of the square wave output. The potentiometer is used so that we can fine tune the duty cycle to 50%, which is required to suppress all the even-order harmonics of the square wave.
3.3V9V
9V
9V
Duty Cycle Control
Tuned Filter
Cross-coupled Inverter
Hard Limiter
Architecture Difference Amplifier
(AC coupled, not shown)

6 Digital Filters The amplitude modulated signals are passed into the computer through the Line-in port of the sound card, which has stereo capability and therefore two channels of input. Each channel takes a single controller’s data. The java software interfaces with the sound card, which performs analog to digital conversion of the input, to collect and extract the digitally sampled amplitude modulated signals. The sampling was set to a rate of 44.1 kHz and at a resolution of eight bits. Because each channel coming in through the Line-in port contains data at different frequencies added together, one for each of the two axes from the accelerometers, digital filters are needed to separate the axes information. Two digital filters have been designed to process each axis. A lowpass filter extracts the 1 kHz signal and a highpass filter extracts the 4 kHz signal. Both filters are 5th order Chebyshev II filters and have stopbands with a minimum of 50 dB attenuation. Chebyshev II filters were chosen because they can be implemented with lower order filter structures and they have no ripples in the passband. This way, the amplitudes of the AM modulated signals do not get distorted. The magnitude responses, pole zero diagrams, and block diagrams for both filters can be found on the following pages.

6.1 5th Order IIR Chebyshev II Lowpass Filter
z -1
z -1
z -1
z -1
z -1
z -1
z -1
z -1
z -1
z -1
Σ
Σ
Σ
Σ
Σ
Σ
x[n] y[n]
3.9933
-6.4629
-5.2867
-2.1824
0.3633
0.0038
-0.0070
0.0043
0.0043
-0.0070
0.0038
0 500 1000 1500 2000 2500 3000
-300
-200
-100
0
Frequency (Hz)
Pha
se (d
egre
es)
0 1000 2000 3000 4000 5000 6000-100
-80
-60
-40
-20
0
20
Frequency (Hz)
Mag
nitu
de (d
B)
Lowpass Filter Magnitude Response
-1 -0.5 0 0.5 1
-1
-0.5
0
0.5
1
Real Part
Imag
inar
y P
art
Pole-Zero Diagram Lowpass Filter
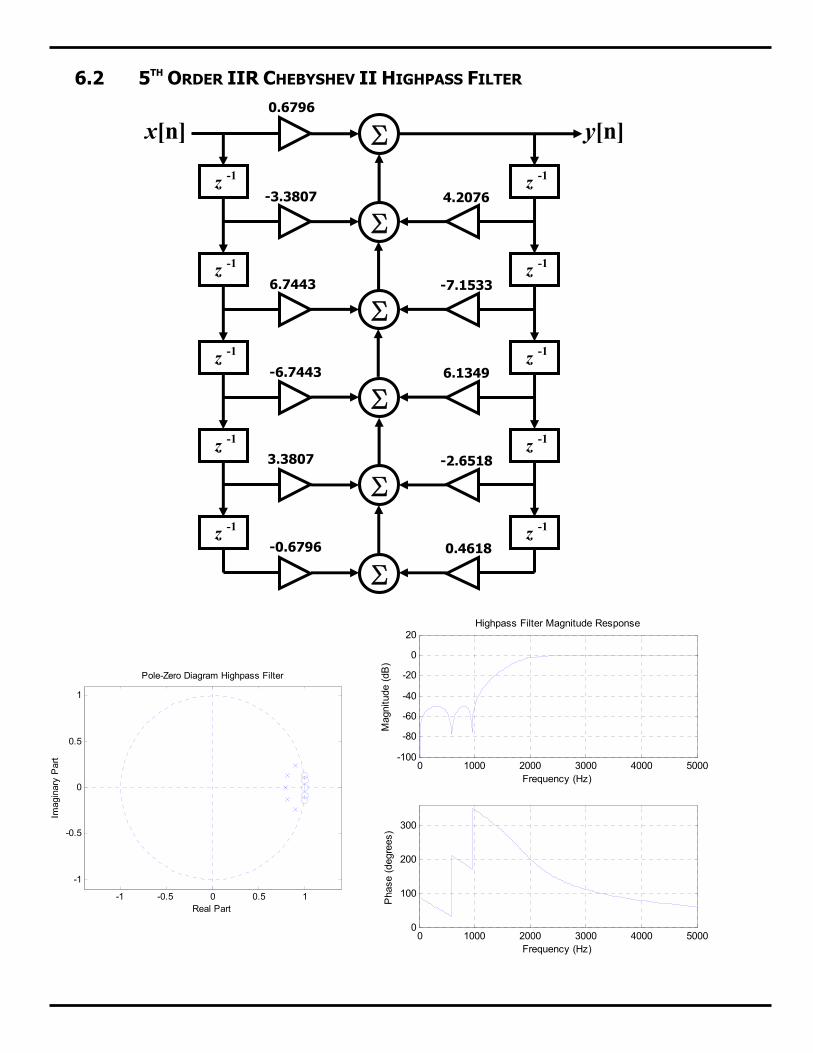
6.2 5TH ORDER IIR CHEBYSHEV II HIGHPASS FILTER
z -1
z -1
z -1
z -1
z -1
z -1
z -1
z -1
z -1
z -1
Σ
Σ
Σ
Σ
Σ
Σ
x[n]
4.2076
-7.1533
6.1349
-2.6518
0.4618
0.6796
-3.3807
6.7443
-6.7443
3.3807
-0.6796
y[n]
0 1000 2000 3000 4000 50000
100
200
300
Frequency (Hz)
Pha
se (d
egre
es)
0 1000 2000 3000 4000 5000-100
-80
-60
-40
-20
0
20
Frequency (Hz)
Mag
nitu
de (d
B)
Highpass Filter Magnitude Response
-1 -0.5 0 0.5 1
-1
-0.5
0
0.5
1
Real Part
Imag
inar
y P
art
Pole-Zero Diagram Highpass Filter

7 Computer Interface The programming part of the project was implemented in Java, which has a real-time, driver independent sound library. The library is found in the package java.sound.sampled.*; it allows the program to access the sound card data through a variety of channels and includes access to mixers and other sound processing functions. In our program, we chose to get raw data (8 bit samples representing amplitude at 44.1 kHz) from the sound card and run it through our own filters and peak detection functions. Sample Java code for reading data from the sound card is shown below. The AudioFormat class stores information on the desired format—sampling rate (44100 in our case), sample size (8 bits for us), number of channels (2), whether to used signed or unsigned numbers (signed), and whether the data should be big-Endian or little-Endian (big-Endian). A DataLine.Info object is then created to store the desired audio format and desired line type (a TargetDataLine is a capture line, a SourceDataLine is a playback line). The line is then initialized from the static AudioSystem class function getLine. After opening and starting capture on the line, the program initializes a thread to handle real-time data processing. In the thread, the byte array tempBuffer is used to store the data read from the line.

8 Software Peak Detection After filtering the signals, the program detects and records the peaks to calculate the envelope of the AM modulated data. This envelope is then used for the game logic. A good algorithm is required to do peak detection well since the signal entering the computer is noisy and small peaks may appear between the real peaks of the signal.
IF
IF
IF
Minimum = Y Detecting Minima
Detecting Maxima
Y > Minimum
Y < Minimum
IncrementCounter.
Maximum = Y
Maximum = Y Y > Maximum
Y < Maximum
IncrementCounter
Minimum = Y
IF
IF
Current Minimum is a peak:
Do associated actions.Reset counter, check for maxima on next cycle.
Current Minimum is not a peak:
Wait for next input.
Current Minimum is a peak:
Do associated actions.Reset counter, check for maxima on next cycle.
Current Minimum is not a peak:
Wait for next input.
Counter < 4
Counter == 4
Counter == 4
Counter < 4
Y
To detect the envelope, we first consider the properties of the signal: the faster signal is at 4 kHz, which, at a sampling rate of 44.1 kHz, represents 10 samples per period. Since we know that the signal must have alternating maxima and minima, we know exactly how many samples to look at before we are sure we have a peak and not just noise. The algorithm is outlined in the diagram below.

9 Graphical User Interface The interface of the game is shown below. Players can see their score, their avatar, and their avatar’s status. By swinging the controller, the player can cast their line into the water, and by hitting a fish with the lure, the player can hook the fish. Reeling a fish all the way back will add a score of one to the player’s total score. The first player to reach ten points wins the game.

10 Setup Instructions The program is written to read data from the active sound input port. However, the program does not work very well with a microphone in (or doesn’t work at all, depending on the computer), and so we use the Line-in port on the computer instead. First, the user must ensure that the Line-in input is selected on the computer.
To do this, open the sound properties window from the control panel:
Then, go to the Audio tab:

Then, click on the ‘Volume’ button:
Finally, check the ‘Select’ box in the ‘Line-In’ column of the volume window:
This will select the Line-in on the computer. Since sound cards vary in sensitivity, we recommend setting the Line-in volume to 50% initially and increasing or decreasing the volume to subsequently adjust the game’s sensitivity in the same direction. After doing this, running the game is a simple matter of double clicking the fishing.jar file containing the game, assuming the computer has Java correctly installed. Once the game starts, place both controllers flat on the table and click ‘Calibrate’ to calibrate the input. The game can then begin. When the game ends, the ‘Calibrate’ button can be pressed to restart it. However, it will also recalibrate the controllers so make sure the controllers are flat on the table before clicking.

![arXiv:2002.11726v1 [cond-mat.mes-hall] 26 Feb 2020 · Quenched topological boundary modes can persist in a trivial system Ching Hua Lee1,2 and Justin C.W. Song1,3 1Institute of High](https://img.pdfslide.us/doc/110x75/5f993a68296286560609c780/arxiv200211726v1-cond-matmes-hall-26-feb-2020-quenched-topological-boundary.jpg)
![Justin Bieber The Key Eau du Parfum 100mL Justin Bieber ...files.shoppersdrugmart.ca/offers/justin-bieber/july2013/JB3_presell... · [ ] Justin Bieber The Key 100mL $70.00* [ ] Justin](https://img.pdfslide.us/doc/110x75/5e5cf67620150154c60a2919/justin-bieber-the-key-eau-du-parfum-100ml-justin-bieber-files-justin-bieber.jpg)