Embed Size (px)
Citation preview

DOCUMENT RESUME
ED 470 293 TM 034 515
AUTHOR Miller, Shazia Rafiullah; Allensworth, Elaine M.; Kockanek,Julie. Reed
TITLE Student Performance: Course Taking, Test Scores, andOutcomes. The State of Chicago Public Schools: 1993 to 2000.
INSTITUTION Consortium on Chicago School Research, IL.SPONS AGENCY Joyce Foundation, Chicago, IL.; John D. and Catherine T.
MacArthur Foundation, Chicago, IL.; Spencer Foundation,Chicago, IL.
PUB DATE 2002-05-00NOTE 73p.; For a related report in the series, see TM 034 516.PUB TYPE Reports Research (143)EDRS PRICE EDRS Price MF01/PC03 Plus Postage.DESCRIPTORS *Academic Achievement; *Achievement Gains; *Course Selection
(Students); *Educational Change; *High School Students; HighSchools; Outcomes of Education; *Scores; Test Results;Testing Programs
IDENTIFIERS *Chicago Public Schools IL; Reform Efforts
ABSTRACT
Each report in "The State of Chicago Public Schools: 1993 to2000" makes up part of a comprehensive picture of how high schools changedunder Phase 2 of the Chicago, Illinois, educational reform efforts. Thisreport looks at student performance. Data from a variety of sources show thatin recent years the high school eligible students in Chicago's public schoolsimproved on a number of measures. These trends exist even though the analysesinclude students who dropped out of school between eighth and ninth grade orwere sent to Academic Preparatory Centers. More students were on track theirfirst year after elementary school (received no more than one failing gradein a core course and had enough credits to assume sophomore status on time,passed the algebra/geometry sequence by the end of their second year, andpassed an honors class sometime in their first year. Somewhat more studentsalso completed a college preparatory program and passed an honors or advancedplacement course over 4 years. The percent of students graduating by age 18rose slightly. Finally, the average scores on the Tests of Achievement andProficiency (TAP) rose substantially for the subset of students who enrolledin the ninth grade. Overall, this is good news for the Chicago public highschools. However, this good news is qualified by the fact that studentperformance itself, even by 2000, was still very poor on most measures. Fewerthan half of all students graduated, barely half were on track after theirfreshman year, and the dropout rate remained above 40%. Policies aimed atbringing in better prepared students appear to have worked, and these accountfor much of the improvement in student performance. No particular type ofschool was especially effective in improving students' performance on theTAP. Four appendixes contain sample data, technical notes, a description offirst-year course taking, and a chart of change in students taking the TAP byperformance on the eighth grade Iowa Tests of Basic Skills. (Contains 4tables, 29 figures, and 23 references.) (SLD)
Reproductions supplied by EDRS are the best that can be madefrom the on final document.

The State of Chicago Public High Schools: 1993 to 2000
TUDEITT PERFORIMIKE:Course Taking, Test Scores, and Outcomes
PERMISSION TO REPRODUCE ANDDISSEMINATE THIS MATERIAL HAS
BEEN GRANTED BY
--J:CL-EastonTO THE EDUCATIONAL RESOURCES
INFORMATION CENTER (ERIC)
a,
CONSORTIUM ON CHICAGO SCHOOL RESEARCH © 2002
BESTCO FrAVY4
U.S. DEPARTMENT OF EDUCATIONOffice of Educational Research and Improvement
EDUCATIONAL RESOURCES INFORMATIONCENTER (ERIC)
IfrThis document has been reproduced asreceived from the person or organizationoriginating it.
Minor changes have been made toimprove reproduction quality.
Points of view or opinions stated in thisdocument do not necessarily representofficial OERI position or policy.
Shazia Rafiullah minerElaine m. flllensworth
Julie Reed Rochanek
May 2002

ficknowledgments
This work could not have been completed without the consistent support and guidance of the analystsat the Consortium. Thanks to Matt Gladden, Holly Hart, Nicole Holland, Doug Lauen, Stuart Luppescu,Jenny Nagaoka, and Todd Rosenkranz for moral support and substantive expertise.
The Consortium's directors, Tony Bryk, Al Bennett, John Easton, Sarah-Kay McDonald,Melissa Roderick, Penny Bender Sebring, and Mark Smylie, along with Stacy Wenzel, suppliedinvaluable insights on the big picture and detailed assistance in structuring the report. Members ofour Steering Committee, Vickie Chou, Fred Hess, Angela Perez Miller, Don Moore, and BarbaraSizemore, along with Matthew Hanson and Arie van der Ploeg, also provided extremely helpfulfeedback on clarifying the information presented and taking additional steps.
Thanks to Rose Sweeney for her outstanding skills in editing and clarifying the text, SandraJennings for her inspired graphics and design skills, Pat Collins for keeping track of the details, andJohn Booz for his beautiful photographs.
Needless to say, we could not have performed this study without the continued support of theChicago Public Schools. Thanks to Phil Hansen and Ed Klunk who graciously provided us withinsights that helped ground our study, and to Sandra Storey, Andrea Ross, and Gudelia Lopez forhelping us understand CPS data.
This study was made possible by grants from the Joyce Foundation, the John D. and CatherineT. MacArthur Foundation, and The Spencer Foundation to support core research at the Consortium.

Student Parfo[rmancE Coarse 7a dngc rest Scores9 and OutcomesI le State o1 Maga Fat Ole So oat: 993 to 2000
Shazia Rafiullah Miller
Elaine M. Allensworth
Julie Reed Kochanek
May 2002
Series Summary 1
I. Introduction: The Context for Analysis 5
II. Preparation of Students Leaving Elementary School:Adjusting for Student Characteristics 9
III. Looking at Students' Full Experience in High School:Long-Term Indicators 13
IV. A More Current Snapshot: Short-Term Indicators 21
V. Tests of Achievement and Proficiency 29
VI. School by School Performance:Are Certain Types of Schools More Successful than Others? 35
VII. A Closer Look at Academic Preparatory Centers 47
VIII. Interpretive Summary 53
Appendix I. Sample for Each Analysis 55
Appendix II. Technical Notes on ITBS and TAP Scores 56
Appendix III. First-Year Student Course-Taking 60
Appendix IV. Change in Students Taking the TAP byPerformance on Eighth Grade ITBS 62
Endnotes 63References 65tk)

THE STATE OF CHICAGO PUBLIC HIGH SCHOOLS: 1993 to 2000
5

Sodes Summaq
Tile State of CTrIcago Pubk HO Schools: 'fi 993 t
THE WAVE OF REFORMS THAT FIRST HIT THE CHICAGOPublic Schools in the late 1980s focused primarily on greater local con-trol over schools. During this period (Phase I), there was considerableimprovement in Chicago public elementary schools. Change in the highschools, however, was minimal.
Beginning in 1995, a second wave of reform(Phase II) focused on strong mayoral control, highstakes accountability, and increased attention fromsystem administrators. Phase II included thesystemwide redesign of high schools.
This series tracks the performance of Chicagopublic high school students from 1993 to 2000using data from the last two years of Phase Ireform as a baseline for looking at the first fiveyears of Phase II. Each report in The State ofChicago Public Schools: 1993 to 2000 series makesup part of a comprehensive picture of how highschools changed under Phase II. This report looksat student performance. Declining High SchoolEnrollment: An Exploration of Causes trackschanges in high school enrollment and explorespossible causes. Changing Special EducationEnrollments: Causes and Distribution amongSchools, examines the increase in the percent ofstudents eligible for special education services andtheir distribution across schools.
Student Performance
Student Performance: Course Taking, Test Scores, andOutcomes shows that in recent years high schooleligible students in Chicago's public schoolsimproved on a number of measures. These trendsexist even though we include in our analyses the
students who dropped out of school betweeneighth and ninth grade, or were sent to AcademicPreparatory Centers. More students were on tracktheir first year after elementary school (received nomore than one failing grade in a core course andhad enough credits to assume sophomore statuson time), passed the algebra/geometry sequence bythe end of their second year, and passed an honorsclass sometime in their first year. Somewhat morestudents also completed a college preparatoryprogram and passed an honors or advancedplacement course over four years. The percent ofstudents graduating by age 18 rose slightly, andthe percent of students dropping out by age 18 fellslightly. Finally, the average score on the Tests ofAchievement and Proficiency (TAP) rose substan-tially for the subset of students who enrolled inthe ninth grade.
Overall, this is good news for Chicago publichigh schoolsstudents' likelihood of succeedingin school has increased. At the same time, this"good news" is qualified by the fact that studentperformance itself, even by 2000, was still verypoor on most measures. Fewer than half of allstudents graduated, barely half were on track aftertheir freshman year, and the dropout rate re-mained above 40 percent.
6

2 THE STATE OF CHICAGO PUBLIC HIGH SCHOOLS: 1993 to 2000
When measuring the effects of high schoolreform policies, the news is mixed. Policies aimedat bringing in better-prepared students appear tohave worked well and account for much of theimprovement in student performance. Thesystem's redesign of high schools in 1997, how-ever, appears to have had only a modest impact onincreasing the rate of the development of students'skills. The rates at which students graduated,stayed on track, passed the algebra/geometrysequence, and completed a college preparatoryprogram appear to be, in part, due to somethingbesides better-prepared students. On the otherhand, the increase in the frequency with whichstudents took honors and advanced placementcourses seems to have occurred primarily as aresult of students leaving elementary school betterprepared for high school.
No particular type of school (neighborhood,vocational, charter or small, extended elementary,or selective admissions) was especially effective atimproving students' performance on the TAP;individual schools from each category stood out.When looking at dropout rates, however, there is anoticeable pattern. Charter schools had substan-tially lower dropout rates after controlling for thecharacteristics of their incoming students.Selective admissions schools also did well.While Academic Preparatory Centers (APCs)generally had mixed results, a few had moresuccess than expected in keeping their studentsfrom dropping out.
Other Reports in the Series
Declining High School Enrollment
Declining High School Enrollment: An Explorationof Causes documents changes in high schoolenrollment from 1993 to 2000 and examines whythey occurred. Analysis shows that the introduc-tion of the promotion gate policy to CPS elemen-tary schools in the 1995-96 school year had aprofound effect on high school enrollment. As
lower achieving eighth-grade students were re-tained or sent to APCs, the size of ninth-gradecohorts shrank. Successive grades were affected assmaller cohorts moved through high school. Thebetter-prepared students who did make it to gradenine were less likely to spend more than four yearsin high school than in the past, thereby furtherdepressing enrollment. As a result of this reduc-tion in high school course repetition, the increasein eighth-grade retention was not accompanied bya decline in graduation rates by age 18.
Enrollment and Distribution of
Special Education Students
Changing Special Education Enrollments: Causesand Distribution among Schools examines in detailthe upward trend of special education enrollmentin high schools. The enrollment of students withdisabilities in ninth grade increased substantiallyover the period of our study, from 11.5 percent inthe 1993-94 school year to 16.4 percent in 1999-00. During this period, a larger percentage ofelementary students were identified as havinglearning disabilities, particularly in the latergrades. Although the proportion of students withdisabilities that was retained only rose slightly, theproportion of general education students that wasretained or sent to an APC rose dramatically.Moreover, students with disabilities were heavilyconcentrated in neighborhood high schools (ratherthan selective admissions, charter, small, or ex-tended elementary schools). Eleven neighborhoodhigh schools, all on probation and located in areaswith disproportionately high levels of low-incomeresidents, experienced an especially large increasein their enrollment of students with specialneedsfrom 16.3 percent in the 1993-94 schoolyear, to 30.1 percent in 1999-00. The overallgrowth of special education enrollment across thesystem resulted in the increased separation ofstudents with learning disabilities from generaleducation students in high school classrooms,especially in schools where a larger proportion ofstudents with disabilities was served.
7

The Unexpected Consequence of Reform Policies
Looking across the reports, we see that some of themost dramatic changes in CPS high schoolsbetween 1993 and 2000 were the consequences ofchanges in CPS elementary schools. This isespecially pronounced when looking at the long-term impact of the eighth-grade promotion gateadopted by the system in 1995-96.
One of the anticipated consequences of thepolicy to end social promotion was a studentpopulation better prepared to cope with thedemands of high school. In Student Performance,trends in graduation, course-taking, and test scoresall show improvement, much of which is attribut-able to better-prepared students in the highschools. On the other hand, Declining High SchoolEnrollment shows that high school enrollmentdeclined substantially between 1993 and 2000 duein part to fewer students passing the promotiongate and, because those who did enroll were betterprepared and less likely to repeat a grade, studentsmoved through the system more quickly. InChanging Special Education Enrollments, we seethat although the general education students whoenrolled in high school were better prepared, theycomprised a smaller percentage of incoming ninthgraders. Because relatively fewer general education
8
Student Performance 3
students were being promoted, high schoolsenrolled a greater concentration of students withdisabilities. This is especially true for those highschools whose traditional enrollment was made upof mostly low achieving students who were notpassing the promotion gate. The higher concentra-tion of students with disabilities made theirinclusion in general education classrooms morecomplex and difficult.
The reverberating effects of the eighth-gradepromotion gate show that before the systemadopts a policy to prompt change in the elemen-tary schools, it should be considered in light of itspossible long-term effects on high schools.
New Information on CPS High Schools
Outcomes for the 2000-01 school year show nosubstantial difference from the trends presented inthese reports, with the exception of the distribu-tion of students with disabilities being signifi-cantly less focused on neighborhood high schools.Updated data for 2000-01 will be posted on theConsortium's website (www.consortium-chicago.org). A planned fourth report in thisseries will look more specifically at the climateinside high schools. The projected date for thisreport's publication is January 2003.

4 THE STATE OF CHICAGO PUBLIC HIGH SCHOOLS: 1993 to 2000
9BEST COPY AVAILABLE

Bo On tir guition: Context Anallysis
OVER THE COURSE OF THE 1990s, CHICAGO PUBLICschools were the subject of a great deal of public attention, broadly scaledreforms, and sweeping changes. Under the decentralization reforms ofthe first half of the decade, a significant number of elementary schoolsmade well-documented progress in improving school organization, in-struction, and student performance.
High schools, on the other hand, showed fewsigns of improvement during this period. InCharting Reform in Chicago: The Students Speak(1996), Consortium researchers reported thatmost high schools were "designed for failure" andthat few students were prepared to participate inthe labor market or enter higher education. Overthe second half of the decade, the Chicago PublicSchools (CPS) tried to spur change in the highschools by implementing targeted reforms andsystemwide redesign) Other policy changes,especially the ending of social promotion inelementary schools, had major implications forhigh schools as well.
Although other researchers have carefullydocumented and evaluated specific reform strate-gies (Hess and Cytrynbaum, forthcoming), thisreport looks at broad indicators of improvementin high school student performance from 1993 to2000. We address three issues: What improve-ment, if any, has there been in student perfor-mance? What is the absolute level of performance?Is improvement the result of real changes in thehigh schools, or only a consequence of havingbetter-prepared students? We analyze traditionalperformance indicators such as standardized testscores and graduation and dropout rates, and newindicators such as measures of whether students
are "on track" to graduate one year after elemen-tary school and whether they complete a collegepreparatory program or pass any honors courses(see Table 1). In addition, we also look at howstandardized test scores and two-year dropout ratescompare among the different types of CPS highschools. (See Appendix I for descriptions of oursample group for each analysis.)
High School Redesign
CPS high school redesign centered on four dis-tinct sets of policies. Although these were imple-mented in individual schools to widely varyingdegrees, their major provisions were the sameacross the system:
Improve the quality of students entering highschool.
Mandate more challenging work.
Help students meet the demands of higherstandards.
Focus resources and penalties on extremelylow performing schools.
10

6 THE STATE OF CHICAGO PUBLIC HIGH SCHOOLS: 1993 to 2000
Table 1: Outcomes Included in this Study
Outcome Type
Length of Time Measured
One and Two Year Four Year
Basic Measures(adequateperformance)
On track Graduation
Dropout
Course-Taking(moderateperformance)
Algebra-geometrysequence
Full collegesequence
College sequencewithout foreignlanguage
Advanced Course-Taking(advancedperformance)
At least one honorscourse in thefirst year
At least onehonors course
At least oneAP course
AchievementScores
TAP readingTAP math
Better Prepared Students
A strong push to improve the quality of studentsentering high school entailed a systemwide policyrequiring students to meet specified performancelevels before they could matriculate. This directlyaddressed a claim long made by CPS high schoolteachers that they would have more success in theclassroom if students came to high school betterprepared.
Reform efforts in the elementary schoolsresulted in several years of rising eighth-gradescores on the Iowa Tests of Basic Skills (ITBS).2Eighth graders who did not meet a specified ITBScut-off score were generally retained in elementaryschool instead of promoted to ninth grade, or if astudent would be turning 15 by December 1 ofthe following academic year, he or she was sent toan Academic Preparatory Center (APC), ideallyuntil the ITBS cut-off score was met. APCs weredesigned to help students with weak skills makethe transition from elementary to high school byproviding additional academic and social support.With the implementation of the ITBS promotiongate and the creation of APCs, Chicago publichigh schools enrolled fewer students with weakbasic skills and, as a result, classrooms were filledwith higher achieving students.
In addition to the above initiatives, CPSworked to attract and retain more able students.In order to achieve this, the system planned acollege preparatory selective admissions highschool for each of the city's six regions (at the timeof publication, all but one was open). Theseschools were quite successful in encouragingbetter-prepared students to remain at, or enroll in,CPS high schools.3 The system also developed awide range of magnet programs inside existingneighborhood high schools to attract students whomight have otherwise enrolled in a selectiveadmissions school or left the system altogether.
A More Rigorous Curriculum
Research suggests that without stiff requirements,students often shy away from taking a heavycourse load or more challenging classes. And yet,when they are required to take these classes, theirstandardized test scores rise and their dropoutrates decrease.' The impact of a tougher academicprogram on minority students is even greaterthey earn higher wages after high school, and theracial divide in standardized test scores and gradu-ation rates diminishes.'
Starting with the freshman class of 1997-98,CPS students are required to complete a rigorousprogram of study that meets the entrance require-ments of competitive colleges like the Universityof Illinois at Urbana-Champaign: four years ofEnglish, three years of math (algebra, geometry,and advanced algebra/trigonometry), three yearsof social science, and two years of foreign lan-guage. Non-academic classes such as fine arts,physical education, and career exploration are alsorequired.' These new graduation requirements arecomparable to the "New Basics" recommended inA Nation at Risk (1983). In fact, with its foreignlanguage requirement, CPS's mandated curricu-lum actually exceeds the New Basics.
Increased Student Support
To counter a possible increase in the number ofdropouts brought about by the more challengingcurriculum, CPS introduced a range of initiatives
11

to help students through high school. Someschools were reorganized into extended elemen-.tary schools so students could complete ninthgrade in a smaller, more familiar environment.Junior and senior academies were set up withinhigh schools to smooth the transition fromelementary school for ninth graders and estab-lish more intimate and personable learningcommunities. All schools were required tolaunch an advisory program to provide studentswith a teacher-advisor to whom they could turnfor advice and guidance. Recovery programswere implemented to help students who failed acourse in the fall semester pass in the spring,and evening high school programs were openedfor students to make up credits needed forgraduation. Each school's commitment to theseinitiatives, and the extent of their implementa-tion, varied greatly.'
Attention for Low Performing Schools
CPS imposed a combination of penalties andincreased resources on extremely low performinghigh schools through the processes of remediation,probation, reconstitution, reengineering, andintervention. For the period of this study, high
1 2
Student Performance 7
schools that were performing poorly could beplaced under remediation and required to submitannual school improvement plans to the CPSCentral Office. Schools in which less than 15percent of students met national norms on theTests of Achievement and Proficiency (TAP) facedprobation. Schools on probation were monitoreduntil test scores exceeded the threshold or theyshowed significant improvement in five essentialareas: school leadership, professional developmentand training, instructional program, learningenvironment, and parent and community rela-tions.' Probation schools received approximately$100,000 in additional funds and were assignedan external partner from the educational commu-nity. In some cases, a business manager wasappointed to help manage day-to-day affairs sothat the principal could focus on other tasks.
Schools failing to make adequate progress underprobation faced reconstitution, reengineering, orintervention. Under these designations, all teach-ers, principals, and Local School Council mem-bers at these schools were placed under the threatof dismissal. In addition, the schools were assignedexternal partners and received $500,000 in addi-tional funding.

8 THE STATE OF CHICAGO PUBLIC HIGH SCHOOLS: 1993 to 2000
1 3 BEST COPY AVAILABLE

[111. PrBparation of Stiod.or
Adjus °rig foT %dont
Loavolig E0ognollitqf
Terziedsics
Sc
UNDERTHE SECOND PHASE OF REFORM IN THE LATE 1990s,the Chicago Public Schools mounted an aggressive campaign to improveits high schools. This campaign had four goals: improve the quality ofentering ninth-grade students; increase the rigor of the academic pro-gram; provide more support for students; and focus increased attentionon extremely low performing schools.
The first of these, improving the quality ofincoming students, was greatly affected by thesystem's implementation of the policy to end socialpromotion that took effect in the 1995-96 schoolyear. Under this policy, eighth graders who did notmeet a specified cut-off score on the ITBS typi-cally were retained or sent to an APC.
Obviously, this policy had a substantial impacton the characteristics of students entering highschool and has made more difficult the problem ofmeasuring accurately the impact of the system'sother high school reforms, especially in a study oftrends over time. Once the weakest students areremoved, the performance of those who do go onto high school improves by defaulthigherachieving students are the only ones being mea-sured. To address this, in this study we distinguishbetween two groups of students: those who enrollin ninth grade and all students who leave elemen-tary school (or all "high school eligible" students).This second group includes students who enroll inninth grade, APCs, or drop out between eighthand ninth grade.
We include both groupsall high schooleligible studentsin our measures of improve-ment (neither APC nor eighth-grade students takethe TAP so we can not include them in our
calculations of scores). In doing so, we ensure thatwe track a similar population over time and arebetter able to determine whether improvementsare the result of better-prepared entering studentsor of changes in the high schools. To adjust forchanges in incoming students, we control for race/ethnicity, gender, socio-economic status, specialeducation classification, age, if a student took theITBS, if a student was returning to CPS fromoutside the system or entering the system anew,and eighth-grade ITBS scores.' These are ouradjusted outcomes. (See Appendix II for a discus-sion of how we adjusted ITBS and TAP scores tocalculate accurate means.)
Rising ITBS Scores and Declining Leave Rates:
Improving the Pool of Entering StudentsOf all the characteristics we control for, the onlyone with substantial change was student prepara-tion as measured by eighth-grade ITBS scores.With the weakest students being retained, enroll-ing in APCs, or dropping out, one could assumethat students entering ninth grade after the imple-mentation of the promotion gate had higherscores. Indeed, ITBS reading scores for enteringninth graders rose from an average of 7.7 grade
14

10 THE STATE OF CHICAGO PUBLIC HIGH SCHOOLS: 1993 to 2000
equivalents (GEs) in 1993-94 to 8.4 in 1999-00(see Figure 1).10 In math, scores rose from 7.6 to8.7 (see Figure 2). For those students who lefteighth grade but did not enroll in high school(i.e., went to an APC or dropped out), scoresdeclined sharply after the policy's adoption. Mathscores recovered the following year, but readingscores only regained their 1993-94 levels in thelast year of our study. (The average scores for allhigh school eligible students between 1993 and2000 were the same as scores for the ninth-gradeonly population because the number of enteringninth graders far exceeded the number of APCstudents and eighth-grade dropouts.) On average,CPS students were leaving elementary schoolbetter prepared.
There was also an increase in the percent ofhigh achieving students going on to CPS highschools. In general, high achieving students werestill more likely than others to leave the systemafter elementary school. However, between the1995-96 and 1999-00 school years, the propor-tion of high achieving students who transferredout decreased by 30 percent, from 21.1 to 14.8(see Figure 3)." By the fall of 1999, the leave rateamong students in the top quartile was onlyslightly higher than that of students in the otherthree quartiles. This decline may be attributed insome part to the opening of several new selectiveadmissions schools.12 It is also important to notethat leave rates for students in the bottom twoquartiles increased slightly during this sameperiod.
Figure 1
ITBS Reading Scores Rise for Entering Ninth Graders,Not for APC Students or Pre-Ninth-Grade DropoutsLast year of elementary school
9.0
v,22 8.0o
5o-cu
a) 7.0
6.0
7.7
7.5
7.87.6
7.98.0
7.0
high school redesign
1.1
eighth-grade promotional gate
8.4
74
1993-94 1994-95 1995-96 1996-97
School Year
1997-98 1998-99 1999-00
Ninth-Grade APC Students andStudents Only I (Pre-Ninth-Grade) Dropouts
Note: Figure does not include bilingual students or students with disabilities; these populations are traditionallyexcluded from public reporting on the ITBS.
BESTCOPYAVAILABLE 15

25
20
15
10
5
Student Performance 11
MIS Math Scores Rise for Entering Ninth Graders,Not for APC Students or Pre-Ninth-Grade DropoutsLast year of elementary school
1993-94 1994-95
eighth-grade promotional gate
1995-96 1996-97
School Year
APC Students and(Pre-Ninth-Grade) Dropouts
1997-98 1998-99 1999-00
Ninth-GradeStudents Only
Note: Figure does not include bilingual students or students with disabilities; these populations are traditionallyexcluded from public reporting on the ITBS.
Figure 2
Fewer High Achieving Students Leave CPSbetween Eighth and Ninth Grades
11.5
8.3
6.4
13.5
8.7
7.2 6.8
12.5
9.8
17.9
12.5
9.2
164
13 14.3
11.3 11.48.7
37.5 8. 8.0high school redesign
eighth-grade promotional gate
9.4
7.9
0
1993-94 1994-95 1995-96 1996-97
School Year
1997-98
ITBS Achievement in Seventh Grade:
Top Quartile 3rd Quartile 2nd Quartile Bottom Quartile
1998-99 1999-00
Note: We look at seventh grade performance on the ITBS because selective enrollment high schools use thesescores for admissions decisions.
BEST COPYAVAILABLE16
Figure 3

12 THE STATE OF CHICAGO PUBLIC HIGH SCHOOLS: 1993 to 2000
1 '7BEST COPY AVAILABLE

DDDo Looking at Stude is° Fu 110 Ex pi akj
T Sc moll: Long:in 11 &atom
OUR EXAMINATION OF IMPROVEMENTS IN CHICAGOpublic high schools uses two sets of indicators: those that look at the fullhigh school experience, and those that look at short-term outcomes. Thefirst group includes graduation and dropout rates, percent completing a
college preparatory curriculum, and percent passing at least one honorscourse over four years.
Each is a cohort variable: for graduation anddropout rates, we track students starting at age 13,the year before the average student enters highschool, until they exit the system either by gradu-ating, dropping out, or transferring to a schooloutside of the system; for the others, we trackstudents from the year they become high schooleligible over four years. We adjust for studentcharacteristics on every measure to determinewhether improvements, if any, might be attributedto reform in the high schools, or are a result ofbetter-prepared students.
The indicators that make up the short-termoutcomes span fewer years. These include thepercent of students on track for graduation,percent passing the algebra/geometry sequence bythe end of tenth grade, and percent-passing anhonors course in the first year. These short-termmeasures help us get a more current picture ofstudent performance. As with the long-termmeasures, we adjust for student characteristics foreach to see if improvements were simply the resultof better-prepared students.
indicators of Basic PerformanceA high school diploma is the threshold require-ment for most post-secondary options; it is needed
to enroll in college, enlist in the armed forces, andsecure higher-paying jobs. In comparison tograduates, dropouts fare significantly worse interms of their employment eligibility, incomepotential, and likelihood of incarceration.'3Whether or not a student graduates or drops out isthe most basic performance measure for highschool.
For our measures of graduation and dropoutrates, we use the procedure outlined in theConsortium's 2001 report, Calculating a CohortDropout Rate." We track a cohort of students forsix years, from the fall of the school year they are13-years old (the age most students are in eighthgrade) until they are age 19. In this way, weaccount for students who drop out between eighthand ninth grade, not just for those that enroll inhigh school.
Graduation Rates Rise Slightly
Although graduation rates remained low, they didimprove slightly from 1993 to 2000 (see Figure 4).Of the CPS students who were 13-years old in thefall of the 1995-96 school year, 44.3 percentgraduated by age 18 in the spring of 2000. This isan increase of 3.7 percent over the graduation ratefor the 1992-93 cohort of 13-year-olds (40.6).Although we can track graduation rates to age 19
18

14 THE STATE OF CHICAGO PUBLIC HIGH SCHOOLS: 1993 to 2000
Figure 4
Graduation Rates Rise Only Slightly after Adjusting for Changes inStudent CompositionFollowed from age 13
60
55
50
45
40
35
30
(spring 1998)
51.0
51.0
40.6
40.6(spring 1997)
(spring 1999)
52.3
(spring 2000)
53.6
0
51.452.4
42.0
43.9
.........42.9
(spring 1999) 42.2
40.6 (spring 2000)
(spring 1998)
44.3
1992 1993
Unadjusted RateBy Age 19
1994 1995
Cohort(13 Years Old in September of Cohort Year)
01301:11Adjusted RateBy Age 19
Unadjusted RateBy Age 18
0E1E1E11Adjusted RateBy Age 18
for only three cohorts, we do see an upward trend,from 51.0 percent for the 1992-93 cohort to 53.6percent for students who were 13 in the fall of1995)
Even though this improvement is promising,the increase is cut in half when we adjust for thecomposition of incoming students. With anincrease of only 1.6 percent, the upward trend inadjusted graduation rates by age 18 is substantiallysmaller than the unadjusted one. Similarly, theadjusted trends for graduation by age 19 showimprovement of only 1.4 percent, compared to
2.6 for the unadjusted one. These adjustmentsindicate that only slight improvements ingraduation rates can be attributed to changes inthe high schools.
Slight Decline in Dropping Out Primarily
a Result of Better Prepared Students
Although the overall dropout rate for Chicagopublic high schools remains above 40 percent,there was a slight decline over the period of ourstudy. By the fall of 2000, 41.8 percent of the1995-96 cohort had dropped out of school. This
i 9

compares with 42.9 percentfor the 1994-95 cohort and43.6 percent for 1993-94 (seeTable 2).16
We could only calculatepartial rates for the more recentcohorts. That is, we couldfollow students for two to fiveyears, but not for six. Here wesee a slight downward trend indropping out by age 18 (from38.9 for the 1993-94 cohort to37.5 for 1996-97). Dropoutrate trends for students under18 are less clear. They showneither the consistent pattern ofdecline that we see in thecomplete cohort rates, nor apattern of increases.
Research has shown thatretention makes students morelikely to drop out in lateryears.17 Since the system'sadoption of the social promo-tion policy in 1995-96, CPShigh schools have received largerpercentages of students whowere retained prior to ninthgrade. In assessing the role ofhigh schools on graduation anddropout rates, it is necessary toadjust these rates for students'incoming achievement levelsand also adjust for the propor-tion of students that were heldback in eighth grade or inAPCs. Therefore, we includewhether a student was retainedin eighth grade with our othercontrols for student characteris-tics. With this adjustment, wesee only slight differencesamong the cohorts in dropoutrates (see Table 3). This indi-cates that the slight decrease in
BEST COPY AVAILABLE
Student Performance 15
Table 2: Percent of Students Dropping Outby Age and Cohort
DroppedOut by
AgeCohort
(schoo year expected to enter high school)
1993-94 1994-95 1995-96 1996-97 1997-98 1998-99 1999-00
14 4.4 4.6 4.4 3.9 3.9 4.2 4.0
15 8.8 8.7 8.0 7.7 7.7 7.9 7.3
16 18.0 17.5 16.8 18.0 18.1 17.2
17 29.3 29.4 28.4 29.3 28.8
18 38.9 38.6 37.9 37.5
19 43.6 42.9 41.8
Final YearFall
1998 1999 2000 2000 2000 2000 2000
Table 3: Adjusted Dropout Rates by Age and Cohort
DroppedOut by
AgeCohort
(schoo year expected to enter high school)
1993-94 1994-95 1995-96 1996-97 1997-98 1998-99 1999-00
14 4.4 4.7 4.5 3.6 3.2 3.5 4.0
15 8.8 8.8 8.2 7.4 7.4 7.6 7.6
16 18.0 18.0 17.5 18.4 19.0 18.7
17 29.3 30.2 29.5 30.8 31.2
18 38.9 39.5 39.1 39.4
19 43.6 43.9 43.1
Final YearFall
1998 1999 2000 2000 2000 2000 2000
iow to lead Tables 2 and 3
To read Tables 2 and 3, follow one cohort down a column until its finalyear. A cohort is identified by when its members turn 13 years old-thisis the year most students are in eighth grade. We begin tracking thecohort's dropout rate starting one year later, when members turn 14.The dropout rate is given as a percentage and followed down a column.
Following the 1993 cohort in Table 2. In the fall of the 1993-94school year at age 14-one year after we began following this cohort-4.4 percent had dropped out. The following year, at age 15, 8.8 percenthad dropped out. By the fall of 1995 at age 16, 18.0 percent droppedout; 29.3 percent by the fall of 1996 at age 17; 38.9 percent at 18; and43.6 percent had dropped out by the fall of 1998-99 at 19.
2 0

16 THE STATE OF CHICAGO PUBLIC HIGH SCHOOLS: 1993 to 2000
dropout rates is mostly the result of better-prepared students.
Indicators of Higher Levels of Student Performance
Students' performance in high school is equally asimportant an indicator as graduation and dropoutrates." Graduation rates describe only how manystudents meet the bare minimum of what weexpect from high schools. To measure whetherstudents meet more demanding expectations, wehave created indicators of higher levels of schoolperformance. One such indicator measureswhether students are accumulating the appropriatecredits to be accepted into a competitive collegelike the University of Illinois at Urbana-Champaign (UIUC). UIUC requires that enteringstudents have four years of English, three years ofmath, three years of social science, three years ofscience, and two years of foreign languagethesame requirements as those adopted by CPS in the
1997-98 school year with its redesign of highschools.
Another indicator of higher levels of perfor-mance is the percentage of students that attemptand pass an honors course during their highschool careers.'9 Chicago public high schools offermore demanding courses for students who arewilling and able to accept additional academicchallenges.2° While we have little guarantee thathonors classes are of comparable quality from oneschool to the next, we are reasonably sure thatwithin any one school, honors classes are moredemanding than the general curriculum. Weconfirm the trend in honors course-taking bylooking specifically at students who attempt andpass advanced placement (AP) courses.
When looking at both of these indicators, wetrack our cohorts for four years, from the timethey become high school eligible until the time an"on track" student would graduate.
BEST COPY AVAILABLE21

Student Performance 17
Figure 5
More Students Pass College Sequence Even after Adjusting forChanges in Student CompositionFour years after elementary school
20
18
16
14
12
1993-97 1994-98 1995-99 1996-00
Cohort
=Emu Full Sequence: Unadjusted o n o o Full Sequence: Adjusted
Note: The full college sequence includes four English, three math, three science, three social science,and two foreign language credits.
Small but Growing Number of Students Pass the
College Preparatory Sequence
Compared to all high school eligible students inthe cohort we followed from 1993 to 1997, thepercent of the 1996-2000 cohort that passed thefull college sequence in four years rose from 9.6percent to 15.8, with the largest increase occurringin the final year (see Figure 5). One might arguethat these numbers are artificially low because weinclude both dropouts and enrolled students whodid not graduate in four years (students whotransfer out of the system are not included). Of allfour-year graduates, almost one-third successfullycompleted the college preparatory sequence (30.1percent), up from about one-fifth (12.1 percent).Nonetheless, although there has been substantialimprovement on this measure, the vast majority ofstudents still did not complete the sequence.
When we adjust for student characteristics, thepercent of students who became high schooleligible in 1996 that took a full college sequenceby 1999-00 is only 12.8 percent, up from 9.6percent for the 1993-97 cohort. This suggeststhat of the 6.2 percent increase in the unadjustedrate, 25 percent is due to the change in studentcomposition and 75 percent is due to otherfactors (such as increased requirements).
Completion of a moderated college preparatory sequence. We
also looked at the percent of students who com-pleted the college sequence with the exception ofthe foreign language requirement. This is anacademic program acceptable for admission to lessselective colleges like Chicago State University. Ahigher and rising percentage of students met theserequirements, from 15.2 of the 1993-97 cohortup to 23.5 percent of the 1996-00 cohort (seeFigure 6). Among CPS students who graduated in
22

18 THE STATE OF CHICAGO PUBLIC HIGH SCHOOLS: 1993 to 2000
2000, we see the biggest jump with a full 45.2percent meeting these reduced requirements. Evenafter adjusting for changes in student composi-tion, we still see a 5.6 percent increase, up from31.6 for the 1993-97 cohort. Again, this increasesuggests that most of the improvement is notsimply a result of changes in enrollment.
More Students Pass an Honors Course in Four Years
Over the period of our study, a substantial andrising percentage of CPS students took and passedhonors courses at some point during their highschool careers (see Figure 7).2' For the most recentcohort (those who became high school eligible in1996 and expected to graduate in 2000), over one-fourth of students (25.9 percent) took and passedat least one honors course in four years, up slightlyfrom 22.9 percent. Of the students from thiscohort who did graduate within four years (ratherthan transfer, drop out, or not graduate), 44.3percent took and passed at least one honorscourse.22
When we adjust for student composition, thereis virtually no change between the percent of
students in the 1993-97 cohort who passed anhonors course and the percent of the 1996-00cohort that passed. The adjusted rate for allcohorts hovered at around 22 percent. Thisindicates that the rising percentage of studentstaking an honors course is due primarily tobetter-prepared students.
A similar pattern with AP courses. Because the meaningand challenge of honors courses can vary widelyacross schools, we look in particular at the trend ofstudents taking and passing AP courses. APcourses are more elite than honors classes and arealigned to the national AP exam. We found a
similar pattern: a slight increase in the number ofstudents who attempted and passed an AP course(from 6.4 percent of the 1993-97 cohort to 8.0percent for the 1996-00 one). Adjusted trendsshow no improvement, remaining steady at about6.5 percent. Since 98.9 percent of all students whopassed an AP course either transferred out of thesystem or graduated, looking only at the studentswho graduated from a CPS high school raises thispercent, from 13.3 percent for the graduating classof 1997 to 15.2 for the graduating class of 2000.
2 3

Student Performance 19
More Students Pass College Sequence without Foreign LanguageEven after Adjusting for Changes in Student CompositionFour years after elementary school
1993-97 1994-98 1995-99 1996-00
Cohort
Partial Sequence: Unadjusted 0000 Partial Sequence: Adjusted
Note: The partial college sequence includes four English, three math, three science, and three social science credits.
Figure 6
Slightly More Students Pass Honors Course, but not afterAdjusting for Changes in Student CompositionFour years after elementary school
1993-97 1994-98 1995-99 1996-00
Cohort
Honors: Unadjusted ci Honors: Adjusted
Note: Honors courses include honors, telescoped honors, International Baccalaureate, and advancedplacement courses.
r
Figure 7
BESTCOPYAVAILABLE

20 THE STATE OF CHICAGO PUBLIC HIGH SCHOOLS: 1993 to 2000
25

OV. A Move C ntS Ps TOCOOM OFkatrs
THE INDICATORS WE HAVE LOOKED AT THUS FARdescribe student performance over the course of a full high school career.One disadvantage of these cumulative measures is that because they takeplace over a long time period they are relatively insensitive to even largechanges in policies and practices.
To understand more current trends, therefore, wemust also look at short-term outcomes. Theseinclude students' success in their first year afterelementary school and whether they are passingmore challenging coursework.
More Students On Track to
Graduate after Ninth G deStudents' performance in their first year afterelementary school is critical to the overall successof their high school careers. We created a baselineindicator of first-year success that determineswhether a student is "on track" or not. To be ontrack, a student must earn enough credits toassume sophomore status on time and havereceived no more than one failing grade in acore course (English, math, science, and socialscience). Students who are sent to APCs ordrop out are automatically off track. Being onor off track is highly correlated with long-termperformance; students who are off track after theirfirst year have tremendous difficulty catching upand graduating within four years. In the 1996-97school year, 78 percent of high school eligible
students who were on track one year after elemen-tary school graduated within four years. Only 15.6percent of off-track students graduated within thissame period.
The on-track measure is sensitive to changes inits two key components: how many coursesstudents take, and how well they do in them. Bycounting credits we learn whether students takeand pass an adequate course load to graduatewithin four years. We identify unacceptableperformance by counting the number of failinggrades students receive in core courses. Together,we get a baseline indicator of acceptable (but notnecessarily strong) academic performance for highschool eligible students.
Despite Steady Improvement Only Half of Ninth
Graders On Track in 1999-00
In the 1999-00 school year, 50.6 percent of allhigh school eligible students were on track tograduate within four years. Although thispercentage is low, it is still a substantial im-provement since 1993-94, when only 42.2percent of high school eligible students were ontrack (see Figure 8).
2s

22 THE STATE OF CHICAGO PUBLIC HIGH SCHOOLS: 1993 to 2000
Figure 8
More Students On Track Even after Adjusting for Changes inStudent CompositionOne year after elementary school
60
55
50 -
VI
45 45car
al
40
35
30
48.9 48.7
42.2
high school redesign
eighth-grade promotional gate
50.6
474
1993-94 1994-95 1995-96 1996-97
School Year
Unadjusted
1997-98
Adjusted
1998-99 1999-00
2 7 BESTCOPYAVAILABLE

After adjusting for changes instudent composition, 5.4percent more students were ontrack (from 42.2 percent in1993-94 to 47.6 percent in1999-00). This suggests thatslightly less than half of theimprovement in on-track ratesis the result of better-preparedstudents entering highschools; more than half is dueto other factors.
The improvement in on-trackrates is the result of two factors:students enrolled in many morecourses and they passed them ata slightly higher rate (see Figures9 and 10). In 1993-94, theaverage student attempted 4.9credits, slightly under the fiveneeded to matriculate to tenthgrade. With the system's highfailure rates, students receivedeven fewer credits. By the 1999-00 school year, students at-tempted an average of 5.7credits. This increase, coupledwith a decrease in failure rates,resulted in more studentsbeing on track. In the 1999-00 school year, the averagestudent received 4.6 credits,up from 3.7 in 1993-94,almost a full course more.
Off -Track Students Have
Difficulty Recovering
Can off-track students get backon track? Not very easily. Forstudents who were off track aftertheir first post-elementaryschool year in 1993-94, only6.1 percent were able to getback on track by the end of the
Student Performance
Students Attempt and Receive More CreditsOne year after elementary school
23
Figure 9
75.5% 74.0% 76.0% 78.4% 77.2% 77.2% 80.7%pass rate pass rate pass rate pass rate pass rate pass rate pass rate
1993-94 1994-95 1995-96 1996-97 1997-98 1998-99 1999-00
School Year
Attempt Receive - - - Full Course Load
Note: Five credits is a full course load for a first year high school student.
tenth gradeor had enoughcredits to matriculate to the11th grade and received nomore than one failing grade in acore course that year (see Figure11). This number rose to 8.9percent for students off track in1997-98 (starting with thesummer of 1997 we includecredits earned in summerschool), but dropped again to6.1 after the number of creditsrequired to move to the 11thgrade increased from 10 to 11.In general, students remainedoff track because they did nothave enough credits rather thanbecause of high failure rates.
28
Percent of Students Pursuing More
Challenging Course Work Rises
As with long-term indicators ofmoderate and advanced studentperformance, the percent ofstudents pursuing more chal-lenging course work on similarshort-term measures also rosefrom 1993 to 2000. More highschool eligible students at-tempted and passed the algebra/geometry math sequence by theend of the tenth grade, andmore attempted and passed anhonors course their first yearafter elementary school. Thissuggests that the long-term
BEST CM AVAILABLE

24 THE STATE OF CHICAGO PUBLIC HIGH SCHOOLS: 1993 to 2000
Figure 10
Passing Rates RiseOne year after elementary school
90
85
80
.12cu
4c5 75
Vv4-)
o_
70
65
78.6
70.1
67.266.4
63.1
83.3
63.0
65.864.7
high school redesign
eighth-grade promotional gate
82.2
77.7
72.571.5
69.9
601993-94 1994-95 1995-96 1996-97
School Year
1997-98 1998-99 1999-00
Foreign Language English Science Social Science Math
trend of students passing honors courses andcompleting a college preparatory curriculum overtheir full high school careers will continue to rise.
More Students Passing Algebra/Geometry Sequence
The algebra/geometry sequence has been docu-mented in research literature as a gatekeeper forcollege enrollment.23 From 1993 to 2000, therewas a steady increase in the percent of CPS stu-dents attempting and passing these courses,especially after they were made a requirement forgraduation in the 1997-98 school year (see Figure12).24 In the 1993-95 school year, 36.5 percent ofall high school eligible students passed the
sequence two years after graduation fromelementary school. By 1998-00, that percenthad risen to 49.7.
When we adjust for the characteristics ofincoming students, the trend is still up substan-tially. For the 1998-00 cohort, 50 percent ofstudents passed the sequence, compared with 37in 1993-95. This suggests that changes inincoming students account for only 17.8 percentof improvement, while other changes, possiblycurricular reforms in the high schools, accountfor the bulk of the improvement (82.2 percent).As we will show later in this report, this rise isconsistent with improved student performance on
29

Student Performance 25
Few Off-Track Students Get Back On TrackTwo years after elementary school
10
9
8
7
7.3
8.9
6.16.3
6 E 00000000 oo
5.
4
increased creditrequirements
high school redesign
eighth-grade promotional gate
1993-94 1994-95 1995-96 1996-97 1997-98 1998-99
School Year
Fall and Spring Credits Only Summer Credits Included
Note: In the 1998-99 school year, credit requirements increased from 10 to 11 for sophomores.Summer school transcripts became available only in 1995-96
Figure 11
More Students Pass Aigebra and Geometry Even afterAdjusting for Changes in Student CompositionTwo years after elementary school
60
55
50
45
40
35
30
25
20
36.536.5
35.3high-school redesign
49.747.6
eighth-grade promotional gate
1993-95 1994-96
111
1995-97 1996-98
School Year
Unadjusted Adjusted
33
1997-99 1998-00
Figure 12

26 THE STATE OF CHICAGO PUBLIC HIGH SCHOOLS: 1993 to 2000
What Courses Are Students Taking?
Over the course of this study, high school eligible students were taking and passing more courses incore subjects. However, in English and math, arguably the subjects with the most emphasis, therewas actually a slight decline in the percent of students attempting courses and only a slight increasein the percent passing them. The biggest increase was actually in social science and science courses.In the 1993-94 school year, only 55 percent of students attempted a social science course and 35percent passed. By 1999-00, 75 percent of students, a full 20 percent more, attempted a socialscience course and 53 percent passed it. The trend for science is similarin the 1993-94 schoolyear, 62 percent of students attempted a science course and 42 percent passed; that percentage roseto 78 percent attempting and 56 percent passing in 1999-00.
Although the improvement in course-taking trends began before the imposition of the newgraduation requirements, there was a substantial bump in 1997-98 when they went fully into effect.Despite the new requirements, however, there was virtually no change in the percent of high schooleligible students attempting foreign language classes in their firstyear, which hovered around 12percent for the entire period of our study. Since this is only a two-year requirement, however, nottaking a foreign language class in a student's first year after elementary school is not necessarilyproblematic. See Appendix III for figures showing the percentage of first-year students taking corecourses from 1993 to 2000.
the math section of the TAR While there is alwaysthe possibility that schools are changing the namesof math courses without actually changing thecontent, the increase in adjusted TAP scoressuggest some real gain in mathematics learning inhigh schools (see Figure 15 on page 30).
Although this improvement is substantial, forstudents graduating by the year 2001, both thealgebra/geometry sequence and advanced algebra/trigonometry are requirements for graduation. Inthis light, a 51 percent passing rate still means thathalf of all high school eligible students are behindin their math requirements two years after elemen-tary school.
Number of Students Passing an
Honors Course Rises Substantially
Earlier we saw an upward trend in studentsenrolling in honors courses across a standard highschool career (see Figure 7 on page 19). Here too
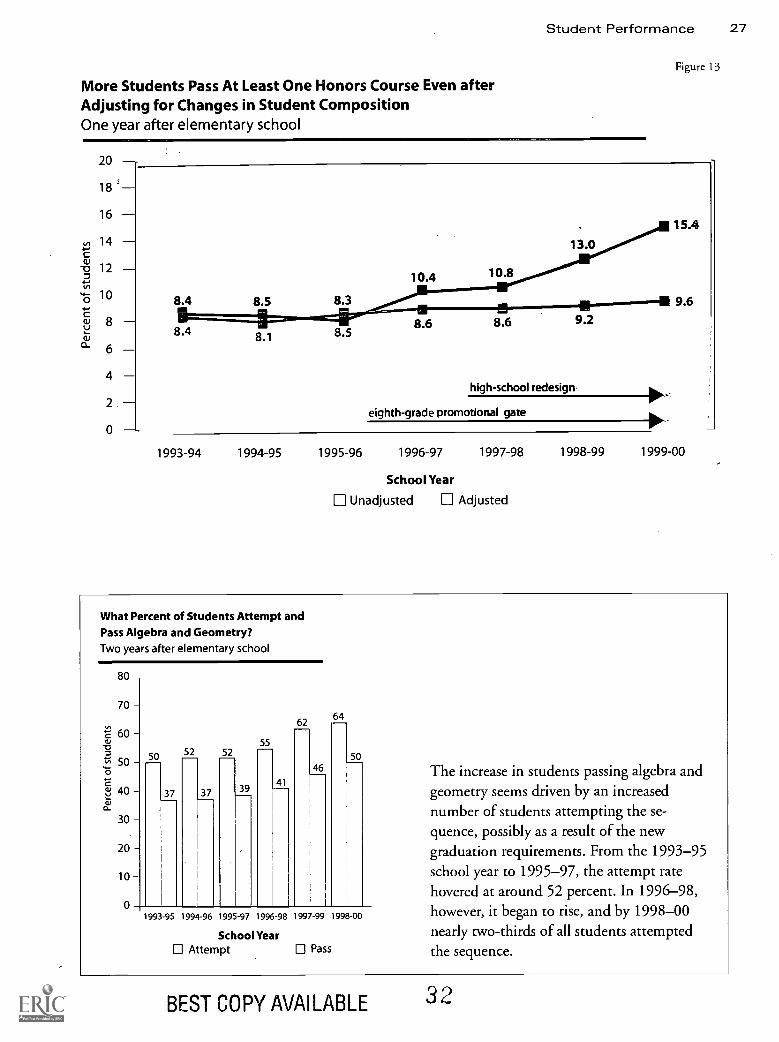
there is a similar trend. In the first three years ofour study, about 8.4 percent of first-year studentspassed at least one honors course. In 1996-97however, this increased to 10.4 percent, and itcontinued to rise for the next three years (seeFigure 13). By 1999-00, 15.4 percent had passedan honors course. This corresponds to the increasein students attempting these courses, which rosefrom 9.2 percent in 1993-94 to 16.6 percent in1999-00.
Once we adjust for changes in student composi-tion however, we see only a small increase in thepercent of students passing an honors course, from8.4 percent in 1993-94 to 9.6 in 1999-00 (seeFigure 13). From these more modest gains, wecan assume that most of the growth is the resultof the demographics of incoming students,particularly their higher ITBS scores, rather thanchanges in the high schools.
31
Student Performance 27
More Students Pass At Least One Honors Course Even afterAdjusting for Changes in Student CompositionOne year after elementary school
20
18'
16
14
12
10
8
6
4
2
0
Figure 13
8.4 8.5 8.3
8.4 8.58.1
13.0
10.4 10.8
8.6 8.6
high-school redesign
eighth-grade promotional gate
15.4
9.6
9.2
1993-94 1994-95 1995-96 1996-97 1997-98
School Year
Unadjusted Adjusted
1998-99 1999-00
What Percent of Students Attempt andPass Algebra and Geometry?Two years after elementary school
80 _
70
60
50
40
30
20
10
50
37
52 52
37 39
55
41
6264
4650
993-95 1994-96 1995-97 1996-98 1997-99 1998-00
School YearAttempt IEJ Pass
The increase in students passing algebra andgeometry seems driven by an increasednumber of students attempting the se-quence, possibly as a result of the newgraduation requirements. From the 1993-95school year to 1995-97, the attempt ratehovered at around 52 percent. In 1996-98,however, it began to rise, and by 1998-00nearly two-thirds of all students attemptedthe sequence.
BEST COPY AVAILABLE 32

28 THE STATE OF CHICAGO PUBLIC HIGH SCHOOLS: 1993 to 2000
33

Flo Tests ®d Ac 'Wellfffiel a Adder
EVEN AFTER WE ADJUST FOR THE CHARACTERISTICS OFstudents taking the Tests of Achievement and Proficiency (TAP), westill find marked improvement over time. Standardized TAP scoresallow us to compare the performance of CPS students to other stu-dents across the country.
Nationally, the average grade equivalent (GE)score for the ninth grade is 9.8. A student withthis score performs like an average ninth grader inthe eighth month of the school year. Among CPSninth graders who took the test, there was enor-mous improvement from 1993 to 2000, especiallyafter the 1997-98 school year (unlike the otherindicators in this report, we examine TAP scoretrends for ninth-grade students only, not for allstudents leaving elementary school).
TAP Scores Rise to National AveragesTAP Scores rose substantially after the implemen-tation of the promotion policy in 1996. Averagescores in reading improved from 8.2 GEs in1993-94 to 9.8 GEs in 1999-00. In math, scoresrose from 8.3 GEs in 1993-94 to 10.0 in 1999-00 (see Figures 14 and 15). Chicago's average isnow comparable to the national average in readingand slightly above the national average in math.
About Half of the Improvement
Due to Better Prepared Students
Even after adjusting for differences in studentcomposition over time, we still find a significant
upward trend. In reading, adjusted scores rosefrom 8.2 to 9.1, or 0.9 GEs, and in math they rosefrom 8.3 to 9.1, or 0.8 GEs. This amounts tonearly a year's additional learning in both subjects.Both unadjusted and adjusted trends showstrong improvement in ninth graders' basicskills. This indicates that only part of theimprovement from 1993 to 2000 is a result ofthe enrollment of better-prepared students inhigh schools.
Was Improvement Affected by Excluding Students?
Our adjusted trends suggest that about half of theimprovement in student achievement is due tochanges in the characteristics of students enteringninth grade. We can see this directly when we lookat the percent of students taking the TAP whoscored in each ITBS quartile in eighth grade. Herewe see that while the percent of students who tookthe TAP who had ITBS scores in the top threequartiles increased, the percent from the bottomquartile fell from 32.8 to 17.1. This decline beganimmediately after the implementation of thepromotion gate policy in the 1995-96 school year(see Figure 16). Absolute numbers declined in asimilar fashion, with a drop of over 3,000 students
34

30 THE STATE OF CHICAGO PUBLIC HIGH SCHOOLS: 1993 to 2000
Figure 14
Ninth-Grade TAP Reading Scores Rise Even after Adjusting forChanges in Student Composition
11
QJ8 10-1
4E'ai
zcr 9.a)ar
rn11'
ra 8
7
3.6
3.2 100,0018.68.2
1993-94 1994-95
8.6
9.1 9.1
a nnnnnnnnW.
oo Nr..3.1 8.7
4111 000oo
8.28.2
high-school redesign
eighth-grade promotional gate
1995-96 1996-97
ei Ei iil a Adjusted Reading Score
School Year
1997-98
9.8
, 9.1
1998-99 1999-00
Unadjusted Reading Score
Figure 15
Ninth-Grade TAP Math Scores Rise Even after Adjusting forChanges in Student Composition
11
:1_3
0 10u
'E'cu
To.>mCT 9 a nnna, 8.6 9.2 0000 9.1ru
ill oo(t) 8.3 8.7 8.78.3
8.341.,,,,,,
8.4ro8
9.2 9.2
9.9 10.0
8.3
high-school redesign
eighth-grade promotional gate
1993-94 1994-95 1995-96 1996-97 1997-98 1998-99 1999-00
Unadjusted Math Score
35
ing Adjusted Math Score
School Year
Student Performance 31
Means Versus Medians
This report uses average TAP scores over time. CPS reports medians. Although the scores are lower whenusing TAP median scores to assess change over time, the overall trend remains the same. Because someyear-by-year increases in TAP scores may be due to variations in the test form, these figures compare theyears in which students took the same form of the test. Looking across time by test form (color-coded on
the graphs), we still see strong gains over time.
Ninth-Grade TAP Median Reading Scores Rise
10
8.2
7.8
eighth-grade high schoolpromotional redesign
gate
8.6 8.6
8.1
9.1
.3
9.1
9.8
9.1
1993-94 1994-95 1995-96 1996-97 1997-98 1998-99 1999-00
School Year
Form K Mean Reading Scores El Form L Mean Reading Scores 1-1 Form M Mean Reading Scores
I I Form K Median Reading Scores Form L Median Reading Scores I Form M Median Reading Scores
Ninth-Grade TAP Median Math Scores Rise
10
eighth-gradepromotional gate
high schoolredesign
9.90.0
9.2 9.2
8.6 8.6
8.3 8.383
8.0
7.7
1993-94 1994-95 1995-96
111 Form K Mean Math Scores
Form K Median Math Scores
9.4
1996-97 1997-98 1998-99 1999-00
School Year
Form L Mean Math Scores Form M Mean Math Scores
111 Form L Median Math Scores I Form M Median Math Scores
36

32 THE STATE OF CHICAGO PUBLIC HIGH SCHOOLS: 1993 to 2000
from the lowest quartile and increases in the otherthree quartiles (see Appendix IV).
The improvement in TAP scores does notappear to be a result of high schools discouragingmore (low achieving) students from taking theTAP. The percent of first-time ninth graders whoseTAP scores are included for reporting actually roseslightly, from 66.4 to 68.8 percent between the
1993-94 and 1999-00 school years (see Figure17). Although there was a slight increase in thepercent of students not taking the TAP at all(from 20.2 to 21.0 percent), there was a biggerdecrease in the percent of students who took theTAP, but were not included in reporting (from13.4 to 10.2 percent).
Figure 16
Fewer Entering Ninth Graders Score in Bottom Quartileon Eighth-Grade Reading
50
45
40
1'3 35
-o30
48 25a)
20
15
10
5
0
32.8
37.0 36.7
36.1
19.9 17.8
9.1
8.5E -------
35.1
19.1
44.544.6
41.2 ....*41""`.... 41.4
26.2
21.8
24.7 25.9
19.7
13.1
26.8
17.1
109 ....... M 11.4.
high school redesign
eighth-grade promotional gate
1993-94 1994-95 1995-96
BottomQuartile
0 0 0 0 0
1996-97 1997-98
Quartile
SecondQuartile
1998-99 1999-00
Third ma TopwQuartile Quartile
3l

Student Performance 33
Figure 17
More First-Time Ninth Graders Take the TAP
1993-94 1994-95 1995-96 1996-97 1997-98 1998-99 1999-00
School Year
Included in TAP Reporting
Tested, but Excluded from TAP Reporting
Did Not Take the TAP
38

34 THE STATE OF CHICAGO PUBLIC HIGH SCHOOLS: 1993 to 2000
BEST COPY AVAILABLE
39

ooll-by-Sc mil Patna co
FROM 1993 TO 2000, STUDENT PERFORMANCE IN CPShigh schools improved, if only slightly, on every indicator. At the sametime, this improvement did not occur uniformly across high schoolssome saw dramatic improvement while others continued to lag behind.Was there a pattern of success among the different types of schools?
In recent years, there has been a proliferation inhigh school choices for students. We comparedTAP scores and two-year dropout rates for sixdifferent types of schools that existed in the 1999-00 school year: extended elementaries, charter andsmall schools, selective admissions, schools onprobation, APCs, and neighborhood and voca-tional schools.25
TAP scores provide a measure of students' basicskills in reading and math by the end of the ninthgrade. It is important to recognize, however, thatthe proportion of students who make it throughninth grade affects the average scores for eachschool. Schools with higher proportions of stu-dents dropping out prior to the TAP will havehigher scores than similar schools where thesestudents remain. To balance this, we also examinetwo-year dropout rates. For each measure, we firstlook at the unadjusted performance of eachschool. Then we look at the value added by eachschool in each category. Because schools serve verydifferent populations of students, we control forstudent characteristics to determine the averageamount each school adds to its students' TAPscores and the school's impact on the likelihood ofa student dropping out within two years.
TAP Scores by School
The observed (unadjusted) reading and math TAPscores by school category are not too surprising.(See page 40 for a description of school catego-ries.) We see that selective admissions schools hadthe highest overall TAP scores and probationschools had the lowest (see Figures 18 and 19).But school means tell us little about how muchschools contribute to students' learning. Studentsthat enroll in probation schools are not alwaysvery well prepared, whereas selective admissionsschools receive the academic cream of the crop.
To examine the value added by high schools, wecreated a model that shows us how well schoolsperformed in comparison to what we wouldexpect given the characteristics of their incomingstudents. The most important factor in thisadjustment was students' incoming ITBS scores.(See Appendix II for a full discussion of how theadjustments were made.) The average value addedof all the schools is zero. Therefore, if a school hada score above zero, it performed better thanexpected given the population of students itserved; if it had a score below zero, it performedworse (see Figures 20 and 21). While all of theschools together have an average score of zero,
40

36 THE STATE OF CHICAGO PUBLIC HIGH SCHOOLS: 1993 to 2000
Figure 18
1999-00 TAP Reading Scores for Ninth GradersNot adjusted for any change in student composition
grade level (9.8 GEs)
DouglassSeward
DyettChavezLozano
Hope
HancockPerspectives
Nuestra AmericaACT
Noble StBest Practices
Future CommonsChicago International
North Lawndale
411111K1M116111,411P4ffle
. rAL
Northside PrepJones
Southside PrepYoung
Lane TechChicago Agricultural
Von SteubenLindblom
Chicago Military
WestinghouseCrane
CorlissFlowerAustin
RichardsFenger
FarragutCalumet
HirschTilden
MarshallManley
SpaldingGage Park
SennHarlanHarperPhillips
Keivyn ParkRobeson
JuarezWells
OrrSouth Shore
EnglewoodClemente
DunbarDu Sable
Carver
Lincoln ParkForeman
CollinsProsserSchurz
AmundsenSteinmetzLake View
JulianSullivan
Morgan ParkCurie
BoganKelly
BowenSimeon
HubbardKenwoodRoosevelt
Chicago VocationalMather
KennedyTaft
Hyde ParkWashington
1
6 8 1'0 1I2 14
Average Grade Equivalent Score
41

1999-00 TAP Math Scores for Ninth GradersNot adjusted for any change in student composition
Student Performance 37
Figure 19
grade level (9.8 GEs)
SewardChavezLozano
DouglassDyettHope
Noble StBest Practices
HancockPerspectives
Nuestra AmericaACT
North LawndaleFuture Commons
Chicago International
JonesNorthside Prep
Lane TechLindblom
YoungSouthside
Von SteubenChicago Agricultural
Chicago Military
MarshallRichards
WestinghouseCorlissCraneWells
CalumetManley
OrrSpalding
SennFenger
South ShoreAustinTildenHarlanFlowerPhillips
FarragutHarper
ClementeKelvyn Park
CarverRobeson
JuarezEnglewoodGage Park
HirschDunbar
DuSable
Extended Elementaries
Charter/Small Schools
Selective Admission Schools
Probation Schools
1:3 Neighborhood Schools
ProsserJulian
Lake ViewForeman
SchurzKelly
KenwoodSteinmetz
Lincoln ParkTaft
SullivanAmundsen
CollinsRoosevelt
CurieMorgan Park
SimeonKennedy
Chicago VocationalBowen
Hyde ParkMather
HubbardBogan
Washington
6 8 10
Average Grade Equivalent Score
42
12 14

38 THE STATE OF CHICAGO PUBLIC HIGH SCHOOLS: 1993 to 2000
Figure 20
1999-00 TAP Reading Scores for Ninth GradersAdjusted for changes in student composition
Douglass -Seward -
Dyett -Chavez -Lozano -Hope -
Hancock -Perspectives -
Nuestra America -ACT -
Noble St -Best Practices -
Future Commons -Chicago International -
North Lawndale -
Northside Prep -Jones -
Southside -Young -
Lane Tech -Chicago Agricultural -
Von Steuben -Lindblom -
Chicago Military -
Westinghouse -Crane -Corliss -Flower -Austin -
Richards -Fenger
FarragutCalumet
HirschTilden
MarshallManley
SpaldingGage Park -
Senn -Harlan -Harper -Phillips -
Kelvyn Park -Robeson -
Juarez -Wells -
Orr -South Shore -Englewood -
Clemente -Dunbar -
DuSable -Carver -
Lincoln Park -Foreman -
Collins -Prosser -Schurz -
Amundsen -Steinmetz -Lake View -
Julian -Sullivan -
Morgan Park -Curie -
Bogan -Kelly -
Bowen -Simeon -
Hubbard -Kenwood -
Roosevelt -Chicago Vocational -
Mather -Kennedy -
Taft -Hyde Park -
Washington -
iwiavreta4vIivAstwerimmvi,,,top:oovorsa
L
1 0.75 0.5 0.25 0.250.25 0.5 0.75 1.25 1.5
Grade Equivalents Grade EquivalentsBelow Predicted Above Predicted
43
Os'

Student Performance 39
1999-00 TAP Math Scores for Ninth GradersAdjusted for changes in student composition
SewardChavezLozano
DouglassDyettHope
Noble StBest Practices
HancockPerspectives
Nuestra AmericaACT
North LawndaleFuture Commons
Chicago International
JonesNorthside Prep
Lane TechLindblom
YoungSouthside Prep
Von SteubenChicago Agricultural
Chicago Military
MarshallRichards
WestinghouseCorlissCraneWells
CalumetManley
OrrSpalding
SennFenger
South ShoreAustinTildenHarlanFlowerPhillips
FarragutHarper
ClementeKelvyn Park
CarverRobeson
JuarezEnglewoodGage Park
HirschDunbar
Du Sable
ProsserJulian
Lake ViewForeman
SchurzKelly
KenwoodSteinmetz
Lincoln ParkTaft
SullivanAmundsen
CollinsRoosevelt
CurieMorgan Park
SimeonKennedy
Chicago VocationalBowen
Hyde ParkMather
HubbardBogan
Washington
Figure 21
ti
L
Extended ElementariesCharter/Small SchoolsSelective Admission SchoolsProbation SchoolsNeighborhood Schools
I
1 0.7'5 0.5 0.25 0 0.25 0.5 0.75 1 1.25 1.5
Grade Equivalents Grade EquivalentsBelow Predicted Above Predicted
44

40 THE STATE OF CHICAGO PUBLIC HIGH SCHOOLS: 1993 to 2000
The Different Types of CPS High Schools
Extended Elementary Schools are grade schools that include a ninth grade; they generally enroll freshmenfrom their own eighth-grade classes. Extended elementaries are meant to ease students' transition to highschool.
Charter Schools are exempt from many of the restrictions placed on regular CPS high schools, but they arenot allowed to use selection criteria in their admissions. Each school develops its own mission and servessomewhat different populations.
Selective Admissions High Schools were established to attract and retain the best students in the system.Enrollment is academically selective.
Probation High Schools are neighborhood (general admission) high schools placed on probation becausethe bulk of their students (85 percent or more) failed to score at or above national norms. Even thoughthese schools are under the threat of sanctions, they also receive extra resources to finance improvementefforts and facilitate partnerships with external partners.
Academic Preparatory Centers (APCs) prepare very low scoring eighth graders for high school. AlthoughAPC students do not take the TAP, we can compare their two-year dropout rates.
Neighborhood High Schools serve the general population and primarily enroll students from their owngeographic area. Vocational High Schools have a specific mission to prepare students for a particular career.They also generally enroll students from the surrounding area. These two types of schools are combined inour analyses. None of these schools were on probation in 1999-00.
Note: Some schools may use criteria for admission that are not controlled for in our analyses, such as recommenda-tion letters and elementary school attendance. In these cases, their students' outcomes may appear better than those ofstudents in other schools simply because of this selection bias.
categories of schools can be positive or negative.For example, Hyde Park Academy's unadjustedninth-grade TAP reading scores were above thenorm for ninth graders at 10.0 GEs, but they wereactually 0.6 GEs lower than we would expectgiven the students enrolled there. By comparison,Crane High School's average TAP reading scoreswere 0.6 GEs below the national norms at 9.2, butthey are 0.6 GEs higher than we would expectgiven the students it enrolled.
For reading, schools' value added ranged from0.8 GEs lower than we would expect given theirincoming population (North Lawndale HighSchool), to 1.2 GEs above the expected score
(Westinghouse). In math, value added rangedfrom nearly 1.0 GEs below expected performance(Washington), to 1.5 GEs above (Marshall).
Many of the schools whose value added wassubstantially worse than expected test a higherpercentage of their students than those with ahigh value added. For example, North Lawndaletested 100 percent of its students in reading and99 percent in math, while Marshall only tested89 percent of its students in each subject (seeTable 4).
After adjusting for student background, eachtype of school showed mixed results. Nevertheless,there are some notable findings within each of the
45

Student Performance 41
Table 4: Percent of Students Taking the TAP in 2000
School Reading Math School Reading Math
Extended Elementary Schools Hirsch 86 86
Hope Community 96 98 Kelvyn Park 78 74
Lozano Bilingual 100 100 Manley 81 81
Chavez 79 79 Marshall 89 89
Seward 92 92 Phillips 82 81
Douglass 84 80 Senn 85 82
Dyett Middle 90 88 South Shore 84 80
Charter/Small Schools Tilden 74 74
Best Practices 89 89 Wells 85 83
North Lawndale 100 99 Spaulding 96 96
Hancock 95 95 Englewood 81 81
Future Commons 94 94 Orr 81 81
ACT 91 91 Clemente 88 87
Nuestra America 86 86 Carver 86 83
Noble Street 94 94 Corliss 85 87
Perspectives 100 100 Juarez 79 79
Chicago International 64 64 Neighborhood Schools
Selective Schools Chicago Vocational 89 89
Jones 100 100 Prosser 96 95
Lane Technical 96 96 Simeon 93 93
Lindblom 92 93 Amundsen 84 84
Southside Prep 94 94 Bogan 87 87
Von Steuben 94 94 Bowen 76 76
Northside Prep 97 98 Foreman 81 81
Chicago Agricultural 99 99 Hyde Park 94 94
Chicago Military 97 97 Kelly 77 76
Young Magnet 98 98 Kennedy 91 91
Probation Schools Lake View 91 89
Dunbar 92 92 Mather 88 88
Flower 90 90 Morgan Park 95 95
Richards 88 90 Roosevelt 82 81
Westinghouse 95 96 Schurz 84 84
Austin 78 78 Steinmetz 86 86
Calumet 72 72 Sullivan 76 75
Crane 84 83 Taft 85 84
DuSable 82 82 Lincoln Park 90 91
Farragut 81 81 Washington 84 85
Fenger 84 84 Hubbard 94 94
Robeson 86 86 Kenwood 92 92
Gage 87 87 Curie 94 94
Harlan 84 82 Julian 83 83
Harper 82 81 Collins 82 84
4 6

42 THE STATE OF CHICAGO PUBLIC HIGH SCHOOLS: 1993 to 2000
groupings. In many selective admissions schools,ninth graders scored even higher than we wouldexpect given their incoming students' alreadyadvanced abilities. Most of the newly createdregional magnets performed especially well.However, Chicago Military Academy performedworse than expected, especially in math, given thebackground of its ninth graders.
The value added by probation schools washigher than for some neighborhood schools, aftertaking differences in incoming population intoaccount. In Figure 21, when we look at thenumber of schools with better than expectedachievement (those to the right of the line) andthose with worse than expected achievement(those to the left of the line), we see that over halfof the probation schools performed better thanexpected in reading and about half of them did so
in mathematics. Just over a third of neighborhoodschools showed better than expected scores inreading or math. Many charter and small schoolsperformed somewhat worse on the TAP than one
would predict given their student population (seeAppendix IV).
The extended elementaries had mixed results,suggesting that the format worked effectively insome schools but not in others. The evidencecertainly does not indicate that keeping ninthgraders in the smaller, more protected environ-ment of elementary education is a foolproofmethod of increasing learning. The mixed resultswithin each category demonstrate that none of themodels give us a clear blueprint. Rather, theparticular workings of individual schools accountfor their success or lack thereof.
Dropout Rates
Turning to two-year unadjusted dropout rates, wefind APC dropout rates were extremely high (seeFigure 22). Extended elementaries, neighborhoodschools, and schools on probation had mixedresults, although probation schools reported ahigher dropout rate than other neighborhoodhigh schools. Selective admissions schools had
47

very low dropout rates, and charterschools' rates were also low.
Adjusted dropout rates present a verydifferent pattern than the TAP scores afterwe control for the populations the schoolsserved. Some with relatively high absolutedropout rates actually kept more studentsenrolled than we might expect once wetake into account the characteristics oftheir incoming students. For example,Hayes APC had a two-year dropout rateof nearly 44 percent, but it actually keptabout 6 percent more students than wewould expect (see Figure 23). Similarly,some schools with low dropout rates hadslightly higher dropout rates than wewould expect given the population theyenroll. For example, Lincoln Park had atwo-year dropout rate of about 13percent, but had about 12 percent morestudents drop out than we wouldexpect. (Please note that a lower drop-out rate is better.)
One of the most noticeable patterns isthat most selective admissions schools andmost charter and small schools had lowerdropout rates than we might expect giventheir student population. This is especially signifi-cant for the charter and small schools, many ofwhich have made preventing students fromdropping out part of their core missions. It is alsonoteworthy that while the APCs as a group hadextremely high overall dropout rates, some of theAPCs, especially Hayes, Partee, and Dorsey, kept
Student Performance 43
more students enrolled than we might expect.Neighborhood and probation schools showed asomewhat mixed set of outcomes, althoughprobation schools did not look significantly worsethan other neighborhood schools once we con-trolled for their student composition.
48

44 THE STATE OF CHICAGO PUBLIC HIGH SCHOOLS: 1993 to 2000
Figure 22
Two-Year Dropout Rates: Fall 1998 to Fall 2000Not adjusted for any change in student composition
Hayes APCDorsey APCPartee APC
Sengstacke APCProctor APC
Rodriguez APCHernandez APC
Olive APCHarvey APC
DouglassHope
LozanoSewardChavez
North LawndaleACT
HancockFuture Commons
Best PracticesChicago International LongwoodChicago International Bucktown
Nuestra AmericaPerspectives
JonesLane Tech
Chicago AgriculturalLindblom
YoungSouthside Prep
Von Steuben
SpaldingHirschWells
ClementeCrane
MarshallSouth Shore
CalumetOrr
JuarezFenger
RichardsEnglewoodGage Park
FlowerWestinghouse
RobesonDunbar
Kelvyn ParkPhillipsHarlanCorlissManleyHarper
FarragutDu Sable
TildenSenn
CarverAustin
MatherChicago Vocational
TaftForeman
KellySimeonProsserCollinsBogan
Lake ViewKennedy
AmundsenJulian
Morgan ParkSteinmetz
KingCurie
SchurzHubbard
Hyde ParkWashington
BowenKenwood
SullivanRoosevelt
Lincoln Park
'. s -,,/,'' ,ti ,..,,,.,
,v))4,,,,,yi.,7,,,, ,,.,,,,- c,.,A.-... ,.) .. 0.-
?.'c. t ay ', v. 1.,- ,' ,-..
7
0% 10% 20% 30% 40% 50% 60%
49
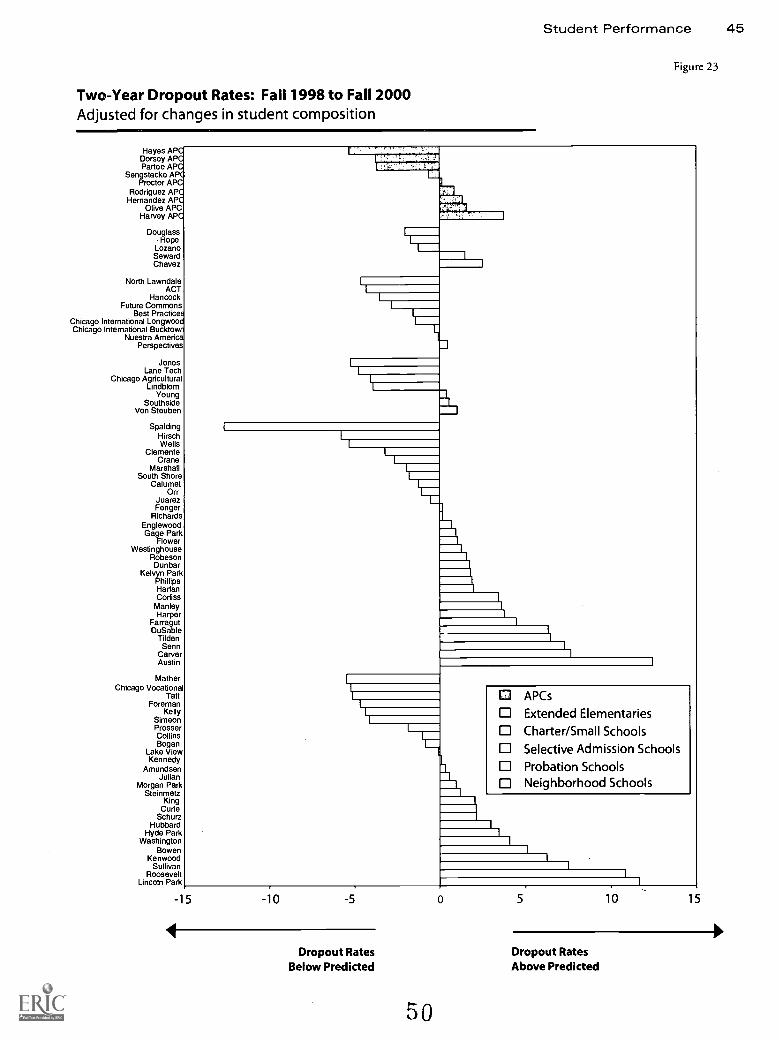
Student Performance 45
Figure 23
Two-Year Dropout Rates: Fall 1998 to Fall 2000Adjusted for changes in student composition
Hayes APCDorsey APCPartee APC
Sengstacke APCProctor APC
Rodriguez APCHernandez APC
Olive APCHarvey APC
DouglassHope
LozanoSewardChavez
North LawndaleACT
HancockFuture Commons
Best PracticesChicago International LongwoodChicago International Bucktowr
Nuestra AmericaPerspectives
JonesLane Tech
Chicago AgriculturalLindblom
YoungSouthside
Von Steuben
SpaldingHirschWells
ClementeCrane
MarshallSouth Shore
CalumetOrr
JuarezFenger
RichardsEnglewoodGage Park
FlowerWestinghouse
RobesonDunbar
Kelvyn ParkPhillipsHarlanCorliss
ManleyHarper
FarragutDuSable
TildenSenn
CarverAustin
MatherChicago Vocational
TaftForeman
KellySimeonProsserCollinsBogan
Lake ViewKennedy
AmundsenJulian
Morgan ParkSteinmetz
KingCurie
SchurzHubbard
Hyde ParkWashington
BowenKenwood
SullivanRoosevelt
Lincoln Park
L_
APCs
Extended Elementaries
Charter/Small Schools
Selective Admission Schools
Probation SchoolsE l Neighborhood Schools
-15 -10 -5 0 5 10 15
Dropout RatesBelow Predicted
Dropout RatesAbove Predicted

46 THE STATE OF CHICAGO PUBLIC HIGH SCHOOLS: 1993 to 2000
BEST COPY AVAILABLE
51

VOL A Om Look at Acadenic Preparatory Canal
WHEN ACADEMIC PREPARATORY CENTERS (APCs) WEREestablished in the 1997-98 school year, there were conflicting opinionsabout the effects they would have. Their purpose was to help transition tohigh school those students who were too old for elementary school buthad yet to meet the ITBS achievement thresholds required for graduationfrom eighth grade.
Ideally, these students would benefit from acurriculum specially designed to prepare them forthe rigors of high school (somewhat like theSummer Bridge program in elementary school)and students who enrolled directly in high schoolfrom the eighth grade would benefit from a morechallenging classroom environment.26 On theother hand, some worried that APCs would onlybe a "cooling out" place for low-performingstudents to go until they tired of school anddropped out. Our evidence suggests that APCperformance fell somewhere in the middle of theseopposing views.
What is the Typical Educational Experience
of APE Students?Approximately 1,600 students enroll in APCs forthe first time each year.27 The curriculum focusesprimarily upon remedial math and English;students do not receive high school credit for thiscoursework, although other classes are offered forcredit. In the 1999-00 school year, the averageAPC student enrolled in 2.9 credit-granting (non-remedial) courses and earned 2.2 creditsabouthalf of the typical course load for a first-year high
school student (see Figure 24; for a comparison toall high school eligible students, see Figure 9 onpage 23). Less than 5 percent attempted a fullcourse load and over 65 percent failed at least onecourse.
In 1999-00, only 17 percent of APC studentsattempted high school English and 26 percentattempted high school math (the rest generallyenrolled in remedial math and English classes,which are not offered for credit). Very few enrolledin science or foreign language coursesless than 5percent each year. The only high school-level corecourse that was common among APC studentswas social science, 70 percent attempted it in1999-00. For the low percentage that took highschool core courses, an even smaller percent passed(see Figure 25; for a comparison-to all high school
eligible students, see Appendix III on page 60).
Dropout Rates Especially High
Since their establishment in 1997-98, roughly aquarter of all APC students drop out in their firstyear. For the 1997 cohort, the dropout rate was 28percent; 25 percent for the 1998 cohort; and 24percent for 1999. Two years after the 1997 cohortenrolled in an APC, 48 percent had dropped out
52

48 THE STATE OF CHICAGO PUBLIC HIGH SCHOOLS: 1993 to 2000
Figure 24
APC Students Do Not Attempt or Pass aFull High School Course Load
6
5
73% 70% 76%pass rate pass rate pass rate
3.3
2.9
01997-98 1998-99
School Year1999-00
El Attempt Receive Full Course Load
Note: Five credits is a full course load for a high school student.
53
(see Figures 26,27, and 28).This compares to a 15 percentdropout rate for the 1998-99cohort of all students whoentered ninth grade. Still,some of the APCs had fewerdropouts than we wouldexpect given the characteristicsof their incoming students (seeFigure 23 on page 45).28
Enrollment in High School
During the period of our study,about half of first-time APCstudents went on to high schoolafter one year; 41 percent of the1997-98 cohort, 58 percent ofthe 1998-99 cohort, and 57percent of the 1999-00 cohort.Correspondingly, in each ofthese three years, a substantialgroup that did not drop out alsofailed to make enough progressto move on to high school.These students were retained inAPCs for a second year. In1997-98,22 percent of studentswere retained after one year and11 percent were retained in eachof the following two years.
How Do APC Students
Perform in High School?
When APC students did enrollin high school they had diffi-culty getting and staying ontrack. Of the 1997-98 cohortthat enrolled in a CPS highschool after one year in an APC,

Figu
re 2
6Pr
ogre
ss o
f Fi
rst-
Tim
e A
PC S
tude
nts:
Sta
rtin
g Fa
ll 19
97
Hig
h S
choo
l
AP
C
Dro
p O
ut
Leav
e C
PS
Oth
er
Figu
re 2
8
CJ?
Hig
h S
choo
l
AP
C
Dro
p O
ut
Leav
e C
PS
Oth
er
't 10
0%
411'
o39
%28
%
22 28%
48%
57%
7%9%
11.'0
Fal
l19
9719
9819
9920
00
Prog
ress
of
Firs
t-T
ime
APC
Stu
dent
s: S
tart
ing
Fall
1999
Fal
l19
9920
0020
0120
02
Figu
re 2
7Pr
ogre
ss o
f Fi
rst-
Tim
e A
PC S
tude
nts:
Sta
rtin
g Fa
ll 19
98
Hig
h S
choo
l
AP
C
Dro
p O
ut
Leav
e C
PS
Oth
er
Fal
l19
9819
99
O E
nrol
led
in A
cade
mic
Pre
p C
ente
r
O E
nrol
led
in C
PS
Hig
h S
choo
l
OD
rop
Out
Leav
e or
Irre
gula
r C
lass
ifica
tion
2000
2001
Not
e: P
aths
for
drop
out
, lea
ve C
PS
, and
oth
er a
ctiv
e gr
oups
are
not
dis
play
ed u
nles
sth
ey r
epre
sent
mor
e th
an 1
per
cent
of s
tude
nts;
num
bers
for
5 pe
rcen
t or
less
are
not s
how
n.

only 30.8 percent were on trackby the end of their freshmanyear." Students from the 1998-99 cohort that enrolled in highschool in 1999-00 attempted6.1 credits their freshman year(more than they needed toachieve sophomore standing),but received credit for only 4.0.At 65.6 percent, their passingrate was considerably lowerthan that for all high schooleligible students, which was80.7 percent in 1999-00 (seeFigure 29).
On average, former APCstudents did attempt a fullcourse load once they enrolledin high school, but were morethan a full credit short ofofficially passing out of ninthgrade (see Figure 30). Furtheranalyses show that those stu-dents who were on track at theend of their first year were ableto do so primarily because theyhad already earned some highschool credits in the APC and insummer school. This raisesquestions about whether thesestudents will be able to remainon track in later years. Onlyafter two full school years (onein an APC and one in highschool) and one summer werethese students able to earnenough credits to be on trackafter their first year.
Student Performance 49
What Percent of APC Students Attempt andPass High School Core Courses Whilein an APC?
1999-00
1998-99
1997-98
1999-00
1998-99
1997-98
1999-00
1998-99
1997-98
1999-00
1998-99
1997-98
1999-00
1998-99
1997-98
LF-1 17
English11
3218
2917
26
Math
l
1529
16 14226
70
SocialScience
47I 59
34I 65
40
Science
ForeignLanguage
1 i I I I
0 10 20 30 40 50 60 70 80 90
Percent of students
Attempt 0 Pass
Note: Numbers for 5 percent or less are not shown.
100
Figure 25
54

Former APC Students Attempt butDo Not Pass a Full Course LoadStudents promoted to high school after one year
7
6
5
4
3
2
0
63% 66%
pass rate pass rate
5.9
3.7
6.1
Student Performance 51
4.0
1998-99 1999-00
School Year
0 Attempt Receive - - - Full Course Load
Figure 29
What Courses Do Former APC Students Attempt and Pass?Students Promoted to high school after one year
100
90
80
70
60
50
40
30
20
10
65
40
72
45
62
34
65
37
61
34
65 6459
3933
37
18 18
11 12
1997-98 1998-99 1997-98 1998-99 1997-98 1998-99 1997-98 1998-99 1997-98 1998-99
English Math Social Science Science ForeignLanguage
Attempt Receive
56
Figure 30

52 THE STATE OF CHICAGO PUBLIC HIGH SCHOOLS: 1993 to 2000
11111111.---_
BEST COPY AVAILABLE
57

Onterweive Summaly
IN THIS REPORT WE EXAMINE THE PERFORMANCE OF CPShigh school students from the 1993-94 school year to 1999-00 on avariety of measures. Overall, outcomes improvedgreater numbers ofstudents graduated, stayed on track after their freshman year, and passed
a more challenging course load.
We found, however, that much of these improve-ments were the result of students leaving elemen-tary school better prepared for high school. Morehigh achieving students were staying in the systemfor high school. And, at the same time, thousandsof low achieving students were being retained ineighth grade. Other than improvements in studentcourse-taking spurred by the revision ofsystemwide graduation requirements, no highschool reform had any discernable effect.
Despite real progress, there is still concernabout the quality of CPS high schools. Even inlight of the improvements noted above, studentperformance remains generally low. Barely 50percent of students graduated or even got startedon the right foot in their first year. Nor didsufficient numbers actually pass the more chal-lenging courses required by CPSeven by the1999-00 school year, not quite half of studentspassed the algebra/geometry sequence within twoyears, and fewer than one-quarter passed thecollege preparatory sequence within four.
What can we learn from these results to im-prove student performance in the future? First,preparing students well before they enter highschools is clearly of critical importance. Success in
the elementary schools breeds success in the highschools. Second, the only provision of the 1997high school redesign that can be clearly associatedwith improvement in student performance werepolicies that mandated a more rigorous curricu-lum, emphasizing the difficulty of changingperformance through systemwide initiatives.Third, school-by-school analyses show that therewas some success in each type of high school. Thissuggests that it is individual schools rather thanany particular type of school that play thebiggest role in whether students exceed expecta-tions (although charter and small schools doappear to have especially low dropout ratesgiven their student populations). We must lookmore closely at successful schools to see whythey are making a difference.
This report establishes a baseline for importantindicators, a baseline that takes into accountchanges in the characteristics of high schoolstudents. Going forward, we must continue tomonitor these indicators and chart the progress ofhigh school reforms. In future work, we willexplore the environment inside high schools to seewhy some do better than others, taking intoaccount their students' level of preparation.
53
54 THE STATE OF CHICAGO PUBLIC HIGH SCHOOLS: 1993 to 2000
_--..-.--°'
59

itdk 11: Samii De fiN Eac Aid*
Sample Reason
Graduation Rates andMovement Through theSystem
Students who were age 13in September
Sample is not affected by changes from theretention policy. 1
Cohort Course Outcomes Students who were eligiblefor high school for the firsttime and stayed in CPS,dropped out, or graduatedover the next four years
Sample is not affected by the creation ofAPCs or possible increases in the numberof eighth-grade graduates who drop outbefore enrolling in high school. Excludesretained students so that the same studentsare not counted in multiple years.
Cohort Course Outcomes,Graduates Only
Four-year high schoolgraduates only
Sub-sample shows how CPS performs withstudents who make it through the system infour years.These analyses show whathappens to the "best" students.
One and Two YearOutcomes
Students who were eligiblefor high school for the firsttime
Sample is not affected by the creation ofAPCs or possible increases in the number ofeighth-grade graduates who drop out beforeenrolling in high school. Excludes retainedstudents so that the same students are notcounted in multiple years.
School Level Outcomes Students who entered highschool in the 1999-00 schoolyear
Uses only one school year, as the clear-est comparisons are made across a singleschool year because of variation in thenumber of schools that exist in any given year.
In 1996, the first year of the new promotion policy for the eighth graders, about 1,800 students were retained in eighth gradefor poor performance on the Iowa Tests of Basic Skills.This was about three times the retention rate of the previous year. As a
result, about 1,200 students who would have been part of the ninth-grade cohort in 1996 were excluded. We would expect theacademic outcomes for the 1996 cohort to be better simply because the students with poor academic performance did not
become part of the cohort, although our adjusted trends account for changes in incoming student composition. Furthermore,since 1996, each new cohort has had a slightly larger percent of students held back from entering high school than the previous
one. In the first three years of the policy, increasing numbers of students were retained in eighth grade or enrolled in APCs rather
than promoted to high schools.Therefore, each incoming ninth-grade class experienced more holding back of low achievingstudents than the previous one. A subset of those retained students never entered high school (i.e., were never included in aninth grade cohort) either because they dropped out or left the system.The remaining students eventually became part of a
cohort, some entering one year later, others two or three years later. While the number of eighth-grade retentions stoppedgrowing after the first three years of the policy (1996, 1997, and 1998), sixth-grade retention began to affect subsequent ninth-grade classes.The effects of third-grade retentions will be seen later, as will the recent increases in first- and second-grade
retentions. Each incoming ninth-grade class will have had more low achieving students removed from its cohort than in the
previous year, and this pattern will continue for many years.
6 0BEST COPY AVAILABLE

56 THE STATE OF CHICAGO PUBLIC HIGH SCHOOLS: 1993 to 2000
Ap Not2s or FE and
1TBS
P SUMSNAETIMS11,3.Z,11.1,21. ...MA V trg,t
Controlling for students' prior achievement in our analyses allows us to estimate what high schools addto their students' education. Without such a control, schools that attract high performing eighth gradersappear more effective because their students start out ahead. Likewise, schools that attract low perform-ing students appear worse because their students start the ninth grade behind. Results for the system aresimilarly affected.
A simple solution would be to control for students' eighth-grade scores on the Iowa Tests of BasicSkills (ITBS). However, a single year of test score data is not a precise measure of true abilitystudentsmay experience a bad test day, or simply miss one or two questions due to carelessness that significantlyeffect their score. In addition, because the Chicago Public Schools uses eighth-grade ITBS scores as thebasis upon which students are promoted to high school or not, these scores probably do not reflect truestudent ability. As students are required to pass a threshold, those near the threshold are motivated toperform at a higher level in order to avoid summer school and those who are well beyond the thresholdhave no special motivation to score well on the test. As a result, some scores might underestimate stu-dents' true ability, others might overestimate them and, the error in the estimates would not be random.
To more accurately represent the students' true achievement levels at the end of the eighth grade, weran a two-level HLM using all of the test score data for each student for every year they were enrolled inCPS. From this we produced a measure of the latent eighth-grade ability. We included only those eighthgraders whose test scores were officially included by the school system, and only included previous testscore data if it was officially included in school system figures. We ran this analysis on cohorts from 1992to 2000 simultaneously using test data from 1987 to 2000. The cohort variable indicates the year thestudent was in eighth grade.
Using students' test scores as the outcome, the first level of the HLM is the test level. At Level 1, weincluded predictors for the student's grade (centered around sixth grade), the student's grade squared(centered around sixth grade), a dummy variable indicating whether or not this is a repeated year for thestudent in grades one through seven, and a separate dummy variable indicating whether or not thisstudent repeated eighth grade. Thus, the equation at Level 1 was:
ITBS score = f3o + R, (Grade) + g,(Grade squared) + f33(Repeat) +f34(Repeat8) + r
At Level 2, the student level, we modeled the intercept and each slope with dummy variables for eachcohort year. In addition, because students coming out of bilingual education programs often have a fasterlearning curve than others, we included a dummy variable indicating whether the student had been in abilingual program. The 1992 cohort was the omitted category. The equations at Level 2 were as follows:
go y1 (Bilingual) + y2(1993 Cohort) + 73(1994 Cohort) + y4(1995 Cohort) + 15(1996 Cohort) +16(1997 Cohort) + 17(1998 Cohort) + 18(1999 Cohort) + 19(2000 Cohort) + uo
61

Student Performance 57
= yo + (Bilingual) + y2(1993 Cohort) + y3(1994 Cohort) + 74(1995 Cohort) + 15(1996 Cohort) +
16(1997 Cohort) + 77(1998 Cohort) + y8(1999 Cohort) + 19(2000 Cohort) +
= yo + y1 (Bilingual) + y2(1993 Cohort) + y3(1994 Cohort) + y4(1995 Cohort) + 15(1996 Cohort) +16(1997 Cohort) + y7(1998 Cohort) + 18(1999 Cohort) + 79(2000 Cohort) +
g3= yo + y2(1993 Cohort) + y3(1994 Cohort) + 74(1995 Cohort) + y5(1996 Cohort) + 16(1997 Cohort) +
77(1998 Cohort) + y8(1999 Cohort) + 19(2000 Cohort)
g4 = yo + y2(1993 Cohort) + y3(1994 Cohort) + y4(1995 Cohort) + y5(1996 Cohort) + 16(1997 Cohort) +
77(1998 Cohort) + y8(1999 Cohort) + 19(2000 Cohort)
Separate models were run for reading and mathematics. We used the empirical Bayes estimates for the
intercept, the grade slope, and the grade squared slope from the residual files to create a measure of latent
student ability. Ideally, we would have liked to center our grade and grade squared variables around
eighth grade so that theintercept would have:
Latent score = (fittedvalue, intercept +EB residual, intercept) +2(fitted value, grade6+EB residual, grade6) +4(fitted value, grade6sq+EB residual, grade6sq) [+(fitted valtie, repeat8) ifstudent repeated eighth grade]
TAP
To not penalize schoolsthat work to prevent lowachieving students fromdropping out and encour-age attendance on testday, we imputed testscores for students whowere enrolled in the fallbut did not have a springTAP score. In this way,schools that do not makethe above efforts andhave fewer low achievingstudents taking the TAPdo not have any unfairadvantage.
HIM Results for Latent Ability Models
Intercept Reading Math Intercept Reading Math
Intercept 0.1823*** 0.5454*** Repeat
Bilingual -0.3401*** -0.0929*** Intercept 0.0364 0.1116***
1993 Cohort -0.1110*** -0.0994*** 1993 Cohort 0.0095 0.1031**
1994 Cohort -0.1060*** -0.1184*** 1994 Cohort 0.1221** 0.1242***
1995 Cohort -0.1249*** -0.0118 1995 Cohort 0.0820* 0.1394***
1996 Cohort -0.0669*** 0.0210* 1996 Cohort 0.1005** 0.2182***
1997 Cohort 0.0498*** 0.1410*** 1997 Cohort 0.2261*** 0.3216***
1998 Cohort 0.0605*** 0.1501*** 1998 Cohort 0.1897*** 0.3022***
1999 Cohort 0.1097*** 0.1914*** 1999 Cohort 0.2126*** 0.3698***
2000 Cohort 0.2023*** 0.2366*** 2000 Cohort 0.1785*** 0.3584***
Grade, centeredon 6th Repeat 8
Intercept 0.2438*** 0.4748*** Intercept 0.0828 0.0131
Bilingual 0.0292*** 0.0313*** 1993 Cohort 0.0013 0.1986**
1993 Cohort 0.2226*** 0.0529*** 1994 Cohort -0.1067 0.1142
1994 Cohort 0.2452*** 0.1006*** 1995 Cohort 0.085 0.0847
1995 Cohort 0.2522*** 0.0737*** 1996 Cohort -0.0393 0.0844
Cohort 0.2902*** 0.0939*** 1997 Cohort 0.1437* 0.1247*.19961997 Cohort 0.2861*** 0.0765*** 1998 Cohort 0.2025*** 0.2803***
1998 Cohort 0.2946*** 0.1028*** 1999 Cohort 0.1956*** 0.0857
1999 Cohort 0.3001*** 0.1238*** 2000 Cohort 0.1514* 0.1944***
2000 Cohort 0.3014*** 0.1131***
Grade SquaredIntercept 0.1581*** -0.0534***Bilingual -0.0013** -0.0081***1993 Cohort -0.1387*** 0.0300***1994 Cohort -0.1443*** 0.0413***1995 Cohort -0.1555*** 0.0078**1996 Cohort -0.1519*" 0.0262***1997 Cohort -0.1689*** 0.0219***1998 Cohort -0.1715*** 0.0265***1999 Cohort -0.1614*** 0.0378***2000 Cohort -0.1584*** 0.0391***
*** p < .001** p < .01* p < .05
62BEST COPY AVAILABLE

58 THE STATE OF CHICAGO PUBLIC HIGH SCHOOLS: 1993 to 2000
To impute TAP scores, we used students' gender, age, SES, race, and latent reading and math ITBSscores for the entire sample. Using a latent variable regression in HMLM, we were able to use the datafrom both students missing TAP scores and those with TAP scores. However, as we were unable to modelthe school effects at Level 2 and produce a latent variable regression at Level 2 in the current version ofHMLM, we centered all variables around their school means outside of the HMLM program.
In this analysis, the Level 1 data files are arranged with one record per variable. All observed data arecopied into a single variable, "outcome." This "outcome" is linked to a set of indicataors that identifywhich specific variable this is. At Level 1, all indicator variables are entered into the equation to predictthe "outcome" along with a variance component. There is no intercept at Level 1.
Y = IfgpXp +r
Where Y is the "outcome" and X are the indicator variables, p ranging from 1 to 17 in this analysis (seethe table "HMLM Results for Estimating TAP Scores"). If data are missing on some "outcome," thoserecords are just absent.
The Level 2 equations are simply the coefficients associated with the indicator variables predicted bythe intercept. These coefficients represent the latent values for each student on each variable (whetheractually observed or not).
Bp = ypO
HMLM Results for Estimating TAP Scores
Latent Variable Regressionon TAP Score Reading Math
Intercept -0.0404** -0.0588**Student SES 0.0868*** 0.0066Old for grade -0.3769*** -0.3234***Very old for grade -0.2551 -0.1536Male -0.0876** 0.1992***White 0.3638*** 0.5155***Asian -0.109 0.4751***Latino 0.1163* 0.1550***8th grade reading ITBS score 1.1430*** 0.04087th grade reading ITBS score 1.1224*** 0.2019***8th grade mathematics ITBS score 0.2017*** 1.3653***7th grade mathematics ITBS score 0.3129*** 1.1976***8th grade reading score missing 0.5183 -0.4558th grade mathematics score missing -0.7725 -0.15397th grade reading score missing -0.5953 0.24877th grade mathematics score missing 0.7297 -0.1451Student SES missing -0.0016 -0.1291
p < .001** p < .01* p < .05
In a latent variable regression, any Level 1parameter, Ep, can become either the outcomeor a predictor in a structured model. We usethis method to make one of our indicatorvariables the outcome and the others thepredictors. The latent variable output thengives us fixed effects for the predictors onwhichever outcome we choose. The resultsfrom the reading and mathematics HMLManalyses are shown below. (For a further discus-sion of the general HMLM methodology, seeRaudenbush and Bryk (2002).)
The coefficients from the table at the leftwere multiplied by the original school-mean-centered data and summed across variables. Tothis was added the original school means ofthose variables to produce the imputed scoresfor those missing TAP data.
Overall, our imputed scores may be higherthan expected for students with missing scoresbecause the model assumes that the studentmissing a TAP score is the same as a student
with the same SES, race, and ITBS scores who took the TAP. However, if the student is missing a TAPscore because he has dropped out, it is more likely that he is lower performing than the student who isstill in school. In this sense, our model produces conservatively estimated imputed scores.
63

School-Level Adjusted TAP Scores
To predict the high school adjusted mean TAPscores, we ran a two-level HLM using TAPscores as the outcome, including imputed TAPscores for those students missing scores. AtLevel 1, the student level, we used gender, race,age, SES, and the latent eighth-grade ability inreading and mathematics as predictors. We alsoincluded a dummy variable to indicate if thestudent attended a summer bridge programafter eighth grade. In addition, we includeddummy variables for students entering highschool from private elementary schools, frompublic schools outside the CPS system, or whowere once in the system but left and are nowreentering. At Level 2, the school level, weincluded predictors for the high school's meanSES, percent of special education students inthe school, and percent mobility. We alsoincluded indicators of the racial composition ofthe student body and a mean of the latentreading and mathematics ability of the enteringninth-grade class of students. All of the Level 2predictors were uncentered. The equations forthese analyses appear below:
Student Performance 59
HLM Results for Estimating theAdjusted School TAP Score Means
Intercept Reading Math
Intercept 9.6569*** 9.9291***High school SES -0.1473 -0.2705
Percent special education 0.0847 -0.3234***
Percent mobility 1.3726 2.225
Predominantly Latino 0.0489 0.1413
Integrated -0.036 0.1423
Racially mixed -0.1158 0.011
Predominantly minority 0.0121 0.3632*
Mean latent achievement 1.2002*** 1.4201***
Male -0.0367 0.1907***
White 0.6006*** 0.7244***
Asian 0.1073 0.6285***Latino 0.3016*** 0.2480***Attended private elementary school 1.0174*** 0.4188***Left CPS and returning to the system 0.0036 -0.1774**
From public elementary schooloutside the system 0.2413** -0.0286
Old for grade -0.3086*** -0.3203***Very old for grade -0.6822*** -0.5460***Student SES 0.0643** -0.0066
Latent 8th grade reading ability 2.3726*** -0.0703*
Latent 8th grade mathematics
ability 0.2010*** 2.8402***
Attended Summer Bridge -0.0968* 0.0747*
*** p < .001Level 1 ** p < .01
TAP score = go + R1 (Male) + 82(White) + * p < .05
83(Asian) + g4(Latino) + g5(Private) +g6(From CPS) + g7(Outside) + g1 =-
88(Old for Grade) + g9(Very Old for Grade) + g2 = 72
R10(SES) + gi (Latent Reading) + f3 -73f4g12(Latent Math) + g13(Bridge) + r = 74
g5 75
Level 2 g6 76
go = y0 + y1(High School SES) + y2(Percent Special g7 = 77
Education) + y3(Percent Mobility) + g8 =78
y4(Predominately Latino) + y5(Integrated) + R9 79
y6(Racially Mixed) + VPredominately Minority) + R10 710
y8(Mean Latent Achievement) + u0 gll =711112 712
g13 713

App
endk
Fot-
Yea
r St
uden
t Cou
rse-
Tak
irg
Wha
t Per
cent
of S
tude
nts
Atte
mpt
and
Pas
s an
Eng
lish
Cou
rse?
One
yea
r af
ter
elem
enta
ry s
choo
l
100
-
90 -
80 -
70 -
60 -
50 -
40 -
30 20 -
10 -
85
60
1993
-94
86
6
85
61
8683
63
83
65
1994
-95
1995
-96
1996
-97
1997
-98
1998
-99
1999
-00
Sch
ool Y
ear
El A
ttem
ptP
ass
Not
e: N
early
all
stud
ents
who
enr
olle
d in
hig
h sc
hool
atte
mpt
ed a
n E
nglis
h cl
ass.
Dro
pout
s, s
tude
nts
enro
lled
in A
PC
s, a
nd s
tude
nts
clas
sifie
d as
spe
cial
edu
catio
nm
ake
up th
e bu
lk o
f stu
dent
s no
t tak
ing
high
sch
ool
leve
l Eng
lish.
Wha
t Per
cent
of S
tude
nts
Atte
mpt
and
Pas
s a
Mat
h C
ours
e?O
ne y
ear
afte
r el
emen
tary
sch
ool
100
-
90 -
80 -
70 -
60 -
50 -
40 -
30 -
20 -
10-
0
82 ,.
5
1993
-94
1994
-95
55
82
53
82 ;.; T71
11.
'40
81
57
1995
-96
1996
-97
1997
-98
1998
-99
1999
-00
Sch
ool Y
ear
Atte
mpt
E P
ass

Wha
t Per
cent
of S
tude
nts
Atte
mpt
and
Pas
s a
Soc
ial S
cien
ce C
ours
e?O
ne y
ear
afte
r el
emen
tary
sch
ool
Wha
t Per
cent
of S
tude
nts
Atte
mpt
and
Pas
s a
Sci
ence
Cou
rse?
One
yea
r af
ter
elem
enta
ry s
choo
l
100-
90 -
80 -
70 -
60 -
50 -
40 -
30 -
20 -
10-
55
37
56
38
61
41
65
45
76
51
76
53
76
54
v-,
43:3
., = 46 cu 12 a) 0-
100
-
90 -
80 -
70 -
60 -
50-
40 30 -
20 -
1 0
-
62
42
62
42
62
43
67
47
77
52
78
55
79
58
1993
-94
1 99
4- 9
5 1
995
-96
1996
-97
199
7-98
1 9
9 8
- 9
9 19
99-0
019
93-9
41
9 94
- 9
5 19
95-9
6 19
96-9
7 19
97-9
81
99 8
- 9
9 1
999-
00
Sch
ool Y
ear
Sch
ool Y
ear
I=1
Atte
mpt
Pas
sA
ttem
ptP
ass
Wha
t Per
cent
of S
tude
nts
Atte
mpt
and
Pas
s a
For
eign
Lan
guag
e C
ours
e?O
ne y
ear
afte
r el
emen
tary
sch
ool
100
-
90 -
80 -
70 -
60 -
50 -
40 -
30 -
20 -
10-
0
129
12r_
_13,
,12
10
1411
10 9
1311
1993
-94
1994
-95
1995
-96
1996
-97
1997
-98
1998
-99
1 9
9 9-
0 0
Sch
ool Y
ear
Atte
mpt
Pas
s

62 THE STATE OF CHICAGO PUBLIC HIGH SCHOOLS: 1993 to 2000
Ilerirx OV: C arge h
POVIOTEMORCO DIT Elg
is QF ty
i DT BS
Although the percent of students taking the TAP did not change from 1993 to 2000, the composition ofstudents who took the test did. Considerably fewer students with very low eighth-grade ITBS readingscores took the TAP in the 1999-00 school year compared to 1993-94.
Fewer Students Scoring Low on ITBSReading Take the TAP the Following Year
1993-94 1994-95 1995-96 1996-97 1997-98 1998-99 1999-00 Change
LowestQuartile 6,173 6,542 6,054 4,573 4,248 3,511 2,982
Down3,191
SecondQuartile 7,289 6,703 6,332 7,196 7,646 7,386 7,779 Up 490
ThirdQuartile 3,742 3,235 3,292 3,803 3743 4,618 4,676 Up 934
HighestQuartile 1,591 1,658 1,562 1,898 1,544 2,342 1,991 Up 400
67

End 02S
1 Bryk et al. (1998); Sebring et al. (1996); Chicago Public
Schools (1997).
2 Easton et al. (2001).
Allensworth and Rosenkranz (2000).
4 Bishop and Ferran (1999); Chaney, Burgdorf, andAtash (1997).
Bishop and Ferran (1999); Adelman (1999); Schmidt(1999).
Chicago Public Schools (2000), Board Report 00 -0726-P02.
Hess and Cytrynbaum (forthcoming).
8 This was the official CPS policy as cited on its website(www.cps.k12.il.us/Schools/probation/qna.html). As faras we know, no school was removed from probation forany reason other than increasing its test scores above thethreshold.
Estimates were produced using logistic regression (with theexception of TAP scores, which were produced through OLSregression)see Appendix II for a technical discussion ofhow we adjusted ITBS and TAP scores to get true scores.Adjustments for graduation and dropout rates were per-formed separately for each age to allow for changingrelationships between characteristics and outcomes.
10 We used the Rasch Model to make ITBS scores equivalentacross different forms of the test. These were then trans-formed into approximate GEs using a regression analysiswithin each form whereby GE=intercept + Rasch measure.
" Students who were retained in eighth grade the followingyear were not included in calculations. Similar leave ratesand trends would have been produced if retained studentswere followed for an additional year (the year they left eighthgrade) and included in calculations with their originalcohort. (Students who dropped out were considereddifferently from those that left.)
12 For further details, see Allensworth and Rosenkranz(2000).
13 See National Center for Education Statistics, The Condi-
tion of Education 1998 (1998), and The Condition ofEducation 1999 (1999); Bureau of Justice Statistics (1991).
63
" Allensworth and Easton (2001). This report describesthe method developed by the Consortium to calculatedropout rates and shows the effects different methodshave on final calculations.
15 If the students that were still enrolled at age 19 were notincluded in the calculations as non-graduates, the percent ofstudents that graduated would be 46.1, 45.1, and 43.8 forthe 1992-93, 1993-94, and 1994-95 cohorts, respectively.
16 If the students still enrolled at age 19 were not included inthe calculations as non-dropouts, dropout rates at age 19would be 46.1, 45.1, and 43.8 percent for the 1992, 1993,and 1994 cohorts, respectively.
'7 Roderick (1994).
18 Miller (1998).
19 Some would argue against honors courses as part of a
system of tracking. See Oakes (1985).
20 All regular high schools offer students at least one honorscourse over a four-year high school career, although many donot offer them in the ninth grade. Special education andalternative schools generally do not provide honors courses.
21 We use the term "honors" to include those coursesdesignated as "honors," "telescoped honors," and"advanced placement."
22 Placement in at least one honors course while in the ninthgrade is a way to identify bright and persevering students. Ofthe students who passed an honors course in the ninth gradein 1996-97, 77.6 percent graduated within four years. Forthose who did not take an honors class in their first year,only 42.7 percent graduated within four years. Nonetheless,this early identification is not a rigid track or a perfectpredictor of student performance. About half of the studentsin the 1996 cohort that did not pass an honors class in theirfirst year went on to take an honors course later in their highschool careers. Furthermore, about 12 percent of studentswho passed an honors course in the ninth grade dropped outof high school within four years.
23 Pelavin and Kane (1990).
24 Students are considered to have passed the algebra/geometry sequence if they pass a full credit of algebra in theninth grade and a full credit of geometry by the end of the

/ 64 THE STATE OF CHICAGO PUBLIC HIGH SCHOOLS: 1993 to 2000
tenth. Students also fulfill this requirement if they takeany higher-level math course in the ninth grade, includ-ing geometry, algebra II, or participate in the IntegratedMath Program.
25 Because many of the new schools have not existed longenough to have four-year outcomes and charter schools arenot required to submit course-taking information to CPS,we are limited in the outcomes we can compare.
26 A study of the Summer Bridge program by the Consor-tium on Chicago School Research is scheduled to bepublished summer 2002.
27 More students are enrolled in APCs, but our sampledoes not include students retained in an APC for morethan one year.
28 Some students who are counted as dropouts from APCsnever actually enrolled there. These are called "no shows." This problem is less prevalent in APCs than in high schools,however.
29 To determine on-track status, we included all creditsstudents earned in the APC, over the summer, and duringtheir official first year in high school.
69
Mem COS
Adelman, Clifford. (1999). Answers in the Toolbox:Academic Intensity, Attendance Patterns, andBachelor's Degree Attainment. ERIC no.ED431363. Washington, DC: US Departmentof Education, Office of Educational Researchand Improvement.
Allensworth, Elaine M. and John Q Easton. (2000).Calculating a Cohort Dropout Rate for the ChicagoPublic Schools: A Technical Report. Chicago:
Consortium on Chicago School Research.
Allensworth, Elaine M. and Todd Rosenkranz.(2000). Access to Magnet Schools in Chicago.
Chicago: Consortium on Chicago School Re-search and the Mexican American Legal Defenseand Educational Fund.
Bishop, John H. and Ferran Mane. (1999). Theimpacts of minimum competency exam gradua-tion requirements on college attendance and earlylabor market success of minority students. Paperpresented at the Conference of the AmericanEducational Research Association, April,Montreal, Canada.
Bryk, Anthony S., Yeow Meng Thum, John Q.Easton, and Stuart Luppescu. (1998). AcademicProductivity of Chicago Public ElementarySchools. Chicago: Consortium on ChicagoSchool Research.
Bureau of Justice Statistics. US Department ofJustice. (1991). Comparing Federal and StatePrison Inmates. NCJ no. 145864. Washington,DC: GPO.
70
Camara, Wayne J. and Amy Elizabeth Schmidt.(1999). Group Differences in Standardized Testingand Social Stratification. New York: CollegeEntrance Examination Board.
Chicago Public Schools. (1997). Design for HighSchools. Board report no. 97-0326-RS7. Chicago:Chicago Public Schools.
Chicago Public Schools. (2000). Board report no.00-0726-P02. Chicago: Chicago Public Schools.
Chaney, Bradford, Kenneth Burgdorff, and NadirAtash. (1997). Influencing achievement throughhigh school graduation requirements. EducationalEvaluation and Policy Analysis, 19: 229-244.
Easton, John Q., Todd Rosenkranz, and Anthony S.Bryk. (2001). Annual CPS test trend review,2000. Research data brief of the AcademicProductivity Series. Chicago: Consortium onChicago School Research.
Hess, G. Alfred, Jr. and Solomon Cytrynbaum.(forthcoming). The effort to redesign Chicagohigh schools: Effects on schools and achievement.In Valerie Lee (Ed.), Research on High SchoolReform Efforts in Chicago (working title). Chicago:Consortium on Chicago School Research.
Miller, Shazia Rafiullah. (1998). Shortcut: Highschool grades as a signal of human capital.Educational Evaluation and Policy Analysis, 20 (4):299-312.

66 THE STATE OF CHICAGO PUBLIC HIGH SCHOOLS: 1993 to 2000
National Center for Education Statistics. US De-partment of Education. (1999). The Condition ofEducation, 1999. NCES no. 99022.Washington,DC: GPO.
National Center for Education Statistics. US De-partment of Education. (1999). Mini Digest ofEducation Statistics, 1998. NCES no. 1999039.Washington, DC: GPO.
National Center for Education Statistics. US De-partment of Education. (1998). The Condition ofEducation, 1998. NCES no. 98013. Washington,DC: GPO.
National Commission on Excellence in Education.(1983). A Nation at Risk: The Imperative forEducational Reform. Washington, DC: US De-partment of Education.
Pelavin, Sol H. and Michael Kane. (1990). Changingthe Odds: Factors Increasing Access to College. New
York: College Entrance Examination Board.
Oakes, Jeanne. (1985). Keeping Track: How SchoolsStructure Inequality. New Haven: Yale UniversityPress.
Raudenbush, Stephen W. and Anthony Bryk.(2002). Hierarchical Linear Models: Applicationsand Data Analysis Methods. 2nd ed. AdvancedQuantitative Techniques in the Social SciencesSeries. Thousand Oaks, CA: Sage Publications.
Roderick, Melissa. (1994). Grade retention andschool dropouts: Investigating the association.American Educational Research Journal, 31 (win-ter): 729-59.
Schmidt, Amy Elizabeth. (1999). Explaining racialand ethnic differences in large scale assessments.Paper presented at the annual meeting of theAmerican Educational Research Association,April, Montreal, Canada.
Sebring, Penny Bender, Anthony S. Bryk, MelissaRoderick, Eric Camburn, Stuart Luppescu, YeowMeng Thum, BetsAnn Smith, and Joseph Kahne.(1996.) Charting Reform in Chicago: The StudentsSpeak. Chicago: Consortium on Chicago SchoolResearch.
This report reflects the interpretation of its authors. Although the Consortium's Steering Committee pro-vided technical advice and reviewed an earlier version of the report, no formal endoresment by these indi-viduals, their organizations, or the Consortium should be assumed.
71

About the AuthorsShazia Rafiullah Miller holds joint responsibilities at the Consortium as a Research Associate and theHead of Research Outreach. As a researcher, Dr. Miller focuses on studying high schools. In her out-reach capacity, she explains Consortium findings and promotes their use in improving schools. Dr.Miller received her Ph.D. in Human Development and Social Policy from Northwestern University,and her B.A. in Political Science, also from Northwestern.
Elaine Allensworth is a Research Associate at the Consortium and the Interim Associate Director for
Statistical Analysis, Surveys, and Data. Her work at the Consortium has included analysis of dropout
rates, magnet schools, and organizational factors that affect school improvement. Work outside of theConsortium includes research on immigration and community development. Dr. Allensworth holds a
Ph.D. in Sociology from Michigan State University, a masters in Sociology/Urban Studies from Michi-
gan State, and a B.A. in Spanish from Kent State University. She worked as a high school Spanish and
science teacher prior to entering graduate school.
Julie Reed Kochanek is a part-time research assistant and data analyst at the Consortium. She has
worked on the network analysis of the Annenberg project, the Local School Council public use data set,and a monograph on social trust with Tony Bryk, Senior Director of the Consortium, and Barbara
Schneider of the University of Chicago. She is currently working on student transitions for the ChicagoEducation Alliance and on the evaluation of the Jump Start program. Ms. Kochanek is a doctoralstudent in the Department of Sociology at the University of Chicago. She received her B.A. from the
University of Notre Dame and her M.A. from UCLA.
72

Steering CommitteeVictoria Chou, Co-Chair
University of Illinois at Chicago
James H. Lewis, Co-ChairRoosevelt University
Institutional MembersChicago Teachers UnionDeborah Lynch Walsh
Chicago Principals and Administrators AssociationBeverly Tunney
Chicago Public SchoolsChristy Carter
for the Chicago Board of Education
Olivia Watkinsfor the Chief Executive Officer
Philip HansenAccountability Office
Illinois State Board of EducationConnie 'Wise
for the Superintendent
Individual MembersJohn Ayers
Leadership for Quality Education
Gina BurkhardtNorth Central Regional Educational Laboratory
Michael E. CarlNortheastern Illinois University
Louis M. GomezNorthwestern University
Anne C. HallettCross City Campaign for Urban School Reform
G. Alfred Hess, Jr.Northwestern University
Rachel W. LindseyChicago State University
George LoweryRoosevelt University
Angela Perez MillerDePaul University
Donald R. MooreDesigns for Change
Sharon RansomUniversity of Illinois at Chicago
Barbara A. SizemoreDePaul University
James SpillaneNorthwestern University
Linda S. TafelNational-Louis University
Consortium on ChicagoSchool Research
MissionThe Consortium on Chicago School Research is an indepen-dent federation of Chicago area organizations that conductsresearch on ways to improve Chicago's public schools and as-sess the progress of school improvement and reform. Formedin 1990, it is a multipartisan organization that includes fac-ulty from area universities, leadership from the Chicago Pub-lic Schools, the Chicago Teachers Union, the ChicagoPrincipals and Administrators Association, education advo-cacy groups, the Illinois State Board of Education, and theNorth Central Regional Educational Laboratory, as well asother key civic and professional leaders.
The Consortium does not argue a particular policy posi-tion. Rather, it believes that good policy is most likely to re-sult from a genuine competition of ideas informed by the bestevidence that can be obtained.
DirectorsAnthony S. BrykUniversity of Chicago
John Q. EastonConsortium on ChicagoSchool Research
Albert L. BennettRoosevelt University
Sarah-Kay McDonaldConsortium on ChicagoSchool Research
Melissa RoderickUniversity of Chicago
Penny Bender SebringUniversity of Chicago
Mark A. SmylieUniversity of Illinoisat Chicago
Consortium on Chicago School Research
1313 East 60th Street, Chicago, IL 60637
773-702-3364 fax -773-702-2010
www.consortium-chicago.org
73

U.S. Department of EducationOffice of Educational Research and Improvement (OERI)
National Library of Education (NLE)
Educational Resources Information Center (ERIC)
NOTICE
Reproduction Basis
E KC"WeetkmIleseaseldnediettote
This document is covered by a signed "Reproduction Release (Blanket)"form (on file within the ERIC system), encompassing all or classes ofdocuments from its source organization and, therefore, does not require a"Specific Document" Release form.
This document is Federally-funded, or carries its own permission toreproduce, or is otherwise in the public domain and, therefore, may bereproduced by ERIC without a signed Reproduction Release form (either"Specific Document" or "Blanket").
EFF-089 (1/2003)