Embed Size (px)
Citation preview

Flagship Investments Limited ABN 99 080 135 913 Level 12 Corporate Centre One 2 Corporate Court BUNDALL QLD 4217 PO Box 7536 G C M C BUNDALL QLD 9726 Telephone 07 5644 4400 Facsimile 07 5574 1457
www.flagshipinvestments.com.au
20 April 2015 The Manager Company Announcements Office ASX Ltd Exchange Centre Level 6 20 Bridge Street SYDNEY NSW 2000 Dear Sir Retail Presentation – FSI as at 31 March 2015 Attached is a retail presentation to be presented on Tuesday 21 April 2015, by the Investment Manager of Flagship Investments Limited. Yours sincerely
I W Harrison Company Secretary

ECPAM - Retail Presentation Document - As at 31/03/2015
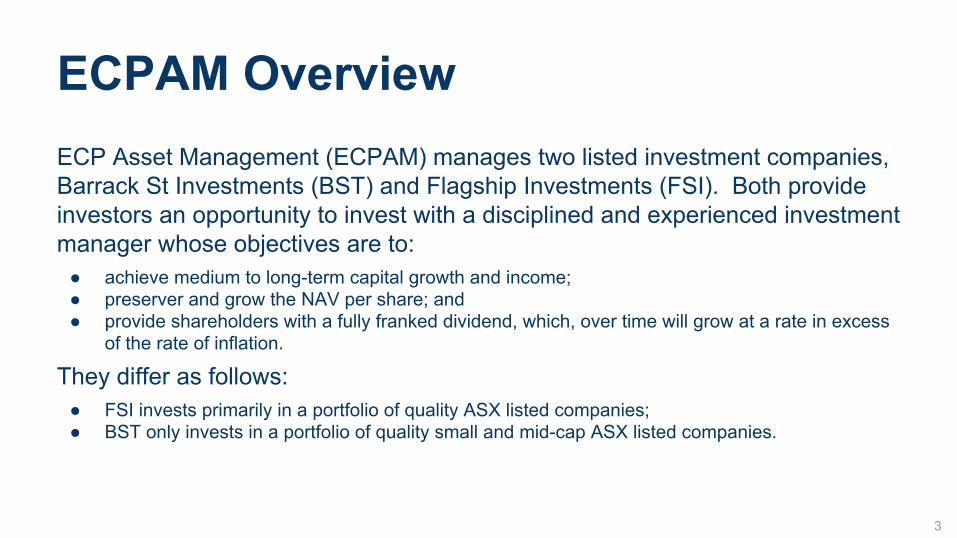
ECPAM OverviewECP Asset Management (ECPAM) manages two listed investment companies, Barrack St Investments (BST) and Flagship Investments (FSI). Both provide investors an opportunity to invest with a disciplined and experienced investment manager whose objectives are to:
● achieve medium to long-term capital growth and income;● preserver and grow the NAV per share; and● provide shareholders with a fully franked dividend, which, over time will grow at a rate in excess
of the rate of inflation.
They differ as follows:● FSI invests primarily in a portfolio of quality ASX listed companies;● BST only invests in a portfolio of quality small and mid-cap ASX listed companies.
3

Investment Team

Why Our Team Produces OutperformanceCommon Beliefs Our team members all fundamentally believe in our
investment philosophy; the economics of a business drives price performance over the long term.
Information Advantage The investment team spend 95% of their time on fundamental analysis of a focussed universe. A deep understanding of each company ensures we place more weight on our research than management or the markets point of view.
Continually Challenge Our Assumptions We’re always looking to see where we can improve. It is our view that you need to constantly challenge your beliefs and continually question your assumptions. By doing so we look to capture additional insights and information we may have missed initially.
Mindfulness Our process, while systemised, is not about box ticking. Moving through a process without giving it all of your attention leads to a lack of understanding, and therefore average results. By being passionate about what we do and taking the time to do it right, we’re comfortable we’re making the right decisions.
7

Investment PhilosophyThe economics of a business drives long-term investment returns. Investing in high quality, growth businesses, that have the ability to generate predictable, above average economic returns will produce superior investment performance over the long-term.
A disconnect exists between price and value, which requires discipline in the price paid for earnings. The combination of purchase discipline, and the appropriate investment due diligence, is crucial to ensuring long-term investment success for our clients.
8

On average the market undervalues extremely high quality, capital efficient, organic growth businesses; and
The market tends to over-emphasize temporary themes and short-term factors.
Market Inefficiencies We Exploit
9

Investment Process SummaryAn focus on quality produces alphaOur investment process is broken up into 4 main stages.
Stages 1 → 3 are designed to remove those companies that do not meet our definition of quality, and focus our attention on a smaller opportunity set.
Stage 4 is designed to manage the uncertainties that exist within the businesses that remain, and construct a portfolio which generates the best risk adjusted returns for our clients.
The process is continuously repeated to look for new opportunities and revisit old ones in order to ensure that the best possible opportunities are in the portfolio at any one time.
11

Representative Companies
21

Resulting Portfolio Composition
IncludedHigh exposure to growth markets, strong competitive advantages, low capital intensity, organic growth and simple businesses.
AvoidedLow ROE, Low Interest Cover, Low Growth, Lack of Competitive advantage, complex businesses.
25

Process BenefitsProven manager● Long term out performance is reliable and fundamentally driven.● Performance is strong in both an absolute and relative sense.
Consistent framework and investment process● Portfolio consists of only the highest quality investments.● We do not over pay for growth.● The GFC stress tested the process, which produced excellent results.● Traditionally there has been a high correlation between IRR and portfolio
returns.
28

Process Key Features1. The investment process is one of elimination of businesses that fail to meet
quality standards;2. Companies that fail process are not held at all rather than underweighted
→ Sell Discipline;3. Companies are weighted according to their 5 year prospects (risk adjusted
IRR); and4. Risk is where a business does not meet IRR and earnings estimates, not a
deviation from an index.

Why BST?Most Investors have an exposure to ASX 50 companies. BST only invests in companies outside of this index, so provides investors an opportunity to share in the wealth creation of highly successful small companies:
● QGC : EV AUD 20m Aug 2000 → EV AUD 5bn Oct 2008
● SEK : EV AUD 500m Mar 2005 → EV > AUD 5bn current.
Analysis shows the majority of outperformance achieved by ECPAM historically has been in mid and small cap companies.Limited research coverage by brokers creates valuation opportunities.

Product Details
Name Barrack Street Investments Limited
Ticker BST
NAV (31 March 2015) 103.7c
Benchmark 8% Absolute Return
Management Fee 1%
Performance Fee 20% over hurdle, high watermark.
29

Portfolio PerformanceHistorical Portfolio Performance to 31 Mar 2015*
*All returns are gross of fees and charges. Excess returns are calculated against the S&P ASX Small Cap Index. Returns greater than one year are expressed as per annum.
Product 3m 6m 1 year YTD Inception
BST 6.42 14.50 - 6.67 8.15
S&P ASX Small Ords Acc 7.30 3.40 - 9.30 -0.14
Alpha -0.88 11.1 - -2.63 8.29
24

Portfolio HoldingsCompany Weight
REA Group 12.4
Carsales.com 10.9
Platinum Asset Management 9.76
Seek Limited 9.48
Domino’s Pizza 9.06
Trade Me Group 7.00
Bendigo Bank 6.47
Navitas 4.72
Sky Network Television 4.48
Sirtex Medical 4.38

Recent Portfolio Additions

Portfolio Return Outlook
Dividend Growth PE Contraction Dividend Return IRR (pre-franking)
19.6% -1.8% 2.6% 20.4%
27


Product Details
Name Flagship Investments Limited
Ticker FSI
NAV (31 March 2015) 181.6c
Benchmark Cash
Management Fee 0%
Performance Fee 15% over benchmark, no high watermark.
29

Portfolio PerformanceHistorical Performance to 31 Mar 2015*
*All returns are gross of fees and charges. Excess returns are calculated against the S&P ASX All Ordinaries Index. Returns greater than one year are expressed as per annum.
Product 3m 1 year 3 Years 5 Years 10 Years
FSI 8.8 12.2 22.1 10.6 12.3
S&P ASX All Ords 8.8 10.0 9.9 3.7 3.6
Alpha 0.0 2.2 12.3 6.9 19.7
33

Portfolio HoldingsCompany Weight
Telstra 9.19
Macquarie Group 8.36
Commonwealth Bank of Australia 8.25
Westpac Banking Corp 6.62
Rio Tinto Limited 5.44
Seek Limited 5.18
REA Group 5.14
AMP Limited 4.62
Brambles Limited 4.60
Woolworths Limited 4.44

Recent Portfolio Additions

Portfolio Return Outlook
Dividend Growth PE Contraction Dividend Return IRR (pre-franking)
14.5% -2.0% 3.3% 15.8%
27

FSI Historical DividendsYear 2004 2005 2006 2007 2008 2009 2010 2011 2012 2013 2014
Dividend 4.5 6.0 6.75 8.00 8.50 8.50 8.50 8.50 6.0 6.5 6.75
Chg % 15.4 33.3 12.5 18.5 6.25 0.0 0.0 0.0 -30.0 8.3 3.8
CPI 2.50 2.50 4.00 2.10 4.50 1.50 3.10 3.60 1.20 2.20 2.90

DisclaimerThis communication is not a securities recommendation.
Any person considering action on the basis of this communication must seek out individual advice relevant to their particular circumstances and investment objectives.
Past performance is no guide for future performance.
35


![Nuclear Physics BI70 [FSI] (1980) 16-31 A PHYSICAL PICTURE](https://img.pdfslide.us/doc/110x75/62a6035821682e28ac09a735/nuclear-physics-bi70-fsi-1980-16-31-a-physical-picture-.jpg)