Embed Size (px)
Citation preview
Ecotoxicology and Environmental Safety 123 (2016) 45–52
Contents lists available at ScienceDirect
Ecotoxicology and Environmental Safety
http://d0147-65
n CorrE-m1 Th
journal homepage: www.elsevier.com/locate/ecoenv
A SELDI-TOF approach to ecotoxicology: comparative profiling of lowmolecular weight proteins from a marine diatom exposed to CdSe/ZnSquantum dots
Francesca Scebba a,n,1, Danika Tognotti b,1, Gianluca Presciuttini b, Edi Gabellieri b,Patrizia Cioni b, Debora Angeloni a, Barbara Basso b, Elisabetta Morelli b
a Institute of Life Sciences, Scuola Superiore Sant'Anna, Piazza Martiri della Libertà 33, 56127 Pisa, Italyb National Research Council – Institute of Biophysics, Section of Pisa, Via Moruzzi, 1, 56124 Pisa, Italy
a r t i c l e i n f o
Article history:Received 10 April 2015Received in revised form19 August 2015Accepted 21 August 2015Available online 29 August 2015
Keywords:NanoparticlesPhaeodactylum tricornutumSELDI-TOF-MSBiomarkersMicroalgae
x.doi.org/10.1016/j.ecoenv.2015.08.02413/& 2015 Elsevier Inc. All rights reserved.
esponding author. Fax: þ39 050 3152166.ail address: [email protected] (F. Scebba).ese authors equally contributed to this paper
a b s t r a c t
Quantum dots (QDs), namely semiconductor nanocrystals, due to their particular optical and electronicproperties, have growing applications in device technology, biotechnology and biomedical fields.Nevertheless, the possible threat to human health and the environment have attracted increasing at-tention as the production and applications of QDs increases rapidly while standard evaluation of safetylags.
In the present study we performed proteomic analyses, by means of 2D gel electrophoresis andSurface Enhanced Laser Desorption Ionization-Time of Flight-Mass Spectrometry (SELDI-TOF-MS). Weaimed to identify potential biomarkers of exposure to CdSe/ZnS quantum dots. The marine diatomPhaeodactylum tricornutum exposed to 2.5 nM QDs was used as a model system. Both 2DE and SELDIshowed the presence of differentially expressed proteins. By Principal Component Analysis (PCA) wewere able to show that the differentially expressed proteins can discriminate between exposed and notexposed cells. Furthermore, a protein profile specific for exposed cells was obtained by SELDI analysis. Toour knowledge, this is the first example of the application of SELDI technology to the analysis of mi-croorganisms used as biological sentinel model of marine environmental pollution.
& 2015 Elsevier Inc. All rights reserved.
1. Introduction
In the last two decades, colloidal semiconductor quantum dotshave received extraordinary attention for their unique optical andelectronic properties. Accordingly, they are increasingly used forapplications in manufacturing magnetic storage media, solar en-ergy transformation and electronics (Dow and Huang, 1996;Smyder and Krauss, 2011), as probes in biological imaging and astherapeutic tools for drug/gene delivery (Kim et al., 2010). On theother hand, as a consequence of the strong demand for nano-particles, a substantial amount of them could be released into theenvironment, from soil to aquatic systems. Therefore adequatestudies of their environmental fate and ecological impact shouldbe performed, and their effects on biota need to be addressed.
Environmental monitoring consist in the evaluation of en-vironmental quality by measuring a set of selected parameters on
as first author.
a regular basis. Traditionally this is based entirely on the evalua-tion of various physical and chemical variables in water and se-diment, occasionally including the assessment of contaminant le-vels in biota. However, the environmental level of pollutants willnot generally give any information about actual effects on thebiological systems (Lam and Gray, 2003). Approaches based onmonitoring the biological effects rather than detecting and quan-tifying pollutants are needed. Several studies have tried to focuson the possible adverse effects in terms of cytotoxicity and geno-toxicity of nanoparticles in living organisms, both animals (Ayeet al., 2013; Peng et al., 2013; Tang et al., 2013) and plants (Ban-dyopadhyay et al., 2015; Moon et al., 2014; Rico et al., 2015) in-cluding, recently, marine organisms (Blickley et al., 2014; Książyket al., 2015; Mackevica et al., 2015; Tang et al., 2014). Indeed, anincreasing input of nanoparticles in the aquatic environment isexpected, especially in riverine and coastal areas (Corsi et al.,2014). Cellular and molecular mechanisms taking place in modelmarine organisms are useful tools to assess environmental riskrelated to nanoparticles exposure (Matranga and Corsi, 2012).Unicellular phytoplanktonic algae represent suitable organisms for
F. Scebba et al. / Ecotoxicology and Environmental Safety 123 (2016) 45–5246
investigating the potential ecotoxicological risk, because they arein direct contact with the external medium. In addition, micro-algae are at the base of the marine food web and could play afundamental role in the accumulation and toxicity of nano-particles, through their potential transfer along the food chain.
Over many years, a significant effort has been made to find up-to-date methods to assess how pollutants affect ecosystems in-cluding living organisms. The use of biological markers has beenproposed as a sensitive “early warning” tool for biological effectmeasurement in environment quality assessment (Cajaravilleet al., 2000). New biomarker assays are continually being devel-oped, but frequently they measure changes in the expression levelof single proteins/enzymes or mRNAs. However it has proved thatsingle biomarkers might not be sufficient to indicate the impact ofenvironmental pollutants (Galloway et al., 2004) because they donot provide unambiguous answers regarding possible effect onbiota. As in clinical medicine, it is clear that most pollutant effectsdepend on a variety of responses, rather than a single one.
Genomic and proteomic technologies have the advantage ofsimultaneously evaluating the expression of many genes, tran-scripts or proteins in a single step, finding differentially expressedgenes which could be putative biomarkers. They are highthroughput assays allowing large-scale analysis of the possiblemolecular responses.
Proteins are the functional molecules of the cell (Gygi et al.,1999) and define metabolic pathways. Therefore, relevant in-formation about the cell response to any environmental toxicantmay be obtained by monitoring changes in protein expression.Traditionally this is done by two-dimensional gel electrophoresis(2DE). In spite of being a powerful technique, 2DE has drawbackssuch as a not excellent resolution of low molecular weights pro-teins and low throughput capacity (Beranova-Giorgianni, 2003).High throughput proteomic technologies are now available, amongwhich the gel-free SELDI-TOF-MS. This approach utilizes chemi-cally derivatized arrays which chromatographically bind a subsetof proteins from a biological matrix of interest, thus enriching thespecific proteins and increasing the sensitivity for low abundancespecies. TOF-MS allows the bound peptides/proteins to be profiledin a semi-quantitative manner (Tang et al., 2004). ProteinChipsurfaces with various chromatographic properties are available,and subsets of proteins with common properties can therefore beeasily selected and analyzed. The approach is rapid, and requiressmall sample volumes without special sample pre-treatment(Poon, 2007).
SELDI has been used as a proteomic profiling method in clinicaland pre-clinical studies in which large number of samples areanalyzed and in which more standard proteomic approaches arenot suitable due to their low throughput capacity (Collins et al.,2010). Compared to 2DE, only a few studies applying SELDI in thefield of environmental toxicology have been published to date(Bjørnstad et al., 2006; Gomiero et al., 2006; Larsen et al., 2006;Lee et al., 2013; Mo et al., 2013; Monsinjon et al., 2006) and onlyone evaluated the toxic effect of nanoparticles on Cucumis sativusseeds (Moon et al., 2014).
Recently, the toxicity of CdSe/ZnS quantum dots (QDs) on themarine diatom Phaeodactylum tricornutum has been investigated(Morelli et al., 2012, 2013). Exposure of P. tricornutum to QDs in-duces growth inhibition, oxidative stress, and lipid peroxidation ina dose-dependent manner. The observed toxicity can be ascribedto the nanoparticles themselves rather than to the dissolved ionsreleased from nanoparticles, since the uptake of Cd ions by P. tri-cornutum cells occurs only during late stationary phase, as showedelsewhere (Morelli et al., 2015). In the present study we definedthe protein expression pattern in extracts of P. tricornutum cellsexposed to CdSe/ZnS quantum dots, using both 2DE and SELDI-TOFMS technology. SELDI analysis detected a specific protein signature
induced by QD exposure.
2. Materials and methods
All reagents, unless specified, were purchased from Sigma(Sigma-Aldrich, St. Louis, MO, USA).
2.1. Quantum dots
CdSe/ZnS core/shell quantum dots (QDs), emitting at 590 nm,are stabilized by a hexadecylamine layer, used as a ligand coatingsurface, and shipped in 5 mg mL�1 toluene dispersion. To allowthe transfer of QDs in water, the organic layer was encapsulated ina functional bilayer film composed of an amphiphilic polymer poly(styrene-co-maleic anhydride) terminated with cumene (PSMA)and ethanolamine, following the procedure reported by Lees et al.(2009) with some modifications (Morelli et al., 2012). QD con-centration was measured spectrophotometrically (ε569¼1.6�105 M�1 cm�1, provided by the manufacturer). Total Cd wasmeasured by Atomic Absorption Spectrometry (Perkin Elmer, Ue-berlingen, Germany), after acidification with HNO3 (0.3% v/v). QDand total Cd concentrations in the stock suspension were 1.3 μMand 620 μM, respectively. The size of the bilayer encapsulated QDswas 1773 nm, as stated by fluorescence correlation spectroscopymeasurements (Morelli et al., 2013). Stable suspensions of water-soluble QDs were stored in the dark at þ4 °C for a maximum of3 months and used for the experiments with algae. Water waspurified by a Milli-Q system from Millipore (Vimodrone, Italy).
2.2. P. tricornutum growth and exposure conditions
The unicellular marine diatom P. tricornutum (Bohlin) used inthis study was obtained from the Culture Collection of Algae andProtozoa (Dunstaffnage Marine Laboratory, UK). Stock cultureswere grown in axenic conditions at 2171 °C and fluorescentdaylight (100 mmol photons m�2 s�1) in a 16:8 light-dark cycle.Culture medium was natural seawater enriched with f/2 medium(Guillard, 1975) modified to obtain a f/10 medium as far as tracemetal concentration is concerned. Seawater was collected in anuncontaminated area, filtered through 0.2 μm membrane filters(Millipore) and stored in the dark at þ4 ° C. Exponential growthwas maintained by inoculating cells weekly into fresh sterilizedmedium. Cell density was measured by recording the opticaldensity of chlorophyll at 680 nm (OD680) by UV/Vis spectro-photometer (JASCO V-550, Lecco, Italy). A standard curve of OD680
vs cell number was generated to convert the optical density ofchlorophyll to cell number, measured by haemocytometer.
The effects of QDs were evaluated by exposing P. tricornutumcultures to 2.5 nM QDs in two successive exposure cycles. For thefirst exposure cycle, algae from a stock culture were inoculated infresh medium (volume¼400 mL) at an initial cell density of5�104 cells mL�1 and spiked with QDs. OD680 values of the algalcultures were measured daily until they reached OD680E0.25,corresponding to 2�106 cells mL�1 (late exponential phase, 7–8days). An aliquot of this culture (calculated to contain 4–6�108
cells) was filtered (1.2 mm, Millipore) and the harvested algaestored at �80 °C until use for proteomic analysis (algae-QD1). Forthe second exposure cycle, suitable aliquots of the first culturewere inoculated in fresh medium with 2.5 nM QDs to obtain aninitial cell density of 5�104 cells mL�1 (usually 10 mL in 400 mL),and the growth was monitored for 4 days. At this time, algae wereharvested as described above, stored at �80 °C and used forproteomic analysis (algae-QD2). Control cultures (no QDs added)were always used in parallel. Three biological replicates of ex-posure to QDs were carried out. The specific growth rate, μ, was
F. Scebba et al. / Ecotoxicology and Environmental Safety 123 (2016) 45–52 47
estimated using the following growth equation (Guillard andSieracki, 2005): μ¼ ln(N1/N0)/(t1�t0), where N0 and N1 are the celldensities (cells mL�1) at time zero (t0) and 96 h (t1) after the ad-dition of 2.5 nM QDs, respectively. The growth inhibition, I, wasdetermined using the specific growth rate of control, mc, and thatof exposed cultures, mexp, according to this formula: I¼100x(mc�mexp)/mc. One-way Anova-test and a post-hoc analysis of var-iance (Tukey test) were conducted using the OriginPro 7.5 SR0software (Origin Lab Corporation, MA, USA).
2.3. Protein extraction
Proteins were extracted from frozen algae using TRIzols
Re-agent (Invitrogen, Life Technologies, CA, USA), following themanufacturer's instructions. Frozen cells (2–6�108) were sus-pended in 1 mL of Trizol and disrupted by sonication (SonopulsUltrasonic Homogenizer, Bandelin) for 3 min with a repeating dutycycle of 0.3 s on ice. After sonication, samples were treated with0.2 mL of chloroform, mixed vigorously by hand, incubated atroom temperature for 15 min and centrifuged for 20 min at12,000xg, at 4 °C. After RNA and DNA removal, isopropanol wasadded to the phenol-ethanol phase to precipitate proteins. Suc-cessively the protein pellet was washed three times with 0.3 Mguanidine hydrochloride in 95% ethanol, once with 100% ethanoland finally suspended in 9.5 M urea and 2% CHAPS. Proteins weresolubilized by gentle shaking at room temperature for about1hour. Insoluble material was removed by centrifugation(10,000xg for 15 min at 4 °C). Protein concentration was de-termined by Bradford method (Bradford, 1976), using bovine ser-um albumin as standard.
2.4. Two dimensional gel electrophoresis (2-DE) and gel imageanalysis
For the first dimension, equal amounts of proteins (80 μg persample) were dissolved in rehydration buffer composed by 8 MUrea, 2% CHAPS, 0.2% DTT, and 2% IPG buffer pH 4–7 (AmershamBioscience) to a final volume of 250 μL. Trace quantities of bro-mophenol blue were also added, to obtain colored samples. Pro-tein samples were loaded on ImmobilineDryStrip 11 cm pH 4–7 NL(Amersham Bioscience). Following overnight passive rehydration,isoelectric focusing was performed at 45 kVh and 15 °C for 16 h,using the Multiphor II apparatus (Amersham Biosciences) equip-ped with EPS 3500 XL power supply (Pharmacia). After isoelectricfocalization, focused strips were frozen at �80 ° C. Before thesecond dimension separation, strips were equilibrated for 15 minin 50 mM Tris–HCl buffer (pH 8.8), containing 30% glycerol, 6 Murea, 4% SDS and 2% DTT, to reduce proteins. Subsequently, pro-teins were alkylated for 15 min in 50 mM Tris–HCl pH 6.8, con-taining 30% glycerol, 6 M urea, 4% SDS, and 3% iodoacetamide.Strips were loaded on the top of 14% w/v polyacrylamide gel andcovered with 0.5% agarose. SDS-PAGE vertical electrophoresis wasperformed with Hoefer SE 600 Ruby apparatus, equipped with3000 Xi power supply (Bio-Rad Laboratories). Electrophoresis wascarried out at 9 °C in 50 mM Tris, 193 mM glycine, and 0.1% SDS, at5 mA/gel for 30 min, followed by 30 mA/gel for about 4 h. At theend of the run, gels were treated with fixing solution (40% me-thanol, 10% acetic acid) and stained with Coomassie Brilliant BlueG-250. Control and exposed sample pairs were always run to-gether to minimize the effects of instrumental variations on pro-tein migration along the gel. Gels were scanned and the 16 bitimages were aligned, filtered to remove speckling, background-subtracted, and compared using SameSpots analysis software(Totallab).
2.5. SELDI-TOF-MS
2.5.1. Protein profilingThe ProteinChip arrays were purchased from Bio-Rad (BioRad
Laboratories, Hercules, CA, USA). In a preliminary experiment P.tricornutum extracts were applied to four different array typeswith their appropriate binding buffers. We tested the weak cationexchange (CM10) array with 100 mM sodium acetate buffer (pH 4),the strong anion exchange (Q10) array with 100 mM Tris HClbuffer (pH 8.0), the hydrophobic (H50) array with 10% ACN/0.1%TFA buffer and finally the Immobilized Metal Affinity Capture(IMAC30) array charged with copper sulfate, with the bindingbuffer 100 mM sodium phosphate/500 mM sodium chloride (pH7.0).
Each sample, corresponding to 10 μg of total proteins, wasloaded in triplicate on arrays. Samples were mixed with eachbinding buffer to the final volume of 150 μl and loaded onto pre-equilibrated spot surfaces. After 30 min incubation with horizontalshaking at room temperature, the unbound proteins were washedout in three steps with 200 μl of the corresponding buffer and200 μl of HPLC-grade water was applied once to remove salts.Finally, 1 μl of saturated sinapinic acid (SPA, BioRad Laboratories)in 50% ACN (Aldrich, Sigma-Aldrich) and 0.5% TFA (Fluka, Sigma-Aldrich) was added twice to each spot on the chip and allowed todry.
2.5.2. Data acquisition and analysisThe ProteinChips were analyzed using a linear TOF mass
spectrometer, PCS 4000 (Ciphergen, USA), with the followingprotocols. Protocol 1: laser power 3250 nJ, matrix attenuation2500, focus mass 10000, sample rate 800 and 25% spot surfacefired for ion profiling between the mass/charge (m/z) range of 0–25000. Protocol 2: laser power 4000 nJ, matrix attenuation 2500,focus mass 30000, sample rate 800 and 25% spot surface fired forion profiling between the mass/charge (m/z) range of 25000–50000. Using ProteinChip Data Manager 3.5 software (BioRad La-boratories), spectra were externally calibrated with ProteinChipAll-in 1 peptide standard (BioRad Laboratories), baseline sub-tracted, mass aligned and normalized using the total ion currentwithin the m/z range 3000–30,000 for the low mass proteins and25000–50000 for the high mass proteins. Qualified mass peaks(signal/noise, S/N45) were auto-detected. Peak clusters werecompleted using a second pass peak selection (S/N42, within0.3% mass window) with minimum peak threshold 20% of allspectra and estimated peaks added. We obtained a cluster list foreach sample in every ProteinChip. Relative peak intensities (fromthree replicate determinations for each sample) were comparedbetween control and quantum dots groups using control as re-ference group. Peaks variation in intensity was evaluated byMann–Whitney U test and a p-value less than 0.05 was accepted asstatistically significant.
A principal component analysis (PCA) was performed with log-transformed data and correlation matrix. Protein Chip data man-ager software used PCA to visualize spectra in three-dimensionalgraphs that illustrated relationships between spectra based ontheir expression profiles.
3. Results and discussion
3.1. Toxicity of QDs to P. tricornutum
Exposure of P. tricornutum to QDs (0.5–2.5 nM) induces a dose-dependent inhibition of growth rate concomitant to reactiveoxygen species (ROS) production enhancement, activation of an-tioxidant enzymes and lipid peroxidation (Morelli et al., 2013). In
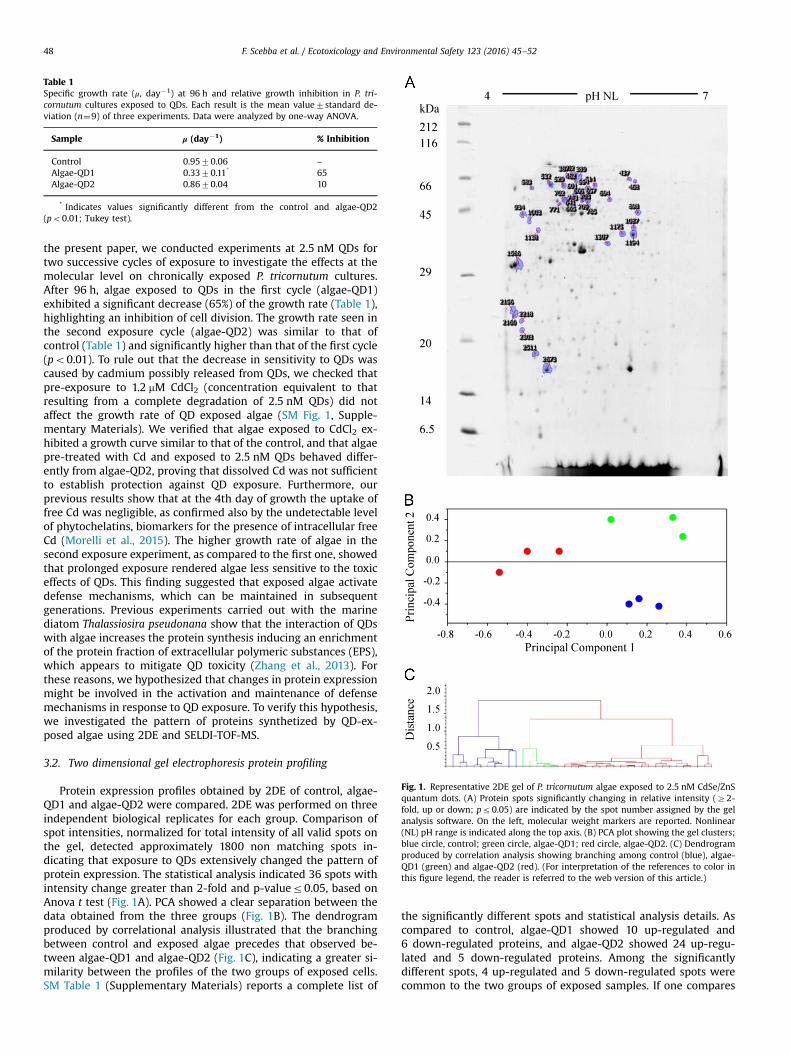
Table 1Specific growth rate (μ, day�1) at 96 h and relative growth inhibition in P. tri-cornutum cultures exposed to QDs. Each result is the mean value7standard de-viation (n¼9) of three experiments. Data were analyzed by one-way ANOVA.
Sample μ (day�1) % Inhibition
Control 0.9570.06 –
Algae-QD1 0.3370.11* 65Algae-QD2 0.8670.04 10
* Indicates values significantly different from the control and algae-QD2(po0.01; Tukey test).
Fig. 1. Representative 2DE gel of P. tricornutum algae exposed to 2.5 nM CdSe/ZnSquantum dots. (A) Protein spots significantly changing in relative intensity (Z2-fold, up or down; pr0.05) are indicated by the spot number assigned by the gelanalysis software. On the left, molecular weight markers are reported. Nonlinear(NL) pH range is indicated along the top axis. (B) PCA plot showing the gel clusters;blue circle, control; green circle, algae-QD1; red circle, algae-QD2. (C) Dendrogramproduced by correlation analysis showing branching among control (blue), algae-QD1 (green) and algae-QD2 (red). (For interpretation of the references to color inthis figure legend, the reader is referred to the web version of this article.)
F. Scebba et al. / Ecotoxicology and Environmental Safety 123 (2016) 45–5248
the present paper, we conducted experiments at 2.5 nM QDs fortwo successive cycles of exposure to investigate the effects at themolecular level on chronically exposed P. tricornutum cultures.After 96 h, algae exposed to QDs in the first cycle (algae-QD1)exhibited a significant decrease (65%) of the growth rate (Table 1),highlighting an inhibition of cell division. The growth rate seen inthe second exposure cycle (algae-QD2) was similar to that ofcontrol (Table 1) and significantly higher than that of the first cycle(po0.01). To rule out that the decrease in sensitivity to QDs wascaused by cadmium possibly released from QDs, we checked thatpre-exposure to 1.2 mM CdCl2 (concentration equivalent to thatresulting from a complete degradation of 2.5 nM QDs) did notaffect the growth rate of QD exposed algae (SM Fig. 1, Supple-mentary Materials). We verified that algae exposed to CdCl2 ex-hibited a growth curve similar to that of the control, and that algaepre-treated with Cd and exposed to 2.5 nM QDs behaved differ-ently from algae-QD2, proving that dissolved Cd was not sufficientto establish protection against QD exposure. Furthermore, ourprevious results show that at the 4th day of growth the uptake offree Cd was negligible, as confirmed also by the undetectable levelof phytochelatins, biomarkers for the presence of intracellular freeCd (Morelli et al., 2015). The higher growth rate of algae in thesecond exposure experiment, as compared to the first one, showedthat prolonged exposure rendered algae less sensitive to the toxiceffects of QDs. This finding suggested that exposed algae activatedefense mechanisms, which can be maintained in subsequentgenerations. Previous experiments carried out with the marinediatom Thalassiosira pseudonana show that the interaction of QDswith algae increases the protein synthesis inducing an enrichmentof the protein fraction of extracellular polymeric substances (EPS),which appears to mitigate QD toxicity (Zhang et al., 2013). Forthese reasons, we hypothesized that changes in protein expressionmight be involved in the activation and maintenance of defensemechanisms in response to QD exposure. To verify this hypothesis,we investigated the pattern of proteins synthetized by QD-ex-posed algae using 2DE and SELDI-TOF-MS.
3.2. Two dimensional gel electrophoresis protein profiling
Protein expression profiles obtained by 2DE of control, algae-QD1 and algae-QD2 were compared. 2DE was performed on threeindependent biological replicates for each group. Comparison ofspot intensities, normalized for total intensity of all valid spots onthe gel, detected approximately 1800 non matching spots in-dicating that exposure to QDs extensively changed the pattern ofprotein expression. The statistical analysis indicated 36 spots withintensity change greater than 2-fold and p-valuer0.05, based onAnova t test (Fig. 1A). PCA showed a clear separation between thedata obtained from the three groups (Fig. 1B). The dendrogramproduced by correlational analysis illustrated that the branchingbetween control and exposed algae precedes that observed be-tween algae-QD1 and algae-QD2 (Fig. 1C), indicating a greater si-milarity between the profiles of the two groups of exposed cells.SM Table 1 (Supplementary Materials) reports a complete list of
the significantly different spots and statistical analysis details. Ascompared to control, algae-QD1 showed 10 up-regulated and6 down-regulated proteins, and algae-QD2 showed 24 up-regu-lated and 5 down-regulated proteins. Among the significantlydifferent spots, 4 up-regulated and 5 down-regulated spots werecommon to the two groups of exposed samples. If one compares
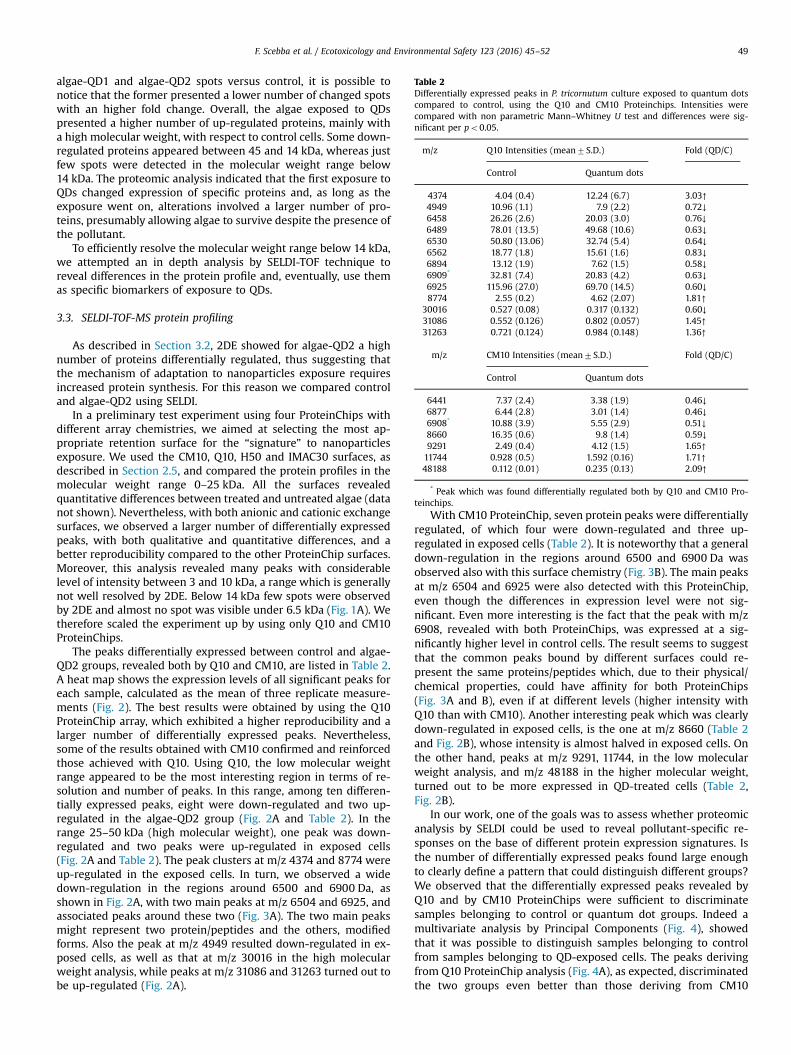
Table 2Differentially expressed peaks in P. tricornutum culture exposed to quantum dotscompared to control, using the Q10 and CM10 Proteinchips. Intensities werecompared with non parametric Mann–Whitney U test and differences were sig-nificant per po0.05.
m/z Q10 Intensities (mean7S.D.) Fold (QD/C)
Control Quantum dots
4374 4.04 (0.4) 12.24 (6.7) 3.03↑4949 10.96 (1.1) 7.9 (2.2) 0.72↓6458 26.26 (2.6) 20.03 (3.0) 0.76↓6489 78.01 (13.5) 49.68 (10.6) 0.63↓6530 50.80 (13.06) 32.74 (5.4) 0.64↓6562 18.77 (1.8) 15.61 (1.6) 0.83↓6894 13.12 (1.9) 7.62 (1.5) 0.58↓6909* 32.81 (7.4) 20.83 (4.2) 0.63↓6925 115.96 (27.0) 69.70 (14.5) 0.60↓8774 2.55 (0.2) 4.62 (2.07) 1.81↑
30016 0.527 (0.08) 0.317 (0.132) 0.60↓31086 0.552 (0.126) 0.802 (0.057) 1.45↑31263 0.721 (0.124) 0.984 (0.148) 1.36↑
m/z CM10 Intensities (mean7S.D.) Fold (QD/C)
Control Quantum dots
6441 7.37 (2.4) 3.38 (1.9) 0.46↓6877 6.44 (2.8) 3.01 (1.4) 0.46↓6908* 10.88 (3.9) 5.55 (2.9) 0.51↓8660 16.35 (0.6) 9.8 (1.4) 0.59↓9291 2.49 (0.4) 4.12 (1.5) 1.65↑11744 0.928 (0.5) 1.592 (0.16) 1.71↑48188 0.112 (0.01) 0.235 (0.13) 2.09↑
* Peak which was found differentially regulated both by Q10 and CM10 Pro-
F. Scebba et al. / Ecotoxicology and Environmental Safety 123 (2016) 45–52 49
algae-QD1 and algae-QD2 spots versus control, it is possible tonotice that the former presented a lower number of changed spotswith an higher fold change. Overall, the algae exposed to QDspresented a higher number of up-regulated proteins, mainly witha high molecular weight, with respect to control cells. Some down-regulated proteins appeared between 45 and 14 kDa, whereas justfew spots were detected in the molecular weight range below14 kDa. The proteomic analysis indicated that the first exposure toQDs changed expression of specific proteins and, as long as theexposure went on, alterations involved a larger number of pro-teins, presumably allowing algae to survive despite the presence ofthe pollutant.
To efficiently resolve the molecular weight range below 14 kDa,we attempted an in depth analysis by SELDI-TOF technique toreveal differences in the protein profile and, eventually, use themas specific biomarkers of exposure to QDs.
3.3. SELDI-TOF-MS protein profiling
As described in Section 3.2, 2DE showed for algae-QD2 a highnumber of proteins differentially regulated, thus suggesting thatthe mechanism of adaptation to nanoparticles exposure requiresincreased protein synthesis. For this reason we compared controland algae-QD2 using SELDI.
In a preliminary test experiment using four ProteinChips withdifferent array chemistries, we aimed at selecting the most ap-propriate retention surface for the “signature” to nanoparticlesexposure. We used the CM10, Q10, H50 and IMAC30 surfaces, asdescribed in Section 2.5, and compared the protein profiles in themolecular weight range 0–25 kDa. All the surfaces revealedquantitative differences between treated and untreated algae (datanot shown). Nevertheless, with both anionic and cationic exchangesurfaces, we observed a larger number of differentially expressedpeaks, with both qualitative and quantitative differences, and abetter reproducibility compared to the other ProteinChip surfaces.Moreover, this analysis revealed many peaks with considerablelevel of intensity between 3 and 10 kDa, a range which is generallynot well resolved by 2DE. Below 14 kDa few spots were observedby 2DE and almost no spot was visible under 6.5 kDa (Fig. 1A). Wetherefore scaled the experiment up by using only Q10 and CM10ProteinChips.
The peaks differentially expressed between control and algae-QD2 groups, revealed both by Q10 and CM10, are listed in Table 2.A heat map shows the expression levels of all significant peaks foreach sample, calculated as the mean of three replicate measure-ments (Fig. 2). The best results were obtained by using the Q10ProteinChip array, which exhibited a higher reproducibility and alarger number of differentially expressed peaks. Nevertheless,some of the results obtained with CM10 confirmed and reinforcedthose achieved with Q10. Using Q10, the low molecular weightrange appeared to be the most interesting region in terms of re-solution and number of peaks. In this range, among ten differen-tially expressed peaks, eight were down-regulated and two up-regulated in the algae-QD2 group (Fig. 2A and Table 2). In therange 25–50 kDa (high molecular weight), one peak was down-regulated and two peaks were up-regulated in exposed cells(Fig. 2A and Table 2). The peak clusters at m/z 4374 and 8774 wereup-regulated in the exposed cells. In turn, we observed a widedown-regulation in the regions around 6500 and 6900 Da, asshown in Fig. 2A, with two main peaks at m/z 6504 and 6925, andassociated peaks around these two (Fig. 3A). The two main peaksmight represent two protein/peptides and the others, modifiedforms. Also the peak at m/z 4949 resulted down-regulated in ex-posed cells, as well as that at m/z 30016 in the high molecularweight analysis, while peaks at m/z 31086 and 31263 turned out tobe up-regulated (Fig. 2A).
With CM10 ProteinChip, seven protein peaks were differentiallyregulated, of which four were down-regulated and three up-regulated in exposed cells (Table 2). It is noteworthy that a generaldown-regulation in the regions around 6500 and 6900 Da wasobserved also with this surface chemistry (Fig. 3B). The main peaksat m/z 6504 and 6925 were also detected with this ProteinChip,even though the differences in expression level were not sig-nificant. Even more interesting is the fact that the peak with m/z6908, revealed with both ProteinChips, was expressed at a sig-nificantly higher level in control cells. The result seems to suggestthat the common peaks bound by different surfaces could re-present the same proteins/peptides which, due to their physical/chemical properties, could have affinity for both ProteinChips(Fig. 3A and B), even if at different levels (higher intensity withQ10 than with CM10). Another interesting peak which was clearlydown-regulated in exposed cells, is the one at m/z 8660 (Table 2and Fig. 2B), whose intensity is almost halved in exposed cells. Onthe other hand, peaks at m/z 9291, 11744, in the low molecularweight analysis, and m/z 48188 in the higher molecular weight,turned out to be more expressed in QD-treated cells (Table 2,Fig. 2B).
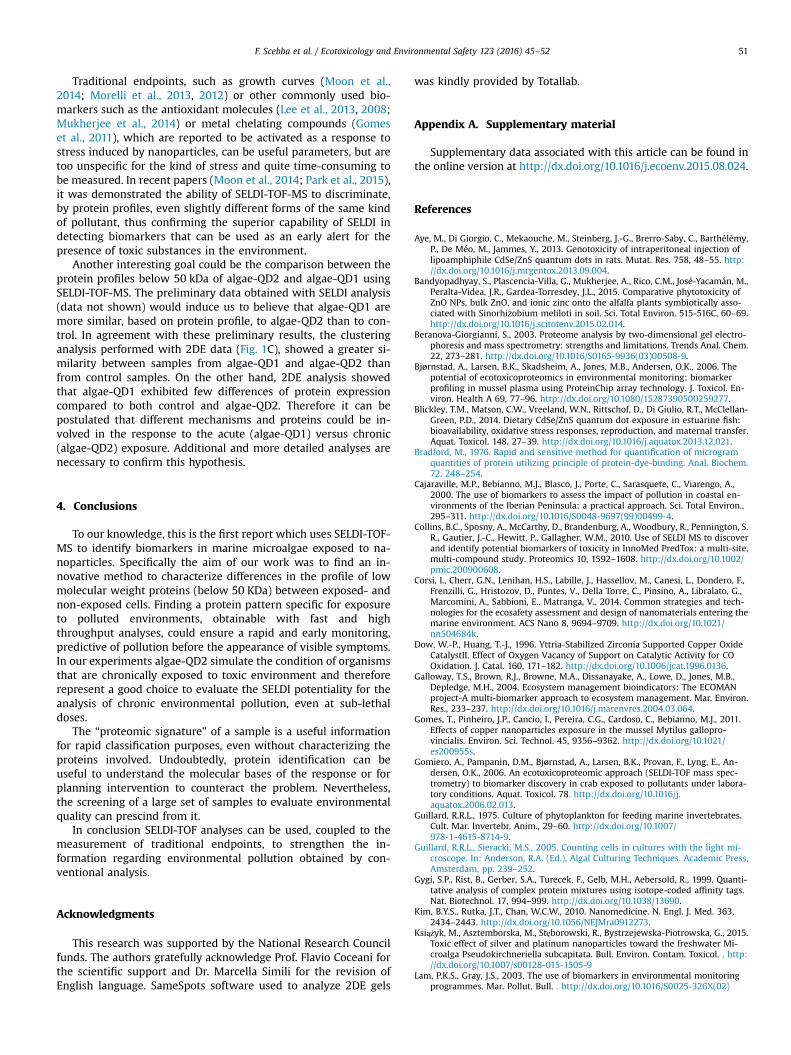
In our work, one of the goals was to assess whether proteomicanalysis by SELDI could be used to reveal pollutant-specific re-sponses on the base of different protein expression signatures. Isthe number of differentially expressed peaks found large enoughto clearly define a pattern that could distinguish different groups?We observed that the differentially expressed peaks revealed byQ10 and by CM10 ProteinChips were sufficient to discriminatesamples belonging to control or quantum dot groups. Indeed amultivariate analysis by Principal Components (Fig. 4), showedthat it was possible to distinguish samples belonging to controlfrom samples belonging to QD-exposed cells. The peaks derivingfrom Q10 ProteinChip analysis (Fig. 4A), as expected, discriminatedthe two groups even better than those deriving from CM10
teinchips.
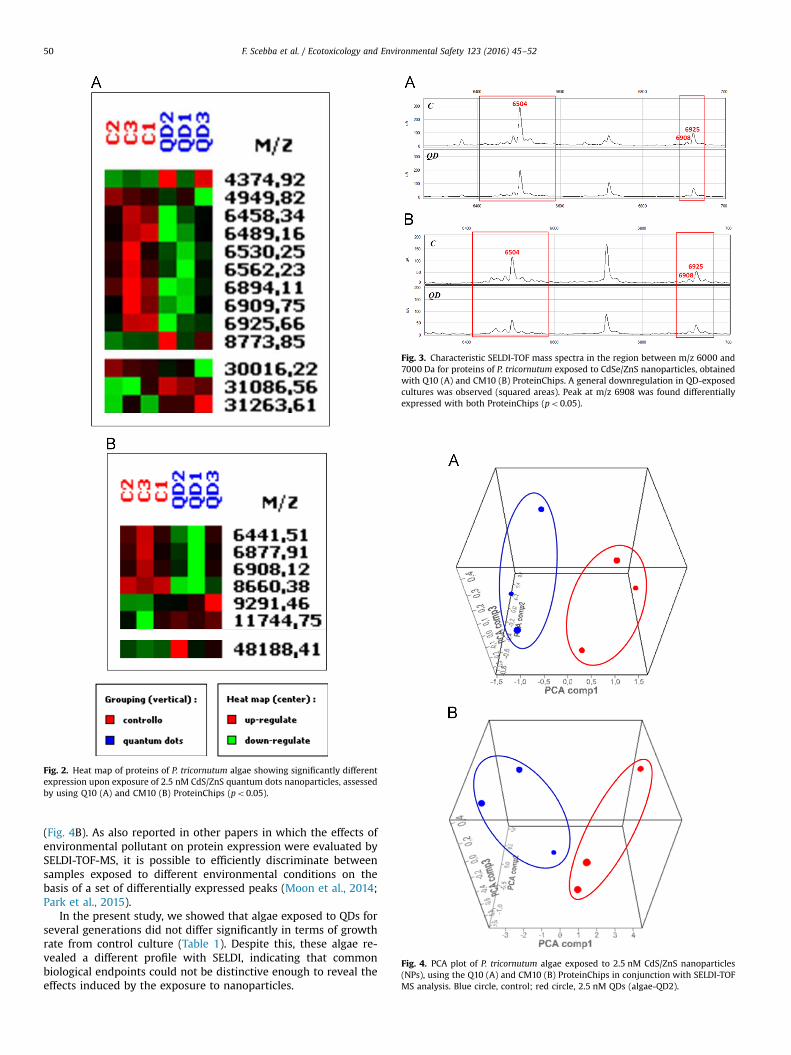
Fig. 2. Heat map of proteins of P. tricornutum algae showing significantly differentexpression upon exposure of 2.5 nM CdS/ZnS quantum dots nanoparticles, assessedby using Q10 (A) and CM10 (B) ProteinChips (po0.05).
Fig. 3. Characteristic SELDI-TOF mass spectra in the region between m/z 6000 and7000 Da for proteins of P. tricornutum exposed to CdSe/ZnS nanoparticles, obtainedwith Q10 (A) and CM10 (B) ProteinChips. A general downregulation in QD-exposedcultures was observed (squared areas). Peak at m/z 6908 was found differentiallyexpressed with both ProteinChips (po0.05).
Fig. 4. PCA plot of P. tricornutum algae exposed to 2.5 nM CdS/ZnS nanoparticles(NPs), using the Q10 (A) and CM10 (B) ProteinChips in conjunction with SELDI-TOFMS analysis. Blue circle, control; red circle, 2.5 nM QDs (algae-QD2).
F. Scebba et al. / Ecotoxicology and Environmental Safety 123 (2016) 45–5250
(Fig. 4B). As also reported in other papers in which the effects ofenvironmental pollutant on protein expression were evaluated bySELDI-TOF-MS, it is possible to efficiently discriminate betweensamples exposed to different environmental conditions on thebasis of a set of differentially expressed peaks (Moon et al., 2014;Park et al., 2015).
In the present study, we showed that algae exposed to QDs forseveral generations did not differ significantly in terms of growthrate from control culture (Table 1). Despite this, these algae re-vealed a different profile with SELDI, indicating that commonbiological endpoints could not be distinctive enough to reveal theeffects induced by the exposure to nanoparticles.
F. Scebba et al. / Ecotoxicology and Environmental Safety 123 (2016) 45–52 51
Traditional endpoints, such as growth curves (Moon et al.,2014; Morelli et al., 2013, 2012) or other commonly used bio-markers such as the antioxidant molecules (Lee et al., 2013, 2008;Mukherjee et al., 2014) or metal chelating compounds (Gomeset al., 2011), which are reported to be activated as a response tostress induced by nanoparticles, can be useful parameters, but aretoo unspecific for the kind of stress and quite time-consuming tobe measured. In recent papers (Moon et al., 2014; Park et al., 2015),it was demonstrated the ability of SELDI-TOF-MS to discriminate,by protein profiles, even slightly different forms of the same kindof pollutant, thus confirming the superior capability of SELDI indetecting biomarkers that can be used as an early alert for thepresence of toxic substances in the environment.
Another interesting goal could be the comparison between theprotein profiles below 50 kDa of algae-QD2 and algae-QD1 usingSELDI-TOF-MS. The preliminary data obtained with SELDI analysis(data not shown) would induce us to believe that algae-QD1 aremore similar, based on protein profile, to algae-QD2 than to con-trol. In agreement with these preliminary results, the clusteringanalysis performed with 2DE data (Fig. 1C), showed a greater si-milarity between samples from algae-QD1 and algae-QD2 thanfrom control samples. On the other hand, 2DE analysis showedthat algae-QD1 exhibited few differences of protein expressioncompared to both control and algae-QD2. Therefore it can bepostulated that different mechanisms and proteins could be in-volved in the response to the acute (algae-QD1) versus chronic(algae-QD2) exposure. Additional and more detailed analyses arenecessary to confirm this hypothesis.
4. Conclusions
To our knowledge, this is the first report which uses SELDI-TOF-MS to identify biomarkers in marine microalgae exposed to na-noparticles. Specifically the aim of our work was to find an in-novative method to characterize differences in the profile of lowmolecular weight proteins (below 50 KDa) between exposed- andnon-exposed cells. Finding a protein pattern specific for exposureto polluted environments, obtainable with fast and highthroughput analyses, could ensure a rapid and early monitoring,predictive of pollution before the appearance of visible symptoms.In our experiments algae-QD2 simulate the condition of organismsthat are chronically exposed to toxic environment and thereforerepresent a good choice to evaluate the SELDI potentiality for theanalysis of chronic environmental pollution, even at sub-lethaldoses.
The “proteomic signature” of a sample is a useful informationfor rapid classification purposes, even without characterizing theproteins involved. Undoubtedly, protein identification can beuseful to understand the molecular bases of the response or forplanning intervention to counteract the problem. Nevertheless,the screening of a large set of samples to evaluate environmentalquality can prescind from it.
In conclusion SELDI-TOF analyses can be used, coupled to themeasurement of traditional endpoints, to strengthen the in-formation regarding environmental pollution obtained by con-ventional analysis.
Acknowledgments
This research was supported by the National Research Councilfunds. The authors gratefully acknowledge Prof. Flavio Coceani forthe scientific support and Dr. Marcella Simili for the revision ofEnglish language. SameSpots software used to analyze 2DE gels
was kindly provided by Totallab.
Appendix A. Supplementary material
Supplementary data associated with this article can be found inthe online version at http://dx.doi.org/10.1016/j.ecoenv.2015.08.024.
References
Aye, M., Di Giorgio, C., Mekaouche, M., Steinberg, J.-G., Brerro-Saby, C., Barthélémy,P., De Méo, M., Jammes, Y., 2013. Genotoxicity of intraperitoneal injection oflipoamphiphile CdSe/ZnS quantum dots in rats. Mutat. Res. 758, 48–55. http://dx.doi.org/10.1016/j.mrgentox.2013.09.004.
Bandyopadhyay, S., Plascencia-Villa, G., Mukherjee, A., Rico, C.M., José-Yacamán, M.,Peralta-Videa, J.R., Gardea-Torresdey, J.L., 2015. Comparative phytotoxicity ofZnO NPs, bulk ZnO, and ionic zinc onto the alfalfa plants symbiotically asso-ciated with Sinorhizobium meliloti in soil. Sci. Total Environ. 515-516C, 60–69.http://dx.doi.org/10.1016/j.scitotenv.2015.02.014.
Beranova-Giorgianni, S., 2003. Proteome analysis by two-dimensional gel electro-phoresis and mass spectrometry: strengths and limitations. Trends Anal. Chem.22, 273–281. http://dx.doi.org/10.1016/S0165-9936(03)00508-9.
Bjørnstad, A., Larsen, B.K., Skadsheim, A., Jones, M.B., Andersen, O.K., 2006. Thepotential of ecotoxicoproteomics in environmental monitoring: biomarkerprofiling in mussel plasma using ProteinChip array technology. J. Toxicol. En-viron. Health A 69, 77–96. http://dx.doi.org/10.1080/15287390500259277.
Blickley, T.M., Matson, C.W., Vreeland, W.N., Rittschof, D., Di Giulio, R.T., McClellan-Green, P.D., 2014. Dietary CdSe/ZnS quantum dot exposure in estuarine fish:bioavailability, oxidative stress responses, reproduction, and maternal transfer.Aquat. Toxicol. 148, 27–39. http://dx.doi.org/10.1016/j.aquatox.2013.12.021.
Bradford, M., 1976. Rapid and sensitive method for quantification of microgramquantities of protein utilizing principle of protein-dye-binding. Anal. Biochem.72, 248–254.
Cajaraville, M.P., Bebianno, M.J., Blasco, J., Porte, C., Sarasquete, C., Viarengo, A.,2000. The use of biomarkers to assess the impact of pollution in coastal en-vironments of the Iberian Peninsula: a practical approach. Sci. Total Environ.,295–311. http://dx.doi.org/10.1016/S0048-9697(99)00499-4.
Collins, B.C., Sposny, A., McCarthy, D., Brandenburg, A., Woodbury, R., Pennington, S.R., Gautier, J.-C., Hewitt, P., Gallagher, W.M., 2010. Use of SELDI MS to discoverand identify potential biomarkers of toxicity in InnoMed PredTox: a multi-site,multi-compound study. Proteomics 10, 1592–1608. http://dx.doi.org/10.1002/pmic.200900608.
Corsi, I., Cherr, G.N., Lenihan, H.S., Labille, J., Hassellov, M., Canesi, L., Dondero, F.,Frenzilli, G., Hristozov, D., Puntes, V., Della Torre, C., Pinsino, A., Libralato, G.,Marcomini, A., Sabbioni, E., Matranga, V., 2014. Common strategies and tech-nologies for the ecosafety assessment and design of nanomaterials entering themarine environment. ACS Nano 8, 9694–9709. http://dx.doi.org/10.1021/nn504684k.
Dow, W.-P., Huang, T.-J., 1996. Yttria-Stabilized Zirconia Supported Copper OxideCatalystII. Effect of Oxygen Vacancy of Support on Catalytic Activity for COOxidation. J. Catal. 160, 171–182. http://dx.doi.org/10.1006/jcat.1996.0136.
Galloway, T.S., Brown, R.J., Browne, M.A., Dissanayake, A., Lowe, D., Jones, M.B.,Depledge, M.H., 2004. Ecosystem management bioindicators: The ECOMANproject-A multi-biomarker approach to ecosystem management. Mar. Environ.Res., 233–237. http://dx.doi.org/10.1016/j.marenvres.2004.03.064.
Gomes, T., Pinheiro, J.P., Cancio, I., Pereira, C.G., Cardoso, C., Bebianno, M.J., 2011.Effects of copper nanoparticles exposure in the mussel Mytilus gallopro-vincialis. Environ. Sci. Technol. 45, 9356–9362. http://dx.doi.org/10.1021/es200955s.
Gomiero, A., Pampanin, D.M., Bjørnstad, A., Larsen, B.K., Provan, F., Lyng, E., An-dersen, O.K., 2006. An ecotoxicoproteomic approach (SELDI-TOF mass spec-trometry) to biomarker discovery in crab exposed to pollutants under labora-tory conditions. Aquat. Toxicol. 78. http://dx.doi.org/10.1016/j.aquatox.2006.02.013.
Guillard, R.R.L., 1975. Culture of phytoplankton for feeding marine invertebrates.Cult. Mar. Invertebr. Anim., 29–60. http://dx.doi.org/10.1007/978-1-4615-8714-9.
Guillard, R.R.L., Sieracki, M.S., 2005. Counting cells in cultures with the light mi-croscope. In: Anderson, R.A. (Ed.), Algal Culturing Techniques. Academic Press,Amsterdam, pp. 239–252.
Gygi, S.P., Rist, B., Gerber, S.A., Turecek, F., Gelb, M.H., Aebersold, R., 1999. Quanti-tative analysis of complex protein mixtures using isotope-coded affinity tags.Nat. Biotechnol. 17, 994–999. http://dx.doi.org/10.1038/13690.
Kim, B.Y.S., Rutka, J.T., Chan, W.C.W., 2010. Nanomedicine. N. Engl. J. Med. 363,2434–2443. http://dx.doi.org/10.1056/NEJMra0912273.
Książyk, M., Asztemborska, M., Stęborowski, R., Bystrzejewska-Piotrowska, G., 2015.Toxic effect of silver and platinum nanoparticles toward the freshwater Mi-croalga Pseudokirchneriella subcapitata. Bull. Environ. Contam. Toxicol. . http://dx.doi.org/10.1007/s00128-015-1505-9
Lam, P.K.S., Gray, J.S., 2003. The use of biomarkers in environmental monitoringprogrammes. Mar. Pollut. Bull. . http://dx.doi.org/10.1016/S0025-326X(02)
F. Scebba et al. / Ecotoxicology and Environmental Safety 123 (2016) 45–5252
00449-6Larsen, B.K., Bjørnstad, A., Sundt, R.C., Taban, I.C., Pampanin, D.M., Andersen, O.K.,
2006. Comparison of protein expression in plasma from nonylphenol and bi-sphenol A-exposed Atlantic cod (Gadus morhua) and turbot (Scophthalmusmaximus) by use of SELDI-TOF. Aquat. Toxicol. 78. http://dx.doi.org/10.1016/j.aquatox.2006.02.026.
Lee, S.E., Young-Woong, C., Mo, H.H., Son, J., Park, K., Cho, K., 2013. Endosulfan-induced biomarkers in Japanese rice fish (Oryzias latipes) analyzed by SELDI-TOF-MS. Int. J. Biol. Sci. 9, 343–349. http://dx.doi.org/10.7150/ijbs.5501.
Lee, W.-M., An, Y.-J., Yoon, H., Kweon, H.-S., 2008. Toxicity and bioavailability ofcopper nanoparticles to the terrestrial plants mung bean (Phaseolus radiatus)and wheat (Triticum Aestivum): plant agar test for water-insoluble nano-particles. Environ. Toxicol. Chem. 27, 1915. http://dx.doi.org/10.1897/07-481.1.
Lees, E.E., Nguyen, T.L., Clayton, A.H.A., Mulvaney, P., 2009. The Preparation ofcolloidally stable, water-soluble, biocompatible, semiconductor nanocrystalswith a small hydrodynamic diameter. ACS Nano 3, 1121–1128. http://dx.doi.org/10.1021/nn900144n.
Mackevica, A., Skjolding, L.M., Gergs, A., Palmqvist, A., Baun, A., 2015. Chronictoxicity of silver nanoparticles to Daphnia magna under different feedingconditions. Aquat. Toxicol. 161C, 10–16. http://dx.doi.org/10.1016/j.aquatox.2015.01.023.
Matranga, V., Corsi, I., 2012. Toxic effects of engineered nanoparticles in the marineenvironment: Model organisms and molecular approaches. Mar. Environ. Res.76, 32–40. http://dx.doi.org/10.1016/j.marenvres.2012.01.006.
Mo, H., Lee, S.-E., Son, J., Hwang, J.M., Bae, Y.J., Cho, K., 2013. Exposure of mayflyEphemera orientalis (Ephemeroptera) eggs to heavy metals and discovery ofbiomarkers. Environ. Toxicol. Pharmacol. 36, 1167–1175. http://dx.doi.org/10.1016/j.etap.2013.10.004.
Monsinjon, T., Andersen, O.K., Leboulenger, F., Knigge, T., 2006. Data processing andclassification analysis of proteomic changes: a case study of oil pollution in themussel, Mytilus edulis. Proteome Sci. 4, 17. http://dx.doi.org/10.1186/1477-5956-4-17.
Moon, Y.-S., Park, E.-S., Kim, T.-O., Lee, H.-S., Lee, S.-E., 2014. SELDI-TOF MS-baseddiscovery of a biomarker in Cucumis sativus seeds exposed to CuO nano-particles. Environ. Toxicol. Pharmacol. 38, 922–931. http://dx.doi.org/10.1016/j.etap.2014.10.002.
Morelli, E., Cioni, P., Posarelli, M., Gabellieri, E., 2012. Chemical stability of CdSequantum dots in seawater and their effects on a marine microalga. Aquat.Toxicol. 122-123, 153–162. http://dx.doi.org/10.1016/j.aquatox.2012.06.012.
Morelli, E., Salvadori, E., Basso, B., Tognotti, D., Cioni, P., Gabellieri, E., 2015. Theresponse of Phaeodactylum tricornutum to quantum dot exposure: acclimationand changes in protein expression. Mar. Environ. Res. . http://dx.doi.org/
10.1016/j.marenvres.2015.06.018Morelli, E., Salvadori, E., Bizzarri, R., Cioni, P., Gabellieri, E., 2013. Interaction of
CdSe/ZnS quantum dots with the marine diatom Phaeodactylum tricornutumand the green alga Dunaliella tertiolecta: a biophysical approach. Biophys.Chem. 182, 4–10. http://dx.doi.org/10.1016/j.bpc.2013.06.007.
Mukherjee, A., Peralta-Videa, J.R., Bandyopadhyay, S., Rico, C.M., Zhao, L., Gardea-Torresdey, J.L., 2014. Physiological effects of nanoparticulate ZnO in green peas(Pisum sativum L.) cultivated in soil. Metallomics 6, 132–138. http://dx.doi.org/10.1039/c3mt00064h.
Park, D.-S., Jeon, H.-J., Park, E.-S., Bae, I.K., Kim, Y.-E., Lee, S.-E., 2015. Highly selectivebiomarkers for pesticides developed in Eisenia fetida using SELDI-TOF MS.Environ. Toxicol. Pharmacol. 39, 635–642. http://dx.doi.org/10.1016/j.etap.2014.12.020.
Peng, L., He, M., Chen, B., Wu, Q., Zhang, Z., Pang, D., Zhu, Y., Hu, B., 2013. Cellularuptake, elimination and toxicity of CdSe/ZnS quantum dots in HepG2 cells.Biomaterials 34, 9545–9558. http://dx.doi.org/10.1016/j.biomaterials.2013.08.038.
Poon, T.C.W., 2007. Opportunities and limitations of SELDI-TOF-MS in biomedicalresearch: practical advices. Expert Rev. Proteomics 4, 51–65. http://dx.doi.org/10.1586/14789450.4.1.51.
Rico, C.M., Barrios, A.C., Tan, W., Rubenecia, R., Lee, S.C., Varela-Ramirez, A., Peralta-Videa, J.R., Gardea-Torresdey, J.L., 2015. Physiological and biochemical responseof soil-grown barley (Hordeum vulgare L.) to cerium oxide nanoparticles. En-viron. Sci. Pollut. Res. Int. . http://dx.doi.org/10.1007/s11356-015-4243-y
Smyder, J.A., Krauss, T.D., 2011. Coming attractions for semiconductor quantumdots. Mater. Today 14, 382–387. http://dx.doi.org/10.1016/S1369-7021(11)70182-1.
Tang, N., Tornatore, P., Weinberger, S.R., 2004. Current developments in SELDI af-finity technology. Mass Spectrom. Rev. . http://dx.doi.org/10.1002/mas.10066
Tang, S., Wu, Y., Ryan, C.N., Yu, S., Qin, G., Edwards, D.S., Mayer, G.D., 2014. Distinctexpression profiles of stress defense and DNA repair genes in Daphnia pulexexposed to cadmium, zinc, and quantum dots. Chemosphere 120C, 92–99. http://dx.doi.org/10.1016/j.chemosphere.2014.06.011.
Tang, Y., Han, S., Liu, H., Chen, X., Huang, L., Li, X., Zhang, J., 2013. The role of surfacechemistry in determining in vivo biodistribution and toxicity of CdSe/ZnS core-shell quantum dots. Biomaterials 34, 8741–8755. http://dx.doi.org/10.1016/j.biomaterials.2013.07.087.
Zhang, S., Jiang, Y., Chen, C.S., Creeley, D., Schwehr, K.A., Quigg, A., Chin, W.C.,Santschi, P.H., 2013. Ameliorating effects of extracellular polymeric substancesexcreted by Thalassiosira pseudonana on algal toxicity of CdSe quantum dots.Aquat. Toxicol. 126, 214–223. http://dx.doi.org/10.1016/j.aquatox.2012.11.012.