Embed Size (px)
Citation preview

ECOTOXICOLOGICAL ASSESSMENT
OF USING COKE IN AQUATIC
RECLAMATION STRATEGIES AT
THE ALBERTA OIL SANDS
A thesis submitted to the College of
Graduate Studies and Research
in partial fulfillment of the requirements
for the Degree of Masters of Science
in the Toxicology Graduate Program
University of Saskatchewan
Saskatoon, Saskatchewan
Canada
Allison Jane Squires
©Copyright Allison Jane Squires. November, 2005. All rights reserved.

i
PERMISSION TO USE
In presenting this thesis in partial fulfillment of the requirements for a Master of
Science degree from the University of Saskatchewan, I agree that the Libraries of this
University may make it freely available for inspection. I further agree that permission
for copying of this thesis in any manner, in whole or in part, for scholarly purposes may
be granted by the professors who supervised my thesis work, in their absence, by the
Graduate Chair of the program or Dean of the College in which my thesis work was
done. It is understood that any copying or publication or use of this thesis or parts
thereof for financial gain shall not be allowed without my written permission. It is also
understood the due recognition shall be given to me and to the University of
Saskatchewan in any scholarly use which may be made of any material in my thesis.
Requests for permission to copy or to make other use of material in this thesis in whole
or in part should be addressed to:
Chair of the Toxicology Graduate Program
Toxicology Centre
University of Saskatchewan
44 Campus Drive
Saskatoon, SK, Canada S7N 5B3

ii
ABSTRACT
Oil sands, also known as tar sands or bituminous sands, are sand deposits
impregnated with dense, viscous petroleum called bitumen. The two major oil sand
mining companies currently producing synthetic crude oil in the province of Alberta are
Syncrude Canada Ltd. and Suncor Energy Inc. Coke is a waste product formed during
the heavy oil upgrading processes. The amount of coke produced currently at the
Syncrude and Suncor operations is significantly more than what can be combusted
and/or sold. Therefore, it must be stored on site making coke a necessary component of
future reclamation landscapes. It is as yet unclear whether or not coke poses a
significant toxicological risk (i.e. through leaching of constituent chemicals and
elements) to the aquatic or terrestrial environments if used in a long-term reclamation
capacity. The primary objective of this research was to evaluate whether stockpiled
Syncrude Canada Ltd. and Suncor Energy Inc. coke can safely and effectively be used
as a substrate amendment in an aquatic reclamation option.
Syncrude and Suncor coke were exposed to three different sets of water quality
conditions: high and low dissolved oxygen, pH (5, 7.5 and 10) and freeze-thaw cycles.
These conditions have the potential to affect the leaching of constituents from coke
once placed in an aquatic environment in northern Alberta. Metals were observed to
leach from both coke types under all treatments. Some of these metals (cobalt, copper,
manganese, molybdenum, nickel, vanadium and zinc) reached levels of toxicological
interest by exceeding published LC50 values for the aquatic macroinvertebrate
Chironomus sp. and/or established Canadian Water Quality Guidelines for the
protection of aquatic life.
To determine the source of metals observed to leach in the leaching
experiments, an accelerated weathering experiment was conducted. Coke from both
Syncrude and Suncor were pre-treated by rinsing with water to remove any natural soil
or sediment particles that become associated with the coke during storage, and with
peroxide to remove any metals bound to the surface of the coke. It was concluded that
the metals leaching into the overlying water and pore water of the coke were from either
the natural soil/sediment particles, and/or were weakly bound to the surface of the coke.
Rinsing coke with water before adding it as a substrate amendment in an aquatic

iii
reclamation strategy may decrease its potential toxicity to aquatic organisms by
removing the soil/sediment debris and metals loosely bound to the surface of the coke,
reducing initial amounts of metals available to the organisms in the pore and overlying
waters.
As part of these leaching experiments, coke from both Syncrude and Suncor
were further characterized with elemental analysis and qualitative analysis with
polarized light microscopy and scanning electron microscopy. These analyses showed
distinct differences in the physical properties (i.e. particle size and structure) of
Syncrude and Suncor coke. However there appeared to be little variation in the
elemental and structural composition among the different weathering treatments within
each coke type.
Following leaching, coke from Syncrude and Suncor was used as a substrate in
10-d toxicity tests with Chironomus tentans. These experiments evaluated whether the
leachate generated from coke, or the coke itself, caused of an adverse effect on the
survival and/or growth of this aquatic invertebrate. Decreased survival and growth of
C. tentans was observed when Suncor coke was used as a substrate. However, further
experimentation showed that these effects were due to the physical properties of Suncor
coke, rather than any constituents that leached from the coke.
In a separate experiment, combinations of fresh oil sands waste materials were
added to experimental enclosures constructed at Syncrude Canada Ltd in May 2002.
Core samples of these waste materials were collected after aging in situ for periods of 2
and 14 months. The aged samples along with fresh (0 month) samples, were used as
substrate material in 10-d toxicity tests with C. tentans to assess the potential toxicity of
both fresh and field-aged combinations of waste materials. These experiments found
that there is a potential for greater initial stress or toxicity to aquatic organisms when
the substrates are freshly added to the reclaimed wetlands. However, this initial
potential toxicity of oil sands waste materials can decrease with aging in an aquatic
environment.

iv
ACKNOWLEDGEMENTS
I would like to thank my supervisor, Dr. Karsten Liber, for his guidance during
the course of this research. I would also like to thank the members of my advisory
committee, Drs. B. Blakley and S. Siciliano, and my external examiner, Dr. B.R. Neal
for their time and advice. I would like to acknowledge my funding sources, NSERC,
Syncrude Canada Ltd. and Canadian Natural Resources Ltd. I am grateful for the
support and encouragement I received from the students, staff and faculty of the
Toxicology Graduate Program, and the College of Graduate Studies and Research at the
University of Saskatchewan.
I would like to acknowledge the assistance received from Syncrude Canada Ltd.
at both the mine site and the Edmonton Research Centre in Edmonton, AB. Specifically
the assistance of Dr. Mike MacKinnon, Peter Abel and Darren Burgardt during the
polarized light and scanning electron microscopy work conducted as part of this thesis.
I am indebted to Dr. Jan Ciborowski and his dedicated group of students and staff at the
University of Windsor for their support during field seasons at the Syncrude mine site.
I could not have conducted this research without the support of my friends and
fellow graduate students. In particular, I would like to thank Sarah S. for her assistance
in the laboratory, my office mate Lorne for all of his advice and Jorgelina, who would
never fail to put things into “perspective” for me. I would like to especially thank my
Saskatchewan Family; Cody Straza, Sarah Armstrong, Sandra Kuchta, Carrie Rickwood
and Andrew Belknap. Without you I would not have made it out intact, thank you all so
much.

v
DEDICATION
To my family: Jim, Gail, Victoria and Kimberly.
Thank you for being the home base from which I draw my motivation.

vi
TABLE OF CONTENTS
PERMISSION TO USE i
ABSTRACT ii
ACKNOWLEDGEMENTS iv
DEDICATION v
TABLE OF CONTENTS vi
LIST OF TABLES xi
LIST OF FIGURES xiii
LIST OF ABBREVIATIONS xviii
CHAPTER 1. INTRODUCTION
1.1 The Oil Sands 1
1.1.1 Industry History 2
1.1.2 Mining 3
1.1.3 Extraction 3
1.1.4 Upgrading 4
1.1.5 Waste Products 4
1.2 History of Coke Production 6
1.3 Coke production at the Athabasca Oil Sands 7
1.3.1 Methods of Coke Production 7
1.3.2 Current Disposal Methods for Coke 9
1.3.3 Physical and Chemical Properties of Coke 10
1.3.4 Coke Toxicity and Leachability 11
1.4 Reclamation Strategies at the Alberta Oil Sands 13
1.4.1 Coke in an Aquatic Reclamation Program 14
1.5 Chironomus tentans as a Test Organism 16
CHAPTER 2. RESEARCH GOAL AND OBJECTIVES
2.1. Goal 18
2.2. Objectives 18

vii
CHAPTER 3. THE EFEECTS OF DISSOLVED OXYGEN, pH, AND FREEZE-
THAW CYCLES ON THE POTENTIAL LONG-TERM TOXICITY OF OIL
SANDS COKE AND THEIR LEACHATES TO CHIRONOMUS TENTANS
3.1 Introduction 19
3.2 Materials and Methods 21
3.2.1 Study Design 21
3.2.1.1 Dissolved Oxygen 22
3.2.1.2 pH 22
3.2.1.3 Freeze-thaw 23
3.2.2 Sampling and Analysis 23
3.2.2.1 Water 23
3.2.2.2 Coke 24
3.2.3 Toxicity Tests 25
3.2.4 Data Analysis 27
3.3 Results 28
3.3.1 Chemical Endpoints 28
3.3.1.1 Water 28
3.3.1.1.1 Dissolved Oxygen 32
3.3.1.1.2 pH 36
3.3.1.1.3 Freeze-thaw 40
3.3.1.2 Coke 44
3.3.2 Biological Endpoints 47
3.3.2.1 Dissolved Oxygen 47
3.3.2.2 pH 47
3.3.2.3 Freeze-thaw 51
viii
3.4 Discussion 53
3.4.1 Metal Chemistry 53
3.4.1.1 Water 53
3.4.1.2 Coke Elemental Chemistry 56
3.4.2 Toxicity of Coke and its Leachates 56
3.5 Conclusions 59
CHAPTER 4. USE OF MICROSCOPY TECHNIQUES TO EVALUATE
PHYSICAL DIFFERENCES IN WEATHERED VERSUS NON-WEATHERED
COKE
4.1 Introduction 62
4.1.1 What is Polarized Light Microscopy? 63
4.1.2 What is Scanning Electron Microscopy? 64
4.2 Materials and Methods 65
4.2.1 Sample Selection 65
4.2.2 Polarized Light Microscopy Analysis 67
4.2.2.1 Procedure for the preparation 67 of coke samples in epoxy
4.2.2.2 Procedure for the polishing of 68 coke samples
4.2.2.3 Procedure for microscopic 68 analysis of coke samples
4.2.3 Scanning Electron Microscopy Analysis 70
4.3 Results 71
4.4 Discussion 75
4.5 Conclusions 77

ix
CHAPTER 5. THE EFFECTS OF ACCELERATED WEATHERING ON THE
LEACHING OF METALS FROM COKE AND THE INFLUENCE OF COKE
PARTICLE SIZE ON THE SURVIVAL AND GROWTH OF CHIRONOMUS
TENTANS
5.1 Introduction 79
5.2 Materials and Methods 81
5.2.1 Accelerated Weathering Experiment 81
5.2.1.1 Study Design 81
5.2.1.2 Experimental Methods and Sampling 82
5.2.2 Particle Size Experiment 82
5.2.3 Data Analysis 83
5.3 Results 84
5.3.1 Accelerated Weathering Experiment 84
5.3.1.1 Water Chemistry 84
5.3.1.2 Coke Chemistry 90
5.3.1.2.1 Elemental Analysis of coke 90
5.3.1.2.2 Polarized Light and SEM Analysis 91
5.3.2 Particle Size Experiment 94
5.4 Discussion 96
5.4.1 Accelerated Weathering Experiment 96
5.4.2 Particle Size Experiment 100
5.5 Conclusions 101
CHAPTER 6. TOXICITY ASSESSMENT OF FIELD-SAMPLED AND
LABORATORY-PREPARED SUBSTRATES COMPRISED OF VARIOUS
COMBINATIONS OF OIL SANDS RECLAMATION MATERIALS
6.1 Introduction 102
6.2 Materials and Methods 104
6.2.1 Field Samples 105
6.2.2 Laboratory Prepared Samples 107

x
6.2.3 Test Conditions 107
6.2.4 Statistics 108
6.3 Results 109
6.3.1 Substrate Amendment Pit Units 109
6.3.2 Tote Units 113
6.4 Discussion 115
6.4.1 Substrate Amendment Pit Units 115
6.4.2 Tote Units 117
6.5 Conclusions 118
CHAPTER 7. GENERAL DISSCUSSION
7.1 Project Rationale 121
7.2 Leaching Experiments 122
7.2.1 Leachability of Coke 122
7.2.2 Accelerated Weathering Experiment 124
7.3 Toxicity of Coke in an Aquatic Environment 125
7.3.1 Toxicity of Coke and its Leachate to C. tentans 125
7.3.2 Influence of Particle Size on the Toxicity 126 of Coke to C. tentans
7.4 Field Experiments 126
7.5 Toxicology of Metals of Concern 127
7.6 Integration of Results 129
7.7 Recommendations for Future Work 130
REFERENCES 133
APPENDIX A 143
APPENDIX B 150
APPENDIX C 165
APPENDIX D 174
xi
LIST OF TABLES
Table 1.1. Physical and chemical characteristics of Syncrude Canada Ltd. and Suncor Energy Inc. cokes. Adapted from Komex International Ltd. (1998) and Scott and Fedorak (2004).
Table 3.1. Characteristics (means ± SE) of reconstituted water used in
laboratory leaching experiments, and surface water sampled from the Deep Wetland field site located at Syncrude Canada Ltd.
Table 3.2. Origin of Syncrude Canada Ltd. and Suncor Energy Inc. coke
samples chosen for elemental analysis.
Table 3.3. Mean levels of polycyclic aromatic hydrocarbons (PAHs) in filtered
overlying waters obtained during a dissolved oxygen leaching experiment using coke from Syncrude Canada Ltd. and Suncor Energy Inc. (µg/L).
Table 3.4. Peak concentrations (µg/L) of several metals that reached levels of
concern in the overlying water (leachate) and coke pore water during the dissolved oxygen leaching experiment: (a) Syncrude coke, (b) Suncor coke.
Table 3.5. Peak concentrations (µg/L) of several metals that reached levels of concern in the overlying water (leachate) and coke pore water during the pH leaching experiment: (a) Syncrude coke, (b) Suncor coke.
Table 3.6. Peak concentrations (µg/L) of several metals that reached levels of
concern in the overlying water (leachate) and coke pore water during the freeze-thaw leaching experiment: (a) Syncrude coke, (b) Suncor coke.
Table 3.7. Peak concentrations of selected metals in untreated and weathered
Syncrude (a) and Suncor (b) coke that also reached levels of concern in overlying water and pore water during the dissolved oxygen (low and high oxygen levels) and pH (5, 7.5 and 10) experiments (µg/g).
Table 3.8. Percentages of selected metals in Syncrude (a) and Suncor (b) coke
that leached into the overlying water and pore water during the dissolved oxygen (low and high oxygen levels) and pH (5, 7.5 and 10) experiments.
12
22
25
31
33
37
41
45
46

xii
Table 4.1. Origin of chosen Syncrude Canada Ltd. and Suncor Energy Inc. coke samples analyzed under polarized light and scanning electron microscopy techniques.
Table 4.2. Sample-polishing sequence used to prepare coke samples for analysis
using polarized light microscopy. Table 4.3. Observations of Syncrude Canada Ltd. and Suncor Energy Inc. coke
samples analyzed by polarized light and scanning electron microscopy techniques.
Table 5.1. Highest peak concentrations (µg/L) pooled over three time points of several metals that reached levels of concern in the overlying water (leachate) and coke pore water during the accelerated weathering leaching experiment: (a) Syncrude coke, (b) Suncor coke.
Table 5.2. Mean concentrations ± standard errors (µg/L) of selected metals in the rinse solutions of the water rinsed and peroxide treated Syncrude and Suncor coke.
Table 5.3. Measured concentrations (µg/g) (a) of metals in weathered Syncrude and Suncor coke after pre-treatment with either a water rinse or a peroxide rinse (n = 1) and calculated mass balance percentages (b) using peak concentrations of metals in both overlying water and pore water and their respective measured concentration in coke.
Table 6.1. Treatment combinations sampled from substrate amendment pits located in Deep Wetland at the Syncrude Canada Ltd. mine site.
Table 6.2. Treatment combinations sampled from plastic totes located in Deep
Wetland at the Syncrude Canada Ltd. mine site. Table 6.3. Visual observations made on substrate combinations sampled from
the substrate amendment pits after aging for 2 and 14 months in Deep Wetland, Syncrude Canada Ltd.
66
69
72
86
89
90
106
106
112
xiii
LIST OF FIGURES
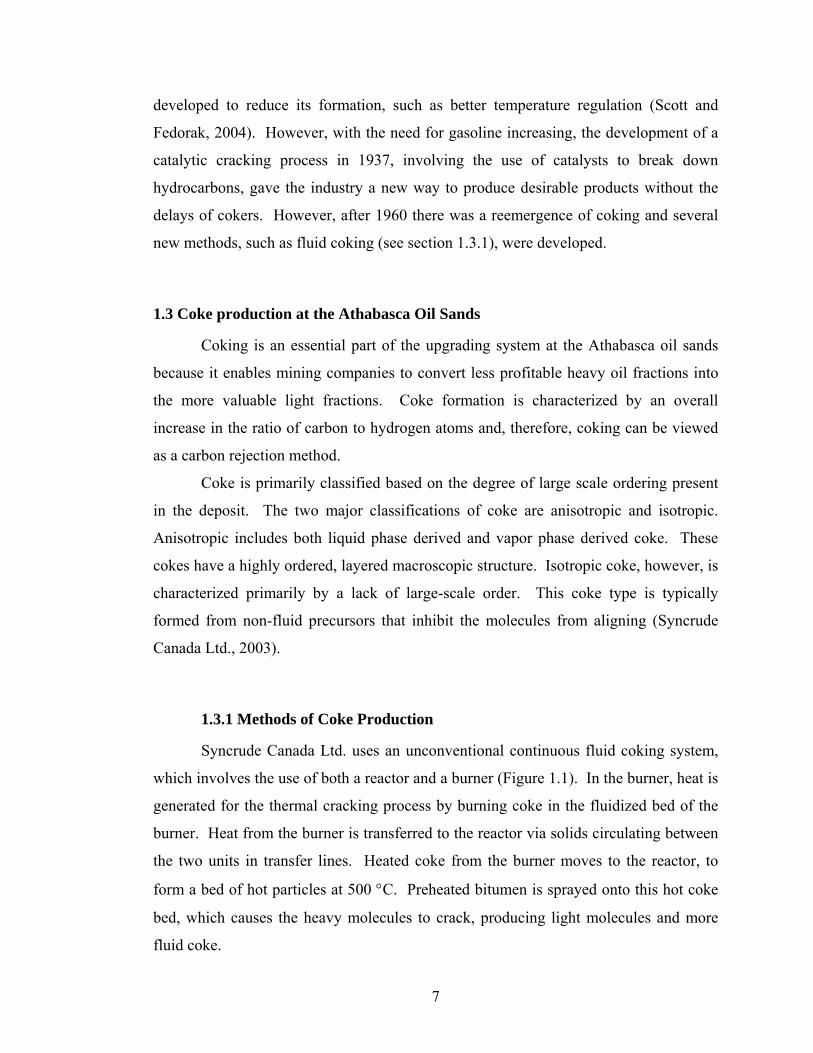
Figure 1.1. A simplified diagram of a fluidized coke system. Adapted from Mankowski (1989) and Syncrude Canada Ltd. (2003).
Figure 1.2. A Simplified diagram of a delayed coker system. Adapted from
Scott and Fedorak (2004). Figure 1.3. Possible layering of oil sand waste materials in a wetland
reclamation strategy on mined oil sand leases (Adapted from Golder Associates Ltd., 2000 and MacKinnon, 2002).
Figure 3.1: Metal concentrations from Syncrude (Syn) coke versus critical
metal concentrations for selected metals analyzed during the dissolved oxygen, pH and freeze-thaw leaching experiments. Metals were not included if they were below the detection limit, or if no critical level could be identified (Ag, Li, Mg, P, Ca, Ti, Ga, Rb, Sr, Y, Zr, Nb, Sn, Sb, Cs, Ba, La, Ce, Pr, Nd, Sm, Eu, Gd, Dy, Ho, Er, Tm, Yb, Lu, Hf, Ta, W, Hg, Tl, Th, V). All critical concentrations are from the Canadian Water Quality Guidelines (CCME, 2003), except for Co (Marr et al., 1998) and U (Muscatello, 2004).
Figure 3.2: Metal concentrations from Suncor (Sun) coke versus critical metal
concentrations for selected metals analyzed during the dissolved oxygen, pH and freeze-thaw leaching experiments. Metals were not included if they were below the detection limit, or if no critical level could be identified (Ag, Li, Mg, P, Ca, Ti, Ga, Rb, Sr, Y, Zr, Nb, Sn, Sb, Cs, Ba, La, Ce, Pr, Nd, Sm, Eu, Gd, Dy, Ho, Er, Tm, Yb, Lu, Hf, Ta, W, Hg, Tl, Th, V). All critical concentrations are from the Canadian Water Quality Guidelines (CCME, 2003), except for Co (Marr et al., 1998) and U (Muscatello, 2004).
Figure 3.3. Log mean values ± standard error for selected metals of concern in
overlying water and pore water for Syncrude coke during a 30-day dissolved oxygen leaching experiment. (* denotes significant differences between overlying water and pore water, ** denotes significant differences between high and low dissolved oxygen levels).
Figure 3.4. Log mean values ± standard error for selected metals of concern in
overlying water and pore water for Suncor coke during a 30-day dissolved oxygen leaching experiment. (* denotes significant differences between overlying water and pore water, ** denotes significant differences between high and low dissolved oxygen levels).
8
9
14
29
30
34
35

xiv
Figure 3.5. Log mean values ± standard error for selected metals of concern in
overlying water and pore water for Syncrude coke during a 90-day pH leaching experiment. (* denotes significant differences between overlying water and pore water, a denotes significant differences between pH 5 and pH 10, b between pH 7.5 and pH 10 and c between pH 5 and pH 7.5 treatments).
Figure 3.6. Log mean values ± standard error for selected metals of concern in
overlying water and pore water for Suncor coke during a 90-day pH leaching experiment. (* denotes significant differences between overlying water and pore water, a denotes significant differences between pH 5 and pH 10, b between pH 7.5 and pH 10 and c between pH 5 and pH 7.5 treatments).
Figure 3.7. Log mean values ± standard error for selected metals of concern in
overlying water and pore water for Syncrude coke during a six-cycle freeze-thaw leaching experiment. (* denotes significant differences between overlying water and pore water, ** denotes significant differences between frozen and not frozen treatments).
Figure 3.8. Log mean values ± standard error for selected metals of concern in
overlying water and pore water for Suncor coke during a six-cycle freeze-thaw leaching experiment. (* denotes significant differences between overlying water and pore water, ** denotes significant differences between frozen and not frozen treatments).
Figure 3.9. Survival (a) and growth (b) of Chironomus tentans (mean ± SE)
larvae after a 10-day toxicity test with coke from Syncrude Canada Ltd. and Suncor Energy Inc. and their overlying leachate waters leached under high and low dissolved oxygen conditions for 30 days. (* denotes significant differences between each coke type and the control sand.
Figure 3.10. Survival (a) and growth (b) of Chironomus tentans larvae (mean ±
SE) after a 10-day toxicity test with coke from Syncrude Canada Ltd. and Suncor Energy Inc. and their overlying leachate waters leached under pH 5, 7.5 and 10 for 45 days. (* denotes significant differences between each coke type and the control sand, ** denotes significant differences among pH within each substrate treatment).
38
39
42
43
48
49

xv
Figure 3.11. Survival (a) and growth (b) of Chironomus tentans larvae (mean ±
SE) after a 10-day toxicity test with coke from Syncrude Canada Ltd. and Suncor Energy Inc. and their overlying leachate waters leached under pH 5, 7.5 and 10 for 90 days. (* denotes significant differences between each coke type and the control sand, ** denotes significant differences among pH within each substrate treatment).
Figure 3.12. Survival (a) and growth (b) of Chironomus tentans (mean ± SE)
after a 10-day toxicity test with coke from Syncrude Canada Ltd. and Suncor Energy Inc. and their overlying leachate waters leached for six consecutive freeze-thaw cycles. (* denotes significant differences between each coke type and the control sand, ** denotes significant differences between each treatment).
Figure 4.1. (a) Vacuum apparatus used for the preparation of coke samples in
epoxy. (b) Finished samples prepared for polarized light microscopy analysis.
Figure 4.2. A sample of unweathered Syncrude coke as seen under a polarized
light microscope, 50X, oil immersion. Figure 4.3. A sample of Syncrude coke weathered for 45 days at pH 7.5 as seen
under a polarized light microscope, 50X, oil immersion. Figure 4.4. A sample of unweathered Suncor coke as seen under a polarized
light microscope, 50X, oil immersion. Figure 4.5. A sample of Suncor coke weathered for 45 days at pH 7.5 as seen
under a polarized light microscope, 50X, oil immersion. Figure 4.6. An electron photomicrograph of a sample of unweathered Syncrude
coke. Figure 4.7. An electron photomicrograph of a sample of Syncrude coke
weathered for 45 days at pH 10. Figure 4.8. An electron photomicrograph of a sample of unweathered Suncor
coke. Figure 4.9. An electron photomicrograph of a sample of Syncrude coke
weathered for 30 days under low dissolved oxygen conditions.
50
52
67
73
73
73
73
74
74
74
74

xvi
Figure 5.1. Log mean concentrations ± standard errors of selected metals in overlying water and pore water for Syncrude coke during a 30-d accelerated weathering leaching experiment. (* denotes significant differences between overlying water and pore water. a denotes significant differences between water rinsed and peroxide treated coke, b between water rinsed and untreated coke and c between untreated and peroxide treated coke).
Figure 5.2. Log mean concentrations ± standard errors of selected metals in
overlying water and pore water for Suncor coke during a 30-d accelerated weathering leaching experiment. (* denotes significant differences between overlying water and pore water. a denotes significant differences between water rinsed and peroxide treated coke, b between water rinsed and untreated coke and c between untreated and peroxide treated coke).
Figure 5.3. A sample of water rinsed Syncrude coke, as seen under a polarized
light microscope, 50X, oil immersion. Figure 5.4. A sample of peroxide treated Syncrude coke, as seen under a
polarized light microscope, 50X, oil immersion. Figure 5.5. A sample of water rinsed Suncor coke, as seen under a polarized
light microscope, 50X, oil immersion. Figure 5.6. A sample of peroxide treated Suncor coke, as seen under a polarized
light microscope, 50X, oil immersion. Figure 5.7. An electron photomicrograph of a sample of Syncrude coke after
rinsing with water. Figure 5.8. An electron photomicrograph of a sample of Syncrude coke after
treatment with peroxide. Figure 5.9. An electron photomicrograph of a sample of Suncor coke after
rinsing with water. Figure 5.10. An electron photomicrograph of a sample of Suncor coke after
treatment with peroxide. Figure 5.11. Mean (± SE) survival (a) and growth, measured as dry weight, (b)
of Chironomus tentans larvae after a 10-d bioassay using different particle sized coke samples. *** denotes a significant difference from Syncrude coke, ** denotes a significant difference from Suncor coke, * denotes a significant difference from control sand. 90
87
88
92
92
92
92
93
93
93
93
95

xvii
Figure 6.1. Substrate amendment pit (a) and plastic tote (b) units as constructed
in Deep Wetland on the Syncrude Canada Ltd. mine site.
Figure 6.2. Mean (± SE) survival (a) and growth, measured as dry weight, (b) of Chironomus tentans larvae after a 10-d bioassay using sediment cores taken from substrate amendment pit units constructed at the Deep Wetland field site at Syncrude Canada Ltd. * Denotes a statistical difference from the native sediment treatment, # denotes a statistical difference from the Suncor coke treatment, and ** denotes a significant difference from the corresponding 0 months aged treatment. Open bars indicate cores constructed using fresh substrates in the laboratory (0 months), and hatched and solid bars indicate cores taken after aging for 2 and 14 months, respectively, at the Deep Wetland field site. (Native denotes the sediment pre-existing at the Deep Wetland field site, sand denotes the tailings sand produced during the bitumen extraction process, Syn denotes Syncrude coke, and Sun denotes Suncor coke).
Figure 6.3. Mean (± SE) survival (a) and growth, measured as dry weight, (b) of
Chironomus tentans larvae after a 10-d bioassay using sediment cores taken from tote units constructed at the Deep Wetland field site at Syncrude Canada Ltd. (solid bars) and sediment cores constructed using fresh substrates in the laboratory (open bars). (Syn denotes Syncrude coke, Sun denotes Suncor coke, MFT denotes mature fine tailings, and CT denotes composite/consolidated tailings).
105
111
114

xviii
LIST OF ABBREVIATIONS α = alpha
λ = lambda
> = greater than
< = less than
≥ = greater than or equal to
µg/g = micrograms per gram
µg/L = micrograms per litre
µg/mL = micrograms per millilitre
µm = micrometre
AEUB = Alberta Energy and Utilities Board
ANOVA = analysis of variance
BDL = below detection limit
BOD = biochemical oxygen demand
ºC = centigrade
CaCO3 = calcium carbonate
C/H = carbon per hydrogen
cm = centimetre
cm/s = centimetres per second
Co = cobalt
CT = composite or consolidated tailings
Cu = copper
CWQG = Canadian Water Quality Guideline
d = day
DO = dissolved oxygen
DOC = dissolved organic carbon
DOM = dissolved organic matter
g/cm3 = grams per cubic centimetre
GC-MS = Gas Chromatography-Mass Spectrometry
h = hour
H+ = hydrogen ion

xix
H2O2 = hydrogen peroxide
H2SO4 = sulphuric acid
ICP-ES = Inductively Coupled Plasma-Emission Spectroscopy
ICP-MS = Inductive Coupled Plasma-Mass Spectrometry
kg = kilogram
L = litre
LC50 = median lethal concentration
M = molar
m2/g = square metres per gram
m3 = cubic metre
MFT = mature fine tailings
mg = milligram
mg/L = milligrams per litre
mg/m3 = milligram per cubic metre
min = minute
mL = millilitre
mm = millimetre
Mn = manganese
Mo = molybdenum
mPas = millipascal second
mV = millivolt
n = number of samples
NaOH = sodium hydroxide
Ni = nickel
nm = nanometre
PAH = Polycyclic aromatic hydrocarbon
Pas = pascal second
psi = pounds per square inch
rpm = revolutions per minute
SE = standard error
sec = seconds

xx
SEM = Scanning Electron Microscopy
Syn or Syncrude = Syncrude Canada Ltd.
Sun or Suncor = Suncor Energy Inc.
V = vanadium
VO2+ = vanadium IV
VO43- = vanadium V
w/w = by weight of the total substance, solution or mixture
Zn = zinc

1
CHAPTER 1. INTRODUCTION
1.1 The Oil Sands
Oil sands, also known as tar sands or bituminous sands, are sand deposits
impregnated with dense, viscous petroleum called bitumen. They are found throughout
the world, often in the same geographical areas as conventional petroleum. The largest
oil sand deposits are in Canada and Venezuela. Oil sand deposits in northwestern China
(Zinjiang Autonomous Region) are also large and at some locations around Karamay,
the bitumen appears directly on the land surface (Speight, 1999). Smaller oil sand
deposits occur in the United States (mainly in Utah), Peru, Trinidad, Madagascar, the
former Soviet Union, the Balkan States, and the Philippines (Speight, 1999).
In Canada, one of the major industries in the province of Alberta is the oil sand
industry. There are four major deposits of oil sands in this province; the Athabasca,
Peace River, Cold Lake, and Wabasca. The largest of these, and the only one currently
amenable to surface mining, is the Athabasca deposit, which covers a total area of
approximately 31,000 km2 (Barton and Wallace, 1979). The Alberta Energy and
Utilities Board (AEUB) estimates that Alberta’s oil sands contain between 1.7 trillion
and 2.5 trillion barrels of bitumen, although most of this is not accessible using current
mining technique (Scott and Fedorak, 2004).
The predominant theory for the origin of these oil sands is that they evolved in
highly organic Cretaceous shales in the southern portion of the Alberta Sedimentary
Basin. Underground pressure forced the oil to soak into the existing silt grade
sediments and localized sand bodies of the McMurray formation. Consequently, there
are wide variations in the viscosity and saturation of the bitumen (0-18 % (w/w)
bitumen), even within a particular deposit of oil sands (Speight, 1999).

2
The two major oil sand mining companies currently producing synthetic crude
oil on this site are Syncrude Canada Ltd. and Suncor Energy Inc. These two companies
produced a combined total of over 150 million barrels of crude oil in 2002, and both are
projecting major increases in their annual production during the next decade. Some
estimates suggest that at least 300 billion barrels of bitumen can be recovered using
current methods (Scott and Fedorak, 2004). Bitumen from the Athabasca region
currently accounts for over 20% of Canada’s petroleum, with projections approaching
50% in a few years (Leung et al., 2001).
1.1.1 Industry History
Early explorers had observed oil sands bitumen and speculated that the surface
seeps arose from underground pools. The Canadian government took the first scientific
interest in tar sands in 1890, however, it was still unknown at this time how best to
exploit this resource profitably. In 1916, Sidney C. Ells started the industry of using
unrefined oil sands bitumen in road paving around the province of Alberta, but this had
to be abandoned when it could not compete with traditional asphalt sources.
It is much more expensive to produce a synthetic crude oil from oil sands than it
is from conventional oil reserves. This is because oil sands projects require long lead
times from initial planning to inception, and then longer still until a profit is made (de
Malherbe et al., 1983). Therefore, with the domestic availability of conventional
sources there has been no incentive to develop the oil sands until very recently.
The most important progression in the oil sands industry occurred in the 1920s
when Dr. Carl Clark developed a hot water extraction method that effectively separated
the oil from the sand (Scott and Fedorak, 2004). From this discovery up until 1960,
many small-scale commercial enterprises were attempted but not sustained. Between
1957 and 1967, three extensive pilot-plant operations were conducted in the Athabasca
region. Syncrude took over operation of the Cities Service Athabasca Inc. project in
1965, and Suncor formed from the amalgamation of Sun Company Inc. (Canada) and
Great Canadian Oil Sands Ltd. in 1979 (Scott and Fedorak, 2004). In order to
accomplish these ventures, the concentration of the resource (measured as percent
3
bitumen saturation) and its accessibility (measured as overburden thickness) had to be
considered (Speight, 1999).
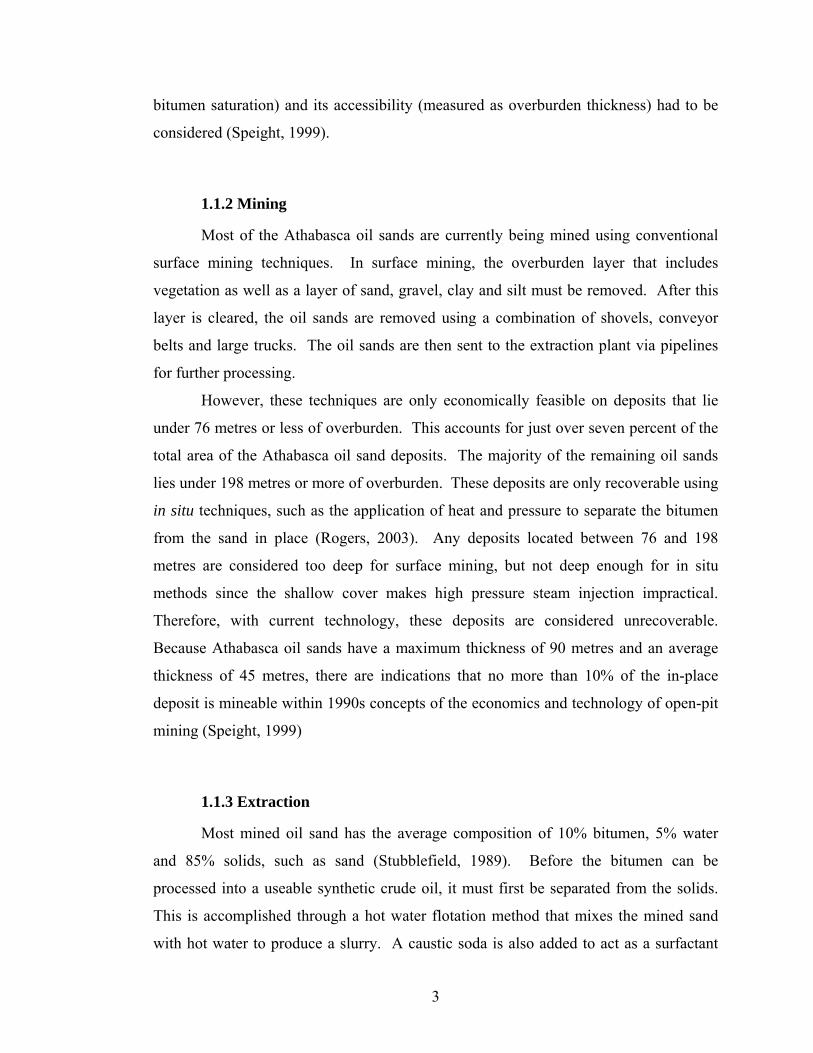
1.1.2 Mining
Most of the Athabasca oil sands are currently being mined using conventional
surface mining techniques. In surface mining, the overburden layer that includes
vegetation as well as a layer of sand, gravel, clay and silt must be removed. After this
layer is cleared, the oil sands are removed using a combination of shovels, conveyor
belts and large trucks. The oil sands are then sent to the extraction plant via pipelines
for further processing.
However, these techniques are only economically feasible on deposits that lie
under 76 metres or less of overburden. This accounts for just over seven percent of the
total area of the Athabasca oil sand deposits. The majority of the remaining oil sands
lies under 198 metres or more of overburden. These deposits are only recoverable using
in situ techniques, such as the application of heat and pressure to separate the bitumen
from the sand in place (Rogers, 2003). Any deposits located between 76 and 198
metres are considered too deep for surface mining, but not deep enough for in situ
methods since the shallow cover makes high pressure steam injection impractical.
Therefore, with current technology, these deposits are considered unrecoverable.
Because Athabasca oil sands have a maximum thickness of 90 metres and an average
thickness of 45 metres, there are indications that no more than 10% of the in-place
deposit is mineable within 1990s concepts of the economics and technology of open-pit
mining (Speight, 1999)
1.1.3 Extraction
Most mined oil sand has the average composition of 10% bitumen, 5% water
and 85% solids, such as sand (Stubblefield, 1989). Before the bitumen can be
processed into a useable synthetic crude oil, it must first be separated from the solids.
This is accomplished through a hot water flotation method that mixes the mined sand
with hot water to produce a slurry. A caustic soda is also added to act as a surfactant

4
(Rogers, 2003). This slurry is transported onto vibrating screens where large materials
such as rocks and lumps of clay are rejected (Syncrude Facts, 1997). From there, the oil
sand slurry is transported to primary separation vessels where the sand settles to the
bottom and the bitumen floats to the surface as froth. Hot water extraction of bitumen
from the oil sands is approximately 90% efficient (Madill et al., 2001). Syncrude-
produced bitumen is a very heavy oil. It has a density of 1.01 X 10³ kg/m3 and a
viscosity of at least 105 mPas at 15.6 °C. It contains ca. 5 % (w/w) sulfur and ca. 0.45
% (w/w) nitrogen, as well as smaller amounts of the metals nickel, vanadium and iron
(Stubblefield, 1989).
1.1.4 Upgrading
After bitumen is extracted from the sand, it is upgraded, converting it from
viscous, tar-like oil to a more useable, light oil product. The general principal behind
this process is to decrease the carbon to hydrogen ratio of the oil. As the C/H ratio is
decreased, more energy is “packed” into the synthesized product and the product
becomes “lighter”, lowering the boiling point of the synthesized fuel (Singh, 1985).
Processing of bitumen yields the product called synthetic crude oil. Syncrude’s
synthetic crude oil is known as Syncrude Sweet Blend (SSB), and is characteristically
low in sulfur (Scott and Fedorak, 2004). This contributes greatly to the North American
refinery goal to produce a more environmentally friendly, lower sulfur petroleum
product. Suncor produces two blends of synthetic crude oil that differ in their sulfur
content. One is a sweet blend not unlike SSB, while the other is a sour blend containing
higher amounts of sulfur to allow Suncor to better meet the specific needs of different
consumers (Scott and Fedorak, 2004).
1.1.5 Waste Products
Sand: Sand from the extraction process at Syncrude Canada Ltd. is stored in the
Southwest Sand Storage area pit. Here the sand and clay settle out and the water
containing clay fines is returned to the Mildred Lake Settling Basin for further

5
clarification (Syncrude Facts, 1997). Sand from the Suncor Energy Inc. operations is
also similarly stored on site.
Fluid Tailings: The caustic soda hot water floatation process used during the extraction
of bitumen from the oil sands deposits requires large volumes of water (about 0.65 m3
wastewater for each ton of oil sands processed) and produces a waste product called
mature fine tailings (MFT) (Matthews et al., 2000). Tailings are a mixture of solids,
water and non-extractable bitumen (50:50:1) (Herman et al., 1994). The major
components of tailings ponds include water (clarified water in the surface zone and
water in the sludge), mineral solids (sand, silt, clays), dissolved solids (inorganic and
organic components, process chemicals and leachates), and bitumen (unrecovered
during extraction) (MacKinnon, 1989).
A second type of tailings is composite tailings (CT), which are a mixture of
MFT and different coagulants. These coagulants solidify the MFT, thereby reducing
the overall fluidity of the tailings deposit. This type of tailings allows for more
reclamation alternatives since they can now be stored as a soil matrix (Matthews et al.,
2000).
Tailings have been shown to contain a number of contaminants of concern,
including a variety of trace metals and organic compounds such as polycyclic aromatic
hydrocarbons (Madeill et al., 2001). The concentrations of these elements in the tailing
ponds are ultimately dependent on the concentrations present in the oil sands.
However, the concentrations of these metals are being maintained at low and fairly
constant levels through interactions with the high-suspended solids fraction in the
tailing slurries and in the sludge (MacKinnon, 1989). Most of the constituents of the
wastewater retained in the tailing ponds are found in surrounding natural surface waters
even though their concentrations and relative distributions are different (MacKinnon
and Boerger, 1986).
Biodegradation studies conducted in the 1990s indicated that the presence of
toxic compounds in oil sands tailings did not inhibit microbial activity. It has also been
shown that microbes indigenous to oil sand tailings can degrade carboxylated
cycloalkanes (Lai et al., 1996 and Herman et al., 1994). Bacteria have been found to be

6
present in fairly high numbers (106 to 108 cells/mL) in tailing ponds where they are
capable of degrading bitumen (Foght et al., 1985).
Water from Syncrude tailings waste has been shown to be acutely toxic to
aquatic organisms. The amounts of cadmium, zinc, lead and vanadium present in the
tailings were shown by Barton and Wallace (1979) to be well above levels which have
been shown to elicit a toxic response in aquatic invertebrates and other taxa. These
responses have been observed using aquatic toxicity tests with Selenastrum
capricornutum (Chlorophyceae), Microtox®, Daphnia magna, Hyalella azteca, and
Onchorhynchus mykiss using waters freshly derived from MFT (mature fine tailings)
and CT (composite or consolidated tailings) processes (Herman et al., 1994; Leung et
al., 2001). Storage and disposal of the vast amounts of high moisture content fine
tailings continues to be one of the major problems associated with the current oil sands
mining and processing technology (Dawson et al., 1999).
Coke: The waste product coke is produced during the heavy oil upgrading processes at
the Alberta oil sands. However, Syncrude Canada Ltd. and Suncor Energy Inc. produce
coke through two different coking processes-fluid and delayed coking (see section
1.3.1). Most of the coke is stored directly onsite at the oil sands operations, although
some of the coke produced via delayed coking is sold and shipped off site (Scott and
Fedorak, 2004). Coke contains a number of different contaminants such as metals and
polycyclic aromatic hydrocarbons (PAHs). The production, composition and end uses
of coke are discussed in detail throughout the rest of this chapter.
1.2 History of Coke Production
Some of the first recorded observations of coke formation in Canada occurred in
the late 1800s by a refinery industry in Alberta experimenting with distillation of crude
oil to obtain kerosene (Scott and Fedorak, 2004). Coke occurred because their method
of heating the oil involved wood or coal. This provided a very uneven temperature
distribution, causing the oil at the bottom of the stills to overheat, forming coke. The
stills had to be shut down periodically to remove the coke until measures were
7
developed to reduce its formation, such as better temperature regulation (Scott and
Fedorak, 2004). However, with the need for gasoline increasing, the development of a
catalytic cracking process in 1937, involving the use of catalysts to break down
hydrocarbons, gave the industry a new way to produce desirable products without the
delays of cokers. However, after 1960 there was a reemergence of coking and several
new methods, such as fluid coking (see section 1.3.1), were developed.
1.3 Coke production at the Athabasca Oil Sands
Coking is an essential part of the upgrading system at the Athabasca oil sands
because it enables mining companies to convert less profitable heavy oil fractions into
the more valuable light fractions. Coke formation is characterized by an overall
increase in the ratio of carbon to hydrogen atoms and, therefore, coking can be viewed
as a carbon rejection method.
Coke is primarily classified based on the degree of large scale ordering present
in the deposit. The two major classifications of coke are anisotropic and isotropic.
Anisotropic includes both liquid phase derived and vapor phase derived coke. These
cokes have a highly ordered, layered macroscopic structure. Isotropic coke, however, is
characterized primarily by a lack of large-scale order. This coke type is typically
formed from non-fluid precursors that inhibit the molecules from aligning (Syncrude
Canada Ltd., 2003).
1.3.1 Methods of Coke Production
Syncrude Canada Ltd. uses an unconventional continuous fluid coking system,
which involves the use of both a reactor and a burner (Figure 1.1). In the burner, heat is
generated for the thermal cracking process by burning coke in the fluidized bed of the
burner. Heat from the burner is transferred to the reactor via solids circulating between
the two units in transfer lines. Heated coke from the burner moves to the reactor, to
form a bed of hot particles at 500 °C. Preheated bitumen is sprayed onto this hot coke
bed, which causes the heavy molecules to crack, producing light molecules and more
fluid coke.

8
The light molecules produced are in the form of vapor. These vapors are
condensed in the upper portion of the reactor in the scrubber and are cleaned of coke
and heavy hydrocarbons when they leave the coker to be separated in the fractionation
facilities (Mankowski, 1989). The vapors from this process are separated by distillation
into four main components: light process gas, naphtha (which is further upgraded into
gasoline), kerosene (to produce jet fuel), and gas-oil (the heaviest component used as a
heating fuel).
The main areas of a fluid coking system are characterized as chunky withdrawal,
bed coke, stripper sheds, upper dense phase wall, dilute phase, horn chamber, cyclone
inlets, cyclone barrel, cyclone gas outlet tube, cyclone snout and scrubber grid. Due to
the different precursors and temperatures as well as the length of time which coke is
retained in the different sections, different classifications or types of coke can be found
at each of these areas (Syncrude Canada Ltd., 2003).
Figure 1.1. A simplified diagram of a fluidized coke system. Adapted from Mankowski (1989) and Syncrude Canada Ltd. (2003).
Reactor
Burner
Hot Coke
Vapour product to fractionator
Scrubbers
Cold CokeWaste Coke

9
Suncor Inc. uses a delayed coking process, which is a ‘batch by batch’
procedure with each coker unit containing a heater and a pair of drums (Figure 1.2).
Bitumen is introduced into the drums and is progressively heated to above 490 °C. The
heat cracks the molecules into vapors and solid coke. The coke is then deposited in a
drum, along with most of the sulfur and virtually all of the metals. The stock leaving
the furnace usually consists of hot liquid and vapors mixed with a small amount of
steam (Scott and Fedorak, 2004). As in Syncrude, they are fractionated and separated
by distillation for consumption.
Figure 1.2. A Simplified diagram of a delayed coker system. Adapted from Scott and Fedorak (2004).
1.3.2 Current Disposal Methods for Coke
Syncrude: There are several options being developed for the petroleum coke produced
during the coking processes at Syncrude Canada Ltd. There is considerable potential,
despite the presence of sulfur, that Syncrude coke can be gasified and used as an energy
source. However, the commercial gasification of oil sands coke is delayed due to the
availability of natural gas on the site of the upgrading plants (Furimsky 1998). It has
also been demonstrated that activated carbons with surface areas and micropore
Coke Drums
Furnace
FractionationColumn
Switch Valve
Vapours from coking
10
volumes comparable to existing commercial activated carbons can be produced from
Syncrude fluid coke (DiPanfilo and Egiebor 1996).
The main problem with these options is that the amount of coke produced at the
Syncrude Canada Ltd. operations (over 2,000 tonnes per day) is significantly more than
can be combusted and/or sold. Therefore, it must be stored on site in “coke cells” and
these then become a necessary component of the reclamation landscapes.
Coke cells are located in mined out areas, or more recently, in tailings holding
ponds (Scott and Fedorak, 2004). The coke is transported there as a slurry with
recycled water, and transported using a network of pipelines. The coke cells extend to
the base of a mined out pit, and are surrounded by earth dikes constructed of “extraction
rejects”. These are clay lumps that were rejected when the oil sand was initially
processed during extraction (Komex International Ltd., 1998). Currently, land on the
reclaimed surface areas of coke cells are used primarily as wildlife habitat (Golder
Associates Ltd., 2000).
Suncor: Prior to the recent expansions at the mine sites north of Fort McMurray, coke
production at Suncor Energy Inc. was low enough that most of it was utilized in the
steam and power production for on-site energy services (Scott and Fedorak, 2004).
However, with the new expansions, the amount of coke is increasing, and new strategies
are being developed to compensate. Approximately 10% of Suncor coke is sold to
Japanese ammonia plants. The majority, however, is stored in large piles on site.
1.3.3 Physical and Chemical Properties of Coke
Coke produced by fluid cokers is termed fluid coke. This coke is formed almost
instantaneously as feed (bitumen) is sprayed onto the hot coke particles in the reactor.
This produces a layered type of coke since new layers of coke are added as cracking
occurs on each particle. Therefore, fluid coke can resemble the structure of small
onions with an average diameter of between 100 and 150 μm (Scott and Fedorak, 2004).
In contrast, three different types of coke can be produced from delayed cokers. These
are termed sponge coke, needle coke and shot coke (Scott and Fedorak, 2004). Some of

11
the physical and chemical characteristics of coke from Syncrude Canada Ltd. and
Suncor Energy Inc. are included in Table 1.1.
1.3.4 Coke Toxicity and Leachability
Due to the different upgrading methods used at Syncrude Canada Ltd. and
Suncor Energy Inc., the toxicological properties of the coke produced by these two
companies should, theoretically, be different. However, there have been no studies
conducted that fully characterizes the toxicological properties of coke for either
Syncrude Canada Ltd. or Suncor Energy Inc., but some leaching work has been done.
A study looking at the short-term metal leaching rates of Syncrude Canada Ltd.
coke was conducted in 1996. This study looked at the amounts of various trace metals
found in the coke before and after leaching. In these short-term (18 hr) leachate tests,
no organic substances (such as polycyclic aromatic hydrocarbons) could be detected in
the leachate (Chung et al., 1996). Therefore, it is now believed that metal-containing
compounds in the coke are buried in the carbon matrix in such a way that they are not
accessible by water (Chung et al., 1996). Proximate and ultimate analyses indicated
that the composition of the samples exhibited little change over several years of coke
production. A rather low oxygen content, in spite of prolonged weathering, indicated a
resistance of the coke to oxidation (Chung et al., 1996).
Leaching experiments using different acids and with a range of pH showed that
little material is leached from Syncrude Canada Ltd. coke. The only metals removed
were nickel and vanadium (Komex International Ltd., 1998). Molybdenum removal
was not detected in the leaching tests, but was found to be concentrated in water
associated with coke storage (Komex International Ltd., 1998).

12
Table 1.1. Physical and chemical characteristics of Syncrude Canada Ltd. and Suncor Energy Inc. cokes. Adapted from Komex International Ltd. (1998) and Scott and Fedorak (2004).
Characteristic Syncrude Suncor
Size Medium to fine sand size (uniform)
Well-graded sandy gravel to large chunks (non-uniform)
Shape Spheres Irregular lumps
Structure Onion-like layering Highly porous, sponge-like
Watera 0.25 to 0.69% 0.24 to 0.66%
Non-Combustible Asha 4.8 to 7.5% 3.3 to 6.5%
Volatile Mattera,b 4.9 to 6.2% 8.3 to 11.0%
Surface Area 10.7 to 12.2 m2/g Highly variable
Specific Gravity 1.55 to 1.65 g/cm3 1.2 to 1.37 g/cm3 (highly dependent on particle size)
Density in Coke Cells ~1.0 mg/m3 Coke cells not used
Permeability 4 to 6 x 10⁻⁴ cm/s at density ~0.94 mg/m3
Highly variable depending on density (an inverse relationship)
Sulphur 6.2 to 6.8% 5.86 to 6.15%
Carbon 80.7 to 83.7% 81.54 to 84.35%
a Proximate analysis (typical). b Volatile matter is weight lost upon heating at 925°C for 7 min in an oxygen-free atmosphere.

13
It has been shown previously that nickel (<0.05 to 0.068 mg/L) and vanadium
(0.04 to 7.0 mg/L) are more mobile under slow, long-term leaching conditions.
Molybdenum is also considered to have long-term leaching potential since it was found
in coke storage water (0.3 to 0.8 mg/L) (Komex International Ltd., 1998). These
findings conflict with the previously held conclusion, that coke will not leach
significant amounts of toxic constituents, and suggest that a thorough evaluation
program involving long-term leaching tests is required in order to fully understand the
risks associated with using coke as part of a reclamation program (Komex International
Ltd., 1998).
1.4 Reclamation Strategies at the Alberta Oil Sands
The goal of reclamation at the oil sands is to achieve maintenance-free, self-
sustaining ecosystems with capabilities equivalent to or better than pre-disturbance
conditions (Golder Associates Ltd., 2000). Indigenous biota living in wetlands created
on mined out oil sands leases will be exposed to complex effluent containing a number
of potentially toxic compounds. Therefore, characterizing the toxic effects of one
chemical alone cannot assess the suitability of the wetlands as a habitat (Pollet and
Bendell-Young, 2000). Organisms also differ in their route of exposure to stressors
(e.g. water, sediment, or food) and, therefore, they may not be exposed to the same
amounts or types of contaminants (Bendell-Young et al., 2000).
The main sources of toxicity from the oil sand mining process to the
surrounding ecosystem have been identified as tailings (fine and coarse), process water,
sulfur, and coke. Both Suncor and Syncrude maintain a no discharge policy in regard to
these contaminants. Therefore, these waste products are stored on site until reclamation
occurs. One strategy for utilizing this coke is as a substrate layer in an aquatic
reclamation program (Figure 1.3). Coke is proposed to be added between a tailings and
peat layer in reclaimed wetlands (Golder Associates Ltd., 2000). This is because coke
has the potential to act as a “buffer” for any contaminants which may leach from the
tailings layer into the overlying clean water cap.

14
Figure 1.3. Possible layering of oil sand waste materials in a wetland reclamation strategy on mined oil sand leases (Adapted from Golder Associates Ltd., 2000 and MacKinnon, 2002).
1.4.1 Coke in an Aquatic Reclamation Program
Today, Syncrude Canada Ltd. produces approximately 23 kg of coke per barrel
of Syncrude Sweet Blend (SSB) oil. This totals approximately 2 million tonnes of coke
per year, with planned expansions in the next few years increasing this number to 3
million tonnes per year (Komex International Ltd., 1998; Scott and Fedorak, 2004). As
part of the Syncrude Canada Ltd. operation, about 2,000 tonnes per day of this coke is
being stockpiled in proximity to the plant (Chung et al., 1996). Suncor produces 39.6
kg of coke per barrel of bitumen processed, amounting to the production of over 3
million tonnes of coke per year (Scott and Fedorak, 2004).
Coke contains a high amount of organic carbon. Using coke as a substrate layer
in an aquatic reclamation strategy would therefore allow for immediate additional input
of organic carbon into a wetland. This could be useful for the timely development of
sustainable wetlands on old oil sands leases where natural organic matter is not very
abundant. In wetlands dissolved organic matter (DOM) plays an important role in the
biogeochemistry of carbon (Kalbitz et al., 2000). Dissolved oraganic matter in
established wetlands originates from plant litter, soil humus, microbial biomass, algal
exudates, decomposing biota or from root exudates.
Tailings Waste
Coke
Water Cap
Natural Ground
Peat/Overburden
Tailings Waste
Coke
Water Cap
Natural Ground
Peat/Overburden
15
A diverse benthic invertebrate community could not develop successfully
without the presence of organic carbon. The invertebrate community establishes early
in any freshwater ecosystem and is an integral part of the aquatic food web. Thus, the
benthic macroinvertebrate community structure in wetlands receiving industrial effluent
is relevant to the overall biotic structure of such a wetland (Bendell-Young et al., 2000).
As a result, the abundance of coke, and its high percentage of organic carbon, makes it a
very attractive option for use in the aquatic reclamation process.
An evaluation program looking at the possible long-term effects of adding coke
to an aquatic environment should be representative of the environment encountered in
the oil sands region, including some of the more extreme environmental conditions.
This will help determine under what conditions coke could potentially release the most
toxic constituents, thus posing the greatest risk to the surrounding aquatic environment.
One such variable is the level of dissolved oxygen in the overlying water cap. Some
metals have been shown to speciate differently under different redox conditions,
potentially becoming more toxic (Meng et al., 2001).
Another water quality condition to consider is pH. There is a potential for coke
to be exposed to various pH levels in a reclaimed environment due to layering with
other waste products (such as tailings) in the reconstructed wetlands. It is known that
under lower pH conditions, metals can be released (ionized) into water from sediment
more easily (Wren and Stephenson, 1991). It has also been shown in previously
conducted short-term work that coke may produce acutely toxic seepage water under
more acidic conditions (Lane et al. 1984).
It is also important to take into account significant climate variables, such as the
freeze-thaw cycle. In previous studies it was discovered that negative pore water
pressures develop when water-saturated oil sands fine tails are subjected to below
freezing temperatures (Dawson et al., 1999). These negative pore water pressures can
cause water to migrate to ice crystals already growing in the pores, forming an ice-soil
structure similar to that seen in permafrost soils. This ice-soil structure has been
demonstrated to cause substantial dewatering of fine tails in both the laboratory and the
field (Dawson et al., 1999). Since the oil sands region in northern Alberta undergos a
considerable drop in temperature during the winter season, the possibility exists for

16
coke to undergo this same process, thus releasing pore water that is potentially more
toxic into the overlying water.
1.5 Chironomus tentans as a Test Organism
Chemical analysis alone is not enough to assess the toxicological risk in an
aquatic environment. It is impossible to analyze for all of the chemicals that may
contribute towards toxicity (Juvonen et al., 2000). Bioassays integrate the combined
effects of all chemicals present at a polluted site, including their bioavailability (van
Gestel et al., 2001). Because of the key position that larvae of members of the family
Chironomidae hold among the invertebrates in freshwater ecosystems, they have
received increased attention in ecotoxicological studies (de Bisthoven et al., 2004).
Among freshwater macroinvertebrates, chironomid larvae are considered a good
indicator of water quality because of their abundance in aquatic ecosystems (Mousavi et
al., 2003). The species, Chironomus tentans, comprises a large percentage of the
invertebrate biomass in the wetlands of Northern Alberta, making it a good
representative of aquatic organisms that may come into contact with oil sands waste
material (Baker, 2004).
Chironomus tentans are easy to culture and handle in the laboratory. They have
a relatively short life cycle (approximately 30 days at 24 ± 1 C°) making them an ideal
candidate for both acute and chronic toxicity studies (Pery et al., 2003). They have
several life stages consisting of an egg mass, larvae (which also has four instars), pupae
and adult (mature fly). The adult stage can cause C. tentans to transport trace metals
and other contaminants from the aquatic to the terrestrial environment (Timmermans
and Walker, 1989).
Chironomus sp. have been shown to be sensitive to a broad range of
contaminants in both water and sediments and therefore are commonly used as part of
metal sediment toxicity studies (Besser and Rabeni, 1987; Ingersoll et al., 1996;
Leppanen et al., 1998; Liber et al., 1996; Peeters et al., 2001). Timmermans et al.
(1992) found that exposure to both zinc and copper caused delayed development and
reduced growth of Chironomus riparius larvae. A study conducted by Powlesland and
George (1986) found that nickel can also bring about reduced growth and development

17
as well as mortality in the sensitive 1st instar larvae of C. riparius at concentrations of
79.5 mg/L. The most obvious impact that metal toxicity can have on C. tentans is the
death of the organism. However, there are more subtle impacts such as growth,
emergence and reproduction that can also be observed (Reynoldson, 1987).
18
2. RESEARCH GOAL AND OBJECTIVES
2.1. Goal
The overall goal of this research was to evaluate whether stockpiled Syncrude
Canada Ltd. and Suncor Energy Inc. coke can safely and effectively be used as a
capping material for consolidated and/or mature fine tailings in aquatic reclamation. It
is as yet unclear whether or not coke poses a significant toxicological risk (i.e. through
leaching of constituent chemicals and elements) to the aquatic or terrestrial
environments if used in a long-term reclamation capacity.
2.2. Objectives
The specific research objectives were to:
I) Determine if the coke generated by Syncrude Canada Ltd. and Suncor Energy
Inc. display different physical properties (porosity, texture) and/or contain
different types or concentrations of toxic constituents (both inorganic and
organic), that could potentially be liberated and affect their suitability for use as
substrate amendments in wetland reclamation options.
II) Determine whether aging under different water quality conditions (e.g. pH, DO
and freeze-thaw) could influence the degree to which toxicants are released from
the coke and become available to aquatic organisms; identify what conditions
are most important in such processes; and determine the acute and sublethal
toxicity of both Syncrude and Suncor coke and their leachates to a representative
benthic invertebrate, Chironomus tentans, after weathering under different
overlying water conditions for 30-90 days.
III) Evaluate if different mixture combinations of coke, soft tailings and reclamation
soil influence the degree to which potential toxicants are released and become
available to aquatic organisms in-situ over time.

19
3. THE EFEECTS OF DISSOLVED OXYGEN, pH, AND FREEZE-THAW
CYCLES ON THE POTENTIAL LONG-TERM TOXICITY OF OIL SANDS
COKE AND THEIR LEACHATES TO CHIRONOMUS TENTANS
3.1 Introduction
Oil sands are sand deposits impregnated with dense, viscous petroleum called
bitumen. The two major oil sand mining companies currently producing synthetic
crude oil in Alberta are Syncrude Canada Ltd. and Suncor Energy Inc.
One waste product produced during the upgrading processes at the Alberta oil
sands is called coke. Currently, Syncrude produces approximately 2 million tonnes of
coke per year, with planned expansions in the next few years increasing this number to
3 million tonnes per year (Komex International Ltd., 1998; Scott and Fedorak, 2004).
Suncor already produces over 3 million tonnes of coke per year (Scott and Fedorak,
2004). Syncrude and Suncor produce coke through different coking processes, called
fluid and delayed coking. Most of the coke is stored directly on-site at the oil sands
operations, although some of the coke produced via delayed coking is sold and shipped
off site.
Coke contains a high amount of organic carbon. Using coke as a substrate layer
in an aquatic reclamation strategy therefore allows for immediate, additional input of
organic carbon into a constructed wetland. This could be useful for the timely
development of sustainable wetlands on old oil sands leases where natural organic
matter is not very abundant. An evaluation program looking at the long-term effects of
adding coke to an aquatic reclamation strategy should be representative of the
environmental conditions encountered in the oil sands region. This will help to
determine under what circumstances coke could potentially release the greatest amount
20
of toxic constituents, thereby posing the greatest risk to the surrounding aquatic
environment. An important environmental variable to consider is the level of dissolved
oxygen in the overlying water cap. Some metals may speciate differently under
different redox conditions, potentially becoming more toxic (Meng et al., 2001).
There is also the potential for coke to be exposed to various pH levels in a
reclaimed environment due to layering with other waste products (such as tailings) in
reconstructed wetlands. It is known that under lower pH conditions, most metals tend
to be released (ionized) into water from sediment more easily (Wren and Stephenson,
1991). It has also been shown in previously conducted short-term work that coke may
produce acutely toxic seepage water under more acidic conditions (Lane et al., 1984).
It is also important to take into account any significant climate changes
encountered in the northern regions of Alberta, such as freeze-thaw cycles. In previous
studies conducted at the Alberta oil sands, it was discovered that negative pore water
pressures develop when water-saturated oil sands fine tailings are subjected to below
freezing temperatures (Dawson et al., 1999). These negative pore water pressures can
cause water to migrate to ice crystals already growing in the pores, forming an ice-soil
structure similar to that seen in permafrost soils. This ice-soil structure has been
demonstrated to cause substantial dewatering of fine tailings under both laboratory and
field conditions (Dawson et al., 1999). Since the oil sands region undergoes a
considerable drop in temperature during the winter season, the possibility of coke
undergoing this same process, and releasing pore water that is potentially more toxic
into the environment is significant.
The objective of the following experiments was to determine the effects of
environmental factors such as the dissolved oxygen and pH levels of the overlying
water, and the freeze-thaw cycles experienced in Northern Alberta, on the long-term
toxicity of Syncrude and Suncor coke and their leachates if coke is incorporated into an
aquatic reclamation landscape.
21
3.2 Materials and Methods
3.2.1 Study Design
A static test protocol was chosen because this would provide a “worst-case”
scenario resulting in more concentrated overlying water and pore water. Leaching, as
used in this thesis, refers to the inherent movement of toxic constituents (i.e. metals)
from the waste product coke into the overlying water and pore water. It is assumed that
any seepage to groundwater from coke if used in reclamation landscapes would be
minimal due to the assumed presence of fine and/or consolidated tailings underneath the
coke layer. Depths of water and coke used in these laboratory experiments are based on
the ratio of the proposed coke and water depths of the constructed wetlands,
approximately 0.5 - 0.75 and 1.0 - 2.0 metres, respectively. This creates, at a
minimum, a 1:4 ratio of coke to water (MacKinnon, 2002).
The test vessels for all experiments were 2 L glass jars with screw caps. This
size was chosen because it provided enough water for sampling, and the caps provide a
sealed environment ideal for the easy maintenance of specific DO and pH levels.
Each test vessel contained a 400 mL layer of coke or sand covered with a 1600
mL layer of reconstituted water, the characteristics of which are listed in Table 3.1.
This water was prepared using laboratory deionized water the day before the start of the
experiment. On day 0 of each leaching experiment, the reconstituted water was
thoroughly mixed before being added to the substrate (coke or sand) in each test jar.
For each leaching experiment, the coke was obtained directly from Syncrude
Canada Ltd. and Suncor Energy Inc. on-site storage piles in May 2002. The sand used
in the control vessels was pure quartz (250-425 μm) sand obtained from Brock White
Canada in Saskatoon, SK, and was rinsed several times with deionized water before
being used in each experiment.

22
Table 3.1. Characteristics (means ± SE) of reconstituted water used in laboratory leaching experiments, and surface water sampled from the Deep Wetland field site located at Syncrude Canada Ltd.
Characteristic Deep Wetland Water1
Reconstituted Water
pH 8.4 ± 0.003 8.4 ± 0.03
Hardness (mg/L CaCO3) 198.7 ± 1.8 204.0 ± 3.4
Alkalinity (mg/L CaCO3) 215.3 ± 3.5 194.7 ± 10.1
1 Samples were collected in May 2002 (n = 4).
3.2.1.1 Dissolved Oxygen
The dissolved oxygen leaching experiment was 30 days in duration, and
consisted of a low and high dissolved oxygen treatment. Prior to adding the
reconstituted water to the substrate in each jar, the water was pre-aerated overnight with
nitrogen for the low oxygen and air for the high oxygen treatments. Afterwards, the jars
were continuously aerated by introducing their respective gases as close to the surface
of the coke/sand layer as possible, without disturbing the surface. This was done using a
hollow glass rod attached to aquarium tubing outside of the test vessel so as to prevent
any contact between the plastic tubing and the water. The dissolved oxygen levels
(mg/L) in each test vessel were measured every second day. Overlying water and pore
water was sampled on days 0, 10, 20 and 30 for analysis of trace metals and standard
water quality variables (see section 3.2.2.1).
3.2.1.2 pH
The pH experiment was 90 days in duration with water sampling occurring on
days 0, 45, and 90 (see section 3.2.2.1). The three pH treatments used in this
experiment were 5, 7.5 and 10, selected to encompass the range of values that each coke
type may be exposed to during the duration of an aquatic reclamation program. Prior to
adding the reconstituted water to the substrate in each jar, it was adjusted to the desired

23
pH level with concentrated (1M) H2SO4 or NaOH. Random checks on each of the test
vessels were made twice per week and, if necessary, the pH was adjusted using H2SO4
or NaOH to keep it within the acceptable range of ± 0.5 pH units. There was no
aeration of the test vessels during this experiment, since it was conducted in an airtight
system to better maintain stable pH levels. Dissolved oxygen was monitored every one
to two weeks to ensure that levels in the overlying water were not below 3 mg/L, the
lowest level required for the proper growth of the aquatic invertebrate, Chironomus
tentans (Irving et al., 2004).
3.2.1.3 Freeze-thaw
In the freeze-thaw experiment, coke and its overlying waters were frozen in 2-L
plastic jars with enough headspace so as to prevent any possibility of cracking the jars
due to expansion of the overlying water during freezing. Six freeze-thaw cycles were
conducted with sampling of the overlying and interstitial waters prior to the first cycle
and after cycles 1, 3 and 6 (see section 3.2.2.1). Each cycle consisted of 2 days of
freezing at –20°C, and 4 days of thawing in an environmental chamber at 23 ± 1°C.
3.2.2 Sampling and Analysis
3.2.2.1 Water
At each sampling time, three replicates (jars) from each treatment for each coke
type and control were removed. The overlying water was carefully decanted off the
coke layer and then filtered using a 3.1-µm pore-size glass fiber filter (Pall Life
Sciences, Mississauga, ON) to remove any coke particles which may have been present.
The overlying water was analyzed for standard water quality variables (ammonia,
conductivity, pH, hardness and alkalinity) at the Toxicology Centre, University of
Saskatchewan, Saskatoon, SK. Sub-samples of overlying water were further filtered
using 0.45-μm Nalgene® membrane filters before being transferred into pre-cleaned 15-
mL Nalgene® bottles (Nalge Nunc International, Rochester, NY, USA) for trace metal
analysis. These samples were acidified with double distilled (ultra-pure) nitric acid

24
(1N) to pH 2 and stored at 4 ºC until they were analyzed. Trace metal analysis was
performed in the Department of Geological Sciences at the University of Saskatchewan
using Inductively Coupled Plasma-Mass Spectrometry (ICP-MS).
Polycyclic aromatic hydrocarbon (PAH) analysis was conducted on two
replicate samples of each dissolved oxygen treatment (high and low) for each coke type
on Day 30 of the leaching period. Filtered overlying water was transferred into sterile
amber glass jars with no head-space. PAH analysis was performed by Enviro-Test
Laboratories (Saskatoon, SK) using Gas Chromatography-Mass Spectrometry (GC-
MS).
After the overlying water was decanted from the leaching jar, coke was
transferred from the jar into a small, plastic sample container. Pore water was then
extracted from the coke by vacuum filtration with a 0.45-μm membrane filter (Pall Life
Sciences, Mississauga, ON). Pore water was analyzed for trace metals and the same
standard water quality variables as described previously for overlying water.
3.2.2.2 Coke
The coke used in these experiments was also analyzed for elemental
composition. A sub-sample of each coke type used for each treatment in the dissolved
oxygen and pH experiments (Table 3.2) was dried in an oven at 60 ºC for 48 hrs. These
samples were then sent to Acme Analytical Laboratories Ltd. (Vancouver, BC) for
analysis using ICP-MS and Inductively Coupled Plasma Emission Spectroscopy (ICP-
ES) techniques.

25
Table 3.2. Origin of Syncrude Canada Ltd. and Suncor Energy Inc. coke samples chosen for elemental analysis1.
Syncrude Canada Ltd. Coke Suncor Energy Inc. Coke Unweathered Syncrude coke, from the coke piles (starting material)
Unweathered Suncor coke, from the coke piles (starting material)
Weathered Syncrude coke, exposed to water with low dissolved oxygen (~ 1 mg/L) for 30 days
Weathered Suncor coke, exposed to water with low dissolved oxygen (~ 1 mg/L) for 30 days
Weathered Syncrude coke, exposed to water with high dissolved oxygen (~ 8 mg/L) for 30 days
Weathered Suncor coke, exposed to water with high dissolved oxygen (~ 8 mg/L) for 30 days
Weathered Syncrude coke, exposed to water at pH 5 for 45 days
Weathered Suncor coke, exposed to water at pH 5 for 45 days
Weathered Syncrude coke, exposed to water at pH 7.5 for 45 days
Weathered Suncor coke, exposed to water at pH 7.5 for 45 days
Weathered Syncrude coke, exposed to water at pH 10 for 45 days
Weathered Suncor coke, exposed to water at pH 10 for 45 days
1 Coke was originally obtained from Syncrude coke piles 4 and 5, and the most current Suncor coke piles in May 2002.
3.2.3 Toxicity Tests
On the last day of the dissolved oxygen and freeze-thaw experiments, and on
days 45 and 90 of the pH experiment, a toxicity test using the macroinvertebrate,
Chironomus tentans, was conducted following the protocol outlined by Environment
Canada (1997). These tests were 10-d experiments measuring the growth and survival
of C. tentans. For each treatment, the combination of the coke + leachate and leachate
independently were tested to allow for the effects of the leachate and the coke to be
assessed separately.
Chironomus tentans were obtained from a laboratory culture maintained at the
Toxicology Centre, University of Saskatchewan. Organisms were cultured in an
environmental chamber at a photoperiod of 16:8 h light:dark and a temperature of 23 ±
1 °C. The culture was maintained using performance-based techniques according to
culturing protocol outlined by Environment Canada (1997). Organisms were fed three

26
times per week with a Tetramin® fish food slurry (Tetra Werke, Melle, Germany). The
culture water was carbon-filtered, Saskatoon municipal water.
Test animals were obtained by aspirating fully emerged adults from the main
colony into a 500-mL Erlenmeyer flask. The adults were then transferred to a glass
breeding jar containing a piece of Parafilm® floating on a layer of culture of water and
two strips of plastic netting, thus providing ample surface area for mating. Each
morning, the breeding jar was checked for egg masses, which, if present, were
transferred to 10-L glass aquaria (2-3 egg masses per aquaria) containing a thin layer of
rinsed culture sand (particle size 250-425 μm) and aerated culture water. After the first
24 hours, animals were fed three times per week with 2.5 mL of a 6 mg/L Tetramin®
fish food slurry. After 8-10 d, larvae (second instar) were transferred from these tanks
to glass pans where they were separated from their cases using plastic pipettes before
being added to test beakers.
All tests were carried out in 250-mL beakers containing 200 mL of leachate
water and 50 mL of substrate. Substrates consisted of culture sand (particle size 250-
425 μm) for the leachate only exposures and leached coke for the coke + leachate
exposures. Ten C. tentans larvae (8-10 d old) were added to each test vessel at the start
of the test and fed a minimum of 5 mg/L of Tetramin® slurry daily throughout the test
period. Tests were conducted in an environmental chamber at the Toxicology Centre,
University of Saskatchewan, at a photoperiod of 16:8 h light:dark and an ambient
temperature of 23 ± 1 °C.
These were static tests with constant aeration of the overlying water. Dissolved
oxygen (mg/L) and temperature (ºC) of the overlying water were checked on a daily
basis in all test vessels. At the end of all tests, each beaker was assessed for changes in
survival and growth (measured as dry weight after 48 h at 60ºC) of C. tentans larvae.
Overlying water was sampled (10 mL) on days 5 and 10 and analyzed for ammonia to
ensure that these levels were not so high as to cause toxicity, thereby confounding
results. Separate samples of the overlying water (10 mL) were collected and analyzed
for alkalinity, hardness, conductivity and pH at the end of the 10 d test to ensure that
these variables were within the acceptable range for proper C. tentans survival and
growth.
27
3.2.4 Data Analysis
Mass balance calculations were performed for metals identified to be of concern
in the dissolved oxygen and pH leaching experiments. These calculations used the peak
concentrations of the identified metals of concern in both overlying water and pore
water, and compared them to their respective concentration in the untreated coke (i.e.
coke that had not undergone any leaching). If the concentration in the corresponding
leached coke was greater than the concentration in the untreated coke, the leached coke
value was used. Peak values were utilized in these calculations in order to simulate the
worst case scenario of using coke as a substrate in an aquatic reclamation strategy.
Statistical analyses were performed using the computer program SigmaStat®,
version 2.03 (SPSS Inc., Chicago, IL, USA) at a 95% (α = 0.05) level of confidence. A
two-way ANOVA was conducted on ranked metals data from the DO, pH and freeze-
thaw experiments since these data failed the test and transformations for homogeneity
of variance. These tests identified statistical differences between the overlying water
and pore water, and among the treatments within these waters for each experiment. If
statistical differences were found, a Holm-Sidak multiple comparison test was run for
all ANOVA tests.
For the toxicity data, a two-way ANOVA was conducted on C. tentans survival
and growth (measured as dry weight after 48 h at 60ºC) to identify statistical differences
among substrate types and treatments (DO, pH and freeze-thaw) within the leachate
water alone and within the coke plus leachate water treatment. The test used for
normality was Kolmogorov-Smirnov and the test for homogeneity of variance was the
Levene median test. If the data failed the test and transformations for homogeneity of
variance, the data were ranked, and a two-way ANOVA was run on the ranked data. If
statistical differences were found, a Holm-Sidak multiple comparison test was run for
all ANOVA tests.

28
3.3 Results
3.3.1 Chemical Endpoints
3.3.1.1 Water
Some trace elements reached concentrations in the overlying water and pore
water during the leaching period that were toxicologically relevant. These
concentrations either exceeded the Canadian Water Quality Guidelines for aquatic life
(CCME, 2003), or exceeded published LC50 values for Chironomus species (Figure 3.1
and 3.2).
Some metal leaching observations were common among each experiment (i.e.
DO, pH and freeze-thaw). First, metal concentrations generally increased in overlying
waters, while decreasing in pore waters. Even though these rates of loss and
accumulation were not similar, in most cases the amount of element lost from the pore
water was close to the amount which accumulated in the overlying water. It was also
observed that there was a rapid release of metals at the beginning (i.e. within the first
few hours) of the experiments, slowing to a lesser rate of release during the remainder
of the leaching period.
There were no detectable levels of any of the PAHs measured in any of the
analyzed Syncrude coke leachate waters (Table 3.3). Some minute levels of
phenanthrene, anthracene, fluoranthene, pyrene, benzo(a)anthracene, chrysene and
benzo(b)fluoranthene were detected in the Suncor coke leachate waters.

29
Figure 3.1: Metal concentrations from Syncrude (Syn) coke versus critical metal concentrations for selected metals analyzed during the dissolved oxygen, pH and freeze-thaw leaching experiments. Metals were not included if they were below the detection limit, or if no critical level could be identified (Ag, Li, Mg, P, Ca, Ti, Ga, Rb, Sr, Y, Zr, Nb, Sn, Sb, Cs, Ba, La, Ce, Pr, Nd, Sm, Eu, Gd, Dy, Ho, Er, Tm, Yb, Lu, Hf, Ta, W, Hg, Tl, Th, V). All critical concentrations are from the Canadian Water Quality Guidelines (CCME, 2003), except for Co (Marr et al., 1998) and U (Muscatello, 2004).
29
A l A s C r C o C u F e M n M o N i Z n U
log
Con
cent
ratio
n (u
g/L)
1
1 0
1 0 0
1 0 0 0
1 0 0 0 0
S yn c ru d e c o k e le v e l C r it ic a l le v e l
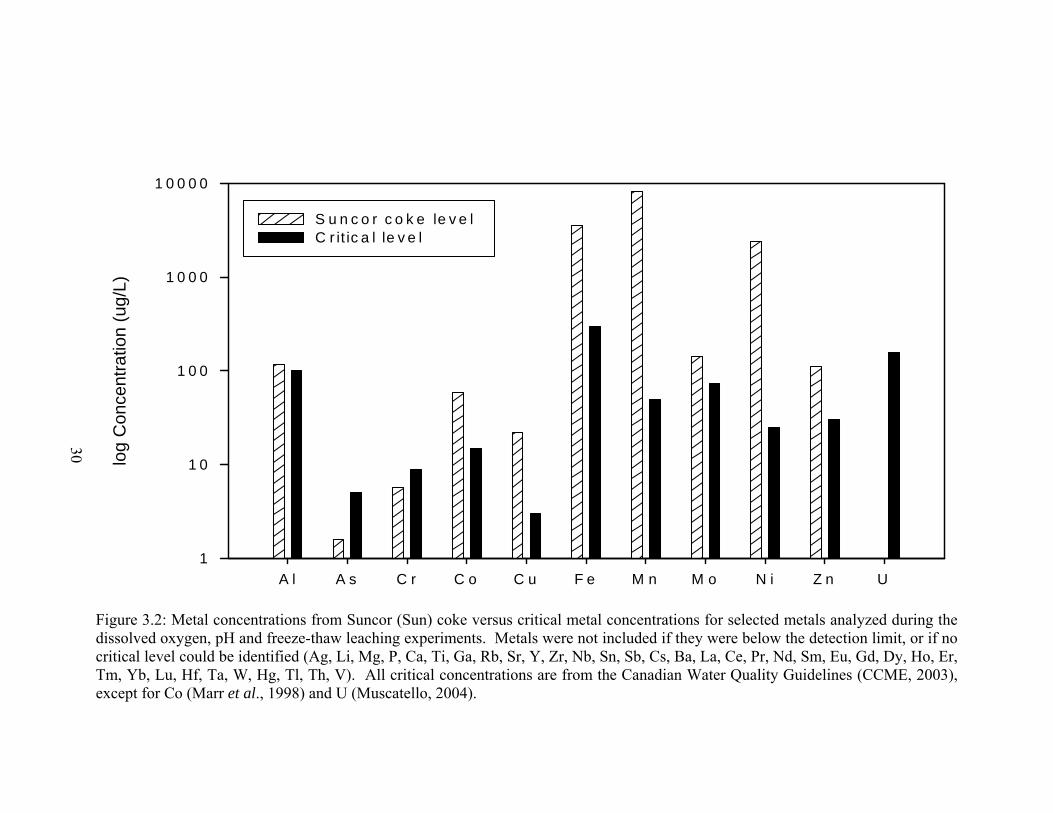
30
Figure 3.2: Metal concentrations from Suncor (Sun) coke versus critical metal concentrations for selected metals analyzed during the dissolved oxygen, pH and freeze-thaw leaching experiments. Metals were not included if they were below the detection limit, or if no critical level could be identified (Ag, Li, Mg, P, Ca, Ti, Ga, Rb, Sr, Y, Zr, Nb, Sn, Sb, Cs, Ba, La, Ce, Pr, Nd, Sm, Eu, Gd, Dy, Ho, Er, Tm, Yb, Lu, Hf, Ta, W, Hg, Tl, Th, V). All critical concentrations are from the Canadian Water Quality Guidelines (CCME, 2003), except for Co (Marr et al., 1998) and U (Muscatello, 2004).
30
A l A s C r C o C u F e M n M o N i Z n U
log
Con
cent
ratio
n (u
g/L)
1
1 0
1 0 0
1 0 0 0
1 0 0 0 0
S u n c o r c o k e le v e l C r it ic a l le v e l
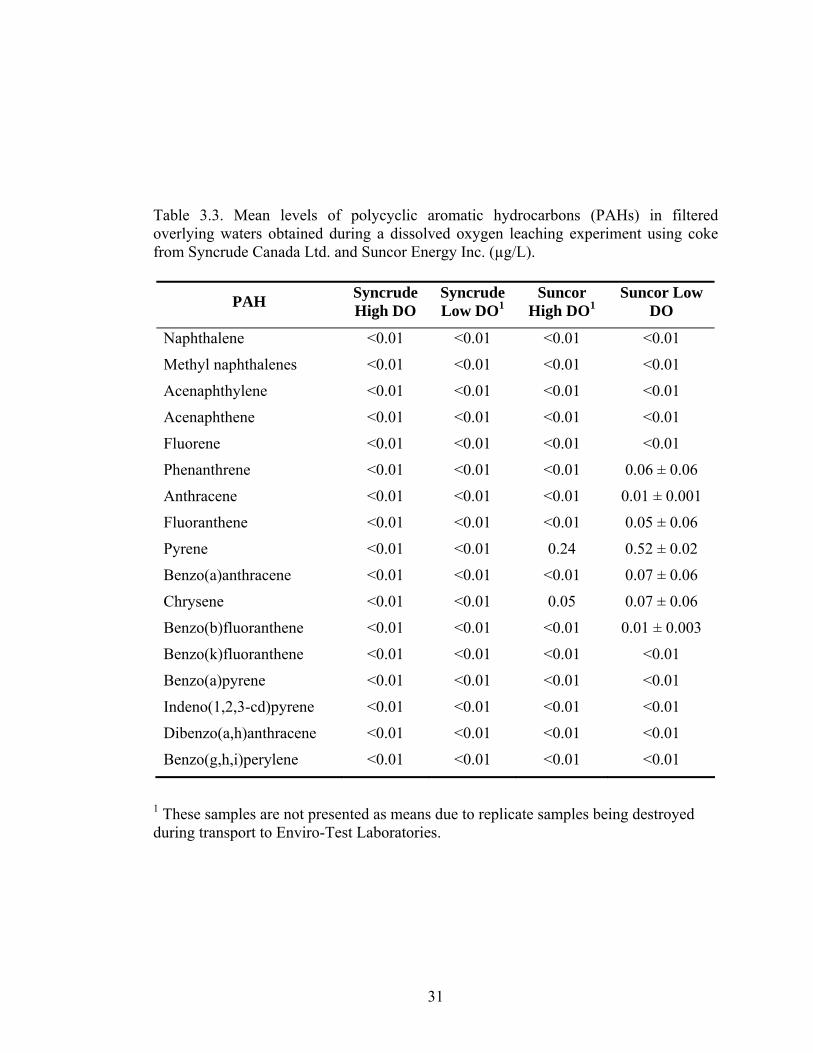
31
Table 3.3. Mean levels of polycyclic aromatic hydrocarbons (PAHs) in filtered overlying waters obtained during a dissolved oxygen leaching experiment using coke from Syncrude Canada Ltd. and Suncor Energy Inc. (µg/L).
PAH Syncrude High DO
Syncrude Low DO1
Suncor High DO1
Suncor Low DO
Naphthalene <0.01 <0.01 <0.01 <0.01
Methyl naphthalenes <0.01 <0.01 <0.01 <0.01
Acenaphthylene <0.01 <0.01 <0.01 <0.01
Acenaphthene <0.01 <0.01 <0.01 <0.01
Fluorene <0.01 <0.01 <0.01 <0.01
Phenanthrene <0.01 <0.01 <0.01 0.06 ± 0.06
Anthracene <0.01 <0.01 <0.01 0.01 ± 0.001
Fluoranthene <0.01 <0.01 <0.01 0.05 ± 0.06
Pyrene <0.01 <0.01 0.24 0.52 ± 0.02
Benzo(a)anthracene <0.01 <0.01 <0.01 0.07 ± 0.06
Chrysene <0.01 <0.01 0.05 0.07 ± 0.06
Benzo(b)fluoranthene <0.01 <0.01 <0.01 0.01 ± 0.003
Benzo(k)fluoranthene <0.01 <0.01 <0.01 <0.01
Benzo(a)pyrene <0.01 <0.01 <0.01 <0.01
Indeno(1,2,3-cd)pyrene <0.01 <0.01 <0.01 <0.01
Dibenzo(a,h)anthracene <0.01 <0.01 <0.01 <0.01
Benzo(g,h,i)perylene <0.01 <0.01 <0.01 <0.01
1 These samples are not presented as means due to replicate samples being destroyed during transport to Enviro-Test Laboratories.
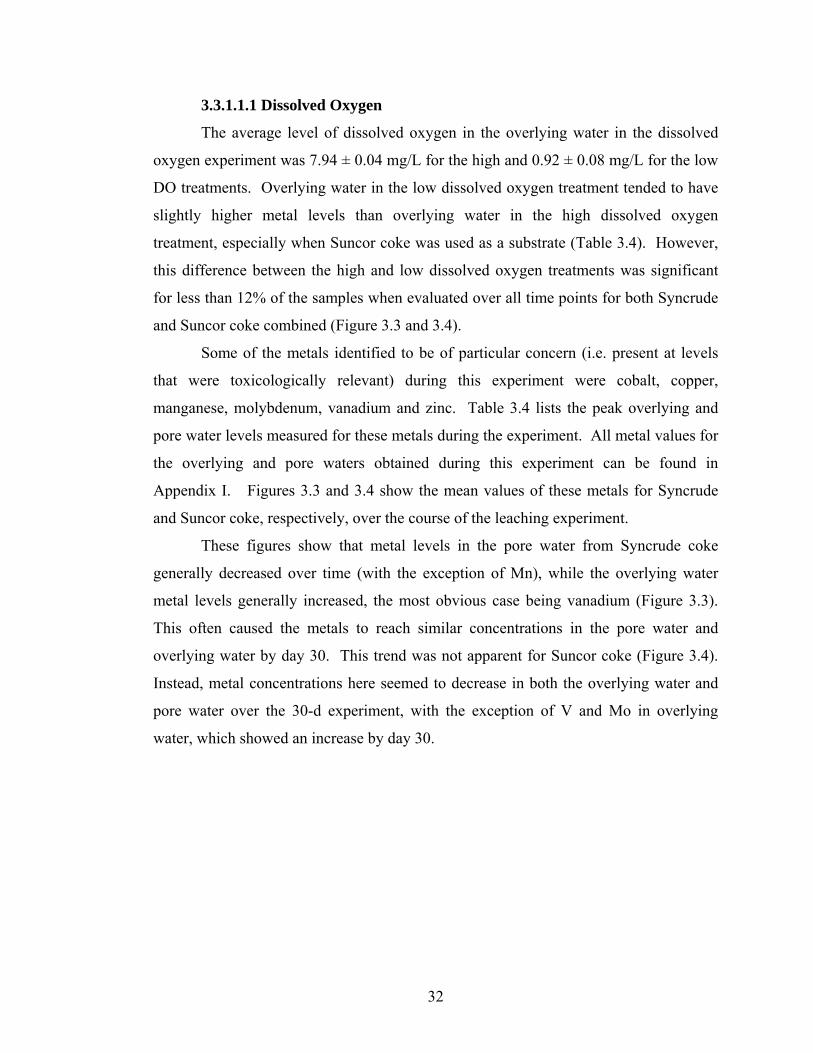
32
3.3.1.1.1 Dissolved Oxygen
The average level of dissolved oxygen in the overlying water in the dissolved
oxygen experiment was 7.94 ± 0.04 mg/L for the high and 0.92 ± 0.08 mg/L for the low
DO treatments. Overlying water in the low dissolved oxygen treatment tended to have
slightly higher metal levels than overlying water in the high dissolved oxygen
treatment, especially when Suncor coke was used as a substrate (Table 3.4). However,
this difference between the high and low dissolved oxygen treatments was significant
for less than 12% of the samples when evaluated over all time points for both Syncrude
and Suncor coke combined (Figure 3.3 and 3.4).
Some of the metals identified to be of particular concern (i.e. present at levels
that were toxicologically relevant) during this experiment were cobalt, copper,
manganese, molybdenum, vanadium and zinc. Table 3.4 lists the peak overlying and
pore water levels measured for these metals during the experiment. All metal values for
the overlying and pore waters obtained during this experiment can be found in
Appendix I. Figures 3.3 and 3.4 show the mean values of these metals for Syncrude
and Suncor coke, respectively, over the course of the leaching experiment.
These figures show that metal levels in the pore water from Syncrude coke
generally decreased over time (with the exception of Mn), while the overlying water
metal levels generally increased, the most obvious case being vanadium (Figure 3.3).
This often caused the metals to reach similar concentrations in the pore water and
overlying water by day 30. This trend was not apparent for Suncor coke (Figure 3.4).
Instead, metal concentrations here seemed to decrease in both the overlying water and
pore water over the 30-d experiment, with the exception of V and Mo in overlying
water, which showed an increase by day 30.
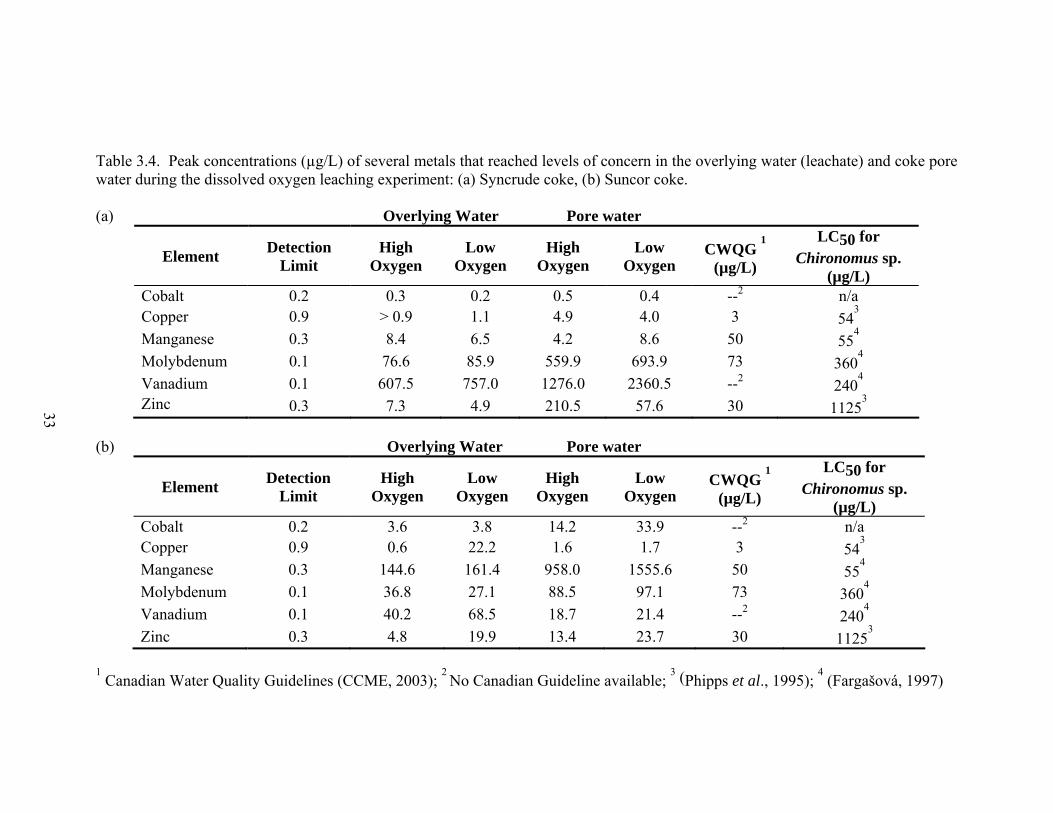
33
Table 3.4. Peak concentrations (µg/L) of several metals that reached levels of concern in the overlying water (leachate) and coke pore water during the dissolved oxygen leaching experiment: (a) Syncrude coke, (b) Suncor coke. (a) Overlying Water Pore water
Element Detection Limit
High Oxygen
Low Oxygen
High Oxygen
Low Oxygen
CWQG 1
(µg/L)
LC50 for Chironomus sp.
(µg/L) Cobalt 0.2 0.3 0.2 0.5 0.4 --2
n/a Copper 0.9 > 0.9 1.1 4.9 4.0 3 54
3
Manganese 0.3 8.4 6.5 4.2 8.6 50 554
Molybdenum 0.1 76.6 85.9 559.9 693.9 73 3604
Vanadium 0.1 607.5 757.0 1276.0 2360.5 --2 240
4
Zinc 0.3 7.3 4.9 210.5 57.6 30 11253
(b) Overlying Water Pore water
Element Detection Limit
High Oxygen
Low Oxygen
High Oxygen
Low Oxygen
CWQG 1
(µg/L)
LC50 for Chironomus sp.
(µg/L) Cobalt 0.2 3.6 3.8 14.2 33.9 --2
n/a Copper 0.9 0.6 22.2 1.6 1.7 3 54
3
Manganese 0.3 144.6 161.4 958.0 1555.6 50 554
Molybdenum 0.1 36.8 27.1 88.5 97.1 73 3604
Vanadium 0.1 40.2 68.5 18.7 21.4 --2 240
4
Zinc 0.3 4.8 19.9 13.4 23.7 30 11253
1 Canadian Water Quality Guidelines (CCME, 2003);
2 No Canadian Guideline available; 3 (Phipps et al., 1995);
4 (Fargašová, 1997)
33

34
Figure 3.3. Log mean values ± standard error for selected metals of concern in overlying water and pore water for Syncrude coke during a 30-day dissolved oxygen leaching experiment. (* denotes significant differences between overlying water and pore water, ** denotes significant differences between high and low dissolved oxygen levels).
Day0 10 30
Log
Van
adiu
m (u
g/L)
1
10
100
1000
10000
Overlying Water, High OxygenPore Water, High OxygenOverlying Water, Low OxygenPore Water, Low Oxygen
Day0 10 30
Log
Man
gane
se (u
g/L)
0.1
1
10
100
Day0 10 30
Log
Zinc
(ug/
L)
1
10
100
1000
Day0 10 30
Log
Mol
ybde
num
(ug/
L)1
10
100
1000
Day
0 10 30
Log
Cop
per (
ug/L
)
0.1
1
10
Day
0 10 30
Log
Cob
alt (
ug/L
)
0.01
0.1
1
*,**
*
*,**
*
*
* *

35
Figure 3.4. Log mean values ± standard error for selected metals of concern in overlying water and pore water for Suncor coke during a 30-day dissolved oxygen leaching experiment. (* denotes significant differences between overlying water and pore water, ** denotes significant differences between high and low dissolved oxygen levels).
Day0 10 30
Log
Van
adiu
m (u
g/L)
1
10
100
Overlying Water, High OxygenPore Water, High OxygenOverlying Water, Low OxygenPore Water, Low Oxygen
Day0 10 30
Log
Man
gane
se (u
g/L)
1
10
100
1000
10000
Day0 10 30
Log
Cob
alt (
ug/L
)
0.1
1
10
100
Day0 10 30
Log
Zinc
(ug/
L)
1
10
100
Day0 10 30
Log
Mol
ybde
num
(ug/
L)
1
10
100
1000Day
0 10 30
Log
Cop
per (
ug/L
)
0.1
1
10
100*
*
* *
* *
* *,**
*,**
*,**
**

36
3.3.1.1.2 pH
The pH level in the overlying water in the pH experiment were 4.88 ± 0.14 for
the pH 5, 7.95 ± 0.15 for the pH 7.5, and 9.37 ± 0.12 for the pH 10 treatment. Metal
leaching was observed at all pH levels; with the lowest pH treatment (pH 5) appearing
to have the highest concentration of metals leaching into the overlying water and pore
water when compared to the pH 7.5 and 10 treatments (Table 3.5). However, this
difference among treatments was significant for only 19% of the time with Syncrude
coke and 33% of the time with Suncor coke over the course of the 90-d experiment
(Figures 3.5 and 3.6). The exceptions to this are molybdenum and vanadium, which
leached at significantly higher concentrations in the pH 10 treatment.
The metals identified to be of particular concern during this experiment were
cobalt, copper, manganese, molybdenum, nickel, vanadium and zinc. Table 3.5 lists the
peak overlying and pore water levels measured for these metals during this experiment.
All metal concentrations measured during this experiment can be found in Appendix II.
Figures 3.5 and 3.6 show the mean values of these metals for Syncrude and Suncor
coke, respectively, over the time of the leaching experiment.
Overlying waters generally had lower concentrations of metals than the pore
waters for both Syncrude and Suncor coke. However, the metal levels in pore waters for
Suncor coke generally decreased over time, while the overlying water metal levels
tended to increase, thereby causing the metals to reach similar levels in the pore water
and overlying water by day 90 (Figure 3.6). This trend was less often observed for
Syncrude coke. Instead, the metal levels often increased and/or decreased at the same
time and rate in both the overlying and pore waters (i.e. they mimicked each other)
within the three treatments over the 90-d leaching experiment (Figure 3.5).

37
Table 3.5. Peak concentrations (µg/L) of several metals that reached levels of concern in the overlying water (leachate) and coke pore water during the pH leaching experiment: (a) Syncrude coke, (b) Suncor coke. (a) Overlying Water Pore water
Element Detection Limit pH 5 pH 7.5 pH 10 pH 5 pH 7.5 pH 10 CWQG
1 (µg/L)
LC50 for Chironomus sp. (µg/L)
Cobalt 0.01 13.1 0.6 0.2 35.5 1.1 2.8 --2 n/a Copper 0.1 2.5 2.4 1.6 1.9 1.7 2.5 3 54
3
Manganese 0.4 281.2 9.0 1.0 559.0 14.0 63.0 50 554
Molybdenum 0.1 33.6 35.7 79.1 72.1 151.6 169.5 73 3604
Nickel 1.1 258.5 19.2 7.3 497.9 37.5 55.8 25-150 2504
Vanadium 0.1 90.8 269.0 546.0 113.6 292.4 730.8 --2 240
4
Zinc 0.3 65.7 19.3 5.6 65.9 4.8 8.5 30 11253
(b) Overlying Water Pore water
Element Detection Limit pH 5 pH 7.5 pH 10 pH 5 pH 7.5 pH 10 CWQG
1 (µg/L)
LC50 for Chironomus sp. (µg/L)
Cobalt 0.01 22.6 3.6 2.0 121.3 103.7 634.0 --2 n/a Copper 0.1 7.0 6.8 1.1 32.2 4.7 29.8 3 54
3
Manganese 0.4 424.2 301.0 118.7 2343.0 3143.0 20150.0 50 554
Molybdenum 0.1 2.5 46.8 57.7 15.3 47.6 344.7 73 3604
Nickel 1.1 176.0 26.4 24.0 1025.6 923.2 5867.8 25-150 2504 Vanadium 0.1 47.0 41.0 162.9 292.6 42.1 130.1 --2
2404
Zinc 0.3 53.0 6.8 5.7 154.3 69.1 263.1 30 11253
1 Canadian Water Quality Guidelines (CCME, 2003);
2 No Canadian Guideline available;
3 (Phipps et al., 1995); 4 (Fargašová, 1997)
37
38
Figure 3.5. Log mean values ± standard error for selected metals of concern in overlying water and pore water for Syncrude coke during a 90-day pH leaching experiment. (* denotes significant differences between overlying water and pore water, a denotes significant differences between pH 5 and pH 10, b between pH 7.5 and pH 10 and c between pH 5 and pH 7.5 treatments).
Day0 45 90
Log
Van
adiu
m (u
g/L)
1
10
100
1000
Overlying W ater, pH 5Pore W ater, pH 5Overlying W ater, pH 7.5Pore W ater, pH 7.5Overlying W ater, pH 10Pore W ater, pH 10
Day0 45 90
Log
Man
gane
se (u
g/L)
0.01
0.1
1
10
100
1000
Day0 45 90
Log
Cob
alt (
ug/L
)
0.01
0.1
1
10
100
Day0 45 90
Log
Nic
kel (
ug/L
)
0.1
1
10
100
1000
Day0 45 90
Log
Cop
per (
ug/L
)
0.1
1
10
Day0 45 90
Log
Zinc
(ug/
L)
1
10
100
Day0 45 90
Log
Mol
ybde
num
(ug/
L)0.1
1
10
100
1000
*, a *, ab
ab a ab ab
abc *, abc *, a abc
*, a *, ab
*, abc *, ab *, ab
* abc abc
*, ab ab *, abc

39
Figure 3.6. Log mean values ± standard error for selected metals of concern in overlying water and pore water for Suncor coke during a 90-day pH leaching experiment. (* denotes significant differences between overlying water and pore water, a denotes significant differences between pH 5 and pH 10, b between pH 7.5 and pH 10 and c between pH 5 and pH 7.5 treatments).
Day0 45 90
Log
Van
adiu
m (u
g/L)
1
10
100
1000
Overlying Water, pH 5Pore Water, pH 5Overlying Water, pH 7.5Pore Water, pH 7.5Overlying Water, pH 10Pore Water, pH 10
Day0 45 90
Log
Man
gane
se (u
g/L)
1
10
100
1000
10000
100000
Day0 45 90
Log
Cob
alt (
ug/L
)
0.1
1
10
100
1000
Day0 45 90
Log
Nic
kel (
ug/L
)
0.1
1
10
100
1000
10000
Day0 45 90
Log
Cop
per (
ug/L
)
0.1
1
10
100
Day0 45 90
Log
Zinc
(ug/
L)
1
10
100
1000
Day0 45 90
Log
Mol
ybde
num
(ug/
L)0.1
1
10
100
1000
* *, abc abc
* ab ab
* *, abc abc
*, ab
*, abc ab
* abc *, abc *, abc
abc *, ab
*, abc *, ab
*

40
3.3.1.1.3 Freeze-thaw
Some of the metals that reached levels of concern in this experiment were
cobalt, copper, manganese, molybdenum, nickel, vanadium and zinc. Table 3.6 lists the
peak concentrations of these metals measured during the experiment in both the
overlying water and pore water. All metal concentrations recorded during this
experiment can be found in Appendix III. Figures 3.7 and 3.8 show the mean values of
these metals for Syncrude and Suncor coke, respectively, over the course of the
leaching experiment. Treatments which underwent the six freeze-thaw cycles showed
significantly higher metal concentrations than those which underwent no freezing less
than 25% of the time for both Syncrude and Suncor coke (Figures 3.7 and 3.8).
These figures show that overlying water in this experiment had, with few
exceptions, much lower concentrations of metals than pore water for both Syncrude and
Suncor coke. However, the metal levels in the pore water from Suncor coke mostly
decreased over time, while increasing in the overlying water, thereby causing the metals
to reach similar concentrations in the pore water and overlying waters by cycle 6. There
was no clear general trend for Syncrude coke. Instead, some metal levels generally
decreased in both the overlying water and pore water over the six freeze-thaw cycles
(Co, Ni), while others followed the same trends as was seen in Suncor coke (Cu, Mo).

41
Table 3.6. Peak concentrations (µg/L) of several metals that reached levels of concern in the overlying water (leachate) and coke pore water during the freeze-thaw leaching experiment: (a) Syncrude coke, (b) Suncor coke. (a) Overlying Water Pore water
Element Detection Limit Control Frozen Control Frozen CWQG
1 (µg/L)
LC50 for Chironomus sp. (µg/L)
Cobalt 0.1 0.3 5.1 0.7 1.1 --2 n/a Copper 0.03 1.1 0.9 2.7 2.7 3 54
3
Manganese 0.1 3.1 5.9 13.4 10.2 50 554
Molybdenum 0.2 70.6 42.7 144.9 225.1 73 3604
Nickel 0.2 9.1 8.3 16.9 11.2 25-150 2504 Vanadium 0.03 97.8 92.7 152.9 185.8 --2
2404
Zinc 5.2 5.3 5.1 10.1 9.3 30 11253
(b) Overlying Water Pore water
Element Detection Limit Control Frozen Control Frozen CWQG
1 (µg/L)
LC50 for Chironomus sp. (µg/L)
Cobalt 0.1 13.9 3.5 61.9 65.0 --2 n/a Copper 0.03 1.6 1.1 4.5 13.8 3 54
3
Manganese 0.1 497.4 174.3 2130.3 1823.7 50 554
Molybdenum 0.2 24.03 23.34 44.98 64.8 73 3604
Nickel 0.2 63.5 16.2 308.6 331.8 25-150 2504 Vanadium 0.03 38.5 28.8 45.7 63.4 --2 240
4
Zinc 5.2 8.1 4.4 15.3 23.1 30 11253
1 Canadian Water Quality Guidelines (CCME, 2003);
2 No Canadian Guideline available;
3 (Phipps et al., 1995); 4 (Fargašová, 1997)
41

42
Figure 3.7. Log mean values ± standard error for selected metals of concern in overlying water and pore water for Syncrude coke during a six-cycle freeze-thaw leaching experiment. (* denotes significant differences between overlying water and pore water, ** denotes significant differences between frozen and not frozen treatments).
Cycle1 3 6
Log
Van
adiu
m (u
g/L)
10
100
1000
Overlying Water, FrozenPore Water, FrozenOverlying Water, Not FrozenPore Water, Not Frozen
Cycle1 3 6
Log
Man
gane
se (u
g/L)
0.1
1
10
100Cycle
1 3 6
Log
Cob
alt (
ug/L
)
0.01
0.1
1
10
Cycle1 3 6
Log
Nic
kel (
ug/L
)
1
10
100
Cycle1 3 6
Log
Cop
per (
ug/L
)
0.1
1
10
Cycle1 3 6
Log
Zinc
(ug/
L)
1
10
100
Cycle1 3 6
Log
Mol
ybde
num
(ug/
L)10
100
1000
* * * * *
*
* *,** * *
*
*,** *,**
* *
*,** **
* *
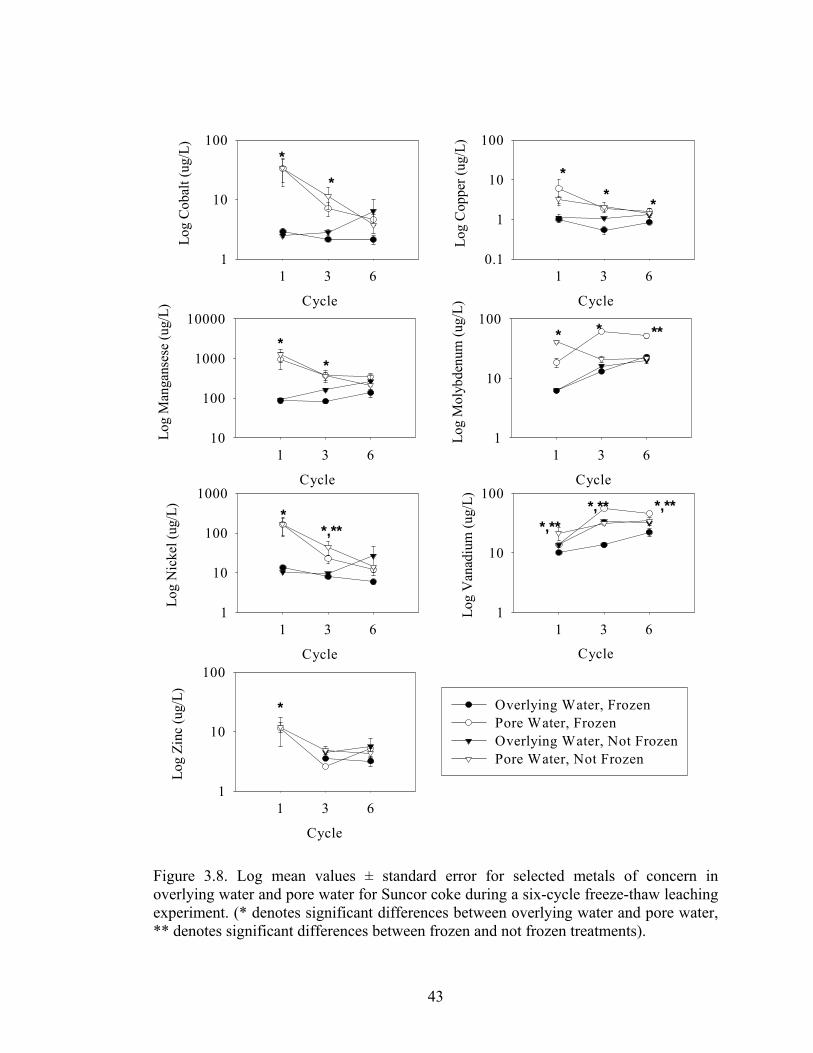
43
Figure 3.8. Log mean values ± standard error for selected metals of concern in overlying water and pore water for Suncor coke during a six-cycle freeze-thaw leaching experiment. (* denotes significant differences between overlying water and pore water, ** denotes significant differences between frozen and not frozen treatments).
Cycle
1 3 6
Log
Van
adiu
m (u
g/L)
1
10
100
Overlying Water, FrozenPore Water, FrozenOverlying Water, Not FrozenPore Water, Not Frozen
Cycle
1 3 6
Log
Man
gans
ese
(ug/
L)
10
100
1000
10000Cycle
1 3 6
Log
Cob
alt (
ug/L
)
1
10
100
Cycle
1 3 6
Log
Nic
kel (
ug/L
)
1
10
100
1000
Cycle
1 3 6
Log
Cop
per (
ug/L
)
0.1
1
10
100
Cycle
1 3 6
Log
Zinc
(ug/
L)
1
10
100
Cycle
1 3 6Lo
g M
olyb
denu
m (u
g/L)
1
10
100
*
* * *
*
* *
* * **
* *,** *,**
*,** *,**
*

44
3.3.1.2 Coke
Concentrations of metals of concern (as identified previously in the overlying
water and pore water) in Syncrude and Suncor coke can be found in Table 3.7. The
concentrations of these metals were similar between untreated coke and coke which had
been weathered during the dissolved oxygen and pH leaching experiments.
Using the values for unweathered and weathered coke from Table 3.7, mass
balance calculations were performed to assess the percentage of total metal in the coke
that had leached into the overlying water and pore water. These percentages are listed
in Table 3.8. Overall, these percentages are very small, with the majority being less
than 1%. The largest percentage (33.05%) occurred with molybdenum in Syncrude
coke weathered under pH 10 conditions.

45
Table 3.7. Peak concentrations of selected metals in untreated and weathered Syncrude (a) and Suncor (b) coke that also reached levels of concern in overlying water and pore water during the dissolved oxygen (low and high oxygen levels) and pH (5, 7.5 and 10) experiments (µg/g).
(a)
Element Untreated1 Low Oxygen
High Oxygen pH 5 pH 7.5 pH 10
Cobalt 8.3 7.5 9.0 9.1 11.2 8.7 Copper 1.4 0.8 1.0 1.1 0.7 0.9 Molybdenum 1.5 1.9 1.6 1.5 1.4 1.3 Nickel 376 462 438 438 462 446 Vanadium 1247 1297 1228 1256 1351 1280 Zinc 4 2 2 3 2 2
(b)
Element Untreated1 Low Oxygen
High Oxygen pH 5 pH 7.5 pH 10
Cobalt 7.1 8.4 7.3 6.9 7.3 7.8 Copper 3.3 2.9 2.6 2.9 2.9 2.5 Molybdenum 12.7 11.5 10.6 12.1 11.3 10.2 Nickel 315 283 291 270 297 299 Vanadium 830 863 864 812 798 890 Zinc 4 4 4 4 4 3
1Untreated coke is defined as coke that has not undergone any leaching.

46
Table 3.8. Percentages of selected metals in Syncrude (a) and Suncor (b) coke that leached into the overlying water and pore water during the dissolved oxygen (low and high oxygen levels) and pH (5, 7.5 and 10) experiments.
(a) Element Low Oxygen High Oxygen pH 5 pH 7.5 pH 10 Cobalt 0.01 0.02 0.79 0.03 0.02 Copper 0.42 0.00 0.95 0.90 0.63 Molybdenum 26.77 28.05 12.17 14.30 33.05 Nickel 0.00 0.00 0.32 0.02 0.01 Vanadium 0.32 0.26 0.04 0.11 0.23 Zinc 5.48 2.14 11.69 5.08 1.5
(b)
Element Low Oxygen High Oxygen pH 5 pH 7.5 pH 10 Cobalt 0.25 0.25 1.70 0.35 0.75 Copper 3.31 0.09 1.12 1.03 0.23 Molybdenum 1.11 1.46 0.10 1.84 2.45 Nickel 0.00 0.00 0.30 0.06 0.18 Vanadium 0.04 0.02 0.03 0.02 0.09 Zinc 2.50 0.62 6.83 0.97 1.20

47
3.3.2 Biological Endpoints
3.3.2.1 Dissolved Oxygen
There was no significant difference in either survival or growth of Chironomus
tentans larvae between the high and low dissolved oxygen treatments in the substrate +
leachate water or the leachate water only tests (Figures 3.9a and b) for either coke type.
There was a significant decrease (p < 0.005) in survival of C. tentans in the treatment
containing leached Suncor coke with its overlying leachate water, compared to both the
Syncrude coke and the leached control sand treatments with their respective overlying
waters (Figure 3.9a). There were no significant differences in survival of C. tentans
with Syncrude coke and its overlying water compared to the control sand treatment (p =
0.914). Suncor coke and its overlying leachate water resulted in a significant decrease
(p < 0.05) in C. tentans growth when compared to both the Syncrude coke and control
sand treatments (Figure 3.9b). In contrast, growth of C. tentans was significantly
greater (p < 0.05) in the treatment containing Syncrude coke and its overlying leachate
water than in both the leached control sand and the Suncor coke treatment (Figure 3.9b).
3.3.2.2 pH
There were no significant differences in C. tentans survival or growth for either
Suncor or Syncrude coke among any of the pH treatments containing leachate water
with new culture sand as a substrate from either days 45 or 90 of this leaching
experiment (Figures 3.10 and 3.11).
In the toxicity test conducted using the substrates and leachate waters from Day
45 of the leaching experiment there were no significant differences in survival of C.
tentans. There was a significant decrease (p < 0.05) in C. tentans growth in the
treatment with Suncor coke as a substrate, and a significant increase (p < 0.05) in
growth in the treatment with Syncrude coke as a substrate, when compared to the
control (Figure 3.10b). Within the Suncor coke substrate treatment, there was a
significant increase in growth in the pH 10 treatment, while within the Syncrude coke
substrate treatment there was a significant decrease in growth in the pH 10 treatment
when compared with the pH 5 and 7.5 treatments.

48
Figure 3.9. Survival (a) and growth (b) of Chironomus tentans (mean ± SE) larvae after a 10-day toxicity test with coke from Syncrude Canada Ltd. and Suncor Energy Inc. and their overlying leachate waters leached under high and low dissolved oxygen conditions for 30 days. (* denotes significant differences between each coke type and the control sand).
0
20
40
60
80
100
120Su
rviv
al (%
)
0.00
0.02
0.04
0.06
0.08
0.10
0.12
0.14
0.16
Control Syncrude Suncor Control Syncrude Suncor
Dry
Wei
ght (
mg)
High Oxygen (7.94 mg/L)Low Oxygen (0.92 mg/L)
*
*
*
(Substrate + Leachate Water) (New Sand + Leachate Water)
(a)
(b)

49
Figure 3.10. Survival (a) and growth (b) of Chironomus tentans larvae (mean ± SE) after a 10-day toxicity test with coke from Syncrude Canada Ltd. and Suncor Energy Inc. and their overlying leachate waters leached under pH 5, 7.5 and 10 for 45 days. (* denotes significant differences between each coke type and the control sand, ** denotes significant differences among pH within each substrate treatment).
*
*
(Substrate + Leachate Water) (New Sand + Leachate Water)
(a)
(b)
**
**
0
20
40
60
80
100
120
140Su
rviv
al (%
)
0.00
0.05
0.10
0.15
0.20
0.25
0.30
Control Syncrude Suncor Control Syncrude Suncor
Dry
Wei
ght (
mg)
pH 5pH 7.5pH 10
0
20
40
60
80
100
120
140Su
rviv
al (%
)
0.00
0.05
0.10
0.15
0.20
0.25
0.30
Control Syncrude Suncor Control Syncrude Suncor
Dry
Wei
ght (
mg)
pH 5pH 7.5pH 10

50
Figure 3.11. Survival (a) and growth (b) of Chironomus tentans larvae (mean ± SE) after a 10-day toxicity test with coke from Syncrude Canada Ltd. and Suncor Energy Inc. and their overlying leachate waters leached under pH 5, 7.5 and 10 for 90 days. (* denotes significant differences between each coke type and the control sand, ** denotes significant differences among pH within each substrate treatment).
0
20
40
60
80
100
120Su
rviv
al (%
)
**
0.00
0.05
0.10
0.15
0.20
0.25
Control Syncrude Suncor Control Syncrude Suncor
Dry
Wei
ght (
mg)
pH 5pH 7.5pH 10
0
20
40
60
80
100
120Su
rviv
al (%
)
**
0.00
0.05
0.10
0.15
0.20
0.25
Control Syncrude Suncor Control Syncrude Suncor
Dry
Wei
ght (
mg)
pH 5pH 7.5pH 10
*
*
*
(Substrate + Leachate Water) (New Sand + Leachate Water)
(a)
(b)

51
There was a significant decrease (p < 0.005) in survival of C. tentans in the
treatment with Suncor coke as a substrate compared to both the control sand and
Syncrude coke in the toxicity test conducted using coke and overlying waters obtained
from day 90 of the leaching experiment (Figure 3.11a). For Suncor coke, there was a
significant decrease in C. tentans survival in the pH 5 treatment when compared with
the pH 7.5 and 10 treatments. There were no significant differences in C. tentans
survival with Syncrude coke as a substrate (p = 0.568). There was a significant
decrease (p < 0.05) in C. tentans growth in the treatment with Suncor coke as a
substrate and a significant increase (p < 0.05) in growth in the treatment with Syncrude
coke as a substrate, when compared to the control (Figure 3.11b).
3.3.2.3 Freeze-thaw
There were no significant differences in survival or growth of C. tentans
between the treatments which underwent six freeze-thaw cycles, and those that did not,
for any of the substrate types. There were also no significant differences in survival or
growth of C. tentans among any of the three treatments containing only leachate water
with new culture sand (Figures 3.12a and b).
There were no significant differences in survival of C. tentans between frozen
and unfrozen samples for both coke types compared to the control sand (p = 1.00)
(Figure 3.12a). However, treatments with Suncor coke and its overlying leachate water
caused a significant decrease (p < 0.05) in C. tentans growth when compared to the
control sand treatment (Figure 3.12b). In contrast, growth of C. tentans larvae was
significantly greater (p < 0.05) in the treatments containing Syncrude coke and its
overlying leachate water when compared to the leached control sand (Figure 3.12b).

52
Figure 3.12. Survival (a) and growth (b) of Chironomus tentans (mean ± SE) after a 10-day toxicity test with coke from Syncrude Canada Ltd. and Suncor Energy Inc. and their overlying leachate waters leached for six consecutive freeze-thaw cycles. (* denotes significant differences between each coke type and the control sand, ** denotes significant differences between each treatment).
0
20
40
60
80
100
120
Surv
ival
(%)
0.00
0.05
0.10
0.15
0.20
0.25
0.30
0.35
Control Syncrude Suncor Control Syncrude Suncor
Dry
Wei
ght (
mg)
Frozen
Unfrozen
0
20
40
60
80
100
120
Surv
ival
(%)
0.00
0.05
0.10
0.15
0.20
0.25
0.30
0.35
Control Syncrude Suncor Control Syncrude Suncor
Dry
Wei
ght (
mg)
Frozen
Unfrozen
*
*
(Substrate + Leachate Water) (New Sand + Leachate Water)
(a)
(b) **
53
3.4 Discussion
3.4.1 Metal Chemistry
3.4.1.1 Water
Coke from the Syncrude Canada Ltd. operations generally released higher
concentrations of metals than coke from the Suncor Energy Inc. operations during the
three leaching experiments described here. One possible explanation for this is the
difference in particle size between the two coke types. Syncrude coke has a much
smaller particle size than Suncor coke. Therefore, there is more surface area available
for leaching to take place than for the same volume of Suncor coke.
For each leaching experiment, there was a general trend of increasing metal
concentrations in overlying water, and decreasing metal concentrations in pore water,
over time. As a result of the static test system used, this reflected the tendency towards
the establishment of equilibrium conditions between the two water phases. It is well
known that as metals are released into pore waters, they can diffuse into the less
concentrated overlying waters (Barna et al., 2005). This allows for further metal
leaching from the coke particles into the now less concentrated pore water.
It was also observed that a rapid release of metals generally occurred at the
beginning (i.e. within the first few hours) of each experiment, slowing to a lesser rate of
release during the remainder of the leaching period. This may reflect the way the
metals are bound to the coke particles. A rapid release of metals at the beginning of the
leaching period suggests that the metals are either loosely bound to the surface of the
coke particles, or they are bound within the clay particles which can contaminate the
coke after storage in the field. As soon as the coke comes in contact with water, these
loosely bound metals are released, causing a spike in water metal concentrations, as
seen in the leaching experiments described here.
Well-aerated soils are characterized by redox potentials of +400 mV or greater,
whereas waterlogged stagnant soils have redox potentials as negative as -300 mV
(Carbonell et al., 1999). Some metals leached to reach higher mean concentrations in

54
the treatment with low dissolved oxygen in the dissolved oxygen leaching experiment.
In previously conducted research looking at the distribution of dissolved metals in
contaminated sediments, Mn and Zn were shown to be released to the water column
under oxygen reduced conditions (Sokolowski et al., 2001; Charlatchka and Cambier,
2000). Soil oxidation conditions also influence soil pH, a major factor influencing
metal chemistry. As oxidized soils are flooded and become anaerobic or reducing, the
pH tends to converge toward 7 (neutrality), favoring metal immobilization (Gambrell,
1994).
Sulphuric acid as chosen to adjust pH in this study because it is commonly
found in acid mine drainage, due to the oxidation of sulphides, and it is a main acid
present in acid rain, due to the oxidation of SO2 (Ribeiro et al., 2000). Like hardness
ions, H+ ions compete with trace metals at binding sites. Therefore, at low pH more
protons are available for binding and fewer metal ions will be bound to sites on cell
surfaces. An increase in pH not only reduces the proton concentration, but also alters
metal speciation distribution leading to a decrease in free metal ion concentration. This
metal fraction is generally considered to be the most bioavailable form for most metals
(Heijerick et al., 2003).
Trace metal solubility as a function of pH is directly related to pH-controlled
dissolution and desorption processes causing a shift to the free metal ion. These can
involve initially present sediment phases and/or phases formed during subsequent
drainage and oxidation of the sediment (Singh et al., 2000). Previous studies have
shown that the water solubility of metals increases sharply when the pH decreases from
pH 6-7 to pH 1-5 (Dudka and Adriano, 1997). It has been suggested that the dissolution
of CaCO3 contributes the metal release from the sediments under these acidic conditions
(Zhang et al., 2002).
It has been reported that the best estimate of the potential leachability of Co,
Mn, Ni and Zn can be found in acid-extractable fractions (pH 4) (Singh et al., 2000).
While decreasing media pH will dramatically increase the concentrations of some
metals in leachates, it has not been shown to strongly affect Cu concentrations
(Sukreeyapongse et al., 2002; Singh et al., 2000; Sawhney et al., 1995). This is

55
possibility due to the formation of soluble Cu complexes with dissolved organic matter
(Sawhney et al., 1995). Copper, and to a lesser extent lead, are capable of forming
complexes with organic matter and these complexes remain stable even below pH 3
(Singh et al., 2000).
In the pH leaching experiment, the majority of metals (except for V and Mo)
leached to a greater extent under low pH conditions (i.e. pH 5). This correlates with
previous findings where lower pH levels in overlying waters have been shown to
increase leaching and therefore availability of trace metals in an aqueous environment
(Chirenje and Ma, 1999; Horne and Dunson, 1995). A study conducted by Wickham et
al. (1987) found that the soluble concentrations of Cu, Mn and Zn were all significantly
higher in overlying water of an acidic pond when compared to the overlying water of a
similar alkaline pond. It is possible that in an oil sands reclamation situation the
overlying waters will have pH levels as low as 6 (Golder Associates Ltd., 2000).
Therefore, the implications of releasing coke into waters with an acidic pH present a
legitimate concern for possible reclamation programs at the Alberta oil sands.
Two of the exceptions to these observations are molybdenum and vanadium,
which leached to higher concentrations at pH 10 instead of at pH 5. Influenced by pH,
molybdenum, an essential trace element, will remain in solution at pH > 5, but forms
complexes with Fe and Al at pH < 5, thereby promoting the bioavailable fraction in
alkaline solutions (CCME, 2003). Solutions with moderate to weak acidity (pH 2-5)
have also been shown to extract very little vanadium (Jack et al., 1979; Tyler, 1978). In
a strong aqueous alkali solution, vanadium is in the form VO43- (vanadium V), while in
an acidic solution, it is in the form VO2+ (vanadium IV) (Greenwood and Earnshaw,
1997). Vanadium IV is a hard Lewis acid and has a strong tendency to coordinate with
oxygen donor atoms. It is therefore capable of both forming strong complexes with
soluble organic chelates and becoming specifically adsorbed to particles, thereby
reducing its solubility and consequent availability in water at low pH levels (Wehrli and
Strumm, 1989).
Frozen treatments were shown to leach a greater concentration of metals than
not frozen treatments less than 25% of the time for both Syncrude and Suncor coke. It
56
is known that contaminants in a large volume of dilute waste water can be concentrated
into a smaller volume by freezing. When water freezes, ice crystals grow from pure
water and impurities (or contaminants) are rejected from the ice structure and become
concentrated in the remaining liquid phase which can be separated and subsequently
treated or disposed of. (Gao et al., 2004). Although no clear conclusion can be reached
on the effects of freezing on the leachability of coke from this study, the possibility of
overlying water and pore water containing toxicologically relevant metal concentrations
is still pertinent.
3.4.1.2 Coke Elemental Chemistry
The concentrations of trace metals found in the coke itself did not appear to
change substantially with any of the weathering treatments (i.e. DO, pH and freeze-
thaw). Some of the minute changes which did occur could likely be attributed to natural
variation in the coke which reflects the natural variations in the starting oil sand
material. Mass balance calculations conducted on the overlying water and pore water
from the dissolved oxygen and pH weathering experiments showed that only a very
small amount (~1%) of the overall metal in the coke actually leached into the overlying
water and pore water. These metal leaching percentages are too small to show up as
changes in the coke itself. Therefore, the majority of the metals are either bound tightly
within the coke matrix, or they are attached to the coke surface in such a way as to be
unavailable using the weathering techniques and durations employed in these
experiments.
3.4.2 Toxicity of Coke and its Leachates
There were no significant differences in survival and growth of C. tentans for
any of the treatments containing only leachate water with new culture sand for any of
the three leaching experiments. This shows that the leachate water itself was not toxic
to C. tentans. Therefore, the amount of metals leaching into the overlying and pore
waters in these experiments had no measurable detrimental effects on C. tentans over
10-d exposures.

57
Some effects on the survival and growth of C. tentans larvae were expected
since the peak levels of copper, manganese, molybdenum, nickel, vanadium and zinc in
the overlying water and/or pore water of the leaching experiments conducted in this
chapter exceeded either published LC50 data for Chironomus sp., or the Canadian Water
Quality Guidelines (CWQG) for the protection of aquatic life. However, the CWQGs
are meant to protect all forms and stages of aquatic life, and are based on the most
sensitive species at its most sensitive life stage (CCME, 2003). Organisms which are
commonly used in the derivation of these guidelines are crustaceans, such as Daphnia
magna and Hyallea azteca, and algae. Consequently, these guidelines are not
necessarily representative of threshold values for C. tentans. In addition, these
guidelines also employ a safety factor to account for differences among species and
environments. For example, the guideline for molybdenum was derived by multiplying
the lowest chronic toxicity value (for Oncorhynchus mykiss) by a safety factor of 0.1
(CCME, 2003).
There were several differences between the studies conducted to generate the
referenced LC50 data, and the toxicity experiments described in this thesis, which may
account for this discrepancy in toxicity. In the study conducted by Phipps et al. (1995),
sample size was not constant since some of the replicates contained only five C. tentans
for each exposure. The present study consistently used ten animals per replicate. Using
fewer animals per replicate can decrease the reliability of test results since a lower
statistical power is associated with a smaller sample size (Zar, 1999).
The study conducted by Fargašová (1997) used a different species (C. plumosus)
which were acquired from the field. Although the author kept a constant length (2.5
cm) among the animals, there is no guarantee that each animal was the same age, as
was possible in the present study where the animals are raised directly from hatch. The
experiments conducted by Fargašová (1997) were also 96 h exposures, and the solutions
were not aerated or fed throughout the test. These factors should also be considered
when comparing this study to the present one where the exposures were 10 d in length,
with constant aeration and feeding once per day as per the Environment Canada (1997)
protocol. It is possibly that the toxicity observed in the Fargašová (1997) study was

58
compounded with effects of decreased food availability and dissolved oxygen (not
measured).
Differences in toxicity to C. tentans between the studies conducted by Fargašová
(1997), Phipps et al., (1995), and the present one may also reflect differences in the
bioavailability of the metals in the test waters. The leachate waters in the present study
were adjusted to mimic the higher hardness and alkalinity of the surface water found in
the oil sands area, before being added to the coke leaching jars (hardness 204.0 ± 3.4
mg/L CaCO3, and alkalinity 194.7± 10.1 mg/L CaCO3). Increased hardness and
alkalinity can reduce the bioavailability, uptake and toxicity of metals to C. tentans
through two mechanisms: (a) competitive inhibition between calcium, magnesium and
other metals at the metal binding and transport sites on cell surfaces, and/or (b)
complexation of metals with carbonate, resulting in a decrease of the free hydrated
metal ion activity (Barata et al., 1998). These mechanisms may increase the potential
for coke to be used as an aquatic reclamation amendment at the oil sands operations,
since the presence of naturally higher hardness in this area may help reduce the
bioavailability and consequent potential toxicity of some metals to aquatic organisms.
A study conducted assessing the LC50 values for H. azteca in both soft and hard
water for a variety of metals found that cobalt, copper and nickel were four, three and
two times less toxic, respectively, in hard water (Borgmann et al., 2005). Vanadium
and zinc have also been previously shown to be less lethal in harder water (Holdway
and Sprague, 1979; De Schamphelaere and Janssen, 2004b; Heigerick et al., 2003).
Since the potential toxicity of the metals identified to be of concern in this study can be
affected by water hardness, this factor should be taken into consideration when
assessing the potential for coke to act as a substrate amendment in an aquatic
reclamation strategy in areas with naturally occurring higher hardness, such as the oil
sands.
No significant differences in survival and growth of C. tentans were found
among treatments for any of the substrate types (control sand, Syncrude coke and
Suncor coke) in either the dissolved oxygen or freeze-thaw experiment. However, there
were some significant decreases in survival and growth among treatments in the pH
leaching experiment. Using leachate water and substrates from Day 45 of the pH
59
leaching experiment, there was a significant decrease in C. tentans growth in the
Syncrude coke substrate treatment. Chironomus larvae have been documented to
accumulate more metals and other elements when the acidity of the water is higher (de
Bisthoven et al., 2004). Changes in pH have also been shown to influence the
metabolism of daphnids, as well as affecting both the speciation of the metals in an
aqueous medium and their solubility (Seco et al., 2003). Therefore, out of the three
weathering treatments tested here (dissolved oxygen, pH and freeze-thaw), pH seemed
to have the greatest potential to influence the toxicity of coke in an aquatic reclamation
program.
Significant decreases in C. tentans survival and growth were found in treatments
containing leached Suncor coke with its corresponding overlying water in all of the
three leaching experiments. It is unlikely that this result is due to the release of metals
or other potential toxicants into the overlying and pore waters since corresponding
effects were not seen in treatments with Syncrude coke as a substrate, or in
corresponding leachate only treatments. Instead, this result may be due to differences in
the physical properties of Syncrude and Suncor cokes.
Macroinvertebrates such as C. tentans need to build tubes/burrows in or on the
sediment/substrate in order to successfully feed, breathe and protect themselves from
predation (Pinder, 1995; Hare et al., 2001). They do this by pumping water through
their burrows, thus increasing the levels of dissolved oxygen and moving edible
particulate matter. In treatments containing Suncor coke as the substrate, C. tentans
may have had difficultly building their tubes due to the larger particle size of Suncor
coke. Therefore, the general stress created by a deficiency in oxygen and/or food due to
their inability to construct proper tubes may have caused a significant decrease in both
survival and growth of C. tentans in the Suncor treatments.
3.5 Conclusions
There were few differences in the leaching capabilities of coke under different
water quality conditions (dissolved oxygen, pH and freeze-thaw cycles). However, the
treatment which showed the greatest influence on metal leaching from coke was pH. In
the pH leaching experiment, the majority of metals considered here leached to a greater
60
extent at low pH levels. This, in turn, may increase the availability of trace metals once
coke is placed in an acidic, aqueous environment. It is recommended that this variable
be monitored in future studies to better assess its potential impact on the leachability of
coke in an aquatic reclamation wetland.
The observed leaching rates for some elements from the pore water to the
overlying water showed that Syncrude and Suncor cokes have the potential to present a
certain degree of toxicological hazard to the environment they come in contact with.
However, it is unknown at this point whether the metals leaching into the pore and
overlying waters are coming from inside the coke matrix, from the coke surface, or even
from debris that contaminate the coke as a result of storage in the field (e.g. clay or
detrital particles). Further leaching studies should focus on determining the origin of
the metals leaching from the coke in order to better assess the potential leaching hazard
of coke as a sediment amendment in an aquatic reclamation project.
The results from the leaching experiments described here showed that Syncrude
coke has the potential to pose a toxicological hazard through the leaching of toxic
constituents once placed in an aquatic environment. However, despite this greater
potential for toxicity, no significant toxic effects were seen in any of the bioassay tests.
Instead, a significant positive effect on growth was seen in the treatments containing
Syncrude coke as a substrate. Therefore, either the compounds released into the
leachate waters from Syncrude coke are not in a biologically active form, or the test
animals used in these experiments were able to tolerate the observed exposure
concentrations.
In these experiments, Suncor coke had a significant negative effect on C. tentans
survival and growth. However, since these reductions were not seen in treatments
containing leachate without the presence of Suncor coke as a substrate, it can be
concluded that these effects were due to the presence and physical properties of the
coke itself, rather than any toxic constituents leaching from the coke into the overlying
water. Since Suncor coke has a much larger particle size than Syncrude coke, it is
possible that this inhibited the growth and survival of C. tentans during the bioassays.
Therefore, it is necessary to conduct experiments which will address this difference in
61
coke particle size in order to draw a conclusion on the potential risk of using Suncor
coke in an aquatic reclamation strategy.
Differences in species behaviour, lifestyle, and physiology can contribute to
different sensitivities to contaminants among species (Milani et al., 2003). Hyallea
azteca has been found to be more sensitive to metals than C. tentans in water-only
exposures (Phipps et al., 1995). Organism physiology plays an important role in their
sensitivities to metals. Chironomid larvae have been shown to regulate the
accumulation of copper, nickel and zinc in their tissues through the utilization of metal-
binding proteins such as metallothioneins (Suedel et al., 1996). Therefore, knowledge
of the sensitivities of different species is imperative when evaluating the possible
sources(s) and potential for sediment toxicity (Milani et al., 2003).
The discrepancies between conclusions drawn from the chemical data (i.e. metal
leaching) and the biological data (i.e. growth and survival of C. tentans) limit our ability
to draw definite conclusions about the risk of using oil sands coke as a substrate
amendment in an aquatic reclamation strategy. Therefore, it is recommended that a test
species, such as a crustacean, which has been shown to be more sensitive to metals than
C. tentans, be used to better asses the impacts of placing coke in an aquatic
environment. To further increase the significance of this test, a more sensitive endpoint
(i.e. reproduction) should be evaluated rather than growth and survival as was used in
the present study.
It is also recommended that longer term weathering/leaching studies be
conducted simulating the greater amount of waste material that would be used in the
construction of an aquatic reclamation wetland. The increased volume of waste material
could change the dynamics of the leachability of coke and long-term leaching studies
will provide a clearer picture on the chronic leaching rates of metals found in Syncrude
and Suncor coke into overlying water and pore water
.
62
4. USE OF MICROSCOPY TECHNIQUES TO EVALUATE PHYSICAL
DIFFERENCES IN WEATHERED VERSUS NON-WEATHERED COKE
4.1 Introduction
Oil sands, also known as tar sands or bituminous sands, are sand deposits
impregnated with dense, viscous petroleum called bitumen. The two major companies
currently mining oil sands in Northern Alberta, Canada, are Suncor Energy Inc. and
Syncrude Canada Ltd. A major waste product produced during the process of
upgrading bitumen to crude oil is coke. Over 2,000 tonnes of coke are produced per
day per oil sands operation (Chung et al., 1996).
Suncor Inc. uses a delayed coking process, which is a ‘batch by batch’
procedure with each coker unit containing a heater and a pair of drums. Bitumen is
introduced into the drums and is progressively heated, cracking the molecules into
vapors and solid coke. The coke is deposited in the drum with the lighter molecules,
produced in the form of vapor, condensing to be separated and processed in
fractionation facilities. Syncrude Canada Ltd. uses an unconventional continuous fluid
coking system, which involves the use of both a reactor and burner. Preheated bitumen
is sprayed onto a preheated hot coke bed in the reactor, which causes the heavy
molecules to crack, producing light molecules and more fluid coke. As at Suncor, the
vapors are fractionated and separated by distillation for consumption.
The structure of petroleum coke is a direct result of how it is formed and how it
behaves during the coking process, and is fundamental to the understanding of its fate
and behaviour when it is released into the environment for storage and/or reclamation
purposes. Coke by nature contains a high amount of organic carbon. The additional
input of organic carbon is useful for the timely development of sustainable wetlands on
old oil sands leases where organic matter is not very abundant. The abundance of coke,
and its high percentage of organic carbon, makes it an attractive option for use as a
63
substrate amendment in aquatic reclamation processes at the Alberta oil sands.
Coke is essentially a heterogeneous substance for which the chemical structure
has not yet been clearly established. Its structure is also largely dependent on the
starting material (i.e. bitumen) (Scott and Fedorak, 2004). Therefore, due to the natural
variations present in unprocessed, mined oil sands, the structure of coke is not identical
between batches and over time.
As an unwanted by-product, coke contains many different potentially toxic
constituents. The concentrations and types of these constituents depend on what is
present in the starting material, bitumen. They typically include many heavy metals
which tend to be concentrated in the coke waste product during the coking process
(Scott and Fedorak, 2004). Currently, coke is stored in large cells dug during the initial
mining process, or stored on site in large piles. These practices cause the coke to
become “contaminated” with particles (such as clay and silica) from the surrounding
environment during storage. These particles have the potential to influence the
weathering of coke or the release of toxic constituents in an aquatic reclamation
strategy.
Presently, it is poorly known how the environmental weathering of coke changes
its physical structure. The primary objective of the work described here was to
determine if the physical structure and/or surface appearance of both Syncrude and
Suncor coke change over time when weathered (for 30 to 90 d) under an overlying layer
of water. If changes were observed, the secondary objective was to consider whether
these changes could have the potential to affect the toxicity of coke and coke leachates
when placed in a long-term aquatic reclamation strategy.
4.1.1 What is Polarized Light Microscopy?
Polarized light microscopy can be used to analyze both the texture and
morphology of any layered structure at the micron range. From this, information on the
thermal history and mechanism of formation of a coke sample can be obtained (Skoog
et al., 1998). In this technique, a beam of unpolarized light moving in the x direction
has an electric field associated with it that comprises the entire y-z plane. Through
cross polarization, a light source can be generated that gives rise to an electric field in
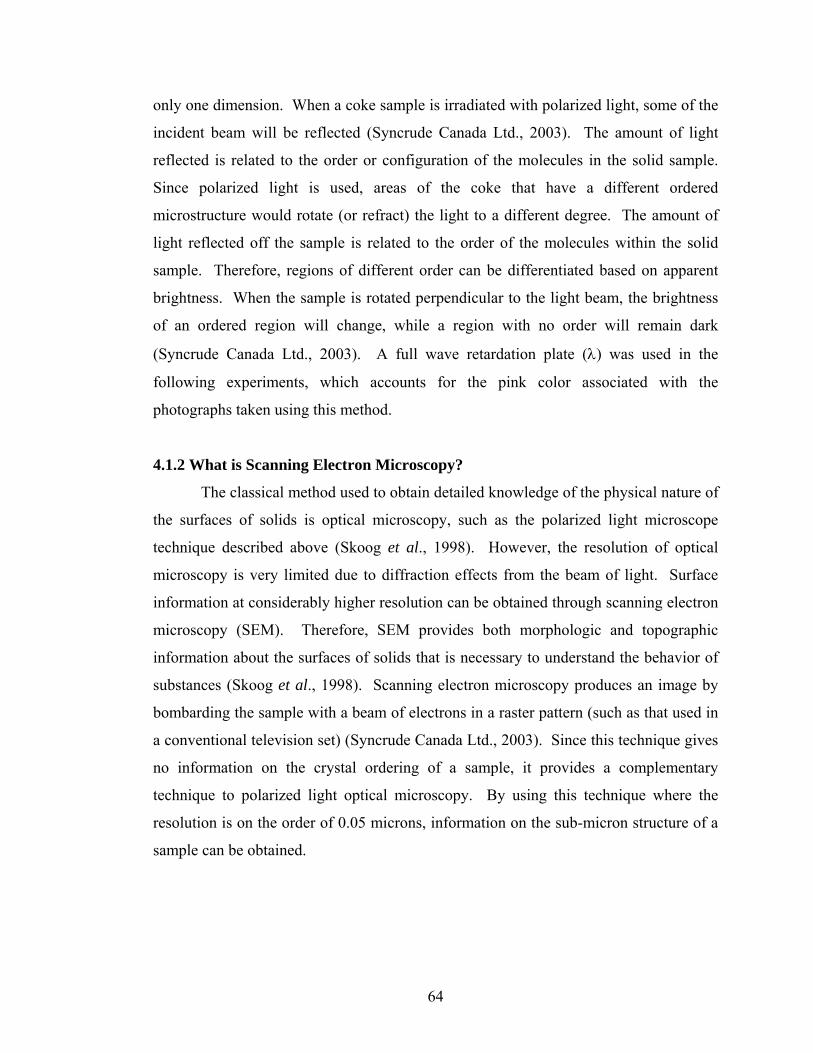
64
only one dimension. When a coke sample is irradiated with polarized light, some of the
incident beam will be reflected (Syncrude Canada Ltd., 2003). The amount of light
reflected is related to the order or configuration of the molecules in the solid sample.
Since polarized light is used, areas of the coke that have a different ordered
microstructure would rotate (or refract) the light to a different degree. The amount of
light reflected off the sample is related to the order of the molecules within the solid
sample. Therefore, regions of different order can be differentiated based on apparent
brightness. When the sample is rotated perpendicular to the light beam, the brightness
of an ordered region will change, while a region with no order will remain dark
(Syncrude Canada Ltd., 2003). A full wave retardation plate (λ) was used in the
following experiments, which accounts for the pink color associated with the
photographs taken using this method.
4.1.2 What is Scanning Electron Microscopy?
The classical method used to obtain detailed knowledge of the physical nature of
the surfaces of solids is optical microscopy, such as the polarized light microscope
technique described above (Skoog et al., 1998). However, the resolution of optical
microscopy is very limited due to diffraction effects from the beam of light. Surface
information at considerably higher resolution can be obtained through scanning electron
microscopy (SEM). Therefore, SEM provides both morphologic and topographic
information about the surfaces of solids that is necessary to understand the behavior of
substances (Skoog et al., 1998). Scanning electron microscopy produces an image by
bombarding the sample with a beam of electrons in a raster pattern (such as that used in
a conventional television set) (Syncrude Canada Ltd., 2003). Since this technique gives
no information on the crystal ordering of a sample, it provides a complementary
technique to polarized light optical microscopy. By using this technique where the
resolution is on the order of 0.05 microns, information on the sub-micron structure of a
sample can be obtained.

65
4.2 Materials and Methods
4.2.1 Sample Selection
The samples analyzed under both polarized light and scanning electron
microscopy were selected from previously conducted dissolved oxygen and pH
weathering experiments (see Chapter 3). Samples were chosen to represent different
amounts and types of weathering, in order to generate a structural comparison between
unweathered and weathered coke types. The types of samples chosen for these analyses
are described in Table 4.1.
Prior to analysis, the coke pore water was removed by vacuum filtration and
each sample was dried in an air oven at 60 ºC overnight to ensure that no water
remained, which would cause interference with the sample preparation for the polarized
light microscope method. Each sample underwent further preparation at the Syncrude
Canada Ltd. Research Centre located in Edmonton, AB, Canada, before analysis using
polarized light and scanning electron microscopy techniques.

66
Table 4.1. Origin of chosen Syncrude Canada Ltd. and Suncor Energy Inc. coke samples analyzed under polarized light and scanning electron microscopy techniques.
Syncrude Canada Ltd. Coke Suncor Energy Inc. Coke
Unweathered Syncrude coke, from the coke piles (starting material)
Unweathered Suncor coke, from the coke piles (starting material)
Weathered Syncrude coke, exposed to water with a low dissolved oxygen level (~ 1 mg/L) for 30 days
Weathered Suncor coke, exposed to water with a low dissolved oxygen level (~ 1 mg/L) for 30 days
Weathered Syncrude coke, exposed to water with a high dissolved oxygen level (~ 8 mg/L) for 30 days
Weathered Suncor coke, exposed to water with a high dissolved oxygen level (~ 8 mg/L) for 30 days
Weathered Syncrude coke, exposed to water at pH 5 for 45 days
Weathered Suncor coke, exposed to water at pH 5 for 45 days
Weathered Syncrude coke, exposed to water at pH 7.5 for 45 days
Weathered Suncor coke, exposed to water at pH 7.5 for 45 days
Weathered Syncrude coke, exposed to water at pH 10 for 45 days
Weathered Suncor coke, exposed to water at pH 10 for 45 days
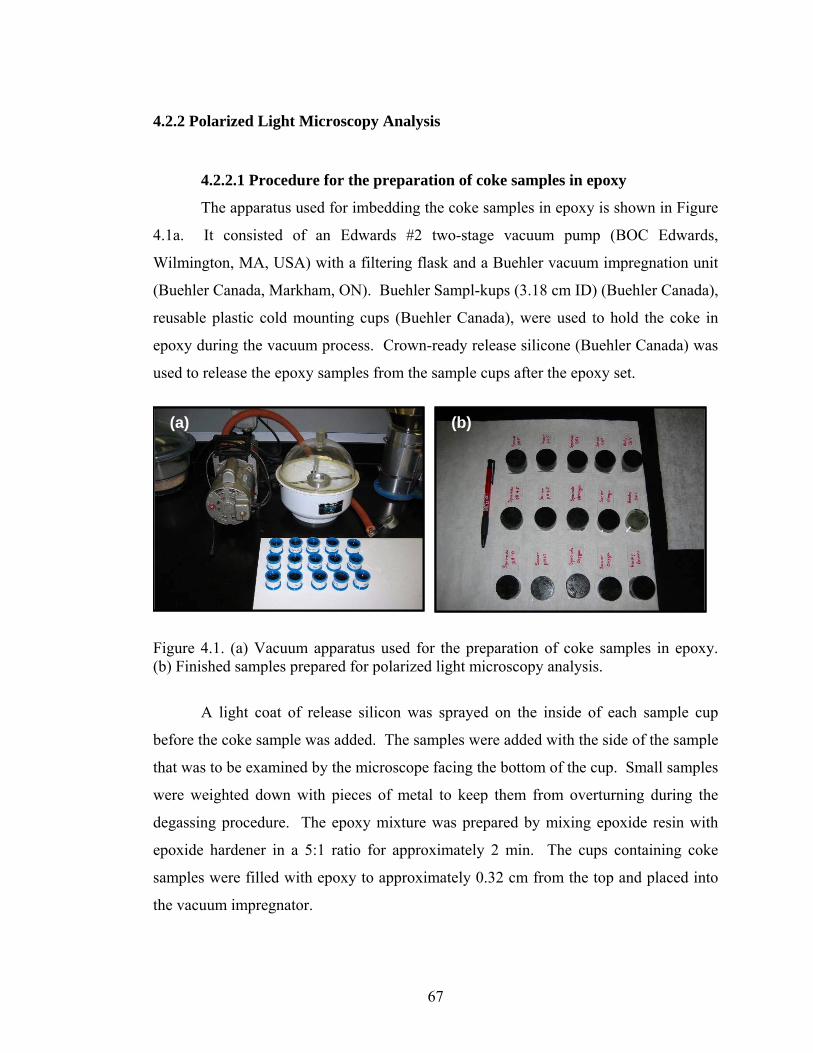
67
4.2.2 Polarized Light Microscopy Analysis
4.2.2.1 Procedure for the preparation of coke samples in epoxy
The apparatus used for imbedding the coke samples in epoxy is shown in Figure
4.1a. It consisted of an Edwards #2 two-stage vacuum pump (BOC Edwards,
Wilmington, MA, USA) with a filtering flask and a Buehler vacuum impregnation unit
(Buehler Canada, Markham, ON). Buehler Sampl-kups (3.18 cm ID) (Buehler Canada),
reusable plastic cold mounting cups (Buehler Canada), were used to hold the coke in
epoxy during the vacuum process. Crown-ready release silicone (Buehler Canada) was
used to release the epoxy samples from the sample cups after the epoxy set.
Figure 4.1. (a) Vacuum apparatus used for the preparation of coke samples in epoxy. (b) Finished samples prepared for polarized light microscopy analysis.
A light coat of release silicon was sprayed on the inside of each sample cup
before the coke sample was added. The samples were added with the side of the sample
that was to be examined by the microscope facing the bottom of the cup. Small samples
were weighted down with pieces of metal to keep them from overturning during the
degassing procedure. The epoxy mixture was prepared by mixing epoxide resin with
epoxide hardener in a 5:1 ratio for approximately 2 min. The cups containing coke
samples were filled with epoxy to approximately 0.32 cm from the top and placed into
the vacuum impregnator.
(a) (b)(a) (b)

68
The vacuum impregnator was placed under full vacuum in order to draw out any
air bubbles in the epoxy that could interfere with the microscopy analysis. Air was
leaked into the system only if the air bubbles began to spill over the edge of the cups.
The cups were kept under full vacuum for approximately 5 min after the bubbling had
stopped to ensure that all voids in the coke samples were filled with epoxy. The
samples were allowed to sit overnight to dry at room temperature. After drying, each of
the samples were removed from the cups one at a time and the sample identification
number was marked on the side of the epoxy mount using an engraver.
4.2.2.2 Procedure for the polishing of coke samples
Any surface irregularities on the topside of the epoxy-impregnated samples were
ground off using a Buehler Automet #2 power head with an Ecomet #3 variable speed
grinder-polisher and a 80-grit belt surfacer (Buehler Canada, Markham, ON). This was
done to make mounting of the sample for the microscopical work easier and to remove
any sharp edges. The samples were then polished following the sequence listed in
Table 4.2, with the power head rotated clockwise and the polisher/grinder rotated
counter clockwise. Once the samples were removed, clean dry air was blown across the
face of each of the samples to thoroughly remove any water that may have been present
in the pores or openings of the sample. This also eliminated any water spots, which may
have hindered the microscopical examination. Each coke sample was mounted by
attaching plasticine to the back of each sample, before attaching it to one end of a
microscope slide. The samples were then pressed onto the slide with a press, and any
excess plasticine was removed. Polished samples are shown in Figure 4.1b.
4.2.2.3 Procedure for microscopic analysis of coke samples
The microscope used in the polarized light analysis was a Zeiss Axioplan (Carl
Zeiss Canada Ltd., Toronto, ON) cross-polarized, λ plate, 50X-oil immersion
microscope. The associated computer was set up and calibrated before immersion oil
was placed on the sample surface. The entire sample was first examined to determine if
it was consistent, and then a representative area was selected and photographed.

69
Table 4.2. Sample-polishing sequence used to prepare coke samples for analysis using polarized light microscopy1.
Abrasive disc Polishing cloth Time/Comments Water Pressure
(psi) Speed (rpm)
120 grit None 2 min 30 sec, until samples are flat and can be seen in the mount. On 15 120
240 grit None 2 min 30 sec. On 15 120 320 grit None 30 sec. On 15 120
400 grit None 30 sec. On 15 120
600 grit None 30 sec. On 15 120
Metadi Supreme Polycrystalline Diamond polishing suspension, 6 micron
Texmet
2 min, spray diamond suspension every 5 sec for 1 min 40 sec and then rinse for 20 sec. The samples were sonified using a Cole-Parmer #8853 sonifier for 2 min in a 20% mixture of ultramet sonic cleaning solution.
Off 15 120
Metadi Supreme Polycrystalline Diamond polishing suspension, 3 micron
Texmet 2 min, spray diamond suspension every 5 sec for 1 min 40 sec and then rinse for 20 sec. Sonify the samples for 2 min.
Off 15 120
Metadi Supreme Polycrystalline Diamond polishing suspension, 1 micron
Mastertex 2 min, spray diamond suspension every 5 sec for 1 min 40 sec and then rinse for 20 sec. Sonify the samples for 2 min.
Off 15 120
Mastermet 2 Colloidal silica, 0.06 micron Mastertex
2 min, drip colloidal silica suspension every 5 sec for 1 min 40 sec and then rinse for 20 sec. Sonify for 2 min using deionized water only.
Off 15 120
1 All materials from Buehler Canada, Markham, ON.
69

70
4.2.3 Scanning Electron Microscopy Analysis
Before preparation for analysis under the SEM, several small subsamples of
coke from each treatment were collected and distributed on weigh paper. This coke was
then examined under a light microscope and subsamples that appeared to be
representative of the entire sample were chosen for SEM analysis.
The undersides of the aluminum mounts (aluminum specimen mounts, polished,
SPI Supplies, West Chester, PA, USA) used for preparation of the coke samples for
examination in the SEM were first labeled. A carbon conductive tab (25 mm) (Pelco
International, Redding, CA, USA) was then placed onto the top of the mounts. A
portion of the coke subsample was stuck to the carbon tab on the mount, and then
examined under the light microscope to determine if the sample had adequately adhered
to the carbon tab. For larger particles (i.e. Suncor coke), two drops of carbon paint
(conducting graphite paint, Soquelec Ltd., Montreal, QC) were placed on the mount
before applying the particle(s), and the samples allowed to sit until dry.
The samples were analyzed using a Hitachi S2500 Scanning Electron
Microscope (Hitachi High Technologies Canada Inc., Rexdale, ON) with an Oxford
Instruments INCAx-sight (Model 6074) energy dispersant system (Oxford Instruments,
Ottawa, ON) at the Syncrude Canada Ltd. Research Centre in Edmonton, AB. The
resolution of the SEM S2500 was 3.5 nm. A photograph was taken of a representative
area of each of the coke samples.

71
4.3 Results
Figures 4.2 to 4.5 show selected images of Syncrude and Suncor coke as
photographed under the polarized light microscope. These examples were chosen based
on the clarity of the image, and how well they illustrated the general effects observed in
the weathered coke. Table 4.3 summarizes the results of both Syncrude and Suncor coke
as analyzed under both polarized light and scanning electron microscopy.
Syncrude coke had a very organized, layered, onion-like structure, which is
clearly shown using the polarized light technique (Figure 4.2). There appeared
(qualitatively) to be a greater amount of fractured coke particles observed in weathered
compared to unweathered Syncrude coke. This fracturing consisted of pieces that
seemed to have broken off around the edges of a coke particle, but still remained
associated with the original coke particle (as shown in Figure 4.3). Weathered
Syncrude coke seemed to exhibit a similar amount of fracturing for all five weathered
treatments when compared to unweathered Syncrude coke (Table 4.3).
There appeared to be no visible difference in the microscopic structure of
Suncor coke among treatments. Suncor coke exhibited no particle definition using the
polarized light microscope technique (Figures 4.4 and 4.5). However, there were a
variety of colours (e.g. darker purples and turquoise) obtained for Suncor coke. This
assortment of colours was not displayed in Syncrude coke, meaning that the ordering of
the two coke types was quite different.
Figures 4.6 to 4.9 show examples of Syncrude and Suncor coke as analyzed
using SEM. No differences were visible between weathered and unweathered
treatments for either coke type using this method. However, several general
observations about each coke type were noted. First, Suncor coke was observed to be
more porous, with a sponge-like texture on the coke surface (Figure 4.8). Suncor coke
was also “chunky” in shape with sharp edges throughout the particles. In contrast,
Syncrude coke did not contain any visible pores and had a more spherical structure with
a bumpy surface (Figure 4.6).

72
Table 4.3. Observations of Syncrude Canada Ltd. and Suncor Energy Inc. coke samples analyzed by polarized light and scanning electron microscopy techniques.
Polarized Light Microscopy Scanning Electron Microscopy Treatment Syncrude Coke Suncor Coke Syncrude Coke Suncor Coke
Unweathered A very organized, layered, onion-like structure, majority of particles seem to be intact.
No particle definition, but there were a variety of colours not observed when examining Syncrude coke.
No visible pores with a spherical structure with a bumpy surface.
Porous, with a sponge-like texture on the surface, also “chunky” in shape with sharp edges throughout the particles.
Low Dissolved Oxygen (30 d)
Increased fracturing of particles compared to unweathered Syncrude coke.
No visible difference in microscopic structure of Suncor coke between treatments.
No visible difference in microscopic structure of Syncrude coke between treatments.
No visible difference in microscopic structure of Suncor coke between treatments.
High Dissolved Oxygen (30 d)
Increased fracturing of particles compared to unweathered Syncrude coke.
No visible difference in microscopic structure of Suncor coke between treatments.
No visible difference in microscopic structure of Syncrude coke between treatments.
No visible difference in microscopic structure of Suncor coke between treatments.
pH 5 (45 d) Increased fracturing of particles compared to unweathered Syncrude coke.
No visible difference in microscopic structure of Suncor coke between treatments.
No visible difference in microscopic structure of Syncrude coke between treatments.
No visible difference in microscopic structure of Suncor coke between treatments.
pH 7.5 (45 d) Increased fracturing of particles compared to unweathered Syncrude coke.
No visible difference in microscopic structure of Suncor coke between treatments.
No visible difference in microscopic structure of Syncrude coke between treatments.
No visible difference in microscopic structure of Suncor coke between treatments.
pH 10 (45 d) Increased fracturing of particles compared to unweathered Syncrude coke.
No visible difference in microscopic structure of Suncor coke between treatments.
No visible difference in microscopic structure of Syncrude coke between treatments.
No visible difference in microscopic structure of Suncor coke between treatments.
72

73
Unweathered Syncrude Coke Weathered Syncrude Coke
Unweathered Suncor Coke Weathered Suncor Coke
Figure 4.3. A sample of Syncrudecoke weathered for 45 days at pH 7.5 as seen under a polarized light microscope, 50X, oil immersion.
Figure 4.2. A sample of unweatheredSyncrude coke as seen under a polarized light microscope, 50X, oil immersion.
Figure 4.4. A sample of unweathered Suncor coke as seen under a polarized light microscope, 50X, oil immersion.
Figure 4.5. A sample of Suncor coke weathered for 45 days at pH 7.5 as seen under a polarized light microscope, 50X, oil immersion.
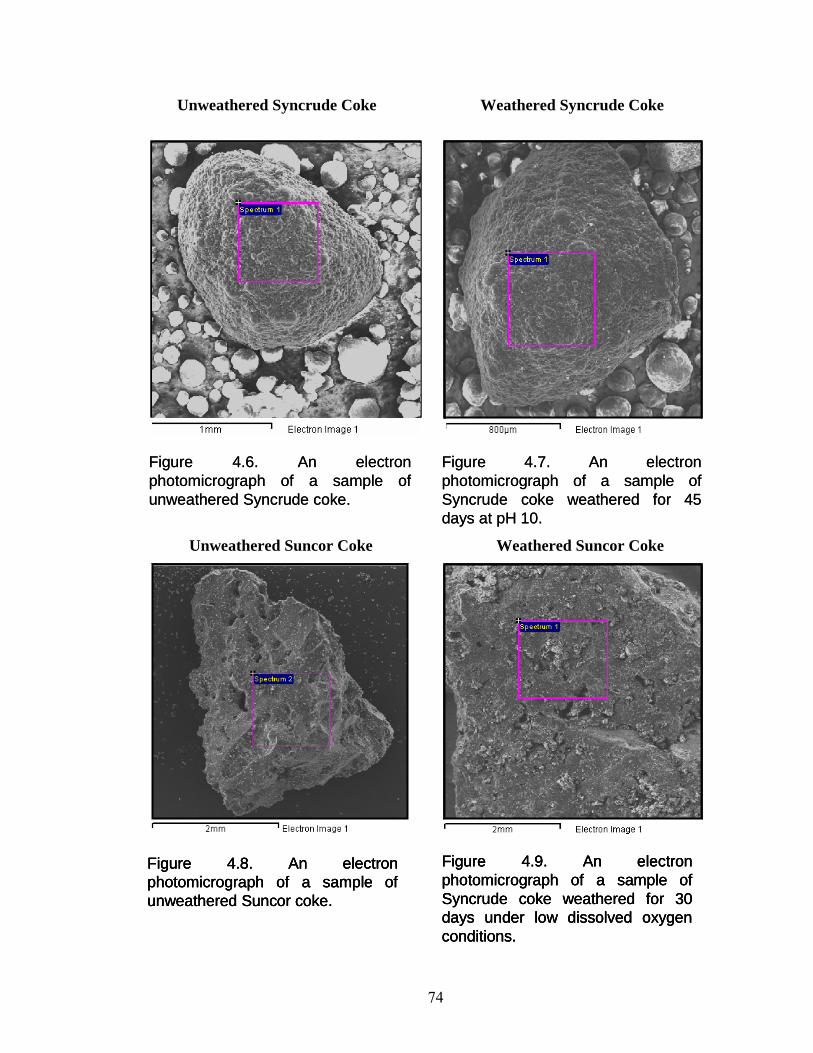
74
Unweathered Syncrude Coke Weathered Syncrude Coke
Unweathered Suncor Coke Weathered Suncor Coke
Figure 4.6. An electron photomicrograph of a sample of unweathered Syncrude coke.
Figure 4.7. An electron photomicrograph of a sample of Syncrude coke weathered for 45 days at pH 10.
Figure 4.8. An electron photomicrograph of a sample of unweathered Suncor coke.
Figure 4.9. An electron photomicrograph of a sample of Syncrude coke weathered for 30 days under low dissolved oxygen conditions.
Figure 4.8. An electron photomicrograph of a sample of unweathered Suncor coke.
Figure 4.9. An electron photomicrograph of a sample of Syncrude coke weathered for 30 days under low dissolved oxygen conditions.

75
4.4 Discussion
The physical differences between Syncrude and Suncor coke types were very
obvious, and were most likely a result of their method of formation. Suncor coke,
which is non-circular, and contains a very porous surface with sharper edges, is very
representative of a delayed coking system (Scott and Fedorak, 2004). Delayed coking
allows for large chucks of coke to be produced, which are then crushed down to smaller
pieces. This process may explain the non-uniform chunky shapes of the coke particles.
The spongy texture of Suncor coke surfaces can be explained by the short holding time
(approximately 48 hrs) that the coke has in the coker before it is removed (Scott and
Fedorak, 2004).
In contrast, Syncrude coke is produced in a fluid coking system, which requires
the continual removal of coke during operation (Scott and Fedorak, 2004). This might
account for the spherical, uniform structure of Syncrude coke, since it is constantly
removed from the coker in the form of a slurry. Syncrude coke’s layered structure is
also more indicative of a longer holding time in the coker permitting layers to build up
on each particle. Har (1981) made similar observations when using SEM to assess the
physical properties of Syncrude coke after fractionation, confirming that the growth of a
coke particle is by surface deposition of material during the coking process.
No differences between weathered and unweathered samples for either coke
type were visible using the SEM. This is most likely because with SEM only single
particles could be viewed (Figures 4.6 to 4.9) in comparison to the multi-particle
analysis conducted using polarized light microscopy (Figures 4.2 to 4.5) thus making it
more difficult to assess any differences in the amount of fracturing among treatments.
There seemed to be a greater amount of fractured Syncrude coke particles
present in both types of weathered coke (dissolved oxygen and pH), compared to
unweathered coke, when observed using polarized light microscopy. However, it is
possible that the same amount of fracturing had occurred in the unweathered coke as in
the weathered coke, but went unnoticed due to the random selection of the views of
coke chosen in the present study.
The increase in fracturing of Syncrude coke observed within the weathered
treatments may also be due to the methods of sample preparation. However, the

76
chances of such a phenomenon are unlikely since all samples (weathered and
unweathered) were prepared at the same time using the same methods. Conversely,
there is a possibility that the weathering treatments (dissolved oxygen and pH) may
have weakened the structure of the coke. This would make it prone to fracture after
being placed in epoxy and dried under vacuum.
Suncor coke exhibited no particle definition using the polarized light technique
so fracturing could not be assessed. This was either due to the much larger particle size
of Suncor coke (which filled the entire field of view on the microscope preventing any
particle comparisons), or to the unordered structure of the coke. Because Suncor coke
is produced using a delayed coking process, the structure of each particle is not layered.
As a result, it is not as easily differentiated as Syncrude coke. This is reflected in the
variety of different colours observed when analyzing Suncor coke using the polarized
light technique, which were absent when examining Syncrude coke.
Under polarized light, areas of the coke having a different ordered
microstructure rotate the light at a different degree. This allows for regions of different
order to be differentiated based on apparent brightness. For example, when a sample is
rotated perpendicular to the light beam the brightness of an ordered region will change,
while a deposit with no order will remain dark (Syncrude Canada Ltd., 2003). The
different colours observed in the Suncor coke compared to the Syncrude coke under the
polarized light microscopy technique are most likely due to differences in structure
within the coke particle, which contributes to the differences in surface texture observed
using SEM.
Differences in order could contribute to differences in the leachability and
ultimate toxicity of coke if it is used as part of an aquatic reclamation program.
Although Syncrude coke has a small particle size thereby increasing the surface area
available for leaching, it also has a very smooth, spherical shape. Suncor coke, on the
other hand, has a much larger particle size, it is very jagged and chunky, with a rough,
porous surface (Scott and Fedorak, 2004). This type of shape and surface can also
increase the surface area available for leaching of toxic constituents.
77
4.5 Conclusions
Syncrude and Suncor coke display very different physical characteristics, such
as particle size, shape and texture. These may lead to differences in leaching of
chemical constituents and therefore possibly in toxicity when placed in an aquatic
environment. Syncrude coke, with its smaller particle size and thus potentially larger
surface area to volume ratio, could potentially leach more toxic constituents into the
overlying water than the larger Suncor coke. However, the porous surface texture of
Suncor coke would also result in an increase in surface area leading to a greater degree
of leaching.
Even though we were unable to make a reliable quantitative analysis of the
amount of fracturing for each weathering treatment, it appeared that while weathering in
general caused increased fractioning of coke, the specific type of weathering (i.e.,
dissolved oxygen or pH) does not have an appreciable effect on the amount of
fracturing, at least not over the time periods studied here. Therefore it can only be
concluded that weathering under common environmental conditions may alter the
physical properties of coke particles, compared to unweathered coke. This may
influence the amount of metals and other constituents leaching out of the coke in a long-
term aquatic reclamation strategy.
Weathering can thus theoretically cause a substantial increase in the surface area
of coke particles since the particles evaluated here appeared to be broken down into
smaller sized fractions. This increases the potential for leaching of toxic constituents
from the coke when weathered over a longer period of time, since a larger surface area
of coke is exposed to the overlying or pore waters. It is anticipated that eventually
particles could become too small to fraction any further, and therefore would reach a
steady state of fractionation (MacKinnon, 2004). This implies that the amount of
constituents leaching out of the coke would eventually reach a threshold and come into
equilibrium with the surrounding aquatic environment. It is uncertain, at this time if or
when this would happen, and how much fractioning of coke particles would contribute
to this.
It is recommended that samples of coke which have undergone a longer period
of weathering be collected and compared to the samples analyzed in the present study.

78
Such comparisons could lead to a better understanding of how the fractioning of coke
may change over a longer time frame. In addition, such analysis could further
determine how fractioning affects the potential leaching of constituents from coke in an
aquatic reclamation strategy
.

79
5. THE EFFECTS OF ACCELERATED WEATHERING ON THE LEACHING
OF METALS FROM COKE AND THE INFLUENCE OF COKE PARTICLE
SIZE ON THE SURVIVAL AND GROWTH OF CHIRONOMUS TENTANS
5.1 Introduction
One of the major industries in the province of Alberta, Canada, is the oil sands
industry. Oil sands are natural sand deposits containing a dense, viscous petroleum
called bitumen. The two major oil sands mining companies currently producing
synthetic crude oil in Alberta are Syncrude Canada Ltd. and Suncor Energy Inc. In
2003, Syncrude produced about 13% of Canada’s petroleum needs, amounting to
approximately 77.3 million barrels of oil (Syncrude Canada Ltd., 2004).
A waste product called coke is produced during part of the bitumen upgrading
processes at the Alberta oil sands. Coking is an essential part of this upgrading system
since it enables oil sands companies to convert less profitable heavy oil fractions into
the more valuable light fractions. Syncrude and Suncor produce coke through two
different processes, fluid and delayed coking. Due to these different processes, some of
the physical properties of Syncrude and Suncor coke, such as particle size, are very
different.
At present, Syncrude produces approximately 2 million tonnes of coke per year,
with planned expansions in the next few years increasing this number to 3 million
tonnes per year. Suncor already produces over 3 million tonnes of coke per year
(Komex International Ltd., 1998; Scott and Fedorak, 2004). Most of this coke is stored
directly onsite at the oil sands operations, although some of the coke produced via
delayed coking is sold and shipped off site (Chung et al., 1996; Scott and Fedorak,
2004).

80
Current reclamation strategies for mined out leases at the Alberta oil sands
include constructing wetlands using layers of waste product, such as tailings and coke.
Coke contains a high amount of organic carbon, a fundamental ingredient in the
establishment of a viable benthic community in aquatic ecosystems. This makes coke
an attractive capping option in an aquatic reclamation strategy at the Alberta oil sands
since other waste products, such as tailings, contain very low levels of natural organic
carbon making them unsuitable as the sole substrate in an aquatic reclamation strategy.
Coke as it is presently stored on site in coke cells or large piles contains small
volumes of soil or sediment matter, such as clay particles. These particles can contain
naturally elevated levels of heavy metals due to the presence of oil sands in the region
(Scott and Fedorak, 2004). It is therefore possible that the metals previously shown to
leach from the coke (see Chapter 3) may actually be originating from these
soil/sediment particles, or loosely bound to the surface of the coke. This could be the
cause of the initial, rapid release of metals which was previously shown to leach into the
overlying water and pore water of coke (Chapter 3).
Toxicity experiments discussed in Chapter 3 of this thesis suggested that the
particle size of coke may play a key role in the observed effects on survival and growth
of the aquatic macroinvertebrate, Chironomus tentans. In those experiments, Syncrude
coke, which has a smaller particle size, resulted in a significant increase in C. tentans
growth compared to Suncor coke, which has a much larger particle size. Particle size,
therefore, has the potential to play an important role in the feasibility of using coke as a
reclamation substrate by limiting the ability of some aquatic macroinvertebrates, such as
C. tentans, to utilize it as a building material for habitat (tube) construction (Berg,
1995).
The first objective of the following experiments was to determine whether the
leaching of certain metals into the overlying and pore waters of the coke as observed in
previous experiments is from: (a) loose debris and/or weakly bound metals associated
with the coke during storage, (b) foreign matter adhering to the surface of the coke, or
(c) the coke matrix itself. The second objective was to determine whether or not the
particle size of Suncor coke has an effect on the survival and/or growth of C. tentans.

81
5.2 Materials and Methods
5.2.1 Accelerated Weathering Experiment
5.2.1.1 Study Design
Cokes from Syncrude and Suncor were exposed to three different pre-treatments
(untreated, water rinsed, and peroxide treated) before undergoing a 30-d leaching
period. Untreated coke was manipulated as done in previous experiments (Chapter 3).
This treatment is considered to be a control treatment and will be compared with the
other two treatments (see below).
The rinsed coke treatment was designed to remove the loose debris associated
with coke (e.g. clay), as well as any metals that may be weakly adsorbed to the surface
of the coke. Each coke type was mixed with reconstituted water (the properties of
which are listed in Table 3.1) at a ratio of coke:water of 1:1 (400 mL of coke with 400
mL of water) and shaken for 30 seconds. The mixture was left undisturbed until the
coke had settled enough to see a clear definition between the coke and the overlying
water layer. At this point, the rinse water was carefully decanted and saved. This
procedure was repeated for a total of four times and the rinse water combined to provide
a total volume of 1600 mL This is equal to the amount of overlying water generated in
previous leaching experiments (Chapter 3). A composite sample of this rinse water was
sent for trace metal analysis. The procedures for the sampling and analysis of trace
metal samples were the same as those outlined in Chapter 3.
To remove matter that may be more strongly bound to the surface of the coke
particles, hydrogen peroxide (H2O2) was used. Hydrogen peroxide is generally used to
oxidize organic matter in soil and sediment that can become bound to metals (Tessler et
al., 1979). Under oxidizing conditions in natural waters organic matter can be
degraded, leading to a release of soluble metals (Tessler et al., 1979). Water rinsed
coke (as outlined above) was submerged in a 10% solution of H2O2 at a ratio of
coke:peroxide of 1:1 and left for 30 minutes. After this time, the peroxide was decanted
and the coke rinsed with 400 mL of reconstituted water an additional four times to
ensure that none of the peroxide remained. Composite samples of both the peroxide and
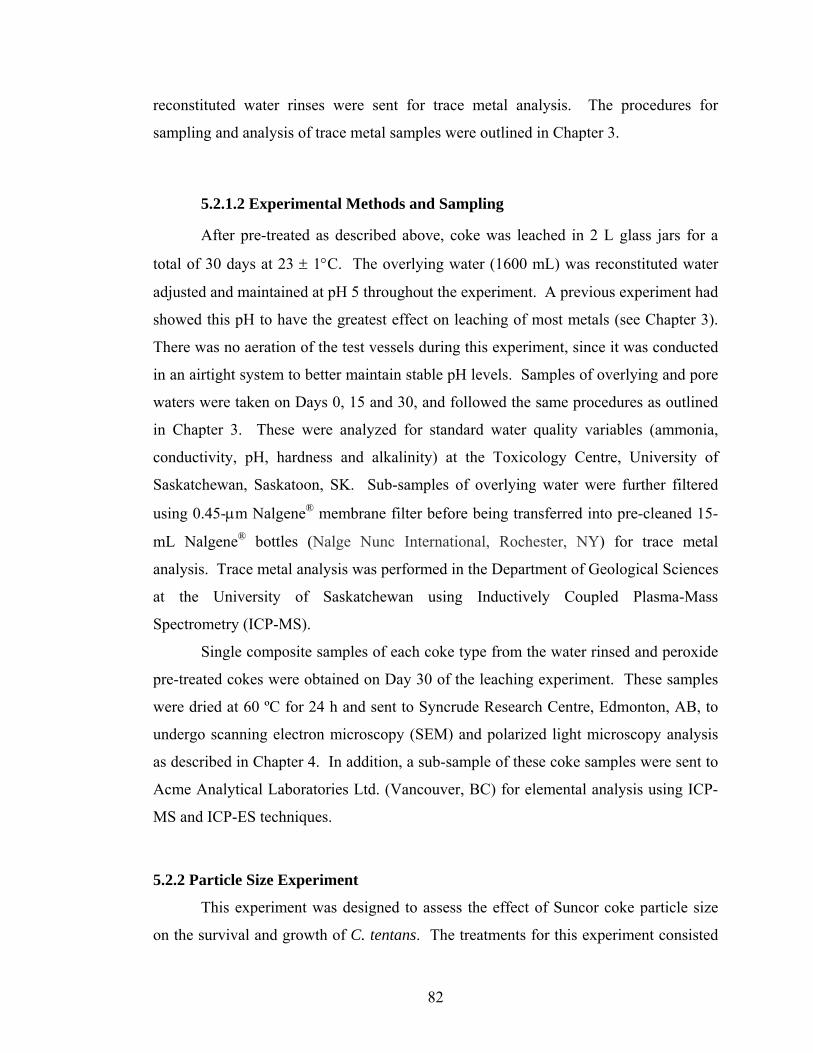
82
reconstituted water rinses were sent for trace metal analysis. The procedures for
sampling and analysis of trace metal samples were outlined in Chapter 3.
5.2.1.2 Experimental Methods and Sampling
After pre-treated as described above, coke was leached in 2 L glass jars for a
total of 30 days at 23 ± 1°C. The overlying water (1600 mL) was reconstituted water
adjusted and maintained at pH 5 throughout the experiment. A previous experiment had
showed this pH to have the greatest effect on leaching of most metals (see Chapter 3).
There was no aeration of the test vessels during this experiment, since it was conducted
in an airtight system to better maintain stable pH levels. Samples of overlying and pore
waters were taken on Days 0, 15 and 30, and followed the same procedures as outlined
in Chapter 3. These were analyzed for standard water quality variables (ammonia,
conductivity, pH, hardness and alkalinity) at the Toxicology Centre, University of
Saskatchewan, Saskatoon, SK. Sub-samples of overlying water were further filtered
using 0.45-μm Nalgene® membrane filter before being transferred into pre-cleaned 15-
mL Nalgene® bottles (Nalge Nunc International, Rochester, NY) for trace metal
analysis. Trace metal analysis was performed in the Department of Geological Sciences
at the University of Saskatchewan using Inductively Coupled Plasma-Mass
Spectrometry (ICP-MS).
Single composite samples of each coke type from the water rinsed and peroxide
pre-treated cokes were obtained on Day 30 of the leaching experiment. These samples
were dried at 60 ºC for 24 h and sent to Syncrude Research Centre, Edmonton, AB, to
undergo scanning electron microscopy (SEM) and polarized light microscopy analysis
as described in Chapter 4. In addition, a sub-sample of these coke samples were sent to
Acme Analytical Laboratories Ltd. (Vancouver, BC) for elemental analysis using ICP-
MS and ICP-ES techniques.
5.2.2 Particle Size Experiment
This experiment was designed to assess the effect of Suncor coke particle size
on the survival and growth of C. tentans. The treatments for this experiment consisted

83
of control sand, untreated Syncrude coke, untreated Suncor coke and crushed Suncor
coke. These allowed for a comparison between each coke type, and the crushed (i.e.
smaller sized) Suncor coke.
Suncor coke was crushed manually with a standard glass mortar and pestle.
After crushing, the coke was passed through a 425 µm mesh sieve. This size was
chosen because it was the smallest mesh size that Syncrude coke could pass easily
through. This provided a reasonable comparison between the particle sizes of crushed
Suncor coke and untreated Syncrude coke. After the coke was crushed, all four
treatments (control sand, Syncrude coke, Suncor coke and crushed Suncor coke) were
rinsed briefly to remove any fine particulate matter.
A 10-d toxicity test using C. tentans was performed using four replicates of each
treatment with 10 animals per replicate. The overlying water was reconstituted water
made to mimic the hardness and alkalinity values found in water sampled at the
Syncrude mine site in northern Alberta (Table 3.1). The remainder of the general
experimental design and procedures are based on the protocol outlined by Environment
Canada (1997) and are described in Chapter 3 (Section 3.2.3).
5.2.3 Data Analysis
Mass balance calculations were conducted for metals identified to be of concern
during the accelerated weathering leaching experiment. These calculations used the
peak concentrations of the identified metals of concern in both overlying water and pore
water, and compared them to their respective, total concentration in the untreated coke
(i.e. coke that had not undergone any leaching). If the concentration in the
corresponding leached coke was greater than the concentration in the untreated coke,
the leached coke value was used. Peak values were utilized in these calculations in
order to calculate the maximum percentage of metals observed to leach from the coke.
Statistical analyses were performed using the computer program SigmaStat®,
version 2.03 (SPSS Inc., Chicago, IL, USA) at a 95% (α = 0.05) level of confidence.
Two-way ANOVAs were conducted on metals data from the accelerated weathering
leaching experiment to determine differences in metal concentrations between overlying
water and pore water, and also among treatments (untreated, water rinsed, and peroxide

84
treated). Two-way ANOVAs were conducted on the ranked data when tests and
transformations for homogeneity of variance failed. If statistical differences were
found, a Holm-Sidak multiple comparison test was run for each ANOVA test.
The endpoints for the toxicity test were survival and growth of C. tentans. A
one-way ANOVA was conducted to test for any statistical difference between the four
substrate treatments (control sand, Syncrude coke, Suncor coke, crushed Suncor coke).
The test used for normality was Kolmogorov-Smirnov and the test for homogeneity of
variance was the Levene median test. If statistical differences were found, a Holm-
Sidak multiple comparison test was run.
5.3 Results
5.3.1 Accelerated Weathering Experiment
5.3.1.1 Water Chemistry
The highest single metal concentration measured over all time points for the
metals identified to be of potential concern in the accelerated leaching experiment are
listed in Table 5.1. These metal concentrations either exceeded the Canadian Water
Quality Guidelines for the protection of aquatic life, or published LC50 values for
Chironomus species. More detailed metal concentration data for this experiment are
summarized in Appendix IV.
An immediate release of metals into the pore water and overlying water
occurred at the beginning (i.e. within the first few hours) of the experiment. In
treatments with Syncrude coke, metal concentrations in both the pore water and
overlying water tended to start high and then decrease over the 30-d leaching period
(Figure 5.1). In treatments with Suncor coke, most metal concentrations increased in
both the pore water and overlying water over the duration of the leaching period, but
generally were lower on day 0 than Syncrude coke (Figure 5.2). The concentrations of
metals in pore water tended to be similar to or exceed the metal concentrations in the
overlying waters on day 30 for both coke types.

85
Metal leaching was observed in all three treatments for both coke types.
However, untreated coke was observed to leach the highest metal concentrations only
19% of the time when pooled over all three time points for Syncrude coke, and 43% of
the time when pooled over all three time points for Suncor coke (Figures 5.1 and 5.2).
Untreated coke generally showed the greatest leaching on day 0 (except for Mo and V).
Metal concentrations then tended to decrease over the remainder of the leaching period.
When Suncor coke was used as a substrate, there was a spike in metal concentrations
for untreated coke on day 15 (except for Cu, Mo and V). Day 15 metal concentrations
either remained relatively constant or decreased slightly by day 30.
The water-rinsed coke leached higher concentrations of metals than the peroxide
treated coke 59% of the time for Syncrude coke and 27% of the time for Suncor coke,
when pooled over all three time points. Metal concentrations in the water rinsed and
peroxide treated Syncrude coke either decreased or remained relatively constant over all
three time points, with the exception of copper, which showed a spike in concentration
on Day 30. However, water rinsed and peroxide treated Suncor coke tended to follow
the trend of the untreated Suncor coke by showing a spike in metal concentration on day
15, before leveling off or decreasing by day 30. There were some exceptions with
Syncrude coke (Co, Cu, Mn) and Suncor coke (Cu, Mo, V) where the peroxide treated
coke leached the most metals, and untreated the least at different time points during the
leaching period (Figures 5.1 and 5.2).
The mean concentrations of metals found in the rinse solutions for the water
rinsed coke and the peroxide treated coke are listed in Table 5.2. It is evident that
higher concentrations of metals were removed with the peroxide treatment versus the
water rinse for both coke types. Higher metal concentrations were found in the rinse
solutions of Syncrude coke than Suncor coke with both of these pre-treatments. When
metal concentrations in the rinse solutions are compared against the mean overlying
water metal concentration on day 30 in the subsequent leaching study (Figures 5.1 and
5.2) the concentrations in the rinse solutions either exceed or were similar to those from
the samples collected from the overlying water.
86
Table 5.1. Peak concentrations (µg/L) measured over three time points for several metals that reached levels of concern in the overlying water (leachate) and coke pore water during the accelerated weathering leaching experiment: (a) Syncrude coke, (b) Suncor coke.
(a) Overlying Water Pore water
Element Detection Limit Untreated Rinsed Peroxide Untreated Rinsed Peroxide CWQG
1
(µg/L) Chironomus sp.
LC50 (µg/L)
Cobalt 0.03 5.1 5.8 5.9 31.5 40.8 29.1 --2 n/a Copper 0.42 4.4 7.3 8.8 3.4 2.5 2.8 3 54
3
Manganese 0.54 188.9 65.9 143.0 683.5 366.7 354.0 50 554
Molybdenum 0.11 91.4 31.1 31.6 851.5 93.9 48.1 73 3604
Nickel 0.97 653.8 114.8 113.0 2590.2 1048.0 1041.1 25-150 10,2005
Vanadium 0.88 761.2 630.0 529.0 1427.6 1034.8 305.3 --2 2404
Zinc 20.07 46.1 11.0 13.0 199.5 89.6 115.5 30 11253
(b) Overlying Water Pore water
Element Detection Limit Untreated Rinsed Peroxide Untreated Rinsed Peroxide CWQG
1
(µg/L) Chironomus sp.
LC50 (µg/L)
Cobalt 0.03 15.0 7.3 6.4 74.1 25.9 31.6 --2 n/a Copper 0.42 8.2 4.6 5.8 8.4 3.7 16.2 3 54
3
Manganese 0.54 342.4 132.9 208.9 1612.5 518.6 645.9 50 554
Molybdenum 0.11 2.3 13.3 13.0 4.8 4.2 13.2 73 3604
Nickel 0.97 68.8 43.0 39.6 334.9 100.9 138.3 25-150 10,2005
Vanadium 0.88 3.7 1097.0 983.0 5.4 4.1 69.9 --2 2404
Zinc 20.07 42.4 25.4 37.8 111.1 53.0 80.9 30 11253
1 Canadian Water Quality Guidelines (CCME, 2003);
2 No Canadian Guideline available;
3 (Phipps et al., 1995); 4 (Fargašová, 1997)
86

87
Figure 5.1. Log mean concentrations ± standard errors of selected metals in overlying water and pore water for Syncrude coke during a 30-d accelerated weathering leaching experiment. (* denotes significant differences between overlying water and pore water. a denotes significant differences between water rinsed and peroxide treated coke, b between water rinsed and untreated coke and c between untreated and peroxide treated coke).
Day0 15 30
Log
Van
adiu
m (u
g/L)
1
10
100
1000
10000
Untreated OWUntreated PWRinsed OWRinsed PWPeroxide OWPeroxide PW
Day0 15 30
Log
Man
gane
se (u
g/L)
0.1
1
10
100
1000Day
0 15 30
Log
Cob
alt (
ug/L
)
0.1
1
10
100
Day0 15 30
Log
Nic
kel (
ug/L
)
10
100
1000
10000
Day
0 15 30
Log
Cop
per (
ug/L
)
0.1
1
10
100
Day0 15 30
Log
Zinc
(ug/
L)
1
10
100
1000
Day0 15 30
Log
Mol
ybde
num
(ug/
L)
0.1
1
10
100
1000
* ac abc
*, ab bc
ab
* a *, abc*, ab
*, ac
*, ac
*, aba
ac
*, ab ac
ac
* abc ac
Day0 15 30
Log
Van
adiu
m (u
g/L)
1
10
100
1000
10000
Untreated OWUntreated PWRinsed OWRinsed PWPeroxide OWPeroxide PW
Day0 15 30
Log
Man
gane
se (u
g/L)
0.1
1
10
100
1000Day
0 15 30
Log
Cob
alt (
ug/L
)
0.1
1
10
100
Day0 15 30
Log
Nic
kel (
ug/L
)
10
100
1000
10000
Day
0 15 30
Log
Cop
per (
ug/L
)
0.1
1
10
100
Day0 15 30
Log
Zinc
(ug/
L)
1
10
100
1000
Day0 15 30
Log
Mol
ybde
num
(ug/
L)
0.1
1
10
100
1000
* ac abc
*, ab bc
ab
* a *, abc*, ab
*, ac
*, ac
*, aba
ac
*, ab ac
ac
* abc ac

88
Figure 5.2. Log mean concentrations ± standard errors of selected metals in overlying water and pore water for Suncor coke during a 30-d accelerated weathering leaching experiment. (* denotes significant differences between overlying water and pore water. a denotes significant differences between water rinsed and peroxide treated coke, b between water rinsed and untreated coke and c between untreated and peroxide treated coke).
Day0 15 30
Log
Van
adiu
m (u
g/L)
0.1
1
10
100
Untreated OWUntreated PWRinsed OWRinsed PWPeroxide OWPeroxide PW
Day0 15 30
Log
Man
gane
se (u
g/L)
10
100
1000
10000Day
0 15 30
Log
Cob
alt (
ug/L
)
1
10
100
Day0 15 30
Log
Nic
kel (
ug/L
)
1
10
100
1000
Day0 15 30
Log
Cop
per (
ug/L
)
1
10
100
Day0 15 30
Log
Zinc
(ug/
L)
1
10
100
1000
Day0 15 30
Log
Mol
ybde
num
(ug/
L)
0.1
1
10
100
*, ac
*, abc *, bc
ab
ac abc
*, ac
*, abc*, bc *, abc
*, ac
*, abc *, bc *, ac *, ac
ac *, ab *, abc
Day0 15 30
Log
Van
adiu
m (u
g/L)
0.1
1
10
100
Untreated OWUntreated PWRinsed OWRinsed PWPeroxide OWPeroxide PW
Day0 15 30
Log
Man
gane
se (u
g/L)
10
100
1000
10000Day
0 15 30
Log
Cob
alt (
ug/L
)
1
10
100
Day0 15 30
Log
Nic
kel (
ug/L
)
1
10
100
1000
Day0 15 30
Log
Cop
per (
ug/L
)
1
10
100
Day0 15 30
Log
Zinc
(ug/
L)
1
10
100
1000
Day0 15 30
Log
Mol
ybde
num
(ug/
L)
0.1
1
10
100
*, ac
*, abc *, bc
ab
ac abc
*, ac
*, abc*, bc *, abc
*, ac
*, abc *, bc *, ac *, ac
ac *, ab *, abc
*, ac
*, abc *, bc
ab
ac abc
*, ac
*, abc*, bc *, abc
*, ac
*, abc *, bc *, ac *, ac
ac *, ab *, abc

89
Table 5.2. Mean concentrations ± standard errors (µg/L) of selected metals in the rinse solutions of the water rinsed and peroxide treated Syncrude and Suncor coke. Syncrude Coke Suncor Coke
Element Water Rinse Peroxide Rinse Water Rinse Peroxide Rinse Cobalt 1.8 ± 0.8 100.5 ± 28.1 5.2 ± 0.8 39.4 ± 11.2 Copper 0.6 ± 0.0 69.8 ± 33.2 2.2 ± 1.0 48.6 ± 14.6 Manganese 46.6 ± 17.6 944.5 ± 223.9 165.8 ± 18.3 694.4 ± 194.8 Molybdenum 16.7 ± 3.7 116.8 ± 11.6 3.0 ± 0.5 187.8 ± 56.4 Nickel 120.3 ± 54.4 1534.2 ± 260.9 30.0 ± 4.5 298.5 ± 82.6 Vanadium 260.6 ± 103.0 12748.5 ± 4609.4 2.2 ± 0.4 715.2 ± 185.3 Zinc 27.7 ± 1.3 332.3 ± 121.9 < 20.1 83.8 ± 20.3

90
5.3.1.2 Coke Chemistry
5.3.1.2.1 Elemental Analysis of coke
There did not appear to be many differences in measured elemental
concentrations between coke that had been rinsed with water only and coke that had
been pre-treated with peroxide for either Syncrude or Suncor coke types (Table 5.3a).
None of the metal concentrations leached into the overlying waters exceeded 3% of the
total metal available in the coke (Table 5.3b). The greatest percentage (2.2% for zinc)
was seen in the peroxide treated Syncrude coke.
Table 5.3. Measured concentrations (µg/g) (a) of metals in weathered Syncrude and Suncor coke after pre-treatment with either a water rinse or a peroxide treatment (n = 1), and the associated percentage of each metal (b) using peak concentrations of metals in both overlying water and pore water and their respective measured concentration in coke.
(a)
Element Syncrude Rinsed
Syncrude Peroxide
Suncor Rinsed
Suncor Peroxide
Cobalt 5.8 5.9 7.3 6.4 Copper 7.3 8.8 4.6 5.8 Molybdenum 31.1 31.6 13.3 13.0 Nickel 114.8 113.0 43.0 39.6 Vanadium 630.0 529.0 1097.0 983.0 Zinc 11.0 13.0 8.0 10.0
(b)
Element Syncrude Rinsed
Syncrude Peroxide
Suncor Rinsed
Suncor Peroxide
Cobalt 0.7 1.2 0.4 0.8 Copper 0.1 1.1 0.4 0.9 Molybdenum 0.8 0.2 0.1 0.3 Nickel 1.2 1.1 0.4 0.7 Vanadium 0.4 0.3 0.0 0.0 Zinc 1.8 2.2 1.6 1.9
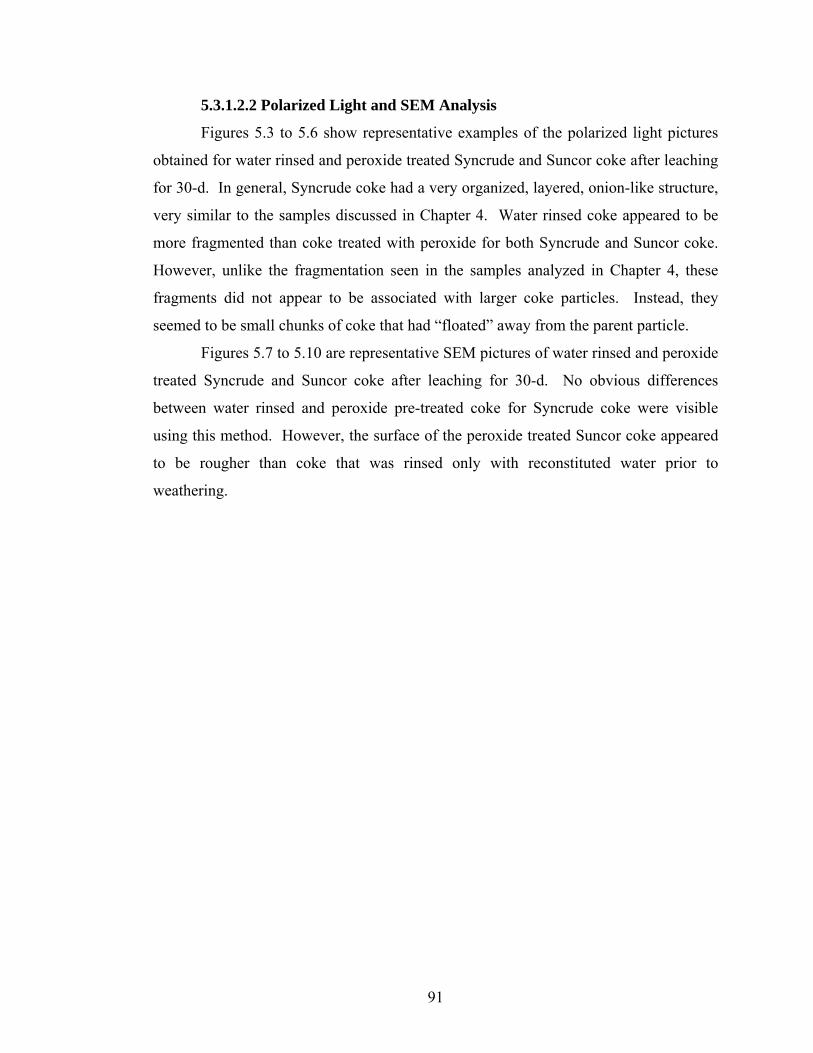
91
5.3.1.2.2 Polarized Light and SEM Analysis
Figures 5.3 to 5.6 show representative examples of the polarized light pictures
obtained for water rinsed and peroxide treated Syncrude and Suncor coke after leaching
for 30-d. In general, Syncrude coke had a very organized, layered, onion-like structure,
very similar to the samples discussed in Chapter 4. Water rinsed coke appeared to be
more fragmented than coke treated with peroxide for both Syncrude and Suncor coke.
However, unlike the fragmentation seen in the samples analyzed in Chapter 4, these
fragments did not appear to be associated with larger coke particles. Instead, they
seemed to be small chunks of coke that had “floated” away from the parent particle.
Figures 5.7 to 5.10 are representative SEM pictures of water rinsed and peroxide
treated Syncrude and Suncor coke after leaching for 30-d. No obvious differences
between water rinsed and peroxide pre-treated coke for Syncrude coke were visible
using this method. However, the surface of the peroxide treated Suncor coke appeared
to be rougher than coke that was rinsed only with reconstituted water prior to
weathering.
92
Syncrude Coke, Water Rinsed Syncrude Coke, Peroxide Treated
Suncor Coke, Water Rinsed Suncor Coke, Peroxide Treated
Figure 5.5. A sample of water rinsed Suncor coke, as seen under a polarized light microscope, 50X, oil immersion.
Figure 5.6. A sample of peroxide treated Suncor coke, as seen under a polarized light microscope, 50X, oil immersion.
Figure 5.3. A sample of water rinsed Syncrude coke, as seen under a polarized light microscope, 50X, oil immersion.
Figure 5.4. A sample of peroxide treated Syncrude coke, as seen under a polarized light microscope, 50X, oil immersion.
Figure 5.5. A sample of water rinsed Suncor coke, as seen under a polarized light microscope, 50X, oil immersion.
Figure 5.6. A sample of peroxide treated Suncor coke, as seen under a polarized light microscope, 50X, oil immersion.
Figure 5.5. A sample of water rinsed Suncor coke, as seen under a polarized light microscope, 50X, oil immersion.
Figure 5.6. A sample of peroxide treated Suncor coke, as seen under a polarized light microscope, 50X, oil immersion.
Figure 5.3. A sample of water rinsed Syncrude coke, as seen under a polarized light microscope, 50X, oil immersion.
Figure 5.4. A sample of peroxide treated Syncrude coke, as seen under a polarized light microscope, 50X, oil immersion.
Figure 5.3. A sample of water rinsed Syncrude coke, as seen under a polarized light microscope, 50X, oil immersion.
Figure 5.4. A sample of peroxide treated Syncrude coke, as seen under a polarized light microscope, 50X, oil immersion.

93
Syncrude Coke, Water Rinsed Syncrude Coke, Peroxide Treated
Suncor Coke, Water Rinsed Suncor Coke, Peroxide Treated
Figure 5.7. An electron photomicrograph of a sample of Syncrude coke after rinsing with water.
Figure 5.8. An electron photomicrograph of a sample of Syncrude coke after treatment with peroxide.
Figure 5.9. An electron photomicrograph of a sample of Suncor coke after rinsing with water.
Figure 5.10. An electron photomicrograph of a sample of Suncor coke after treatment with peroxide.
Figure 5.7. An electron photomicrograph of a sample of Syncrude coke after rinsing with water.
Figure 5.8. An electron photomicrograph of a sample of Syncrude coke after treatment with peroxide.
Figure 5.7. An electron photomicrograph of a sample of Syncrude coke after rinsing with water.
Figure 5.8. An electron photomicrograph of a sample of Syncrude coke after treatment with peroxide.
Figure 5.9. An electron photomicrograph of a sample of Suncor coke after rinsing with water.
Figure 5.10. An electron photomicrograph of a sample of Suncor coke after treatment with peroxide.
Figure 5.9. An electron photomicrograph of a sample of Suncor coke after rinsing with water.
Figure 5.10. An electron photomicrograph of a sample of Suncor coke after treatment with peroxide.

94
5.3.2 Particle Size Experiment
There was a significant decrease in C. tentans survival for the treatment
containing unmanipulated Suncor coke as a substrate when compared to the three other
treatments: control sand, Syncrude coke (p < 0.001) and crushed Suncor coke (p < 0.05)
(Figure 5.11a). The treatment containing crushed Suncor coke as a substrate showed a
significant increase in survival of C. tentans when compared with unmanipulated
Suncor coke (p < 0.05). However, survival was still significantly lower than in the
treatment using control sand as a substrate (p < 0.05) (Figure 5.11a).
No significant differences were observed in growth of C. tentans among any of
the four treatments (p = 0.769) (Figure 5.11b). However, there was a trend of increased
growth with crushed Suncor coke compared to unmanipulated Suncor coke.

95
Figure 5.11. Mean (± SE) survival (a) and growth, measured as dry weight, (b) of Chironomus tentans larvae after a 10-d bioassay using different particle sized coke samples. *** denotes a significant difference from Syncrude coke, ** denotes a significant difference from Suncor coke, * denotes a significant difference from control sand.
Control Syncrude Suncor SuncorSand Coke Coke Crushed
Control Syncrude Suncor SuncorSand Coke Coke Crushed

96
5.4 Discussion
5.4.1 Accelerated Weathering Experiment
There was an immediate release of metals into the pore water and overlying
water for all three treatments for both Syncrude and Suncor coke. This trend is similar
to what was seen in the leaching experiments described in Chapter 3. In the untreated
coke, these metals could be either weakly bound to the surface of the coke particles, or
associated with the natural soil and sediment particles found among the coke after
storage in the field. As soon as the coke came in contact with water, these loosely
bound metals could have been released, causing a spike in dissolved metal
concentrations. However, metals released from the water rinsed and peroxide treated
coke are less likely from these sources since these pre-treatments should have removed
the natural soil and sediment particles, and any metals weakly adsorbed to the surface of
the coke. Instead, these metals may be from any leftover rinse water that was not fully
removed during pre-treatment. Future experiments could account for this issue by
performing additional rinses or filtering the coke before leaching to ensure that none of
the rinse water remained behind.
Metal concentrations in both the pore water and overlying water of Syncrude
coke tended to start high before decreasing over the 30-d leaching period. In treatments
using Suncor coke, most metal concentrations increased in both the pore water and
overlying water over the duration of the leaching period. These different leaching
trends may be a consequence of the finer particle size of Syncrude coke, which makes it
more difficult to rinse during pre-treatment. It is possible that rinse water, which
contained a high concentration of metals, was not removed as effectively as with the
larger particle size Suncor coke, causing this initial high concentration of metals in both
the pore water and overlying water.
Metal concentrations leaching from the untreated Syncrude coke were generally
higher than metal concentrations leaching from the water rinsed and peroxide treated
Syncrude coke at day 0 (except for Mo and V). This is most likely a result of metals
leaching either from the soil and sediment debris, or metals loosely bound to the surface

97
of the coke. Such metals could easily dissociate into the pore water within the first few
hours of the leaching experiment.
When Suncor coke was leached, the greatest concentrations of metals were
generally observed on day 15 rather than day 0. This could be a result of differences in
the soil and sediment debris which are known to contaminate the coke when stored
outside. Although it was not measured in this experiment, there may have been less of
this debris in the Suncor coke. However, it is also possible that these results are due to
the different physical properties of Syncrude and Suncor coke. Since the samples
collected on day 0 were taken within hours of the coke coming in contact with water, it
is possible that the larger sized Suncor coke, which has less surface area available for
leaching than the same volume of Syncrude coke, did not have sufficient time for the
loosely bound metals to leach before the initial sampling. Therefore, a greater
concentration of metals was observed later on in the leaching period, rather than
immediately as was found with the smaller sized Syncrude coke.
Water rinsed and peroxide treated coke showed little change in metal leaching
over all three time points for Syncrude coke. This may be because the pre-treatments
(i.e. water rinse and peroxide treatment) effectively removed the metals loosely
associated with the coke which would have caused metal concentrations to increase
over the duration of the leaching period. Instead, a fairly constant concentration of
metals over the three sampling times were observed, which was most likely due to an
equilibrium establishing between the coke and the pore water (i.e. the release and
reabsorbtion of metals from the coke).
When Suncor coke was used as a substrate, water rinsed and peroxide treated
coke tended to mimic the untreated coke by showing spikes in metal concentrations at
day 15, before decreasing or remaining relatively constant by day 30. Therefore,
equilibrium between the dissolved metals in pore water and those bound to the coke was
not established with Suncor coke. However, it is also possible that this result was due
to the difference in particle sizes between Suncor and Syncrude cokes as described
previously. Therefore, greater concentrations of metals would be observed later on in
the leaching period, rather than at the beginning of the leaching period, as was observed
with the smaller sized Syncrude coke.
98
The highest concentrations of metals were observed to leach into the pore water
and overlying water from either the untreated or water rinsed coke the majority of the
time. Since the water rinse would have removed any soil and sediment debris and
loosely bound metals on the coke surface, it may be concluded that a proportion of the
metals released was actually from the coke matrix itself. This makes metal
concentrations leaching from the rinsed coke comparable to those leaching from the
untreated coke. Therefore, we can conclude that a portion of the metals released is
coming from the coke itself. There was not a substantial difference between the
leaching trends of the water rinsed and peroxide treated coke, therefore the greatest
portion of the metals were most likely bound to the surface of the coke in such a way
that they were not completely removed by pre-rinsing the coke with water or peroxide.
Some of the highest concentrations of metals (especially on days 15 and 30)
were released from coke that had been pre-treated with peroxide. Accelerated oxidation
of sediment using H2O2 is a recognized practice (Jennings et al., 2000). It has been
previously shown to successfully assess the response of common sulfide and sulphate
minerals, such as those likely found within coke, under oxidizing conditions (Jennings
et al., 2000). The pre-treatments used in this experiment (water and peroxide) were at
least partially effective at removing metals as evidenced by the high concentrations of
metals sampled in the rinse solutions. A portion of the metals released from the coke
into the pore water and overlying water during the 30-d leaching period may, in fact, be
partially attributed to metals leaching directly from the coke matrix.
There were some instances (Cu, Mo, and V) where the greatest amount of metal
leaching into the pore water and overlying water were not from the untreated coke. In
these particular cases the peroxide treatment often leached the most, and untreated the
least, amount of metals. Molybdenum and vanadium, as discussed in Chapter 3, have a
great affinity for oxygen donors, and if H2O2 is added to aqueous solutions these metals
have been shown to become more soluble (Greenwood and Earnshaw, 1997). Copper
has also been shown to dissolve more readily in aqueous solutions containing H2O2
(Greenwood and Earnshaw, 1997). These properties may explain the differences in
leaching among the metals discussed in this experiment once coke is pre-treated with a
strong oxidizing agent such as H2O2. These results also demonstrate the importance of

99
understanding the behaviour of individual metals in an aqueous environment before
considering coke as part of an aquatic reclamation strategy.
Total metal concentrations measured within the coke did not appear to change
substantially with any of the weathering treatments. The minute changes that did occur
could be due to natural variation in the coke, reflecting natural variations in the starting
oil sands material. Mass balance calculations showed that none of the metals that
leached into the overlying water and pore water exceeded 3% of the total metal present
in the coke. These metal percentages are too small to show up as significant changes in
the coke itself. These observations are similar to those seen in the experiments
described in Chapter 3, and indicate the majority of the metals are most likely contained
within the coke matrix, or attached to the coke surface in such a way as to be mostly
unavailable using the weathering techniques and rinse durations employed in these
experiments.
When analyzed using polarized light microscopy, coke that had been water
rinsed appeared to be more fragmented than coke that had been treated with peroxide.
The absence of fragmentation in the peroxide treatment was most likely due to the
increased number of rinses that the peroxide treatment underwent prior to leaching. The
peroxide treated coke was rinsed four times with reconstituted water, then once with
peroxide, and finally four additional times with reconstituted water, for a total of nine
times. The water rinsed coke was only rinsed four times with reconstituted water.
Therefore, the peroxide treated coke underwent five additional shakings and rinses.
This additional handling could have caused the smaller coke fragments to be removed
along with the rinse water prior to leaching.
Analysis with SEM showed that the surface of the peroxide treated Suncor coke
tended to be slightly rougher than the surface of the water rinsed coke. This may be due
to the chemical effect of peroxide on the coke surface. Nevertheless, the mass balance
calculations suggested that the majority of the metals remained contained within the
coke itself. Therefore, the surface effect observed using SEM was not significant in
terms of the amount of metal leaching into the pore water and overlying water.

100
5.4.2 Particle Size Experiment
There were no significant differences in the survival or growth of C. tentans
when exposed to Syncrude coke and crushed Suncor coke. However, there was a
significant decrease in C. tentans survival in unmanipulated Suncor coke compared to
control sand. Therefore, once the particle size of the crushed Suncor coke was
comparable to that of Syncrude coke, its effect on C. tentans decreased significantly,
making the particle size of Suncor coke an important factor in its adverse effect on this
organism. This is most likely due to the inability of C. tentans to utilize coarse coke for
tube building as effectively as they can smaller sized substrates.
Tube building is initiated by first or second instar larvae by applying salivary
secretions along the edge of sediment or algae particles and attaching pieces together.
Once several large bundles have been constructed and transferred to its anterior prolegs,
the larva crawls through the bundle to form a tunnel. This process continues for one to
three hours until the tube is complete (Berg, 1995). Therefore, the substrate particle
size has the potential to play an important role in the viability of coke as a substrate
amendment by limiting the ability of some aquatic macroinvertebrates to utilize it as a
building material for habitat construction.
The larger the particle size, the more unlikely it can be used as a substrate for
tube building (Ruse, 2002). Tubes are important for the survival and growth of C.
tentans as the animals move water through the tubes with their bodies, replenishing
oxygen and removing carbon dioxide and metabolites (Pinder, 1995). The ability of
chironomids to construct tubes also decreases the risk of predation, and may minimize
their dislodgement by currents (Berg, 1995). Therefore, as shown in this experiment,
Suncor coke may have too large a particle size for the C. tentans to properly utilize it in
tube building. This factor could contribute to decreased survival and growth of these
and other tube-building organisms if Suncor coke is used as a substrate amendment at
the Alberta oil sands without crushing, or without the addition of finer-sized
reclamation amendment materials (e.g. peat or reclamation soil). However, the habitat
requirements of other aquatic organisms must also be considered as finer particle sized
substrates are not ideal for all invertebrates. Therefore, a variety of substrate sizes
would likely provide the ideal option when constructing these reclamation wetlands.
101
5.5 Conclusions
Since most metals in the accelerated leaching experiment initially leached to a
greater degree from the untreated coke, it can be concluded that these metals were from
either the natural soil or sediment particles that become associated with the coke during
storage, or were weakly bound to the surface of the coke. Rinsing the coke with water
removed the soil/sediment debris and metals loosely bound to the surface of the coke,
thereby reducing the amount of metals subsequently leaching out into the overlying
water and pore water. Therefore, rinsing the coke with water before adding it as a
substrate amendment in an aquatic reclamation strategy may decrease the potential for
toxicity to aquatic organisms by reducing the initial amount of metals available to the
organisms in the pore and overlying waters. However, since coke has been shown to
contain toxicologically significant amounts of metals, rinsing away debris will not
eliminate the potential for metal release from coke into the aquatic environment.
Coke particle size was hypothesized to be one of the major causes of the
previously observed decrease in survival and growth of C. tentans when Suncor coke
was used as a substrate (see Chapter 3). The results from the particle size experiment
conducted here showed that once the particle size of Suncor coke was reduced, its
adverse effects on C. tentans decreased significantly. Reducing the particle size of
Suncor coke would therefore allow aquatic macroinvertebrates to utilize it as a substrate
for habitat construction during initial colonization in an aquatic reclamation strategy.
Based on these results, it would be useful for Suncor to consider either reducing their
coke to a smaller particle size before using it as a substrate amendment in an aquatic
reclamation strategy, or adding a thin capping material with a finer particle size, such as
natural soil or sediment.

102
6. TOXICITY ASSESSMENT OF FIELD-SAMPLED AND LABORATORY-
PREPARED SUBSTRATES COMPRISED OF VARIOUS COMBINATIONS OF
OIL SANDS RECLAMATION MATERIALS
6.1 Introduction
One of the major industries in the province of Alberta, Canada, is the oil sands
industry. Oil sands, also known as tar sands or bituminous sands, are sand deposits
impregnated with dense, viscous petroleum called bitumen. Such deposits are found
throughout the world, often in the same geographical areas as conventional petroleum.
One of the primary waste products produced during the upgrading of oil sands to
crude oil is coke. Petroleum coke is a solid, carbonaceous residue that forms during the
cracking of petroleum distillates (Scott and Fedorak, 2004). The amount of coke
produced at the two major Alberta oil sands mining companies, Syncrude Canada Ltd.
and Suncor Energy Inc., (over 2,000 tonnes per day per operation) is significantly more
than what can be combusted and/or sold. Therefore, the excess coke must be stored on
site in coke cells which then become a necessary component of the closure/reclamation
landscapes.
The goal of reclamation at the oil sands is to achieve maintenance-free, self-
sustaining ecosystems with capabilities equivalent to or better than pre-disturbance
conditions (Golder Associates Ltd., 2000). In aquatic ecosystems, the invertebrate
community is established early in the successional/developmental process and becomes
an integral component of the food web. Thus, the benthic macroinvertebrate
community structure in wetlands which receive industrial inputs is relevant to the
sustainability of such a wetland (Bendell-Young et al., 2000).

103
There is concern that the development of a benthic community in aquatic
reclamation landscapes receiving industrial inputs from the Alberta oil sands operations
will be slower than desired. These industrial inputs (i.e. tailings and sand) which would
form the primary substrates of these reclamation landscapes contain little or no organic
carbon, a substance required for the development of a sustainable benthic community.
It has been previously shown that the extent of benthic colonization positively correlates
with the organic carbon content of the sediment (Pinder, 1995). Therefore, a healthy
and diverse benthic invertebrate community could not successfully develop without the
presence of organic carbon. The abundance of coke, with its high percentage of organic
carbon, makes it a very attractive option for use as a substrate in reclamation practices
at the Alberta oil sands.
One proposed reclamation strategy at the Alberta oil sands operations is a
wetland landscape. This would involve the layering of different waste products (such as
tailings) in mined-out areas. The two types of tailings produced at the Alberta oil sands
are mature fine tailings (MFT) and composite or consolidated tailings (CT). In one
proposal, the tailings layer would be capped by a layer of coke, followed by water.
Coke would then act as a buffer between the more toxic tailings and the overlying cap
of clean water. A further amendment of peat or overburden (terrestrial soil removed
prior to surface mining) has been proposed. This amendment would be placed over the
coke layer as a way of providing additional buffering for the tailings layer, and to act as
a barrier between the potentially toxic coke and the overlying water cap.
The main objective of the experiments described here was to assess the potential
toxicity of both fresh and field-aged combinations of peat, native soil, tailing sand,
mature fine tails (MFT) (Syncrude), composite tails (CT) (Syncrude) and coke
(Syncrude and Suncor). Combinations of fresh materials were aged in Deep Wetland
on the Syncrude Canada Ltd. mine site for a period of 2 and 14 months. A secondary
objective of these experiments was to determine if the presence of peat as a capping
material affected the potential toxicity of any of the other reclamation materials.
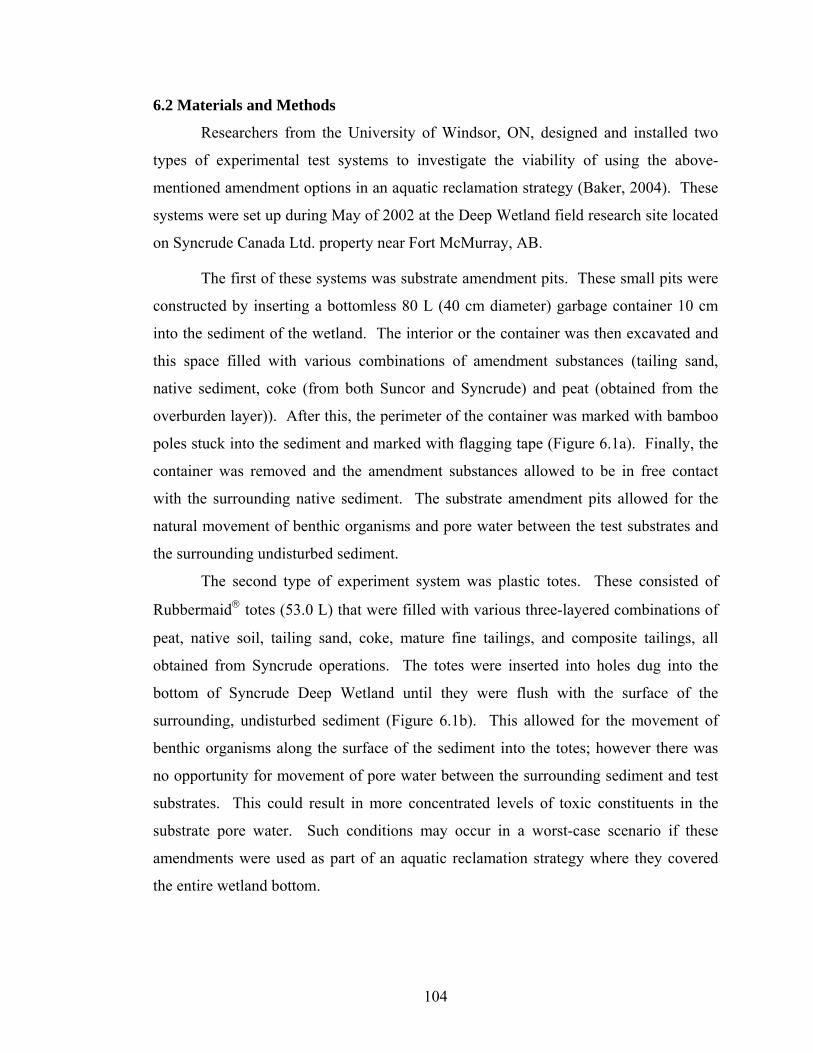
104
6.2 Materials and Methods
Researchers from the University of Windsor, ON, designed and installed two
types of experimental test systems to investigate the viability of using the above-
mentioned amendment options in an aquatic reclamation strategy (Baker, 2004). These
systems were set up during May of 2002 at the Deep Wetland field research site located
on Syncrude Canada Ltd. property near Fort McMurray, AB.
The first of these systems was substrate amendment pits. These small pits were
constructed by inserting a bottomless 80 L (40 cm diameter) garbage container 10 cm
into the sediment of the wetland. The interior or the container was then excavated and
this space filled with various combinations of amendment substances (tailing sand,
native sediment, coke (from both Suncor and Syncrude) and peat (obtained from the
overburden layer)). After this, the perimeter of the container was marked with bamboo
poles stuck into the sediment and marked with flagging tape (Figure 6.1a). Finally, the
container was removed and the amendment substances allowed to be in free contact
with the surrounding native sediment. The substrate amendment pits allowed for the
natural movement of benthic organisms and pore water between the test substrates and
the surrounding undisturbed sediment.
The second type of experiment system was plastic totes. These consisted of
Rubbermaid® totes (53.0 L) that were filled with various three-layered combinations of
peat, native soil, tailing sand, coke, mature fine tailings, and composite tailings, all
obtained from Syncrude operations. The totes were inserted into holes dug into the
bottom of Syncrude Deep Wetland until they were flush with the surface of the
surrounding, undisturbed sediment (Figure 6.1b). This allowed for the movement of
benthic organisms along the surface of the sediment into the totes; however there was
no opportunity for movement of pore water between the surrounding sediment and test
substrates. This could result in more concentrated levels of toxic constituents in the
substrate pore water. Such conditions may occur in a worst-case scenario if these
amendments were used as part of an aquatic reclamation strategy where they covered
the entire wetland bottom.
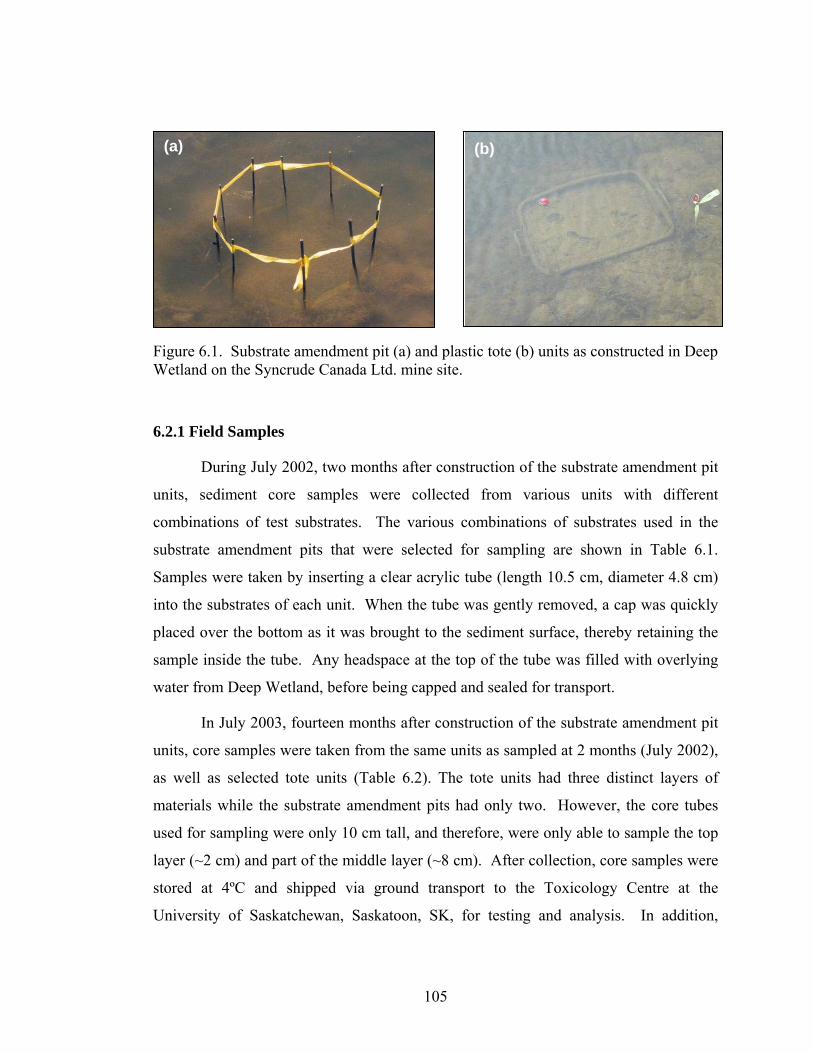
105
Figure 6.1. Substrate amendment pit (a) and plastic tote (b) units as constructed in Deep Wetland on the Syncrude Canada Ltd. mine site.
6.2.1 Field Samples
During July 2002, two months after construction of the substrate amendment pit
units, sediment core samples were collected from various units with different
combinations of test substrates. The various combinations of substrates used in the
substrate amendment pits that were selected for sampling are shown in Table 6.1.
Samples were taken by inserting a clear acrylic tube (length 10.5 cm, diameter 4.8 cm)
into the substrates of each unit. When the tube was gently removed, a cap was quickly
placed over the bottom as it was brought to the sediment surface, thereby retaining the
sample inside the tube. Any headspace at the top of the tube was filled with overlying
water from Deep Wetland, before being capped and sealed for transport.
In July 2003, fourteen months after construction of the substrate amendment pit
units, core samples were taken from the same units as sampled at 2 months (July 2002),
as well as selected tote units (Table 6.2). The tote units had three distinct layers of
materials while the substrate amendment pits had only two. However, the core tubes
used for sampling were only 10 cm tall, and therefore, were only able to sample the top
layer (~2 cm) and part of the middle layer (~8 cm). After collection, core samples were
stored at 4ºC and shipped via ground transport to the Toxicology Centre at the
University of Saskatchewan, Saskatoon, SK, for testing and analysis. In addition,
(a) (b)(a) (b)

106
samples of surface water from Deep Wetland were collected in 10-L plastic containers
and shipped to the laboratory along with the sediment cores.
Once samples arrived at the Toxicology Centre, observations were made of the
height, texture and layering of each core, and any indigenous fauna were removed.
Substrate cores were then carefully transferred into 250-mL glass beakers, taking care to
ensure that the different layers remain relatively intact, and beakers were filled with the
untreated surface water taken from Deep Wetland at the time of collection. Core
samples were allowed to settle, after which time the overlying water was gently aerated
overnight, as per Environment Canada (1997) protocol, to ensure that the levels of
dissolved oxygen in each beaker were above 40 % saturation before test animals are
added.
Table 6.1. Treatment combinations sampled from substrate amendment pits located in Deep Wetland at the Syncrude Canada Ltd. mine site.
Bottom Layer (10 cm) Top Layer (2 cm) Native Soil Native Soil Native Soil Peat Tailings Sand Tailings Sand Tailings Sand Peat Syncrude Coke Syncrude Coke Syncrude Coke Peat Suncor Coke Suncor Coke Suncor Coke Peat
Table 6.2. Treatment combinations sampled from plastic totes located in Deep Wetland at the Syncrude Canada Ltd. mine site.
Bottom Layer (29 cm) Middle Layer (10 cm) Top Layer (2 cm) Mature Fine Tailings Syncrude Coke Syncrude Coke Mature Fine Tailings Syncrude Coke Peat Composite Tailings Syncrude Coke Syncrude Coke Composite Tailings Syncrude Coke Peat
107
6.2.2 Laboratory Prepared Samples
In addition to the field-collected core samples described above, complementary
samples were prepared in the laboratory, directly in 250-mL beakers, using the same
substrate combinations as those sampled from both the field substrate amendment pits
and tote units. These samples were prepared immediately prior to testing the field
samples collected from the Deep Wetland field site at 14 months. These samples
represented fresh (0 months aging in the field) substrate combinations and were run
simultaneous with the 14 month field samples to evaluate if the toxicity of these
combinations changed over time. The fresh samples were prepared on Day –1 of the
experiment, and aerated and allowed to settle exactly as the field samples were in
preparation for bioassay testing.
6.2.3 Test Conditions
The animals used in this experiment were the aquatic macroinvertebrate,
Chironomus tentans. This benthic invertebrate is an ideal choice for these types of
tests, since most of its life cycle occurs in the sediment, allowing for increased contact
with the test substances.
Chironomus tentans were obtained from a laboratory culture maintained at the
Toxicology Centre, University of Saskatchewan. Organisms were cultured in an
environmental chamber at a photoperiod of 16:8 h light:dark and a temperature of 23 ±
1°C. The culture was maintained using performance-based techniques according to
culturing protocols outlined by Environment Canada (1997). Culture organisms were
fed three times per week with Tetramin® fish food slurry. The culture water was
carbon-filtered, City of Saskatoon municipal water aerated overnight prior to addition to
the culture tanks to ensure that the correct temperature and dissolved oxygen levels
were obtained.
Test animals were acquired by aspirating fully emerged adults from the main
colony into a 500-mL Erlenmeyer flask. The adults were then transferred to a glass
breeding jar containing a piece of Parafilm® floating on a thin layer of culture of water
and two strips of plastic netting, thus providing ample surface area for mating. Each
morning, the breeding jar was checked for egg masses, which, if present, were then

108
transferred to 10-L glass aquaria (2-3 masses per aquaria) containing a thin layer of
rinsed culture sand (particle size 250-425 μm) and aerated culture water. After the first
48 h, animals were fed three times per week with 2.5 ml of a 6 mg/L Tetramin® fish
food slurry. After 10 d, larvae (second instar) were transferred from these tanks to glass
pans where they were separated from their cases using plastic pipettes before being
added to test beakers.
A total of ten 10-d old C. tentans larvae were added to each beaker containing a
sediment core at the start of the test. For samples collected after field aging for 2
months, tests were run directly in the core tubes used for sampling. Because of low
survival in this test, bioassays using the treatment combinations from the substrate
amendment pit units aged 0 and 14 months were run in 250-mL beakers as described
above.
At the end of all tests, each beaker or tube was assessed for changes in survival
and growth (measured as dry weight after 48 h at 60ºC) of C. tentans larvae. These
were static tests and both dissolved oxygen (mg/L) and temperature (º C) in the
overlying water were checked on a daily basis in all test vessels. Overlying water was
also sampled (10 mL) on days 5 and 10 for ammonia to ensure that these levels were not
so high as to cause toxicity, thereby confounding results. Separate samples of the
overlying water (10 mL) were collected and analyzed for alkalinity, hardness,
conductivity and pH at the end of the 10 d test to ensure that these variables were within
the acceptable range for proper C. tentans survival and growth.
6.2.4 Statistics
Statistical analyses were performed using the computer program SigmaStat®,
version 3.0 (SPSS Inc., Chicago, IL, USA) at a 95% (α= 0.05) level of confidence.
Significant differences among substrate combinations from the substrate amendment pit
units for both C. tentans survival and growth (dry weight) were assessed for each
sampling time (0, 2 and 14 months) using two-way analysis of variance (ANOVA) with
substrate type (bottom layer) and presence/absence of peat amendment (top layer) as the
two factors. Survival at 14 months failed the test and transformation for normality, so a

109
Kruskal-Wallis one-way ANOVA on Ranks was used to evaluate differences among
treatments. Multiple pairwise comparisons were evaluated with a Holm-Sidak test for
both ANOVA tests.
Significant differences among survival and growth (dry weight) of C. tentans for
different substrate treatments from the tote units for 0 months (fresh) and 14 months
(aged) were assessed using one-way ANOVA. The test used for normality was
Kolmogorov-Smirnov and the test for homogeneity of variance was the Levene median
test. Survival and growth at both 0 and 14 months failed the test and transformation for
homogeneity of variances, so a Kruskal-Wallis one-way ANOVA on Ranks was used to
evaluate differences among treatments. Multiple pairwise comparisons were evaluated
with a Holm-Sidak test.
6.3 Results
6.3.1 Substrate Amendment Pit Units
Survival and growth of C. tentans larvae for tests using substrates from the
substrate amendment pit units are shown in Figure 6.2. Data for the 2-month sampling
time cannot be directly compared to the 0-and 14-month test data due to the differences
in test methods (i.e. tested in core tubes vs. beakers). Animals that were removed from
the weathered samples consisted mostly of snails. Other fauna may initially have been
present, but not observed if they died and decomposed before the cores were analyzed.
No significant differences for either survival or growth of C. tentans (p > 0.05)
were observed between substrate treatments containing peat and those without peat for
any sampling time. Furthermore, no significant differences were observed in survival
of C. tentans for any substrate treatment at each individual sampling time. However,
there was poor survival (16.7%) in the 2 month aged treatments compared to the 0 and
14 month substrate treatment combinations. Growth data for this same time point (2
months) show that the growth of C. tentans was better than or equal to that observed for
the 0 month samples.
Growth of C. tentans in the 0 month (fresh) samples was significantly less than
in the 14-month aged samples across all substrate types. This trend was also observed

110
in the survival data, excluding the tailings sand treatment, although it was not
statistically significant (Figure 6.2a).
Tailings sand and both Syncrude and Suncor coke treatments at 0 months had
significantly (p < 0.05) lower C. tentans growth than the native sediment treatment at
this same time point. However, these differences were not observed for any of the
treatments at 2 and 14 months. Growth of C. tentans was also significantly decreased
(p < 0.001) in treatments with Suncor coke compared to both Syncrude coke and
tailings sand (Figure 6.2b).
Observations on the heights and layering of the core samples from the substrate
amendment pits taken after aging for 2 and 14 months in Deep Wetland are listed in
Table 6.3. These data show that the thickness of the peat layer in most of the treatments
had decreased substantially after aging in Deep Wetland for 2 and 14 months.
However, there also appeared to be a trend of organic matter depositing on the surface
of some of the treatments without peat previously added, especially after 14 months of
aging.

111
Figure 6.2. Mean (± SE) survival (a) and growth, measured as dry weight, (b) of Chironomus tentans larvae after a 10-d bioassay using sediment cores taken from substrate amendment pit units constructed at the Deep Wetland field site at Syncrude Canada Ltd. * Denotes a statistical difference from the native sediment treatment, # denotes a statistical difference from the Suncor coke treatment, and ** denotes a significant difference from the corresponding 0 months aged treatment. Open bars indicate cores constructed using fresh substrates in the laboratory (0 months), and hatched and solid bars indicate cores taken after aging for 2 and 14 months, respectively, at the Deep Wetland field site. (Native denotes the sediment pre-existing at the Deep Wetland field site, sand denotes the tailings sand produced during the bitumen extraction process, Syn denotes Syncrude coke, and Sun denotes Suncor coke).
0
20
40
60
80
100
120
140
160
Surv
ival
(%)
0 Months2 Months14 Months
0
0.5
1
1.5
2
2.5
3
3.5
4
4.5
5
Dry
Wei
ght (
mg)
(b)
*
* #
* #
Native Native + Peat
Sand Sand + Peat
Syn Syn + Peat
Sun Sun + Peat
(a)
****
**
****
**
**
**

112
Table 6.3. Visual observations made on substrate combinations sampled from the substrate amendment pits after aging for 2 and 14 months in Deep Wetland, Syncrude Canada Ltd.
Original Substrate Combination
Observations after aging for 2 months Observations after aging for 14 months
Native Soil -Organic matter (i.e. leaves, grass, small sticks) on top of core samples -Soil layer is 1.5 to 5.7 cm high
-Thin (0.1 cm) layer of organic matter (i.e. leaves, grass, small sticks) on top of core samples -Soil layer is 2.1 to 5.1 cm high
Native Soil + Peat -Thin brown organic layer on top of core with some grass and leaves present -Soil layer is 1.2 to 4.7 cm high
-Thin brown organic layer on top of cores with some grass and leaves present -Soil layer is 6.0 to 8.2 cm high
Tailings Sand -No organic matter visible on top of core -Sand is granular, brown with black speaks -Sand layer is 2.5 to 5.7 cm high
-Layer of organic matter (0.1 to 1.0 cm) visible on top of cores -Sand layer is 5.5 to 8.1 cm high
Tailings Sand + Peat -Thin visible dark brown peat layer -Small sticks and grass on surface of core -Sand layer is 3.9 to 5.5 cm high
-Thin (0.3 to 0.4 cm) visible dark brown peat layer -Lots of small sticks and grass on surface of cores -Sand layer is 3.9 to 5.5 cm high
Syncrude Coke -Thin light brown/tan layer on top of coke layer -Coke layer is 4.5 to 5.7 cm high
-Thin (0.1 to 1.0 cm) light grey organic layer on top of coke layer -Coke layer is 6.0 to 7.3 cm high
Syncrude Coke + Peat
-Thin layer (0.1 cm) of brown organic matter on top with some grass and leaves -Coke layer is 5.0 to 5.7 cm high
-Thin layer (0.1to 1.0 cm) of brown organic matter on top with some grass and leaves -Coke layer is 6.3 to 8.1 cm high
Suncor Coke -Some organic matter observed on top of cores (i.e. grass and roots) -Coke is black with large chunks, very porous -Coke layer is 1.5 to 4.5 cm high
-Thin (0.1 cm) light grey organic layer observed on top of cores (i.e. grass and roots) -Coke is black with large chunks, very porous -Coke layer is 4.5 to 7.3 cm high
Suncor Coke + Peat -Some organic matter on top of cores -Thin uneven dark brown layer on surface -Coke layer is 1.0 to 3.5 cm high
-Some organic matter on top of cores -Thin (0.3 to 0.8 cm) dark brown layer on surface -Coke layer is 4.1 to 6.8 cm high
112

113
6.3.2 Tote Units
Survival and growth data for tests with substrate cores from the tote units are
shown in Figure 6.3. No significant differences in either survival or growth of C.
tentans larvae were observed between substrate treatments containing a top layer of peat
and substrate treatments without peat. There were also no significant differences in
survival or growth between fresh substrate treatments (0 months) and tote substrate
treatments aged for 14 months in Deep Wetland. Despite the absence of statistical
significance, there was a trend of lower survival and growth of C. tentans in the 0
months samples. In addition, the lowest C. tentans survival occurred in both of the
MFT treatments, with the lowest being in the treatment without the peat layer added.

114
Figure 6.3. Mean (± SE) survival (a) and growth, measured as dry weight, (b) of Chironomus tentans larvae after a 10-d bioassay using sediment cores taken from tote units constructed at the Deep Wetland field site at Syncrude Canada Ltd. (solid bars) and sediment cores constructed using fresh substrates in the laboratory (open bars). (Syn denotes Syncrude coke, Sun denotes Suncor coke, MFT denotes mature fine tailings, and CT denotes composite/consolidated tailings).
0
20
40
60
80
100
120
140
160
Surv
ival
(%)
0 Months
14 Months
0
1
2
3
4
5
6
7
Dry
Wei
ght (
mg)
(b)
(a)
MFT + Syn MFT + Syn + Peat
CT + Syn CT + Syn + Peat

115
6.4 Discussion
6.4.1 Substrate Amendment Pit Units
Bioassays with the substrate amendment pit treatment combinations aged for 2
months yielded poor survival of C. tentans in the majority of the treatments, but growth
of C. tentans did not show the same trend. The increased growth of surviving
organisms in the native sediment may have been due to decreased competition among
test organisms for food and space rather than any direct, positive influence of the test
treatment. The lower density of organisms would allow for a greater availability of
resources per organism, theoretically translating into an increase in growth per
individual.
The influence of density on organism growth has previously been observed in an
experiment where the abundance of Chironomus plumosus larvae was artificially
increased. In this experiment, growth and development of larvae was negatively
impacted by increasing population density. It was concluded that the exploitation of
food resources was the main cause of this result (Tokeshi, 1995). A separate field study
conducted with Chironomus riparius also showed that growth rate was retarded by
density and that this, in turn, could affect the number of generations produced during a
season (Rasmussen, 1985).
There were no statistical differences in observed survival of C. tentans between
the 0 and 14 month aged treatments for any substrate type in the substrate amendment
pit units. This was, at least in the majority of cases, most likely due to the high standard
error for this endpoint (Figure 6.2a). High standard error is common in tests with field-
collected substrates (Conquest, 2000), so these results were not completely unexpected.
There was a statistically significant increase in growth of C. tentans in 14 month
aged treatments when compared to fresh, 0-month treatments (i.e. unweathered), for
every substrate type in the substrate amendment pit units. This observation is promising
since it implies that any adverse effects of using these substrate combinations may
decrease overtime when they are placed in an aquatic environment. Previous research
with field soils confirms the hypothesis that toxicant bioavailability decreases with the

116
amount of aging it undergoes (Lock and Janssen, 2003). Environmental variables such
as pH, soil moisture content, drying and rewetting cycles, and temperature seem to have
the greatest affect on the rate of aging and detoxification (Lock and Janssen, 2003).
A significant difference in C. tentans growth between aged and fresh native
sediment was unexpected. However, water saturation to near 100% at the sediment
surface for a substantial part of the year (as occurs in wetland areas) limits oxygen
diffusion deep into the soil. As a result, available dissolved oxygen is consumed by
microbial respiration, creating an environment with a high biochemical oxygen demand
(BOD) (Gambrell, 1994). The BOD is defined as a measure of the amount of oxygen
(in mg O2 per litre of water) used up during oxidation by aerobic bacteria (Schwedt,
2001). The fresh native sediment used in these experiments was sampled directly as
wet sediment from Deep Wetland and stored in sealed pails for approximately a year
before being utilized as a substrate in this experiment. This could have maintained a
high BOD and consequently, may have contributed to the differences in toxicity
between the non-weathered and weathered treatments. Although the overlying water
for both fresh and aged samples was aerated and allowed to sit for 24 h before adding
the test organisms, the level of dissolved oxygen in the pore water (unmeasured) of the
native sediment may have been lower than that required for the “normal” growth of C.
tentans. This would not have been the case for the remaining substrates (sand,
Syncrude coke and Suncor coke) since these were sampled and stored in sealed pails as
dry materials.
There was a significant difference in the growth of C. tentans between Suncor
coke and Syncrude coke for the 0 months (fresh) treatments. These differences were
not seen for the 14 months aged treatments. Weathering (aging) may cause the lighter,
coarser parts of Suncor coke to be washed away, decreasing the overall particle size of
this treatment. This was illustrated by the large amounts of Suncor coke observed to be
floating and congregating on the water surface at the ends of Deep Wetland
immediately after construction of the substrate amendment pits. A smaller particle size
may make Suncor coke a more hospitable environment for the growth of C. tentans
larvae. However, this phenomenon does create the potential for toxicants to be spread

117
through connected wetland areas if the overlying water containing the floating Suncor
coke is able to flow between them.
There were no statistical differences in the survival or growth of C. tentans
between substrates with or without a peat amendment for any of the substrate
combinations tested. This may be because the lighter density of the peat caused some
of it to be washed “downstream” (much like some of the Suncor coke layer) in the
wetland and away from the substrate amendment pits after their construction. This
resulted in less of the peat actually staying on the surface of the substrate amendments
as observed in the core samples taken after aging for 2 and 14 months (Table 6.3). In
some cases, although peat was still present on the surface of the cores, the thickness of
some of the peat layers had decreased substantially after aging for 14 months.
6.4.2 Tote Units
No significant differences in either survival or growth of C. tentans were
observed between treatments aged for 0 and 14 months. However, there was a general
trend of lower survival and growth in the fresh substrates (0 months) versus those aged
for 14 months for all substrate treatment types. This observation parallels trends
observed with the substrate combinations tested in the substrate amendment pit units.
The 14 months aged substrates from in Deep Wetland had the opportunity for
toxicants contained within these substrates to leach out and be “washed” away or
diluted with the overlying water. Conversely, the fresh substrates were only capped
with the clean water added to each test beaker (200 mL) prior to the bioassay.
Therefore, any potentially toxic constituents that could readily leach out of these
substrates would be concentrated in a much smaller volume of water compared to the
aged treatments in Deep Wetland.
The research of Nix and Martin (1992) found that in test tanks containing oil
sands tailings, detoxification occurred though the migration of toxic compounds from
the tailings layer into the overlying water. It is probable that the trends of lower
survival and growth of C. tentans as observed in the tote unit samples was due to the

118
leaching of toxicants from the substrate layer into the overlying water. The fresh
treatments did not have the opportunity for detoxification by leaching into the wetland,
like the 14 months aged treatments, before their exposure to C. tentans.
In the fresh, 0 month aged treatments there was lower C. tentans survival in both
of the MFT treatments compared to the CT treatments, with the lowest being in the
MFT treatment without the peat layer added. This lower C. tentans survival in the MFT
treatments could be a result of the greater water content of MFT (65% water in MFT
versus 42% water in CT) (MacKinnon, 1989; Matthews et al., 2000). As the solids in
the MFT slowly consolidate in the tote units, the interstitial water, which contains
potentially toxic constituents, forms a layer on top of the solids. This water layer can
then migrate through the coke and peat layers and potentially reach the clean overlying
water cap (van den Heuvel et al., 1999; Matthews et al., 2000). However, the trend of
lower toxicity in the peat-capped treatments implies that peat has the potential to either
provide an adequate buffer by binding the toxic constituents found in the coke and/or
tailings layers before they reach the clean water cap, or it can provide an adequate base
(i.e. organic matter and particle size) for improved survival of C. tentans.
6.5 Conclusions
Overall, there were few statistically significant differences in the survival and
growth of C. tentans when these animals were exposed to different substrate
combinations from the substrate amendment pit units. However, there was a significant
decrease C. tentans growth in the fresh treatment (0 months) compared to the aged
treatment (14 months). This observation implies that the toxicity, or stress caused by
different oil sands waste products, once used as part of an aquatic reclamation strategy,
can decrease with the amount of aging or weathering it undergoes.
There is the potential for greater initial stress or toxicity to aquatic organisms
when the substrates are freshly added to the reclaimed wetlands. Colonization of
reclaimed wetlands by benthic invertebrates may therefore initially be slow. As a
result, a detoxification (aging) period may have to occur prior to colonization to allow
for the potential toxicity of the substrates to decrease to a more viable level.

119
There was a trend of increased survival and growth in substrates from the tote
units capped with peat versus those without peat. This peat layer may have provided a
buffer between the coke/tailings layer and the overlying water cap. Having an
additional layer over the more toxic substrates (such as tailings and coke) could reduce
the leaching of toxic constituents from the waste material into the overlying water, thus
reducing exposure and potential toxicity to aquatic organisms. However, this
hypothesis should be further evaluated in order to ensure that using a capping option,
such as peat, in future aquatic reclamation practices at the Alberta oil sands is both
worthwhile and ecologically viable.
Previous research has identified the nature of the substrate as an important factor
influencing patterns of Chironomid distribution and community structure. Although
some organisms display habitat preferences for certain sediment characteristics, such as
particle size, many species of Chironomus are capable of adapting to and utilizing a
variety of substrate types (Pinder, 1995). Nevertheless, it is possible that the differences
in C. tentans growth seen in this study were a result of the physical characteristics of the
substrates, rather than the presence of toxic constituents. Dissolved oxygen levels in
some substrates (unmeasured) may also have been low and thus caused some level of
stress. However, most tube-building Chironomidae can counteract this phenomenon by
raising the openings of their tubes above the level of the sediment. This allows them to
maintain an adequate concentration of dissolved oxygen by using their bodies to drive
fresh water through the tubes. This mechanism replenishes oxygen while flushing out
metabolites and carbon dioxide (Pinder, 1995).
Based on the results obtained in these experiments, there is little reason to
suspect that exposure to aged oil sands materials would substantially impede the
colonization of reclamation wetlands by benthic macroinvertebrates, such as
Chironomus tentans. However, the amounts of waste materials used in the construction
of the substrate amendment pits and tote units may have been too small to accurately
assess the impacts from a full-scale aquatic reclamation program. The greater amount
of waste material that would be used in the construction of these wetlands could
possibly produce a significant effect once placed in an aquatic environment. It is
recommended that a larger scale reclamation study using more realistic amounts of

120
waste materials (relative to the volume of overlying water) be conducted to better
determine the potential impacts of these waste inputs on the associated aquatic
ecosystem.

121
7. GENERAL DISSCUSSION
7.1 Project Rationale
The goal of reclamation at the Athabasca oil sands is to achieve maintenance-
free, self-sustaining ecosystems with capabilities equivalent to or better than pre-
disturbance conditions (Golder Associates Ltd., 2000). The main sources of toxicity
from the oil sand mining process to the surrounding ecosystem have been identified as
the tailings (fine and coarse), process water, sulfur, and coke. Both Suncor and
Syncrude maintain a no discharge policy in regards to these contaminants. Therefore,
these waste products are stored on site until reclamation occurs.
The waste product coke is produced during the heavy oil upgrading processes.
Syncrude Canada Ltd. uses an unconventional continuous fluid coking system,
involving the use of both a reactor and a burner. Suncor Inc. uses a delayed coking
process, which is a ‘batch by batch’ procedure with each coker unit containing a heater
and a pair of drums.
The amount of coke produced currently at the Syncrude and Suncor operations
(over 2,000 tonnes per operation per day) is significantly more than can be combusted
and/or sold. Therefore, it must be stored on site in “coke cells” and these then become a
necessary component of the reclamation landscapes. Coke contains a high amount of
organic carbon. The additional input of organic carbon is useful for the timely
development of sustainable wetlands on old oil sands leases where organic matter is not
very abundant. As a result, the abundance of coke, with its high percentage of organic
matter, makes it a very attractive option for use in the aquatic reclamation process.

122
It is as yet unclear whether or not coke poses a significant toxicological risk (i.e.
through leaching of constituent chemicals and elements) to the aquatic or terrestrial
environments if used in a long-term reclamation capacity. The primary objective of this
research was to evaluate whether stockpiled Syncrude Canada Ltd. and Suncor Energy
Inc. coke can safely and effectively be used as a substrate amendment in an aquatic
reclamation option.
7.2 Leaching Experiments
7.2.1 Leachability of Coke
Several aging/weathering experiments were conducted as part of this thesis to
determine under what conditions coke would most likely release potentially toxic
constituents into the surrounding reclamation landscape. This was done by exposing the
coke to different overlying water quality conditions (i.e. DO, pH and freeze-thaw) for
periods of 30 or 90 days. These treatments were designed to better assess the extent to
which toxicants are released from the coke in an aquatic environment and to identify
what conditions are most important when considering coke as a substrate amendment in
a reclamation landscape.
Upon the exposure of coke to water, an immediate release (i.e. within a few
hours) of metals was measured in both the pore water and overlying water. After this
initial release, metal concentrations tended to increase in overlying waters and at the
same time, decrease in the coke pore waters over the remainder of the leaching period.
This resulted in the establishment of near equilibrium conditions between the pore and
overlying water phases presumably since metals released into pore waters can diffuse
into the less concentrated overlying waters (Barna et al., 2005). This shows the
potential of coke to leach toxic constituents into the environment if incorporated as a
substrate amendment in an aquatic reclamation program.
Coke from the Syncrude operations tended to release higher concentrations of
metals into the pore water and overlying water than coke from the Suncor operations.
This could be due to differences in particle size between the two coke types. Syncrude
123
coke has a much smaller particle size than Suncor coke. Therefore, there is more
surface area available for leaching to take place with Syncrude coke compared to the
same volume of Suncor coke.
Some metals which were identified to be of particular concern in these leaching
experiments were cobalt, copper, manganese, molybdenum, nickel, vanadium and zinc.
These elements reached concentrations in the pore water and overlying water that are
considered to be toxicologically relevant (i.e. higher than the CWQG and published
LC50 values for Chironomus sp.). However, elemental analyses of weathered versus
unweathered coke showed that the greatest mass (≥ 69%) of metals still remained within
the coke itself. The concentrations of trace metals found within the coke did not appear
to change substantially as a result of any of the weathering treatments. The small
changes that did occur can likely be attributed to the natural variation in coke that occurs
due to the variations in the starting oil sand material (i.e. bitumen). Since there were no
substantial changes in the elemental composition of coke between weathered and
unweathered samples, it can be assumed that the majority of the metals are either bound
tightly or trapped within the coke matrix, or they are attached to the coke surface in such
a way as to be unavailable using the weathering techniques and test durations employed
in these experiments.
There were few differences between the leaching patterns of metals from coke
among the different water quality conditions (dissolved oxygen, pH and freeze-thaw
cycles) evaluated as part of this thesis. The treatment which showed the greatest
influence on metal leaching from coke was pH. In the pH leaching experiment, the
majority of metals leached to a greater extent at low pH. This suggests that trace metals
may leach from coke once placed in an acidic, aqueous environment. This is a real a
possibility in a reclamation situation, where the overlying waters will have pH levels as
low as 6 due to layering with other waste products such as tailings (Golder Associates
Ltd., 2000). It is recommended that this variable be monitored in future studies to better
assess its potential impact on the leaching of metals from coke in an aquatic reclamation
wetland.

124
7.2.2 Accelerated Weathering Experiment
The immediate release of metals when coke was exposed to water in the
dissolved oxygen, pH and freeze-thaw leaching experiments was hypothesized to be
from one or all of three sources. These are: (i) metals associated with the natural soil or
sediment contaminating the coke during storage: (ii) metals that were weakly bound to
the surface of the coke, and/or (iii) metals bound or trapped within the coke matrix
itself. To determine from which of these sources this immediate release of metals was
originating, cokes from both Syncrude and Suncor were pre-treated before being leached
for 30 days. Coke was either rinsed with water to remove natural soil/sediment debris,
or rinsed with water and then treated with peroxide which removed both the natural
soil/sediment debris and any metals weakly bound to the coke surface.
Even though leaching occurred from all treatments (untreated, water rinsed and
peroxide treated) for most metals, the highest concentrations were observed to leach
from the untreated and water rinsed coke. Rinsing the coke with water before leaching
should have removed any soil and sediment debris, as well as any weakly surface bound
metals. Therefore, metals which leached from water rinsed coke must have been either
bound to the coke surface in such a way as to not be released through rinsing alone, or
these metals leached directly from the coke matrix.
There was a greater concentration of metals at the begining of the leaching
period in the untreated coke, but not in the water rinsed coke. Rinsing the coke could
have removed soil and sediment debris, thereby reducing the amount of metals leaching
into the pore water and overlying water. This decreased the potential toxicity of coke to
aquatic organisms by reducing the amount of metals leaching into the pore water and
overlying water. Therefore, the potential toxicity of coke if used as a substrate in an
aquatic reclamation strategy may be reduced by pre-rinsing with water.

125
7.3 Toxicity of Coke in an Aquatic Environment
7.3.1 Toxicity of Coke and its Leachate to C. tentans
On the last day of each leaching experiment, a 10-d toxicity test using the
aquatic macroinvertebrate, Chironomus tentans, was conducted. For each treatment, the
combination of coke and leachate, as well as the leachate independently were tested.
This allowed for the effects (both lethal and sublethal) of coke and its leachate to be
assessed separately.
In these experiments, Suncor coke had a significant negative effect on C. tentans
survival and growth when used as a substrate. However, these reductions were not seen
in treatments containing leachate without the presence of Suncor coke as a substrate.
Therefore, it was concluded that these effects were due to the physical properties of the
coke itself (i.e. particle size), rather than any potentially toxic constituents which
leached from the coke into the overlying water.
Macroinvertebrates such as C. tentans need to build tubes or burrows in or on the
sediment/substrate in order to successfully feed, breathe and protect themselves from
predation (Hare et al., 2001). In treatments containing Suncor coke as the substrate, C.
tentans had difficultly building tubes due to the larger particle size of Suncor coke.
Therefore, the stress created from the inability of these invertebrates to construct proper
tubes may have produced the significant decrease in both survival and growth of C.
tentans observed in the treatments using Suncor coke as the substrate.
Results from the leaching experiments showed that Syncrude coke had a higher
concentration of trace metals leaching into the pore water and overlying water than
Suncor coke. However, despite this greater potential for toxicity, no significant toxic
effects were seen in any of the C. tentans tests. Instead, a significant positive effect on
the growth of C. tentans was observed in the treatments containing Syncrude coke as a
substrate. Therefore, the compounds released into the leachate waters from Syncrude
coke were either not in a biologically active or available form, or the test animals used
in these experiments were able to tolerate the respective metal exposure concentrations.

126
7.3.2 Influence of Particle Size on the Toxicity of Coke to C. tentans
Particle size was thought to be one of the major reasons for the decreased
survival and growth of C. tentans observed when Suncor coke was used as a substrate.
To address this hypothesis, Suncor coke was crushed to a size comparable to that of
Syncrude coke. These coke types, along with control sand and uncrushed Suncor coke,
were used as substrates in a 10-d toxicity test with C. tentans.
This experiment showed that once the particle size of Suncor was reduced, its
effect on C. tentans decreased significantly. Based on these results, it may be useful for
Suncor to crush their coke to a smaller particle size before using it as a substrate
amendment in an aquatic reclamation strategy. Reducing the particle size of Suncor
coke, or covering it with a finer particle layer, would allow aquatic macroinvertebrates
living in this substrate to better utilize it for habitat construction, thus increasing the
success of initial substrate colonization in an aquatic reclamation strategy.
7.4 Field Experiments
Two types of experimental field systems were implemented at the Deep Wetland
field research site located on Syncrude Canada Ltd. property. These systems were used
to investigate the viability of using waste products from the Alberta oil sands as
amendment options in an aquatic reclamation strategy. The first of these systems were
substrate amendment pits which consisted of a hole dug into the natural sediment of the
wetland and filled with various combinations of oil sands waste materials. The second
type of experiment units were plastic totes that were filled with various three-layered
combinations of substrates and inserted into holes dug into the sediment of Deep
Wetland.
Core samples from the different substrate combinations from the substrate
amendment pits and tote units were collected at different points over two field seasons
(2002 and 2003). Toxicity tests using C. tentans were run with these samples, along
with samples that were prepared with fresh materials in the laboratory. This was done in
order to compare the toxicity of fresh substrates with those that had aged in the field for
14 months.

127
Overall, there were few statistically significant differences in the survival and
growth of C. tentans when these animals were exposed to different substrate
combinations from the substrate amendment pit units. However, there was a significant
decrease C. tentans growth in the fresh treatment (0 months) compared to the aged
treatment (14 months). This observation implies that the toxicity, or stress caused by
different oil sands waste products, once used as part of an aquatic reclamation strategy,
can decrease with the amount of aging or weathering it undergoes.
Results from these experiments showed the potential for acute toxicity to aquatic
organisms when reclamation substrates are initially added to a reclamation wetland.
Colonization of a reclaimed wetland by benthic invertebrates may therefore be slow due
to this toxicity. A period of detoxification may have to occur prior to adding waste
materials to a reclamation wetland. Allowing the substrates to age may reduce their
initial toxicity to aquatic organisms to a level viable for the sustainability of aquatic
reclamation landscapes.
7.5 Toxicology of Metals of Concern
Cobalt: The reported 96-hr LC50 for cobalt to fathead minnow (Pimephales promelas) is
91.9 mg/L (Marr et al., 1998). Few studies appear to exist that assess the toxicological
impacts and mode of action of cobalt in aquatic organisms. Due to this lack of data,
Canadian Water Quality Guidelines for the protection of aquatic life have not been
developed.
Copper: Copper is considered an essential metal. Therefore, many aquatic organisms
have developed strategies to regulate their body Cu concentrations (Rainbow and
Dallinger, 1993). Copper may bind to nitrogen and sulfur atoms in the proteins of
aquatic macroinvertebrates (Borgmann and Norwood, 2002). Accumulation of copper
in Chironomus riparius larvae has been shown to cause significant growth impairment
at exposure concentrations of 0.09 mg (Timmermans et al., 1992). Accumulation of
copper in the gills of freshwater fish has been shown to inhibit Na ion influx and reduce
Na-K ATPase activity (Santore et al., 2001).

128
Manganese: A study conducted by Fargašová (1997) found that the 96-hr LC50 of
manganese for Chironomus plumosus larvae was 0.055 mg/L. Manganese activates an
essential part of enzyme systems that metabolize proteins and energy in all animals
(Reimer, 1998). It concentrates in the mitochondria and is therefore present in higher
concentrations in tissues rich in mitochondria. Manganese concentrations in fish tissue
were found to be higher in liver and gill tissue than in muscle tissue (Reimer, 1998).
Molybdenum: At sufficiently low concentrations, molybdenum is a required
micronutrient (Naddy et al., 1995). In a study conducted by Khangarot (1991) the 96-hr
LC50 for the worm Tubifex tubifex was 28.91 mg/L. Although the mode of toxicity in
aquatic invertebrates is not currently understood, molybdenum has been shown to inhibit
copper uptake in mammals (Whiting et al., 1994).
Nickel: Chironomus riparis larvae have been shown to be relatively tolerant of nickel
concentrations when compared to other species (Powlesland and George, 1986). Nickel
has been shown to bind to oxygen atoms in protein ligands of aquatic organisms
(Borgmann and Norwood, 2002). Nickel is considered a respiratory toxicant in fish by
causing significant damage to gills, thereby impairing gas exchange, leading to
suffocation (Pane et al., 2003).
Vanadium: Little data are available on the impact of vanadium on aquatic organisms
(Ringelband, 2001). However, a study conducted by Fargašová (1997) found that the
96-hr LC50 for Chironomus plumosus larvae was 0.24 mg/L. Vanadium has been shown
to have inhibitory effects on the activity of the membrane-bound enzyme Na, K-ATPase
of the brackish water hydroid Cordylophora caspia (Ringelband, 2001).
Zinc: The genus Chironomus can regulate the bioaccumulation of zinc, as it is an
essential metal (Rainbow and Dallinger, 1993). However, Zn concentrations in C.
riparius larvae of 2500 ug/g dry weight has been shown to significantly decrease their
normal development and growth (Timmermans et al., 1992). The mode of action for
129
acute Zn toxicity in fish has been identified as hypocalcaemia, which is a decreased
blood concentration of Ca due to competition with Zn at Ca channels (de Schamphelaere
and Janssen, 2004a).
7.6 Integration of Results
As part of the proposed aquatic reclamation strategy at the Alberta oil sands,
coke would be used as one substrate layer in a wetland landscape. The possible long-
term effects that the waste product coke could produce on an aquatic environment have
not been investigated previously. Laboratory leaching studies conducted as part of this
thesis provide the first insight into the possible chemical and biological impacts of coke
on an aquatic environment. Results demonstrated that Syncrude and Suncor cokes
contain metals that can leach into the surrounding environment if used as a substrate in
an aquatic reclamation program. Some of these metals exceeded published LC50 values
for Chironomus species and Canadian Water Quality Guidelines for the protection of
aquatic life, showing that coke has the potential to pose a significant risk to biota if used
as part of an aquatic reclamation strategy at the Alberta oil sands.
Further experimentation with coke showed that a portion of the metals could be
leaching from the soil or sediment debris associated with the coke, or from metals bound
to the surface of the coke, which are then immediately dissolved after coming into
contact with water. Field experimentation showed the potential for the toxicity of oil
sand waste materials to decrease with weathering in a natural aquatic environment.
Therefore, the potential impact of incorporating coke as a substrate in an aquatic
reclamation strategy appears to be greatest shortly after incorporation. It is therefore
recommended that either active rinsing or a period of leaching be applied before coke is
used as a substrate in an aquatic environment. However, the potential for metals
leaching directly from the coke matrix after coke is allowed to weather for an extended
period of time must be considered. This may be a possible source of risk when applying
coke as a substrate in a permanent reclamation wetland.
Despite the potential for toxic effects on aquatic biota living in wetlands
constructed using coke as a substrate, experiments conducted as part of this thesis did
not observe any direct effects on the aquatic macroinvertebrate C. tentans as a result of
130
the release of metals from coke into pore water and overlying water. This could be a
result of the test species chosen for these experiments. Due to their ability to regulate
some metals, C. tentans is not considered to be the most sensitive species for evaluating
the effects of metal toxicity in an aquatic environment (Besser and Rabeni, 1987).
Furthermore, the endpoints (survival and growth) used to evaluate the toxicity of coke to
C. tentans are not as sensitive as those that can be evaluated in a longer duration toxicity
experiment. Therefore, a life-cycle experiment evaluating the effects of coke leachate
on the reproduction and behaviour of these insects may have shown some toxic effect
from the metals measured in the coke leachate.
Even though no toxic effects could be attributed to the coke leachate, some
decreases in the growth and survival of C. tentans were observed when Suncor coke was
used as a substrate in toxicity tests. These decreases may lead to effects on the
populations of future generations, thereby decreasing the long-term effectiveness of
using coke as a substrate in reclamation wetlands at the Alberta oil sands. In addition,
the particle size of Suncor coke was shown to contribute to its effects on C. tentans.
Therefore, either reducing the particle size of Suncor coke, or supplementing this
substrate with a smaller sized substrate layer, should reduce these negative effects.
7.7 Recommendations for Future Work
Leaching experiments conducted as part of this thesis looked at the effect of
different overlying water conditions (DO, pH and freeze-thaw) on the leaching of
potentially toxic constituents from coke. There are, however, other general water
quality conditions, such as water hardness and dissolved organic carbon, (DOC) that
should also be evaluated before coke should be considered for use as part of an aquatic
reclamation strategy. Water hardness and DOC have been shown to be important in
influencing the bioavailability of metals and other toxic constituents in aquatic systems
(Chirenje and Ma, 1999). Therefore, further leaching studies, such as those conducted
in this thesis, should be considered as a way to assess the effects of these variables on
the leaching potential of coke.
Based on the bioavailability and consequent toxicity of constituents within coke
to aquatic organisms, toxicity threshold levels should be established to determine if the

131
constituents leaching from coke during an aquatic reclamation strategy at the Alberta oil
sands have the potential to impair aquatic biota. These thresholds could be based on
either pre-existing or newly developed long-term aquatic toxicity data. It is important to
consider the most sensitive test species and endpoint (such as reproduction) when
conducting toxicity testing to establish thresholds. The data used to develop these
thresholds should be specific to the northern Alberta environment, which may already
contains background levels of these constituents as part of the natural oil sand deposits.
Thresholds can provide an accurate way of quantatively determining the risk of using
coke in an aquatic reclamation strategy.
As part of the field studies conducted in this thesis, a trend of decreasing toxicity
was seen for substrates capped with a layer of peat versus those without this capping
layer. The peat layer may have provided a buffer between the waste amendments layer
and the overlying water. This would theoretically reduce the leaching of toxic
constituents from the waste material (coke) into the overlying water, thus reducing
contaminant exposure and potential toxicity to aquatic organisms. Since the findings
discussed in this thesis could not verify statistically that an overlying layer of peat can
reduce the toxicity of oil sands waste to aquatic organisms, it is important that further
research be conducted to confirm this hypothesis. Both field and controlled laboratory
studies comparing the addition of peat as an additional substrate layer over coke would
be useful in determining if peat does indeed provide a significant positive effect when
coke and other waste materials are used as substrates in future aquatic reclamation
practices at the Alberta oil sands.
Using indigenous C. tentans populations from the oil sands region in toxicity
testing should also be explored. Indigenous organisms may have built a tolerance to
existing background levels of oil sands toxic constituents in order to adapt and survive
in this area. Using these organisms in future toxicity experiments with oil sands waste
materials may help to differentiate between the impact of increased loading of toxic
constituents from using coke as part of an aquatic reclamation strategy, and those
present due to the oil sand deposits found naturally in the Athabasca region
(Groenendijk et al., 2002).

132
The discrepancies between conclusions drawn from the chemical data (i.e. metal
leaching) and biological data (i.e. growth and survival of C. tentans) limit our ability to
draw definite conclusions about the viability of using oil sands coke as a substrate
amendment in an aquatic reclamation strategy. Often, laboratory studies have
limitations because their design can not account for many of the chemical and biological
complexities of the natural systems being considered. In these systems, the metal
concentrations and animals vary over time, therefore predicting toxicity in nature on the
basis of laboratory toxicity tests can be difficult (Hare, 1992). Long-term
weathering/leaching studies using coke as a substrate should therefore be conducted to
address these discrepancies. With these studies, the effects of the release of toxic
constituents from coke on different trophic levels within an aquatic ecosystem could be
more accurately assessed. The results obtained from these experiments could aid in
predicting the behaviour of coke and the metals leaching from the coke if used as part of
a long-term aquatic reclamation strategy at the Alberta oil sands.
Based on the results obtained from toxicity experiments conducted as part of this
thesis, there is little reason to suspect that exposure to aged oil sands materials would
impede the colonization of reclamation wetlands by benthic macroinvertebrates, such as
Chironomus tentans. However, a greater amount of waste material would be used
during the construction of full-scale reclamation wetlands. This additional loading may
alter the effects of coke on the surrounding aquatic system. It is therefore recommended
that a reclamation study using larger, more realistic amounts of waste materials be
conducted to better determine the impacts these waste inputs would have on the
surrounding aquatic ecosystem.

133
REFERENCES Baker, L.F. 2004. The effects of petroleum coke on macrophyte and invertebrate
communities of constructed wetlands. B.Sc. Thesis, University of Windsor, Windsor, ON.
Barata C., Baird D.J. and Markich S.J. 1998. Influence of genetic and environmental
factors on the tolerance of Daphnia magna Straus to essential and non-essential metals. Aquatic. Toxicol. 42:115-137.
Barna R., Rethy Z. and Tiruta-Barna L. 2005. Release dynamic process identification
for a cement based material in various leaching conditions. Part I. Influence of leaching conditions on the release amount. J. Environ. Manage. 74:141-151.
Barton D.R. and Wallace R.R. 1979. The effects of an experimental spillage of oil
sands tailings sludge on benthic invertebrates. Environ. Pollut. 18:305-312. Bendell-Young L.I., Bennett K.E., Crowe A., Kennedy C.J., Kermode A.R., Moore
M.M., Plant A.L. and Wood A. 2000. Ecological characteristics of wetlands receiving an industrial effluent. Ecol. Appl. 10:310-322.
Berg, M.B. 1995. Chapter 7: Larval food and feeding behaviour. In The
Chironomidae: The biology and ecology of non-biting midges, 1st Ed. Chapman and Hall, London, England.
Besser, J.M. and Rabeni, C.F. 1987. Bioavailability and toxicity of metals leached
from lead-mine tailings to aquatic invertebrates. Environ. Toxicol. Chem. 6:879-890.
Borgmann, U. and Norwood, W.P. 2002. Metal bioavailability and toxicity through a
sediment core. Environ. Pollut. 116:159-168. Carbonell A.A., Porthouse J.D., Mulbah C.K., DeLaune R.D. and Patrick W.H. Jr.
1999. Metal solubility in phosphogypsum-amended sediment under controlled pH and redox conditions. J. Environ. Qual. 28:232-242.
CCME. 2003. Canadian Water Quality Guidelines for the Protection of Aquatic Life.
Canadian Council of Ministers of the Environment, Environment Canada, Hull, QC.
Charlatchka, R. and Cambier, P. 2000. Influence of reducing conditions on solubility
of trace metals in contaminated soils. Water. Air. Soil. Pollut. 118:143-167. Chirenje T. and Ma L.Q. 1999. Effects of acidification on metal mobility in a
papermill-ash amended soil. J. Environ. Qual. 28:760-766.
134
Chung K.H., Janke L.C.G., Dureau R. and Furimsky E. 1996. Leachability of cokes from Syncrude stockpiles. Environ. Sci. Eng. Mag. March 1996:50-53.
Conquest, L. L., 2000. Chapter 7: Environmental monitoring: investigating
associations and trends. Statistics in Ecotoxicology, Edited by T. Sparks, John Wiley and Sons Ltd., New York, NY, USA.
Dawson R.F., Sego D.C. and Pollock G.W. 1999. Freeze-thaw dewatering of oil sands
fine tails. Can. Geotech. J. 36:587-598. de Bisthoven, L.J., Gerhardt, A. and Soares, A.M.V.M. 2004. Effects of acid mine
drainage on larval Chironomous (Diptera, Chironomidae) measured with the multispecies freshwater biomonitor. Environ. Toxicol. Chem. 23:1123-1128.
de Malherbe, R., Doswell, S.J., Mamalis, A.G. and de Malherbe, M.C. 1983. Synthetic
crude from oil sands. Fortschritt-Berichte der Zeitschriften. No. 3. de Schamphelaere, K.A.C. and Janssen, C.R. 2004a. Bioavailability and chronic
toxicity of zinc to juvenile rainbow trout (Oncorhynchus mykiss): comparison with other fish species and development of a biotic ligand model. Environ. Sci. Technol. 38:6201-6209.
de Schamphelaere, K.A.C. and Janssen, C.R. 2004b. Effects of dissolved organic
carbon concentration and source, pH, and water hardness on chronic toxicity of copper to Daphnia magna. Environ. Toxicol. Chem. 23:115-1122.
DiPanfilo R. and Egiebor N.O. 1996. Activated carbon production from synthetic
crude coke. Fuel. Proc. Tech. 46:157-169. Dudka, S. and Adriano, D.C. 1997. Environmental impacts of metal ore mining and
processing: a review. J. Environ. Qual. 26:590-602. Environment Canada. 1997. Test for growth and survival in sediment using larvae of
freshwater midges (Chironomus tentans or Chironomus riparius). EPS 1/RM/32. Environmental protection series, Biological Test Methods, Environment Canada, ON.
Fargašová, A. 1997. Sensitivity of Chironomus plumosus larvae to V5+, Mo6+, Mn2+,
Ni2+, Cu2+, and Cu+ metal ions and their combinations. Bull. Environ. Contam. Toxicol. 59:956-962.
Foght, J.M., Fedorak, P.M. and Westlake, D.W.S. 1985. Microbial content and
metabolic activities in the Syncrude tailings pond. AOSTRA. 1:139-146. Furimsky E. 1998. Gasification of oil sand coke: review. Fuel. Proc. Tech. 56:263-
290.

135
Gambrell, R.P. 1994. Trace and toxic metals in wetlands-a review. J. Environ. Qual.
23:883-891. Gao W., Smith D.W. and Sego D.C. 2004. Treatment of pulp mill and oil sands
industrial wastewaters by the partial spray freezing process. Water. Res. 38:579-584.
Golder Associates Ltd. 2000. Framework for oil sands reclamation performance
assessment: landforms and terrain units for oil sands developments. Suncor Energy Inc., Report 992-2280. Golder Associates Ltd., Calgary, AB.
Greenwood, N.N. and Earnshaw, A. 1997. Chemistry of the elements 2nd Ed.
Butterworth-Heinemann, Oxford, England. Groenendijk D., Lücker S.M.G., Plans M., Kraak M.H.S. and Admiraal W. 2002.
Dynamics of metal adaptation in riverine chironomids. Environ. Pollut. 117:101-109.
Har S.H. 1981. Characterization of oil sands fluid coke. University of Alberta MSc
Thesis, Edmonton, AB. Hare, L. 1992. Aquatic insects and trace metals: bioavailability, bioaccumulation, and
toxicity. Crit. Rev. Toxicol. 22:327-369. Hare L., Tessier A. and Warren L. 2001. Cadmium accumulation by invertebrates
living at the sediment-water interface. Environ. Toxicol. and Chem. 20:880-889. Heijerick, D.G., Janssen, C.R. and De Coen, W.M. 2003. The combined effects of
hardness, pH, and dissolved organic carbon on the chronic toxicity of Zn to D. magna: development of a surface response model. Arch. Environ. Contam. Toxicol. 44:210-217.
Herman D.C., Fedorak P.M., MacKinnon M.D. and Costerton J.W. 1994.
Biodegradation of naphthenic acids by microbial populations indigenous to oil sands tailings. Can. J. Microbiol. 40:467-477.
Holdway, D. and Sprague, J. 1979. Chronic toxicity of vanadium to flag fish. Water
Res. 13:905–910. Horne, M.T. and Dunson, W.A 1995. The interactive effects of low pH, toxic metals,
and DOC on s simulated temporary pond community. Environ. Pollut. 89:155-161.

136
Ingersoll, C.G., Haverland, P.S., Brunson, E.L., Canfield, T.J., Dwyer, F.J., Henke, C.E., Kemble, N.E., Mount, D.R. and Fox, R.G. 1996. Calculation and evaluation of sediment effect concentrations for the amphipod Hyalella azteca and the midge Chironomus riparius. J. Great Lakes Res. 22:602-623.
Irving, E.C., Liber, K. and Culp, J.M. 2004. Lethal and sublethal effects of low
dissolved oxygen condition on two aquatic invertebrates, Chironomus tentans and Hyalella azteca. Environ. Toxicol. Chem. 23:1561-1566.
Jack, T.R., Sullivan, E.A. and Zajic, J.E. 1979. Leaching of vanadium and other metals
from Athabasca oil sands coke and coke ash. Fuel. 58:589-594. Jennings, S.R., Dollhopf, D.J. and Inskeep, W.P. 2000. Acid production from sulfide
minerals using hydrogen peroxide weathering. Appl. Geochem. 15:247-255. Juvonen, R., Martikainen, E., Schultz, E., Joutti, A., Ahtiainen, J. and Lehtokari, M.
2000. A battery of toxicity tests as indicators of decontamination in composting oily waste. Ecotox. Environ. Safety. 47:156-166.
Kalbitz, K., Solinger, S., Park, J.-H., Michalzik, B. and Matzner, E. 2000. Controls on
the dynamics of dissolved organic matter in soils: a review. Soil Sci. 165:277-304.
Khangarot, B.S. 1991. Toxicity of metals to a freshwater tubificid worm, Tubifex
tubifex (Muller). Bull. Environ. Contam. Toxicol. 46:906-912. Komex International Ltd. 1998. Chemical and physical characterization of Syncrude’s
stockpiled coke. File number: KI-4668. Submitted to Syncrude Canada Ltd. by Komex International Ltd., Edmonton, AB.
Lai J.W.S., Pinto L.J., Kiehlmann E., Bendell-Young L.I. and Moore M.M. 1996.
Factors that affect the degradation of naphthenic acids in oil sands waste water by indigenous microbial communities. Environ. Toxicol. Chem. 15:1482-1491.
Lane S.J., Lee C.J., MacAskill D.N. and Hickey D.R. 1984. The toxicity of solid waste
and their leachates from heavy crude upgrading. Report produced by the Environmental Protection Service, Environment Canada in association with the Department of Supply and Services Canada, ON.
Leppanen, M.T., Postma, J.F., Groenendijk, D., Kukkonen, J.V.K. and Bucket-de Jong,
M.C. 1998. Feeding activity of midge larvae (Chironomus riparius Meigen) in metal-polluted river sediments. Ecotox. Environ. Safety. 41:251-257.
Leung , S.S-C., MacKinnon, M.D. and Smith, R.E.H. 2001. Aquatic reclamation in the
Athabasca, Canada, oil sands: naphthenate and salt effects on phytoplankton communities. Environ. Toxicol. Chem. 20:1532-1543.
137
Liber, K., Call, D., Dawson, T., Whiteman, F. and Dillon, T. 1996. Effects of
Chironomus tentans larval growth retardation on adult emergence and ovopositing success: implications for interpreting freshwater sediment bioassays. Hydrobiologia. 323: 155-167.
Lock K. and Janssen C.R. 2003. Influence of aging on metal availability in soils. Rev.
Environ. Contam. Toxicol. 178:1-21. MacKinnon, M.D. 1989. Development of the tailings pond at Syncrude’s oil sands
plat: 1978-1987. AOSTRA. 5:109-133. MacKinnon, M.D. 2002. Wetlands 2002 Review. Wetland Study Preview Session,
2002, Edmonton, AB. MacKinnon M.D. 2004. Syncrude Canada Ltd., Edmonton Research Centre. Personal
Communication, Edmonton, AB. MacKinnon, M.D. and Boerger, H. 1986. Description of two treatment methods for
detoxifying oil sands tailings water. Water. Poll. Res. J. Canada. 21:496-512. Madill R.E.A., Orzechowski, M.T., Chen, G., Brownlee, B.G. and Bunce, N.J. 2001.
Preliminary risk assessment of the wet landscape option for reclamation of oil sands mine tailings: bioassays with mature fine tailings pore water. Environ. Toxicol. Chem. 16:197-208.
Mankowski T. 1989. Introduction to Syncrude fluid cokes and fluid bed technology.
Available from Syncrude Canada Ltd, Edmonton, AB. Marr, J.C.A., Hansen, J.A., Meyer, J.S., Cacela, D., Podrabsky, T., Lipton, J. and
Bergmann, H.L. 1998. Toxicity of cobalt and copper to rainbow trout: application of a mechanistic model for predicting survival. Aquat. Toxicol. 43:225-238.
Matthews , J.G., Shaw, W.H., MacKinnon, M.D. and Cuddy, R.G. 2000. Development
of composite tailings technology and Syncrude Canada. Sixth International Symposium on Environmental Issues and Waste Management and Mineral Production. Calgary, Alberta. May 30-June2, 2000.
Meng X., Korfiatis G.P., Jing C. and Christodoulatos C. 2001. Redox transformations
of arsenic and iron in water treatment sludge during aging and TCLP extraction. Environ. Sci. Technol. 35:3476-3481.

138
Milani, D., Reynoldson, T.B., Borgmann, U. and Kolasa, J. 2003. The relative sensitivity of four benthic invertebrates to metals in spiked-sediment exposures and application to contaminated field sediment. Environ. Toxicol. Chem. 22:845-854.
Morford J.L. and Emerson S. 1999. The geochemistry of redox sensitive trace metals
in sediments. Geochim. Cosmochim. Acta. 63:1735-1750. Mousavi, S.K., Primicerio, R. and Amundsen, P-A. 2003. Diversity and structure of
Chironomidae (Diptera) communities along a gradient of heavy metal contamination in a subarctic watercourse. Sci. Total Environ. 307:93-110.
Muscatello, J.R. 2004. Chronic toxicity and accumulation of uranium in the aquatic
invertebrate Chironomus tentans. University of Saskatchewan MSc thesis, Saskatoon, SK.
Naddy, R.B., La Point, T.W. and Klaine, S.J. 1995. Toxicity of arsenic, molybedenum
and selenium combinations to Ceriodaphnia dubia. Environ. Toxicol. Chem. 14:329-336.
Nix, P.G. and Martin, R.W. 1992. Detoxification and reclamation of Suncors oil sand
tailings ponds. Environ. Toxicol. Water. Qual. 7:171-188. Pane, E.F., Richards, J.G. and Wood, C.M. 2003. Acute waterborne nickel toxicity in
the rainbow trout (Oncorhynchus mykiss) occurs by a respiratory rather than ionoregulatory mechanism. Aquat. Toxicol. 63:65-82.
Peeters, E.T.H.M., Dewitte, A., Koelmans, A.A., van der Velden, J. and den Besten, P.J.
2001. Evaluation of bioassays versus contaminant concentrations in explaining the macroinvertebrate community structure in the Rhine-Meuse delta, the Netherlands. Environ. Toxicol. Chem. 20:2883-2891.
Pery, A.R., Sumon, V., Mons, R., Flammarion, P., Lagadic, L. and Garric, J. 2003. A
model to understand the confounding effects of natural sediments in toxicity tests with Chironomus riparius. Environ. Toxicol. Chem. 22:2476-2481.
Phipps, G.L., Mattson, V.R. and Ankley, G.T. 1995. Relative sensitivity of three
freshwater benthic macroinvertebrates to ten contaminants. Arch. Environ. Contam. Toxicol. 28:281-286.
Pinder, L.C.V. 1995. Chapter 6: The habitats of chironomid larvae. In The
Chironomidae: The biology and ecology of non-biting midges, 1st Ed. Chapman and Hall, London, England.
Pollet, I. and Bendell-Young, L.I. 2000. Amphibians as indicators of wetland quality.
Environ. Toxicol. Chem. 19:2589-2597.

139
Powlesland, C. and George, J. 1986. Acute and chronic toxicity of nickel to larvae of
Chironomus riparis (Meigen). Environ. Pollut. 42:47-64. Rainbow, P.S. and Dallinger, R. 1993. Metal uptake, regulation and excretion in
freshwater invertebrates. In Ecotoxicology of metals in invertebrates. Lewis publishers, Boca Raton, FL, USA. pp. 119-131.
Rasmussen, J.B. 1985. Effects of density and microdetritus enrichment on the growth
of Chironomid larvae in a small pond. Can. J. Fish. Aquat. Sci. 42:1418-1422. Reimer, P.S. 1998. Environmental effects of manganese and proposed freshwater
guidelines to protect aquatic life in British Columbia. University of British Columbia MSc Thesis, Vancouver, BC.
Reynoldson, T.B. 1987. Interactions between sediment contaminants and benthic
organisms. Hydrobiologia. 149:53-66. Ribeiro, R., Lobes, I., Pereira, A.M.M., Goncalves, F. and Soarea, A.M.V.M. 2000.
Survival time of Ceriodaphnia dubia in acid waters with metal contamination. Bull. Environ. Contam. Toxicol. 64:130-136.
Ringelband, U. 2001. Salinity dependence of vanadium toxicity against the brackish
water hydroid Cordylophora caspia. Ecotox. Environ. Safety. 48:18-26. Rogers V.V. 2003. Mammalian toxicity of napthenic acids derived from the Athabasca
oil sands. University of Saskatchewan PhD thesis, Saskatoon, SK. Ruse L. 2002. Colonization of gravel lakes by Chironomidae. Arch. Hydrobiol.
153:391-407. Santore, R.C., Di Toro, D.M., Paquin, P.R., Allen, H.E. and Meyer, J.S. 2001. Biotic
ligand model of the acute toxicity of metals. 2. application to acute copper toxicity in freshwater fish and Daphnia. Environ. Toxicol. Chem. 20:2397-2402.
Sawhney, B.L., Bugbee, G.J. and Stilwell, D.E. 1995. Heavy metals leachability as
affected by pH of compost-amended growth medium used in container-grown rhododendrons. Compost Sci. Util. 3:64-73.
Schwedt, G. 2001. The essential guide to environmental chemistry. John Wiley and
Sons, Ltd., West Sussex, England. Scott A.C. and Fedorak P.M. 2004. Petroleum coking: a review of coking processes
and the characteristics, stability, and environmental aspects of coke produced by the oil sands companies. Suncor Energy Inc., Syncrude Canada Ltd. and Canadian Natural Resources Ltd, AB.

140
Seco, J.I., Fernandez-Pereira, C. and Vale, J. 2003. A study of the leachate toxicity of
metal-containing solid wastes using Daphnia magna. Ecotox. Environ. Safety. 56:339-350.
Simpson S.L. and Batley G.E. 2003. Disturbances to metal partitioning during toxicity
testing of iron(II)-rich estuarine pore waters and whole sediments. Environ. Toxicol. Chem. 22:424-432.
Singh S.P.N. 1985. Synthetic fuels: production and products. Vet. Hum. Toxciol.
28:285-290. Singh, S.P., Ma, L.Q., Tack, F.M.G. and Verloo, M.G. 2000. Trace metal leachability
of land-disposed dredged sediments. J. Environ. Qual. 29:1124-1132. Skoog, D.A., Joller, F.J. and Nieman, T.A. 1998. Principles of instrumental analysis.
5th Ed. Harcourt Brace & Company, Orlando, FL, USA. Sokolowski, A., Wolowicz, M. and Hummel, H. 2001. Distribution of dissolved and
labile particulate trace metals in the overlying bottom water in the Vistula river plume (Southern Baltic Sea). Marine Pollut. Bull. 42:967-980.
Speight JG. 1999. The chemistry and technology of petroleum, 3rd Ed. Marcel Dekker,
Inc., New York, NY, USA. Stubblefield, W.A., McKee, R.H., Kapp, R.W. Jr. and Hinz, J.P. 1989. An evaluation
of the acute toxic properties of liquids derived from oil sands. J. Appl. Toxicol. 9:59-65.
Suedel, B.C., Deaver, E. and Rodgers, J.H. Jr. 1996. Experimental factors that may
affect toxicity of aqueous and sediment-bound copper to freshwater organisms. Arch. Environ. Contam. Toxicol. 30: 40-46.
Sukreeyapongse, O., Holm, P.E., Strobel, B.W., Panichasakpatana, S., Magid, J. and
Hansen, H.C. 2002. pH-dependent release of cadmium, copper and lead from natural and sludge-amended soils. J. Envrion. Qual. 31:1901-1909.
Syncrude Canada Ltd. 1997. Syncrude 21 the facts. Syncrude Canada Ltd.
Government & Public Affairs, Fort McMurray, AB. Syncrude Canada Ltd. 2003. The coke manual: characterization of Syncrude fluid
coker deposits. Research Department Progress Report 32(7), Syncrude Canada Ltd., Edmonton, AB.
Syncrude Canada Ltd. 2004. Syncrude 21 the facts. Syncrude Canada Ltd.
Government & Public Affairs, Fort McMurray, AB.
141
Tessier, A., Campbell, P.G.C. and Bisson, M. 1979. Sequential extraction procedure
for the speciation of particulate trace metals. Anal. Chem. 51:844-851. Timmermans, K.R., Peeters, W. and Tonkes, M. 1992. Cadmium, zinc, lead and copper
in Chironomus riparius (Meigen) larvae (Diptera, Chironomidae): uptake and effects. Hydrobiologia. 241:119-134.
Timmermans, K.R. and Walker, P.A. 1989. The fate of trace metals during the
metamorphosis of chironomids (Diptera, Chironomidae). Environ. Pollut. 62:73-85.
Tokeshi, M., 1995. Chapter 10 Life cycles and population dynamics. In The
Chironomidae: The biology and ecology of non-biting midges, 1st Ed. Chapman and Hall, London, England.
Tyler, G. 1978. Leaching rates of heavy metal ions in forest soil. Water Air. Soil.
Pollut. 9:137-148. van den Heuvel M.R., Power M., MacKinnon M.D., Van Meer T., Dobson E.P. and
Dixon D.G. 1999. Effects of oil sands related aquatic reclamation on yellow perch (Perca flavescens). I. Water quality characteristics and yellow perch physiological and population responses. Can. J. Fish. Aquat. Sci. 56:1213-1225.
van Gestel, C.A.M., van der Waarde, J.J., Derksen, J.G.M. (A), van der Hoek, E.E.,
Veul, M.F.X.W., Bouwens, S., Rusch, B., Kronenburg, R. and Stokman, G.N.M. 2001. The use of acute and chronic bioassays to determine the ecological risk and bioremediation efficiency of oil-polluted soils. Environ. Toxicol. Chem. 20:1438-1449.
Wehrli, B. and Stumm, W. 1989. Vandyl in natural waters: adsorption and hydrolysis
promote oxygenation. Geochim. Cosmochim. Acta. 53:69-77. Whiting, E.R., Mathieu, S. and Parker, D.W. 1994. Effects of drainage from a
molybdenum mine and mill on stream macroinvertebrate communities. J. Fresh. Ecol. 9:299-311
Wickham, P., van de Walle, E. and Planas, D. 1987. Comparative effects of mine
wastes on the benthos of an acid and an alkaline pond. Environ. Pollut. 44:83-89. Wren C.D. and Stephenson G.L. 1991. The effect of acidification on the accumulation
and toxicity of metals to freshwater invertebrates. Environ. Pollut. 71:205-241. Zar, J.H. 1999. Biostatistical Analysis, 4th Ed. Prentice-Hall, Inc. Upper Saddle River,
NJ, USA.
142
Zhang, M.K., He, Z.L., Calvert, D.V., Stoffella, P.J. and Yang, X. 2002. Effects of the St. Lucie estuary muck sediment application on metal solubility and pH of sandy soils: a laboratory observation. Soil Sci. 167:377-389.
Zwolsman J.J.G. and van Eck G.T.M. 1999. Geochemistry of major elements and trace
metals in suspended matter of the Scheldt estuary, southwest Netherlands. Marine. Geochem. 66:91-111.

143
APPENDIX A: Mean ± SE metal concentrations (µg/L) from the dissolved oxygen leaching experiment using Syncrude (a) and Suncor (b) cokes. (n = 3) (BDL = below detection limit) (a) Treatment Al As Au Ba Ca Ce
Pore Water High Dissolved Oxygen Day 0 BDL BDL BDL 1.1 ± 0.5 5416.9 ±
1465.6 BDL
High Dissolved Oxygen Day 10 BDL BDL BDL 0.7 ± 0.3 4212.2 ±
226.4 BDL
High Dissolved Oxygen Day 30 BDL BDL BDL 1.0 ± 0.1 6676.2 ±
264.9 BDL
Low Dissolved Oxygen Day 0 BDL 0.6 ± 0.0 BDL 1.5 ± 0.3 6469.9 ±
597.3 0.0 ± 0.0
Low Dissolved Oxygen Day 10 BDL BDL BDL 1.0 ± 0.1 5347.0 ±
591.3 BDL
Low Dissolved Oxygen Day 30
4.5 ± 0.0 BDL BDL 1.5 ± 0.2 6632.2 ±
297.8 0.0 ± 0.0
Overlying Water
High Dissolved Oxygen Day 0 BDL BDL BDL 0.3 ± 0.0 2911.2 ±
58.7 BDL
High Dissolved Oxygen Day 10 BDL BDL BDL 1.1 ± 0.7 3708.4 ±
567.1 BDL
High Dissolved Oxygen Day 30
13.8 ± 0.0 BDL BDL 0.6 ± 0.0 4365.3 ±
320.0 BDL
Low Dissolved Oxygen Day 0 BDL BDL BDL 0.3 ± 0.1 3436.5 ±
21.9 BDL
Low Dissolved Oxygen Day 10
17.6 ± 0.0 BDL BDL 0.8 ± 0.2 3554.1 ±
180.1 BDL
Low Dissolved Oxygen Day 30
8.6 ± 0.0 BDL BDL 0.5 ± 0.0 4983.2 ±
148.8 0.0 ± 0.0
(b) Treatment Al As Au Ba Ca Ce
Pore Water High Dissolved Oxygen Day 0 BDL BDL BDL 0.4 ± 0.0 3246.4 ±
25.1 BDL
High Dissolved Oxygen Day 10
27.9 ± 0.0 BDL BDL 0.7 ± 0.0 5418.9 ±
1793.1 BDL
High Dissolved Oxygen Day 30 BDL BDL BDL 0.5 ± 0.0 6483.0 ±
57.2 BDL
Low Dissolved Oxygen Day 0 BDL BDL BDL BDL 3074.6 ±
28.8 BDL
Low Dissolved Oxygen Day 10 BDL BDL BDL 0.2 ± 0.0 3926.0 ±
187.1 BDL
Low Dissolved Oxygen Day 30 9.3 ± 0.0 BDL BDL 0.2 ± 0.0 7395.0 ±
308.2 BDL
Overlying Water
High Dissolved Oxygen Day 0 BDL BDL BDL 0.2 ± 0.1 3350.1 ±
233.9 BDL
High Dissolved Oxygen Day 10
13.4 ± 0.2 BDL BDL 0.3 ± 0.0 3342.1 ±
587.2 BDL
High Dissolved Oxygen Day 30 BDL BDL BDL 0.3 ± 0.0 4676.2 ±
289.8 0.0 ± 0.0
Low Dissolved Oxygen Day 0 BDL BDL BDL 0.2 ± 0.0 3038.2 ±
335.7 BDL
Low Dissolved Oxygen Day 10
12.8 ± 0.0 BDL BDL 0.3 ± 0.0 3831.0 ±
331.4 BDL
Low Dissolved Oxygen Day 30
41.0 ± 0.0 BDL BDL 0.2 ± 0.0 5850.0 ±
111.3 BDL

144
Appendix A continued (a) Treatment Co Cr Cu Dy Er Eu
Pore Water High Dissolved Oxygen Day 0 0.3 ± 0.1 BDL 4.7 ± 0.2 BDL BDL BDL
High Dissolved Oxygen Day 10 0.2 ± 0.0 BDL 1.0 ± 0.0 BDL BDL BDL
High Dissolved Oxygen Day 30 BDL 81.9 ±
72.9 BDL BDL BDL BDL
Low Dissolved Oxygen Day 0 0.4 ± 0.0 BDL 3.5 ± 0.6 BDL BDL BDL
Low Dissolved Oxygen Day 10 BDL 29.4 ± 4.7 1.1 ± 0.7 BDL BDL BDL
Low Dissolved Oxygen Day 30 BDL 26.9 ± 7.0 BDL BDL BDL BDL
Overlying Water
High Dissolved Oxygen Day 0 0.2 ± 0.0 BDL BDL 0.0 ±
0.0 BDL BDL
High Dissolved Oxygen Day 10 0.1 ± 0.0 BDL BDL 0.1 ±
0.0 BDL BDL
High Dissolved Oxygen Day 30 0.2 ± 0.0 BDL BDL 0.1 ±
0.0 BDL BDL
Low Dissolved Oxygen Day 0 0.2 ± 0.0 BDL 1.1 ± 0.0 0.1 ±
0.0 BDL BDL
Low Dissolved Oxygen Day 10 0.1 ± 0.0 BDL BDL 0.1 ±
0.0 BDL BDL
Low Dissolved Oxygen Day 30 BDL BDL BDL 0.1 ±0.0 BDL BDL
(b) Treatment Co Cr Cu Dy Er Eu
Pore Water High Dissolved Oxygen Day 0
10.7 ± 3.4 BDL 1.3 ± 0.1 BDL BDL BDL
High Dissolved Oxygen Day 10 2.6 ± 0.4 BDL 1.7 ± 0.1 BDL BDL BDL
High Dissolved Oxygen Day 30 1.1 ± 0.0 BDL 0.7 ±0.0 BDL BDL 0.1 ±
0.0
Low Dissolved Oxygen Day 0
20.5 ± 13.4 BDL 1.6 ± 0.1 BDL BDL BDL
Low Dissolved Oxygen Day 10 2.5 ± 0.0 BDL 0.6 ± 0.1 BDL BDL BDL
Low Dissolved Oxygen Day 30 0.8 ± 0.5 BDL 0.6 ± 0.0 0.2 ±
0.0 BDL BDL
Overlying Water
High Dissolved Oxygen Day 0 3.5 ± 0.0 BDL BDL 0.1 ±
0.0 BDL BDL
High Dissolved Oxygen Day 10 0.5 ± 0.0 BDL BDL BDL BDL BDL
High Dissolved Oxygen Day 30 0.9 ± 0.1 BDL 0.6 ± 0.0 0.1 ±
0.0 BDL BDL
Low Dissolved Oxygen Day 0 3.4 ± 0.5 BDL 22.2 ± 0.0 BDL BDL BDL
Low Dissolved Oxygen Day 10 0.3 ± 0.1 BDL BDL 0.2 ±
0.0 BDL BDL
Low Dissolved Oxygen Day 30 0.1 ± 0.0 BDL 0.7 ± 0.0 BDL BDL BDL

145
Appendix A continued (a) Treatment Fe Gd Hf Hg Ho La
Pore Water High Dissolved Oxygen Day 0 BDL BDL 0.7 ± 0.0 BDL BDL BDL
High Dissolved Oxygen Day 10 18.2 ± 0.0 BDL BDL BDL BDL BDL
High Dissolved Oxygen Day 30 88.2 ± 0.0 BDL 0.1 ± 0.0 BDL BDL 0.0 ±
0.0
Low Dissolved Oxygen Day 0 BDL BDL 0.1 ± 0.0 BDL BDL BDL
Low Dissolved Oxygen Day 10 BDL BDL 0.5 ± 0.0 BDL BDL BDL
Low Dissolved Oxygen Day 30 BDL BDL 0.4 ± 0.0 BDL BDL BDL
Overlying Water
High Dissolved Oxygen Day 0 BDL 0.0 ± 0.0 0.4 ± 0.2 BDL BDL BDL
High Dissolved Oxygen Day 10 BDL 0.1 ± 0.0 0.0 ± 0.0 BDL BDL BDL
High Dissolved Oxygen Day 30 BDL BDL BDL BDL BDL BDL
Low Dissolved Oxygen Day 0 BDL BDL 0.1 ± 0.0 BDL BDL BDL
Low Dissolved Oxygen Day 10 BDL 0.1 ± 0.0 0.1 ± 0.0 BDL BDL BDL
Low Dissolved Oxygen Day 30 BDL 0.1 ± 0.0 0.0 ± 0.0 BDL BDL BDL
(b) Treatment Fe Gd Hf Hg Ho La
Pore Water High Dissolved Oxygen Day 0 BDL BDL 0.3 ± 0.2 BDL BDL BDL
High Dissolved Oxygen Day 10 BDL BDL 0.2 ± 0.0 BDL BDL 0.0 ±
0.0
High Dissolved Oxygen Day 30 BDL BDL BDL BDL BDL BDL
Low Dissolved Oxygen Day 0 BDL BDL 0.1 ±0.0 BDL BDL BDL
Low Dissolved Oxygen Day 10 BDL BDL 0.1 ± 0.0 BDL BDL BDL
Low Dissolved Oxygen Day 30 BDL BDL BDL BDL BDL BDL
Overlying Water
High Dissolved Oxygen Day 0 BDL 0.1 ± 0.0 0.1 ± 0.0 BDL BDL BDL
High Dissolved Oxygen Day 10 BDL BDL 0.0 ± 0.0 BDL BDL BDL
High Dissolved Oxygen Day 30 BDL BDL 0.2 ± 0.2 BDL BDL BDL
Low Dissolved Oxygen Day 0 28.5 ± 0.0 0.1 ± 0.0 0.2 ± 0.2 BDL BDL BDL
Low Dissolved Oxygen Day 10 BDL BDL 0.5 ± 0.0 BDL BDL BDL
Low Dissolved Oxygen Day 30 BDL BDL BDL BDL BDL BDL
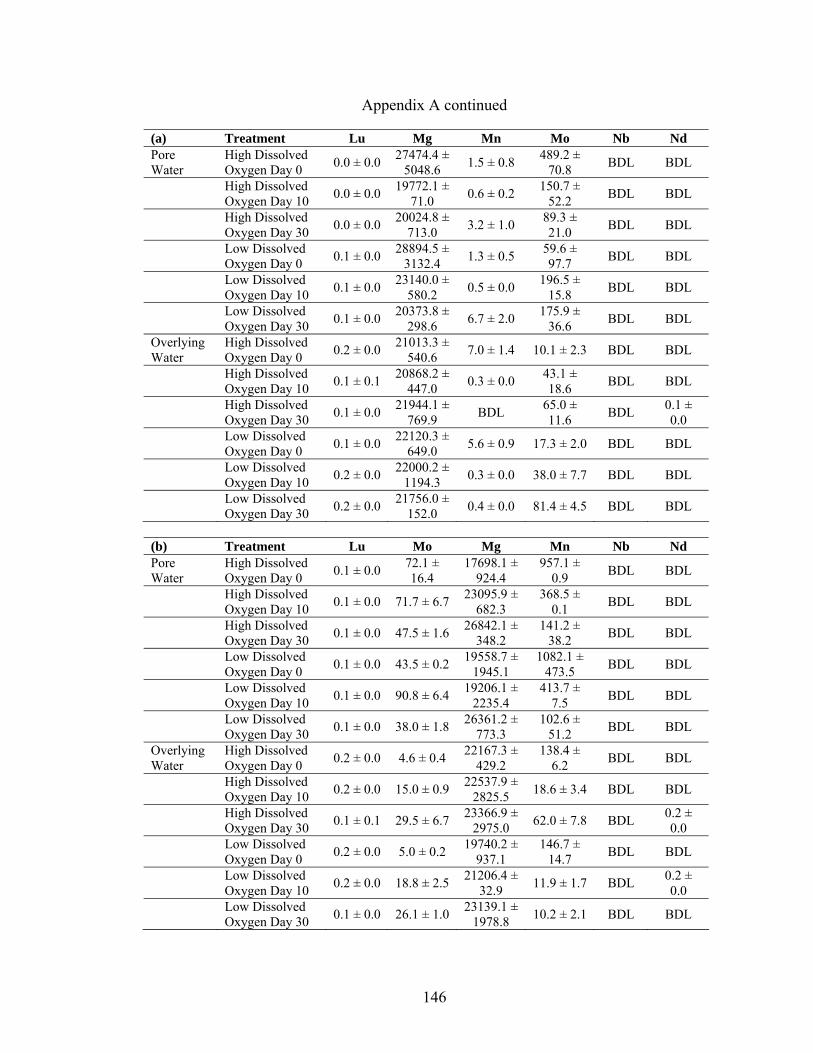
146
Appendix A continued (a) Treatment Lu Mg Mn Mo Nb Nd Pore Water
High Dissolved Oxygen Day 0 0.0 ± 0.0 27474.4 ±
5048.6 1.5 ± 0.8 489.2 ± 70.8 BDL BDL
High Dissolved Oxygen Day 10 0.0 ± 0.0 19772.1 ±
71.0 0.6 ± 0.2 150.7 ± 52.2 BDL BDL
High Dissolved Oxygen Day 30 0.0 ± 0.0 20024.8 ±
713.0 3.2 ± 1.0 89.3 ± 21.0 BDL BDL
Low Dissolved Oxygen Day 0 0.1 ± 0.0 28894.5 ±
3132.4 1.3 ± 0.5 59.6 ± 97.7 BDL BDL
Low Dissolved Oxygen Day 10 0.1 ± 0.0 23140.0 ±
580.2 0.5 ± 0.0 196.5 ± 15.8 BDL BDL
Low Dissolved Oxygen Day 30 0.1 ± 0.0 20373.8 ±
298.6 6.7 ± 2.0 175.9 ± 36.6 BDL BDL
Overlying Water
High Dissolved Oxygen Day 0 0.2 ± 0.0 21013.3 ±
540.6 7.0 ± 1.4 10.1 ± 2.3 BDL BDL
High Dissolved Oxygen Day 10 0.1 ± 0.1 20868.2 ±
447.0 0.3 ± 0.0 43.1 ± 18.6 BDL BDL
High Dissolved Oxygen Day 30 0.1 ± 0.0 21944.1 ±
769.9 BDL 65.0 ± 11.6 BDL 0.1 ±
0.0
Low Dissolved Oxygen Day 0 0.1 ± 0.0 22120.3 ±
649.0 5.6 ± 0.9 17.3 ± 2.0 BDL BDL
Low Dissolved Oxygen Day 10 0.2 ± 0.0 22000.2 ±
1194.3 0.3 ± 0.0 38.0 ± 7.7 BDL BDL
Low Dissolved Oxygen Day 30 0.2 ± 0.0 21756.0 ±
152.0 0.4 ± 0.0 81.4 ± 4.5 BDL BDL
(b) Treatment Lu Mo Mg Mn Nb Nd Pore Water
High Dissolved Oxygen Day 0 0.1 ± 0.0 72.1 ±
16.4 17698.1 ±
924.4 957.1 ±
0.9 BDL BDL
High Dissolved Oxygen Day 10 0.1 ± 0.0 71.7 ± 6.7 23095.9 ±
682.3 368.5 ±
0.1 BDL BDL
High Dissolved Oxygen Day 30 0.1 ± 0.0 47.5 ± 1.6 26842.1 ±
348.2 141.2 ±
38.2 BDL BDL
Low Dissolved Oxygen Day 0 0.1 ± 0.0 43.5 ± 0.2 19558.7 ±
1945.1 1082.1 ±
473.5 BDL BDL
Low Dissolved Oxygen Day 10 0.1 ± 0.0 90.8 ± 6.4 19206.1 ±
2235.4 413.7 ±
7.5 BDL BDL
Low Dissolved Oxygen Day 30 0.1 ± 0.0 38.0 ± 1.8 26361.2 ±
773.3 102.6 ±
51.2 BDL BDL
Overlying Water
High Dissolved Oxygen Day 0 0.2 ± 0.0 4.6 ± 0.4 22167.3 ±
429.2 138.4 ±
6.2 BDL BDL
High Dissolved Oxygen Day 10 0.2 ± 0.0 15.0 ± 0.9 22537.9 ±
2825.5 18.6 ± 3.4 BDL BDL
High Dissolved Oxygen Day 30 0.1 ± 0.1 29.5 ± 6.7 23366.9 ±
2975.0 62.0 ± 7.8 BDL 0.2 ± 0.0
Low Dissolved Oxygen Day 0 0.2 ± 0.0 5.0 ± 0.2 19740.2 ±
937.1 146.7 ±
14.7 BDL BDL
Low Dissolved Oxygen Day 10 0.2 ± 0.0 18.8 ± 2.5 21206.4 ±
32.9 11.9 ± 1.7 BDL 0.2 ± 0.0
Low Dissolved Oxygen Day 30 0.1 ± 0.0 26.1 ± 1.0 23139.1 ±
1978.8 10.2 ± 2.1 BDL BDL

147
Appendix A continued (a) Treatment Ni Pb Pr Rb Sb Sc Pore Water
High Dissolved Oxygen Day 0 BDL 0.1 ±
0.0 0.0 ± 0.0 4.0 ± 0.0 1.3 ± 0.0 3.6 ± 0.5
High Dissolved Oxygen Day 10 BDL BDL BDL 2.8 ± 0.1 0.6 ± 0.1 4.4 ± 1.7
High Dissolved Oxygen Day 30 BDL BDL 0.0 ± 0.0 2.5 ± 0.2 0.5 ± 0.0 3.7 ± 0.7
Low Dissolved Oxygen Day 0 BDL 0.1 ±
0.0 BDL 5.7 ± 0.6 1.2 ± 0.3 5.9 ± 1.2
Low Dissolved Oxygen Day 10 BDL BDL 0.0 ± 0.0 3.4 ± 0.3 0.84 ± 0.1 5.6 ± 0.4
Low Dissolved Oxygen Day 30 BDL BDL 0.0 ± 0.0 4.8 ± 0.3 0.7 ± 0.1 5.9 ± 0.4
Overlying Water
High Dissolved Oxygen Day 0 BDL BDL BDL 1.3 ± 0.3 0.1 ± 0.0 6.5 ± 0.9
High Dissolved Oxygen Day 10 BDL BDL BDL 2.2 ± 0.1 0.2 ± 0.0 3.9 ± 0.4
High Dissolved Oxygen Day 30 BDL 0.1 ±
0.0 BDL 3.2 ± 0.1 0.41 ± 0.1 4.5 ± 0.9
Low Dissolved Oxygen Day 0 BDL BDL BDL 1.1 ± 0.0 0.1 ± 0.0 5.9 ± 0.9
Low Dissolved Oxygen Day 10 BDL BDL BDL 2.1 ± 0.3 0.2 ± 0.0 3.3 ± 0.1
Low Dissolved Oxygen Day 30 BDL BDL BDL 3.0 ± 0.0 0.4 ± 0.0 2.6 ± 0.3
(b) Treatment Ni Pb Pr Rb Sb Sc Pore Water
High Dissolved Oxygen Day 0 BDL BDL 0.0 ± 0.0 2.1 ± 0.1 0.1 ± 0.0 2.3 ± 1.9
High Dissolved Oxygen Day 10 BDL BDL 0.0 ± 0.0 1.9 ± 0.0 0.3 ± 0.1 3.5 ± 0.3
High Dissolved Oxygen Day 30 BDL BDL 0.0 ± 0.0 1.3 ± 0.1 0.2 ± 0.0 4.4 ± 0.3
Low Dissolved Oxygen Day 0 BDL BDL BDL 2.1 ± 0.4 BDL 2.0 ± 0.2
Low Dissolved Oxygen Day 10 BDL BDL 0.0 ± 0.0 1.8 ± 0.2 0.2 ± 0.1 1.6 ± 0.1
Low Dissolved Oxygen Day 30 BDL BDL 0.0 ± 0.0 1.2 ± 0.0 0.2 ± 0.0 3.4 ± 0.4
Overlying Water
High Dissolved Oxygen Day 0 BDL BDL BDL 0.6 ± 0.1 BDL 4.4 ± 0.1
High Dissolved Oxygen Day 10 BDL BDL BDL 0.8 ± 0.0 0.1 ± 0.0 3.5 ± 0.5
High Dissolved Oxygen Day 30 BDL BDL 0.0 ± 0.0 1.3 ± 0.2 0.1 ± 0.0 2.6 ± 0.9
Low Dissolved Oxygen Day 0 BDL 3.2 ±
0.0 BDL 0.6 ± 0.1 0.1 ± 0.0 4.2 ± 0.8
Low Dissolved Oxygen Day 10 BDL BDL BDL 1.1 ± 0.0 0.1 ± 0.0 3.1 ± 0.7
Low Dissolved Oxygen Day 30 BDL BDL 0.0 ± 0.0 1.1 ± 0.0 BDL 3.3 ± 0.6

148
Appendix A continued (a) Treatment Sm Sr Ta Th Ti Tl Tm Pore Water
High Dissolved Oxygen Day 0 BDL 108.3
± 13.5 BDL 0.0 ± 0.0
3.3 ± 1.0
0.0 ± 0.0
0.0 ± 0.0
High Dissolved Oxygen Day 10 BDL 95.6 ±
5.0 BDL 0.0 ± 0.0
2.6 ± 1.7
0.0 ± 0.0
0.0 ± 0.0
High Dissolved Oxygen Day 30 BDL 118.0
± 0.2 BDL BDL 1.6 ± 0.1 BDL 0.0 ±
0.0
Low Dissolved Oxygen Day 0 BDL 133.4
± 0.9 BDL 0.1 ± 0.0
2.2 ± 1.0 BDL 0.0 ±
0.0
Low Dissolved Oxygen Day 10 BDL 113.4
± 0.1 BDL 0.1 ± 0.1
2.7 ± 0.7
0.0 ± 0.0 BDL
Low Dissolved Oxygen Day 30 BDL 141.8
± 3.2 BDL 0.1 ± 0.1
2.0 ± 0.0
0.1 ± 0.0 BDL
Overlying Water
High Dissolved Oxygen Day 0 BDL 87.0±
5.9 BDL 0.1 ± 0.0
1.6 ± 0.3
0.2 ± 0.0 BDL
High Dissolved Oxygen Day 10 BDL 109.4
± 9.3 BDL BDL 1.5 ± 0.0 BDL BDL
High Dissolved Oxygen Day 30 BDL 91.6 ±
0.4 BDL 0.0 ± 0.0
1.8 ± 0.0
0.1 ± 0.0 BDL
Low Dissolved Oxygen Day 0 BDL 94.9 ±
0.9 BDL BDL 1.7 ± 0.1
0.1 ± 0.0 BDL
Low Dissolved Oxygen Day 10 BDL 114.2
± 2.3 BDL BDL 1.8 ± 0.2 BDL BDL
Low Dissolved Oxygen Day 30 BDL 123.8
± 3.6 BDL BDL 2.5 ± 0.0 BDL BDL
(b) Treatment Sm Sr Ta Th Ti Tl Tm Pore Water
High Dissolved Oxygen Day 0 BDL 29.6 ±
6.7 BDL 0.1 ± 0.0
2.2 ± 0.4
0.1 ± 0.0
0.0 ± 0.0
High Dissolved Oxygen Day 10 BDL 66.4 ±
3.5 BDL 0.1 ± 0.0
2.7 ± 0.0
0.0 ± 0.0
0.0 ± 0.0
High Dissolved Oxygen Day 30 BDL 100.3
± 3.5 BDL 0.1 ± 0.0
2.1 ± 0.0 BDL BDL
Low Dissolved Oxygen Day 0 BDL 69.9 ±
17.5 BDL 0.0 ± 0.0
2.4 ± 0.3
0.0 ± 0.0
0.0 ± 0.0
Low Dissolved Oxygen Day 10 BDL 71.6 ±
5.8 BDL BDL 2.5 ± 0.5
0.0 ± 0.0
0.0 ± 0.0
Low Dissolved Oxygen Day 30 BDL 157.0
± 9.9 BDL BDL BDL BDL 0.0 ± 0.0
Overlying Water
High Dissolved Oxygen Day 0 BDL 80.4 ±
9.3 BDL BDL BDL 0.1 ± 0.0 BDL
High Dissolved Oxygen Day 10 BDL 85.3 ±
15.3 BDL BDL BDL BDL 0.0 ± 0.0
High Dissolved Oxygen Day 30 BDL 86.8 ±
9.3 BDL 0.2 ± 0.1 BDL 0.0 ±
0.0 0.0 ± 0.0
Low Dissolved Oxygen Day 0 BDL 82.9 ±
4.0 BDL 0.2 ± 0.0 BDL 0.1 ±
0.0 BDL
Low Dissolved Oxygen Day 10 BDL 97.1 ±
7.0 BDL 0.2 ± 0.0 BDL 0.1 ±
0.0 BDL
Low Dissolved Oxygen Day 30 BDL 114.0
± 0.4 BDL BDL 1.1 ± 0.0
0.0 ± 0.0
0.0 ± 0.0
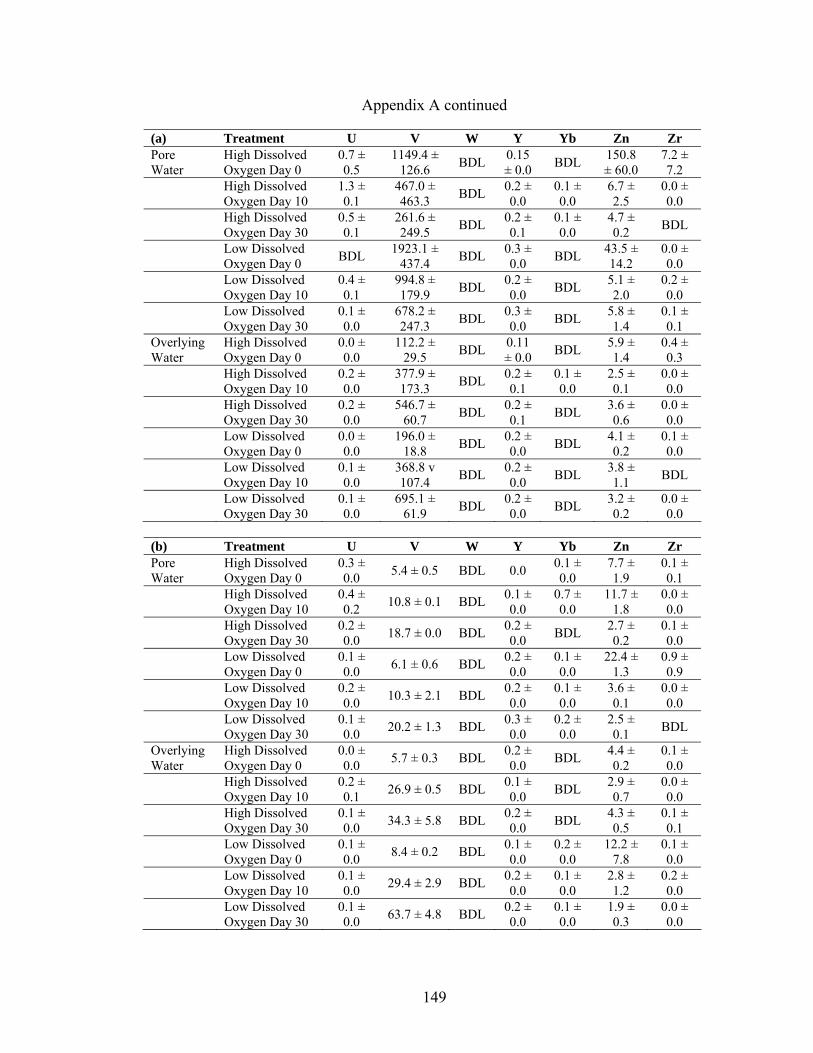
149
Appendix A continued (a) Treatment U V W Y Yb Zn Zr Pore Water
High Dissolved Oxygen Day 0
0.7 ± 0.5
1149.4 ± 126.6 BDL 0.15
± 0.0 BDL 150.8 ± 60.0
7.2 ± 7.2
High Dissolved Oxygen Day 10
1.3 ± 0.1
467.0 ± 463.3 BDL 0.2 ±
0.0 0.1 ± 0.0
6.7 ± 2.5
0.0 ± 0.0
High Dissolved Oxygen Day 30
0.5 ± 0.1
261.6 ± 249.5 BDL 0.2 ±
0.1 0.1 ± 0.0
4.7 ± 0.2 BDL
Low Dissolved Oxygen Day 0 BDL 1923.1 ±
437.4 BDL 0.3 ± 0.0 BDL 43.5 ±
14.2 0.0 ± 0.0
Low Dissolved Oxygen Day 10
0.4 ± 0.1
994.8 ± 179.9 BDL 0.2 ±
0.0 BDL 5.1 ± 2.0
0.2 ± 0.0
Low Dissolved Oxygen Day 30
0.1 ± 0.0
678.2 ± 247.3 BDL 0.3 ±
0.0 BDL 5.8 ± 1.4
0.1 ± 0.1
Overlying Water
High Dissolved Oxygen Day 0
0.0 ± 0.0
112.2 ± 29.5 BDL 0.11
± 0.0 BDL 5.9 ± 1.4
0.4 ± 0.3
High Dissolved Oxygen Day 10
0.2 ± 0.0
377.9 ± 173.3 BDL 0.2 ±
0.1 0.1 ± 0.0
2.5 ± 0.1
0.0 ± 0.0
High Dissolved Oxygen Day 30
0.2 ± 0.0
546.7 ± 60.7 BDL 0.2 ±
0.1 BDL 3.6 ± 0.6
0.0 ± 0.0
Low Dissolved Oxygen Day 0
0.0 ± 0.0
196.0 ± 18.8 BDL 0.2 ±
0.0 BDL 4.1 ± 0.2
0.1 ± 0.0
Low Dissolved Oxygen Day 10
0.1 ± 0.0
368.8 v 107.4 BDL 0.2 ±
0.0 BDL 3.8 ± 1.1 BDL
Low Dissolved Oxygen Day 30
0.1 ± 0.0
695.1 ± 61.9 BDL 0.2 ±
0.0 BDL 3.2 ± 0.2
0.0 ± 0.0
(b) Treatment U V W Y Yb Zn Zr Pore Water
High Dissolved Oxygen Day 0
0.3 ± 0.0 5.4 ± 0.5 BDL 0.0 0.1 ±
0.0 7.7 ± 1.9
0.1 ± 0.1
High Dissolved Oxygen Day 10
0.4 ± 0.2 10.8 ± 0.1 BDL 0.1 ±
0.0 0.7 ± 0.0
11.7 ± 1.8
0.0 ± 0.0
High Dissolved Oxygen Day 30
0.2 ± 0.0 18.7 ± 0.0 BDL 0.2 ±
0.0 BDL 2.7 ± 0.2
0.1 ± 0.0
Low Dissolved Oxygen Day 0
0.1 ± 0.0 6.1 ± 0.6 BDL 0.2 ±
0.0 0.1 ± 0.0
22.4 ± 1.3
0.9 ± 0.9
Low Dissolved Oxygen Day 10
0.2 ± 0.0 10.3 ± 2.1 BDL 0.2 ±
0.0 0.1 ± 0.0
3.6 ± 0.1
0.0 ± 0.0
Low Dissolved Oxygen Day 30
0.1 ± 0.0 20.2 ± 1.3 BDL 0.3 ±
0.0 0.2 ± 0.0
2.5 ± 0.1 BDL
Overlying Water
High Dissolved Oxygen Day 0
0.0 ± 0.0 5.7 ± 0.3 BDL 0.2 ±
0.0 BDL 4.4 ± 0.2
0.1 ± 0.0
High Dissolved Oxygen Day 10
0.2 ± 0.1 26.9 ± 0.5 BDL 0.1 ±
0.0 BDL 2.9 ± 0.7
0.0 ± 0.0
High Dissolved Oxygen Day 30
0.1 ± 0.0 34.3 ± 5.8 BDL 0.2 ±
0.0 BDL 4.3 ± 0.5
0.1 ± 0.1
Low Dissolved Oxygen Day 0
0.1 ± 0.0 8.4 ± 0.2 BDL 0.1 ±
0.0 0.2 ± 0.0
12.2 ± 7.8
0.1 ± 0.0
Low Dissolved Oxygen Day 10
0.1 ± 0.0 29.4 ± 2.9 BDL 0.2 ±
0.0 0.1 ± 0.0
2.8 ± 1.2
0.2 ± 0.0
Low Dissolved Oxygen Day 30
0.1 ± 0.0 63.7 ± 4.8 BDL 0.2 ±
0.0 0.1 ± 0.0
1.9 ± 0.3
0.0 ± 0.0

150
APPENDIX B: Mean ± SE metal concentrations (µg/L) from the pH leaching experiment using Syncrude (a) and Suncor (b) cokes. (n = 3) (BDL = below detection limit) (a) Treatment Ag Al As Ba Ca Ce Pore Water pH 5 Day 0 BDL 0.0 ±
0.0 0.8 ± 0.0 24.6 ± 1.9 137496.3
± 17250.9 0.0 ± 0.0
pH 5 Day 45 BDL 0.0 ± 0.0
0.5 ± 0.5 22.6 ± 4.9 80579.4 ±
13758.5 0.1 ± 0.0
pH 5 Day 90 BDL 1209.4 ± 499.6 BDL 28.5 ± 0.7 73020.0 ±
2291.9 1.0 ± 0.3
pH 7.5 Day 0 BDL 8.4 ± 0.0
0.8 ± 0.0 24.3 ± 1.2 104349.7
± 11425.3 BDL
pH 7.5 Day 45 BDL 0.0 ± 0.0
0.5 ± 0.1 19.3± 1.2 41814.1 ±
76.0 0.0 ± 0.0
pH 7.5 Day 90 BDL 9.7 ± 0.0
0.3 ± 0.0 18.0 ± 0.9 55844.0 ±
897.1 BDL
pH10 Day 0 BDL 13.9 ± 0.0 BDL 22.3 ± 1.3 140215.5
± 3130.0 0.1 ± 0.0
pH 10 Day 45 BDL 48.1 ± 8.0
1.2 ± 0.1 12.9 ± 1.1 19657.5 ±
1262.9 0.2 ± 0.0
pH 10 Day 90 BDL 44.9 ± 10.6
0.8 ± 0.2 7.7 ± 0.6 18493.8 ±
347.8 BDL
Overlying Water pH 5 Day 0 BDL 26.0 ±
0.0 BDL 5.1 ± 4.8 22943.7 ± 17390.2 BDL
pH 5 Day 45 0.0 ± 0.0
137.4 ± 75.4
0.1 ± 0.1 26.4 ± 2.8 63490.7 ±
5346.9 0.5 ± 0.2
pH 5 Day 90 0.0 ± 0.0
25.7 ± 3.4
0.0 ± 0.0 1.9 ± 0.2 11723.0 ±
1126.8 0.0 ± 0.0
pH 7.5 Day 0 BDL 0.0 ± 0.0 BDL 5.2 ± 4.8 22245.6 ±
16603.9 BDL
pH 7.5 Day 45 0.0 ± 0.0
29.6 ± 5.4
0.1 ± 0.0 19.9 ± 0.1 49462.0 ±
2082.4 0.0 ± 0.0
pH 7.5 Day 90 0.0 ± 0.0
57.1 ± 3.0
0.1 ± 0.0 0.6 ± 0.4 6400.7 ±
28.1 0.0 ± 0.0
pH10 Day 0 BDL 153.3 ± 36.6 BDL 4.5 ± 4.0 18359.5 ±
10311.4 0.1 ± 0.0
pH 10 Day 45 0.0 ± 0.0
64.1 ± 7.3
0.2 ± 0.0 11.8 ± 0.6 14973.8 ±
575.2 0.0 ± 0.0
pH 10 Day 90 0.0 ± 0.0
75.9 ± 15.7
0.2 ± 0.0 9.3 ± 0.4 9218.0 ±
139.9 0.0 ± 0.0

151
Appendix B continued (b) Treatment Ag Al As Ba Ca Ce Pore Water pH 5 Day 0 BDL 3489.1 ±
3273.7 BDL 15.7 ± 3.9
168482.4 ± 20562.6
23.4 ± 19.6
pH 5 Day 45 BDL 3528.2 ± 553.2
0.5 ± 0.1
16.2 ± 1.0
86200.4 ± 3784.0 19.3 ± 2.2
pH 5 Day 90 0.1 ± 0.0
2098.3 ± 468.6 BDL 12.5 ±
0.3 93067.3 ±
5946.3 10.4 ± 0.8
pH 7.5 Day 0 BDL 467.4 ± 401.1 BDL 10.2 ±
0.8 184013.8 ±
28805.3 6.3 ± 4.8
pH 7.5 Day 45 BDL 0.0 ± 0.0 BDL 3.5 ± 0.2
68850.8 ± 4589.0 0.1 ± 0.0
pH 7.5 Day 90 BDL 46.7 ± 8.5 BDL 2.9 ± 0.4
64334.7 ± 6422.3 BDL
pH10 Day 0 BDL 512.1 ± 357.9
1.6 ± 0.0
0.4 ± 37.5
705974.8 ± 509327.0 BDL
pH 10 Day 45 BDL 46.1 ± 7.2 0.5 ± 0.0
37.5 ± 26.8
45119.9 ± 11475.4 11.9 ± 8.3
pH 10 Day 90 0.1 ± 0.0 69.7 ± 5.6 0.6 ±
0.0 2.1 ± 0.5
9390.0 ± 964.4 0.0 ± 0.0
Overlying Water pH 5 Day 0 0.2 ±
0.0 153.5 ±
15.9 BDL 0.8 ± 0.2
28726.4 ± 11001.9 BDL
pH 5 Day 45 0.0 ± 0.0
967.3 ± 95.3
0.0 ± 0.0
7.5 ± 0.7
62571.2 ± 1425.7 1.1 ± 0.1
pH 5 Day 90 0.0 ± 0.0
68.5 ± 10.6
0.1 ± 0.0
14.9 ± 0.2
8660.8 ± 597.7 7.4 ± 0.2
pH 7.5 Day 0 BDL 70.7 ± 6.5 BDL 1.1 ± 0.1
27925.8 ± 11565.4 0.1 ± 0.0
pH 7.5 Day 45 0.0 ± 0.0 31.6 ± 8.8 0.0 ±
0.0 5.0 ± 2.4
65102.1 ± 6469.8 0.2 ± 0.0
pH 7.5 Day 90 0.0 ± 0.0
72.0 ± 18.0
0.0 ± 0.0
6.8 ± 0.1
6747.3 ± 393.9 0.1 ± 0.0
pH10 Day 0 BDL 228.6 ± 2.2 BDL 0.0 ±
0.0 39334.3 ±
2679.4 0.0 ± 0.0
pH 10 Day 45 0.0 ± 0.0 72.9 ± 9.4 0.0 ±
0.0 5.9 ± 0.3
47142.8 ± 8379.9 0.1 ± 0.0
pH 10 Day 90 0.0 ± 0.0
81.0 ± 16.3
0.2 ± 0.0
6.4 ± 0.3
8530.5 ± 888.3 0.0 ± 0.0

152
Appendix B continued (a) Treatment Co Cr Cs Cu Dy Er Eu
Pore Water pH 5 Day 0 2.9 ± 0.3 BDL 0.0 ±
0.0 1.8 ± 0.0
0.0 ± 0.0 BDL BDL
pH 5 Day 45 1.8 ± 0.7 BDL 0.0 ±
0.0 1.2 ± 0.1
0.0 ± 0.0 BDL BDL
pH 5 Day 90 28.6 ± 3.6 BDL 0.0 ±
0.0 1.4 ± 0.2
0.1 ± 0.0
0.1 ± 0.0 BDL
pH 7.5 Day 0 0.9 ± 0.1
0.2 ± 0.0
0.0 ± 0.0
1.5 ± 0.1 BDL 0.0 ±
0.0 BDL
pH 7.5 Day 45 0.1 ± 0.0
0.2 ± 0.0
0.0 ± 0.0
0.7 ± 0.0 BDL 0.0 ±
0.0 BDL
pH 7.5 Day 90 0.1 ± 0.0
0.3 ± 0.0 BDL 0.6 ±
0.1 BDL BDL BDL
pH10 Day 0 1.7 ± 0.6
0.2 ± 0.0
0.0 ± 0.0
2.2 ± 0.2 BDL BDL BDL
pH 10 Day 45 0.2 ± 0.0
0.2 ± 0.0
0.0 ± 0.0
0.7 ± 0.2 BDL 0.0 ±
0.0 BDL
pH 10 Day 90 0.1 ± 0.0
0.3 ± 0.1 BDL 0.7 ±
0.1 BDL BDL BDL
Overlying Water pH 5 Day 0 0.6 ±
0.1 0.1 ± 0.0
0.0 ± 0.0
2.2 ± 0.2 BDL 0.0 ±
0.0 BDL
pH 5 Day 45 3.1 ± 0.7
0.0 ± 0.0
0.0 ± 0.0
1.2 ± 0.1
0.1 ± 0.0
0.0 ± 0.0
0.0 ± 0.0
pH 5 Day 90 12.1 ± 0.7
0.0 ± 0.0
0.0 ± 0.0
1.3 ± 0.2
0.0 ± 0.0
0.0 ± 0.0
0.0 ± 0.0
pH 7.5 Day 0 0.5 ± 0.0
0.1 ± 0.0
0.0 ± 0.0
1.8 ± 0.3 BDL BDL BDL
pH 7.5 Day 45 0.1 ± 0.0
1.2 ± 0.1
0.0 ± 0.0
1.0 ± 0.2
0.0 ± 0.0
0.0 ± 0.0
0.0 ± 0.0
pH 7.5 Day 90 0.2 ± 0.0
1.4 ± 0.1
0.0 ± 0.0
0.7 ± 0.1
0.0 ± 0.0
0.0 ± 0.0
0.0 ± 0.0
pH10 Day 0 0.2 ± 0.0
0.1 ± 0.0 BDL 1.1 ±
0.3 0.0 ± 0.0
0.0 ± 0.0 BDL
pH 10 Day 45 0.1 ± 0.0
1.4 ± 0.1
0.0 ± 0.0
0.7 ± 0.0
0.0 ± 0.0
0.0 ± 0.0
0.0 ± 0.0
pH 10 Day 90 0.1 ± 0.0
2.1 ± 0.4
0.0 ± 0.0
0.5 ± 0.1
0.0 ± 0.0
0.0 ± 0.0
0.0 ± 0.0
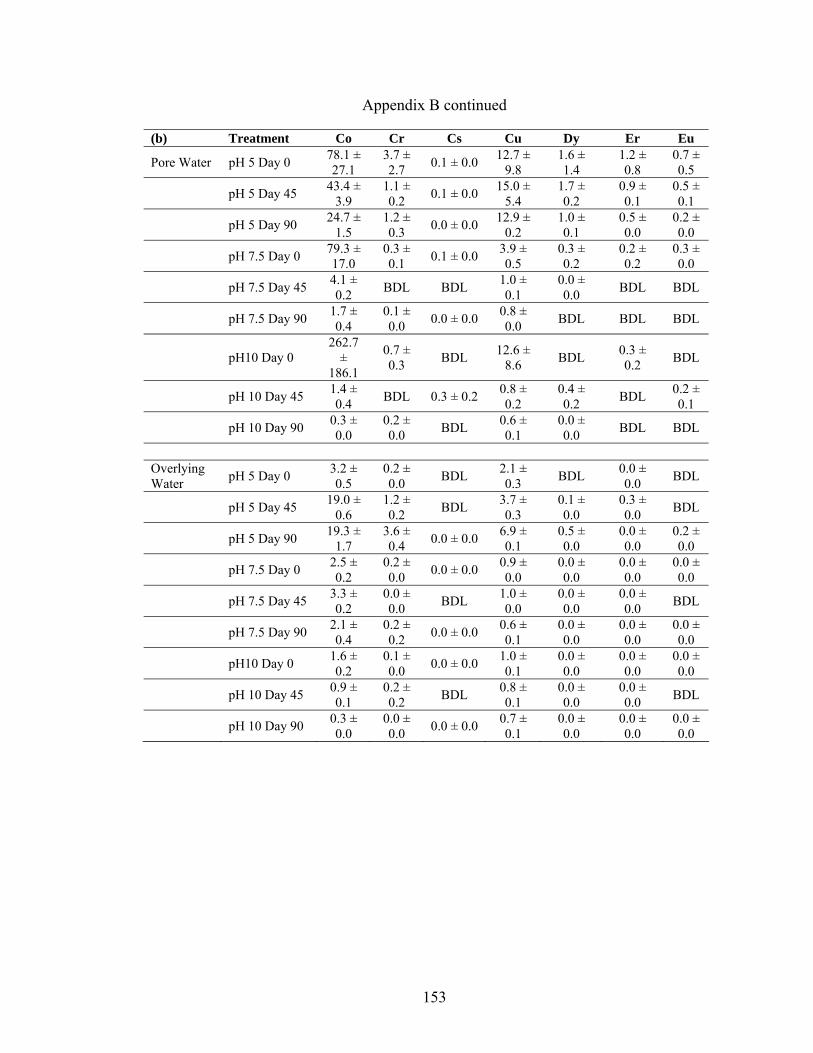
153
Appendix B continued (b) Treatment Co Cr Cs Cu Dy Er Eu
Pore Water pH 5 Day 0 78.1 ± 27.1
3.7 ± 2.7 0.1 ± 0.0 12.7 ±
9.8 1.6 ± 1.4
1.2 ± 0.8
0.7 ± 0.5
pH 5 Day 45 43.4 ± 3.9
1.1 ± 0.2 0.1 ± 0.0 15.0 ±
5.4 1.7 ± 0.2
0.9 ± 0.1
0.5 ± 0.1
pH 5 Day 90 24.7 ± 1.5
1.2 ± 0.3 0.0 ± 0.0 12.9 ±
0.2 1.0 ± 0.1
0.5 ± 0.0
0.2 ± 0.0
pH 7.5 Day 0 79.3 ± 17.0
0.3 ± 0.1 0.1 ± 0.0 3.9 ±
0.5 0.3 ± 0.2
0.2 ± 0.2
0.3 ± 0.0
pH 7.5 Day 45 4.1 ± 0.2 BDL BDL 1.0 ±
0.1 0.0 ± 0.0 BDL BDL
pH 7.5 Day 90 1.7 ± 0.4
0.1 ± 0.0 0.0 ± 0.0 0.8 ±
0.0 BDL BDL BDL
pH10 Day 0 262.7
± 186.1
0.7 ± 0.3 BDL 12.6 ±
8.6 BDL 0.3 ± 0.2 BDL
pH 10 Day 45 1.4 ± 0.4 BDL 0.3 ± 0.2 0.8 ±
0.2 0.4 ± 0.2 BDL 0.2 ±
0.1
pH 10 Day 90 0.3 ± 0.0
0.2 ± 0.0 BDL 0.6 ±
0.1 0.0 ± 0.0 BDL BDL
Overlying Water pH 5 Day 0 3.2 ±
0.5 0.2 ± 0.0 BDL 2.1 ±
0.3 BDL 0.0 ± 0.0 BDL
pH 5 Day 45 19.0 ± 0.6
1.2 ± 0.2 BDL 3.7 ±
0.3 0.1 ± 0.0
0.3 ± 0.0 BDL
pH 5 Day 90 19.3 ± 1.7
3.6 ± 0.4 0.0 ± 0.0 6.9 ±
0.1 0.5 ± 0.0
0.0 ± 0.0
0.2 ± 0.0
pH 7.5 Day 0 2.5 ± 0.2
0.2 ± 0.0 0.0 ± 0.0 0.9 ±
0.0 0.0 ± 0.0
0.0 ± 0.0
0.0 ± 0.0
pH 7.5 Day 45 3.3 ± 0.2
0.0 ± 0.0 BDL 1.0 ±
0.0 0.0 ± 0.0
0.0 ± 0.0 BDL
pH 7.5 Day 90 2.1 ± 0.4
0.2 ± 0.2 0.0 ± 0.0 0.6 ±
0.1 0.0 ± 0.0
0.0 ± 0.0
0.0 ± 0.0
pH10 Day 0 1.6 ± 0.2
0.1 ± 0.0 0.0 ± 0.0 1.0 ±
0.1 0.0 ± 0.0
0.0 ± 0.0
0.0 ± 0.0
pH 10 Day 45 0.9 ± 0.1
0.2 ± 0.2 BDL 0.8 ±
0.1 0.0 ± 0.0
0.0 ± 0.0 BDL
pH 10 Day 90 0.3 ± 0.0
0.0 ± 0.0 0.0 ± 0.0 0.7 ±
0.1 0.0 ± 0.0
0.0 ± 0.0
0.0 ± 0.0

154
Appendix B continued (a) Treatment Fe Ga Gd Hf Hg Ho Pore Water pH 5 Day 0 371.2 ±
19.7 BDL BDL BDL BDL BDL
pH 5 Day 45 233.5 ± 56.1 BDL BDL BDL BDL BDL
pH 5 Day 90 188.6 ± 17.9 BDL 0.2 ± 0.1 BDL BDL 0.0 ± 0.0
pH 7.5 Day 0 303.0 ± 23.5 BDL 0.0 ± 0.0 BDL 0.3 ±
0.0 BDL
pH 7.5 Day 45 105.7 ± 2.1
0.1 ± 0.0 0.0 ± 0.0 BDL BDL BDL
pH 7.5 Day 90 152.7 ± 3.5
0.1 ± 0.0 BDL BDL 0.4 ±
0.0 BDL
pH10 Day 0 363.9 ± 33.1
0.0 ± 0.0 0.0 ± 0.0 BDL 0.4 ±
0.0 BDL
pH 10 Day 45 91.9 ± 8.1
0.2 ± 0.0 BDL BDL BDL BDL
pH 10 Day 90 57.6 ± 3.6
0.2 ± 0.0 BDL BDL BDL BDL
Overlying Water pH 5 Day 0 158.9 ±
0.0 BDL BDL 0.1 ± 0.1 BDL BDL
pH 5 Day 45 183.4 ± 18.1
0.0 ± 0.0 0.0 ± 0.0 0.0 ±
0.0 0.0 ± 0.0 0.0 ± 0.0
pH 5 Day 90 0.0 ± 0.0
0.0 ± 0.0 0.2 ± 0.1 2.4 ±
1.7 0.0 ± 0.0 0.0 ± 0.0
pH 7.5 Day 0 124.9 ± 0.0 BDL BDL 0.0 ±
0.0 BDL BDL
pH 7.5 Day 45 131.8 ± 13.9
0.1 ± 0.0 0.0 ± 0.0 0.0 ±
0.0 0.0 ± 0.0 0.0 ± 0.0
pH 7.5 Day 90 29.7 ± 15.7
0.0 ± 0.0 0.0 ± 0.0 0.2 ±
0.2 0.0 ± 0.0 0.0 ± 0.0
pH10 Day 0 124.6 ± 0.0 BDL BDL 0.0 ±
0.0 BDL BDL
pH 10 Day 45 19.6 ± 19.6
0.2 ± 0.0 0.0 ± 0.0 0.0 ±
0.0 0.0 ± 0.0 0.0 ± 0.0
pH 10 Day 90 11.8 ± 11.8
0.0 ± 0.0 0.0 ± 0.0 0.0 ±
0.0 0.0 ± 0.0 0.0 ± 0.0

155
Appendix B continued (b) Treatment Fe Ga Gd Hf Hg Ho Pore Water pH 5 Day 0 3584.2 ±
3078.0 1.8 ± 0.0 2.0 ± 1.7 0.1 ± 0.0 0.9 ±
0.0 0.4 ± 0.3
pH 5 Day 45 1197.9 ± 283.6 BDL 1.9 ± 0.3 BDL BDL 0.3 ±
0.0
pH 5 Day 90 1985.5 ± 532.7
0.2 ± 0.0 1.0 ± 0.1 BDL 0.6 ±
0.0 0.2 ± 0.0
pH 7.5 Day 0 629.6 ± 81.5
0.0 ± 0.0 0.4 ± 0.4 BDL BDL 0.1 ±
0.0
pH 7.5 Day 45 183.4 ± 5.5 BDL BDL BDL BDL BDL
pH 7.5 Day 90 206.4 ± 21.2
0.1 ± 0.0 BDL BDL BDL BDL
pH10 Day 0 2618.4 ± 1976.7
0.4 ± 0.2 BDL 0.2 ± 0.0 BDL 0.1 ±
0.0
pH 10 Day 45 120.5 ± 27.2
0.1 ± 0.0 0.8 ± 0.6 BDL BDL BDL
pH 10 Day 90 46.5 ± 4.2
0.2 ± 0.0 BDL BDL BDL BDL
Overlying Water pH 5 Day 0 143.7 ±
2.7 BDL BDL 0.1 ± 0.0 BDL 0.0 ± 0.0
pH 5 Day 45 483.0 ± 48.8
0.0 ± 0.0 0.1 ± 0.0 0.0 ± 0.0 0.0 ±
0.0 0.1 ± 0.0
pH 5 Day 90 1405.1 ± 423.8
0.0 ± 0.0 0.9 ± 0.0 0.1 ± 0.1 0.0 ±
0.0 0.0 ± 0.0
pH 7.5 Day 0 147.3 ± 12.2 BDL 0.0 ± 0.0 0.1 ± 0.0 BDL BDL
pH 7.5 Day 45 149.3 ± 15.0
0.0 ± 0.0 BDL 0.0 ± 0.0 0.0 ±
0.0 0.0 ± 0.0
pH 7.5 Day 90 0.0 ± 0.0 0.0 ± 0.0 0.0 ± 0.0 0.0 ± 0.0 0.0 ±
0.0 0.0 ± 0.0
pH10 Day 0 114.2 ± 9.4 BDL 0.0 ± 0.0 BDL BDL BDL
pH 10 Day 45 107.9 ± 5.4
0.1 ± 0.0 BDL 0.0 ± 0.0 0.0 ±
0.0 0.0 ± 0.0
pH 10 Day 90 19.6 ± 19.6
0.1 ± 0.0 0.0 ± 0.0 0.0 ± 0.0 0.0 ±
0.0 0.0 ± 0.0

156
Appendix B continued (a) Treatment La Li Lu Mg Mn Mo
Pore Water pH 5 Day 0 0.0 ± 0.0
58.8 ± 2.7 BDL 97836.3 ±
6171.4 74.6 ±
1.0 52.2 ± 10.2
pH 5 Day 45 0.0 ± 0.0
17.2 ± 1.4 BDL 58756.4 ±
6464.4 87.3 ± 41.9
28.6 ± 12.7
pH 5 Day 90 0.8 ± 0.2
24.0 ± 0.3 BDL 48241.1 ±
1902.6 523.4 ±
20.8 1.4 ± 0.2
pH 7.5 Day 0 0.0 ± 0.0
44.7 ± 7.0 BDL 82903.0 ±
10549.9 12.0 ±
1.1 99.3 ± 26.2
pH 7.5 Day 45 0.0 ± 0.0
9.1 ± 0.5 BDL 41861.7 ±
1017.1 0.7 ± 0.0
45.8 ± 3.2
pH 7.5 Day 90 0.0 ± 0.0
3.1 ± 0.0 BDL 38620.1 ±
239.0 0.5 ± 0.2
29.7 ± 0.5
pH10 Day 0 0.0 ± 0.0
55.8 ± 6.3 BDL 118137.8 ±
4744.2 29.6 ± 17.1
114.7 ± 13.3
pH 10 Day 45 0.1 ± 0.0
7.5 ± 1.2 BDL 37134.1 ±
2566.4 1.1 ± 0.1
96.7 ± 36.4
pH 10 Day 90 BDL 5.4 ± 0.3 BDL 40851.7 ±
724.0 0.2 ± 0.0
37.8 ± 7.8
Overlying Water pH 5 Day 0 BDL 4.8 ±
0.7 BDL 38068.5 ± 3295.9
7.9 ± 1.2
1.1 ± 0.2
pH 5 Day 45 0.3 ± 0.1
17.2 ± 1.8
0.0 ± 0.0
57195.0 ± 4432.8
67.3 ± 12.3
18.1 ± 7.8
pH 5 Day 90 0.0 ± 0.0
21.3 ± 1.2
0.0 ± 0.0
50803.1 ± 3738.5
231.0 ± 26.0
4.7 ± 0.5
pH 7.5 Day 0 0.0 ± 0.0
5.2 ± 0.8 BDL 36643.2 ±
3352.0 8.6 ± 0.5
2.0 ± 0.4
pH 7.5 Day 45 0.0 ± 0.0
7.9 ± 0.6
0.0 ± 0.0
48626.6 ± 2140.1
0.0 ± 0.0
30.8 ± 2.5
pH 7.5 Day 90 0.0 ± 0.0
9.0 ± 1.3
0.0 ± 0.0
37119.5 ± 899.1
0.3 ± 0.1
27.4 ± 0.5
pH10 Day 0 0.1 ± 0.0
5.1 ± 0.5 BDL 41403.8 ±
2814.2 0.9 ± 0.0
3.3 ± 1.2
pH 10 Day 45 0.0 ± 0.0
8.7 ± 0.2
0.0 ± 0.0
45346.7 ± 602.3
0.2 ± 0.2
51.0 ± 14.1
pH 10 Day 90 0.0 ± 0.0
9.6 ± 0.2
0.0 ± 0.0
46938.1 ± 1335.3
0.0 ± 0.0
38.0 ± 8.5

157
Appendix B continued (b) Treatment La Li Lu Mg Mn Mo
Pore Water pH 5 Day 0 9.1 ± 7.2
34.6 ± 12.1 BDL 59870.9 ±
3826.2 1683.7 ± 488.1 12.6 ± 2.7
pH 5 Day 45 7.5 ± 0.9
15.3 ± 2.0 BDL 44411.9 ±
810.0 759.0 ±
71.8 1.2 ± 0.1
pH 5 Day 90 4.1 ± 0.3
6.6 ± 1.0 BDL 44723.3 ±
2275.7 488.7 ±
18.4 1.4 ± 0.2
pH 7.5 Day 0 3.0 ± 2.0
48.2 ± 6.7 BDL 62360.2 ±
4562.0 2204.3 ± 506.1 26.1 ± 6.0
pH 7.5 Day 45 0.0 ± 0.0
3.4 ± 0.2 BDL 41959.4 ±
2842.4 347.7 ±
18.0 31.7 ± 1.1
pH 7.5 Day 90 BDL 5.0 ± 0.4 BDL 46278.1 ±
1737.5 164.1 ±
63.1 39.0 ± 4.3
pH10 Day 0 BDL 159.9 ± 109.1 BDL
260766.0 ±
195593.0
8307.0 ±
5932.6
141.2 ± 101.7
pH 10 Day 45 6.0 ± 4.1
5.3 ± 1.6 BDL 42114.2 ±
2341.3 154.3 ±
53.1 43.5 ± 4.7
pH 10 Day 90 0.0 ± 0.0
2.3 ± 0.0 BDL 36969.6 ±
1577.7 15.4 ±
8.8 49.0 ± 9.5
Overlying Water pH 5 Day 0 BDL 3.1 ±
0.0 BDL 40012.9 ± 1725.7
62.3 ± 8.5 0.4 ± 0.1
pH 5 Day 45 0.4 ± 0.1
7.9 ± 0.4
0.0 ± 0.0
48750.2 ± 2006.8
361.1 ± 3.5 1.3 ± 0.1
pH 5 Day 90 3.0 ± 0.1
7.7 ± 0.9
0.0 ± 0.0
40107.7 ± 3600.2
377.9 ± 24.8 2.1 ± 0.2
pH 7.5 Day 0 0.1 ± 0.0
0.8 ± 0.0 BDL 39398.3 ±
5183.6 48.8 ±
4.7 0.5 ± 0.0
pH 7.5 Day 45 0.1 ± 0.0
7.3 ± 0.7
0.0 ± 0.0
59398.9 ± 2218.9
259.6 ± 22.1 23.9 ± 2.0
pH 7.5 Day 90 0.0 ± 0.0
8.0 ± 1.3
0.0 ± 0.0
40087.8 ± 5022.8
195.1 ± 51.5 35.9 ± 5.4
pH10 Day 0 0.0 ± 0.0
2.2 ± 0.7 BDL 54194.5 ±
1355.0 41.7 ±
3.4 0.9 ± 0.1
pH 10 Day 45 0.1 ± 0.0
7.2 ± 0.7
0.0 ± 0.0
74331.9 ± 9163.4
61.7 ± 30.8 34.6 ± 1.4
pH 10 Day 90 0.0 ± 0.0
6.8 ± 1.9
0.0 ± 0.0
39672.8 ± 1692.7
12.9 ± 6.6 41.1 ± 8.3

158
Appendix B continued (a) Treatment Nb Nd Ni P Pb Pr Rb Pore Water pH 5 Day 0 BDL BDL 64.6 ±
6.8 858.7 ±
19.2 BDL BDL 8.5 ± 0.1
pH 5 Day 45 BDL BDL 58.2 ± 27.8
529.9 ± 33.1
0.7 ± 0.1
0.0 ± 0.0 5.6 ± 0.8
pH 5 Day 90 BDL 0.5 ± 0.2
375.4 ± 62.9
518.7 ± 37.2
0.3 ± 0.1
0.1 ± 0.0 6.1 ± 0.3
pH 7.5 Day 0 BDL BDL 35.5 ± 1.8
755.9 ± 87.6
0.1± 0.0 BDL 7.2 ± 0.3
pH 7.5 Day 45 BDL BDL 7.2 ± 0.4
304.2 ± 17.2
0.4 ± 0.0 BDL 3.9 ± 0.0
pH 7.5 Day 90 BDL BDL 4.9 ± 0.2
304.4 ± 4.6
0.1 ± 0.0 BDL 4.3 ± 0.2
pH10 Day 0 BDL BDL 43.2 ± 6.5
978.4 ± 49.9
0.1 ± 0.0 BDL 8.2 ± 0.5
pH 10 Day 45 BDL 0.1 ± 0.0
6.8 ± 0.9
277.6 ± 4.2
0.4 ± 0.1 BDL 3.9 ± 0.3
pH 10 Day 90 BDL BDL 2.9 ± 0.3
341.6 ± 3.5
0.1 ± 0.0 BDL 4.0 ± 0.2
Overlying Water pH 5 Day 0 BDL BDL 19.2 ±
2.3 267.7 ±
31.0 BDL BDL 1.8 ± 0.1
pH 5 Day 45 0.0 ± 0.0
0.2 ± 0.1
75.6 ± 13.8
315.1 ± 10.8
1.7 ± 0.1
0.1 ± 0.0 5.5 ± 0.7
pH 5 Day 90 0.0 ± 0.0
0.0 ± 0.0
235.9 ± 21.7
340.1 ± 20.3
0.0 ± 0.0
0.0 ± 0.0 5.1 ± 0.3
pH 7.5 Day 0 BDL 0.1 ± 0.0
15.9 ± 1.7
190.4 ± 18.2
3.6 ± 0.0 BDL 1.8 ± 0.2
pH 7.5 Day 45 0.0 ± 0.0
0.0 ± 0.0
6.5 ± 0.5
167.3 ± 8.4
2.2 ± 0.3
0.0 ± 0.0 3.8 ± 0.1
pH 7.5 Day 90 0.0 ± 0.0
0.0 ± 0.0
3.7 ± 0.2
207.9 ± 5.3
0.2 ± 0.1
0.0 ± 0.0 3.1 ± 0.1
pH10 Day 0 BDL 0.2 ± 0.0
6.8 ± 0.4
214.7 ± 37.0
1.3 ± 0.0 BDL 1.7 ± 0.2
pH 10 Day 45 0.0 ± 0.0
0.0 ± 0.0
2.0 ± 0.3
164.8 ± 8.4
1.0 ± 0.0
0.0 ± 0.0 4.0 ± 0.2
pH 10 Day 90 0.0 ± 0.0
0.0 ± 0.0
0.9 ± 0.1
245.2 ± 11.0
0.0 ± 0.0
0.0 ± 0.0 3.5 ± 0.1
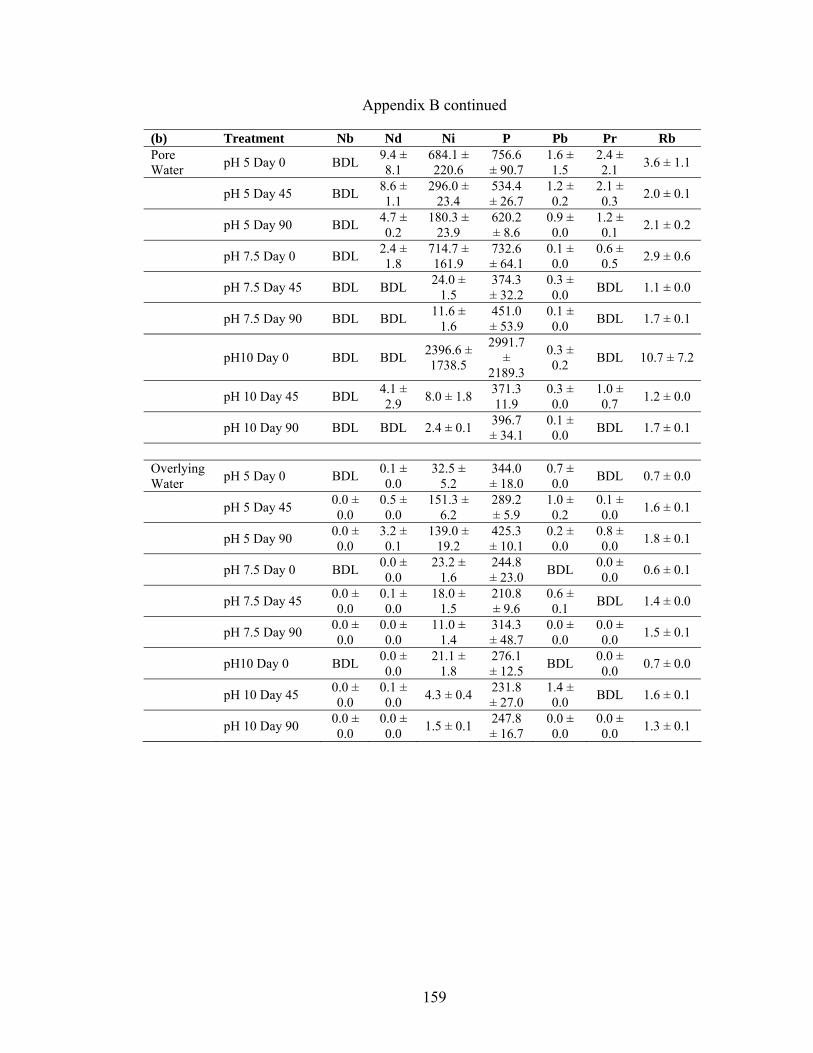
159
Appendix B continued (b) Treatment Nb Nd Ni P Pb Pr Rb Pore Water pH 5 Day 0 BDL 9.4 ±
8.1 684.1 ± 220.6
756.6 ± 90.7
1.6 ± 1.5
2.4 ± 2.1 3.6 ± 1.1
pH 5 Day 45 BDL 8.6 ± 1.1
296.0 ± 23.4
534.4 ± 26.7
1.2 ± 0.2
2.1 ± 0.3 2.0 ± 0.1
pH 5 Day 90 BDL 4.7 ± 0.2
180.3 ± 23.9
620.2 ± 8.6
0.9 ± 0.0
1.2 ± 0.1 2.1 ± 0.2
pH 7.5 Day 0 BDL 2.4 ± 1.8
714.7 ± 161.9
732.6 ± 64.1
0.1 ± 0.0
0.6 ± 0.5 2.9 ± 0.6
pH 7.5 Day 45 BDL BDL 24.0 ± 1.5
374.3 ± 32.2
0.3 ± 0.0 BDL 1.1 ± 0.0
pH 7.5 Day 90 BDL BDL 11.6 ± 1.6
451.0 ± 53.9
0.1 ± 0.0 BDL 1.7 ± 0.1
pH10 Day 0 BDL BDL 2396.6 ± 1738.5
2991.7 ±
2189.3
0.3 ± 0.2 BDL 10.7 ± 7.2
pH 10 Day 45 BDL 4.1 ± 2.9 8.0 ± 1.8 371.3
11.9 0.3 ± 0.0
1.0 ± 0.7 1.2 ± 0.0
pH 10 Day 90 BDL BDL 2.4 ± 0.1 396.7 ± 34.1
0.1 ± 0.0 BDL 1.7 ± 0.1
Overlying Water pH 5 Day 0 BDL 0.1 ±
0.0 32.5 ±
5.2 344.0 ± 18.0
0.7 ± 0.0 BDL 0.7 ± 0.0
pH 5 Day 45 0.0 ± 0.0
0.5 ± 0.0
151.3 ± 6.2
289.2 ± 5.9
1.0 ± 0.2
0.1 ± 0.0 1.6 ± 0.1
pH 5 Day 90 0.0 ± 0.0
3.2 ± 0.1
139.0 ± 19.2
425.3 ± 10.1
0.2 ± 0.0
0.8 ± 0.0 1.8 ± 0.1
pH 7.5 Day 0 BDL 0.0 ± 0.0
23.2 ± 1.6
244.8 ± 23.0 BDL 0.0 ±
0.0 0.6 ± 0.1
pH 7.5 Day 45 0.0 ± 0.0
0.1 ± 0.0
18.0 ± 1.5
210.8 ± 9.6
0.6 ± 0.1 BDL 1.4 ± 0.0
pH 7.5 Day 90 0.0 ± 0.0
0.0 ± 0.0
11.0 ± 1.4
314.3 ± 48.7
0.0 ± 0.0
0.0 ± 0.0 1.5 ± 0.1
pH10 Day 0 BDL 0.0 ± 0.0
21.1 ± 1.8
276.1 ± 12.5 BDL 0.0 ±
0.0 0.7 ± 0.0
pH 10 Day 45 0.0 ± 0.0
0.1 ± 0.0 4.3 ± 0.4 231.8
± 27.0 1.4 ± 0.0 BDL 1.6 ± 0.1
pH 10 Day 90 0.0 ± 0.0
0.0 ± 0.0 1.5 ± 0.1 247.8
± 16.7 0.0 ± 0.0
0.0 ± 0.0 1.3 ± 0.1

160
Appendix B continued (a) Treatment Sb Sc Sm Sn Sr Ta
Pore Water pH 5 Day 0 0.2 ± 0.0
1.7 ± 0.2 BDL 0.2 ±
0.0 1340.9 ±
128.1 BDL
pH 5 Day 45 0.2 ± 0.0
0.9 ± 0.2 BDL 0.2 ±
0.0 622.6 ±
45.0 BDL
pH 5 Day 90 BDL 1.5 ± 0.1 BDL BDL 556.8 ±
11.6 BDL
pH 7.5 Day 0 0.1 ± 0.0
1.5 ± 0.2 BDL BDL 1090.0 ±
123.4 BDL
pH 7.5 Day 45 0.3 ± 0.1
0.6 ± 0.0 BDL BDL 343.4 ± 7.5 BDL
pH 7.5 Day 90 0.1 ± 0.0
0.5 ± 0.1 BDL 0.1 ±
0.0 458.9 ± 3.4 BDL
pH10 Day 0 0.2 ± 0.0
0.6 ± 0.1 BDL BDL 1436.8 ±
49.7 BDL
pH 10 Day 45 0.4 ± 0.1
0.5 ± 0.0 BDL BDL 211.3 ±
12.4 BDL
pH 10 Day 90 0.2 ± 0.1
0.6 ± 0.0 BDL BDL 138.0 ± 5.0 BDL
Overlying Water pH 5 Day 0 0.0 ±
0.0 1.9 ± 0.0 BDL 0.3 ±
0.0 188.4 ± 111.1 BDL
pH 5 Day 45 0.1 ± 0.0
0.4 ± 0.0
0.0 ± 0.0
0.2 ± 0.2
546.2 ± 35.4
0.0 ± 0.0
pH 5 Day 90 0.1 ± 0.0
1.4 ± 0.1
0.0 ± 0.0
0.5 ± 0.4
124.5 ± 17.4
0.0 ± 0.0
pH 7.5 Day 0 0.1 ± 0.0
1.7 ± 0.1 BDL BDL 179.2 ±
103.1 BDL
pH 7.5 Day 45 0.1 ± 0.0
0.1 ± 0.1
0.0 ± 0.0
0.0 ± 0.0
366.6 ± 1.71
0.0 ± 0.0
pH 7.5 Day 90 0.2 ± 0.0
0.4 ± 0.0
0.0 ± 0.0
0.2 ± 0.0 112.8 ± 0.7 0.0 ±
0.0
pH10 Day 0 0.0 ± 0.0
0.6 ± 0.4 BDL 0.1 ±
0.0 154.2 ±
95.7 BDL
pH 10 Day 45 0.2 ± 0.0
0.1 ± 0.1
0.0 ± 0.0
0.0 ± 0.0 168.3 ± 5.8 0.0 ±
0.0
pH 10 Day 90 0.2 ± 0.1
0.8 ± 0.1
0.0 ± 0.0
0.1 ± 0.0 83.5 ± 2.8 0.0 ±
0.0

161
Appendix B continued
(b) Treatment Sb Sc Sm Sn Sr Ta Pore Water pH 5 Day 0 BDL 3.2 ±
0.0 3.1 ± 2.2
0.9 ± 0.0
675.1 ± 44.5 BDL
pH 5 Day 45 BDL 0.5 ± 0.0
1.9 ± 0.3
0.2 ± 0.0
473.1 ± 14.4 BDL
pH 5 Day 90 BDL 0.6 ± 0.1
1.1 ± 0.1
0.1 ± 0.0
418.2 ± 12.8 BDL
pH 7.5 Day 0 BDL BDL 0.5 ± 0.3
0.3 ± 0.0
1017.5 ± 97.1 BDL
pH 7.5 Day 45 BDL 0.2 ± 0.0 BDL BDL 278.6 ±
3.0 BDL
pH 7.5 Day 90 0.0 ± 0.0
0.3 ± 0.1 BDL BDL 370.9 ±
17.5 BDL
pH10 Day 0 0.0 ± 0.0
1.2 ± 0.0 BDL BDL
3943.6 ±
2879.8 BDL
pH 10 Day 45 BDL 0.2 ± 0.0
0.8 ± 0.3 BDL 205.0 ±
45.6 BDL
pH 10 Day 90 0.1 ± 0.0
0.3 ± 0.0 BDL BDL 56.9 ±
4.4 BDL
Overlying Water pH 5 Day 0 0.1 ±
0.0 0.2 ± 0.0 BDL 0.2 ±
0.0 292.6 ±
98.0 BDL
pH 5 Day 45 0.0 ± 0.0
0.0 ± 0.0
0.1 ± 0.0
0.2 ± 0.0
403.4 ± 6.5
0.0 ± 0.0
pH 5 Day 90 0.0 ± 0.0
0.3 ± 0.3
0.7 ± 0.0
0.0 ± 0.0
92.0 ± 6.0
0.0 ± 0.0
pH 7.5 Day 0 0.0 ± 0.0 BDL 0.0 ±
0.0 0.2 ± 0.2
506.3 ± 177.8 BDL
pH 7.5 Day 45 BDL 0.0 ± 0.0 BDL 0.1 ±
0.0 308.9 ±
4.3 0.0 ± 0.0
pH 7.5 Day 90 0.0 ± 0.0
0.1 ± 0.1
0.0 ± 0.0
0.0 ± 0.0
88.7 ± 3.3
0.0 ± 0.0
pH10 Day 0 0.0 ± 0.0
0.1 ± 0.0
0.0 ± 0.0
0.1 ± 0.1
604.0 ± 18.4 BDL
pH 10 Day 45 BDL 0.0 ± 0.0
0.0 ± 0.0
0.1 ± 0.0
179.0 ± 33.5
0.0 ± 0.0
pH 10 Day 90 0.0 ± 0.0
0.4 ± 0.2
0.0 ± 0.0
0.0 ± 0.0
47.5 ± 1.7
0.0 ± 0.0

162
Appendix B continued (a) Treatment Th Ti Tl Tm U Pore Water pH 5 Day 0 0.0 ± 0.0 8.8 ± 0.9 BDL BDL BDL
pH 5 Day 45 BDL 8.1 ± 3.4 BDL BDL 0.0 ± 0.0 pH 5 Day 90 BDL 4.5 ± 0.8 0.1 ± 0.0 BDL BDL pH 7.5 Day 0 BDL 7.2 ± 0.6 BDL BDL 0.2 ± 0.0 pH 7.5 Day 45 BDL 2.2 ± 0.0 BDL BDL 0.8 ± 0.1 pH 7.5 Day 90 BDL 4.8 ± 1.5 BDL BDL 0.8 ± 0.0 pH10 Day 0 BDL 7.1 ± 0.3 BDL BDL 0.4 ± 0.3 pH 10 Day 45 BDL 8.7 ± 0.0 BDL BDL 1.1 ± 0.4 pH 10 Day 90 BDL 0.6 ± 0.2 BDL BDL 0.7 ± 0.0 Overlying Water pH 5 Day 0 0.0 ± 0.0 4.9 ± 0.7 BDL BDL BDL
pH 5 Day 45 0.0 ± 0.0 2.3 ± 0.3 0.1 ± 0.0 0.0 ± 0.0 0.0 ± 0.0 pH 5 Day 90 0.2 ± 0.1 1.9 ± 0.1 0.1± 0.0 0.0 ± 0.0 0.0 ± 0.0 pH 7.5 Day 0 0.0 ± 0.0 3.9 ± 0.6 BDL BDL 0.0 ± 0.0 pH 7.5 Day 45 0.0 ± 0.0 1.8 ± 0.1 0.0 ± 0.0 0.0 ± 0.0 0.4 ± 0.0 pH 7.5 Day 90 0.1 ± 0.0 4.1 ± 1.4 0.0 ± 0.0 0.0 ± 0.0 0.4 ± 0.0 pH10 Day 0 BDL 3.3 ± 1.2 0.0 ± 0.0 BDL 0.0 ± 0.0 pH 10 Day 45 0.0 ± 0.0 1.1 ± 1.1 0.0 ± 0.0 0.0 ± 0.0 0.5 ± 0.1 pH 10 Day 90 0.0 ± 0.0 3.2 ± 0.4 0.0 ± 0.0 0.0 ± 0.0 0.2 ± 0.0 (b) Treatment Th Ti Tl Tm U Pore Water pH 5 Day 0 1.2 ± 0.9 20.2 ± 9.4 0.1 ± 0.0 0.1 ± 0.1 0.5 ± 0.4
pH 5 Day 45 0.1 ± 0.0 6.3 ± 0.9 0.1 ± 0.0 0.1 ± 0.0 0.5 ± 0.0 pH 5 Day 90 0.1 ± 0.0 8.5 ± 1.4 0.0 ± 0.0 0.1 ± 0.0 0.2 ± 0.0 pH 7.5 Day 0 0.0 ± 0.0 11.7 ± 1.0 BDL 0.1 ± 0.0 0.1 ± 0.0 pH 7.5 Day 45 BDL 5.8 ± 1.6 BDL BDL 0.1 ± 0.0 pH 7.5 Day 90 BDL 4.6 ± 0.8 BDL BDL 0.2 ± 0.0 pH10 Day 0 0.0 ± 0.0 50.4 ± 38.2 0.2 ± 0.0 0.1 ± 0.0 0.8 ± 0.6 pH 10 Day 45 BDL 3.8 ± 0.0 BDL BDL 0.3 ± 0.0 pH 10 Day 90 BDL 2.1 ± 1.3 BDL BDL 0.1 ± 0.0 Overlying Water pH 5 Day 0 0.1 ± 0.0 2.6 ± 0.2 BDL BDL 0.1 ± 0.0
pH 5 Day 45 0.0 ± 0.0 2.3 ± 0.3 0.1 ± 0.0 0.0 ± 0.0 0.2 ± 0.0 pH 5 Day 90 0.0 ± 0.0 5.3 ± 1.4 0.1 ± 0.0 0.0 ± 0.0 0.1 ± 0.0 pH 7.5 Day 0 0.0 ± 0.0 2.4 ± 0.1 BDL BDL 0.0 ± 0.0 pH 7.5 Day 45 0.0 ± 0.0 3.0 ± 1.4 0.0 ± 0.0 0.0 ± 0.0 0.2 ± 0.0 pH 7.5 Day 90 0.0 ± 0.0 2.1 ± 0.5 0.0 ± 0.0 0.0 ± 0.0 0.1 ± 0.0 pH10 Day 0 BDL 2.5 ± 0.3 BDL BDL 0.0 ± 0.0 pH 10 Day 45 0.0 ± 0.0 0.5 ± 0.5 0.0 ± 0.0 0.0 ± 0.0 0.3 ± 0.0 pH 10 Day 90 0.0 ± 0.0 3.6 ± 0.7 0.0 ± 0.0 0.0 ± 0.0 0.1 ± 0.0
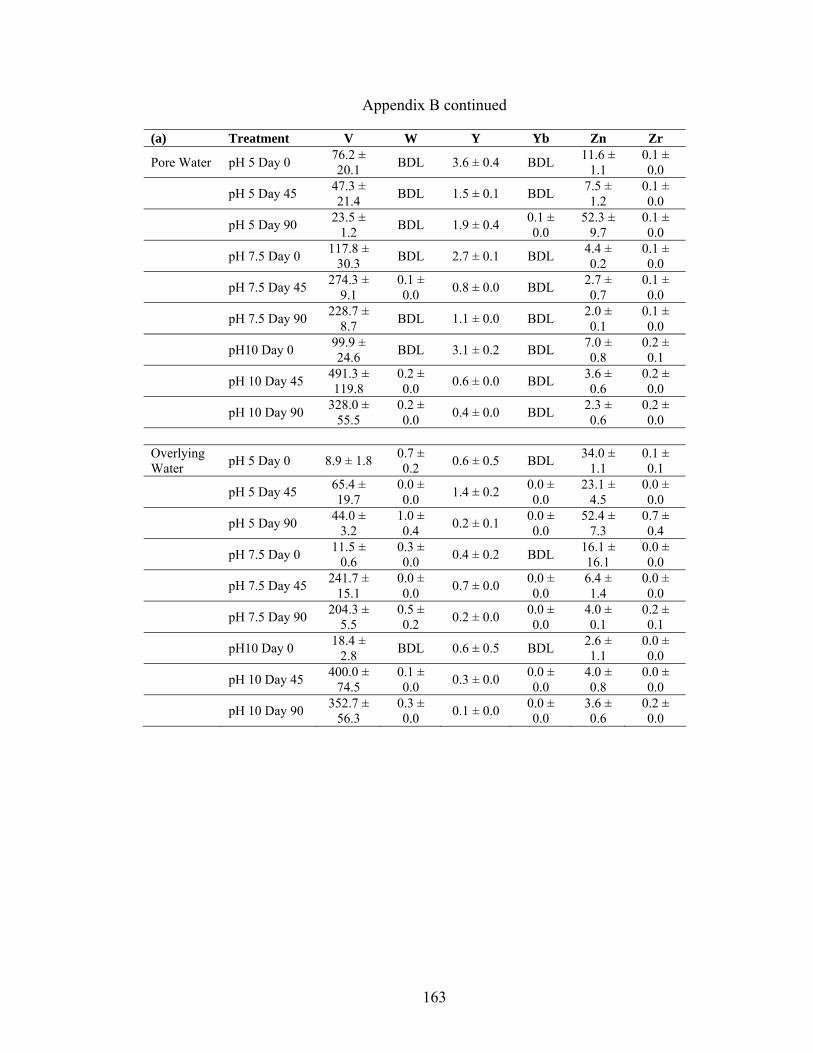
163
Appendix B continued (a) Treatment V W Y Yb Zn Zr
Pore Water pH 5 Day 0 76.2 ± 20.1 BDL 3.6 ± 0.4 BDL 11.6 ±
1.1 0.1 ± 0.0
pH 5 Day 45 47.3 ± 21.4 BDL 1.5 ± 0.1 BDL 7.5 ±
1.2 0.1 ± 0.0
pH 5 Day 90 23.5 ± 1.2 BDL 1.9 ± 0.4 0.1 ±
0.0 52.3 ±
9.7 0.1 ± 0.0
pH 7.5 Day 0 117.8 ± 30.3 BDL 2.7 ± 0.1 BDL 4.4 ±
0.2 0.1 ± 0.0
pH 7.5 Day 45 274.3 ± 9.1
0.1 ± 0.0 0.8 ± 0.0 BDL 2.7 ±
0.7 0.1 ± 0.0
pH 7.5 Day 90 228.7 ± 8.7 BDL 1.1 ± 0.0 BDL 2.0 ±
0.1 0.1 ± 0.0
pH10 Day 0 99.9 ± 24.6 BDL 3.1 ± 0.2 BDL 7.0 ±
0.8 0.2 ± 0.1
pH 10 Day 45 491.3 ± 119.8
0.2 ± 0.0 0.6 ± 0.0 BDL 3.6 ±
0.6 0.2 ± 0.0
pH 10 Day 90 328.0 ± 55.5
0.2 ± 0.0 0.4 ± 0.0 BDL 2.3 ±
0.6 0.2 ± 0.0
Overlying Water pH 5 Day 0 8.9 ± 1.8 0.7 ±
0.2 0.6 ± 0.5 BDL 34.0 ± 1.1
0.1 ± 0.1
pH 5 Day 45 65.4 ± 19.7
0.0 ± 0.0 1.4 ± 0.2 0.0 ±
0.0 23.1 ±
4.5 0.0 ± 0.0
pH 5 Day 90 44.0 ± 3.2
1.0 ± 0.4 0.2 ± 0.1 0.0 ±
0.0 52.4 ±
7.3 0.7 ± 0.4
pH 7.5 Day 0 11.5 ± 0.6
0.3 ± 0.0 0.4 ± 0.2 BDL 16.1 ±
16.1 0.0 ± 0.0
pH 7.5 Day 45 241.7 ± 15.1
0.0 ± 0.0 0.7 ± 0.0 0.0 ±
0.0 6.4 ± 1.4
0.0 ± 0.0
pH 7.5 Day 90 204.3 ± 5.5
0.5 ± 0.2 0.2 ± 0.0 0.0 ±
0.0 4.0 ± 0.1
0.2 ± 0.1
pH10 Day 0 18.4 ± 2.8 BDL 0.6 ± 0.5 BDL 2.6 ±
1.1 0.0 ± 0.0
pH 10 Day 45 400.0 ± 74.5
0.1 ± 0.0 0.3 ± 0.0 0.0 ±
0.0 4.0 ± 0.8
0.0 ± 0.0
pH 10 Day 90 352.7 ± 56.3
0.3 ± 0.0 0.1 ± 0.0 0.0 ±
0.0 3.6 ± 0.6
0.2 ± 0.0

164
Appendix B continued (b) Treatment V W Y Yb Zn Zr
Pore Water pH 5 Day 0 102.0 ± 95.3 BDL 10.0 ±
7.0 0.9 ± 0.6
72.8 ± 41.9
1.6 ± 1.5
pH 5 Day 45 7.9 ± 1.8 BDL 9.7 ± 1.1
0.8 ± 0.1
71.1 ± 7.8
0.2 ± 0.1
pH 5 Day 90 8.3 ± 2.0 BDL 5.8 ± 0.6
0.3 ± 0.1
43.4 ± 2.9
0.4 ± 0.3
pH 7.5 Day 0 7.5 ± 0.4 BDL 5.0 ± 1.6
0.3 ± 0.0
44.3 ± 13.8
0.2 ± 0.0
pH 7.5 Day 45 11.3 ± 0.7 0.1 ± 0.1
0.8 ± 0.0 BDL 2.7 ±
0.6 0.1 ± 0.0
pH 7.5 Day 90 38.6 ± 1.9 0.3 ± 0.1
0.8 ± 0.1 BDL 2.2 ±
0.4 0.1 ± 0.0
pH10 Day 0 34.6 ± 23.2
0.1 ± 0.1
12.5 ± 8.8
0.2 ± 0.0
110.9 ± 76.5
1.6 ± 1.5
pH 10 Day 45 33.4 ± 5.0 0.8 ± 0.7
0.5 ± 0.1 BDL 1.9 ±
0.4 2.1 ± 2.0
pH 10 Day 90 83.6 ± 23.3
0.4 ± 0.4
0.2 ± 0.0 BDL 2.9 ±
1.2 0.1 ± 0.0
Overlying Water pH 5 Day 0 3.7 ± 0.2 0.6 ±
0.0 1.1 ± 0.4 BDL 13.5 ±
1.7 0.1 ± 0.0
pH 5 Day 45 14.9 ± 1.5 0.0 ± 0.0
3.6 ± 0.0
0.2 ± 0.0
46.8 ± 2.3
0.1 ± 0.0
pH 5 Day 90 33.7 ± 7.5 0.5 ± 0.3
0.2 ± 0.0
0.0 ± 0.0
47.6 ± 2.9
0.1 ± 0.0
pH 7.5 Day 0 2.6 ± 0.0 0.3 ± 0.0
1.3 ± 0.5 BDL 4.7 ±
0.6 0.1 ± 0.0
pH 7.5 Day 45 25.8 ± 1.3 0.1 ± 0.1
0.6 ± 0.0
0.0 ± 0.0
5.9 ± 0.2
0.0 ± 0.0
pH 7.5 Day 90 32.9 4.0 0.5 ± 0.1
0.1 ± 0.0
0.0 ± 0.0
5.9 ± 0.6
0.1 ± 0.0
pH10 Day 0 5.2 ± 0.4 BDL 1.6 ± 0.1 BDL 2.4 ±
0.2 0.0 ± 0.0
pH 10 Day 45 62.2 ± 4.7 0.4 ± 0.0
0.5 ± 0.2
0.0 ± 0.0
5.5 ± 0.1
0.0 ± 0.0
pH 10 Day 90 103.0 ± 30.0
0.7 ± 0.1
0.1 ± 0.0
0.0 ± 0.0
3.9 ± 0.3
0.8 ± 0.5

165
APPENDIX C: Mean ± SE metal concentrations (µg/L) from the freeze-thaw leaching experiment using Syncrude (a) and Suncor (b) cokes. (n = 3) (BDL = below detection limit) (a) Treatment Ag Al As Au Ba Ca
Pore Water Unfrozen Cycle 1 BDL 11.6 ±
0.9 0.6 ± 0.1 0.0 ± 0.0 18.2 ± 0.8
94428.5 ± 8264.8
Unfrozen Cycle 3 BDL 29.1 ±
3.0 0.5 ± 0.1 BDL 23.5 ± 0.5
72903.1 ± 7923.9
Unfrozen Cycle 6 BDL 25.7 ±
0.9 0.6 ± 0.1 0.0 ± 0.0 20.1 ± 1.4
61079.4 ± 3769.1
Frozen Cycle 1 BDL 19.9 ±
3.4 0.4 ± 0.0 0.0 ± 0.0 18.8 ± 1.3
96693.7 ± 8866.3
Frozen Cycle 3 BDL 16.4 ±
3.6 1.1 ± 0.2 0.0 ± 0.0 22.6 ± 1.5
128746.1 ± 8350.2
Frozen Cycle 6 BDL 58.0 ±
37.3 0.7 ± 0.0 0.0 ± 0.0 18.6 ± 0.7
69870.2 ± 7139.9
Overlying Water
Unfrozen Cycle 1 0.0 ± 0.0 51.8 ±
0.0 BDL 0.0 ± 0.0 18.1 ± 0.3
54056.0 ± 949.0
Unfrozen Cycle 3 BDL 47.5 ±
5.6 0.5 ± 0.0 0.0 ± 0.0 20.9 ± 0.9
54572.8 ± 1424.7
Unfrozen Cycle 6 BDL 34.5 ±
12.2 0.4 ± 0.1 BDL 23.1 ± 1.1
56309.4 ± 3812.0
Frozen Cycle 1 BDL 24.3 ±
2.9 BDL 0.0 ± 0.0 17.0 ± 1.5
47259.4 ± 199.4
Frozen Cycle 3 BDL 27.3 ±
6.0 BDL 0.0 ± 0.0 15.2 ± 1.0
45536.6 ± 2179.1
Frozen Cycle 6 BDL 17.3 ±
1.8 0.2 ± 0.0 BDL 15.0 ± 1.1
38931.9 ± 3966.7
(b) Treatment Ag Al As Au Ba Ca
Pore Water Unfrozen Cycle 1 0.0 ± 0.0 86.5 ±
8.5 BDL 0.0 ± 0.0 8.0 ± 0.5 126482.2 ± 22519.0
Unfrozen Cycle 3 BDL 116.6 ±
23.0 0.3 ± 0.0 BDL 3.8 ± 0.5 71311.9 ± 4471.8
Unfrozen Cycle 6 BDL 59.9 ±
5.1 BDL BDL 5.5 ± 1.2 64224.1 ± 3872.7
Frozen Cycle 1 BDL 85.2 ±
21.6 0.4 ± 0.0 BDL 5.5 ± 1.2 97748.8 ± 18067.7
Frozen Cycle 3 0.0 ± 0.0 47.9 ±
5.7 0.4 ± 0.1 BDL 4.7 ± 0.9 97805.7 ± 13154.0
Frozen Cycle 6 BDL 36.4 ±
2.0 0.3 ± 0.0 BDL 3.6 ± 0.3 84187.2 ± 11301.5
Overlying Water
Unfrozen Cycle 1 BDL 94.7 ±
10.1 BDL BDL 8.1 ± 0.2 54685.4 ± 1620.3
Unfrozen Cycle 3 BDL 48.8 ±
12.0 0.2 ± 0.0 BDL 10.5 ± 0.6 61461.4 ± 1137.1
Unfrozen Cycle 6 BDL 49.0 ±
5.6 0.4 ± 0.0 BDL 7.6 ± 2.1 60812.1 ± 7747.1
Frozen Cycle 1 BDL 69.6 ±
9.6 BDL BDL 8.2 ± 0.0 42836.6 ± 2834.2
Frozen Cycle 3 BDL 38.0 ±
5.2 0.4 ± 0.0 0.0 ± 0.0 7.9 ± 0.1 29952.8 ± 1918.6
Frozen Cycle 6 BDL 27.8 ±
6.3 BDL 0.0 ± 0.0 9.6 ± 0.3 38574.2 ± 4194.0
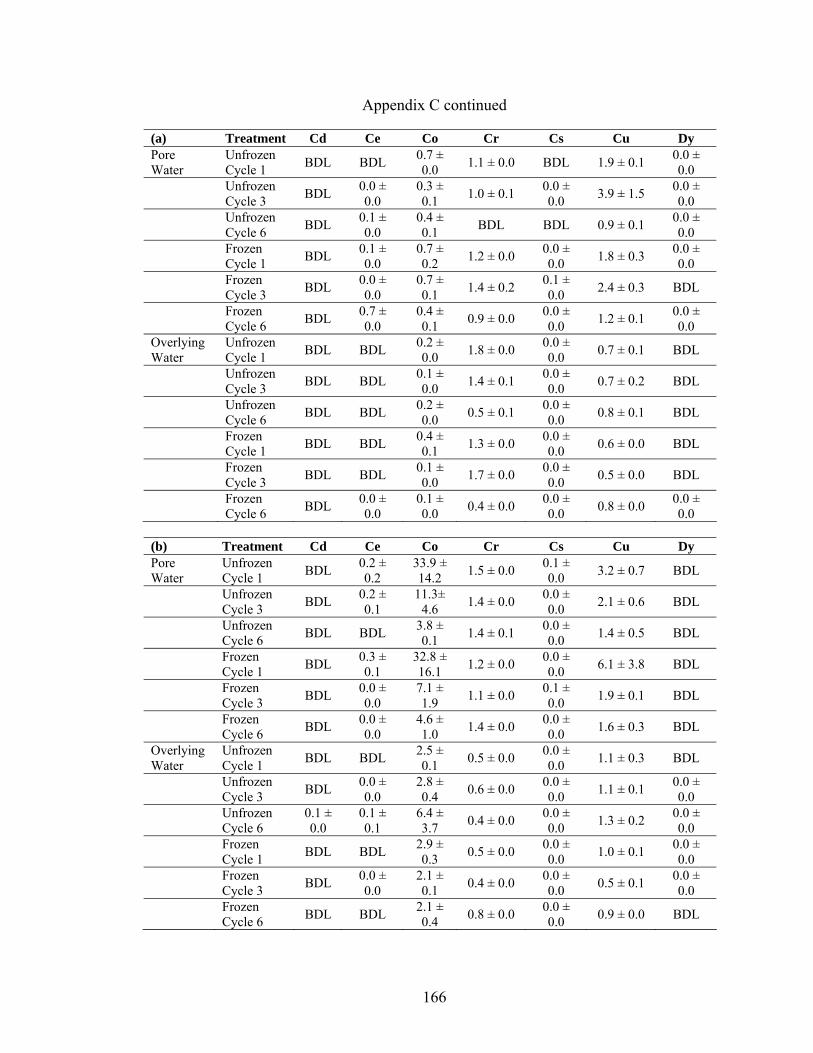
166
Appendix C continued (a) Treatment Cd Ce Co Cr Cs Cu Dy Pore Water
Unfrozen Cycle 1 BDL BDL 0.7 ±
0.0 1.1 ± 0.0 BDL 1.9 ± 0.1 0.0 ± 0.0
Unfrozen Cycle 3 BDL 0.0 ±
0.0 0.3 ± 0.1 1.0 ± 0.1 0.0 ±
0.0 3.9 ± 1.5 0.0 ± 0.0
Unfrozen Cycle 6 BDL 0.1 ±
0.0 0.4 ± 0.1 BDL BDL 0.9 ± 0.1 0.0 ±
0.0
Frozen Cycle 1 BDL 0.1 ±
0.0 0.7 ± 0.2 1.2 ± 0.0 0.0 ±
0.0 1.8 ± 0.3 0.0 ± 0.0
Frozen Cycle 3 BDL 0.0 ±
0.0 0.7 ± 0.1 1.4 ± 0.2 0.1 ±
0.0 2.4 ± 0.3 BDL
Frozen Cycle 6 BDL 0.7 ±
0.0 0.4 ± 0.1 0.9 ± 0.0 0.0 ±
0.0 1.2 ± 0.1 0.0 ± 0.0
Overlying Water
Unfrozen Cycle 1 BDL BDL 0.2 ±
0.0 1.8 ± 0.0 0.0 ± 0.0 0.7 ± 0.1 BDL
Unfrozen Cycle 3 BDL BDL 0.1 ±
0.0 1.4 ± 0.1 0.0 ± 0.0 0.7 ± 0.2 BDL
Unfrozen Cycle 6 BDL BDL 0.2 ±
0.0 0.5 ± 0.1 0.0 ± 0.0 0.8 ± 0.1 BDL
Frozen Cycle 1 BDL BDL 0.4 ±
0.1 1.3 ± 0.0 0.0 ± 0.0 0.6 ± 0.0 BDL
Frozen Cycle 3 BDL BDL 0.1 ±
0.0 1.7 ± 0.0 0.0 ± 0.0 0.5 ± 0.0 BDL
Frozen Cycle 6 BDL 0.0 ±
0.0 0.1 ± 0.0 0.4 ± 0.0 0.0 ±
0.0 0.8 ± 0.0 0.0 ± 0.0
(b) Treatment Cd Ce Co Cr Cs Cu Dy Pore Water
Unfrozen Cycle 1 BDL 0.2 ±
0.2 33.9 ± 14.2 1.5 ± 0.0 0.1 ±
0.0 3.2 ± 0.7 BDL
Unfrozen Cycle 3 BDL 0.2 ±
0.1 11.3±
4.6 1.4 ± 0.0 0.0 ± 0.0 2.1 ± 0.6 BDL
Unfrozen Cycle 6 BDL BDL 3.8 ±
0.1 1.4 ± 0.1 0.0 ± 0.0 1.4 ± 0.5 BDL
Frozen Cycle 1 BDL 0.3 ±
0.1 32.8 ± 16.1 1.2 ± 0.0 0.0 ±
0.0 6.1 ± 3.8 BDL
Frozen Cycle 3 BDL 0.0 ±
0.0 7.1 ± 1.9 1.1 ± 0.0 0.1 ±
0.0 1.9 ± 0.1 BDL
Frozen Cycle 6 BDL 0.0 ±
0.0 4.6 ± 1.0 1.4 ± 0.0 0.0 ±
0.0 1.6 ± 0.3 BDL
Overlying Water
Unfrozen Cycle 1 BDL BDL 2.5 ±
0.1 0.5 ± 0.0 0.0 ± 0.0 1.1 ± 0.3 BDL
Unfrozen Cycle 3 BDL 0.0 ±
0.0 2.8 ± 0.4 0.6 ± 0.0 0.0 ±
0.0 1.1 ± 0.1 0.0 ± 0.0
Unfrozen Cycle 6
0.1 ± 0.0
0.1 ± 0.1
6.4 ± 3.7 0.4 ± 0.0 0.0 ±
0.0 1.3 ± 0.2 0.0 ± 0.0
Frozen Cycle 1 BDL BDL 2.9 ±
0.3 0.5 ± 0.0 0.0 ± 0.0 1.0 ± 0.1 0.0 ±
0.0
Frozen Cycle 3 BDL 0.0 ±
0.0 2.1 ± 0.1 0.4 ± 0.0 0.0 ±
0.0 0.5 ± 0.1 0.0 ± 0.0
Frozen Cycle 6 BDL BDL 2.1 ±
0.4 0.8 ± 0.0 0.0 ± 0.0 0.9 ± 0.0 BDL

167
Appendix C continued (a) Treatment Er Eu Fe Ga Gd Ge Hf
Pore Water Unfrozen Cycle 1 BDL BDL 175.8 ±
9.6 BDL BDL BDL 0.0 ± 0.0
Unfrozen Cycle 3 BDL BDL 121.2 ±
14.9 0.1 ± 0.0 BDL 0.1 ±
0.0 0.0 ± 0.0
Unfrozen Cycle 6
0.0 ± 0.0 BDL 115.0 ±
17.1 BDL BDL BDL 0.0 ± 0.0
Frozen Cycle 1 BDL BDL 180.9 ±
28.4 BDL BDL 0.1 ± 0.0
0.0 ± 0.0
Frozen Cycle 3 BDL BDL 214.5 ±
22.6 BDL BDL 0.1 ± 0.0
0.0 ± 0.0
Frozen Cycle 6
0.0 ± 0.0 BDL 186.6 ±
46.1 0.1 ± 0.0 BDL 0.1 ±
0.0 0.0 ± 0.0
Overlying Water
Unfrozen Cycle 1 BDL BDL 108.5 ±
14.5 BDL BDL BDL BDL
Unfrozen Cycle 3
0.0 ± 0.0 BDL 85.6 ±
5.9 0.1 ± 0.0 BDL BDL BDL
Unfrozen Cycle 6
0.0 ± 0.0 BDL 95.6 ±
10.5 0.1 ± 0.0 BDL 0.1 ±
0.0 BDL
Frozen Cycle 1 BDL BDL 79.1 ±
10.7 BDL BDL BDL BDL
Frozen Cycle 3
0.0 ± 0.0 BDL 91.2 ±
3.1 0.1 ± 0.0 BDL 0.1 ±
0.0 BDL
Frozen Cycle 6 BDL BDL 71.4 ±
8.9 0.1 ± 0.0 BDL BDL BDL
(b) Treatment Er Eu Fe Ga Gd Ge Hf
Pore Water Unfrozen Cycle 1 BDL BDL 254.6 ±
44.6 0.1 ± 0.0
0.0 ± 0.0
0.1 ± 0.0
0.0 ± 0.0
Unfrozen Cycle 3 BDL BDL 183.4 ±
38.5 0.1 ± 0.0 BDL 0.1 ±
0.0 BDL
Unfrozen Cycle 6 BDL BDL 126.6 ±
10.0 0.1 ± 0.0 BDL 0.1 ±
0.0 BDL
Frozen Cycle 1
0.0 ± 0.0 BDL 225.0 ±
47.4 BDL 0.1 ± 0.0 BDL 0.1 ±
0.0
Frozen Cycle 3
0.0 ± 0.0 BDL 178.8 ±
37.3 0.1 ± 0.0 BDL 0.2 ±
0.0 BDL
Frozen Cycle 6
0.0 ± 0.0 BDL 147.8 ±
18.4 BDL BDL 0.1 ± 0.0 BDL
Overlying Water
Unfrozen Cycle 1 BDL BDL 107.1 ±
14.1 0.1 ± 0.0 BDL 0.1 ±
0.0 BDL
Unfrozen Cycle 3 BDL BDL 118.6 ±
8.7 0.1 ± 0.0 BDL 0.1 ±
0.0 0.0 ± 0.0
Unfrozen Cycle 6 BDL BDL 118.6 ±
32.4 0.1 ± 0.0 BDL BDL 0.0 ±
0.0
Frozen Cycle 1 BDL BDL 81.7 ±
8.7 BDL BDL BDL BDL
Frozen Cycle 3 BDL BDL 61.5 ±
4.8 0.1 ± 0.0 BDL BDL BDL
Frozen Cycle 6 BDL BDL 76.2 ±
9.4 0.1 ± 0.0 BDL BDL BDL

168
Appendix C continued (a) Treatment Hg Ho La Li Lu Mg Pore Water
Unfrozen Cycle 1 BDL BDL 0.0 ± 0.0 28.0 ± 6.4 BDL 81933.0 ±
5236.2
Unfrozen Cycle 3 BDL BDL 0.0 ± 0.0 21.3 ± 3.0 BDL 57994.2 ±
1144.7
Unfrozen Cycle 6 BDL BDL 0.1 ± 0.0 14.7 BDL 55477.2 ±
1114.9
Frozen Cycle 1 BDL BDL 0.0 ± 0.0 22.7 ± 3.8 BDL 78683.4 ±
4158.9
Frozen Cycle 3 BDL 0.0 ± 0.0 0.0 ± 0.0 33.9 ± 1.8 BDL 140503.1 ±
4034.5
Frozen Cycle 6 BDL 0.0 ± 0.0 0.1 ± 0.1 15.4 ± 2.3 BDL 89690.4 ±
5319.1 Overlying Water
Unfrozen Cycle 1 BDL BDL 0.0 ± 0.0 10.0 ± 0.0 BDL 50816.7 ±
1257.1
Unfrozen Cycle 3 BDL BDL 0.0 ± 0.0 11.2 ± 0.6 BDL 50789.4 ±
2120.3
Unfrozen Cycle 6 BDL 0.0 ± 0.0 0.0 ± 0.0 13.5 ± 1.9 BDL 52363.1 ±
4879.4
Frozen Cycle 1 BDL BDL 0.0 ± 0.0 5.7 ± 0.5 BDL 46003.1 ±
1896.7
Frozen Cycle 3 BDL BDL 0.0 ± 0.0 8.7 ± 0.5 BDL 44257.8 ±
1771.1
Frozen Cycle 6 BDL BDL 0.0 ± 0.0 8.7 ± 0.5 BDL 45817.0 ±
1247.2 (b) Treatment Hg Ho La Li Lu Mg Pore Water
Unfrozen Cycle 1 BDL 0.0 ± 0.0 0.2 ± 0.1 25.0 ±
7.7 BDL 80846.7 ± 3367.7
Unfrozen Cycle 3 BDL BDL 0.1 ± 0.0 8.2 ± 1.9 BDL 49076.6 ±
1992.9
Unfrozen Cycle 6 BDL BDL BDL 7.7 ± 0.5 0.0 ±
0.0 48001.0 ±
805.6
Frozen Cycle 1 BDL BDL 0.2 ± 0.1 16.7 ±
6.7 BDL 54727.7 ± 3950.0
Frozen Cycle 3 BDL BDL 0.0 ± 0.0 17.2 ±
2.1 BDL 133558.4 ± 8856.6
Frozen Cycle 6 BDL BDL 0.0 ± 0.0 11.3 ±
1.9 BDL 99806.4 ± 1081.2
Overlying Water
Unfrozen Cycle 1 BDL 0.0 ± 0.0 0.0 ± 0.0 2.7 ± 0.1 BDL 49100.3 ±
928.3
Unfrozen Cycle 3 BDL BDL 0.0 ± 0.0 6.5 ± 0.5 BDL 49084.0 ±
604.9
Unfrozen Cycle 6 BDL BDL 0.1 ± 0.0 6.8 ± 1.8 BDL 46690.2 ±
1064.8
Frozen Cycle 1 BDL BDL 0.0 ± 0.0 3.7 ± 0.4 BDL 45522.4 ±
474.9
Frozen Cycle 3 BDL 0.0 ± 0.0 0.0 ± 0.0 5.1 ± 0.5 BDL 37250.4 ±
307.4
Frozen Cycle 6 BDL BDL 0.0 ± 0.0 6.8 ± 0.4 BDL 47005.4 ±
1357.6

169
Appendix C continued (a) Treatment Mn Mo Nb Nd Ni P
Pore Water Unfrozen Cycle 1 6.2 ± 3.6 121.4±
13.4 0.5 ± 0.0 BDL 14.3 ± 1.4 353.7 ± 22.0
Unfrozen Cycle 3 0.8 ± 0.3 71.7 ± 6.4 0.4 ± 0.0 BDL 7.9 ± 0.1 219.6 ± 13.7
Unfrozen Cycle 6 6.6 ± 2.6 65.7 ± 9.1 0.4 ± 0.0 BDL 4.4 ± 0.6 214.2 ± 3.8
Frozen Cycle 1 6.9 ± 2.2 112.1 ±
4.8 0.5 ± 0.0 BDL 9.8 ± 1.2 326.8 ± 22.8
Frozen Cycle 3 1.8 ± 0.6 148.1 ±
39.3 0.5 ± 0.0 BDL 10.6 ± 0.2 524.0 ± 22.9
Frozen Cycle 6 2.8 ± 1.1 58.0 ± 5.8 0.5 ± 0.0 0.3 ±
0.0 6.2 ± 0.4 318.2 ± 27.9
Overlying Water
Unfrozen Cycle 1 2.7 ± 0.2 17.7 ± 3.0 0.4 ± 0.0 BDL 7.6 ± 0.9 181.5 ± 15.5
Unfrozen Cycle 3 0.3 ± 0.1 36.0 ± 2.7 0.5 ± 0.0 BDL 5.2 ± 0.2 195.9 ± 8.9
Unfrozen Cycle 6 0.8 ± 0.1 52.8 ± 8.9 0.5 ± 0.1 BDL 3.6 ± 0.4 163.8 ± 14.0
Frozen Cycle 1 4.9 ± 0.6 17.6 ± 0.9 0.5 ± 0.0 BDL 7.1 ± 0.8 161.9 ± 7.0
Frozen Cycle 3 0.7 ± 0.2 31.3 ± 5.8 0.5 ± 0.0 BDL 2.9 ± 0.1 161.4 ± 4.9
Frozen Cycle 6 0.6 ± 0.0 31.4 ± 0.7 0.4 ± 0.0 BDL 2.7 ± 0.1 149.4 ± 2.6
(b) Treatment Mn Mo Nb Nd Ni P
Pore Water Unfrozen Cycle 1
1254.9 ± 437.8 40.9 ± 2.5 0.4 ± 0.0 0.2 ±
0.0 163.4 ±
74.0 378.2 ± 30.6
Unfrozen Cycle 3
363.2 ± 82.6 20.9 ± 2.5 0.4 ± 0.0 BDL 43.8 ±
16.0 196.0 ± 13.1
Unfrozen Cycle 6
212.7 ± 13.0 21.9 ± 1.0 0.4 ± 0.0 BDL 14.2 ± 1.1 205.7 ± 4.4
Frozen Cycle 1
970.8 ± 426.5 18.4 ± 3.3 0.4 ± 0.0 BDL 164.7 ±
83.6 249.7 ± 28.9
Frozen Cycle 3
377.0 ± 125.7 61.6 ± 3.2 0.5 ± 0.0 BDL 22.5 ± 5.3 532.3 ± 42.8
Frozen Cycle 6
344.6 ± 97.2 51.9 ± 4.8 0.4 ± 0.0 BDL 12.2 ± 2.0 395.6 ± 41.7
Overlying Water
Unfrozen Cycle 1
91.3 ± 6.7 6.3 ± 0.2 0.4 ± 0.0 BDL 10.4 ± 0.2 126.8 ± 3.4
Unfrozen Cycle 3
162.8 ± 14.8 16.2 ± 1.0 0.4 ± 0.0 BDL 9.7 ± 0.5 150.2 ± 7.2
Unfrozen Cycle 6
264.5 ± 117.0 19.9 ± 2.2 0.4 ± 0.0 BDL 26.8 ±
18.4 164.3 ± 6.9
Frozen Cycle 1
87.6 ± 12.2 6.2 ± 0.3 0.4 ± 0.0 BDL 13.4 ± 1.4 129.4 ± 1.9
Frozen Cycle 3
84.6 ± 11.0 13.1 ± 1.0 0.4 ± 0.0 BDL 7.9 ± 0.6 129.6 ± 4.4
Frozen Cycle 6
137.5 ± 31.2 23.0 ± 0.2 0.4 ± 0.0 BDL 5.9 ± 0.7 165.9 ± 3.1
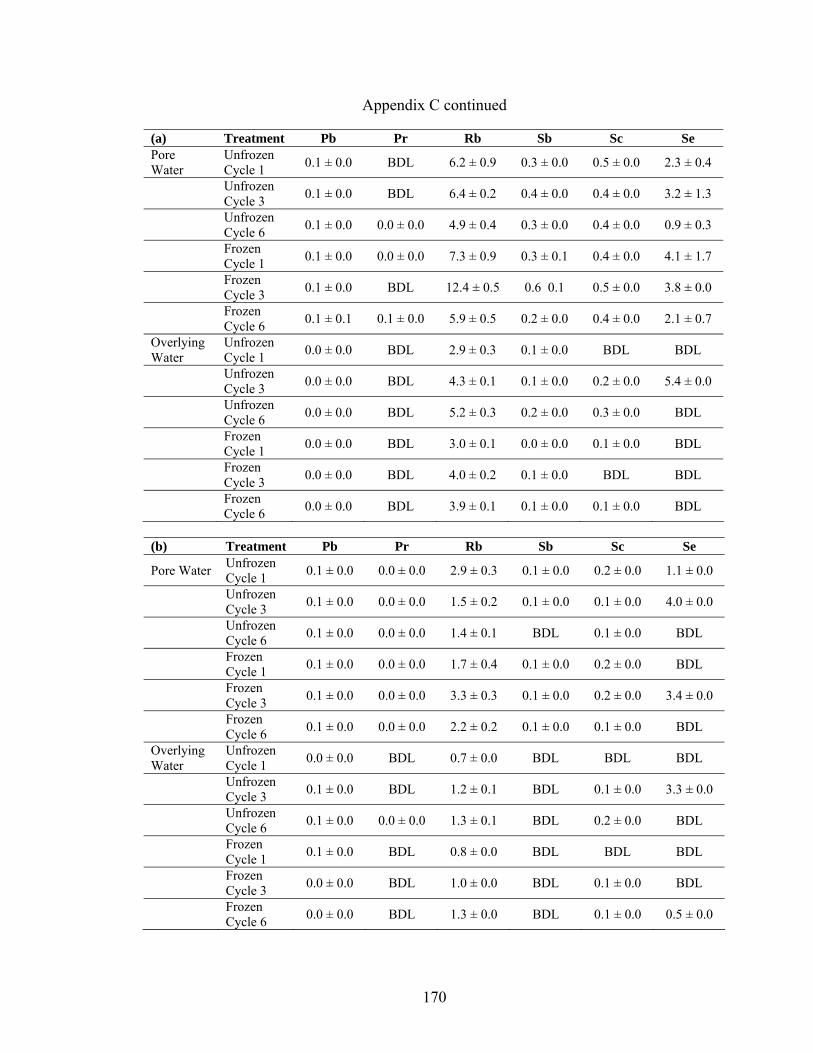
170
Appendix C continued (a) Treatment Pb Pr Rb Sb Sc Se Pore Water
Unfrozen Cycle 1 0.1 ± 0.0 BDL 6.2 ± 0.9 0.3 ± 0.0 0.5 ± 0.0 2.3 ± 0.4
Unfrozen Cycle 3 0.1 ± 0.0 BDL 6.4 ± 0.2 0.4 ± 0.0 0.4 ± 0.0 3.2 ± 1.3
Unfrozen Cycle 6 0.1 ± 0.0 0.0 ± 0.0 4.9 ± 0.4 0.3 ± 0.0 0.4 ± 0.0 0.9 ± 0.3
Frozen Cycle 1 0.1 ± 0.0 0.0 ± 0.0 7.3 ± 0.9 0.3 ± 0.1 0.4 ± 0.0 4.1 ± 1.7
Frozen Cycle 3 0.1 ± 0.0 BDL 12.4 ± 0.5 0.6 0.1 0.5 ± 0.0 3.8 ± 0.0
Frozen Cycle 6 0.1 ± 0.1 0.1 ± 0.0 5.9 ± 0.5 0.2 ± 0.0 0.4 ± 0.0 2.1 ± 0.7
Overlying Water
Unfrozen Cycle 1 0.0 ± 0.0 BDL 2.9 ± 0.3 0.1 ± 0.0 BDL BDL
Unfrozen Cycle 3 0.0 ± 0.0 BDL 4.3 ± 0.1 0.1 ± 0.0 0.2 ± 0.0 5.4 ± 0.0
Unfrozen Cycle 6 0.0 ± 0.0 BDL 5.2 ± 0.3 0.2 ± 0.0 0.3 ± 0.0 BDL
Frozen Cycle 1 0.0 ± 0.0 BDL 3.0 ± 0.1 0.0 ± 0.0 0.1 ± 0.0 BDL
Frozen Cycle 3 0.0 ± 0.0 BDL 4.0 ± 0.2 0.1 ± 0.0 BDL BDL
Frozen Cycle 6 0.0 ± 0.0 BDL 3.9 ± 0.1 0.1 ± 0.0 0.1 ± 0.0 BDL
(b) Treatment Pb Pr Rb Sb Sc Se
Pore Water Unfrozen Cycle 1 0.1 ± 0.0 0.0 ± 0.0 2.9 ± 0.3 0.1 ± 0.0 0.2 ± 0.0 1.1 ± 0.0
Unfrozen Cycle 3 0.1 ± 0.0 0.0 ± 0.0 1.5 ± 0.2 0.1 ± 0.0 0.1 ± 0.0 4.0 ± 0.0
Unfrozen Cycle 6 0.1 ± 0.0 0.0 ± 0.0 1.4 ± 0.1 BDL 0.1 ± 0.0 BDL
Frozen Cycle 1 0.1 ± 0.0 0.0 ± 0.0 1.7 ± 0.4 0.1 ± 0.0 0.2 ± 0.0 BDL
Frozen Cycle 3 0.1 ± 0.0 0.0 ± 0.0 3.3 ± 0.3 0.1 ± 0.0 0.2 ± 0.0 3.4 ± 0.0
Frozen Cycle 6 0.1 ± 0.0 0.0 ± 0.0 2.2 ± 0.2 0.1 ± 0.0 0.1 ± 0.0 BDL
Overlying Water
Unfrozen Cycle 1 0.0 ± 0.0 BDL 0.7 ± 0.0 BDL BDL BDL
Unfrozen Cycle 3 0.1 ± 0.0 BDL 1.2 ± 0.1 BDL 0.1 ± 0.0 3.3 ± 0.0
Unfrozen Cycle 6 0.1 ± 0.0 0.0 ± 0.0 1.3 ± 0.1 BDL 0.2 ± 0.0 BDL
Frozen Cycle 1 0.1 ± 0.0 BDL 0.8 ± 0.0 BDL BDL BDL
Frozen Cycle 3 0.0 ± 0.0 BDL 1.0 ± 0.0 BDL 0.1 ± 0.0 BDL
Frozen Cycle 6 0.0 ± 0.0 BDL 1.3 ± 0.0 BDL 0.1 ± 0.0 0.5 ± 0.0

171
Appendix C continued (a) Treatment Si Sm Sn Sr Ta Th
Pore Water Unfrozen Cycle 1
2170.6 ± 182.5 BDL BDL 942.7 ±
181.2 BDL BDL
Unfrozen Cycle 3
2301.9 ± 49.7 BDL 0.1 ± 0.0 607.5 ±
41.8 0.0 ± 0.0 BDL
Unfrozen Cycle 6
1939.0 ± 105.4 BDL BDL 521.0 ±
67.1 BDL 0.0 ± 0.0
Frozen Cycle 1
1712.2 ± 51.8 BDL BDL 953.3 ±
204.8 BDL 0.0 ± 0.0
Frozen Cycle 3
2295.4 ± 183.3 BDL BDL 1259.8 ±
101.9 0.0 ± 0.0 0.0 ± 0.0
Frozen Cycle 6
1687.7 ± 41.3 BDL 0.0 ± 0.0 590.6 ±
61.6 BDL 0.0 ± 0.0
Overlying Water
Unfrozen Cycle 1 BDL BDL BDL 400.8 ±
11.1 BDL BDL
Unfrozen Cycle 3
759.8 ± 49.0 BDL BDL 448.7 ±
8.4 BDL BDL
Unfrozen Cycle 6
1236.4 ± 103.8 BDL BDL 516.7 ±
50.5 BDL 0.0 ± 0.0
Frozen Cycle 1 0.0 ± 0.0 BDL BDL 399.0 ±
11.3 BDL BDL
Frozen Cycle 3
222.5 ± 0.0 BDL BDL 395.5 ±
26.3 BDL BDL
Frozen Cycle 6
610.8 ± 16.3 BDL 0.1 ± 0.0 331.2 ±
23.8 BDL 0.0 ± 0.0
(b) Treatment Si Sm Sn Sr Ta Th
Pore Water Unfrozen Cycle 1
391.2 ± 63.8 0.1 ± 0.0 0.2 ± 0.0 558.1 ±
52.3 BDL 0.0 ± 0.0
Unfrozen Cycle 3
378.7 ± 81.8 BDL 0.1 ± 0.0 346.9 ±
7.7 BDL BDL
Unfrozen Cycle 6
438.8 ± 10.7 BDL BDL 324.9 ±
3.6 BDL BDL
Frozen Cycle 1
231.7 ± 76.8 BDL BDL 450.4 ±
54.5 BDL BDL
Frozen Cycle 3
584.5 ± 55.1 BDL 0.2 ± 0.0 584.2 ±
70.8 BDL 0.0 ± 0.0
Frozen Cycle 6
593.9 ± 50.2 BDL BDL 471.4 ±
47.1 BDL 0.0 ± 0.0
Overlying Water
Unfrozen Cycle 1 BDL BDL BDL 327.1 ±
7.5 BDL 0.0 ± 0.0
Unfrozen Cycle 3
105.7 ± 0.0 BDL 0.1 ± 0.0 328.2 ±
5.2 BDL 0.0 ± 0.0
Unfrozen Cycle 6
468.6 ± 49.4 BDL 0.1 ± 0.0 328.0 ±
12.8 BDL 0.0 ± 0.0
Frozen Cycle 1 0.0 ± 0.0 BDL BDL 290.9 ±
11.2 BDL BDL
Frozen Cycle 3 0.0 ± 0.0 BDL 0.1 ± 0.0 185.3 ±
4.4 BDL 0.0 ± 0.0
Frozen Cycle 6
212.7 ± 12.3 BDL 0.1 ± 0.0 220.7 ±
14.5 BDL BDL

172
Appendix C continued (a) Treatment Ti Tl Tm U V Pore Water
Unfrozen Cycle 1 2.1 ± 0.2 0.0 ± 0.0 BDL 0.4 ± 0.1 86.3 ± 12.2
Unfrozen Cycle 3 1.7 ± 0.2 BDL BDL 0.7 ± 0.1 115.8 ± 19.0
Unfrozen Cycle 6 2.1 ± 0.8 0.0 ± 0.0 BDL 0.6 ± 0.1 61.0 ± 12.5
Frozen Cycle 1 2.1 ± 0.5 0.0 ± 0.0 BDL 0.5 ± 0.1 78.7 ± 15.3
Frozen Cycle 3 2.2 ± 0.3 0.0 ± 0.0 BDL 2.7 ± 0.5 93.1 ± 5.5
Frozen Cycle 6 2.5 ± 0.8 0.0 ± 0.0 BDL 1.1 ± 0.1 164.9 ± 10.5
Overlying Water
Unfrozen Cycle 1 1.8 ± 0.0 BDL BDL 0.1 ± 0.0 47.0 ± 7.5
Unfrozen Cycle 3 2.0 ± 0.0 BDL BDL 0.2 ± 0.0 77.9 ± 5.4
Unfrozen Cycle 6 1.6 ± 0.1 0.0 ± 0.0 BDL 0.3 ± 0.1 76.4 ± 10.8
Frozen Cycle 1 BDL BDL BDL 0.1 ± 0.0 32.0 ± 5.4
Frozen Cycle 3 BDL BDL BDL 0.4 ± 0.1 26.4 ± 1.7
Frozen Cycle 6 0.9 ± 0.1 0.0 ± 0.0 BDL 0.5 ± 0.0 77.7 ± 7.7
(b) Treatment Ti Tl Tm V U Pore Water
Unfrozen Cycle 1 2.9 ± 0.3 0.0 ± 0.0 BDL 21.4 ± 5.1 0.3 ± 0.0
Unfrozen Cycle 3 1.6 ± 0.4 BDL BDL 31.4 ± 2.3 0.1 ± 0.0
Unfrozen Cycle 6 1.6 ± 0.2 BDL BDL 34.5 ± 5.6 0.1 ± 0.0
Frozen Cycle 1 2.7 ± 0.4 0.0 ± 0.0 BDL 13.6 ± 1.3 0.1 ± 0.0
Frozen Cycle 3 2.2 ± 0.3 0.0 ± 0.0 BDL 55.1 ± 4.2 0.4 ± 0.0
Frozen Cycle 6 2.1 ± 0.1 0.0 ± 0.0 BDL 46.2 ± 2.7 0.3 ± 0.0
Overlying Water
Unfrozen Cycle 1 1.1 ± 0.2 0.0 ± 0.0 BDL 13.6 ± 1.0 0.0 ± 0.0
Unfrozen Cycle 3 1.6 ± 0.2 0.0 ± 0.0 BDL 33.7 ± 3.1 0.1 ± 0.0
Unfrozen Cycle 6 2.0 ± 0.3 0.0 ± 0.0 BDL 32.0 ± 0.4 0.1 ± 0.0
Frozen Cycle 1 0.9 ± 0.2 0.0 ± 0.0 BDL 10.2 ± 0.1 0.0 ± 0.0
Frozen Cycle 3 0.9 ± 0.2 0.0 ± 0.0 BDL 13.6 ± 1.3 0.1 ± 0.0
Frozen Cycle 6 1.4 ± 0.7 BDL BDL 22.3 ± 3.2 0.1 ± 0.0

173
Appendix C continued (a) Treatment W Y Yb Zn Zr
Pore Water Unfrozen Cycle 1 BDL 2.6 ± 0.2 BDL 6.0 ± 1.2 0.1 ± 0.0
Unfrozen Cycle 3 BDL 1.7 ± 0.0 BDL 8.9 ± 0.4 0.1 ± 0.0
Unfrozen Cycle 6 BDL 1.4 ± 0.2 BDL 8.5 ± 1.5 0.2 ± 0.0
Frozen Cycle 1 BDL 2.4 ± 0.4 0.0 ± 0.0 3.3 ± 0.7 0.1 ± 0.0
Frozen Cycle 3 BDL 3.6 ± 0.5 0.0 ± 0.0 4.5 ± 0.6 0.2 ± 0.0
Frozen Cycle 6 BDL 1.8 ± 0.1 0.1 ± 0.0 8.9 ± 0.3 0.4 ± 0.2
Overlying Water
Unfrozen Cycle 1 BDL 1.2 ± 0.1 0.0 ± 0.0 4.1 ± 1.2 0.0 ± 0.0
Unfrozen Cycle 3 BDL 1.2 ± 0.0 BDL 2.6 ± 0.2 0.1 ± 0.0
Unfrozen Cycle 6 BDL 1.2 ± 0.1 0.0 ± 0.0 3.5 ± 0.0 0.1 ± 0.0
Frozen Cycle 1 BDL 1.1 ± 0.1 0.0 ± 0.0 3.4 ± 1.0 0.1 ± 0.0
Frozen Cycle 3 BDL 1.2 ± 0.1 0.0 ± 0.0 2.8 ± 0.2 0.1 ± 0.0
Frozen Cycle 6 BDL 0.9 ± 0.0 BDL BDL 0.0 ± 0.0
(b) Treatment W Y Yb Zn Zr
Pore Water Unfrozen Cycle 1 0.2 ± 0.0 1.6 ± 0.2 0.0 ± 0.0 11.9 ± 2.2 0.2 ± 0.0
Unfrozen Cycle 3 BDL 1.1 ± 0.1 BDL 4.8 ± 0.7 0.1 ± 0.0
Unfrozen Cycle 6 0.2 ± 0.0 0.8 ± 0.0 BDL 4.3 ± 0.8 0.1 ± 0.0
Frozen Cycle 1 BDL 1.4 ± 0.1 0.0 ± 0.0 11.5 ± 5.8 0.1 ± 0.0
Frozen Cycle 3 0.6 ± 0.0 1.6 ± 0.2 0.0 ± 0.0 2.6 ± 0.2 0.2 ± 0.0
Frozen Cycle 6 0.3 ± 0.0 1.3 ± 0.1 0.1 ± 0.0 5.2 ± 0.7 0.1 ± 0.0
Overlying Water
Unfrozen Cycle 1 BDL 0.9 ± 0.0 BDL BDL 0.1 ± 0.0
Unfrozen Cycle 3 0.1 ± 0.0 0.9 ± 0.1 BDL 4.5 ± 0.0 0.0 ± 0.0
Unfrozen Cycle 6 0.1 ± 0.0 1.0 ± 0.1 BDL 5.7 ± 2.0 0.1 ± 0.0
Frozen Cycle 1 BDL 0.8 ± 0.0 BDL BDL 0.0 ± 0.0
Frozen Cycle 3 0.1 ± 0.0 0.5 ± 0.0 BDL 3.6 ± 0.0 0.0 ± 0.0
Frozen Cycle 6 0.1 ± 0.0 0.6 ± 0.0 BDL 3.2 ± 0.6 0.0 ± 0.0

174
APPENDIX D: Mean ± SE metal concentrations (µg/L) from the accelerated weathering leaching experiment using Syncrude (a) and Suncor (b) cokes. (n = 3) (BDL = below detection limit) (a) Treatment Ag Al As Au Ba Ca Pore Water Untreated Day 0 BDL 1282.8 ±
293.8 0.4 ± 0.1 BDL 18.6 ± 2.0 109051.5 ± 2403.8
Water Rinsed Day 0 0.0 ± 0.0 144.8 ±
38.1 0.4 ± 0.1 BDL 60.3 ± 0.5 57097.5 ± 7982.8
Peroxide Treated Day 0 BDL 3421.8 ±
397.7 9.7 ± 0.6 BDL 23.7 ± 3.9 17098.6 ± 1849.2
Untreated Day 15 BDL 252.3 ±
187.7 0.4 ± 0.0 0.0 ± 0.0 22.7 ± 0.5 102346.6 ± 12778.2
Water Rinsed Day 15 BDL 16.1 ±
0.0 0.5 ± 0.0 0.0 ± 0.0 25.4 ± 0.5 61564.5 ± 3594.5
Peroxide Treated Day 15 BDL 98.9 ±
27.6 0.3 ± 0.0 0.0 ± 0.0 53.7 ± 2.1 72603.4 ± 3951.4
Untreated Day 30 BDL 12.7 ±
0.0 0.7 ± 0.1 BDL 18.9 ± 0.4 80988.6 ± 2931.5
Water Rinsed Day 30 BDL BDL 0.6 ± 0.1 BDL 28.5 ± 2.7 59843.9 ±
2162.8
Peroxide Treated Day 30 BDL 79.5 ±
8.2 0.5 ± 0.3 0.0 ± 0.0 48.3 ± 5.3 69548.0 ± 4850.6
Overlying Water Untreated Day 0 0.1 ± 0.0 206.5 ±
40.3 BDL BDL 9.5 ± 0.5 70788.8 ± 2000.5
Water Rinsed Day 0 BDL 91.6 ±
2.5 BDL BDL 28.0 ± 0.4 67788.9 ± 4397.5
Peroxide Treated Day 0 BDL 398.0 ±
24.5 1.3 ± 0.0 BDL 17.8 ± 0.7 23401.5 ± 539.3
Untreated Day 15 0.1 ± 0.0 210.9 ±
163.4 0.5 ± 0.0 BDL 28.2 ± 1.6 78875.6 ± 3831.8
Water Rinsed Day 15 BDL BDL 0.4 ± 0.1 0.0 ± 0.0 33.6 ± 1.9 52183.2 ±
1429.2
Peroxide Treated Day 15 BDL 531.3 ±
77.1 0.3 ± 0.0 0.0 ± 0.0 56.8 ± 3.3 53776.7 ± 616.3
Untreated Day 30 BDL 7.7 ± 0.3 0.3 ± 0.0 BDL 25.4 ± 0.4 72231.9 ±
2039.7
Water Rinsed Day 30 BDL BDL 0.6 ± 0.0 BDL 37.1 ± 3.9 54134.9 ±
408.6
Peroxide Treated Day 30 BDL 143.5 ±
71.2 0.5 ± 0.1 BDL 52.5 ± 4.3 60877.2 ± 5610.5

175
Appendix D continued (b) Treatment Ag Al As Au Ba Ca Pore Water Untreated Day 0 0.0 ±
0.0 115.5 ±
24.5 BDL BDL 3.3 ± 0.6 88057.2 ± 2539.3
Water Rinsed Day 0 BDL 20.8 ±
1.1 BDL 0.0 ± 0.0 10.3 ± 0.3 83972.8 ±
2426.2
Peroxide Treated Day 0 BDL 27.6 ±
6.1 0.3 ± 0.0 BDL 4.0 ± 0.2 34743.7 ±
869.6
Untreated Day 15 BDL 273.6 ±
201.9 0.7 ± 0.0 BDL 22.3 ± 1.2 96126.6 ±
7645.1
Water Rinsed Day 15 BDL 99.9 ±
58.5 0.3 ± 0.0 BDL 13.0 ± 1.1 57628.6 ±
1835.8
Peroxide Treated Day 15 BDL 546.2 ±
108.8 0.4 ± 0.1 BDL 11.2 ± 1.2 52176.4 ±
970.1
Untreated Day 30 BDL 377.2 ±
180.1 0.3 ± 0.0 BDL 23.2 ± 1.3 79756.3 ±
3570.7
Water Rinsed Day 30 BDL 126.8 ±
28.1 0.2 ± 0.1 BDL 11.8 ± 0.7 55909.0 ±
1081.2
Peroxide Treated Day 30 BDL 511.7 ±
48.0 0.2 ± 0.0 BDL 9.8 ± 0.3 51258.8 ±
1414.5 Overlying Water Untreated Day 0 BDL 31.4 ±
0.8 0.3 ± 0.1 BDL 7.8 ± 0.4 63713.6 ±
1044.4
Water Rinsed Day 0 BDL 13.7 ±
1.8 0.4 ± 0.0 BDL 10.9 ± 0.2 71727.2 ±
1612.3
Peroxide Treated Day 0 BDL 23.8 ±
1.8 BDL 0.0 ± 0.0 14.3 ± 0.6 32482.1 ±
200.9
Untreated Day 15 BDL 225.0 ±
106.2 BDL BDL 15.9 ± 0.6 67482.6 ± 501.9
Water Rinsed Day 15 BDL 91.8 ±
14.9 0.3 ± 0.0
0.0 ± 0.0 12.9 ± 0.2 48599.4 ±
805.9
Peroxide Treated Day 15 BDL 248.0 ±
16.6 BDL 0.0 ± 0.0 12.5 ± 0.8 45135.3 ±
939.6
Untreated Day 30 BDL 293.1 ±
89/4 0.3 ± 0.1 BDL 19.3 ± 2.2 70032.2 ±
167.0
Water Rinsed Day 30 BDL 164.3 ±
30.8 0.3 ± 0.1 BDL 13.3 ± 0.4 52781.9 ±
903.5
Peroxide Treated Day 30 BDL 352.4 ±
29.8 0.2 ± 0.0 BDL 12.1 ± 1.0 47297.9 ±
1850.5

176
Appendix D continued (a) Treatment Cd Ce Co Cr Cs Cu Pore Water Untreated Day 0 0.5 ± 0.1 1.9 ± 0.4 27.5 ±
2.3 BDL 0.4 ± 0.0 2.4 ± 0.1
Water Rinsed Day 0 BDL 0.2 ± 0.1 22.3 ±
9.4 BDL 0.2 ± 0.0 1.6 ± 0.3
Peroxide Treated Day 0 BDL 0.8 ± 0.2 19.3 ±
4.9 7.8 ± 0.5 0.3 ± 0.1 1.4 ± 0.2
Untreated Day 15 BDL 0.4 ± 0.3 8.3 ± 7.6 BDL 0.1 ± 0.1 3.0 ± 0.4
Water Rinsed Day 15 BDL 0.0 ± 0.0 0.5 ± 0.1 1.6 ± 0.0 0.0 ± 0.0 1.5 ± 0.5
Peroxide Treated Day 15 BDL 0.3 ± 0.1 20.4 ±
1.5 BDL 0.1 ± 0.0 1.8 ± 0.5
Untreated Day 30 0.1 ± 0.0 0.0 ± 0.0 0.5 ± 0.0 BDL 0.0 ± 0.0 1.7 ± 0.5
Water Rinsed Day 30 BDL BDL 0.7 ± 0.1 BDL 0.0 ± 0.0 0.9 ± 0.1
Peroxide Treated Day 30 BDL 0.2 ± 0.0 15.1 ±
3.8 BDL 0.1 ± 0.0 1.4 ± 0.1
Overlying Water Untreated Day 0 BDL 0.9 ± 0.2 3.8 ± 0.6 BDL 0.1 ± 0.0 1.6 ± 0.1
Water Rinsed Day 0 BDL 0.2 ± 0.1 4.7 ± 1.0 BDL 0.1 ± 0.0 1.1 ± 0.2
Peroxide Treated Day 0 BDL 0.1 ± 0.0 5.6 ± 0.3 1.8 ± 0.1 0.1 ± 0.0 1.0 ± 0.1
Untreated Day 15 BDL 0.4 ± 0.3 4.0 ± 3.0 0.7 ± 0.0 0.1 ± 0.1 3.0 ± 0.7
Water Rinsed Day 15 BDL 0.0 ± 0.0 1.1 ± 0.3 BDL 0.1 ± 0.0 1.1 ± 0.1
Peroxide Treated Day 15 0.5 ± 0.1 0.9 ± 0.1 12.1 ±
0.4 1.5 ± 0.1 0.1 ± 0.0 1.9 ± 0.2
Untreated Day 30 0.1 ± 0.0 BDL 0.2 ± 0.0 BDL 0.0 ± 0.0 1.1 ± 0.1
Water Rinsed Day 30 BDL 0.0 ± 0.0 0.8 ± 0.4 BDL 0.0 ± 0.0 0.9 ± 0.1
Peroxide Treated Day 30 0.2 ± 0.0 0.4 ± 0.2 10.8 ±
1.4 0.9 ± 0.0 0.1 ± 0.0 7.4 ± 5.8
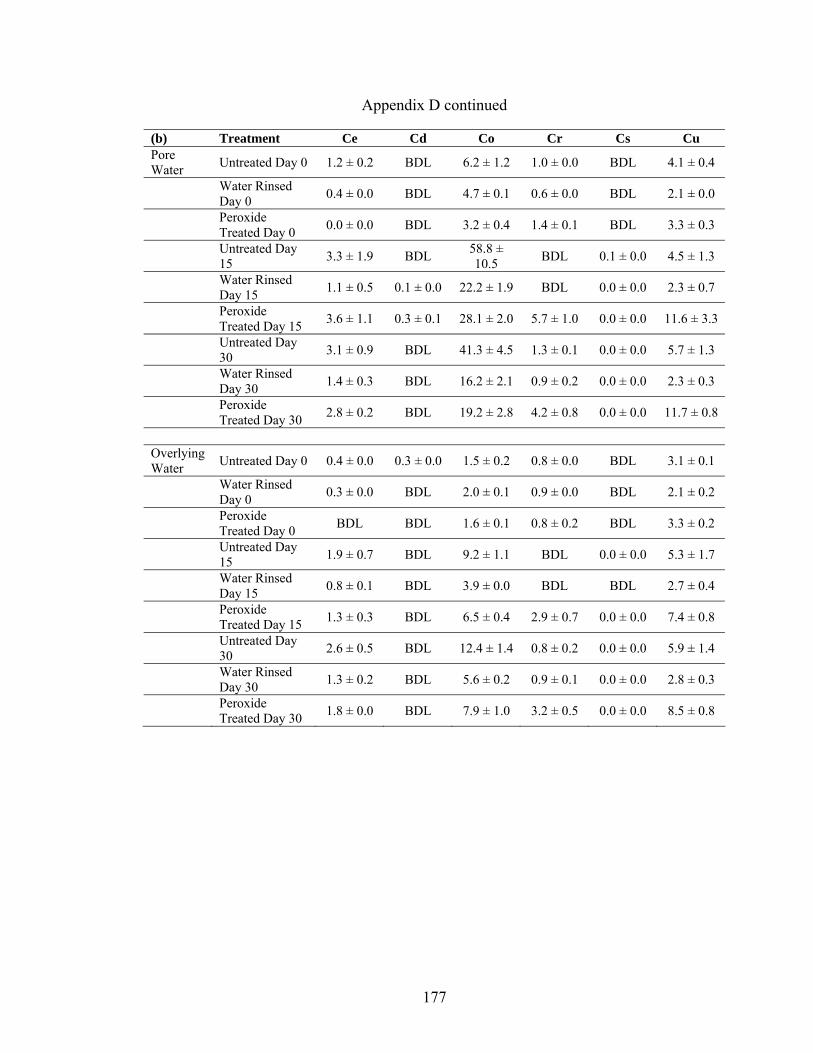
177
Appendix D continued (b) Treatment Ce Cd Co Cr Cs Cu Pore Water Untreated Day 0 1.2 ± 0.2 BDL 6.2 ± 1.2 1.0 ± 0.0 BDL 4.1 ± 0.4
Water Rinsed Day 0 0.4 ± 0.0 BDL 4.7 ± 0.1 0.6 ± 0.0 BDL 2.1 ± 0.0
Peroxide Treated Day 0 0.0 ± 0.0 BDL 3.2 ± 0.4 1.4 ± 0.1 BDL 3.3 ± 0.3
Untreated Day 15 3.3 ± 1.9 BDL 58.8 ±
10.5 BDL 0.1 ± 0.0 4.5 ± 1.3
Water Rinsed Day 15 1.1 ± 0.5 0.1 ± 0.0 22.2 ± 1.9 BDL 0.0 ± 0.0 2.3 ± 0.7
Peroxide Treated Day 15 3.6 ± 1.1 0.3 ± 0.1 28.1 ± 2.0 5.7 ± 1.0 0.0 ± 0.0 11.6 ± 3.3
Untreated Day 30 3.1 ± 0.9 BDL 41.3 ± 4.5 1.3 ± 0.1 0.0 ± 0.0 5.7 ± 1.3
Water Rinsed Day 30 1.4 ± 0.3 BDL 16.2 ± 2.1 0.9 ± 0.2 0.0 ± 0.0 2.3 ± 0.3
Peroxide Treated Day 30 2.8 ± 0.2 BDL 19.2 ± 2.8 4.2 ± 0.8 0.0 ± 0.0 11.7 ± 0.8
Overlying Water Untreated Day 0 0.4 ± 0.0 0.3 ± 0.0 1.5 ± 0.2 0.8 ± 0.0 BDL 3.1 ± 0.1
Water Rinsed Day 0 0.3 ± 0.0 BDL 2.0 ± 0.1 0.9 ± 0.0 BDL 2.1 ± 0.2
Peroxide Treated Day 0 BDL BDL 1.6 ± 0.1 0.8 ± 0.2 BDL 3.3 ± 0.2
Untreated Day 15 1.9 ± 0.7 BDL 9.2 ± 1.1 BDL 0.0 ± 0.0 5.3 ± 1.7
Water Rinsed Day 15 0.8 ± 0.1 BDL 3.9 ± 0.0 BDL BDL 2.7 ± 0.4
Peroxide Treated Day 15 1.3 ± 0.3 BDL 6.5 ± 0.4 2.9 ± 0.7 0.0 ± 0.0 7.4 ± 0.8
Untreated Day 30 2.6 ± 0.5 BDL 12.4 ± 1.4 0.8 ± 0.2 0.0 ± 0.0 5.9 ± 1.4
Water Rinsed Day 30 1.3 ± 0.2 BDL 5.6 ± 0.2 0.9 ± 0.1 0.0 ± 0.0 2.8 ± 0.3
Peroxide Treated Day 30 1.8 ± 0.0 BDL 7.9 ± 1.0 3.2 ± 0.5 0.0 ± 0.0 8.5 ± 0.8
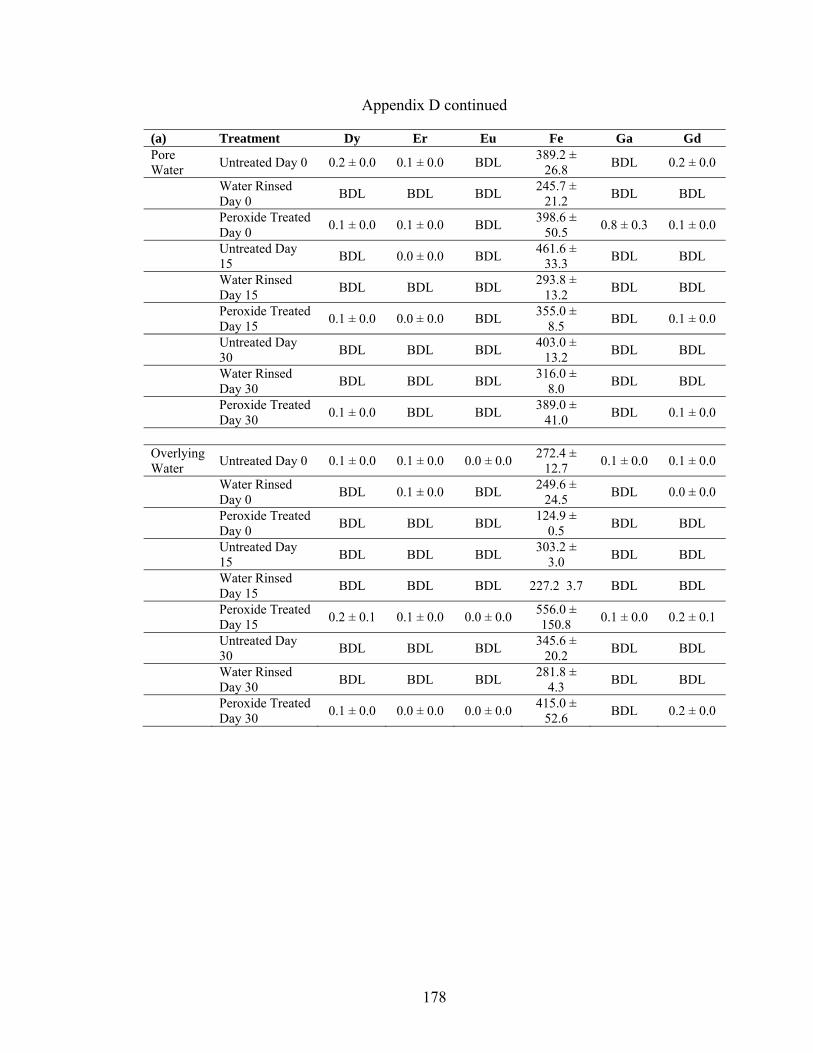
178
Appendix D continued (a) Treatment Dy Er Eu Fe Ga Gd Pore Water Untreated Day 0 0.2 ± 0.0 0.1 ± 0.0 BDL 389.2 ±
26.8 BDL 0.2 ± 0.0
Water Rinsed Day 0 BDL BDL BDL 245.7 ±
21.2 BDL BDL
Peroxide Treated Day 0 0.1 ± 0.0 0.1 ± 0.0 BDL 398.6 ±
50.5 0.8 ± 0.3 0.1 ± 0.0
Untreated Day 15 BDL 0.0 ± 0.0 BDL 461.6 ±
33.3 BDL BDL
Water Rinsed Day 15 BDL BDL BDL 293.8 ±
13.2 BDL BDL
Peroxide Treated Day 15 0.1 ± 0.0 0.0 ± 0.0 BDL 355.0 ±
8.5 BDL 0.1 ± 0.0
Untreated Day 30 BDL BDL BDL 403.0 ±
13.2 BDL BDL
Water Rinsed Day 30 BDL BDL BDL 316.0 ±
8.0 BDL BDL
Peroxide Treated Day 30 0.1 ± 0.0 BDL BDL 389.0 ±
41.0 BDL 0.1 ± 0.0
Overlying Water Untreated Day 0 0.1 ± 0.0 0.1 ± 0.0 0.0 ± 0.0 272.4 ±
12.7 0.1 ± 0.0 0.1 ± 0.0
Water Rinsed Day 0 BDL 0.1 ± 0.0 BDL 249.6 ±
24.5 BDL 0.0 ± 0.0
Peroxide Treated Day 0 BDL BDL BDL 124.9 ±
0.5 BDL BDL
Untreated Day 15 BDL BDL BDL 303.2 ±
3.0 BDL BDL
Water Rinsed Day 15 BDL BDL BDL 227.2 3.7 BDL BDL
Peroxide Treated Day 15 0.2 ± 0.1 0.1 ± 0.0 0.0 ± 0.0 556.0 ±
150.8 0.1 ± 0.0 0.2 ± 0.1
Untreated Day 30 BDL BDL BDL 345.6 ±
20.2 BDL BDL
Water Rinsed Day 30 BDL BDL BDL 281.8 ±
4.3 BDL BDL
Peroxide Treated Day 30 0.1 ± 0.0 0.0 ± 0.0 0.0 ± 0.0 415.0 ±
52.6 BDL 0.2 ± 0.0
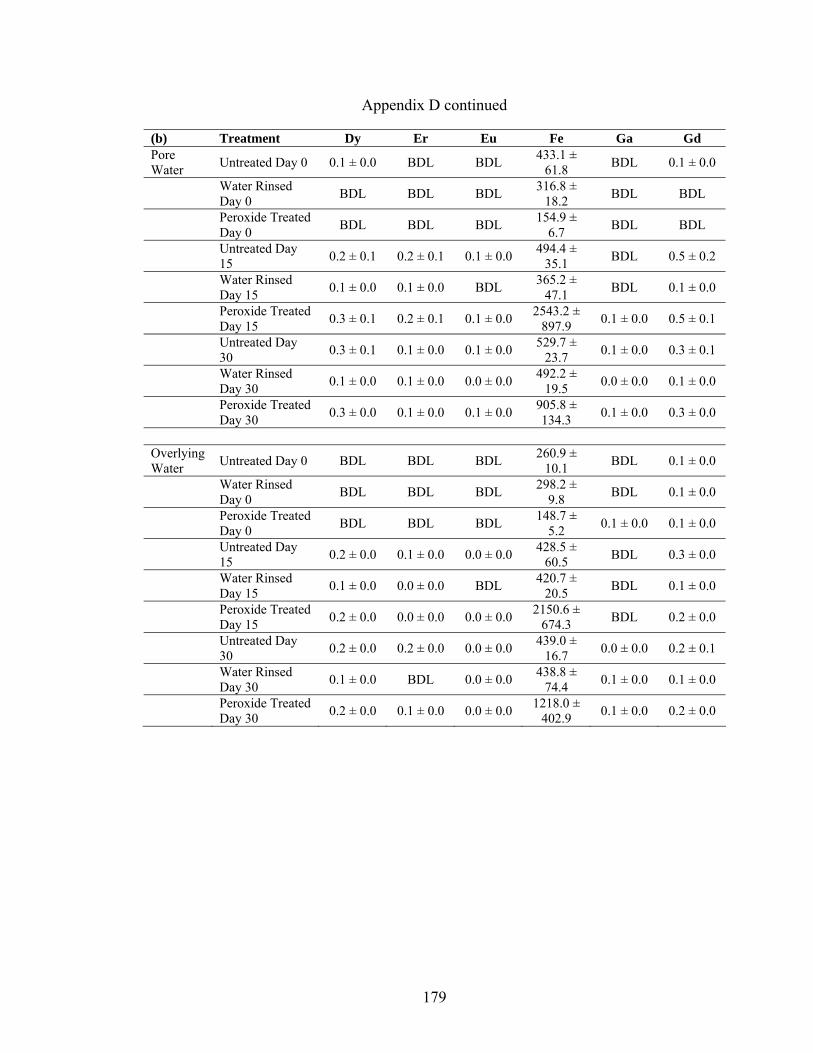
179
Appendix D continued (b) Treatment Dy Er Eu Fe Ga Gd Pore Water Untreated Day 0 0.1 ± 0.0 BDL BDL 433.1 ±
61.8 BDL 0.1 ± 0.0
Water Rinsed Day 0 BDL BDL BDL 316.8 ±
18.2 BDL BDL
Peroxide Treated Day 0 BDL BDL BDL 154.9 ±
6.7 BDL BDL
Untreated Day 15 0.2 ± 0.1 0.2 ± 0.1 0.1 ± 0.0 494.4 ±
35.1 BDL 0.5 ± 0.2
Water Rinsed Day 15 0.1 ± 0.0 0.1 ± 0.0 BDL 365.2 ±
47.1 BDL 0.1 ± 0.0
Peroxide Treated Day 15 0.3 ± 0.1 0.2 ± 0.1 0.1 ± 0.0 2543.2 ±
897.9 0.1 ± 0.0 0.5 ± 0.1
Untreated Day 30 0.3 ± 0.1 0.1 ± 0.0 0.1 ± 0.0 529.7 ±
23.7 0.1 ± 0.0 0.3 ± 0.1
Water Rinsed Day 30 0.1 ± 0.0 0.1 ± 0.0 0.0 ± 0.0 492.2 ±
19.5 0.0 ± 0.0 0.1 ± 0.0
Peroxide Treated Day 30 0.3 ± 0.0 0.1 ± 0.0 0.1 ± 0.0 905.8 ±
134.3 0.1 ± 0.0 0.3 ± 0.0
Overlying Water Untreated Day 0 BDL BDL BDL 260.9 ±
10.1 BDL 0.1 ± 0.0
Water Rinsed Day 0 BDL BDL BDL 298.2 ±
9.8 BDL 0.1 ± 0.0
Peroxide Treated Day 0 BDL BDL BDL 148.7 ±
5.2 0.1 ± 0.0 0.1 ± 0.0
Untreated Day 15 0.2 ± 0.0 0.1 ± 0.0 0.0 ± 0.0 428.5 ±
60.5 BDL 0.3 ± 0.0
Water Rinsed Day 15 0.1 ± 0.0 0.0 ± 0.0 BDL 420.7 ±
20.5 BDL 0.1 ± 0.0
Peroxide Treated Day 15 0.2 ± 0.0 0.0 ± 0.0 0.0 ± 0.0 2150.6 ±
674.3 BDL 0.2 ± 0.0
Untreated Day 30 0.2 ± 0.0 0.2 ± 0.0 0.0 ± 0.0 439.0 ±
16.7 0.0 ± 0.0 0.2 ± 0.1
Water Rinsed Day 30 0.1 ± 0.0 BDL 0.0 ± 0.0 438.8 ±
74.4 0.1 ± 0.0 0.1 ± 0.0
Peroxide Treated Day 30 0.2 ± 0.0 0.1 ± 0.0 0.0 ± 0.0 1218.0 ±
402.9 0.1 ± 0.0 0.2 ± 0.0

180
Appendix D continued (a) Treatment Ge Hf Hg Ho La Li Pore Water Untreated Day 0 BDL BDL BDL 0.0 ±
0.0 1.6 ± 0.4
116.7 ± 7.6
Water Rinsed Day 0 BDL BDL BDL 0.0 ±
0.0 0.3 ± 0.1
30.5 ± 5.6
Peroxide Treated Day 0 0.4 ± 0.0 0.3 ± 0.0 BDL 0.0 ±
0.0 0.4 ± 0.1
15.8 ± 2.0
Untreated Day 15 BDL BDL BDL BDL 0.2 ±
0.2 28.1 ± 12.0
Water Rinsed Day 15 BDL 0.1 ± 0.0 BDL BDL 0.0 ±
0.0 11.8 ±
0.0
Peroxide Treated Day 15 BDL BDL BDL BDL 0.2 ±
0.0 16.6 ±
2.2
Untreated Day 30 0.1 ± 0.0 0.0 ± 0.0 BDL BDL 0.0 ±
0.0 12.2 ±
1.4
Water Rinsed Day 30 0.1 ± 0.0 0.0 ± 0.0 BDL BDL 0.0 ±
0.0 8.0 ± 0.7
Peroxide Treated Day 30 BDL 0.0 ± 0.0 BDL 0.0 ±
0.0 0.1 ± 0.0
10.4 ± 2.7
Overlying Water Untreated Day 0 BDL BDL BDL BDL 0.7 ±
0.1 20.4 ±
8.6
Water Rinsed Day 0 BDL BDL BDL BDL 0.2 ±
0.0 BDL
Peroxide Treated Day 0 BDL BDL BDL 0.0 ±
0.0 0.1 ± 0.0 BDL
Untreated Day 15 BDL 0.0 ± 0.0 BDL BDL 0.2 ±
0.2 21.4 ±
5.8
Water Rinsed Day 15 BDL BDL BDL BDL 0.0 ±
0.0 10.6 ±
0.0
Peroxide Treated Day 15 BDL BDL BDL 0.0 ±
0.0 0.6 ± 0.1 BDL
Untreated Day 30 0.1 ± 0.0 0.0 ± 0.0 BDL BDL 0.0 ±
0.0 15.6 ±
0.6
Water Rinsed Day 30 0.1 ± 0.0 BDL BDL BDL 0.0 ±
0.0 8.9 ± 1.8
Peroxide Treated Day 30 0.2 ± 0.0 0.0 ± 0.0 BDL 0.0 ±
0.0 0.3 ± 0.1
6.1 ± 1.0

181
Appendix D continued (b) Treatment Ge Hf Hg Ho La Li Pore Water Untreated Day 0 BDL BDL BDL BDL 0.6 ± 0.1 BDL
Water Rinsed Day 0 BDL BDL BDL BDL 0.3 ± 0.0 BDL
Peroxide Treated Day 0 BDL 0.0 ± 0.0 BDL BDL 0.0 ± 0.0 BDL
Untreated Day 15 BDL BDL BDL 0.1 ± 0.0 1.9 ± 1.0 17.9 ±
2.2
Water Rinsed Day 15 0.1 ± 0.0 0.0 ± 0.0 BDL 0.0 ± 0.0 0.7 ± 0.2 5.7 ± 1.5
Peroxide Treated Day 15 BDL 0.0 ± 0.0 BDL 0.1 ± 0.0 1.6 ± 0.5 4.1 ± 1.5
Untreated Day 30 BDL 0.0 ± 0.0 BDL 0.0 ± 0.0 1.7 ± 0.4 10.2 ±
1.4
Water Rinsed Day 30 BDL 0.0 ± 0.0 BDL 0.0 ± 0.0 0.8 ± 0.1 5.0 ± 0.0
Peroxide Treated Day 30 BDL 0.0 ± 0.0 BDL 0.0 ± 0.0 1.3 ± 0.1 BDL
Overlying Water Untreated Day 0 BDL BDL BDL BDL 0.2 ± 0.0 BDL
Water Rinsed Day 0 BDL BDL BDL BDL 0.2 ± 0.0 BDL
Peroxide Treated Day 0 BDL BDL BDL BDL 0.0 ± 0.0 BDL
Untreated Day 15 BDL BDL BDL 0.0 ± 0.0 0.8 ± 0.3 BDL
Water Rinsed Day 15 BDL BDL BDL BDL 0.4 ± 0.0 BDL
Peroxide Treated Day 15 BDL 0.1 ± 0.0 BDL 0.0 ± 0.0 0.6 ± 0.1 BDL
Untreated Day 30 BDL 0.0 ± 0.0 BDL 0.0 ± 0.0 1.2 ± 0.2 6.0 ± 0.3
Water Rinsed Day 30 BDL 0.0 ± 0.0 BDL 0.0 ± 0.0 0.6 ± 0.1 BDL
Peroxide Treated Day 30 BDL 0.0 ± 0.0 BDL 0.0 ± 0.0 0.8 ± 0.0 BDL

182
Appendix D continued (a) Treatment Lu Mg Mn Mo Nb Nd Pore Water Untreated Day 0 BDL 73303.8 ±
7741.3 595.5 ±
52.2 27.8 ±
7.0 0.4 ± 0.0 0.7 ± 0.2
Water Rinsed Day 0 BDL 40828.3 ±
5319.2 281.1 ±
48.6 73.1 ± 10.6
0.5 ± 0.0 0.1 ± 0.0
Peroxide Treated Day 0 BDL 10153.6 ±
710.7 240.7 ±
56.7 44.8 ±
1.8 0.5 ± 0.0 0.5 ± 0.1
Untreated Day 15 BDL 81256.2 ±
9503.8 221.6 ± 210.3
327.2 ± 262.2
0.7 ± 0.1 0.3 ± 0.0
Water Rinsed Day 15 BDL 60805.7 ±
2311.9 9.0 ± 2.6
71.7 ± 2.5
0.5 ± 0.0 BDL
Peroxide Treated Day 15 BDL 61432.7 ±
4745.4 323.1 ±
8.5 1.4 ± 0.5
0.4 ± 0.0 0.2 ± 0.0
Untreated Day 30 BDL 68771.6 ±
1379.3 10.8 ±
1.4 41.3 ±
2.4 0.1 ± 0.0 BDL
Water Rinsed Day 30 BDL 58974.0 ±
2374.1 19.4 ±
4.5 52.1 ±
1.5 0.1 ± 0.0 0.1 ± 0.0
Peroxide Treated Day 30 BDL 58684.3 ±
3301.6 237.7 ±
38.7 1.7 ± 0.6 BDL 0.1 ± 0.0
Overlying Water Untreated Day 0 BDL 45709.2 ±
6357.9 68.9 ±
5.4 10.6 ±
3.2 0.5 ± 0.0 0.4 ± 0.0
Water Rinsed Day 0 BDL 53961.5 ±
5398.6 56.5 ±
8.4 34.6 ±
6.4 0.5 ± 0.0 0.1 ± 0.0
Peroxide Treated Day 0 BDL 13097.8 75.3 ±
4.4 11.3 ±
0.7 0.4 ± 0.0 0.2 ± 0.0
Untreated Day 15 BDL 56931.1 ±
1813.0 79.5 ± 55.3
51.6 ± 21.8
0.5 ± 0.0 0.2 ± 0.0
Water Rinsed Day 15 BDL 47210.1 ±
180.7 26.8 ±
5.2 14.5 ±
0.6 0.4 ± 0.0 BDL
Peroxide Treated Day 15 BDL 48289.3 ±
230.3 128.3 ±
0.7 0.8 ± 0.1
0.4 ± 0.0 0.6 ± 0.1
Untreated Day 30 BDL 59236.2 ±
1481.6 1.6 ± 0.7
23.6 ± 0.3
0.1 ± 0.0 BDL
Water Rinsed Day 30 BDL 50137.4 ±
1200.0 18.7 ±
8.5 25.5 ±
1.4 0.1 ± 0.0 BDL
Peroxide Treated Day 30 BDL 51653.7 ±
4267.6 133.4 ±
8.3 1.3 ± 0.3
0.0 ± 0.0 0.3 ± 0.0

183
Appendix D continued (b) Treatment Lu Mg Mn Mo Nb Nd Pore Water Untreated Day 0 BDL 39203.8 ±
1329.2 142.5 ±
28.7 0.7 ± 0.2
0.4 ± 0.0
0.5 ± 0.1
Water Rinsed Day 0 BDL 58077.9 ±
1899.5 107.1 ±
3.5 1.7 ± 0.1
0.4 ± 0.0
0.2 ± 0.0
Peroxide Treated Day 0 BDL 13393.1 ±
303.6 64.6 ±
8.0 10.5 ±
1.4 0.5 ± 0.0
0.1 ± 0.0
Untreated Day 15 0.0 ± 0.0 55482.5 ±
3808.1 1278.1 ± 220.4
2.7 ± 1.1
0.4 ± 0.0
1.1 ± 0.7
Water Rinsed Day 15 BDL 44719.4 ±
2334.7 481.6 ±
24.2 3.1 ± 0.7
0.0 ± 0.0
0.4 ± 0.2
Peroxide Treated Day 15 0.0 ± 0.0 43356.4 ±
1319.3 563.0 ±
42.6 1.2 ± 0.3
0.0 ± 0.0
1.5 ± 0.5
Untreated Day 30 BDL 55272.8 ±
3430.3 893.1 ± 103.7
1.3 ± 0.4
0.0 ± 0.0
1.1 ± 0.4
Water Rinsed Day 30 BDL 48308.8 ±
476.9 369.4 ±
39.3 1.5 ± 0.3
0.0 ± 0.0
0.4 ± 0.1
Peroxide Treated Day 30 BDL 45564.3 ±
1346.2 356.9 ±
54.3 0.6 ± 0.1 BDL 1.2 ±
0.0 Overlying Water Untreated Day 0 BDL 33779.9 ±
824.5 39.9 ±
2.8 0.2 ± 0.0
0.4 ± 0.0
0.2 ± 0.0
Water Rinsed Day 0 BDL 56307.3 ±
2129.9 59.2 ±
4.3 0.9 ± 0.1
0.4 ± 0.0
0.1 ± 0.0
Peroxide Treated Day 0 BDL 12857.8 ±
370/1 33.6 ±
2.4 6.1 ± 0.4
0.5 ± 0.0
0.1 ± 0.0
Untreated Day 15 BDL 52050.7 ±
1322.4 211.1 ±
15.6 1.1 ± 0.6
0.4 ± 0.0
0.8 ± 0.3
Water Rinsed Day 15 BDL 43430.8 ±
863.3 84.8 ±
4.1 1.0 ± 0.2
0.4 ± 0.0
0.4 ± 0.1
Peroxide Treated Day 15 BDL 43204.6 ±
949.6 126.3 ±
13.0 4.3 ± 0.6
0.4 ± 0.0
0.5 ± 0.1
Untreated Day 30 BDL 54671.1 ±
607.0 302.1 ±
23.1 0.3 ± 0.1
0.0 ± 0.0
1.1 ± 0.3
Water Rinsed Day 30 0.0 48436.1 ±
893.5 125.5 ±
3.7 0.6 ± 0.1 BDL 0.4 ±
0.1
Peroxide Treated Day 30 BDL 45086.0 ±
1737.9 162.9 ±
24.5 0.9 ± 0.5 BDL 0.6 ±
0.0
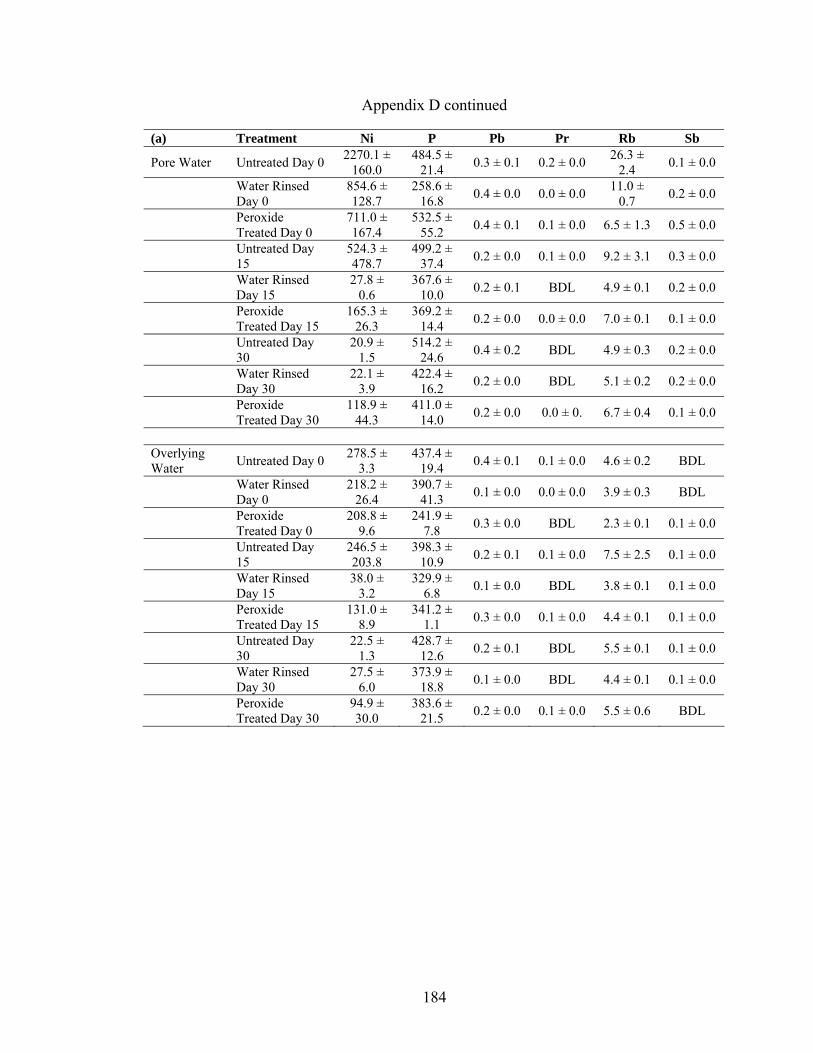
184
Appendix D continued (a) Treatment Ni P Pb Pr Rb Sb
Pore Water Untreated Day 0 2270.1 ± 160.0
484.5 ± 21.4 0.3 ± 0.1 0.2 ± 0.0 26.3 ±
2.4 0.1 ± 0.0
Water Rinsed Day 0
854.6 ± 128.7
258.6 ± 16.8 0.4 ± 0.0 0.0 ± 0.0 11.0 ±
0.7 0.2 ± 0.0
Peroxide Treated Day 0
711.0 ± 167.4
532.5 ± 55.2 0.4 ± 0.1 0.1 ± 0.0 6.5 ± 1.3 0.5 ± 0.0
Untreated Day 15
524.3 ± 478.7
499.2 ± 37.4 0.2 ± 0.0 0.1 ± 0.0 9.2 ± 3.1 0.3 ± 0.0
Water Rinsed Day 15
27.8 ± 0.6
367.6 ± 10.0 0.2 ± 0.1 BDL 4.9 ± 0.1 0.2 ± 0.0
Peroxide Treated Day 15
165.3 ± 26.3
369.2 ± 14.4 0.2 ± 0.0 0.0 ± 0.0 7.0 ± 0.1 0.1 ± 0.0
Untreated Day 30
20.9 ± 1.5
514.2 ± 24.6 0.4 ± 0.2 BDL 4.9 ± 0.3 0.2 ± 0.0
Water Rinsed Day 30
22.1 ± 3.9
422.4 ± 16.2 0.2 ± 0.0 BDL 5.1 ± 0.2 0.2 ± 0.0
Peroxide Treated Day 30
118.9 ± 44.3
411.0 ± 14.0 0.2 ± 0.0 0.0 ± 0. 6.7 ± 0.4 0.1 ± 0.0
Overlying Water Untreated Day 0 278.5 ±
3.3 437.4 ±
19.4 0.4 ± 0.1 0.1 ± 0.0 4.6 ± 0.2 BDL
Water Rinsed Day 0
218.2 ± 26.4
390.7 ± 41.3 0.1 ± 0.0 0.0 ± 0.0 3.9 ± 0.3 BDL
Peroxide Treated Day 0
208.8 ± 9.6
241.9 ± 7.8 0.3 ± 0.0 BDL 2.3 ± 0.1 0.1 ± 0.0
Untreated Day 15
246.5 ± 203.8
398.3 ± 10.9 0.2 ± 0.1 0.1 ± 0.0 7.5 ± 2.5 0.1 ± 0.0
Water Rinsed Day 15
38.0 ± 3.2
329.9 ± 6.8 0.1 ± 0.0 BDL 3.8 ± 0.1 0.1 ± 0.0
Peroxide Treated Day 15
131.0 ± 8.9
341.2 ± 1.1 0.3 ± 0.0 0.1 ± 0.0 4.4 ± 0.1 0.1 ± 0.0
Untreated Day 30
22.5 ± 1.3
428.7 ± 12.6 0.2 ± 0.1 BDL 5.5 ± 0.1 0.1 ± 0.0
Water Rinsed Day 30
27.5 ± 6.0
373.9 ± 18.8 0.1 ± 0.0 BDL 4.4 ± 0.1 0.1 ± 0.0
Peroxide Treated Day 30
94.9 ± 30.0
383.6 ± 21.5 0.2 ± 0.0 0.1 ± 0.0 5.5 ± 0.6 BDL

185
Appendix D continued (b) Treatment Ni P Pb Pr Rb Sb
Pore Water Untreated Day 0 31.7 ± 6.5
373.4 ± 14.7
0.8 ± 0.0
0.2 ± 0.0
0.7 ± 0.1 BDL
Water Rinsed Day 0
25.1 ± 0.8
369.6 ± 9.6
0.2 ± 0.0
0.0 ± 0.0
0.9 ± 0.1 BDL
Peroxide Treated Day 0
14.8 ± 1.8
183.8 ± 9.7
0.1 ± 0.0
0.0 ± 0.0
0.7 ± 0.0 BDL
Untreated Day 15
258.5 ± 47.4
439.6 ± 30.8
0.2 ± 0.1
0.3 ± 0.2
2.9 ± 0.3 BDL
Water Rinsed Day 15
91.9 ± 4.5
357.4 ± 12.1
0.2 ± 0.0
0.1 ± 0.0
1.6 ± 0.0 BDL
Peroxide Treated Day 15
123.2 ± 8.4
336.6 ± 8.1
1.3 ± 0.5
0.4 ± 0.1
1.3 ± 0.1 BDL
Untreated Day 30
180.3 ± 22.1
494.5 ± 8.4
0.3 ± 0.1
0.3 ± 0.1
2.3 ± 0.2 BDL
Water Rinsed Day 30
71.1 ± 6.7
409.8 ± 5.1
0.2 ± 0.0
0.1 ± 0.0
1.4 ± 0.1 BDL
Peroxide Treated Day 30
86.6 ± 11.2
411.0 ± 7.6
1.5 ± 0.3
0.3 ± 0.0
1.1 ± 0.1 BDL
Overlying Water Untreated Day 0 8.4 ± 0.7 296.5 ±
2.1 0.8 ± 0.0
0.0 ± 0.0
0.4 ± 0.0 BDL
Water Rinsed Day 0
11.8 ± 0.8
354.6 ± 15.1
0.3 ± 0.0
0.0 ± 0.0
0.4 ± 0.0 BDL
Peroxide Treated Day 0 7.7 ± 0.7 187.7 ±
5.3 0.1 ± 0.0 BDL 0.4 ±
0.0 BDL
Untreated Day 15
46.7 ± 3.9
393.8 ± 7.3
0.6 ± 0.3
0.2 ± 0.1
1.3 ± 0.1 BDL
Water Rinsed Day 15
20.6 ± 0.8
322.2 ± 6.8
0.3 ± 0.1
0.1 ± 0.0
0.9 ± 0.0 BDL
Peroxide Treated Day 15
34.3 ± 2.2
321.0 ± 6.4
1.6 ± 0.4
0.2 ± 0.0
0.8 ± 0.0 BDL
Untreated Day 30
60.8 ± 4.9
454.6 ± 6.4
0.6 ± 0.2
0.3 ± 0.1
1.5 ± 0.1 BDL
Water Rinsed Day 30
28.8 ± 1.1
392.7 ± 11.8
0.3 ± 0.0
0.1 ± 0.0
1.2 ± 0.1 BDL
Peroxide Treated Day 30
43.9 ± 3.4
399.9 ± 8.2
1.6 ± 0.2
0.2 ± 0.0
0.9 ± 0.1
0.0 ± 0.0

186
Appendix D continued (a) Treatment Sc Se Si Sm Sn Sr
Pore Water Untreated Day 0 0.9 ± 0.1 BDL 8396.7 ±
1710.5 0.2 ± 0.0 BDL 1256.5 ± 71.1
Water Rinsed Day 0
0.5 ± 0.0 BDL BDL BDL BDL 669.9
± 81.3
Peroxide Treated Day 0
1.7 ± 0.1 BDL 11350.9
± 213.4 0.2 ± 0.0 0.3 ± 0.0
151.9 ± 6.1
Untreated Day 15
1.3 ± 0.6 BDL BDL 0.1 ± 0.0 BDL 942.9
± 82.8
Water Rinsed Day 15
0.6 ± 0.0 BDL BDL BDL BDL 473.9
± 27.2
Peroxide Treated Day 15
1.7 ± 0.1 BDL 168822.7
± 0.0 0.1 ± 0.0 BDL 469.6 ± 20.9
Untreated Day 30
0.6 ± 0.0
1.9 ± 0.4 BDL BDL 0.2 ±
0.0 681.7 ± 8.8
Water Rinsed Day 30
0.5 ± 0.0 BDL BDL BDL 0.2 ±
0.1 500.7 ± 29.4
Peroxide Treated Day 30
1.1 ± 0.2
2.9 ± 0.4
4507.6 ± 0.0 BDL BDL 447.4
± 9.5 Overlying Water Untreated Day 0 0.2 ±
0.0 BDL BDL BDL 0.3 ± 0.0
602.1 ± 37.6
Water Rinsed Day 0
0.2 ± 0.0 BDL BDL BDL 0.3 ±
0.0 472.7 ± 49.8
Peroxide Treated Day 0 BDL BDL BDL BDL 0.5 ±
0.1 158.5 ± 1.0
Untreated Day 15
0.4 ± 0.1 BDL 4760.3 ±
0.0 0.1 ± 0.0 BDL 612.5 ± 3.5
Water Rinsed Day 15
0.2 ± 0.0 BDL BDL BDL BDL 391.4
± 9.1
Peroxide Treated Day 15
0.5 ± 0.1 BDL BDL 0.1 ± 0.0 BDL 374.6
± 8.4
Untreated Day 30
0.3 ± 0.0 BDL 23129.4
± 5851.4 0.0 ± 0.0 0.1 ± 0.0
612.0 ± 20.1
Water Rinsed Day 30
0.3 ± 0.0
3.2 ± 0.0
22813.7 ± 3239.1 BDL 0.1 ±
0.0 420.8 ± 5.8
Peroxide Treated Day 30
0.6 ± 0.0
1.7 ± 0.0
6967.9 ± 0.0 0.1 ± 0.0 0.8 ±
0.0 400.0 ± 5.3

187
Appendix D continued (b) Treatment Sc Se Si Sm Sn Sr
Pore Water Untreated Day 0 0.1 ± 0.0 BDL BDL 0.1 ±
0.0 0.3 ± 0.0
482.9 ± 5.4
Water Rinsed Day 0 BDL BDL BDL 0.1 ±
0.0 BDL 482.8 ± 4.4
Peroxide Treated Day 0
0.2 ± 0.0
4.0 ± 0.0 BDL BDL BDL 190.4
±1.5
Untreated Day 15
0.3 ± 0.1
4.8 ± 0.6 BDL 0.4 ±
0.1 0.1 ± 0.0
518.9 ± 32.2
Water Rinsed Day 15 BDL 2.6 ±
0.6 BDL 0.1 ± 0.0
0.1 ± 0.0
382.7 ± 9.3
Peroxide Treated Day 15
0.4 ± 0.1
1.4 ± 0.0 BDL 0.3 ±
0.1 0.1 ± 0.0
355.0 ± 2.3
Untreated Day 30
0.3 ± 0.0
1.7 ± 0.0
2244.3 ± 482.1
0.2 ± 0.1
0.2 ± 0.0
479.9 ± 12.0
Water Rinsed Day 30
0.2 ± 0.0 BDL 3601.7 ±
192.1 0.1 ± 0.0
0.4 ± 0.0
360.7 ± 4.2
Peroxide Treated Day 30
0.4 ± 0.0
1.0 ± 0.0
6520.5 ± 1038.3
0.2 ± 0.0
0.2 ± 0.0
333.3 ± 7.2
Overlying Water Untreated Day 0 BDL BDL BDL BDL BDL 460.3 ±
3.0
Water Rinsed Day 0 BDL BDL BDL 0.1 ±
0.0 BDL 464.1 ± 4.1
Peroxide Treated Day 0
0.3 ± 0.0 BDL BDL BDL 0.4 ±
0.1 197.6 ±
5.4
Untreated Day 15
0.1 ± 0.0 BDL BDL 0.2 ±
0.1 BDL 415.7 ± 6.0
Water Rinsed Day 15
0.1 ± 0.0 BDL BDL 0.1 ±
0.0 BDL 339.4 ± 7.9
Peroxide Treated Day 15
0.2 ± 0.1 BDL BDL 0.1 ±
0.0 0.1 ± 0.0
315.0 ± 9.7
Untreated Day 30
0.2 ± 0.0
2.2 ± 0.5
7037.6 ± 392.2
0.2 ± 0.0
0.2 ± 0.0
450.7 ± 6.3
Water Rinsed Day 30
0.2 ± 0.0
0.5 ± 0.0
3449.6 ± 1384.9
0.1 ± 0.0 BDL 357.3 ±
4.7
Peroxide Treated Day 30
0.3 ± 0.0 BDL 3115.9 ±
212.8 0.1 ± 0.0
0.3 ± 0.0
316.2 ± 7.0

188
Appendix D continued (a) Treatment Ta Th Ti Tl Tm U Pore Water Untreated Day 0 BDL BDL 2.8 ± 0.3 BDL BDL BDL
Water Rinsed Day 0 BDL 0.0 ± 0.0 BDL BDL BDL 0.0 ± 0.0
Peroxide Treated Day 0 BDL 0.1 ± 0.0 21.1 ±
1.8 BDL BDL 0.0 ± 0.0
Untreated Day 15 0.0 ± 0.0 0.0 ± 0.0 4.3 ± 0.4 0.0 ± 0.0 0.0 ± 0.0 0.1 ± 0.0
Water Rinsed Day 15 BDL 0.0 ± 0.0 2.0 ± 0.0 BDL 0.0 ± 0.0 0.0 ± 0.0
Peroxide Treated Day 15 BDL 0.1 ± 0.0 3.3 ± 0.8 0.1 ± 0.0 0.0 ± 0.0 0.0 ± 0.0
Untreated Day 30 BDL 0.0 ± 0.0 2.2 ± 0.4 BDL BDL 0.0 ± 0.0
Water Rinsed Day 30 BDL 0.0 ± 0.0 2.1 ± 0.3 BDL BDL 0.0 ± 0.0
Peroxide Treated Day 30 BDL 0.0 ± 0.0 2.6 ± 0.1 0.1 ± 0.0 BDL 0.0 ± 0.0
Overlying Water Untreated Day 0 BDL BDL 2.7 ± 0.0 0.1 ± 0.0 BDL 0.0 ± 0.0
Water Rinsed Day 0 BDL 0.0 ± 0.0 2.1 ± 0.2 0.0 ± 0.0 BDL BDL
Peroxide Treated Day 0 BDL 0.0 ± 0.0 9.3 ± 0.3 BDL BDL BDL
Untreated Day 15 BDL BDL 1.6 ± 0.1 0.1 ± 0.0 BDL BDL
Water Rinsed Day 15 BDL 0.0 ± 0.0 1.8 ± 0.0 BDL BDL BDL
Peroxide Treated Day 15 BDL 0.0 ± 0.0 3.1 ± 0.2 0.1 ± 0.0 0.0 ± 0.0 0.0 ± 0.0
Untreated Day 30 BDL BDL 1.7 ± 0.3 BDL BDL 0.0 ± 0.0
Water Rinsed Day 30 BDL BDL 1.2 ± 0.2 BDL BDL BDL
Peroxide Treated Day 30 BDL 0.0 ± 0.0 2.2 ± 0.1 0.1 ± 0.0 0.0 ± 0.0 0.0 ± 0.0

189
Appendix D continued (b) Treatment Ta Th Ti Tl Tm U Pore Water Untreated Day 0 BDL 0.0 ± 0.0 2.4 ± 0.1 BDL BDL 0.1 ± 0.0
Water Rinsed Day 0 BDL 0.0 ± 0.0 1.8 ± 0.1 BDL BDL BDL
Peroxide Treated Day 0 BDL BDL 1.9 ± 0.3 BDL BDL 0.0 ± 0.0
Untreated Day 15 BDL 0.0 ± 0.0 4.1 ± 0.1 0.0 ± 0.0 0.0 ± 0.0 0.0 ± 0.0
Water Rinsed Day 15 BDL BDL 1.9 ± 0.2 BDL 0.0 ± 0.0 BDL
Peroxide Treated Day 15 BDL 0.0 ± 0.0 2.0 ± 0.2 0.1 ± 0.0 0.0 ± 0.0 0.1 ± 0.0
Untreated Day 30 BDL 0.0 ± 0.0 3.1 ± 0.7 0.0 ± 0.0 0.0 ± 0.0 0.0 ± 0.0
Water Rinsed Day 30 BDL 0.0 ± 0.0 1.8 ± 0.4 0.0 ± 0.0 0.0 ± 0.0 BDL
Peroxide Treated Day 30 0.0 ± 0.0 0.0 ± 0.0 2.2 ± 0.3 0.1 ± 0.0 0.0 ± 0.0 0.1 ± 0.0
Overlying Water Untreated Day 0 BDL 0.0 ± 0.0 1.8 ± 0.0 BDL BDL 0.0 ± 0.0
Water Rinsed Day 0 BDL BDL 2.3 ± 0.6 BDL BDL BDL
Peroxide Treated Day 0 BDL BDL 1.7 ± 0.1 BDL BDL BDL
Untreated Day 15 BDL 0.0 ± 0.0 2.7 ± 0.1 0.0 ± 0.0 0.0 ± 0.0 0.1 ± 0.0
Water Rinsed Day 15 BDL 0.0 ± 0.0 1.7 ± 0.0 0.0 ± 0.0 BDL 0.0 ± 0.0
Peroxide Treated Day 15 BDL 0.0 ± 0.0 4.6 ± 0.4 0.0 ± 0.0 0.0 ± 0.0 0.1 ± 0.0
Untreated Day 30 BDL BDL 2.1 ± 0.3 0.0 ± 0.0 0.0 ± 0.0 0.0 ± 0.0
Water Rinsed Day 30 BDL BDL 1.5 ± 0.4 BDL 0.0 ± 0.0 0.0 ± 0.0
Peroxide Treated Day 30 BDL 0.0 ± 0.0 2.3 ± 0.3 0.0 ± 0.0 0.0 ± 0.0 0.1 ± 0.0

190
Appendix D continued (a) Treatment V W Y Yb Zn Zr
Pore Water Untreated Day 0 549.4 ± 109.2 BDL 4.2 ± 0.5 0.1 ± 0.0 158.9 ±
21.7 BDL
Water Rinsed Day 0
868.7 ± 84.9 BDL 1.8 ± 0.2 BDL 64.0 ±
14.4 BDL
Peroxide Treated Day 0
277.9 ± 14.5 BDL 1.0 ± 0.2 0.1 ± 0.0 74.2 ±
21.0 10.7 ±
0.8
Untreated Day 15 786.4 ± 397.3 0.1 ± 0.0 2.6 ± 0.1 BDL 39.4 ±
27.8 0.1 ± 0.0
Water Rinsed Day 15
87.4 ± 5.8 BDL 1.3 ± 0.1 BDL 6.9 ± 1.0 0.1 ± 0.0
Peroxide Treated Day 15 4.7 ± 0.9 BDL 1.9 ± 0.1 BDL 61.4 ±
11.8 0.4 ± 0.0
Untreated Day 30 54.6 ± 5.7 BDL 1.9 ± 0.0 BDL 9.3 ± 2.8 0.1 ± 0.0
Water Rinsed Day 30
72.5 ± 12.7 BDL 1.2 ± 0.0 BDL 6.3 ± 1.1 BDL
Peroxide Treated Day 30 2.8 ± 0.9 BDL 1.7 ± 0.2 BDL 38.9 ±
10.9 0.3 ± 0.0
Overlying Water Untreated Day 0 200.9 ±
45.4 BDL 2.2 ± 0.3 BDL 29.5 ± 2.1 BDL
Water Rinsed Day 0
371.4 ± 42.2 BDL 1.3 ± 0.1 BDL 24.7 ±
5.5 BDL
Peroxide Treated Day 0
212.9 ± 29.0 BDL 0.4 ± 0.1 BDL 25.8 ±
1.0 BDL
Untreated Day 15 385.6 ± 207.8 BDL 1.9 ± 0.2 BDL 22.3 ±
11.9 0.0 ± 0.0
Water Rinsed Day 15
52.7 ± 0.9 BDL 1.3 ± 0.0 BDL 8.7 ± 1.3 0.0 ± 0.0
Peroxide Treated Day 15
22.2 ± 1.7 BDL 2.5 ± 0.2 BDL 49.3 ±
1.3 0.6 ± 0.2
Untreated Day 30 63.1 ± 2.6 BDL 1.5 ± 0.2 BDL 6.7 ± 0.5 BDL
Water Rinsed Day 30
63.2 ± 6.6 BDL 1.2 ± 0.1 BDL 7.1 ± 1.3 BDL
Peroxide Treated Day 30 7.3 ± 3.0 BDL 1.8 ± 0.2 BDL 35.9 ±
7.8 0.3 ± 0.0

191
Appendix D continued (b) Treatment V W Y Yb Zn Zr
Pore Water Untreated Day 0 3.6 ± 0.9 BDL 1.9 ± 0.1 BDL 12.4 ± 2.2 0.1 ± 0.0
Water Rinsed Day 0 2.7 ± 0.2 BDL 1.6 ± 0.1 BDL 9.9 ± 0.5 BDL
Peroxide Treated Day 0
50.2 ± 10.2 0.4 ± 0.0 0.6 ± 0.0 BDL 44.8 ±
18.1 0.1 ± 0.0
Untreated Day 15 2.2 ± 0.4 BDL 3.1 ± 1.0 0.1 ± 0.0 74.0 ±
20.7 0.1 ± 0.0
Water Rinsed Day 15 3.3 ± 0.5 BDL 1.8 ± 0.2 BDL 37.0 ±
8.0 BDL
Peroxide Treated Day 15 2.0 ± 0.9 BDL 2.9 ± 0.6 0.2 ± 0.0 72.1 ±
1.8 0.2 ± 0.0
Untreated Day 30 1.4 ± 0.2 BDL 2.9 ± 0.4 0.1 ± 0.0 59.2 ±
7.6 0.1 ± 0.0
Water Rinsed Day 30 1.8 ± 0.2 BDL 1.6 ± 0.2 0.0 ± 0.0 27.6 ±
1.7 BDL
Peroxide Treated Day 30 1.5 ± 0.4 BDL 2.5 ± 0.1 0.1 ± 0.0 46.6 ±
3.8 0.1 ± 0.0
Overlying Water Untreated Day 0 0.8 ± 0.1 BDL 1.4 ± 0.1 0.1 ± 0.0 12.4 ±
0.0 BDL
Water Rinsed Day 0 1.3 ± 0.1 BDL 1.3 ± 0.1 BDL 13.2 ±
1.5 0.0 ± 0.0
Peroxide Treated Day 0
29.3 ± 2.9 0.2 ± 0.0 0.6 ± 0.0 BDL 26.5 ±
0.5 0.0 ± 0.0
Untreated Day 15 2.4 ± 0.7 BDL 1.9 ± 0.3 0.2 ± 0.0 25.6 ±
3.8 0.1 ± 0.0
Water Rinsed Day 15 3.5 ± 0.6 BDL 1.3 ± 0.1 BDL 17.6 ±
1.1 0.1 ± 0.0
Peroxide Treated Day 15
38.6 ± 1.9 BDL 1.6 ± 0.1 0.1 ± 0.0 32.5 ±
2.7 0.3 ± 0.0
Untreated Day 30 1.0 ± 0.0 BDL 2.4 ± 0.2 0.1 ± 0.0 36.5 ±
3.7 0.1 ± 0.0
Water Rinsed Day 30 1.6 ± 0.4 BDL 1.5 ± 0.1 0.1 ± 0.0 23.4 ±
1.0 0.1 ± 0.0
Peroxide Treated Day 30 3.8 ± 2.4 BDL 1.8 ± 0.1 0.1 ± 0.0 31.3 ±
2.7 0.1 ± 0.0