Embed Size (px)
Citation preview

Disabled People’s Housing Needs Study - An Assessment of the Housing Needs of People with Physical Disabilities
Nottinghamshire and Derbyshire Strategic Housing Local Authorities
Local Report for Bolsover District Council
Revised Draft Final, 7 September 2012

Contents
Executive Summary................................................................................................1
1.0 Introduction...........................................................................................................81.1 Study Aims and Methodology..............................................................................81.2 Local Context.........................................................................................................91.3 Report Structure....................................................................................................9
2.0 Housing Needs of People with Physical Disabilities........................................102.1 What does evidence tell us about the housing needs of disabled people?...102.2 Customer and stakeholder perpective..............................................................122.3 Factors Affecting Future Demand......................................................................142.4 Key Points............................................................................................................16
3.0 Meeting the Housing Needs of People with Physical Disabilities...................183.1 Strategic Approach.............................................................................................183.2 What is the current housing provision for people with physical disabilities?213.3 Key Points............................................................................................................26
4.0 Disabled Resident Survey..................................................................................284.1 Profile of Respondents.......................................................................................284.2 Current Property..................................................................................................304.3 Disabled Housing Needs....................................................................................314.4 Future Housing Plans.........................................................................................324.5 Key Points............................................................................................................34
5.0 Demographic and Housing Needs Data............................................................365.1 Demographics.....................................................................................................365.2 Disabled Living Allowance.................................................................................385.3 Disabled Facilities Grants...................................................................................395.4 Children with Disabilities....................................................................................405.5 Council Tax Exemptions.....................................................................................405.6 Housing Demand: Housing Registers..............................................................415.7 Letting Data: CORE Returns...............................................................................425.8 Housing Demand and Lettings...........................................................................425.9 Housing Supply...................................................................................................435.10 Supporting People Data......................................................................................43
i

5.11 Key points............................................................................................................43
6.0 Future Need and Demand...................................................................................456.1 Forecasting the Volume of Unmet Need...........................................................456.2 The Type of Housing Required..........................................................................476.3 Programmes to Meet Need.................................................................................486.4 Key Points............................................................................................................51
7.0 Conclusions and Recommendations................................................................537.1 Recommendations..............................................................................................55
Glossary .............................................................................................................60
Annex One: Charts and Tables............................................................................1
Annex Two: Value for Money.............................................................................37
Annex Three: Detailed Recommendations.......................................................41
Annex Four: Good Practice...................................................................................52
ii

Executive Summary
Introduction
1. This study examines the housing needs of people with physical disabilities in Nottinghamshire and Derbyshire, It was undertaken by Ecorys and ConsultCIH on behalf of fifteen local authorities. The aims of the study are:
To better understand how to meet the housing needs of people with physical disabilities. To better understand the means by which appropriate housing for disabled people can be
delivered. To obtain a robust evidence base for the development of housing for disabled people.
2. The focus of this research is the physical structure and facilities of a home (rather than care and support issues). There is a stand-alone report for Bolsover District Council which is one of a series of 15 local reports and is complemented by an overview report for the study area as a whole. This a summary of the key findings, conclusions and recommendations for Bolsover.
Methodology
3. The methodology for the project comprised the following elements:
A literature review of national, regional, local research, academic papers, data and statistics and best practice models.
Collation and interrogation of existing data from each local authority, including from; adult care; occupational therapists; disability organisations; housing registers; stock data and stock condition surveys; children’s Special Educational Needs (SEN) data; council tax data and other housing needs assessments.
Collation and interrogation of data from; Office of National Statistics, Department for Communities and Local Government; Department of Work and Pensions; Department of Health, and; other government agencies including the Homes and Communities Agency.
Collation and interrogation of specialist datasets including; POPPI (Projecting Older People Population Information system); PANSI (Projecting Adult Needs and Services Information) EAC (Elderly Accommodation Council) and; Children in Need Census.
Focus groups with organisations specialising in disabled persons care, housing developers. Focus groups with residents and service users, including a Black and Asian Minority Ethnic
(BAME) focus group. Structured telephone interviews and on-line surveys with households with disabled
members. Stakeholder interviews with senior providers and experts.
1

The population and profile of disabled people in Bolsover
4. There are an increasing number of people with physical disabilities in the borough, who need homes and facilities to meet their needs.
5. A Housing Needs survey completed in 2003 identified 4,897 households with a disabled member (15.8% of all households). All ‘special needs’ groups are otherwise combined, but generally 40% of all social housing tenants were considered to have a special need, including frail older people, compared to fewer than 10% owner-occupiers with a mortgage.
6. Derbyshire County Council has assessed the need for adaptations over the five years from 2010 to 2014. The majority of adaptations are provided for people over 65 years old and Bolsover’s population over 65 years will increase from 13,600 to 15,100 over that time.
7. The factors that affect demand from disabled households for housing may change in the future due to a number of factors, including: the economic downturn;. the condition of private rented sector housing; welfare reform and potential under-occupation; health service changes; and disabled children and adults living longer.
8. By 2015 it is estimated that between 707 and 775 households in the district with a disabled member, will be in unsuitable accommodation, and will require measures to be able to remain in their home or move to a suitable property. The high estimates of these indicate that by 2030, these will have increased to 985.
How the current housing provision and services meet needs
9. The capacity of existing provision to meet these needs, is limited by constraints on public spending, the suitability of existing homes, the affordability of suitable properties, and the increasing demand from increasing numbers of disabled people for the resources available.
10. Whilst many people would like to remain in their existing homes, but only around 70 Disabled Facilities Grants (DFGs) have been delivered each year historically, and this may not be sustainable in the future. For those able and willing to move to the social rented sector, there are limited lettings available each year – and many of these will not meet the aspirations and demands of disabled people, or are not suitable to fully accommodate their disabilities.
11. A proportion of the households will be able to pay for suitable adaptations themselves, or are able to find and afford an alternative property which meets their needs. However, there is an undersupply of accommodation of different types and sizes and tenures available to meet the needs of people with physical disabilities.
12. Planning policies and emerging strategic documents to require the development of new housing to meet the needs of people with physical disabilities have not yet been implemented. Private sector provision is restrained by market forces, although there is new
2

provision (albeit very low numbers) being made in affordable housing through s106 planning agreements.
13. Local and county-wide services to meet the needs of disabled people in Bolsover include; advice and information; repairs; improvements and safety measures; disabled facilities grants; housing-related support and choice based lettings scheme. Whilst many of these services seem to be valued and effective in most aspects, there are some gaps in provision, and some changes could be considered which would improve the services.
The type of housing, facilities and services which disabled people want
14. Surveys, focus groups and interviews with residents and organisations highlighted that there are a number of factors which many disabled people want from their homes, whether in their existing home, or by moving.
15. Those considering a house-move mainly indicate a demand for bungalows, although consideration may need to be given to whether/how well these demands could be met through suitable, well-designed ground floor flats, or adapted houses such as those meeting lifetime homes standards. Being near to friends and family is a major consideration for many.
Shortfall in properties to meet unmet need
16. A shortfall in the provision of suitable properties has been identified, showing that there is unmet need which could potentially be met by the provision of new homes.
17. Based on projections for 2015, estimates of the number of people with physical disabilities in unsuitable accommodation with unmet needs range from 537 to 601. This range rises by 2030 to 796.
High or low estimate of unmet housing need
2010 2015 2020 2025 2030
High estimate: based on ONS population change figures
542 601 656 722 796
Low estimate: based on High Level DLA claims
536 537 537 538 539
18. We have made some estimates of the size and type of programme that could be introduced to meet these needs. The figures are based on 2015 projected needs, and if the programme was implemented it would clear the backlog of need in its entirety. The local authority would have to balance the actual size and shape of this programme with those responding to other priority housing requirements
19. These figures are broken down by estimated tenure; property type and size; and properties to wheelchair standard.
20. Tenure of new provision:
3

- 37% would be able to afford to buy a suitable new home and access private sector provision
- 63% would need Affordable housing - Social Rented, and/or other rented tenures such as Affordable Rented – dependent on local affordability issues and funding restrictions.
- Shared Ownership or shared equity properties may fall into the “private sector provision”, or the affordable housing provision– depending on the percentage share bought and other local market conditions.
Tenure of new housing for 2015 Percentage
Number of properties (low estimate)
Number of properties
(high estimate)
Private Sector Provision (to buy) 37% 198 222Affordable Housing 63% 339 378
21. Property type and size of new provision:
- Private Sector Provision being developed to meet the needs of disabled households should be mainly two-bedroomed bungalows. Affordable housing to meet the needs of disabled housing should be mainly two-bedroomed bungalows or flats, although provision also needs to be made for one-bedroomed and larger properties. It is not assessed here, whether/how the demands of people wanting a bungalow ideally, might be met through suitable, well-designed ground floor flats, although this may be necessary to consider in the light of financial constraints.
New housing – High needs assessment for 2015
Size of accommodation required 1 bed 2 bed 3+ bed
Bungalows 112 271 68Flats 30 72 18Houses 7 18 5Total 149 361 91
New housing – Low needs assessment for 2015
Size of accommodation required 1 bed 2 bed 3+ bed
Bungalows 101 242 59Flats 26 65 17Houses 6 17 4Total 133 324 80
22. Wheelchair properties:
- We estimate that there are 99 households with wheelchair users whose needs will not be met as of 2013, as set out below. This figure increases to 114 by 2033.
4

- These needs may be met in the private sector and/or affordable provision
Wheelchair accessible provision (within new housing as above) to 2013
Size of accommodation required 1 bed 2 bed 3+ bed
Bungalows 19 45 10Flats 2 6 2Houses 2 2 2Supported 2 6 1Total 25 59 15
5

Recommendations
Specific Recommendations for Bolsover Details
A. Scrutinise allocation activity Ensure that adapted and wheelchair homes are not let to those who do not need them; and that they are let to those who do, including letting of over 60s accommodation to younger disabled people.Process analysis, and changes in policy (for example, holding a pool of void suitable properties).Consider extending use of choice based lettings system and development of accessible housing registers.
B. Draw up and update database of all affordable housing adapted / wheelchair stock.
Keep records of private sector stock that has benefitted from DFGs. Agreement between social landlords and DFG administrators.Consider extending use of choice based lettings system and development of accessible housing registers – including private sector landlords.
C. Review preventative policy in conjunction with adult services and health agencies
Consider tri-partite resourcing arrangements.To include explicit agreement of who should pay for adaptations or transfer to appropriate accommodation.Link policy to clear preventative rationale.
D. Introduce a residential design Supplementary Planning Document
Where not already in progress, introduce a residential design SPD that states where adaptable/ accessible/ wheelchair standard homes will be required (as a quota or by reference to a site design guide) and what is meant by accessible or adaptable. Ensure that developers are clear about what is expected of them in any proposed development, address concerns about financial viability or practical difficulties and consider any additional funding available to ensure viability and deliverability.
E. Implement existing planning policy around 'Special Needs Housing'
Include Lifetime Homes and Wheelchair properties.Include negotiations with developers.Use evidence in this report to implement policy.
F. Develop ‘one-stop shop’ approach for services for people with disabilities
Could involve improved referral and co-ordination or replacement / integration of services.Internal negotiations within authority, and with County and housing associations.
G. Overcome barriers which discourage people moving to a more suitable property
Address concerns about the upheaval of moving, provide help with planning and moving, including advocacy through One Stop Shop service to explain and discuss all housing options and offer a range of tenure options; home ownership/shared ownership/social rent/affordable rent.
H. Address Specific Rural / Urban and Black and Minority Ethnic group Equalities Issues where they exist.
No specific issues have been noted in this study, but such issues should be considered when developing new homes and services, and in monitoring existing provision.
6

General Recommendation Details
I. Raise Awareness Raise awareness of the housing needs and aspirations of disabled adults and children and promote joint agency / partnership working
J. Ensure housing needs assessments highlight the needs of disabled people
Ensure that housing needs assessments and strategic housing market assessments distinguish customer characteristics that influence design in new homes and the need for adaptations of existing homes.
K. Promote preventative and early intervention investment
Promote preventative and early intervention investment, so that benefitting agencies (in particular health and social care) understand the value for money of investment.
L. Further Develop Home Improvement Agency
Further develop the Home Improvement Agency and a system of recycling adaptations – stair lifts in particular Work with HIAs to explore additional funding possibilities e.g. extending menu of services for self funders; social care and health investment Work with HIAs and ICES services locally to explore demand and opportunity
M. Introduce more comprehensive stock condition survey and recording systems.
Record nature of adaptation and level (e.g LHS, wheelchair etc) Record nature of adaptation and level (e.g. LHS, wheelchair etc) jointly with provider partners.
N. Agree a protocol for adaptations.
Agree a protocol for adaptations to homes across tenure, so that resources are more effectively used to meet the needs of more disabled people.
O. Ensure private sector / developer obligations are enforced
Ensure private sector / developer obligations are enforced in a co-ordinated way across the study area.
Identify opportunities to bring together OT, housing and Planning expertise, plus local disabled people and representatives in development of a design guide.
Engage OTs in detailing key features required to improve adaptability of new homes. Use this together with site design guides to ensure that both developers and development control understand what you require and S106 agreements to deliver these. Take specific design requirements into account in determining site viability.
P. Use publically owned land to meet needs
Agree a partnership approach to how publically owned land can be used to improve the viability of homes that are designed specifically for the needs of disabled people,
7

1.0 Introduction
1.1 Study Aims and Methodology
1.1.1 Aims
23. A consortium comprising of fifteen local authorities within Nottinghamshire and Derbyshire commissioned Ecorys and ConsultCIH to undertake a Disabled Housing Needs Study to examine the housing needs of people with physical disabilities. The objectives of the study included identifying current shortfalls and future need for suitable accommodation, and to examine options for meeting these needs in a deliverable and cost effective way.
24. The aims of the study were:
To better understand how to meet the housing needs of people with physical disabilities, in order that they can be provided with housing appropriate to meet their needs.
To better understand the means by which appropriate housing for disabled people can be delivered across all housing tenures and how value for money can be ensured.
To obtain a robust evidence base pertaining to the development of housing for disabled people that can be used to inform future policies, strategies and negotiations with developers.
25. The research was to focus on the physical structure and facilities of a home, rather than the care and support issues. Outputs were an overview report, summarising the data and finding as for the study area as a whole, and separate reports for each of the participating local authorities. This Bolsover report is one of the local reports.
1.1.2 Methodology
26. The methodology for the project comprised several elements:
A literature review of national, regional, local research, academic papers, data and statistics and best practice models.
Collation and interrogation of existing data from each local authority, including from; adult care; occupational therapists; disability organisations; housing registers; stock data and stock condition surveys; children’s SEN data; council tax data and other housing needs assessments.
Collation and interrogation of data from; Office of National Statistics, Department for Communities and Local Government; Department of Work and Pensions; Department of Health, and; other government agencies including the Homes and Communities Agency.
Collation and interrogation of specialist datasets including; POPPI (Projecting Older People Population Information system); PANSI (Projecting Adult Needs and Services Information) EAC (Elderly Accommodation Council) and; Children in Need Census.
Focus groups in local authority areas with organisations specialising in disabled persons care, housing developers and service users (including a BAME focus group).
Structured telephone interviews with households with disabled members.
8

On-line surveys with households with disabled members. Stakeholder interviews with senior providers and experts.
1.2 Local Context
27. Bolsover is part of the North Derbyshire and Bassetlaw Housing Market Area (HMA) and the Sheffield City Region (which also incorporates Derbyshire Dales). The HMA has had a joint Housing Strategy since 2009 (Bolsover’s own most recent Housing Strategy was 2005-2010). The area is characterised by proximity to large conurbations and connectedness by road (including the M1) and rail. There has been significant population growth over the last decade but there is a low population density across the area. There is also a markedly low black and minority ethnic population (0.9% in the 2001 Census).
28. There are four medium sized towns: Bolsover, Clowne, Sirebrook and South Normanton and these house half the population with the remainder in villages originally developed around collieries. The area was historically dependent on the mining industry but current employment tends to be in retail and service industries. House prices have grown least of the four HMA authorities and are the lowest of the group. 63.3% of properties are in Band A. Of the 33,680 dwellings, in 2009 over 16% were owned and managed by the council, 2.4% by housing associations, 69.3% were owner occupied and 7.7% privately rented. 27% of all homes are detached, 44% semi-detached and 23% are terraced – only 5% are flatted properties.
29. Despite there being no large scale areas of severe social and economic deprivation, the housing markets are relatively fragile and there are substantial housing needs. Lower than average incomes are connected to the loss of the collieries and there is higher than regional average unemployment – 4.1% in September 2011 compared to 3.7% regionally with a long-term unemployment rate of 15.6% (August 2011).
1.3 Report Structure
30. The reminder of this report is structured as follows:
Section 2 sets out housing needs of people with disabilities Section 3 outlines how these needs are currently met Section 4 summarises the results of the disabled resident's survey Section 5 sets out demographic and housing needs data Section 6 gives forecasts for future disabled persons' housing needs Section 7 then draws conclusions from the report and makes recommendations.
31. A data set of background information is given in Annex 1.
9

2.0 Housing Needs of People with Physical Disabilities
2.1 What does evidence tell us about the housing needs of disabled people?
32. National evidence is covered in the Overview Report, with locally-relevant evidence set out here. We found a lack of detailed evidence at a local authority level, in particular in relation to perceptions of local people and projected future changes in need. These aspects were therefore covered through surveys, interviews and focus groups.
33. The HMA area as a whole has above national average percentages of people with long term limiting illnesses and claiming Disability Living Allowance. Health in Bolsover is lower than national and regional averages and worse in some areas; this is connected to the coal mining history of the area. Bolsover has the highest rate of premature mortality in the county, including high levels of excess winter deaths. Around 22.5% of the population are 65 years old and over (ONS mid-year estimates 2007) – the highest rate in the HMA and well above national and regional averages.
34. A Housing Needs survey completed in 2003 identified 4,897 households with a disabled member (15.8% of all households). All ‘special needs’ groups are otherwise combined, but generally 40% of all social housing tenants were considered to have a special need (including frail elderly people) compared to fewer than 10% owner-occupiers with a mortgage.
35. The Northern Area Strategic Housing Market assessment (SHMA) was completed in 2007 and identified a total of 24,429 households across the HMA with a disabled member equating to 14.7% of all households. 15.9% of these households were estimated to live in unsuitable housing. It is silent on the need for accessible or lifetime homes and instead suggests that needs can be met through adaptations.
36. The HMA’s private rented study (2010) identified that 16% working age people living in private rented housing in Bolsover identified that they had a long-term illness or disability, compared to 9% across the HMA. 15% had a family member in receipt of Disability Living Allowance (8% across the HMA).
37. The 2008 Northern Housing Market Area study of the housing needs of younger people, and the undated study of the housing needs of BME communities do not identify any specific needs associated with a disability. The latter did include feedback from one resident who required a home suitable for a child with a disability but had been offered an unsuitable home. The study of the housing needs of older people identified that 71% of anticipated growth in households will be in those aged 65 or over, and 40% aged 75 or above. Owner-occupation amongst the retired population is expected to grow. 90% of all enquiries to North Derbyshire HIA in respect of home improvement assistance are from older people.
10

38. Derbyshire’s draft Joint Commissioning Plan for people with physical and sensory disabilities1 identifies that, in 2008, the total (all ages) Derbyshire disabled population was 769,400 of which 473,200 were aged 18-64. A quarter of these were identified as having a ‘Severe’ physical disability and half a ‘Moderate’ physical disability. Of this group 13449 males and 8000 females (18-64) were identified as being permanently unable to work. In 2009 there were 208 people known to adult care identified as having a sensory loss – 26 with a dual sensory loss and 115 with a visual impairment, although it noted the likelihood that there are significantly more people yet to be identified in each of these groups. By the year 2015, the prevalence of each type of disability is predicted to increase by 4%.
39. The main issues that include implications for housing identified for (the document states that this is based on evidence rather than consultation) people with disabilities are:
Availability of information and advice has been sparse and inaccessible, as have support or advocacy services.
Access to a network of support 24/7 (including health and social care services) Equality of access to all health and social care services Opportunity to have a voice and influence local service development, both at a
strategic and local community level Accessible housing with provision of timely and appropriate equipment (e.g.
telecare) and/or adaptations Access to high quality care and support services Timely access to appropriate services for all including disabled people from the
black, minority ethnic and Asian (BME&A) communities; disabled parents, and children in transition to adult services.
40. The strategy has a (short) section on housing that affirms the lack of knowledge of housing tenure against age and disability but goes on to state ‘It is argued that following the social model of disability the need to identify this group is not only unnecessary but discriminatory, as all mainstream provision should meet the needs of all people including Disabled People and people with a sensory impairment….. A market gaps analysis therefore has to be based on all housing meeting a basic standard as being suitable to meet the needs of Disabled People2.” Clearly very little housing in any area meets this ‘basic standard’: the concern is therefore that the needs for accessible, adaptable housing are simply ignored.
41. Bolsover shares the North Derbyshire Home Improvement Agency with Chesterfield and North East Derbyshire councils. In Bolsover, the HIA provides home improvement, home safety, fire prevention and other services and works with Fire and Rescue and other agencies to provide home safety checks for older people and people with disabilities.
1 Services for Derbyshire Disabled People and People with a Sensory Impairment Aged 18-64; Joint Commissioning Strategy 2010 – 2014 draft April 2010 – note the latest draft is awaited from DCC2 Our italics
11
42. The Age UK Home Options Advisor and the North Derbyshire HIA staff visit customers in their homes and provide advice on a variety of housing issues. HOPS activities are acknowledged to save adaptations budget through assisting older people to move to more suitable homes, which can avoid adapting current homes.
43. Falls prevention assessments are completed by a range of front line community workers and work to respond to these is referred to the handyperson service provided by Mediquip across the County area. This latter is funded by Supporting People and social care and helps vulnerable people (including people with physical disabilities) with basic repairs and safety measures including fire safety and security checks.
44. Bolsover DC introduced a choice based lettings scheme in 2011. The allocations policy places those with urgent medical needs into Band A. Band B (high rehousing need) includes existing BDC tenants living in adapted homes who no longer require the adaptations and tenants who are waiting for an adaptation. In this way the Council hopes to make better use of its adapted homes. People with high medical needs also go into Band B.
45. In 2010/11, the Council spent £584,001 on 114 DFGs. The Council’s Grants team is responsible for administering the processing of the grant including financial assessments and more personal assistance to individual customers. The design and procurement process is delivered by the County Council’s architectural service.
46. The inconsistency of referrals for adaptations is causing some difficulties in planning expenditure: at present OT assessments are delayed. This is not to say that need is decreasing – if the backlog of OT assessments is reduced or eliminated in future months, there will be a very significant increase in referrals and therefore spend on DFGs.
2.2 What do customers and stakeholders say about current housing need and demand from disabled people?
2.2.1 Customer Perspective
47. Those attending the focus groups were a mix of owner occupiers, council tenants and housing association tenants from across the fifteen local authorities. Some had lived in their property since before becoming disabled, while others had moved since. All had had some kind of adaptations made, ranging from grab rails to ceiling track hoists. Most respondents felt that their current property was suitable, and that with future adaptations it would remain so, though some felt that moving would be their only option in the future.
48. There was a general consensus that there is a lack of suitable housing, and that often any suitable housing available is not given to people with disabilities. Several respondents reported situations where adapted council properties had been given to applicants without disabilities and that properties had had adaptations removed.
49. Those renting from the council and housing associations felt that the process for getting a new property was difficult to understand and unfair, and in some cases people felt that there
12

was no point in bidding as they had never had success in the past. One respondent said that she feared being taken off the list because she wasn't bidding, but she felt that there was no point bidding on properties that she knew would not be suitable. Respondents in privately owned homes also faced barriers when considering a move, most commonly that bungalows, the most popular housing choice, were simply unaffordable, even to those who owned their own property. Finding out what was available in terms of suitable properties was a problem for both council tenants and homeowners, with many feeling that it was difficult to know what was out there, especially when they had been offered unsuitable properties in the past which had been described as being suitable.
50. The size of property on offer was also criticised, with many respondents feeling that housing providers did not take into consideration the fact that disabled people have families and may require overnight care.
51. Anecdotal feedback suggested a lack of properties suitable for younger disabled people. Several respondents knew of young disabled people who had been put into accommodation with the elderly as that was the only adapted property available, but this caused problems if they ever wanted friends to visit. Affordability of properties for younger people was also discussed, with respondents feeling that many young people would simply not be able to afford to live independently. Rising heating costs and the changes to Housing Benefit were of concern.
2.2.2 Stakeholder Perspective
52. There is a clear understanding of the rising demand for aids, adaptations and more extensive structural work to homes to accommodate the needs of the rising number of disabled people across the city. Participants in focus groups were able to give examples of effective inter agency working, to achieve seamless and effective service delivery for disabled people and their families, in some cases but the identified positive practice was not consistently applied across the area.
53. Examples were found during discussions with stakeholders of a lack of awareness of alternative housing solutions/options for households who needed extensive disabled adaptations and facilities. There appeared to be no consistently applied option analysis and appraisal of alternatives to high cost adaptation work. Participants expressed enthusiasm for an improved approach to the development and dissemination of an adapted housing database that includes cross tenures homes with clear and easily accessible descriptions of the properties.
54. All participants supported the need for county wide protocols to improve the advice and assistance for disabled people in planning for their future housing needs. Stakeholders across statutory and voluntary agencies expressed a need to better understand the current and future needs of disabled children and adults, the impact on all services of the ageing population and the implications of the increased life expectancy of people with severe physical and sensory disabilities including dementia.
13

2.3 Factors Affecting Future Demand
2.3.1 Wider Trends
55. This section draws on the wider literature review in the Overview Report. The economic downturn affects all sectors of the population trying to resolve their own housing needs, including those with a disabled family member. With mortgages less available and a sluggish house market, people are likely to continue to find it harder to sell their own home and move to something more suitable for some time yet.
56. Adding to this is the pressure to build more homes on the available land. There is a tension between this and building homes that are sufficiently generous in space standards to enable occupation by those with more significant disabilities, e.g. using a wheelchair. This particularly affects families with disabled children who need much better circulation spaces to allow more complex mobility chairs to be manoeuvred. In addition, building upwards allows more density of homes but upper floor properties can only be accessible if lifts are fitted: a cost that most developers are unwilling to consider unless the development is specifically intended for older people.
57. Inevitably the increasingly ageing population will have a major impact on the need for disability-related housing services. Derbyshire County council has assessed the need for adaptations over the five years from 2010 to 2014. The majority of adaptations are provided for people over 65 years old and Bolsover’s population over 65 years will increase from 13,600 to 15,100 over that time. The area is anticipated to have the county’s largest increase in the proportions of older people with disabilities arising from strokes and falls. The study predicts the need for 1,294 adaptations over these five years at an estimated cost of £10.4 million.
58. The 2003 House Condition Survey found (we note that this data is now 8 years old):
22.7% of private rental dwellings were surveyed as unfit which was around four times higher than that found in the owner-occupied sector and around sixteen times higher than the RSL sector.
17.0% of pre-1919 dwellings estimated to be unfit compared with only 0.4% of dwellings built after 1964.
68.2% of private rented stock was pre-1919 compared with 33.2% of all dwellings.
59. This implies significant levels of category 1 hazards such as falls on stairs or on the level or excess cold. There is an inevitable consequence that a proportion of these occupiers will have falls or suffer ill health from inadequately heated homes and require admission to hospital.
60. The North Derbyshire and Bassetlaw Private sector strategy 2011 highlights that people with disabilities and those with long term limiting conditions are particularly at risk if their homes are the wrong design or are in poor condition. Older private rented tenants and/or those with long-term ill health face particular challenges: responsibility for the condition of the home
14
rests with the landlord as homeowner but landlords are not responsible for adapting their homes. It can be especially problematic to get a landlord’s permission to adapt a home, not least because major adaptations can completely change the nature of a home which may affect future lettability. Privately rented homes are least likely to fulfil Decent Homes standards and provide affordable warmth and least likely to offer good standard accommodation that is suitable for the needs of people with disabilities.
61. Good health care and improved medical expertise means that more babies born with significant, often multiple disabilities are now surviving into childhood and adulthood. This means there is a need to support more families to care for their disabled children by providing or enabling suitable homes that will later also require more self-contained space that supports the independence of young adults.
62. Welfare reform to limit housing benefit to under-occupiers will impact on those with disabilities who need additional space for medical supplies, equipment or simply in terms of circulation space. This will particularly affect families with disabled children and disabled adults under 65 years old. It is also likely to lead to an increased demand for homes that meet space requirements for the disabled person but where benefit will cover the payable rent. Most authorities will in any case have difficulty in meeting demand for downsizing moves. Space standards in much of the sheltered stock are inadequate for wheelchair users and many younger disabled people may not want to live on sheltered schemes
2.3.2 Customer Perspective
63. Focus gr Focus group attendees who weren't currently considering a move felt that they may need to do so in the future as their condition worsened. This would mean that they would be, in most cases, too old to get a mortgage (if they could afford one) and in need of greater care.
64. Cuts in subsidised transport were an issue for many, and suggests that in future people will be more considerate of the location of their property in relation to local shops and will continue to drive for longer, therefore needing reserved parking spaces with dropped kerbs or driveways.
65. The lack of affordable homes in general meant that in many cases the children of disabled people would be unable to move out, and so the need for larger properties to cater for families was discussed. Many felt resentment that it was assumed that as a disabled person they were single with no children (in almost every case the attendees had partners and/or children). Changes to Housing Benefit worried many people as they felt that they had very little spare cash currently, if any, and having to find money to make up the difference between Housing Benefit and their rent would be very difficult.
66. The loss of homes to the 'right to buy' scheme was considered one of the main factors in the reduction of suitable available properties for those in council housing.
15

2.3.3 Stakeholder Perspective
67. The Derbyshire Supporting People programme currently funds Home Improvement Agencies and Handyperson services as well as a range of supported accommodation and floating support. This budget is under significant pressure and, although services have so far been retained, the county council indicates that HIAs in particular are under review with a view to reducing SP expenditure and seeking increased contributions from the district and borough councils. Bolsover already supports the North Derbyshire HIA to enable adaptations and is unlikely to replace cuts in funding to the HIA by the county council.
68. There are particular concerns about the needs of disabled children and young adults. Adaptations are expensive, often involving an extension. The county council is prepared to top-up maximum grant to enable these to be delivered, but the housing authority has to find £30,000, which equates to a large proportion of the budget. More disabled children are surviving birth, and multiply disabled children are surviving for far longer. This is to be celebrated, but the system isn’t geared up to meet their housing needs.
2.4 Key Points
69. From this chapter, the following key points can be made about the identified housing needs of disabled people in Bolsover.
70. The main concerns of customers and residents are the lack of suitable housing and inappropriate allocations of both adapted and un-adapted housing and difficulty understanding affordable housing allocation processes.
71. Specifically, disabled people have a need for access to:
Comprehensive but easy to understand advice and information. Accessible suitable accommodation. A fair and efficient allocation of adapted and purpose-built social housing. Appropriate equipment. Affordable private sector accommodation. Properties for younger (non-elderly) people. Adaptation of existing property (e.g. through DFGs). Homes with high space standards.
72. Most residents felt their current properties were adequate, or could be made so with adaptations, but looking to the future there were concerns about cuts to subsidised transport, difficulties in their children affording to remain near their disabled parents, and changes to the housing benefit system.
73. There were some specific cultural, language and communications equalities issues experienced by BAME groups.
16
74. Amongst stakeholders there was a lack of awareness of alternative solutions for those needing extensive adaptations and support for a cross-authority adapted housing database.
75. The factors that affect demand from disabled households for housing may change in the future due to:
The economic downturn. The condition of private rented sector housing. Welfare reform and potential under-occupation. Health service changes. The ageing population. Disabled children and adults living longer.
17

3.0 Meeting the Housing Needs of People with Physical Disabilities
76. . The overview report sets out in detail the legislative and regulatory requirements that exist in relation to housing provision for people with sensory and physical disabilities. Good practice and guidance is contained in, and summarised in an appendix to, the overview report. Cost benefit studies in general consider the value of housing interventions in relation to savings for the public purse and the individual/ household; many are intangible or difficult to quantify in direct monetary terms. These studies are also explored in the overview report.
77. A clear message from the small number of housing developer partners involved in the focus groups was in favour of better space standards rather than Lifetime Homes Standard – in comparison with occupational therapists and housing options managers who were in favour of Lifetime Homes standard to reduce future calls on DFGs, given the ongoing and increasing pressure on these budgets.
3.1 Strategic Approach
78. The Older People’s Housing Needs Study completed for the East Midlands Regional Assembly in 2009 recommended some specific actions to meet future needs. These included that:
All new general needs housing is developed to Lifetime Homes Standards to enable more older people (and those with disabilities) to remain in general needs housing.
All new flatted blocks of ay tenure should have lifts to all storeys above the ground floor
Planning guidance should be provided for the development of ‘granny flat’ extensions to ensure that they are developed to accessible standards
Local authorities should set clear guidance for both RSL and private sector partners in line with these principles in relation to:
the future level of wheelchair housing (5%), accessibility in relation to new general needs housing specialist housing
79. Derbyshire County Council’s plan 2010-14 includes specific commitments to review the provision of adaptations and equipment, continue to support the handyvan service, to increase the range of supported accommodation and telecare and ensure housing options services are available for all older people to help them live in a home setting that suits them best.
80. Derbyshire County Council’s adult care service plan 2010-14 includes the implementation of the countywide universally available re-ablement service which provides support to reduce
18

long-term dependence and reduce the number of people admitted to residential care or re-admitted to hospital. Major adaptations are a priority to support the Older Persons’ Total Place agenda. The vision for individual and community wellbeing includes the following especially relevant outcomes:
Readily available comprehensive information, advice and guidance to support a good quality of life.
Services for targeted groups of people to prevent ill-health and maintain their physical, emotional and financial wellbeing, with advocacy and support where required
Help to avert crises with support from health and social care services working together.
Homes and Neighbourhoods designed around people. Housing will be adapted and equipment provided so people can continue to live where they want to
81. Targets have been set to increase the number of telecare recipients to 3,500 by 2014,
82. Despite these priorities, the performance measure targets indicate that the numbers waiting for minor adaptations will increase, and those for major adaptations will not improve. Waiting time targets are from assessment to delivery, and not from enquiry to assessment.
83. Derbyshire’s Joint Commissioning Strategy for People with Physical Disabilities3 highlights the importance of adaptations and telecare but says little else about the strategic approach to meeting needs through housing-related services and provision.
84. The 2005-10 Housing Strategy included an objective ‘to ensure that specific housing needs are met, for example, for….. people with disabilities’. The 2009 HMA Housing Strategy includes an objective ‘meeting the needs of vulnerable groups’ which includes people with disabilities. The latter anticipated that Local Development Frameworks would include requirements for lifetime homes and higher levels of the Code for Sustainable Homes.
85. The North Derbyshire and Bassetlaw Older Persons’ Housing Needs study action plan (undated but probably 2008) includes a number of relevant activities:
Increase the provision of specialist older persons’ housing to meet a Derbyshire target of 50 units per 1,000 people aged 65 and over
Identify opportunities to re-model existing sheltered schemes to better meet the needs of the older population.
Local authorities should ‘consider’ requiring lifetime homes standards in new developments to minimise the need for adaptations in new housing stock. Actions related to this are to:
Ensure Lifetime homes are incorporated with LDFs Adopt principles of the Sheffield City Region Good Practice Guide on
design of properties for older people.
3 April 2010 draft version - updated draft awaited
19
Increase expenditure on DFGs – it is recognised that this increased funding must be sought from the Government
Develop access to equity release to enable older homeowners to release capital for home improvements
Develop a fuel poverty strategy aligned with that for North East Derbyshire and Chesterfield
Develop comprehensive advice and information systems
86. The North Derbyshire and Bassetlaw Private Sector Housing Strategy 2011 aims to achieve four outcomes:
1. Homes are affordably warm and their impact on the environment is minimised2. Vulnerable people are able to sustain independent living3. Private homes provide additional good quality housing options4. Private rented homes are safe and well managed
87. To achieve the independent living for vulnerable people outcome the strategy suggests action will be taken to:
Develop easy to understand information in a range of formats for customers and agencies
Ensure front line staff are able to identify client issues, advise and make referrals to other agencies where needed
Explore the potential to introduce ‘paid for’ services and improve access to private sector services e.g. via trusted trader
Identify and develop alternative ways in which people whose homes need repair and improvement are helped e.g. equity release; alternative housing options
Ensure, through a variety of means, that as many people as possible can benefit from adaptation services e.g. reduced costs; needs assessments based on ‘minimum necessary’
Improve the availability of support to people in the private sector to help them live independently
88. Derbyshire PCT employs a Housing and Health Manager whose remit is to work with the district and borough housing authorities on health improvement issues. Two monthly meetings give opportunities to exchange ideas and discuss how health and housing can complement each other more effectively. There is on-going work with GPs to raise awareness of the impacts of housing issues on health and improve referrals for a range of housing-related services, such as affordable warmth. The PCT has also been asked to complete research into the local prevalence of certain conditions to see whether there is any justification for seeking additional funding for adaptations.
89. There is a ‘hypothetical’ understanding amongst all local stakeholders that prevention (though the right home or adaptations) is far better and cheaper than dealing with the consequences of leaving things as they are. However, there is no agreement on who should pay for this. Stakeholders from all agencies other than housing understand that
20
social care and health are the beneficiaries of cost savings where prevention is achieved, but for the most part see housing as the sole responsibility of districts and boroughs – ‘it’s their statutory duty so they should find ways to make it happen’. We did come across some local stakeholders in social care and health who considered that these agencies should agree what each will contribute in order to achieve cost-avoidance and better standards for customers.
3.2 What is the current housing provision for people with physical disabilities?
90. There is reliance on Part M planning regulations being changed before Bolsover District Council feels they can insist on their planning policies around accessible homes. The main issue affecting S106 requirements is the lack of evidence of need - this project is expected to provide sufficient evidence to back-up negotiations.
91. The Occupational Therapy service identifies that where, in the past, it has been involved in the design of new homes (always for social rent) they have found that small adjustments to designs, such as levelling access routes and adjusting circulation spaces and door positions has meant that properties can be occupied by people with disabilities with far fewer and less expensive adaptations. The OT service isn’t currently involved in new development design.
92. The North Derbyshire HIA has been awarded a Quality Mark by Foundations.
93. The inconsistency of referrals for adaptations is causing some difficulties in planning expenditure: at present OT assessments are delayed. This is not to say that need is decreasing – if the backlog of OT assessments is reduced or eliminated in future months, there will be a very significant increase in referrals and therefore spend on DFGs. Meanwhile, however, customers will wait some months for an assessment before the process of adapting their home can even start. This underscores the problems caused by the multi-faceted DFG system especially where two different agencies are responsible for different parts of the process. Other issues can arise where the county council’s architect service is unable to process requests quickly enough.
94. Derbyshire’s Joint Commissioning Strategy for people with physical disabilities4 includes some research findings (December 2007) into the effectiveness of the provision of adaptations via DFGs to people in non-local authority housing. Not all the data is included, but some key facts are:
95. Applicants who withdrew their application for a DFG (total number or proportion of all applicants not stated):
A third say they couldn’t afford their contribution
1 in 7 withdrew because ‘if they had got better information early in the process they would have never have gone ahead with their application’.
4 April 2010 draft version - updated draft awaited
21

Speed in processing the application by the County and District Council was rated as poor or very poor by 42% and 46% of applicants respectively.
Where adaptations were ‘in progress’ but not yet completed:
40.6% were dissatisfied with the way their application had been dealt with overall
51.5% of these applicants felt the speed of processing their application was poor or very poor
96. Virtually all completed applicants were still using their adaptations. Despite some general deterioration in health nearly 80% of applicants’ care needs had stayed the same, with only 4% lessoning. This group had a more positive view of the process (though had suffered in the long process). Many made very positive comments on the impact the adaptations had made on their lives.
97. The allocations policy states that younger people with disabilities can be allocated bungalows normally let to older people: this helps to meet needs.
98. It is not known to what extent the Council has information about adapted homes in any tenure across the area.
99. At present estate agents and managing agents are not engaged with the Council in considering how to advertise homes that could accommodate people with disabilities. This means that most customers’ housing options are limited to occasions when disabled facilities are recognised at void inspection in social rented stock. This may be after the home is advertised.
100. There is good understanding across Health and Social Care about the extent to which the right home will reduce on-going long-term inputs. Funding the right home supports parents to care – this is usually an intensive job that is hard work. Without the right home and equipment, parents need more external assistance (e.g. to lift the child), which is a cost to social care, and children are more likely to come down with chest infections (they can’t be moved often enough to keep their chests clear) or other problems caused by stasis etc. and need hospital care, which is a cost to health. A rational preventative and cost-effective approach would be for social care and health to pay to get the right home environment as early as possible. The same type of feedback was given about disabled adults and the need to support carers and prevent acute illness, which complicates conditions and increases disability.
101. One recent case (across the whole of Derbyshire) was given as an example of how this could happen – health, social care and housing all contributed to a new build bungalow for a family with four disabled children. However, it took ‘years’ for this to be achieved.
Providing additional homes
22

102. Bolsover’s saved Local Plan provides a policy framework that has the potential to support new homes being built to standards that support the design requirements of people with disabilities.
103. Planning policy H.4.9 ‘Accessibility for People with a Disability’ states that it is desirable that as many dwellings as possible are designed to facilitate access by people with a disability.
104. H.5.11 Access for People with a Disability states that the layout of housing areas, from the design of the immediate surroundings of the house within its curtilage, to the wider context, should cater for the needs of people with a disability. Developers are encouraged to adopt the design features of 'Mobility Housing' in all dwellings as a matter of course as housing built in this way can readily be occupied by people with or without mobility problems, and the niche market for such purpose-built accommodation is increasing. On housing sites near shops, services and public transport the local planning authority will seek to negotiate the provision of some mobility housing as set out in policy HOU 15 in the local plan.
105. Annexe 2 in this supplementary planning guidance explains the design rules that need to be followed to make dwellings accessible for people who have a disability or who have problems walking or climbing stairs. In practice this provision is rarely or ever used, or even considered in the development control process, and is not strong enough to be a requirement even for bungalows that otherwise appear to be ideal and easy to build to mobility standards.
106. The saved Local Plan includes: HOU16 Mobility housing: Where there is clear evidence of need5, the local planning authority will encourage developers of residential sites which are well served by shops, community services, and public transport to provide a proportion of dwellings to meet mobility standards. This provision will be secured by condition or negotiated through a section 106 planning obligation.
Making best use of existing homes and responding to individual needs
107. Derbyshire County Council leads advice and information for people with disabilities through the First Contact signposting service. The filter form used by the service includes housing-related questions and referral routes (other than for adaptations) are to Bolsover’s housing options team. Age UK also provides a specific housing options service for older people (HOPS) that aims to provide holistic approaches to housing needs.
108. Bolsover shares the North Derbyshire Home Improvement Agency with Chesterfield and North East Derbyshire councils. In Bolsover, the HIA provides home improvement, home safety, fire prevention and other services and works with Fire and Rescue and other agencies to provide home safety checks for older people and people with disabilities. The Age UK Home Options Advisor and the North Derbyshire HIA staff visit customers in their homes and provide advice on a variety of housing issues. HOPS activities are
5 Our italics
23

acknowledged to save adaptations budget through assisting older people to move to more suitable homes, which can avoid adapting current homes.
109. Falls prevention assessments are completed by a range of front line community workers and work to respond to these is referred to the handyperson service provided by Mediquip across the County area. This latter is funded by Supporting People and social care and helps vulnerable people (including people with physical disabilities) with basic repairs and safety measures including fire safety and security checks.
110. Bolsover DC introduced a choice based lettings scheme in 2011. The allocations policy places those with urgent medical needs into Band A. Band B (high rehousing need) includes existing BDC tenants living in adapted homes who no longer require the adaptations and tenants who are waiting for an adaptation. In this way the council hopes to make better use of its adapted homes. People with high medical needs also go into Band B. People with disabilities will be considered for bungalows which are otherwise let to over 50 year olds so this helps to meet these needs. A Housing Application Review Panel meets to discuss and deal with more complicated cases, which will include allocating properties with extensive adaptations and overriding the bedroom number criteria if someone has medical equipment requiring its own room.
111. The County Council’s Occupational Therapists are involved in assessing needs and the suitability of available homes.
112. In 2010/11, the Council spent £584,001 on 114 DFGs. The Council’s Grants team is responsible for administering the processing of the grant including financial assessments and more personal assistance to individual customers and the design and procurement process is delivered by the County Council’s architectural service. A service level agreement was historically established between the two councils but there is no monitoring or performance management that would help the partners to improve the system. Only stairlifts and over-bath showers are delivered locally - improvements to the process have resulted in speedier delivery of these more straightforward adaptations, whilst more complex adaptations can still take some time; requiring design and occasionally planning permission.
113. Floating support services, also funded through the Supporting People programme are available across the county area. The support service most likely to be provided to people with physical disabilities is a community alarm that enables clients to call for assistance at any time. Demand for support services outstrip supply and the support services identify that they have few clients who are supported solely because of their physical disability: most have other issues such as rent and other debts, problems retaining their tenancy and substance misuse; these being the primary reasons for referral to the support service.
3.2.1 What Provision Should Look Like
114. This section outlines the forward looking aspects of strategic documents to set out aspirations for how provision should look in the future.
24

115. The Older People’s Housing Needs Study completed for the East Midlands Regional Assembly in 2009 recommended some specific actions to meet future needs. These included that:
All new general needs housing is developed to Lifetime Homes Standards to enable more older people (and those with disabilities) to remain in general needs housing. All new flatted blocks of any tenure should have lifts to all storeys above the ground floor. Planning guidance should be provided for the development of ‘granny flat’ extensions to ensure that they are developed to accessible standards. Local authorities should set clear guidance for both RSL and private sector partners in line with these principles in relation to:
- the future level of wheelchair housing (5%), - accessibility in relation to new general needs housing - specialist housing
116. The vision in Derbyshire County Council’s Adult Care Service Plan 2010-14 with regard to individual and community wellbeing, includes the following especially relevant outcomes:
Readily available comprehensive information, advice and guidance to support a good quality of life. Services for targeted groups of people to prevent ill-health and maintain their physical, emotional and financial wellbeing, with advocacy and support where required. Help to avert crises with support from health and social care services working together. Homes and Neighbourhoods designed around people. Housing will be adapted and equipment provided so people can continue to live where they want to.
117. The Derbyshire 2011-16 Housing Strategy also outlines the advantages of understanding and meeting the housing needs of people with physical disabilities which include:
Ensuring more housing options are available so disabled people have choices. Cost effective use of available funding to meet long-term needs. Improved health, well-being and independence. Reduction in care and support costs. Enabling disabled people to live in mixed communities.
3.2.2 Customer Perspective
118. Those attending the focus groups gave mixed messages about their levels of satisfaction with current service delivery. While most were complimentary about how aids and adaptations had been provided, others felt that waiting times for fundamental things, such as accessible showers, were too long and that in some cases planners and workmen were unsympathetic to the needs of disabled people (e.g. not waiting long enough after ringing doorbells before leaving, not being flexible when installing new kitchens). Those
25

who owned their own properties felt that they were in a particularly difficult position. They were given conflicting advice about whether adaptations would be paid for and felt that sourcing reliable tradesmen was something they needed help with. They also felt that they should have more access to council housing, with one respondent suggesting some kind of 'swap' whereby owner occupiers could sell their property to the council in return for a place in appropriate accommodation.
119. The availability of information for people with disabilities, ranging from advice on benefits to housing and healthcare, was considered insufficient. Respondents talked about being passed from one organisation to another, and often not knowing who to call for what. The provision of a centralised point of contact for queries was considered to be something that would be of great benefit, with respondents suggesting that they felt it would offer better value for money. The sharing of information by organisations was also criticised, with many respondents saying that they had to explain their situation over and over again to different organisations, and in some cases different branches of the same organisation.
120. There was a general consensus among respondents that there were not enough suitable properties available, and those that the council or housing associations considered to be suitable were, in fact, not. The lack of step-free access, narrow doorways, bathrooms unsuitable for adaptation and the lack of storage space for wheelchairs and mobility scooters was criticised, as was the provision of properties with only one bedroom. This meant that some respondents were in homes they felt were unsuitable, but better than anything else that they might be able to find.
3.3 Key Points
121. In terms of how well the current services and provision is effective in meeting the needs and demands of disabled households, we can summarise the following:
122. There are provisions in planning policies for Special Needs Housing and Lifetime Standards, but this has not been implemented and private sector supply is constrained by market forces.
123. There are a number of local authority and third sector services to help meet housing needs which seem to be generally well-regarded but some concerns and comments are highlighted.
Home Options Choice Based Lettings Scheme: Allocations process can be difficult to understand and unfair and some people offered unsuitable properties.
First Contact Signposting and Referral Scheme: Monitoring information not available specifically re people with physical disabilities.
Age UK: Advice on a range of issues for older people. Home Improvement Agency: Advice on housing issues and arrangement of
repairs/improvements. Citizens Advice Bureau: Advice and information, including debt counselling.
26

Housing Options for Older People Service: Advice on housing issues and options - Save money by assisting to move people to more suitable homes, rather than DFGs
Handyvan: Basic repairs and safety measures, helps maintain independence; enhance health and social care provisions; value for money; consistently highly rated.
Floating services for housing related support: Community alarms; Support for people with other issues besides their physical disability.
124. Disabled housing need will not be met by current projected supply, the need for adaptations remains high and the level of investment in DFGs is seen as unsustainable.
125. The DFGs experiences delays and there is dissatisfaction with the process, although positive views of the impact DFGs had made on people’s lives.
126. There is very limited information maintained on the location of adapted property and there is no engagement with estate agents on disabled facilities.
127. A stronger preventative strategy is needed, involving health and social service agencies, to develop or adapt the right homes.
128. The provision of a single, centralised point of contact for the multiple services for those with physical disabilities would be of benefit.
27

4.0 Disabled Resident Survey
129. A total of 600 telephone interviews with disabled residents or members of their family across the 15 local authority areas were completed, together with an online version to which 78 people responded. Respondents were asked two screening questions before they were able to complete the survey; the first identified the local authority area they lived in and the second confirmed that they had a physical disability or visual impairment. The total number of responses from Bolsover was 45, with results set out in the following section.
4.1 Profile of Respondents
130. The profile of respondents living in Bolsover in terms of household types, number of residents and age profile broadly reflected the wider sample from the 15 local authorities and was as follows.
Household type Bolsover Total (All Notts and Derbs Local Authorities )
Single Person 33% 39%Couple with no children living at home 38% 40%Single parent with children u-16 living at home
0% 1%
Couple with children u-16 living at home 9% 3%Sharing with other adults 11% 9%Living with extended family 4% 3%Parent(s) living with children over 16 2% 4%Other 1% 1%
131. The majority of households (73%) were occupied by one or two people, with a broadly even split between these two groups.
Number of people in household Bolsover All LAs
One 33% 39%Two 40% 46%Three 18% 10%Four 4% 3%Five 4% 2%Six 0% <1%More than 6 0% <1%Don't know 0% <1%
28

132. Bolsover had the highest proportion of three person households and the second highest proportion of couples living with children under the age of 16.
Age of household Bolsover All LAs
Both adults over 60 69% 70%Both adults under 60 16% 16%Mixed age (at least one over 60 and one under 60)
16% 14%
133. In terms of ethnicity, the profile in Bolsover was overwhelmingly white British, reflecting the overall demographic profile.
Ethnic origin Bolsover All LAs
White British 98% 94%White Irish 0% 1%Other European 2% 1%Other White 0% <1%White & Black Caribbean 0% <1%Other Mixed 0% <1%Indian 0% <1%Black Caribbean 0% 1%Black African 0% <1%Other Black 0% <1%Other 0% <1%Prefer not to say 0% 2%
Household income Bolsover All LAs
Under £500/month 11% 8%£501 - £1000/month 11% 21%£1001 - £1500/month 7% 8%£1501 - £2000/month 0% 3%£2001 - £2500/month 2% 2%£2501 - £3000/month 0% 0%£3001 - £3500/month 0% 1%£3501 - £4000/month 0% 0%£4001 - £5000/month 1% <1%£5001 - £7500/month 0% <1%Above £7500/month 0% <1%Don't know/prefer not to say 67% 58%
29
134. The majority (76%) were 'non-working' households.
Working status of household Bolsover All LAs
Working (at least one adult in employment) 24% 18%Not working (no employed adults) 76% 82%
135. Bolsover had one of the highest proportions of households claiming Housing Benefit, and also one of the highest proportions of respondents who were unsure which benefits they received.
Benefits received Bolsover All LAs
Council Tax Benefit 49% 44%Housing Benefit 33% 26%Local Housing Allowance 0% 1%Income Support 9% 9%Pension Credit 16% 18%Jobseeker's Allowance 0% 2%Child Tax Credit 4% 3%Child Benefit 2% 3%Working Tax Credit 0% 2%Disability Living Allowance 64% 58%Attendance Allowance 9% 17%Carers Allowance 16% 17%Incapacity Benefit 4% 3%None of these 7% 10%Don't know 11% 7%Other 0% 4%Refused 0% 2%
4.2 Current Property
136. The predominant property type was bungalow, with Bolsover (44%) having a relatively high proportion compared to the wider study area (29%).
What type of property do you currently live in? Bolsover All LAs
Terrace/end of terrace 18% 13%Semi-detached house 29% 33%Detached house 4% 11%Bungalow 44% 29%Ground floor flat 0% 5%Flat/maisonette in a block with less than 5 floors 2% 4%Flat/maisonette in a block of 5-10 floors 0% <1%Flat/maisonette in a block of more than 10 floors 0% <1%Flat/bedsit in a converted house 2% 1%Caravan/mobile home 0% <1%
30

What type of property do you currently live in? Bolsover All LAs
Supported housing 0% 3%Extra care accommodation 0% <1%Other 0% 2%
137. Just under half of respondents either owned their house outright, or had an outstanding mortgage.
And do you…? Bolsover All LAs
Own your property outright 36% 47%Own with a mortgage 11% 10%Rent from the council 42% 28%Rent from a housing association 9% 9%Rent from a private landlord 2% 3%Part-rent and part-own through shared ownership 0% <1%Other 0% 2%
138. In terms of bedrooms, Bolsover had one of the highest proportions of respondents living in properties two bedrooms.
139. Very few (7%) of respondents said that they, or someone else in the household, were on the housing register.
4.3 Disabled Housing Needs
140. In terms of specific needs, around 20% wheelchair users, 13% outside the house only and 7% inside.
Wheelchair use Bolsover All LAs
Inside the house only 7% 2%Outside the house only 13% 22%Both inside and outside the house 18% 10%No wheelchair use 62% 66%
141. In addition, in Bolsover 60% use equipment or aids on a regular basis, and:
44% use a walking stick 4% have a wet room or walk-in shower 11% have a stairlift 26% have grab rails
31

142. A quarter of respondents felt they needed level access to a shower or wet room and 18% having a need for level access to the front door.
(Do you have, or) do you need any of the following?, Bolsover All LAs
Level access to the front door 18% 16%Level floors within the home 7% 5%Accessible toilet facilities 11% 8%A level access shower/wet room 24% 24%Adapted kitchen facilities 4% 9%A stair lift or through-floor lift to get access to the upper floors
7% 12%
Ceiling track hoist 2% 2%Widened doorways 2% 6%Reserved parking bay outside property 11% 12%Driveway to allow close access to property 7% 8%
143. Most (89%) Bolsover respondents considered their current property to be suitable for the needs of the disabled resident. Those who felt the property was not suitable gave reasons including stairs being a problem, needing adapted bathroom facilities and parking being an issue.
144. 20% of Bolsover respondents felt that they could afford the necessary adaptations (compared to an average across the study area of 18%).
4.4 Future Housing Plans
145. In terms of future plans, one-fifth felt likely to move within 5 years, but the majority felt they were unlikely to.
Are you, or will you be, actively seeking to move to a more suitable property in the next 5 years?
Bolsover All LAs
Yes, I/we are currently looking to move home 13% 9%Not seeking to move now, but we are likely to do so in the next 5 years
4% 9%
Not seeking to move now and we are fairly unlikely to do so in the next 5 years
4% 8%
Not seeking to move now and we are very unlikely to do so in the next 5 years
73% 70%
Don't know 4% 5%
146. Bolsover had the highest proportions of respondents looking to move currently, with Bassetlaw and Nottingham City also reporting the same proportion. Amongst those in Bolsover looking to move now or being likely to do so in the next 5 years, reasons given for wanting to move included the
32

current property being too big, it being unsuitable for adaptations, a desire to move closer to shops and transport links, to release equity and due to the property being too small.
Are there any barriers which prevent you from moving?
Bolsover All LAs
Can't afford a suitable home 13% 15%Suitable home not available 7% 7%Can't face the upheaval of moving 29% 22%Would have to move away from friends/family 18% 22%Would have to move away from jobs/schools 0% 2%Tied to a fixed term tenancy 0% <1%Would be unable to sell current home 4% 3%Would not want to move 9% 4%Other 2% 5%Don't know 4% 4%No barriers 42% 42%
147. In terms of number of bedrooms needed in a new house, Bolsover had one of the smallest proportions of households needing just one bedroom.
148. The majority (62%) of respondents would like a bungalow, this was the smallest proportion in the study area, but a significant number did not think they would be able to afford it.
What sort of property would you like/afford to live in? Bolsover
LikeBolsover
AffordTotalLike
TotalAfford
Terrace/end of terrace 2% 4% 2% 6%Semi detached house 9% 9% 8% 8%Detached house 7% 4% 5% 2%Bungalow 62% 49% 75% 52%Flat/maisonette in a block with 5 floors or less
2% 2% 9% 9%
Flat/maisonette in a block with 6-10 floors
0% 0% 1% 1%
Flat/maisonette in a block with 10+ floors
0% 0% 1% 1%
Supported housing 4% 4% 6% 9%Extra Care accommodation 0% 0% 3% 3%Other 2% 2% 3% 3%Don't know 13% 29% 9% 27%Don't want to move 4% 0% 3% 3%
149. Bolsover had the second highest proportion of respondents who said that they would like to rent from the council (after NE Derbyshire, 50%) and one of the lowest proportions wanting to own their next home outright.
33

And how would you like/be able to afford to occupy your next home? Bolsover
LikeBolsover
AffordTotalLike
TotalAfford
Own your property outright 27% 27% 42% 31%Own your property with a mortgage 9% 13% 5% 6%Rent from the council 48% 47% 39% 43%Rent from a housing association 16% 18% 17% 20%Rent from a private landlord 4% 8% 6% 8%Part-rent and part-own (shared ownership)
0% 2% 2% 2%
Other 0% 0% 1% 1%Don't know 22% 24% 12% 17%Don't want to move 0% 0% 3% 3%
150. The majority of people said they would seek advice from the Council/Housing Association or Social Services (62%), but there was little knowledge of other / voluntary services.
If you wanted advice about making your house more suitable, or other housing options, where would you go to find that advice?
Bolsover All LAs
Council 47% 38%Social Services 29% 19%Citizens' Advice Bureau 0% 4%Family 9% 8%Housing provider 4% 7%Healthcare provider 4% 8%Age UK 0% 3%Friends/Neighbours 0% 2%Occupational Therapist 0% 3%Internet 0% 2%Mobility Centre 0% 1%Other 11% 6%Don't need advice 2% 3%Don't know 11% 16%
4.5 Key Points
151. Based on the survey of residents, we can highlight the following about disabled housing need in Bolsover.
152. Demand is highest for one and two bed roomed properties bungalows or ground floor flats,
in a mix of tenures, although some do need to be larger 3 or 4 bed roomed properties. (No questions were asked about the need/desirability for a small garden or outdoor private space)
34

153. Up to 20% are wheelchair users – 13% outside the house only and 7% inside. About 30% use a walking stick on a regular basis.
154. In terms of adaptation, need is highest for level access shower/wet room, with need also high for level access to a front door and stair lift / lift access to upper floors.
155. Around one quarter of respondents felt that their property was not currently suitable for their needs and only a small number felt they could afford the necessary adaptations.
156. The main barriers which would prevent people from moving are having to move away from family and friends, concerns about the upheaval of moving and the lack of or un-affordability of a suitable home
157. Over 75% of respondents would go to the Council or Social Services for advice, with a relatively low level of awareness and use of non-statutory services.
35

5.0 Demographic and Housing Needs Data
158. This section outlines the key findings regarding housing issues for people with physical mobility disabilities based on related demographic and housing needs data. It should be read alongside the findings from the overall statistical report, where additional or complementary data can be found. The charts and tables referred to are in Annex 1.
5.1 Demographics
159. This study focuses on the short (three years) and medium (five years) term picture of demand for and supply of suitable accommodation to meet the needs of people with physical disabilities. However, it is important that short and medium term solutions and policies are also framed in the context of longer-term patterns of demographic change. So, where available, we have also used forecasts and projections that related to the next ten and twenty years, to 2030.
5.1.1 Overall Population Change
160. In the short and medium term, the overall population in Bolsover is forecast to increase by 2.4% between 2010 and 2015, from 74,900 to 76,700. This rate of increase is below the study average. The current age breakdown is 61,300 residents aged under 65 and 13,600 aged 65 or older, including 1,700 aged 85+. The working age population is projected to see an insignificant decrease of 100 residents, while the 65+ resident population is expected to increase by 1,900 (14%).
161. In the longer term, population is projected to reach 78,800 by 2020, and 82,900 by 2030 – an 8,000 increase on 2010, and a rate slightly below the study average. Again, this overall increase contains considerable differences between the rate of change for the under and over 65 year old populations.
162. We are now seeing the culmination of the population bulge in the post-war ‘baby boom’ generations, with proportionately greater numbers hitting the over 65 age group. Of the overall increase, the 18-64 group is projected to see an increase of only 500 residents, while there is projected to be a 7,500 increase in the 65+ group. This represents a 0.8% increase on 2010 figures for residents aged 18-64, and a corresponding increase of 55% for the 65+ group.
163. These longer term shifts in age profile will particularly impact on the balance between working and non-working adults in the population. Bolsover is likely to see a loss of the proportion of working age population of nearly 9%, above the 6.5% projected loss across the study area.
5.1.2 Population Change Among the Very Elderly
164. As regards the very elderly (85+ population) in the shorter term all areas will see a steady increase year on year, with Bolsover projected to see a below-average increase of 12%
36

165. When we look at the longer term, we can see that all areas are projected to see a significant increase, with the population in the majority of authorities more than doubling. Bolsover’s increase will see an extra 1,800 over 85s in the population. This will result in the population of over 85s doubling by 2030 (increasing by 105%), with a total of 3,500 residents in the group. Over 85s are projected to form over 4% of the Bolsover population by 2030
5.1.3 Older People and Mobility Issues
166. The charts and tables below show projections for the proportionate growth of over 65s who are unable to manage at least one mobility-related activity, in the short, medium and long term.
167. These activities include being able to walk upstairs and downstairs, being able to walk around the house on the level, getting to the toilet and shower, getting out of doors and walking around. Currently there are 2,427 people with these difficulties in Bolsover. This is forecast to increase to 2,768 by 2015 and 4,086 by 2030 – a 68% increase on 2010 figures. Bolsover’s long-term rate of increase is marginally higher than the average rate (64.2 %)
168. In addition to (or potentially overlapping) this group it is estimated that in 2015 there will be a 10% increase in the number of residents aged 75 or over with registerable visual conditions (that is, fully or near blind) , bringing the total to 10,500 residents in the study area.
169. There are also range of projections for residents with other medical and related conditions that may impact on housing mobility issues, though less directly than the indicators above. Heart conditions may make walking up stairs difficult, and necessitate stair lifts. Likewise, strokes can severely impair movement, and sufferers may require ground floor accommodation or wheelchair appropriate accommodation. Bladder problems may necessitate extra toilet and washing facilities. The projected rates of increase in these conditions for older people are shown in the charts below, with a summary table for all authorities at the end of this section. Bolsover’s rates of increase are mainly around or slightly above average for these indicators.
5.1.4 Working Age Population
170. Moving on to the working age population (18 to 64) with physical disabilities, 4,886 Bolsover residents are projected to have either moderate or severe physical disabilities by 2015, a small 1.4%) increase on 2010 figures.
171. This includes 1,128 with severe disabilities. In the longer term, by 2030 there are projected to be 5,016 residents with disabilities, including 1,185 with severe disabilities. This represents a 4.1% increase in the proportion of the working age population with disabilities.
37

172. Given the marginal changes over the short term, we concentrate in the rest of this section on the longer term picture for working age disabled people. Looking particularly at residents where physical disabilities limits the capacity to work, chart 20 indicates an increase of 6.7% (from approximately 50,000 to 54,000) in this groups over the longer term across the study area, with Bolsover seeing a small, below average increase of 2.7%. .
173. While being unable to work because of physical disability does not automatically equate to a requirement for housing-related adaptations or other solutions, there will be extensive overlap between medical conditions such as heart and circulatory problems, strokes and diabetes, and a need for accommodation adaptations or single level accommodation.
174. We have some data on the nature of physical disability projected for the working age population, though not specific data on mobility–related problems for 18-64s (as we do have for the 65+ group). Specifically we can say that across the authorities a minor increase in working age people affected by strokes (5%) and a slightly larger proportion with diabetes (7%) is forecast. There are minimal changes to those with serious visual problems. For all these indicators, Bolsover is likely to experience a small or minimal increase in numbers.
5.2 Disabled Living Allowance
175. One of the most useful indicators of the prevalence of mobility-related disabilities in an area is the take up of Disabled Living Allowance (DLA). DLA is not currently means tested, so it captures a full range of households. Take-up can be analysed by severity of mobility difficulty, as it distinguishes mobility–related conditions from care-related disabilities (e.g. support for those with learning disabilities, help with washing, cooking meals, communicating etc.) and there are separate rates for lower and higher mobility difficulties.
176. A claimant is only entitled to the lower level of the mobility component if they need guidance or supervision most of the time from another person when walking out of doors in unfamiliar places. To get the higher rate one or more of the following must apply:
You are unable or virtually unable to walk without severe discomfort, or at risk of endangering your life or causing deterioration in your health by making the effort to walk.
You have no feet or legs. You are assessed to be both 100 per cent disabled because of loss of eyesight and not less
than 80 per cent disabled because of deafness and you need someone with you when you are out of doors.
You are certified as severely sight impaired by a consultant ophthalmologist6.
6 http://www.direct.gov.uk/en/MoneyTaxAndBenefits/BenefitsTaxCreditsAndOtherSupport/Disabledpeople/DG_10011816
38

177. We consider that those claiming the higher rate are the most likely to also require housing-related adaptations, or provision of specifically-designed accommodation to meet their housing needs.
178. In 2010 there were 4,440 individuals claiming higher level DLA in Bolsover. This represented 5.9% of the population, the highest proportion among all fifteen local authorities. Over the last three years, the number of individuals claiming higher mobility rate DLA has been increasing on average 3.3% per annum. There has been little change between these years. If we assume that this rate of change will continue, in Bolsover there will be 4,547 claimants by 2015 and 4,914 by 2030. This is an 11% increase on current numbers, rather below the 14.7% average for the study area.
5.3 Disabled Facilities Grants
179. Data on Disabled Facilities Grants (DFGs) is a key source in assessing the demand for mobility-related adaptations, and also of the ability of local authorities to meet existing and future demand. DFGs are mandatory where an assessment concludes that works are necessary. They are means tested (except where they are for the benefit of disabled children), capped at £30,000, and are available to all tenures. Discretionary assistance may be given for works costing more that £30,000 or in other circumstances. Tenants may have to make a contribution if they are assessed as not eligible for the full cost.
180. DFGs are available for mobility-related building modifications, adaptations and improvements to help with:
Making it easier to get in and out of the dwelling by, for example, widening doors, levelling thresholds and installing ramps.
Ensuring the safety of the disabled person and other occupants by, for example, providing a specially adapted room in which it would be safe to leave a disabled person unattended or improved lighting to ensure better visibility.
Making access to the living room and kitchen easier. Providing or improving access to the bedroom, toilet, washbasin and bath (and/or shower)
facilities; for example, by installing a stair lift or providing a downstairs bedroom and bathroom.
Adapting heating or lighting controls to make them easier to use. Improving access and movement around the home to enable the disabled person to care for
another person who lives in the property, such as a spouse, child or another person for whom the disabled person cares.
181. Bolsover planned to complete 78 DFGs in 2009-2010, towards the lower end of outputs across the study area authorities. Historically, again they have been consistently in the lower range of the number of DFGs undertaken since 2004.
182. What is also clear is that in spite of only a very minor increase in the number of mandatory grants since 2004-5, costs have been rising substantially. This is clearly shown in table 7
39

below, which indicates that the average grant now costs £6,825, compared to £4,677 in 2004-5 – a 46% increase. Bolsover’s costs have risen more sharply than most, with their position changing from fourth lowest costs to fourth highest among the authorities since 2004
5.4 Children with Disabilities
183. The first is the register of Special Educational Needs held by county councils, from which the numbers of children with specifically physical and sensory disabilities can be calculated by authority. Chart 29 gives numbers with physical, sensory and multiple disabilities as of 2010. As can be seen in chart 30 they represent a minority (10%) of all those with SEN statements, but they are likely to also need suitable conditions and adaptations at home in order to flourish at school. Bolsover has a below average percentage of children with a SEN statement because of physical mobility-related disability, the lowest level in the study area. In numerical terms, numbers towards the lower end among the authorities, which are dominated by the numbers in the two large cities, Derby and Nottingham.
184. The other source of data is the ‘Census of Children in Need’ (Chart 31) which tracks social service engagement with children by their particular needs. There are three categories of relevance to physical housing needs consideration - mobility needs, hand function needs (perhaps necessitating special bathroom fittings) and visual need. Again, the numbers are small, but requirements on authorities may be extensive. Bolsover’s ‘Children in Need’ assessments for mobility-related problems are at the lower end of the spectrum among the study authorities.
5.5 Council Tax Exemptions
185. In certain circumstances of relevance to housing requirements of people with disabilities, Council Tax may be reduced, disregarded, or buildings may be declared exempt from liability. The relevant criteria are:
Reduced Council Tax: this is charged where the property has had major adaptations related to disability or medical condition (e.g. a second bathroom, extra wheelchair space, a room for kidney dialysis), by moving the property to a lower band.
Disregards of 25% or 50%: for people temporarily in hospital, residents in dwellings where personal care is provided.
Exempted dwellings: empty homes where the normal resident is in another dwelling to receive care, or a dwelling that is unoccupied because the normal resident has moved elsewhere to look after someone who needs care.
186. Most of the fifteen local authorities were able to give some data on the number of exemptions, though because of different recording methods it is difficult to gain a full picture. Bolsover noted 141 reductions for disabilities.
40

5.6 Housing Demand: Housing Registers
187. While all fifteen authorities run district wide housing registers, practice varies widely in the quantity, range and type of data kept on the housing needs of individuals. In so far as is possible to compare like with like, we have brought together and summarised data on those applicants with mobility and physical disability related requirements on the register, and compared this to the general applicant population. We have had to make a number of assumptions, which are detailed below.
188. Age: Some authorities either highlight or only hold age-related data, often against banding information.
189. Need for adaptations and medical condition: Some authorities specifically categorise applicants who require mobility-related adaptations, or purpose built accommodation. Others do not, but categorise applicants under medical categories of degrees of seriousness. Where we have adaptation requirement data we have used this; where we only or additionally have medical-need data, we use this
190. Accuracy in describing physical disability: Where we can distinguish specifically mobility-related physical disability we have done so; where this is not possible we have categorised this as ‘other’ physical disability.
191. Wheelchair requirement: Some authorities specifically list applicants requiring wheelchairs; others do not, though it cannot be assumed that there is no wheelchair requirement in these cases.
192. Base figures: To ensure a degree of consistency in the baseline, overall housing register figures are taken from the 2010 HSSA forms, representing the official local authority monitoring return to the DCLG.
193. What will be apparent from Table 9 is the considerable variation in the proportion of applicants who can be categorised as having (or potentially having) some form of mobility – related disability. This range runs from 3% (Chesterfield) to 38% (Erewash). The weighted average (i.e. taking account of different sizes of housing registers) is 14%.
194. With 2,043 applicants on the register, Bolsover has a below average (3299) number of applicants on the housing register. We do not have details of the numbers or proportion of those with mobility-related disabilities.
195. Clearly the make-up of social housing stock will be one of the two key determinants of how easy it is for mobility disabled people to access appropriate stock (the other one being rate of supply or turnover, noted above).
196. We have fairly detailed information of the quantity of wheelchair accessible housing association stock is by authority, and less extensive data for local authority stock (it should be remembered that some association stock will comprise transferred council stock).
41
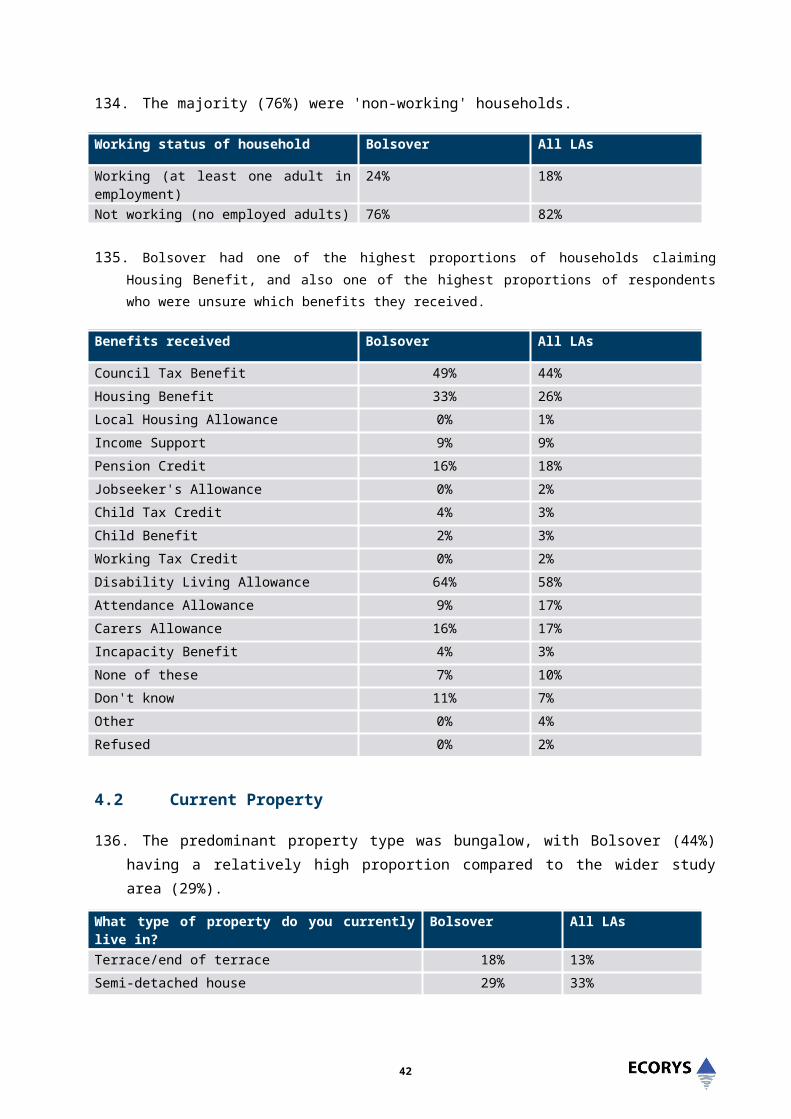
197. On average, 2.7% housing association stock is of wheelchair standard. The rate varies substantially between authorities, with Bolsover having a rate (3,4%) slightly above that across all the authorities (2.7%).
5.7 Letting Data: CORE Returns
198. The CORE (Continuous Recording of Lettings)7 database should record all the lettings made by local authority and housing association landlords, for both general needs and supported accommodation, under a number of headings. Some of these relate to the characteristics of households re-housed, and some to the property that is let. For the purposes of this study, the most relevant fields are those relating to whether there are mobility-related disabilities within the households re-housed; and whether the property has been constructed or adapted to meet the needs of disabled people.
199. We have downloaded raw data for 2009-2010 (the fullest recent year) for all social housing lettings in the fifteen authorities. Data is split between general needs and supported housing lettings, with slightly more detailed information available on supported housing.
200. In 2009-2010, 34 lettings in Bolsover were made to people with some form of mobility or visual related disability, including 28 into supported housing lettings. These figures are put into perspective when we note that there were a total of 483 lettings in Bolsover. Thus, just over 7% of lettings were to those with mobility-related needs.
201. As regards supported housing lettings to those with mobility difficulties, 1% of general needs lettings and 1.5% of supported housing lettings were made into wheelchair standard stock, with a further 92% supported housing lettings into specially adapted stock. This was above average for wheelchair lettings but substantially above average for adapted stock.
5.8 Housing Demand and Lettings
202. A When we compare the demand for mobility-appropriate homes (as expressed via the housing register) with available supply (as expressed in annual CORE lettings), the following pattern emerges:
203. While the weighted average shows that one in ten achieved an appropriate letting, again, wide variation between authorities is illustrated. Some of this is certainly due to definitional ambiguity – for example, the relatively high percentages achieved by Chesterfield and North East Derbyshire are at least in part due to their registers only taking account of older people, or of limited information on those with disabilities.
204. Taking this into account, it is particularly clear that there is substantially excess demand for appropriate accommodation compared to available year-on-year reletting supply. At this
7 https://core.tenantservicesauthority.org/
42

point we do not have details of the numbers of those on the housing register with mobility-related disabilities for Bolsover, so we cannot make this comparison.
5.9 Housing Supply
205. As noted, it is more difficult to estimate the amount of local authority wheelchair and mobility adapted stock. Unlike housing associations, there is no central collection of this data, nor do all local authorities maintain full descriptions of stock. Table 14 below is based on local authority returns, and certainly underestimates the amount of such stock. It may exclude recent adaptations through DFGs (see above).
206. In addition, it should be noted that there is a substantial amount of bungalow and level entrance accommodation earmarked for the elderly and those with mobility difficulties, as well as sheltered housing schemes. For example, in the North Derbyshire and Bassetlaw HMA area, there are over 2300 designated bungalows and low rise flats.
207. It should also be noted that Rushcliffe, Amber Valley, Gedling, Derbyshire Dales and Erewash have undertaken large scale voluntary stock transfers to housing associations, and therefore have no or minimal amounts of local authority stock – their figures should appear in table 13. We do not at this stage have this type of stock data for Bolsover.
5.10 Supporting People Data
208. Data on Supporting People (SP) is only held at the level of Administering Authority . While the cities of Derby and Nottingham are Administering Authorities in their own right (and one can therefore analyse their SP figures separately), the other authorities come under the umbrella of the counties of Derbyshire and Nottinghamshire as their administering authorities, and therefore cannot be disaggregated.
209. Table 15 shows the number of households benefitting from SP services as at 31 December 2010 What is immediately clear is that services for people with physical disabilities, represent a tiny proportion – under 1% - of all commissioned activity funded by SP. We also show figures for the frail elderly client group (also a small sector) and the rather general classification of 'older people with support needs'. This is a substantial group, and undoubtedly will contain people with mobility difficulties – these figures should be looked at in parallel with the demographic data from POPPI and PANSI
5.11 Key points
210. Based on the statistical information available, we are able to derive the following regarding the housing needs of people with physical disabilities in Bolsover.
211. There are significant and increasing numbers of disabled people with housing needs in Bolsover, including older people, working age residents and families with children.
43

212. There is substantial excess demand for appropriate accommodation compared to year on year supply.
213. The information about existing suitable housing stock in all tenures is inadequate and ways to improve information, including from the private sector, should be explored.
214. The over 65 population will increase in the short, medium and long term and the over 85 population will increase in the long term, significantly increasing the need for housing for disabled people.
215. An estimated 2.7% of Bolsover’s social housing stock is of wheelchair standard. However, the understanding of 'wheelchair standard' is not clear. Anecdotally, there a less than five housing association properties which are to full standard suitable for people who use their wheelchairs indoors, as well as out of door. There are currently around 99 households with wheelchair requirements whose needs are not met, a figure increasing to 114 by 2033.
216. A significant number of disabled people will be looking to social housing to meet their needs, although there are still many who may be able to afford to buy a suitable property.
217. Works using 78 Disabled Facilities Grants were carried out in 2009-10..
218. There are very limited to no facilities in supported accommodation (non-elderly) for wheelchair users, and normally communal areas are not fully accessible.
44
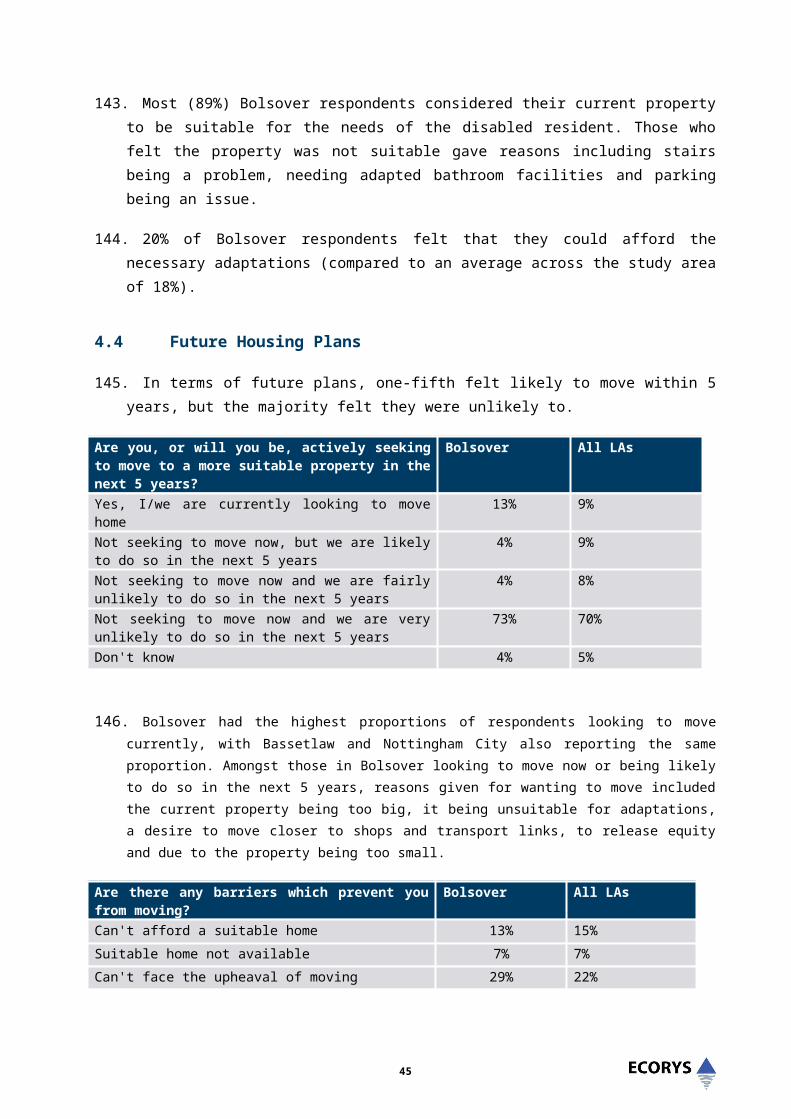
6.0 Future Need and Demand
6.1 Forecasting the Volume of Unmet Need
219. Based on the data collected in Section 5, we can develop a model that helps estimate current needs and forecast future needs and requirements for appropriate accommodation for people with physical mobility disabilities. The model is in part based on that developed by Habinteg and London South Bank University, to whom acknowledgements are given, for estimating housing need among wheelchair users8.
220. Unlike the Habinteg model, this does seek to forecast longer term demand, supply and need. While we have reasonably robust population figures, supply will ultimately be constrained by economic factors. We have therefore factored in conservative approaches to growth, in view of the current and projected long-term fiscal forecasts for public expenditure.
221. Any model cannot claim to be a definitive forecast of what the future may bring. Depending on the inputs, different outputs are available and models can be used to construct scenarios, around which different policy responses can be geared This model is no different, in that it uses two different data sources for underlying needs, one giving a ‘high’ level of need, and one a ‘low’ level of need. The model works as follows:
i. Use either figures for numbers of claimants of High Mobility Rate Disabled Living Allowance (which will give a ‘low’ figure); or combined ONS-based figures from the POPPI and PANSI systems for under 65s unable to work because of a physical condition and over 65s with at least one severe mobility-related problem (which will give a ‘high’ figure).
ii. Project these figures to 2030 by either using ONS projections (for POPPI / PANSI) or historic rate of increase in DLA (Ecorys calculation from 2006-2010 DWP figures)
iii. To calculate numbers of those in unsuitable homes, take 15.9% of them (from SEH figure for number of disabled people saying they were in unsuitable accommodation). This is very close to the figure from the Ecorys survey (15.5%).
iv. Lettings are then taken into account. We have taken 2010 CORE lettings to people with physical disabilities, and applied a straight-line projection (with no increase) across the years. This is to take account of both the low levels of social housing investment and continuing Right to Buy. Where we have data from the 2008-2011 National Affordable Housing Programme, we have up-rated the lettings for 2010 only to take this into account (North East Derbyshire, Derby and Nottingham benefitted). When there is more detail from the 2011-15 programme this can be added, as again a ‘one off’ for the relevant five years.
8 Mind the Step: an estimation of housing need among wheelchair users in England Habinteg Housing Association, 2010
45

v. DFGs are then taken into account. We have based these on 2010 figures. In view of the enhanced allocation for 2011/12, we have enhanced the 2010 - 2015 figure proportionately. However, to take account of the longer term constrains on public spending, we have then reverted to 2010 levels.
vi. We have then built in what we have termed an ‘adjustment for self-help’. This takes account of the fact that there will be a number of households with disabled residents who do have adequate resources to resolve their own housing problems, without recourse to the public or social sectors. Around 57% of respondents to the survey owned their own homes, including 47% owning them outright – implying a significant amount of equity available. Around 18% were planning to move over the next five years, and 42% felt there were no barriers preventing them moving. 37% felt they were able to afford to buy their next home (either outright or with a mortgage – see Figure 18, Appendix E). Assuming that only those in unsuitable homes would have this incentive, we therefore calculated 18% of this figure (percentage planning to move) and then took 37% (those that could afford to buy) of the resulting number. These remaining figures we left to be netted off from those in unmet need.
vii. The last stage is to calculate the unmet need figure. The sum is:
The number of people with physical disabilities in unsuitable accommodation
- minus those that will get a suitable social housing let - minus those that will have needs fully met through DFGs - minus those that can meet their own needs in the market place
= equals unmet need.
222. For Biolsover the figures for people with physical disabilities in unsuitable accommodation with unmet needs are:
High or low estimate of unmet housing need
2010 2015 2020 2025 2030
High estimate: based on ONS population change figures
542 601 656 722 796
Low estimate: based on High Level DLA claims
536 537 537 538 539
46

223. Details of these calculations appear in Tables 16a and 16b in Annex 1, with a summary of the workings for 2015 outlined below:
Low Estimate High Estimate
A. Total under 65s unable to work, plus over 65s with at least one mobility difficulty
4445 4875
B. Number in unsuitable accommodation 707 775
C. Minus Lettings for new supply 34 34D. Minus DFGs delivered 89 89E. Minus those who have income to provide own solutions (self-help): 18% of people wanting to move as 37% of people able to self- help of B.
47 52
Total - people with physical disabilities in unsuitable accommodation with unmet needs as at 2015 (B minus C, minus D, minus E)
537 601
6.2 The Type of Housing Required
6.2.1 Wheelchair Housing
224. As noted in section 5.1.4 we estimate that in Bolsover, in 2013 there are projected to be 990 households with indoor and outdoor wheelchair requirements, of which 10% (99) will not have their needs met. By 2033 these figures will have increased to 1,140 and 114 respectively. Full details of the calculations appear in Table 17 of Annex One.
6.2.2 Adapted and Appropriate Housing
225. Based on the results of the survey (and using cross-authority data as this is more reliable), the key ‘built in’ features that physically disabled residents require in any development programme are level access entrances to homes, and most importantly, level access bathroom and washing facilities. Stair lifts (or through floor lifts) and reserved parking bays are next most important.
226. Bungalows were overwhelmingly the most popular built form (preferred by 75%). 9% favoured flats in small low-rise blocks, and 8% preferred semi-detached houses. Although 85% of respondents lived alone or in two-person households, there was a strong demand for larger than one-bed accommodation:
Size of accommodation required 1 bed 2 bed 3 bed 4 bed +
% requiring size 24% 62% 12% 1%
47
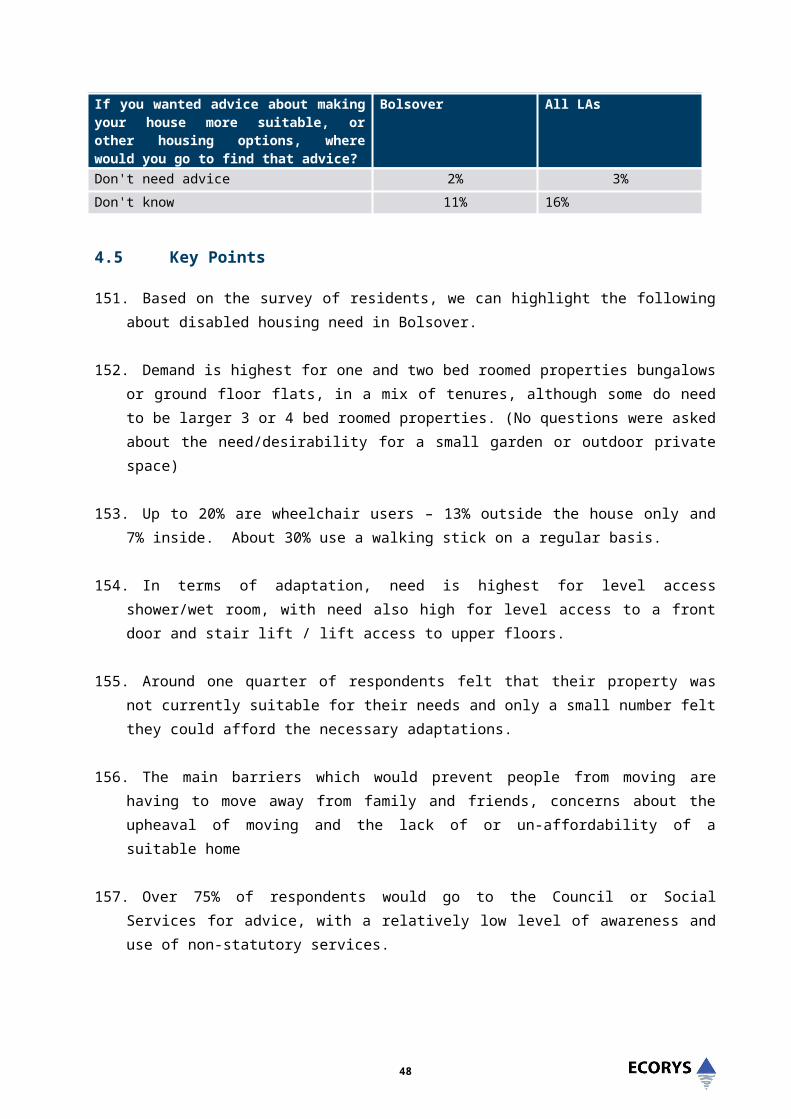
227. This requirement for larger homes was apparent across the age groups as well, including among households with very old members:
Size of accommodation required 1 bed 2 bed 3 bed 4 bed D/K
Households with 75 years+ resident (s) 30% 55% 4% 1% 11%Households with 60+ residents (no 75+) 17% 59% 13% - 11%Households with only under 60s residents
9% 49% 32% 6% 5%
6.3 Programmes to Meet Need
228. As noted, the figures in section 6.1 take account of those housing needs that could be met in situ, or by households making their own arrangements in the private sector. The brief for this study requires some estimates for potential programmes for new supply, to help meet the outstanding unmet need that has been identified. We have attempted to so below, but there are some important assumptions and considerations that need noting:
229. We cannot pre-judge how individual authorities will or should balance the housing needs of people with physical mobility disabilities against those with other forms of disability, or in other forms of housing stress – homelessness, overcrowding, poor conditions, un-affordability and the like. This prioritisation is a matter for local democratic processes, not consultants. The figures should therefore be treated as the answer to the question ‘if we were to attempt to address unmet disabled housing need in its entirety, year on year, what new supply is required?’.
230. The figures in the tables below represent programmes based on needs identified for the year 2015 (or 2013 for wheelchair accommodation), as this seemed more sensible than looking back to 2010 or to the next few years. Future programmes would be predicated on the rate at which the backlog need is tackled in the first programme, as additional need comes over the demographic horizon. The percentages in the table can be easily applied to future years’ needs figures, after netting off the additional supply that may come through. To reflect the two sets of ‘high’ and ‘low’ needs figures we have derived, we provide two programmes with greater and lesser requirements.
231. The majority of the programmes we illustrate are focussed on the affordable housing sector, and in particular the affordable rented sector (under 2% of survey respondents were interested in intermediate products, and under 6% in the private rented sectors). As noted earlier, around a third of the 18% planning to move could conceivably buy (or rent) their next home, and we netted these off from the ‘in needs’ calculation.
232. However, the brief requires that we look to the capacity of the private sector to meet needs. The sector is primarily market and planning-driven (in terms of new developments) and we cannot predict the future of the specialist sector in the current economic climate. The prime developer of retirement accommodation, McCarthy and Stone notes a significant pent up demand for this form of accommodation, but a scarcity of developers in the
48

market, citing planning problems, lack of support infrastructure, and high overheads as barriers9.
233. Taking the survey results which indicate 37% of disabled residents able to afford their own home, it could be expected that private sector would meet the same proportion of unmet need, i.e. 222 units of the high estimate and 198 units of the low estimate.
234. Traditionally, the funding of social sector schemes involving new or refurbished housing for people with disabilities has been reliant on capital grant, now Affordable Housing Programme and its previously its predecessors, sometimes augmented by one-off programmes from the Department of Health and the Department of Work and Pensions.. However the new funding arrangements, the redefinition of ‘affordable’, changes to housing benefit and the introduction of Universal Credit, and the shortage of public sector investment during this round at least of the Spending Review cycle means authorities and housing associations need to look further afield for resources, including considering schemes that have no grant element. Some areas for exploration include:
Opportunities under the localism legislation for community assets to be remodelled for disabled peoples’ resources.
Accessing New Homes Bonus and focussing this on disability-appropriate accommodation; using second home Council Tax for this purpose.
Working with the private sector (perhaps through use of local authority land assets) to tap into potential private demand for high quality disabled appropriate accommodation.
Further exploration with housing associations and developers of the focussed use of S 106 resources and zero grant developments.
235. Finally, enhanced development programmes on their own will be inadequate to meet the needs of people with disabilities. A combined approach involving most efficient use of existing social and private sector stock, enhanced support services designed to keep people with disabilities in their own homes, better targeting of allocations of social housing stock, and focussed use of Disabled Facilities Grant are all required alongside the development of new homes.
236. Our assumptions about property size, type and tenure for the programmes are based on the following:
Bungalows, houses and flats: based on the views of disabled residents wanting to move, there is overwhelming preference for bungalows as the favourite built form. We have reflected this in the 75% recommendation, but we have increased the proportion of flats to 20% (and reduced houses to 5%) in recognition of the need to stretch grant in the current era of low public expenditure.
9 National Planning Policy Framework – consultation response, McCarthy and Stone, 2011
49

Bedroom numbers split: as noted, although the large majority of respondents were one and two person households, reflecting the elderly profile of the group, there was a strong demand (over 60%) for two bedroom homes – sensible for carers, those with visiting families or those with special equipment needs. However, we need to flag up a warning that measures to provide notionally over-large accommodation for these households may possibly lead to problems with Housing Benefit entitlement, under the ‘under-occupation’ accommodation rules that have been introduced.
Households with children: we have also taken account of the fact that there is evidence of a smaller but still significant group of households with children (who themselves may have physical disabilities) needing larger accommodation. The most reliable source of local data on children with disabilities is probably the local authority Special Educational Needs assessment data, which represents returns from actual assessments rather than survey responses (such as the Children in Need Survey). The proportion of children with SEN assessments for physical / mobility disabilities as a proportion of those with unmet disability-related housing needs ranges between 10% (high needs) and 20% (low needs); we therefore feel this figures of 15% three bed or larger homes matches this well, in addition to echoing the numbers in our survey needing larger homes.
Wheelchair requirements: the profile and aspirations of those using wheelchairs needing to move was very similar to that of others with disabilities. The one difference was that around 10% expected to move into some form of supported housing (under 5% of others wanted this), so we have reflected this in their programme.
New housing – High needs assessment for 2015
Size of accommodation required 1 bed 2 bed 3+ bed
Bungalows 112 271 68Flats 30 72 18Houses 7 18 5Total 149 361 91
New housing – Low needs assessment for 2015
Size of accommodation required 1 bed 2 bed 3+ bed
Bungalows 101 242 59Flats 26 65 17Houses 6 17 4Total 133 324 80
237. We estimate that there are 147 households with wheelchair users whose needs will not be met as of 2013, as set out below. This figure increases to 171 by 2033.
Wheelchair accessible provision (within new housing as above) to 2013
50

Size of accommodation required 1 bed 2 bed 3+ bed
Bungalows 19 45 10Flats 2 6 2Houses 2 2 2Supported 2 6 1Total 25 59 15
238. Applying the proportion of people able to afford their own home of 37%, we estimate that private sector provision should be 94 units for the low estimate scenario and 310 units for the high estimate scenario, with the with the majority of market properties to be developed being two-bedroomed bungalows (or acceptable provision made via ground floor flats).
239. Therefore, we estimate that 63% of the units should be Affordable housing. These could be Social Rented, and/or other rented tenures such as Affordable Rented, dependent on local affordability issues and funding restrictions.
240. Shared Ownership or shared equity properties may fall into the “private sector provision” percentage, or the affordable housing provision percentage – depending on the percentage share bought and other local market conditions.
6.4 Key Points
241. This section helps us to understand the immediate and future shortfall in suitable accommodation in terms of numbers and property types. It also provides evidence to support relevant planning policies, strategic documents and funding bids:
242. Based on projections for 2015, estimates of the number of people with physical disabilities in unsuitable accommodation with unmet needs range from 537 to 601. This range rises by 2030: ranging from 539 to 796. Of these, we estimate that:
- 37% would be able to afford to buy a suitable new home and access private sector provision
- 63% would need Affordable housing - Social Rented, and/or other rented tenures such as Affordable Rented – dependent on local affordability issues and funding restrictions.
- Shared Ownership or shared equity properties may fall into the “private sector provision”, or the affordable housing provision– depending on the percentage share bought and other local market conditions.
- 99 people would need fully wheelchair accessible provision in 2013, in the private sector and/or affordable provision (ranging in estimates of 17% to 58% of those in unsuitable accommodation with unmet needs for 2015)
51

243. Private Sector Provision being developed to meet the needs of disabled households should be mainly two-bedroomed bungalows. Affordable housing to meet the needs of disabled housing should be mainly two-bedroomed bungalows or flats, although provision also needs to be made for one-bedroomed and larger properties. It is not assessed here, whether/how the demands of people wanting a bungalow ideally, might be met through suitable, well-designed ground floor flats, although this may be necessary to consider in the light of financial constraints.
244. We have also made some estimates of the size and type of programme that could be introduced to meet these needs. The figures are based on 2015 projected needs, and if the programme was implemented it would clear the backlog of need in its entirety. The local authority would have to balance the actual size and shape of this programme with those responding to other priority housing requirements
52

7.0 Conclusions and Recommendations
245. There are an increasing number of people with physical disabilities in the borough, who need homes and facilities to meet their needs.
246. A Housing Needs survey completed in 2003 identified 4,897 households with a disabled member (15.8% of all households). All ‘special needs’ groups are otherwise combined, but generally 40% of all social housing tenants were considered to have a special need, including frail older people, compared to fewer than 10% owner-occupiers with a mortgage.
247. Derbyshire County Council has assessed the need for adaptations over the five years from 2010 to 2014. The majority of adaptations are provided for people over 65 years old and Bolsover’s population over 65 years will increase from 13,600 to 15,100 over that time.
248. The factors that affect demand from disabled households for housing may change in the future due to a number of factors, including: the economic downturn;. the condition of private rented sector housing; welfare reform and potential under-occupation; health service changes, the ageing population;. disabled children and adults surviving longer
249. By 2015 it is estimated that between 707 and 775 households in the district with a disabled member, will be in unsuitable accommodation, and will require measures to be able to remain in their home or move to a suitable property. The high estimates of these indicate that by 2030, these will have increased to 985.
250. The capacity of existing provision to meet these needs, is limited by constraints on public spending, the suitability of existing homes, the affordability of suitable properties, and the increasing demand from increasing numbers of disabled people for the resources available.
251. Whilst many people would like to remain in their existing homes, only about 70 Disabled Facilities Grants have been historically delivered annually, and this may not be sustainable in the future. For those able and willing to move to the social rented sector, there are limited lettings available each year, and many of these will not meet the aspirations and demands of disabled people, or are not suitable to fully accommodate their disabilities.
252. A small proportion of the households will be able to pay for suitable adaptations themselves, or are able to find and afford an alternative property which meets their needs. However, there is an undersupply of accommodation of different types and sizes and tenures available to meet the needs of people with physical disabilities.
253. Planning policies and emerging strategic documents to require the development of new housing to meet the needs of people with physical disabilities have not yet been implemented. Private sector provision is restrained by market forces, although there
53

is new provision (albeit very low numbers) being made in affordable housing through s106 planning agreements.
254. Local and county-wide services to meet the needs of disabled people in Bolsover include; advice and information; repairs; improvements and safety measures; disabled facilities grants; housing-related support and choice based lettings scheme.. Whilst many of these services seem to be valued and effective in most aspects, there are some gaps in provision, and some changes could be considered which would improve the services.
255. There are a number of factors which many disabled people want from their homes, whether in their existing home, or by moving. These include: - ground floor accommodation or stair lifts or through floor lifts to access upper floors; level access to a walk-in shower or wet room; level access to the front door.
256. Those considering a house-move mainly indicate a demand for bungalows, although consideration may need to be given to whether/how well these demands could be met through suitable, well-designed ground floor flats, or adapted houses such as those meeting lifetime homes standards. Being near to friends and family is a major consideration for many. Any new provision of homes being considered should be mainly two-bedroomed, although there is also a need for one-bedroomed, and larger homes.
257. A shortfall in the provision of suitable properties has therefore been identified, showing that there is unmet need which could potentially be met by the provision of new homes.
258. The estimates of this need is for 537 to 601 new homes to meet the needs of people with physical disabilities as at 2015, increasing to up to 796 by 2030. These estimates are broken down further in the study into property type, size of property, and those needed to be fully wheelchair accessible.
259. Private sector provision can be expected to address part of the unmet need, with the rest met through the affordable housing sector.
260. 37% would be able to afford to buy a suitable new home and access private sector provision. Based on low and high estimates for 2015, this equates to 198 to 222 people.
261. 63% (ranging in estimates from for 2015) would need Affordable housing - Social Rented, and/or other rented tenures such as Affordable Rented – dependent on local affordability issues and funding restrictions. Based on low and high estimates for 2015, this equates to 339 to 378 people
262. Shared Ownership or shared equity properties may fall into the “private sector provision”, or the affordable housing provision – depending on the percentage share bought and other local market conditions.
54

7.1 Recommendations
263. The table below sets out recommendations for Bolsover, which have been drawn from the information and conclusions from this report. These are looked at in more detail in Annex 3.
264. A number of more general recommendations are also set out, addressing gaps identified in the wider study area. These recommendations are looked into in more detail Annex 3, with Good Practice examples in Annex 4.
Specific Recommendations for Bolsover Details
A. Scrutinise allocation activity
Ensure that adapted and wheelchair homes are not let to those who do not need them; and that they are let to those who do, including letting of over 60s accommodation to younger disabled people.Process analysis, and changes in policy (for example, holding a pool of void suitable properties).Consider extending use of choice based lettings system and development of accessible housing registers.
B. Draw up and update database of all affordable housing adapted / wheelchair stock.
Keep records of private sector stock that has benefitted from DFGs. Agreement between social landlords and DFG administrators.Consider extending use of choice based lettings system and development of accessible housing registers – including private sector landlords.
C. Review preventative policy in conjunction with adult services and health agencies
Consider tri-partite resourcing arrangements.To include explicit agreement of who should pay for adaptations or transfer to appropriate accommodation.Link policy to clear preventative rationale.
D. Introduce a residential design Supplementary Planning Document
Where not already in progress, introduce a residential design SPD that states where adaptable/ accessible/ wheelchair standard homes will be required (as a quota or by reference to a site design guide) and what is meant by accessible or adaptable. Ensure that developers are clear about what is expected of them in any proposed development, address concerns about financial viability or practical difficulties and consider any additional funding available to ensure viability and deliverability.
E. Implement existing planning policy around 'Special Needs Housing'
Include Lifetime Homes and Wheelchair properties.Include negotiations with developers.Use evidence in this report to implement policy.
F. Develop ‘one-stop shop’ approach for services for people with disabilities
Could involve improved referral and co-ordination or replacement / integration of services.Internal negotiations within authority, and with County and housing associations.
55

Specific Recommendations for Bolsover Details
G. Overcome barriers which discourage people moving to a more suitable property
Address concerns about the upheaval of moving, provide help with planning and moving, including advocacy through One Stop Shop service to explain and discuss all housing options and offer a range of tenure options; home ownership/shared ownership/social rent/affordable rent.
H. Address Specific Rural / Urban and Black and Minority Ethnic group Equalities Issues where they exist.
No specific issues have been noted in this study, but such issues should be considered when developing new homes and services, and in monitoring existing provision.
General Recommendation Details
I. Raise Awareness Raise awareness of the housing needs and aspirations of disabled adults and children and promote joint agency / partnership working
J. Ensure housing needs assessments highlight the needs of disabled people
Ensure that housing needs assessments and strategic housing market assessments distinguish customer characteristics that influence design in new homes and the need for adaptations of existing homes.
K. Promote preventative and early intervention investment
Promote preventative and early intervention investment, so that benefitting agencies (in particular health and social care) understand the value for money of investment.
L. Further Develop Home Improvement Agency
Further develop the Home Improvement Agency and a system of recycling adaptations – stair lifts in particular Work with HIAs to explore additional funding possibilities e.g. extending menu of services for self funders; social care and health investment Work with HIAs and ICES services locally to explore demand and opportunity
M. Introduce more comprehensive stock condition survey and recording systems.
Record nature of adaptation and level (e.g LHS, wheelchair etc) Record nature of adaptation and level (e.g. LHS, wheelchair etc) jointly with provider partners.
N. Agree a protocol for adaptations.
Agree a protocol for adaptations to homes across tenure, so that resources are more effectively used to meet the needs of more disabled people.
O. Ensure private sector / developer obligations are enforced
Ensure private sector / developer obligations are enforced in a co-ordinated way across the study area.
Identify opportunities to bring together OT, housing and Planning expertise, plus local disabled people and representatives in development of a design guide.
Engage OTs in detailing key features required to improve adaptability of new homes. Use this together with site design guides to ensure that both developers
56

General Recommendation Details
and development control understand what you require and S106 agreements to deliver these. Take specific design requirements into account in determining site viability.
P. Use publically owned land to meet needs
Agree a partnership approach to how publically owned land can be used to improve the viability of homes that are designed specifically for the needs of disabled people,
These are further expanded upon in Annex 3 and with Good Practice examples in Annex 4.
57

Glossary
BAME Black and Asian Minority Ethnic CORE Continuous Recording of LettingsDCLG Department of Communities and Local GovernmentDFG Disabled Facilities GrantDH Department of HealthDLA Disabled Living AllowanceDWP Department for Work and PensionsEAC Elderly Accommodation CouncilEIA Equalities Impact AssessmentHCA Homes and Communities AgencyHIA Home Improvement AgenciesHOLD Home Ownership for People with Long Term Disabilities ProgrammeHOPS Housing Options for Older PeopleLDD Local Development DocumentONS Office of National StatisticsPANSI Projecting Advisory Needs and Services InformationPOPIS Protecting Older People Information SystemRSL Registered Social LandlordSEH Survey of English HousingSEN Special Educational NeedsSHMA Strategic Housing Market AssessmentSLA Service Level AgreementSP Supporting PeopleSPD Supplementary Planning Document
58

Annex 1: Charts and Tables
A1

Chart 1 Overall percentage population increase 2010-2015
Overall percentage population increase 2010-2015
0 1 2 3 4 5 6 7
South Derbys hi reNotti ngham UA
Derby UA Rus hcl iffeBroxtoweAshfi eldAVERAGE
Amber Val leyGedl ing
High PeakBols over
Chesterfi eldBa s setlawNorth Ea st
Erewas hDerbyshire
Chart 2 Overall percentage population increase 2010-2030
Overall percentage population increase 2010-2030
0 5 10 15 20 25
South DerbyshireNottingham UA
RushcliffeBroxtow eDerby UA
AshfieldGedling
AVERAGEAmber Valley
High PeakBolsover
BassetlawChesterf ield
Erew ashNorth East Derbyshire
Derbyshire Dales
A2

Chart 3 Percentage loss of working age population 2010-2030
Percentage loss of working age population 2010-2030
0 2 4 6 8 10 12 14 16
Derbyshire DalesBassetlaw
Amber ValleyHigh Peak
North East DerbyshireChesterfield
BolsoverSouth Derbyshire
ErewashAshfield
RushcliffeAVERAGE
GedlingBroxtoweDerby UA
Nottingham UA
Chart 4 Percentage increase in 85+ population 2010-2015
Percentage increase in 85+ population 2010-2015
0 5 10 15 20 25
Rus hcl iffeAmber Val ley
Bas setlawDerbys hire Dales
Gedl ingHigh Peak
North Eas t Derbyshi reSouth Derbyshi re
Derby UA As hfi eld
BroxtoweAVERAGE
Chesterfi eldErewas hBolsover
Notti ngham UA
Chart 5 85+ residents as proportion of population
A3

85+ residents as proportion of population
0 1 2 3 4 5 6 7
Nottingham UA
Derby UA
South Derbyshire
Broxtowe
AVERAGE
Ashfield
Bolsover
Gedling
Rushcliffe
Erewash
Chesterfield
High Peak
Amber Valley
Bassetlaw
North East Derbyshire
Derbyshire Dales
2030%
2010%
Chart 6 Annual rate of increase in over 85 population, 2010-2030
Chart 7 Percentage increase in 65+ population unable to manage at least one mobility-related activity 2010-2015
A4

Percentage increase in 65+ population unable to manage at least one mobility-related activity 2010-2015
0 5 10 15 20 25
BassetlawHigh Peak
South DerbyshireN E Derbyshire
Derbyshire DalesGedling
Rushcl iffeBolsover
Amber ValleyBroxtowe
AshfieldAVERAGEErewash
ChesterfieldDerby UA
Nottingham UA
Chart 8 Percentage increase in 65+ population unable to manage at least one mobility-related activity 2010-2030
Percentage increase in 65+ population unable to manage at least one mobility-related activity 2010-2030
0 20 40 60 80 100 120
South DerbyshireBassetlawHigh Peak
Derbyshire DalesAmber Valley
N E DerbyshireAshfield
RushcliffeBolsoverErewashAVERAGE
ChesterfieldGedling
BroxtoweDerby UA
Nottingham UA
Chart 9 Percentage increase in 75+ population with registerable visual condition 2010-2015
A5

Percentage increase in 75+ population with registerable visual condition 2010-2015
-5 0 5 10 15 20
BassetlawAshfield
North East DerbyshireSouth DerbyshireDerbyshire Dales
Amber ValleyGedling
RushcliffeErewash
High PeakBroxtoweAVERAGEBolsover
ChesterfieldDerby UA
Nottingham UA
Chart 10 Percentage increase in 75+ population with registerable visual condition 2010-2030
Percentage increase in 75+ population with registerable visual condition 2010-2030
0 20 40 60 80 100 120
South DerbyshireBassetlaw
Amber ValleyDerbyshire Dales
High PeakAshfield
North East DerbyshireRushcliffe
ErewashBolsover
ChesterfieldAVERAGE
GedlingBroxtoweDerby UA
Nottingham UA
A6

Chart 11 Percentage increase in 65+ population with limiting long-term illness 2010-2015
Percentage increase in 65+ population with limiting long-term illness 2010-2015
0 5 10 15 20 25
South DerbyshireAmber Valley
BassetlawDerbyshire Dales
High PeakNorth East
AshfieldRushcliffe
ErewashGedling
BolsoverAVERAGE
BroxtoweChesterfield
Derby UA Nottingham UA
Chart 12 Percentage increase in 65+ population with limiting long-term illness 2010-2030
Percentage increase in 65+ population with limiting long-term illness 2010-2030
0 10 20 30 40 50 60 70 80 90
South DerbyshireHigh Peak
Amber ValleyBassetlaw
Derbyshire DalesRushcliffe
AshfieldBolsover
ChesterfieldNorth East
ErewashAVERAGE
GedlingBroxtoweDerby UA
Nottingham UA
Chart 13 Percentage increase in 65+ population with heart-related health condition 2010-2015
Percentage increase in 65+ population with heart-related health condition 2010-2015
0 5 10 15 20 25
South DerbyshireBassetlawHigh Peak
Amber Val leyDerbyshire Dales
North EastRushcliffe
BolsoverGedling
AshfieldBroxtoweAVERAGEErewash
ChesterfieldDerby UA
Nottingham UA
A7
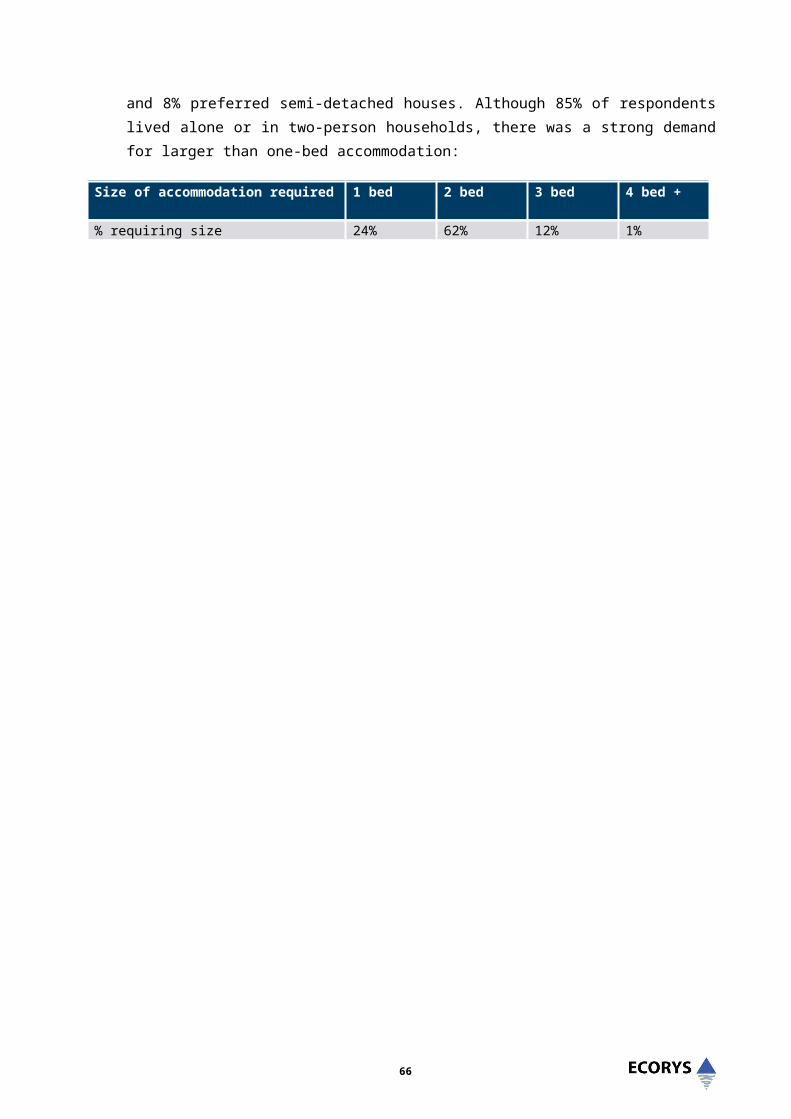
Chart 14 Percentage increase in 65+ population with heart-related health condition 2010-2030
Percentage increase in 65+ population with heart-related health condition 2010-2030
0 10 20 30 40 50 60 70 80 90
South DerbyshireHigh PeakBassetlaw
Amber ValleyRushcliffe
Derbyshire DalesAshfield
BolsoverNorth East Derbyshire
ChesterfieldAVERAGEErewashGedl ing
BroxtoweDerby UA
Nottingham UA
Chart 15 Percentage increase in 65+ population with stroke-related health condition 2010-2015
Percentage increase in 65+ population with stroke-related health condition 2010-2015
0 5 10 15 20 25
South DerbyshireBassetlawHigh Peak
Amber ValleyDerbyshire Dales
North EastRushcliffe
BolsoverGedling
AshfieldErewashAVERAGE
BroxtoweChesterfield
Derby UA Nottingham UA
Chart 16 Percentage increase in 65+ population with stroke-related health condition 2010-2030
Percentage increase in 65+ population with stroke-related health condition 2010-2030
0 20 40 60 80 100
South DerbyshireHigh PeakBassetlaw
Amber Val leyDerbyshire Dales
RushcliffeAshfield
BolsoverNorth East Derbyshire
AVERAGEChesterfield
ErewashGedling
BroxtoweDerby UA
Nottingham UA
A8

Chart 17 Percentage increase in 65+ population to have bladder problem 2010-2015
Percentage increase in 65+ population predicted to have bladder problem 2010-2015
0 5 10 15 20 25
South DerbyshireBassetlawHigh Peak
North East DerbyshireDerbyshire Dales
Amber ValleyRushcl iffe
BolsoverGedling
AshfieldBroxtoweAVERAGEErewash
ChesterfieldDerby UA
Nottingham UA
Chart 18 Percentage increase in 65+ population predicted to have bladder problem 2010-2030
Percentage increase in 65+ population predicted to have bladder problem 2010-2030
0 20 40 60 80 100
South DerbyshireHigh PeakBassetlaw
Amber ValleyDerbyshire Dales
RushcliffeAshfield
BolsoverNorth East Derbyshire
AVERAGEErewash
ChesterfieldGedling
BroxtoweDerby UA
Nottingham UA
Chart 19 Percentage change 18-64 population with moderate and severe physical disabilities 2010-2030
A9
Percentage change 18-64 population with moderate and severe physical disabilities 2010-2030
-10 -5 0 5 10 15 20 25
Nottingham UASouth Derbyshire
Derby UA Broxtowe
AshfieldAVERAGE
RushcliffeBolsover
GedlingAmber Valley
ErewashHigh Peak
ChesterfieldBassetlaw
North East DerbyshireDerbyshire Dales
Chart 20 Percentage change 18-64 population unable to work because of serious physical disability 2010-2030
Percentage change 18-64 population unable to work because of serious physical disability 2010-2030
-10 -5 0 5 10 15 20 25
Nottingham UASouth Derbyshire
Derby UA Broxtowe
AshfieldAVERAGE
Rushcl iffeGedling
Amber ValleyBolsoverErewash
High PeakChesterfield
BassetlawNorth East Derbyshire
Derbyshire Dales
Chart 21 Percentage change 18-64 population with serious visual impairment 2010-2030
Percentage change 18-64 population with serious visual impairment 2010-2030
-10 -5 0 5 10 15 20
Nottingham UADerby UA Broxtowe
South DerbyshireGedl ing
RushcliffeAVERAGEAshfield
High PeakErewash
Amber ValleyBolsover
ChesterfieldBassetlaw
North East DerbyshireDerbyshire Dales
Chart 22 Percentage change 18-64 population with predicted to have type 1 or 2 diabetes 2010-2030
A10

Percentage change 18-64 population with predicted to have type 1 or 2 diabetes 2010-2030
-10 -5 0 5 10 15 20 25
Nottingham UASouth Derbyshire
Derby UA Broxtowe
AshfieldAVERAGE
RushcliffeBolsover
Amber ValleyGedling
ErewashHigh Peak
ChesterfieldBassetlaw
North East DerbyshireDerbyshire Dales
Chart 23 Percentage change 18-64 population with predicted to have disability because of stroke 2010-2030
Percentage change 18-64 population with predicted to have disability because of stroke 2010-2030
-10 -5 0 5 10 15 20 25
Nottingham UASouth Derbyshire
Derby UA Broxtowe
AshfieldAVERAGE
RushcliffeAmber Valley
BolsoverErewashGedling
BassetlawHigh Peak
ChesterfieldNorth East Derbyshire
Derbyshire Dales
Chart 24 Percentage population claiming higher level DLA 2010
A11

Percentage population claiming Higher Level DLA 2010
0.000 1.000 2.000 3.000 4.000 5.000 6.000 7.000
Rushcl iffe Derbyshire Dales
High Peak South Derbyshire
Broxtowe Gedling
Erewash Derby City
Amber ValleyAVERAGE
Nottingham Ashfield
North East Derbyshire Bassetlaw
Chesterfield Bolsover
Chart 25 Percentage increase projected in higher level DLA claimants 2010-2030
Percentage increase projected in Higher Level DLA claimants 2010 - 2030
0 5 10 15 20 25
South Derbyshire Nottingham
Rushcliffe Broxtowe
Derby City Ashfield Gedling
AVERAGEAmber Valley
High Peak Bolsover
Bassetlaw Chesterfield
Erewash North East Derbyshire
Derbyshire Dales
Chart 26 Percentage increase projected in higher level DLA claimants as proportion of population 2030
A12

Percentage increase projected in Higher Level DLA claimants as proportion of population 2030
0 1 2 3 4 5 6 7
Bolsover Chesterfield
Bassetlaw North East
Ashfield Nottingham
AVERAGEAmber Valley
Derby City Erewash Gedling
Broxtowe South Derbyshire
High Peak Derbyshire Dales
Rushcliffe
Chart 27 Disabled facilities grants delivered and planned 2004-2010
Disabled Facilities Grants delivered and planned 2004-2010
0 200 400 600 800 1000 1200 1400 1600 1800
Derbyshire DalesHigh Peak
AshfieldBroxtowe
N E DerbyshireChesterfield
BolsoverRushcliffe
South DerbyshireBassetlaw
GedlingErewash
Derby UA Nottingham UA
Amber Val ley
2004/5 outturn 2005/06 outturn2006/07 outturn 2007/08 outturn2008/09 planned 2009/10 planned
Chart 28 Average cost per mandatory DFG, 2004/4 and 2009/10
A13

Average cost per mandatory DFG, 2004/5 and 2009/10
0
2000
4000
6000
8000
10000
12000
14000
16000
18000
20000
2004/05
2009/10
Chart 29 Children assesses as having SEN through physical disability
Children assessed as having SEN through physical disability
0 50 100 150 200 250
Nottingham Derby City
AVERAGEAshfield
Chesterfield Amber Valley
Bassetlaw North EastHigh Peak Rushcliffe
Bolsover Derbyshire Dales
Gedling Erewash
South Derbyshire Broxtowe
A14

Chart 30 Percentage SEN pupils with physical mobility-related disability
Percentage SEN pupils with physical mobility-related disability
0 2 4 6 8 10 12
Ashfield Rushcl iffe
Derbyshire Dales Bassetlaw Derby City
Chesterfield Broxtowe
High Peak AVERAGEGedling
North East Derbyshire Nottingham
Amber Val leySouth Derbyshire
Erewash Bolsover
Chart 31 Children in need with mobility, hand and visual problems
Children in need with mobility, hand and visual problems
0 20 40 60 80 100 120 140 160 180 200
Nottingham Derby City High Peak
Erewash Amber ValleyChesterfield
North East Derbyshire AVERAGE
Derbyshire Dales South Derbyshire
Bolsover Ashfield
Bassetlaw Broxtowe
Rushcliffe Gedling
A15

Chart 32 Council tax exemptions, disregards and discounts because of disability
Council Tax exemptions
0
100
200
300
400
500
600
700
Reductions for disabilities Exempt because in care home / doing caring
A16

Chart 33 Percentage physically disabled residents on housing register
Percentage physically disabled residents on housing register
0.0 5.0 10.0 15.0 20.0 25.0 30.0 35.0 40.0 45.0
BolsoverChesterfield
DerbyAshfield
NE Derbyshire*BroxtoweHigh Peak
AVERAGENottingham City
RushcliffeGedling
Derbyshire DalesBassetlaw
South DerbyshireAmber Val ley
Erewash
Chart 34 Total on housing register 2010
Total on housing register 2010
0 2000 4000 6000 8000 10000 12000
Rushcl iffeSouth Derbyshire
GedlingNE Derbyshire*
ErewashAmber Valley
Derbyshire DalesBroxtoweBolsover
ChesterfieldAVERAGE
High PeakBassetlaw
AshfieldDerby
Nottingham City
A17

Chart 35 Percentage lettings to people on the register with mobility disabilities 2010
Percentage lettings to people on the register with mobility disabilities 2010
0.0 10.0 20.0 30.0 40.0 50.0 60.0 70.0 80.0
BolsoverChesterfield
DerbyAshfield
NE Derbyshire*Broxtowe
High PeakAVERAGE
Nottingham CityRushcliffe
GedlingDerbyshire Dales
BassetlawSouth Derbyshire
Amber ValleyErewash
% disabled on register % lettings to mobility disabled people
A18

Chart 36: Proportion of respondents needing a level access shower/wet room
Chart 37: Proportion of respondents needing level access to their front door
A19
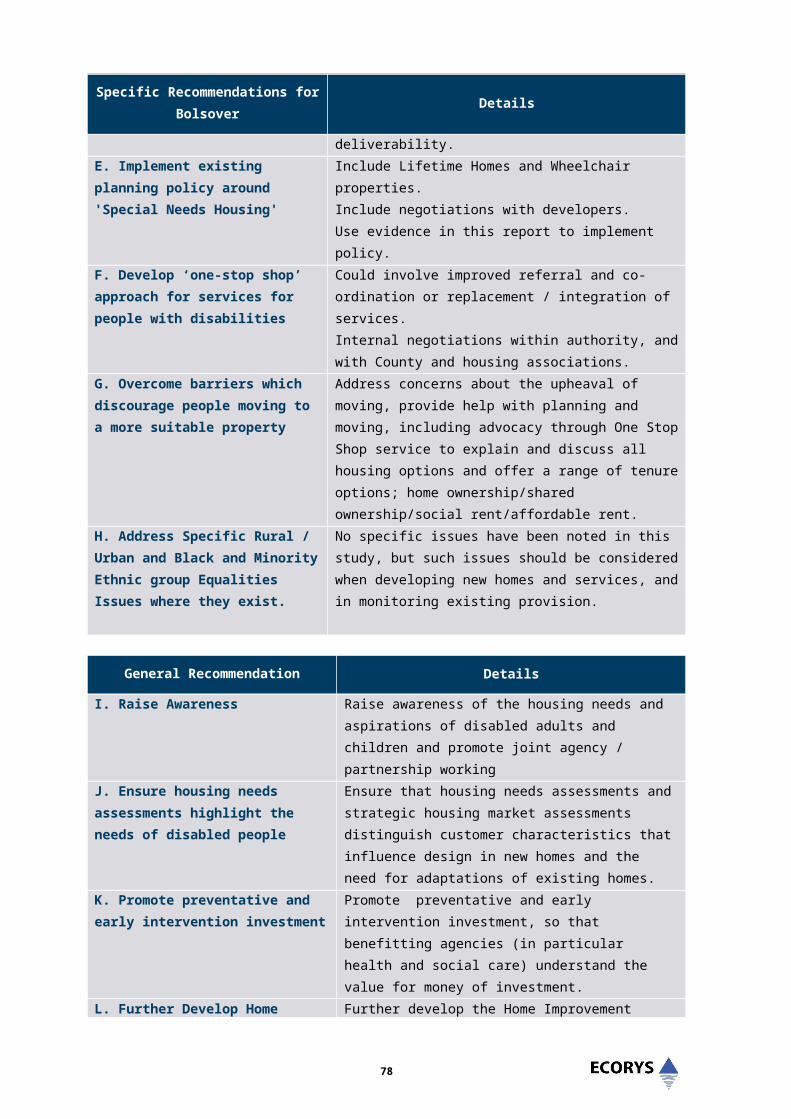
Base: All respondents (678)
A20

Table A.1 Population change by authority, 2010-2015
2010 2011 2012 2013 2014 2015
change 2010-2015
% change 2010-2015 2010 2011 2012 2013 2014 2015
change 2010-2015
% change 2010-2015
Amber Valley 99,500 99,500 99,200 98,900 99,000 98,900 -600 -0.60 22,600 23,200 24,300 25,300 26,000 26,900 4,300 19.0Ashfield 97,000 97,100 97,300 97,400 97,600 98,000 1,000 1.03 20,300 21,000 21,600 22,400 23,100 23,600 3,300 16.3Bassetlaw 91,200 90,900 90,400 90,100 89,800 89,700 -1,500 -1.66 20,900 21,600 22,500 23,300 24,100 24,700 3,800 18.2Bolsover 61,300 61,300 61,200 61,000 61,200 61,200 -100 -0.16 13,600 13,900 14,400 14,900 15,100 15,500 1,900 14.0Broxtowe 92,900 93,400 93,600 93,800 94,300 94,800 1,900 2.03 19,700 20,100 20,800 21,500 22,000 22,400 2,700 13.7Chesterfield 82,400 82,500 82,300 82,000 81,700 82,000 -400 -0.49 18,900 19,200 19,800 20,500 21,200 21,400 2,500 13.2Derby UA 208,700 210,300 211,400 212,800 214,300 215,700 7,000 3.31 38,600 39,000 40,000 40,800 41,300 42,000 3,400 8.8Derbyshire Dales 54,700 54,200 53,800 53,400 53,000 52,900 -1,800 -3.35 15,500 16,100 16,700 17,300 17,900 18,300 2,800 18.1Erewash 91,200 91,000 90,500 90,300 90,100 90,100 -1,100 -1.22 19,700 20,200 21,000 21,600 22,200 22,600 2,900 14.7Gedling 91,900 91,900 91,800 91,700 91,900 92,300 400 0.44 21,300 21,800 22,600 23,300 23,900 24,300 3,000 14.1High Peak 77,000 77,000 76,800 76,800 76,600 76,900 -100 -0.13 16,000 16,500 17,200 17,800 18,500 18,800 2,800 17.5North East Derbyshire 77,900 77,600 77,100 76,800 76,500 76,300 -1,600 -2.08 20,500 21,100 21,900 22,600 23,200 23,900 3,400 16.6Nottingham UA 271,600 276,100 279,600 282,700 285,800 288,600 17,000 6.08 34,500 34,300 34,600 34,900 35,000 35,300 800 2.3Rushcliffe 92,600 92,800 92,900 93,100 93,300 93,900 1,300 1.40 19,900 20,600 21,400 22,100 22,800 23,200 3,300 16.6South Derbyshire 79,300 79,900 80,300 80,700 81,100 81,700 2,400 2.99 14,600 15,100 15,800 16,500 17,200 17,700 3,100 21.2TOTAL 1,569,200 1,575,500 1,578,200 1,581,500 1,586,200 1,593,000 23,800 1.51 316,600 323,700 334,600 344,800 353,500 360,600 44,000 13.9
Population 18-64 Population 65+
A21

Table A.2 Population change by authority, 2010-2030
2010 2015 2020 2025 2030change 2010-30
% change 2010-2015 2010 2015 2020 2025 2030
change 2010-30
% change 2010-2015
Amber Valley 99,500 98,900 100,300 101,500 101,200 1,700 1.7 22,600 26,900 29,800 33,000 37,200 14,600 64.6Ashfield 97,000 98,000 100,400 102,600 103,200 6,200 6.4 20,300 23,600 25,900 28,300 31,800 11,500 56.7Bassetlaw 91,200 89,700 90,000 90,000 88,800 -2,400 -2.6 20,900 24,700 27,500 30,600 34,400 13,500 64.6Bolsover 61,300 61,200 61,800 62,300 61,800 500 0.8 13,600 15,500 17,000 18,700 21,100 7,500 55.1Broxtowe 92,900 94,800 98,300 101,300 103,400 10,500 11.3 19,700 22,400 23,900 25,900 28,400 8,700 44.2Chesterfield 82,400 82,000 82,500 82,500 81,800 -600 -0.7 18,900 21,400 23,400 26,000 29,000 10,100 53.4Derby UA 208,700 215,700 223,500 229,600 233,700 25,000 12.0 38,600 42,000 44,500 48,400 53,900 15,300 39.6Derbyshire Dales 54,700 52,900 52,400 52,200 51,400 -3,300 -6.0 15,500 18,300 20,300 22,300 24,800 9,300 60.0Erewash 91,200 90,100 90,800 91,700 91,500 300 0.3 19,700 22,600 24,600 26,700 29,700 10,000 50.8Gedling 91,900 92,300 94,900 97,600 99,300 7,400 8.1 21,300 24,300 26,200 28,200 30,800 9,500 44.6High Peak 77,000 76,900 77,500 78,500 78,000 1,000 1.3 16,000 18,800 21,200 23,500 26,800 10,800 67.5North East Derbyshire 77,900 76,300 76,500 77,000 76,700 -1,200 -1.5 20,500 23,900 26,100 28,200 30,800 10,300 50.2Nottingham UA 271,600 288,600 301,600 313,100 323,800 52,200 19.2 34,500 35,300 36,400 39,200 43,800 9,300 27.0Rushcliffe 92,600 93,900 96,300 99,100 100,800 8,200 8.9 19,900 23,200 25,800 28,300 31,600 11,700 58.8South Derbyshire 79,300 81,700 85,000 87,400 88,400 9,100 11.5 14,600 17,700 20,000 22,700 25,900 11,300 77.4TOTAL 1,569,200 1,593,000 1,631,800 1,666,400 1,683,800 114,600 7.3 316,600 360,600 392,600 430,000 480,000 163,400 51.6
Population 18-64 Population 65+
A22

Table A.3 65s and over unable to manage at least one mobility-related activity, short and medium terms
2010 2011 2012 2013 2014 2015 2010 2011 2012 2013 2014 2015
Amber Valley 4,244 4,230 4,433 4,577 4,719 4,809 0.0 -0.3 4.5 7.8 11.2 13.3Ashfield 3,675 3,787 3,794 3,927 3,995 4,152 0.0 3.0 3.2 6.9 8.7 13.0Bassetlaw 3,686 3,827 3,980 4,104 4,177 4,393 0.0 3.8 8.0 11.3 13.3 19.2Bolsover 2,427 2,446 2,514 2,607 2,674 2,768 0.0 0.8 3.6 7.4 10.2 14.1Broxtowe 3,586 3,719 3,817 3,855 3,939 4,063 0.0 3.7 6.4 7.5 9.8 13.3Chesterfield 3,638 3,615 3,710 3,778 3,869 4,010 0.0 -0.6 2.0 3.8 6.3 10.2Derby UA 7,281 7,464 7,572 7,635 7,825 7,957 0.0 2.5 4.0 4.9 7.5 9.3Derbyshire Dales 2,863 2,974 3,034 3,145 3,180 3,315 0.0 3.9 6.0 9.8 11.1 15.8Erewash 3,644 3,699 3,771 3,894 4,012 4,093 0.0 1.5 3.5 6.9 10.1 12.3Gedling 3,904 4,055 4,184 4,252 4,354 4,477 0.0 3.9 7.2 8.9 11.5 14.7High Peak 2,945 3,075 3,201 3,243 3,427 3,482 0.0 4.4 8.7 10.1 16.4 18.2N E Derbyshire 3,559 3,717 3,836 3,891 4,034 4,151 0.0 4.4 7.8 9.3 13.3 16.6Nottingham UA 6,618 6,553 6,600 6,596 6,624 6,683 0.0 -1.0 -0.3 -0.3 0.1 1.0Rushcliffe 3,770 3,849 3,953 4,119 4,181 4,321 0.0 2.1 4.9 9.3 10.9 14.6South Derbyshire 2,568 2,568 2,780 2,862 2,983 3,030 0.0 0.0 8.3 11.4 16.2 18.0TOTAL 58,408 59,578 61,179 62,485 63,993 65,704 0.0 2.0 4.7 7.0 9.6 12.5
Percentage change (on 2010 base)Number
A23
Table A.4 65s and over unable to manage at least one mobility-related activity, long term
2010 2015 2020 2025 2030 2010 2015 2020 2025 2030
Amber Valley 4,244 4,809 5,610 6,502 7,506 0.0 13.3 32.2 53.2 76.9Ashfield 3,675 4,152 4,709 5,447 6,344 0.0 13.0 28.1 48.2 72.6Bassetlaw 3,686 4,393 5,080 5,867 6,879 0.0 19.2 37.8 59.2 86.6Bolsover 2,427 2,768 3,065 3,507 4,086 0.0 14.1 26.3 44.5 68.4Broxtowe 3,586 4,063 4,528 5,055 5,643 0.0 13.3 26.3 41.0 57.4Chesterfield 3,638 4,010 4,485 5,022 5,844 0.0 10.2 23.3 38.0 60.6Derby UA 7,281 7,957 8,604 9,579 10,790 0.0 9.3 18.2 31.6 48.2Derbyshire Dales 2,863 3,315 3,835 4,360 5,084 0.0 15.8 34.0 52.3 77.6Erewash 3,644 4,093 4,654 5,263 6,080 0.0 12.3 27.7 44.4 66.8Gedling 3,904 4,477 5,023 5,521 6,250 0.0 14.7 28.7 41.4 60.1High Peak 2,945 3,482 3,993 4,626 5,415 0.0 18.2 35.6 57.1 83.9North East Derbyshire 3,559 4,151 4,752 5,427 6,146 0.0 16.6 33.5 52.5 72.7Nottingham UA 6,618 6,683 6,876 7,416 8,287 0.0 1.0 3.9 12.1 25.2Rushcliffe 3,770 4,321 4,922 5,597 6,504 0.0 14.6 30.6 48.5 72.5South Derbyshire 2,568 3,030 3,572 4,186 5,061 0.0 18.0 39.1 63.0 97.1TOTAL 58,408 65,704 73,708 83,375 95,919 0.0 12.5 26.2 42.7 64.2
Number Percentage change (on 2010 base)
A24
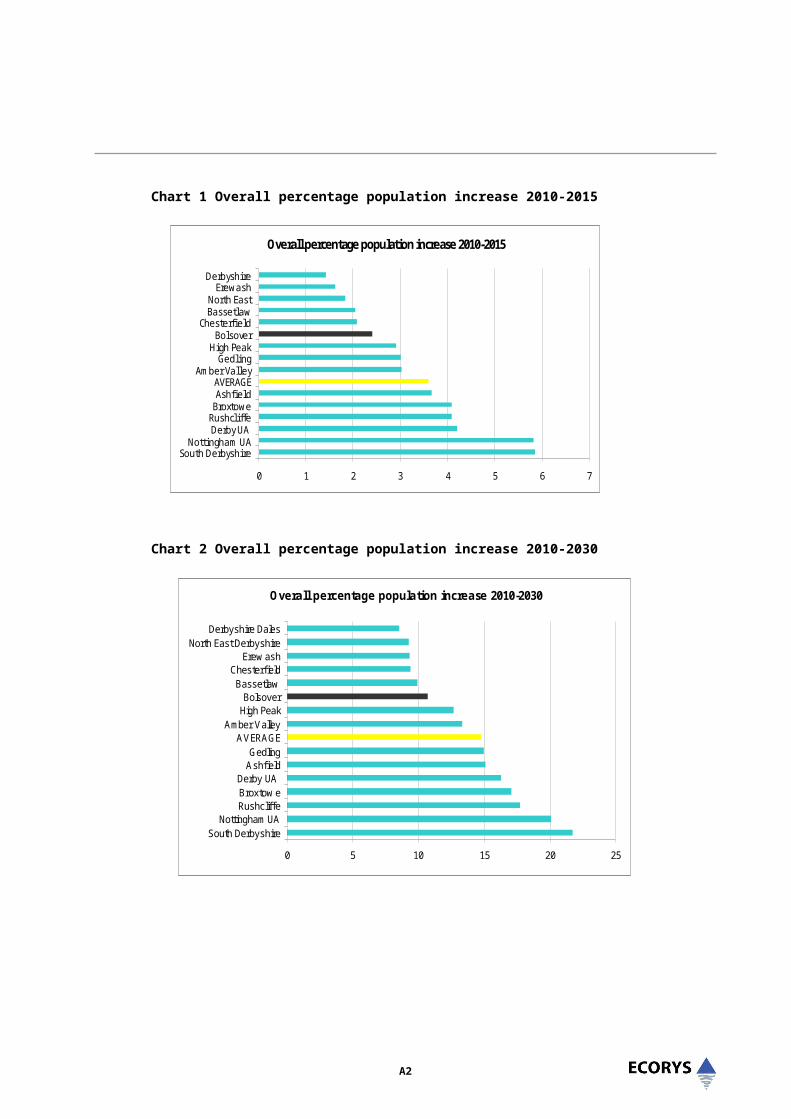
Table A.4a Other medical conditions, 65 and over, all authorities
2010 2011 2012 2013 2014 2015
No. increase
2010-2015% increase 2010-2015
Long term limiting illness 159,804 163,265 168,417 173,353 177,653 181,230 21,426 13.4Heart attack 15,493 15,845 16,402 16,832 17,226 17,641 2,148 13.9Stroke 7,292 7,459 7,723 7,931 8,119 8,332 1,040 14.3Danger of falls 84,263 86,090 88,905 91,078 93,243 95,609 11,346 13.5Bladder problem 51,911 53,023 54,758 56,139 57,468 58,894 6,983 13.5
2010 2015 2020 2025 2030
No. increase
2010-2030% increase 2010-2030
Long term limiting illness 159,804 181,230 198,785 220,664 246,206 86,402 54.1Heart attack 15,493 17,641 19,298 21,307 23,828 8,335 53.8Stroke 7,292 8,332 9,197 10,258 11,472 4,180 57.3Danger of falls 84,263 95,609 105,549 117,216 133,594 49,331 58.5Bladder problem 51,911 58,894 64,814 72,201 81,335 29,424 56.7
Other medical conditions, 65 and over - short and medium term
Other medical conditions, 65 and over - longterm
A25

Table A.5 Higher mobility rate Disabled Living Allowance claimants
2010 2011 2012 2013 2014 2015change
2010-2015% change 2010-2015 2010 2015 2020 2025 2030
change 2010-2030
% change 2010-2030
Amber Valley 3,840 3,859 3,884 3,906 3,931 3,956 116 3.0 3,840 3,956 4,092 4,230 4,353 513 13.3Ashfield 4,620 4,652 4,683 4,718 4,754 4,789 169 3.7 4,620 4,789 4,974 5,156 5,317 697 15.1Bassetlaw 4,770 4,787 4,804 4,825 4,847 4,868 98 2.1 4,770 4,868 5,000 5,132 5,242 472 9.9Bolsover 4,440 4,458 4,481 4,499 4,523 4,547 107 2.4 4,440 4,547 4,671 4,802 4,914 474 10.7Broxtowe 3,060 3,084 3,109 3,133 3,161 3,185 125 4.1 3,060 3,185 3,321 3,457 3,582 522 17.1Chesterfield 4,620 4,638 4,656 4,675 4,693 4,716 96 2.1 4,620 4,716 4,830 4,948 5,053 433 9.4Derby City 7,200 7,258 7,319 7,383 7,442 7,503 303 4.2 7,200 7,503 7,803 8,094 8,373 1,173 16.3Derbyshire Dales 1,480 1,482 1,486 1,491 1,495 1,501 21 1.4 1,480 1,501 1,533 1,571 1,606 126 8.5Erewash 3,180 3,189 3,197 3,209 3,220 3,232 52 1.6 3,180 3,232 3,309 3,395 3,475 295 9.3Gedling 3,200 3,214 3,234 3,251 3,273 3,296 96 3.0 3,200 3,296 3,423 3,556 3,678 478 14.9High Peak 2,380 2,393 2,406 2,421 2,434 2,449 69 2.9 2,380 2,449 2,526 2,610 2,682 302 12.7North East Derbyshire 4,060 4,072 4,085 4,101 4,114 4,134 74 1.8 4,060 4,134 4,233 4,341 4,435 375 9.2Nottingham 10,090 10,232 10,357 10,469 10,575 10,677 587 5.8 10,090 10,677 11,142 11,613 12,117 2,027 20.1Rushcliffe 2,150 2,167 2,184 2,202 2,219 2,238 88 4.1 2,150 2,238 2,333 2,435 2,530 380 17.7South Derbyshire 2,520 2,550 2,579 2,609 2,638 2,668 148 5.9 2,520 2,668 2,818 2,955 3,067 547 21.7TOTAL 61,610 62,048 62,492 62,933 63,371 63,825 2,215 3.6 61,610 63,825 66,138 68,490 70,692 9,082 14.7
High rate DLA, short and medium term High rate DLA, long term
A26

Table A.6 Mandatory Disabled Facilities Grants
Total number of mandatory grants (completed)
2004/5 2005/06 2006/07 2007/08 2008/09 2009/10 2004/05 2005/06 2006/07 2007/08 2008/09 2009/10outturn outturn outturn outturn planned planned outturn outturn outturn outturn planned planned
Amber Valley 469 356 354 114 150 150 1,025 886 942 640 700 1,000Ashfield 36 66 59 51 50 50 272 317 545 392 420 420Bassetlaw 35 70 91 106 110 106 188 499 961 847 916 850Bolsover 64 71 85 78 69 78 310 330 543 580 500 600Broxtowe 46 38 43 52 70 73 271 273 288 390 507 550Chesterfield 70 83 28 63 70 70 383 428 229 462 1,061 1,260Derby UA 213 212 215 238 200 200 1,333 1,369 1,400 1,379 1,400 1,400Derbyshire Dales 28 40 32 39 45 45 149 198 198 214 240 240Erewash 103 123 158 132 156 156 600 638 706 632 750 750Gedling 107 86 83 117 120 120 387 455 404 551 602 600High Peak 43 53 36 54 45 45 220 249 246 277 242 242N E Derbyshire 50 42 50 56 67 91 290 200 337 215 246 250Nottingham UA 205 220 236 221 240 300 1,426 1,600 1,635 1,639 1,800 2,300Rushcliffe 74 84 62 76 92 100 293 367 238 342 411 450South Derbyshire 46 47 121 118 92 83 284 271 620 657 417 466TOTAL 1589 1591 1653 1515 1576 1667 7431 8080 9292 9217 10212 11378
Total expenditure on mandatory grants (£ thousand)
A27

Table A.7 Cost per mandatory Disabled Facilities Grant over time
2004/5 2005/06 2006/07 2007/08 2008/09 2009/10outturn outturn outturn outturn planned planned
Amber Valley £2,186 £2,489 £2,661 £5,614 £4,667 £6,667Ashfield £7,556 £4,803 £9,237 £7,686 £8,400 £8,400Bassetlaw £5,371 £7,129 £10,560 £7,991 £8,327 £8,019Bolsover £4,844 £4,648 £6,388 £7,436 £7,246 £7,692Broxtowe £5,891 £7,184 £6,698 £7,500 £7,243 £7,534Chesterfield £5,471 £5,157 £8,179 £7,333 £15,157 £18,000Derby UA £6,258 £6,458 £6,512 £5,794 £7,000 £7,000Derbyshire Dales £5,321 £4,950 £6,188 £5,487 £5,333 £5,333Erewash £5,825 £5,187 £4,468 £4,788 £4,808 £4,808Gedling £3,617 £5,291 £4,867 £4,709 £5,017 £5,000High Peak £5,116 £4,698 £6,833 £5,130 £5,378 £5,378N E Derbyshire £5,800 £4,762 £6,740 £3,839 £3,672 £2,747Nottingham UA £6,956 £7,273 £6,928 £7,416 £7,500 £7,667Rushcliffe £3,959 £4,369 £3,839 £4,500 £4,467 £4,500South Derbyshire £6,174 £5,766 £5,124 £5,568 £4,533 £5,614TOTAL £4,677 £5,079 £5,621 £6,084 £6,480 £6,825
A28

Table A.8 Council Tax Exemptions, disregards and band reductions
Amber Valley 112 6 1 16 145 308 588Ashfield 85 6 3 1 70 267 432Bassetlaw 60 7 0 0 39 372 478Bolsover 58 8 1 3 31 142 243Broxtowe 95 13 2 0 69 209 388Chesterfield 87 3 0 1 42 224 357Derby UA 216 10 0 0 61 467 754Derbyshire Dales 77 7 0 0 22 188 294Erewash 104 4 4 107 0 266 485Gedling 107 6 1 0 70 280 464High Peak 94 18 4 2 81 240 439North East Derbyshire 90 7 1 2 39 256 395Nottingham UA 124 14 1 3 71 575 788Rushcliffe 86 8 1 1 20 323 439South Derbyshire 75 7 0 0 24 226 332
TOTAL 1,470 124 19 136 784 4,343 6,876
Exempt property Class J
(moved to give care) TOTAL
Disregard-Patients where the hospital is
their main residence
Disregardt - Patients in residential
care
Band reductions
for disabilities
Exempt property
Class E (in hospital)
Exempt property Class I
(moved to receive care)
A29

Table A.9 Housing register data
Total of housing register
Identified older groups in need
Wheelchair requirement
Medical / social need
Need for specially adapted property
Visual / combined visual disability
Other physical disability
Grand total
% Housing register
Amber Valley 2639 750 0 99 207 0 0 957 36.3Ashfield 4981 0 0 0 331 0 0 331 6.6Bassetlaw 4913 0 0 51 9 0 1108 1168 23.8Bolsover 3299 0 0 0 0 0 0 0 0.0Broxtowe 2955 0 0 0 276 36 0 313 10.6Chesterfield 3405 0 0 0 0 0 109 109 3.2Derby 8547 0 95 0 319 48 0 353 4.1Derbyshire Dales 2936 0 126 0 383 0 172 681 23.2Erewash 2043 0 133 0 283 61 303 780 38.2Gedling 1497 0 0 0 263 47 0 310 20.7High Peak 4638 0 66 0 268 46 173 553 11.9NE Derbyshire* 1765 122 0 0 0 0 0 122 6.9Nottingham City 9734 0 0 0 0 0 0 1699 17.5Rushcliffe 947 0 0 0 167 21 0 188 19.9South Derbyshire 1429 0 60 91 191 51 0 393 27.5TOTAL 55728 872 480 241 2697 310 1865 7957 14.3
A30
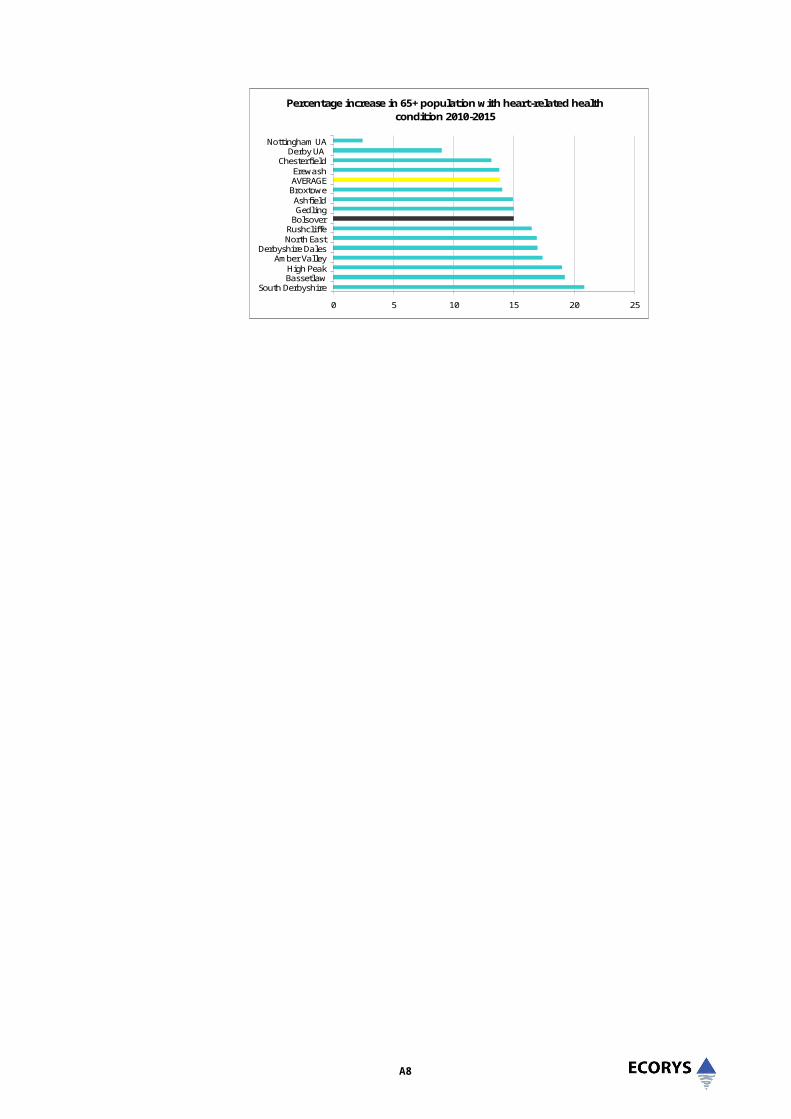
Table A.10 Lettings to applicants with mobility-related disabilities
Required full wheelchair access
Required wheelchair access to essential rooms
Required level access housing
Requires adaptations related to visual impairment Total
Required full wheelchair access
Required wheelchair access to essential rooms
Required level access housing
Requires adaptations related to visual impairment Total
Lettings to people with mobility disabilities
Overall % lettings to people with mobility disabilities
Amber Valley BC 2 2 9 0 13 1 3 37 0 41 54 6.6Ashfield BC 2 5 63 2 72 0 2 1 0 3 75 7.2Bassetlaw DC 7 0 5 1 13 10 2 31 2 45 58 7.4Bolsover DC 2 0 3 1 6 3 0 25 0 28 34 7.0Broxtowe BC 0 0 4 0 4 1 1 5 1 8 12 4.9Chesterfield BC 3 3 13 1 20 4 2 8 0 14 34 3.6Derby City 5 2 14 4 25 8 3 20 4 35 60 3.0Derbyshire Dales DC 2 0 15 0 17 2 1 40 0 43 60 16.9Erewash BC 0 0 8 0 8 0 2 39 2 43 51 7.4Gedling BC 0 2 13 0 15 7 0 39 5 51 66 12.5High Peak BC 2 0 3 1 6 2 0 6 1 9 15 3.2NE Derbyshire DC 2 2 58 0 62 10 2 12 1 25 87 14.1Nottingham City 13 3 58 11 85 11 3 51 15 80 165 4.1Rushcliffe DC 0 0 0 0 0 7 0 11 0 18 18 8.9South Derbyshire DC 1 3 5 0 9 2 0 5 2 9 18 4.5TOTAL 41 22 271 21 355 68 21 330 33 452 807 5.9
Lettings to people with mobility disabilities
General and Supported disabled lettingsGeneral Needs lettings Supported Housing lettings
A31

Table A.11 Analysis of mobility-adapted accommodation lettings
Core lettings data 2009 - 2010
All general needs lettings
Wheelchair standard stock let
GN
% general needs wheelchair stock
All supported lettings
Fitted with aids or adaptations
Designed to accessible general standard
Designed to wheelchair user standard
% Supp lettings designed to wheelchair user standard
% Adapted supported stock
Amber Valley BC 393 6 1.5 431 239 67 15.5 71.0Ashfield BC 963 27 2.8 78 15 11 15 19.2 52.6Bassetlaw DC 417 6 1.4 362 71 57 1 0.3 35.6Bolsover DC 285 3 1.1 198 178 1 3 1.5 91.9Broxtowe BC 126 0 0.0 118 25 21 12 10.2 49.2Chesterfield BC 729 7 1.0 206 9 101 52 25.2 78.6Derby City 1,254 15 1.2 754 135 193 25.6 43.5Derbyshire Dales DC 231 3 1.3 123 102 12 9.8 92.7Erewash BC 504 5 1.0 187 0 161 5 2.7 88.8Gedling BC 281 1 0.4 248 32 118 76 30.6 91.1High Peak BC 331 0 0.0 143 33 49 34.3 57.3NE Derbyshire DC 574 19 3.3 41 0 6 22 53.7 68.3Nottingham City 2,462 45 1.8 1561 100 707 69 4.4 56.1Rushcliffe DC 83 0 0.0 119 14 100 5 4.2 100.0South Derbyshire DC 239 3 1.3 157 147 8 5.1 98.7TOTAL 8,872 140 1.6 4,726 444 1,939 589 12.5 62.9
General needs lettings
Lettings analysis
Supported lettings
A32

Table A.12 Lettings to mobility disabled as proportion of needs, 2009-10
Total on housing register
Grand total w. mobility-related disability
% housing register
Lettings 2009-10 to people with mobility disabilities
Lettings as % of physically disabled on register
Amber Valley 2639 957 36.3 54 5.6Ashfield 4981 331 6.6 75 22.7Bassetlaw 4913 1168 23.8 58 5.0Bolsover 3299 0 0.0 34 Broxtowe 2955 313 10.6 12 3.8Chesterfield 3405 109 3.2 34 31.2Derby 8547 353 4.1 60 17.0Derbyshire Dales 2936 681 23.2 60 8.8Erewash 2043 780 38.2 51 6.5Gedling 1497 310 20.7 66 21.3High Peak 4638 553 11.9 15 2.7NE Derbyshire* 1765 122 6.9 87 71.3Nottingham City 9734 1699 17.5 165 9.7Rushcliffe 947 188 19.9 18 9.6South Derbyshire 1429 393 27.5 18 4.6TOTAL 55728 7957 16.7 807 10.1
A33

Table A.13 Housing association stock data
Core lettings data 2009 - 2010
HA general needs
HA Supported and older
HA wheelchair general needs
HA wheelchair supported / Older
% wheelchair stock
Amber Valley BC 4249 2680 15 4 0.3Ashfield BC 1283 467 29 96 7.1Bassetlaw DC 786 370 11 5 1.4Bolsover DC 618 331 9 23 3.4Broxtowe BC 867 207 2 14 1.5Chesterfield BC 752 640 3 65 4.9Derby City 5399 1860 98 87 2.5Derbyshire Dales DC 2907 930 15 12 0.7Erewash BC 4475 2048 17 66 1.3Gedling BC 3642 1357 462 162 12.5High Peak BC 676 357 0 5 0.5NE Derbyshire DC 544 189 6 5 1.5Nottingham City 6013 3298 4 115 1.3Rushcliffe DC 2530 1468 3 56 1.5South Derbyshire DC 689 125 5 28 4.1TOTAL 35430 16327 679 743 2.7
Housing association stock (RSR)
Stock analysis
A34

Table A.14 Local authority wheelchair units and mobility-adapted accommodation
Local authority Status Wheelchair units
Mobility adaptations
Amber Valley LSVT Ashfield ALMO 261 1213Bassetlaw ALMO 2154Bolsover LA Broxtowe LA 27 Chesterfield LA 3734Derby ALMO 107 403 Derbyshire Dales LSVT Erewash LSVT Gedling LSVT High Peak LA 21 465North East Derbyshire ALMO Nottingham ALMO 142 2448Rushcliffe LSVT South Derbyshire LA 6 898
Table A.15 Supporting people – beneficiary households December 2010
Frai
l Eld
erly
Old
er p
eopl
e w
ith
supp
ort n
eeds
Peop
le w
ith a
Ph
ysic
al o
r Se
nsor
y Di
sabi
lity
Total Contracted Household
Units
% F
rail
Elde
rly
% O
lder
peo
ple
with
sup
port
need
s
% P
eopl
e w
ith a
Ph
ysic
al o
r Se
nsor
y Di
sabi
lity
Derby .. 3,797 37 5,011 0.00 75.77 0.74Nottingham 668 9,489 124 13,283 5.03 71.44 0.93Derbyshire 58 13,276 21 14,871 0.39 89.27 0.14Nottinghamshire 178 11,711 69 14,250 1.25 82.18 0.48
A35

Table A.16a Unmet housing need among people with physical and sensory mobility disabilities: high estimate
2010 2015 2020 2025 2030
% i n unsu-itabl e homes
(1) 2010 2015 2020 2025 2030
Tota l on register
with PMD 2010 2010 2015 2020 2025 2030 2010 2015 2020 2025 2030
2010 pre
boost% 2012 boost 2010 2015 2020 2025 2030 2010 2015 2020 2025 2030
Amber Valley 7,705 8,279 9,252 10,167 11,062 15.9% 1,225 1,316 1,471 1,617 1,759 957 54 54 54 54 54 344 319 319 319 319 319 8 82 88 98 108 117 771 856 1,000 1,136 1,269Ashfield 6,820 7,364 8,093 8,882 9,712 15.9% 1,084 1,171 1,287 1,412 1,544 331 75 75 75 75 75 81 62 62 62 62 62 30 72 78 86 94 103 875 955 1,064 1,181 1,304Bassetlaw 6,841 7,579 8,332 9,110 9,965 15.9% 1,088 1,205 1,325 1,448 1,584 1168 58 58 58 58 58 116 104 104 104 104 104 12 72 80 88 96 106 854 963 1,075 1,190 1,317Bolsover 4,481 4,875 5,249 5,692 6,195 15.9% 712 775 835 905 985 0 34 34 34 34 34 105 89 89 89 89 89 18 47 52 56 60 66 542 601 656 722 796Broxtowe 6,614 7,128 7,748 8,349 8,974 15.9% 1,052 1,133 1,232 1,327 1,427 313 12 12 12 12 12 81 64 64 64 64 64 26 70 75 82 88 95 905 981 1,073 1,163 1,255Chesterfield 6,435 6,846 7,373 7,887 8,594 15.9% 1,023 1,089 1,172 1,254 1,366 109 34 34 34 34 34 87 77 77 77 77 77 13 68 72 78 84 91 844 905 983 1,060 1,165Derby UA 13,266 14,204 15,192 16,318 17,600 15.9% 2,109 2,258 2,416 2,595 2,798 353 62 60 60 60 60 274 256 256 256 256 256 7 140 150 161 173 186 1,651 1,792 1,939 2,106 2,296Derbyshire Dales 4,972 5,382 5,935 6,428 7,072 15.9% 791 856 944 1,022 1,124 681 60 60 60 60 60 55 46 46 46 46 46 19 53 57 63 68 75 632 693 775 848 944Erewash 6,647 7,103 7,773 8,411 9,140 15.9% 1,057 1,129 1,236 1,337 1,453 780 51 51 51 51 51 184 166 166 166 166 166 11 70 75 82 89 97 770 838 937 1,032 1,140Gedling 7,007 7,567 8,206 8,721 9,442 15.9% 1,114 1,203 1,305 1,387 1,501 310 66 66 66 66 66 147 127 127 127 127 127 16 74 80 87 92 100 847 930 1,025 1,102 1,209High Peak 5,638 6,195 6,795 7,419 8,069 15.9% 553 608 672 747 833 553 15 15 15 15 15 62 55 55 55 55 55 13 37 40 45 50 55 446 497 557 627 707North East Derbyshire 6,365 6,908 7,566 8,197 8,834 15.9% 1,012 1,098 1,203 1,303 1,405 122 90 87 87 87 87 98 71 71 71 71 71 38 67 73 80 87 94 783 867 965 1,058 1,153Nottingham UA 13,291 13,802 14,486 15,380 16,503 15.9% 1,699 1,764 1,855 1,980 2,147 1699 255 165 165 165 165 295 284 284 284 284 284 4 113 118 124 132 143 1,046 1,197 1,282 1,399 1,555Rushcliffe 6,865 7,454 8,170 8,881 9,757 15.9% 188 204 225 249 281 188 18 18 18 18 18 107 98 98 98 98 98 9 13 14 15 17 19 60 75 95 117 146South Derbyshire 5,153 5,728 6,445 7,150 8,014 15.9% 819 911 1,025 1,137 1,274 393 18 18 18 18 18 107 101 101 101 101 101 6 55 61 68 76 85 645 731 837 942 1,070TOTAL 108,100 116,414 126,615 136,992 148,933 15.90% 17,188 18,510 20,132 21,782 23,680 7,957 902 807 807 807 807 2144 1,918 1,918 1,918 1,918 1,918 1,034 1,114 1,212 1,313 1,431 11,672 12,882 14,264 15,681 17,327
Numbers with PMDs in unsuitable homes
Demand Total under 65as unable to work and over 65s with
at least one mobility diffi culty
Based on POPPI / PANSI data Lettings PA adjusted for new supply
Supply
DFGs PA Adjustment for self-help (2)Unmet need
A36

Table A.16b Unmet housing need among people with physical and sensory mobility disabilities: low estimate
2010 2015 2020 2025 2030
Average %
increase PA High
level DLA
% in uns u-i table homes
(1) 2010 2015 2020 2025 2030
Total on
register with PMD 2010 2010 2015 2020 2025 2030 2010 2015 2020 2025 2030 2010 2015 2020 2025 2030 2010 2015 2020 2025 2030
Amber Valley 3840 3,876 3,913 3,950 3,987 0.95 15.9% 611 616 622 628 634 957 54 54 54 54 54 318.6 318.6 318.6 318.6 318.6 41 41 41 42 42 197 203 208 214 219Ashfield 4620 4,739 4,860 4,985 5,113 2.57 15.9% 735 753 773 793 813 331 75 75 75 75 75 62.4 62.4 62.4 62.4 62.4 49 50 51 53 54 548 566 584 602 621Bassetlaw 4770 4,796 4,821 4,847 4,873 0.54 15.9% 758 762 767 771 775 1168 58 58 58 58 58 103.6 103.6 103.6 103.6 103.6 51 51 51 51 52 546 550 554 558 562Bolsover 4440 4,445 4,450 4,455 4,460 0.11 15.9% 706 707 708 708 709 0 34 34 34 34 34 89 89 89 89 89 47 47 47 47 47 536 537 537 538 539Broxtowe 3060 3,075 3,091 3,106 3,122 0.50 15.9% 487 489 491 494 496 313 12 12 12 12 12 64.4 64.4 64.4 64.4 64.4 32 33 33 33 33 378 380 382 385 387Chesterfield 4620 4,695 4,770 4,847 4,925 1.61 15.9% 735 746 758 771 783 109 34 34 34 34 34 76.8 76.8 76.8 76.8 76.8 49 50 51 51 52 575 586 597 609 620Derby UA 7200 7,300 7,402 7,505 7,610 1.39 15.9% 1,145 1,161 1,177 1,193 1,210 353 62 60 60 60 60 255.6 255.6 255.6 255.6 255.6 76 77 78 79 81 751 768 783 798 814Derbyshire Dales 1480 1,516 1,552 1,589 1,628 2.41 15.9% 235 241 247 253 259 681 60 60 60 60 60 45.8 45.8 45.8 45.8 45.8 16 16 16 17 17 114 119 125 130 136Erewash 3180 3,180 3,180 3,180 3,180 0.98 15.9% 506 506 506 506 506 780 51 51 51 51 51 165.6 165.6 165.6 165.6 165.6 34 34 34 34 34 255 255 255 255 255Gedling 3200 3,223 3,246 3,270 3,294 0.72 15.9% 509 512 516 520 524 310 66 66 66 66 66 126.6 126.6 126.6 126.6 126.6 34 34 34 35 35 282 286 289 293 296High Peak 2380 2,412 2,444 2,476 2,509 1.33 15.9% 378 383 389 394 399 553 15 15 15 15 15 55.2 55.2 55.2 55.2 55.2 25 26 26 26 27 283 288 292 297 302North East Derbyshire 4060 4,132 4,206 4,281 4,357 1.78 15.9% 646 657 669 681 693 122 90 87 87 87 87 71.2 71.2 71.2 71.2 71.2 43 44 45 45 46 441 455 466 477 488Nottingham UA 10090 10,136 10,182 10,228 10,275 0.45 15.9% 1,604 1,612 1,619 1,626 1,634 1699 255 165 165 165 165 284.4 284.4 284.4 284.4 284.4 107 107 108 108 109 958 1,055 1,062 1,069 1,075Rushcliffe 2150 2,196 2,243 2,291 2,341 2.15 15.9% 342 349 357 364 372 188 18 18 18 18 18 97.6 97.6 97.6 97.6 97.6 23 23 24 24 25 203 210 217 224 232South Derbyshire 2520 2,557 2,595 2,633 2,672 1.47 15.9% 401 407 413 419 425 393 18 18 18 18 18 101.4 101.4 101.4 101.4 101.4 27 27 27 28 28 255 260 266 271 277TOTAL 61,610 62,277 62,955 63,644 64,344 15.90% 9,796 9,902 10,010 10,119 10,231 7,957 807 807 807 807 807 1,918 1,918 1,918 1,918 1,918 652 659 667 674 681 6,323 6,517 6,618 6,720 6,824
Based on High Level DLA
Demand
High level DLA claimants Numbers with PMDs in unsuitable homes
Supply
DFGs PALettings PA adjusted for new supply Adjustment for self-help (2)Unmet need
A37
Table A.17 Households with unmet need for wheelchair accommodation
2013 2018 2023 2026 2028 2033 2013 2018 2023 2026 2028 2033 2013 2018 2023 2026 2028 2033
Amber Valley 55,000 58,000 61,000 62,000 63,000 66,000 1,650 1,740 1,830 1,860 1,890 1,980 165 174 183 186 189 198 Ashfield 52,000 54,000 57,000 59,000 60,000 62,000 1,560 1,620 1,710 1,770 1,800 1,860 156 162 171 177 180 186 Bassetlaw 50,000 52,000 54,000 56,000 57,000 58,000 1,500 1,560 1,620 1,680 1,710 1,740 150 156 162 168 171 174 Bolsover 33,000 34,000 36,000 37,000 37,000 38,000 990 1,020 1,080 1,110 1,110 1,140 99 102 108 111 111 114 Broxtowe 51,000 54,000 57,000 59,000 60,000 62,000 1,530 1,620 1,710 1,770 1,800 1,860 153 162 171 177 180 186 Chesterfield 47,000 49,000 51,000 52,000 53,000 54,000 1,410 1,470 1,530 1,560 1,590 1,620 141 147 153 156 159 162 Derby UA 108,000 114,000 120,000 123,000 126,000 131,000 3,240 3,420 3,600 3,690 3,780 3,930 324 342 360 369 378 393 Derbyshire Dales 31,000 33,000 34,000 35,000 36,000 37,000 930 990 1,020 1,050 1,080 1,110 93 99 102 105 108 111 Erewash 49,000 51,000 53,000 55,000 55,000 57,000 1,470 1,530 1,590 1,650 1,650 1,710 147 153 159 165 165 171 Gedling 51,000 53,000 56,000 57,000 58,000 60,000 1,530 1,590 1,680 1,710 1,740 1,800 153 159 168 171 174 180 High Peak 41,000 43,000 45,000 47,000 47,000 49,000 1,230 1,290 1,350 1,410 1,410 1,470 123 129 135 141 141 147 North East Derbyshire 44,000 45,000 47,000 48,000 49,000 50,000 1,320 1,350 1,410 1,440 1,470 1,500 132 135 141 144 147 150 Nottingham UA 140,000 150,000 158,000 163,000 167,000 175,000 4,200 4,500 4,740 4,890 5,010 5,250 420 450 474 489 501 525 Rushcliffe 49,000 52,000 55,000 57,000 58,000 60,000 1,470 1,560 1,650 1,710 1,740 1,800 147 156 165 171 174 180 South Derbyshire 40,000 43,000 46,000 48,000 49,000 51,000 1,200 1,290 1,380 1,440 1,470 1,530 120 129 138 144 147 153
TOTAL 841,000 885,000 930,000 958,000 975,000 1,010,000 25,230 26,550 27,900 28,740 29,250 30,300 2,523 2,655 2,790 2,874 2,925 3,030
Household projections '000 No. wheelchair users (3%) No. wheelchair users with unmet housing needs (10%)
Notes: the Habinteg / London South Bank University study calculated that in the East Midlands 3% of households had at least on wheelchair user, and of these 10% had unmet housing needs.
A38

Annex 2: Value for Money
A39
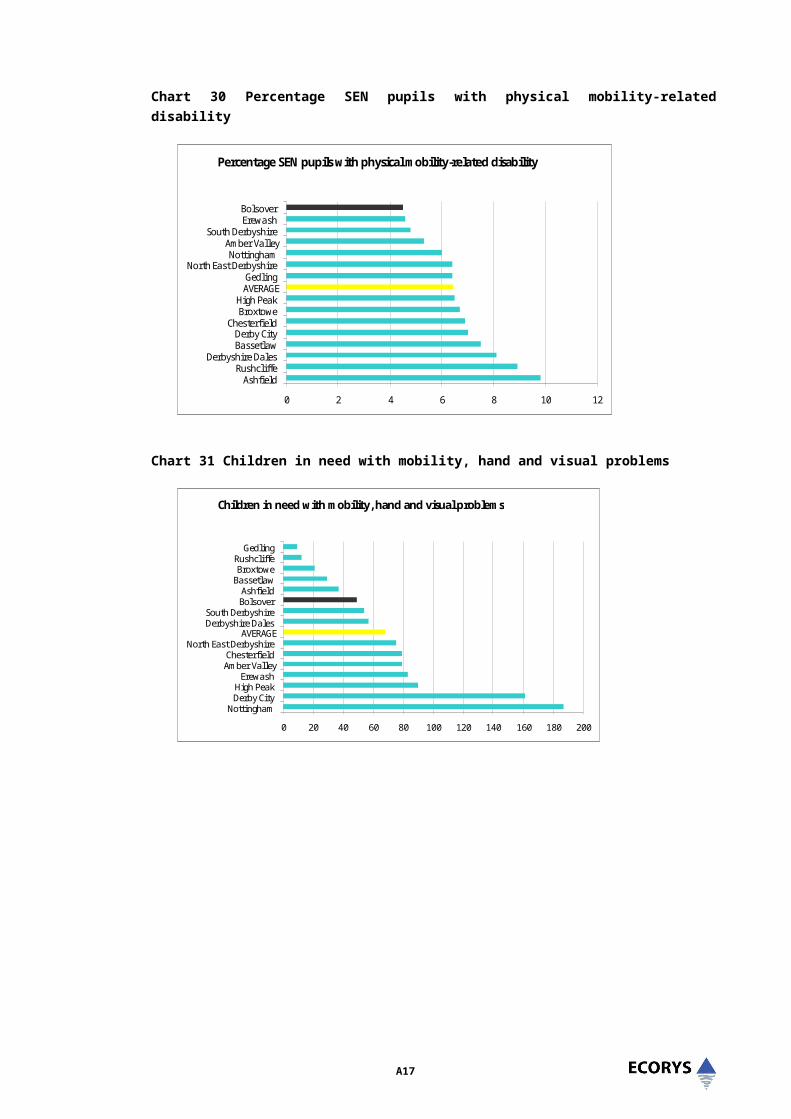
Material in this annex repeats Appendix A from the Overarching Report and provides a summary of the cost benefit literature reviewed in relation to the common sources of funding available.
Cost of intervention Benefits for individual/ household
Benefits for LA/ public sector
Source of funding
DFGAverage grant per applicant £5,750 as at 200710
NB considerably more for children with severe disabilities (non means test up to £50,000 for children).
Meeting aspirations: older people in particular would prefer to remain in their home.
Living safely and with reduced risk of falls (and mortality)
Remain connected to social networks, care and support
For children - increased capacity to develop own social and living skills
Develop independence, pursue education, training and employment
Prevents accidents and falls (and mortality) – hip fractures cost up to £25,424, and in 2000 totalled £726m11
Prevents/ delays entry to residential care – average £519.30 per resident per week for older people; £1,378 per resident week for younger adults with sensory and physical impairments12
Reduction in home care hours required:Average package for older people is £162 per week (excluding high cost); for people with disabilities is £265 per week13
LA DFG allocation
(DFG allowance to be factored into local council housing finance settlement)
Partnership funding from PCTs occurs in some areas e.g Liverpool, Blackpool.
RRO 2002 – loans
Self funding from households
Costs of developing Lifetime Homes
Estimated between £525-1625 in addition to general development costs
Nb developing LH in greater numbers is expected to reduce the unit cost by £250.
Reducing costs of future adaptations
Enabling use by people at range of ages and with different needs
Living safely and with reduced risk of falls (and mortality)
For children -
As above in reducing risks of accidents and falls and reducing dependence on care and health interventions
HCA affordable grant programme
Development contributions
Contribution of free/discounted land from LAs/ public sector partners to improve
10 DCLG (2007) DFG programme: the government’s proposals to improve the delivery programme. 11 PSSRU (2007) Research Summary, http://www.pssru.ac.uk/pdf/rs044.pdf 12 PSSRU Unit costs in health and social care 2011, p2613 As above, p109 and p112
A40

Cost of intervention Benefits for individual/ household
Benefits for LA/ public sector
Source of funding
increased capacity to develop own social and living skills
Develop independence, pursue education, training and employment
development viability
Specialist housing for people with sensory and physical impairment - estimated £1,386 per person per year incl. support costs
Sheltered/Extra care - estimated £444 per person per year
Specialist provision to meet specific needs re: sensory and physical impairment.
Opportunities for increased support and activities to prevent social isolation
(The cost benefits of specialist housing were less for young people, but the case of young people with disabilities not studied separately)
Younger adults with physical and sensory disabilities in high dependency care homes – est cost £1,378 per resident week
Specialist housing for older people is increasingly used as an explicit alternative to residential (and nursing) care homes – cost effective alternative for health and caree.g £418 per week average cost in extra care compared to £519.30 in private residential care.
HCA affordable homes programme - % for specialist housing
Free/ discounted land from LAs/ public sector partners
Self funding (through development mix – leasehold and rented mixed schemes)
Moving to alternative accommodation(e.g bungalows, other general needs housing more suitable)
Average cost £1,50014
Safer living environment supporting independent living.
Reduced/ delayed need for health and social care interventions
Dependent upon the provision of suitable alternative housing options delivered through the planning system
14 Based on the scheme, Seamless relocation, which supports older home owners to move and downsize. Nick O’Shea (2012) Helping older people choose the right homes for them: an introduction to the costs and benefits of providing advice and support, EAC
A41

Annex 3: Detailed Recommendations
A42
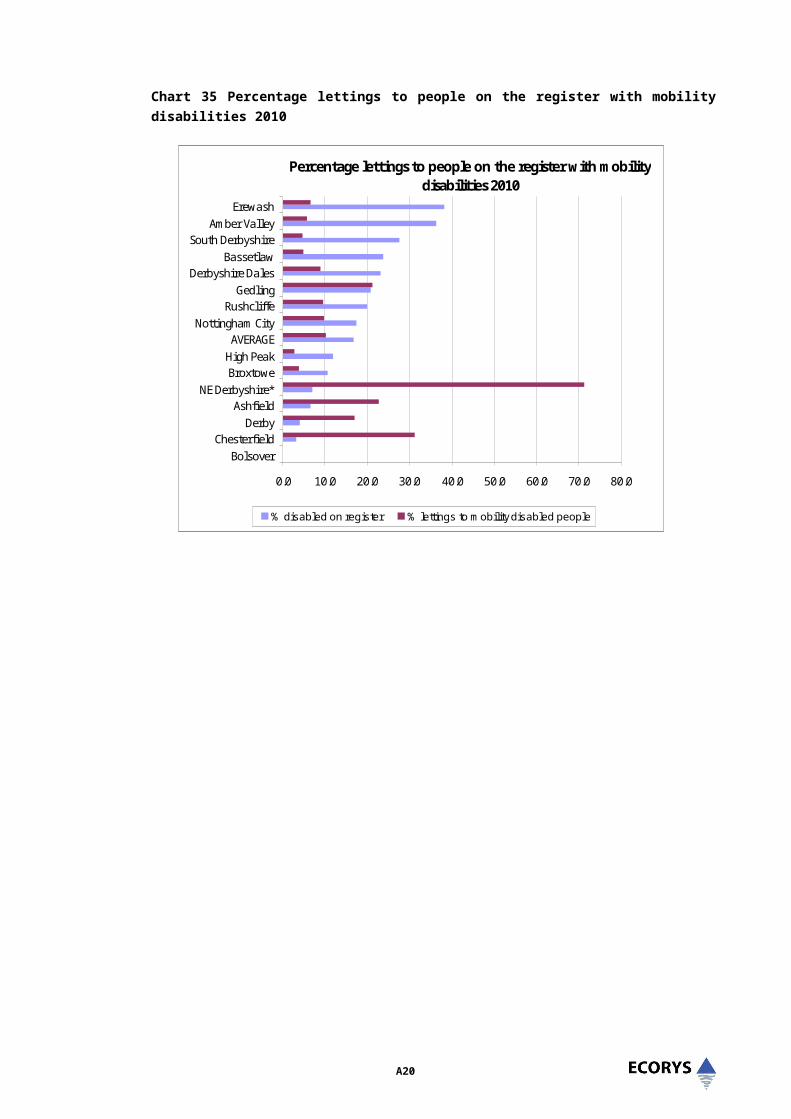
Recommendations
Recommendation Details How to measure success Cross Reference to Report Section
Additional information
Bolsover Impact and OutcomesPractical Guidance – How
to
A. Scrutinise allocation activity Ensure that adapted and wheelchair homes are not let to those who do not need them; and that they are let to those who do, including letting of over 60s accommodation to younger disabled people.
Process analysis, and changes in policy (for example, holding a pool of void suitable properties).
Consider extending use of choice based lettings system and development of accessible housing registers.
More accurate matching of stock to needs
Increased housing options for disabled people 2.2, 3.2, 4.4, 5.6
See 5.1.2 of overarching report and good practice examples
Monitor outcomes to adjust allocations accordingly – successful outcomes for both disabled people and exiting residents
B. Draw up and update database of all affordable housing adapted / wheelchair stock.
Keep records of private sector stock that has benefitted from DFGs.
Agreement between social landlords and DFG administrators.
Consider extending use of choice based lettings system and development of accessible housing registers – including private sector landlords.
More accurate matching of stock to needs
3.2, 3.3, 4.4, 5.6, 5.9
A43

Recommendation Details How to measure success Cross Reference to Report Section
Additional information
Bolsover Impact and OutcomesPractical Guidance – How
to
C. Review preventative policy in conjunction with adult services and health agencies
Consider tri-partitite resourcing arrangements.
To include explicit agreement of who should pay for adaptations or transfer to appropriate accommodation.
Link policy to clear preventative rationale.
Increased investment in relevant accommodation
3.2, 3.3
D. Implement existing planning policy around “Special Needs Housing” – including Lifetime Homes and Wheelchair properties
Where not already in progress, introduce a residential design SPD that states where adaptable/ accessible/ wheelchair standard homes will be required (as a quota or by reference to a site design guide) and what is meant by accessible or adaptable.
Ensure that developers are clear about what is expected of them in any proposed development, address concerns about financial viability or practical difficulties and consider any additional funding available to ensure viability and deliverability.
Include Lifetime Homes and
Increased production of Lifetime Homes and other suitable properties for people with physical disabilities
3.2, 5.2, 6.3
A44

Recommendation Details How to measure success Cross Reference to Report Section
Additional information
Bolsover Impact and OutcomesPractical Guidance – How
to
Wheelchair properties.
Include negotiations with developers.
Use evidence in this report to implement policy.
E. Develop ‘one-stop shop’ approach for services for people with disabilities
Could involve improved referral and co-ordination or replacement / integration of services.
Internal negotiations within authority, and with County and housing associations.
Increased satisfaction levels on residents, and improved PIs for service delivery (particularly DFGs)
2.2, 3.2, 3.3, 4.4, 6.3
G. Overcome barriers which discourage people moving to a more suitable property
Address concerns about the upheaval of moving, provide help with planning and moving, including advocacy through One Stop Shop service to explain and discuss all housing options and offer a range of tenure options; home ownership/shared ownership/social rent/affordable rent.
2.2, 4.4, 6.1, 6.3
H. Address Specific Rural / Urban and Black and Minority Ethnic group Equalities Issues where they exist.
No specific issues for have been noted in this study, but such issues should be considered when developing new homes and services, and in monitoring existing provision.
N/A
A45

General Recommendations
Addressing gaps identified in the wider study and overarching report
Recommendation Details Practical Steps Measures of
Success Additional Information
Cross Reference to Report Section in Overarchin
g ReportI..Raise Awareness
A. Raise awareness of the housing needs and aspirations of disabled adults and children and promote joint agency / partnership working.
Nominate a local elected member champion in each LA to promote this area amongst their peers and across agencies in the local area.
Establish a Disabled People’s Advisory Group ensuring local authority (strategic housing/planning/councillors), housing providers, health, social care, private sector landlords, housing developers, voluntary agencies and user representation.
Identify opportunities to raise awareness across a wide range of statutory and voluntary agencies.
Map information sharing opportunities over 6 monthly periods and secure speaking opportunities.
Raised profile of the importance of the need to respond to the housing needs of disabled people could be measured through the following:Increased understanding of the issues & their impact across agencies.Improved joint agency working Improved & shared data collection on needs
Performance monitoring shared across agencies resulting in improvements in re-housing and/or DFG delivery.
Improved consistency
Cross authority/ sub regional working may be the preferred model to share the administrative and operational burdens.
Much of the activity could be organised remotely via a specific section of a nominated website/s.
Consider how external information hubs such as hi4em can support a wider shared approach and place to collate and store evidence.http://www.hi4em.org.uk/
See also East Sussex in figures as an example of how an information hub that supports a range of organisations and programmes can be developed.http://www.eastsussexinfigures.org.uk/webview/welcome.html
2.1, 3.2
A46

Recommendation Details Practical Steps Measures of
Success Additional Information
Cross Reference to Report Section in Overarchin
g ReportIdentify existing fora and meetings at which this can be included as a standing item for discussion.
Look to emerging structures that will provide new opportunities for sharing information and agreeing solutions - e.g health and well being boards
in responding to needs across different housing tenures and areas.
J. Ensure housing needs assessments highlight the needs of disabled people
B. Ensure that housing needs assessments and strategic housing market assessments distinguish customer characteristics that influence design in new homes and the need for adaptations of existing homes.
Look at existing opportunities to increase information and data held (following mapping exercise below) – to inform decisions on additional data collection (e.g surveys) if necessary
Be clear about how and where in the assessment Map out the points at which disabled people contact the LA. Ensure that there is a clear agreed proforma to collect information at point of contact.Establish a clear route to the place/ post in the LA the information is collated.
Increased numbers for whom information has been gathered on contact
Quality of information – clear link between characteristic and (range of) intervention(s)
Assessments source and reflect numbers (need) linked to the different interventions required (new homes, reconfigured services
Short term: Proforma
Blackpool has a shared referral system for all frontline staff to identify housing issues and refer to Home Improvement Agency.
Royal Borough of Kensington and Chelsea developed a guide to help all professionals assess housing suitable for adaptations as part of its development of an accessible housing register
See appendix good practice examples
2.1, 2.3, 3.2, 4.1, 5.1, 4.6, 4.9
A47

Recommendation Details Practical Steps Measures of
Success Additional Information
Cross Reference to Report Section in Overarchin
g Report
Consider how other consultation exercises can be utilised to add to knowledge, in particular to address gaps identified. Process information held will be included.
developed and used across LA (and partners). Medium term: Proforma used in wider consultation exercises:JSNA, planning., adaptations etc.)
K. Promote preventative and early intervention investment
C. Promote preventative and early intervention investment, so that benefitting agencies (in particular health and social care) understand the value for money of investment.
Look to current and emerging structures that will provide opportunities for sharing information and agreeing solutions - e.g health and well being boards
Agree approach to measure outcomes and efficiencies/savings from different interventions
Agreed evidence base developed locally.
Used by all partners in their investment decisions
Long term success will be investment of health and social care funding in housing (e.g sustaining Home Improvement agencies in county/ sub region)
DFG guide (to be published soon) examples and recommendations on multi agency working and performance measuresAdaptations good practice measures from initial enquiry to delivery.
The resources needed for the production of regular reports, dissemination and the associated publicity could be produced at a sub regional level to reduce costs. Specific local issues could be inserted as a section of the shared resources to ensure local accountability.
3.1
L. Further Develop Home Improvement Agency
D. Develop an (existing) Home Improvement Agency and a system of
Work with HIAs to explore additional funding possibilities e.g. extending menu of services for self funders; social care and health investment
Sustainable HIAs.
Increased ‘reach’ and range of services (financial signposting; housing options etc.)
See appendix C good practice examples: Orbit 3.1
A48

Recommendation Details Practical Steps Measures of
Success Additional Information
Cross Reference to Report Section in Overarchin
g Reportrecycling adaptations – stairlifts in particular
Work with HIAs and ICES services locally to explore demand and opportunity
Easy access; cost effective and quicker provision of stair lifts
Increased customer satisfaction
M. Introduce more comprehensive stock condition survey and recording systems.
E. Introduce more comprehensive stock condition survey and recording systems.
Record nature of adaptation and level (e.g LHS, wheelchair etc)
Record nature of adaptation and level (e.g. LHS, wheelchair etc) jointly with provider partners.
Greater knowledge of what type of housing/ level of adaptation is available where, connected to location, facilities, transport etc.
Information could be basis for an accessible housing register across LAs and housing tenure, see overview report chapter 5.1.2 and appendix C good practice examples.
Consider how external information hubs such as hi4em can support a wider shared approach and place to collate and store evidence.http://www.hi4em.org.uk/
Extend approach to accessible housing register across LA partners where CBL does so. The CBL mechanisms/IT may be able to support development of the AHR. A shared approach to assessing adaptations would be required (as in example from RBKC).
2.2, 4.6
N. Agree a protocol for adaptations.
F. Agree a protocol for adaptations to homes across tenure, so that resources are more effectively
Identify fora where relevant professionals can be brought together to establish protocol, including housing option managers, provider partners and OTs.
Establish shared protocol and
Partners clear on the process for all adaptations and able to communicate to customers.
Adaptations delivered more effectively and in
Consider the development of a local disabled housing design code.
See appendix C good practice examples: Hull, Merlin housing society and Obit.
2.1, 3.2, 4.1
A49

Recommendation Details Practical Steps Measures of
Success Additional Information
Cross Reference to Report Section in Overarchin
g Reportused to meet the needs of more disabled people.
publicise widely through all partners networks, CAB, Age UK etc.
Use the protocol as opportunity to review the process for adaptations and remove unnecessary layers or requirements from the process of providing DFGs
Explore the potential to expand the remit of Age UK Derbyshire’s Housing Options service to be a vehicle for development/ delivery over the existing partnership of LAs and beyond.
Consider possibility of co-location of staff (e.g. OTs in housing sections) or mechanisms to support greater interaction and training across staff (housing options, OTs and technical staff)
This could include a reasonableness policy that encourages OTs, at the point
better timeframes.
Increased satisfaction with process and delivery of adaptations
A50

Recommendation Details Practical Steps Measures of
Success Additional Information
Cross Reference to Report Section in Overarchin
g Reportof assessment to:
- Give good quality information to disabled people about the housing options available to them
- Give realistic prospects for the prompt delivery of recommended adaptations
O. Ensure private sector / developer obligations are enforced
G. Ensure provate sector / developer obligations are enforced in a co-ordinated way across the study area.
Identify opportunities to bring together OT, housing and Planning expertise, plus local disabled people and representatives in development of a design guide.
Engage OTs in detailing key features required to improve adaptability of new homes. Use this together with site design guides to ensure that both developers and development control understand what you require and S106 agreements to deliver these. Take specific design requirements into account in determining site
Increased customer and stakeholder satisfaction
Long term reduction in increased demand for DFGs (against predicted increases)
3.2, 5.1
A51

Recommendation Details Practical Steps Measures of
Success Additional Information
Cross Reference to Report Section in Overarchin
g Reportviability.
P. Use publically owned land to meet needs
H. Agree a partnership approach to how how publically owned land can be used to improve the viability of homes that are designed specifically for the needs of disabled people,
Map out potential public land and partners
Identify fora in which discussions and agreement about best use of land can be established
Use (for example) ‘less than best’ sale or gifting, and site swaps to enable more viable development
Have clear and agreed local policies on use of land
3.2, 5.1
A52

Annex 4: Good Practice
A53

Annex 4: Good Practice Examples
Some of the examples below are set within the overarching report; others are linked to the key recommendations being made.
Housing as effective prevention of increased social care/ health needs (and costs):
The Southwark discharge pathway15 involves social workers placed in older peoples wards in two hospitals to identify people early on for intermediate care and proactive planning. The social workers are supported by a multi disciplinary team which includes occupational therapists and physiotherapists providing home based rehabilitation. This approach has resulted in:
Reduced stay in the wards 12% reduction in admittance to residential and nursing care Reductions in the care packages required on average from 16 to 12 hours.
Wolverhampton Council has used very sheltered housing explicitly as a direct alternative to residential care. Over a decade from 1997, the council has evaluated that the demographic trend would have led to an increase in residential care from 814 to 1,050 cases, but use of alternative very sheltered housing solutions has led to a fall to 588 placed in residential care. From its first very sheltered scheme, it estimated to have saved £123,000 on costs of care over two years; later evaluation of two other schemes estimated savings of 48% and 24% respectively.16
Accessible housing registers and CBL:
Royal Borough of Kensington and Chelsea (UKHA finalist 2010)RBK&C, and many London boroughs, have CBL but provided a separate allocations process for disabled (specifically wheelchair user) households. This perpetuates a sense of exclusion and a medical, ‘special needs’ approach to housing solutions, and reduced the level of choice households could exercise.
RBK&C developed an accessible housing register to address this and to enable households with a member using a wheelchair to exercise similar control over their housing situation.
A target was set for up to 75% of the social housing stock in the borough to be assessed for accessibility, given an accessible housing category, and for full, accurate and consistent information to be available in the CBL system. 90% was actually assessed by qualified OTs/ trained OT assistants and consistent information collected. This enabled a much speedier response when properties became vacant.
A guide was also produced for the Health and disability assessment Team to use. The aim was for a consistent and objective approach to all assessments for eligibility to enable people to bid for the appropriate category of properties.
15 Dept of Health (2009) Use of resources in adult social care: a guide for local authorities, p2716 Dept of Health (2009) Use of resources in adult social care: a guide for local authorities, pp 32-33.
A54
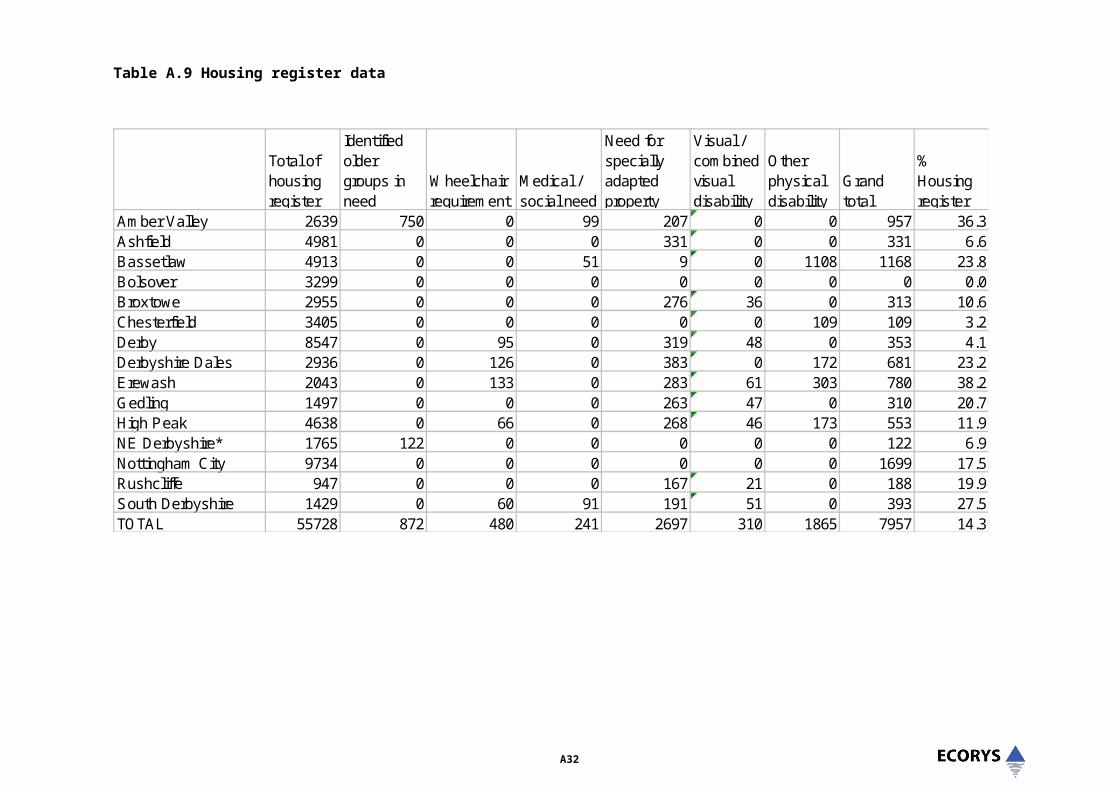
IT was an important element in the project, supporting data collection and management, facilitating the assessment of properties and calculation of an accessible housing category. It included use of a digital pen to complete property surveys.
Achievements:
In 2006/07 CORE returns revealed that 70% of wheelchair homes were let to households without a wheelchair user; with the new register this will only happen if no family with a wheelchair user wants the property
Households are not required to visit inaccessible homes (for example, corridor widths enable people to assess if their wheelchair will be able to access property)
Landlords’ awareness of what constitutes accessibility is being increased The awareness and sensitivity of staff to disabled householders’ needs is increasing It provides an inclusive approach consistent with the social model of disability Better knowledge of stock enables a quicker response and less void time, and feeds into
greater strategic planning for needs
Protocol for joint approaches to adaptations:
Oldham Housing Investment Partnership has developed a protocol for Delivering Equipment and Adaptations between the major registered housing providers and Oldham Council. The protocol includes the following:
Agreed process and procedure for dealing with adaptations An agreed set of measurable standards of performance Agreement as to sources of funding for major and minor adaptations Clarity over maintenance procedures, responsibilities and contractor standards The delivery of the agreed Housing Adaptations Work plan
The registered housing providers have agreed to finance:
Minor adaptations up to £1000 – Housing organisationMajor adaptations £1000 - £8000 – costs shared equallyComplex adaptations over £8000 – will be agreed through discussions between the council and the housing organisation
In addition, an Accessible Housing Co-ordinator has been appointed to:
Develop and co-ordinate a register/database of adapted properties and a register of disabled people who require rehousing.
Ensure a common process is implemented by housing providers for assessing requests and the letting of adapted properties
Co-ordinate protocols and common policy to ensure a range of options are considered prior to investing in existing social housing
A55

Review of and streamlining procedures:
Leeds City Council brought in a range of measures to reduce DFG bureaucracy which resulted in a greatly speeded up service including:
Reduction and simplification of paperwork and use of e mail for standard letters, schedules, approvals and receipt of final documentation with contractors
Fixed scheme costs for a range of standard adaptations such as wet floor showers. This has removed the need for quotes and assessments by using standard specifications.
Scanned drawings act as schedules A contractors “fining system” which sees a reduction (£300) off the standard price for defects
that stop use of facilities at final inspection and/or for late final paperwork Professional close working relationship with a small group of selected contractors and internal
partners has led to major resource savings
Wolverhampton City Council introduced a Small Adaptations Grant (SAG) under the 2002 Regulatory Reform Order. The SAG is used for installation of stairlifts and ramps and uses a simplified and streamlined application process. In 2008/2009 - 70 SAGs were awarded with average time from receipt of referral to completion of works of 8 weeks. The numbers of SAG’s in 2009/10 and 2010/11 have remained similar; however timescales have since increased slightly due to financial constraints.
Since the Government's General Consent in 2008, St Helens Council have used the increased flexibility in relation to DFG funding to provide a flexible ' fast track' DFG through its Housing Assistance Policy. The fast track grant is available to all clients who have an OT assessed need for mandatory DFG but where the total cost of works is less than £2,000. The 'fast track' process eliminates the need for applicant means testing and provides a timely, less bureaucratic process to enable low cost adaptations. The 'fast track' DFG is also available for tenants of Registered Providers within the Borough whose landlords enter into a partnership arrangement with the Council and provide 50% funding towards the cost of adaptations to their stock. This approach has lead to a significant reduction in the time taken to grant approval across all DFG applications due to the release of staff resources (a reduction of more than half in less than three years) and has also resulted in a higher level of customer care and satisfaction.
Breaking down silo working – co-location, shared training and development of staff:
From 1996 South Gloucestershire Council has worked collaboratively across departments and with the health service to improve the way in which adaptations are delivered. Multi agency panels were established to discuss complex cases and schemes exceeding the grant limit. Joint training takes place re.g.ularly with private sector housing staff and occupational therapists. The procedure avoids duplication with joint visits only taking place where technical solutions are unclear, usually around 10% of cases.
A senior occupational therapist has been seconded to the Private Sector Housing Team since 2003 and has direct responsibility for managing the technicians providing small adaptations, supporting customers requiring complex adaptations, advising the multi agency panels and advising the Housing Partnership on new affordable housing schemes. Merlin Housing Society, the
A56

LSVT association, also benefits from having an occupational therapist seconded by the Council to inform the association’s major works programme.
Through closer working the Council has achieved significant reductions in the time taken for standard adaptations and has smoothed the process for more complex cases. The service can evidence urgent schemes involving straight track stair lifts, automatic toilets and even, in one case where a customer was confined to the first floor of their home, a through-floor lift being installed within one week of the need being identified.
In St Helens the OT services are based in the same location and under the same management as the Home Improvement Agency and technical services, thereby providing a ‘one stop shop’ for clients. This ensures a co-ordinated approach to service delivery and maximises client access to a range of additional support and preventative services.
Making best use of stock – opportunities from renewal and reconfiguration:
e.g. Reconfiguring existing stock
Hull City Council’s conversion of hard to let one bed bungalows (This would not meet physical disabilities so easily but might be suitable for people with sensory impairments. Also thinking a bit beyond straightforward reconfiguring – making best use they can of stock)
Hull had a large number of one bedroom bungalows for people over 55 that were increasingly difficult to let. However the demand for two bedroom properties remained high, and consultation with stakeholders (including the Tenants’ Forum and Service Improvement Group) highlighted the need to:
Meet the needs of the community Enable people to remain independent lifestyles Increase income from stock and tackle voids.
Whilst the one bedroom bungalows were not suitable for conversion to two bedroom, four designs had available ‘dead space’ (previously for laundry facilities) which could be converted to a sleep-over space, big enough for a bed and minimal furniture, which would facilitate carer’s staying over.
The conversion work added only £1 pwk to rent and the council have seen an increased demand for the properties and high levels of customer satisfaction.
The Council are considering the suitability of other properties for similar work, for example one bed sheltered flats, to enable other households to remain independent for longer.
e.g. Inclusion of accessibility features in Decent Homes Work/ refurbishment
Merlin Housing Society, the association set up to receive South Gloucestershire Council housing stock in 2007, has worked positively to address adaptations. Although the transfer agreement only required the association to carry out adaptations up to the value of £1,000, good value for money has been achieved by adapting properties during the Decent Homes programme with the association contributing the cost of a standard bathroom replacement, typically around £1,700, and
A57

the Council topping up the budget to provide a level access shower. The association also provides two intermediate care units for use where a customer is unable to live in their home during adaptation works, usually to enable discharge from hospital where major adaptations are needed before they return home.
Orbit Housing Association is piloting the installation of wet rooms when upgrading and completing Decent Homes Standard work. Tenants who want a bath will still be able to have a standing one installed, that will be easy to remove when it is no longer suitable.
Recycling adaptations:
Somerset and Bath and NE Somerset Care and Repair have set up an award-winning service to recycle stair lifts. The agency put together a funding package using lottery money earmarked for recycling, along with money from other charitable sources. They have a storage facility and workshop in an industrial unit near their office. They obtained technical training from the leading manufacturers and are now re.g.istered as dealers and re-sellers for 3 manufacturers. All the returned lifts, some of which are quite new, are serviced, steam cleaned and disinfected and the fabric and foam on seat covers are replaced. They offer services for private sector service users, local authorities and local housing associations. They can offer a recycled lift at half the cost of a new one. They provide a rapid turnaround and also offer a warranty scheme and a breakdown service. The facility is advertised on their website and they get donations of lifts from a wide area.
The scheme has developed so that the agency can now offer a full stair lift service, providing both new and reconditioned, straight run and curved rail lifts. A Consumer Credit Licence has also been obtained which allows the Agency to offer both lease and hire purchase options. The lease option is of particular use for short term or end of life situations.
Expanding existing resources – Home Improvement Agency:
Orbit’s HIA provides adaptations in several local authority areas. They have employed OTs and also student secondments to strengthen their service offer (and provide valuable work experience) and they work closely with their contractors, which includes Orbit’s Direct Labour Organisation to deliver adaptations. Recent restructuring has streamlined their management and the technical team provide support from assessment to final stage. Processes they are applying in one are (Burton and Stafford) are providing examples of how they can support stronger delivery of adaptations for other local authority partners.
County wide strategic approaches:
Wolverhampton City Council has established a contractual arrangement for the supply and installation of lifts that provides a ten year warranty. This was achieved through competitive tendering and provides for annual servicing and a full parts and labour warranty. Where the lift is no longer required, the supplier will remove and store the lift free of charge and refit it in another property with any required refurbishment and with the remainder of the warranty remaining in place. In 2010/11 13% of installations were of recycled lifts. This arrangement replaces a stairlift maintenance scheme that provided help to recipients of DFGs but was administratively relatively costly.
A58
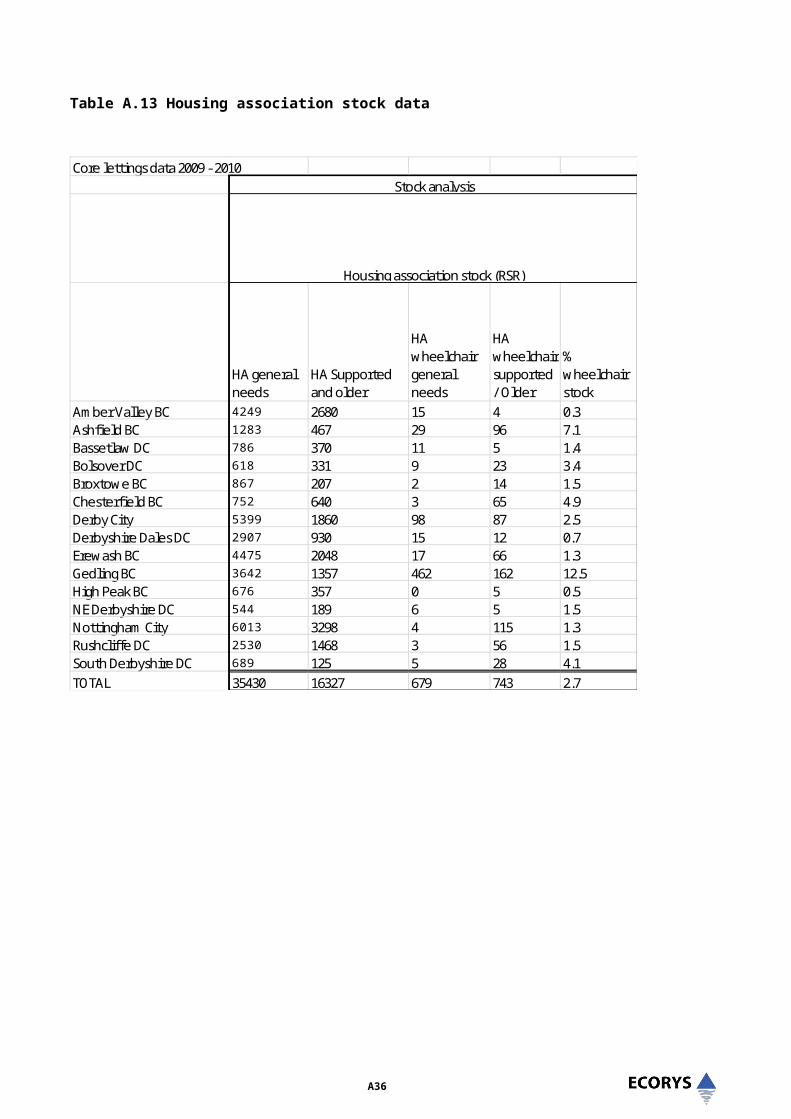
Aids and adaptation delivery:
Birmingham City Council
The council has improved services and addressed backlog by streamlining access arrangements and prioritising effectively.The approach is to look at all options and funding streams which could be used to address needs. This can include:
Care and support packages Charitable funding through the cross tenure House Proud scheme Link into the Decent Homes programme Relocation to suitable property – e.g via the Wise Move scheme promoting better use of
stock and supporting moves to more suitable accommodation.
Purbeck Housing Trust
Resident involvement across a range of services including aids and adaptations led to an improvement of delivery and customer satisfaction. It conducted a mapping exercise of its residents to enable a targeted awareness raising campaign to ensure people knew what services they could receive and how to apply. Tenants receive clear information on the process and standards.
Other improvements include greater speed in delivery and offering adaptations as part of planned maintenance and improvement. Assessments for minor works are completed within 2 days of a referral/application and delivered by a responsive repairs contractor within 20 days; OTs were involved in training staff to undertake assessments for these works. Due to the backlog, Purbeck increased its threshold for minor works from £500 to £3,500. Major works are improving with assessment and completion increasingly being within 50 days (the target is 90 days).
Service standards are clear and set by an Independent living group that includes tenants. Satisfaction with the minor works service has increased to 97%
Homes in Havering
The ALMO and contractor partners proactively use profiling to identify tenants and anticipate needs to tailor planned maintenance programmes. Identifying potentially vulnerable new tenants has meant minor aids such as grab rails can be in place before they occupy the property.Residents who have used the service were involved in the review and setting performance measures. An overall target was set from requests for assistance to delivery in 87 days (with assessments from OTs within that in 28 days). Effective liaison with OTs means advice is given within 10 working days, and the average time to deliver the adaptation is 50 days. Residents are aware of the service standards and kept informed throughout the process; satisfaction has increased.
Fixed aids are recycled for example, stairlifts and shower cubicles, and there is a regular maintenance regime. Adapted properties are also allocated through a disabled housing register to improve effective use of stock.
A59

A single point of access and a team of OTs seconded from the council have helped to streamline the service. More work is being done to plan for current and future need through research on demographic changes.
Developing new homes:
Papworth Everard
Closure of a residential care home for disabled people led to the development of a number of new flats in Papworth Everard, both private for sale and accessible housing, with a private developer. Design was an important feature to increase security, not making the accessible housing appear different and resulted in improved circulation space, wider doors and lifts in communal areas. Location was also am important factor, sited near to community facilities and employment opportunities. Disabled people were involved at planning and design stages.
Learning from other schemes in the East of England (e.g Peterborough One Community) also highlights the value of appointing an inclusive design champion and all teams formally adopting inclusive design principles (design, construction and management teams)17.
17 Papworth Trust(2008) Guide to developing inclusive communities, pp21 and 28.
A60