Embed Size (px)
Citation preview
Ecosystems haveEcosystems have complex dynamicscomplex dynamics
• By Sven Erik Jørgensen• By Sven Erik Jørgensen• Environmental Chemistry• University Park 2• 2100 Copenhagen Øg• Denmark• sej@farma ku dk or• [email protected] or
[email protected] page: www ecologicalmodel net• Home page: www.ecologicalmodel.net
Outlines
• Ecotones• Two types of ecology• Properties of ecosystems included the p y
application of the thermodynamic laws on ecosystemsy
• Description of ecosystem development by the use of gradients, as complex,the use of gradients, as complex, adaptive, hierarchical, self-organizing systemssystems
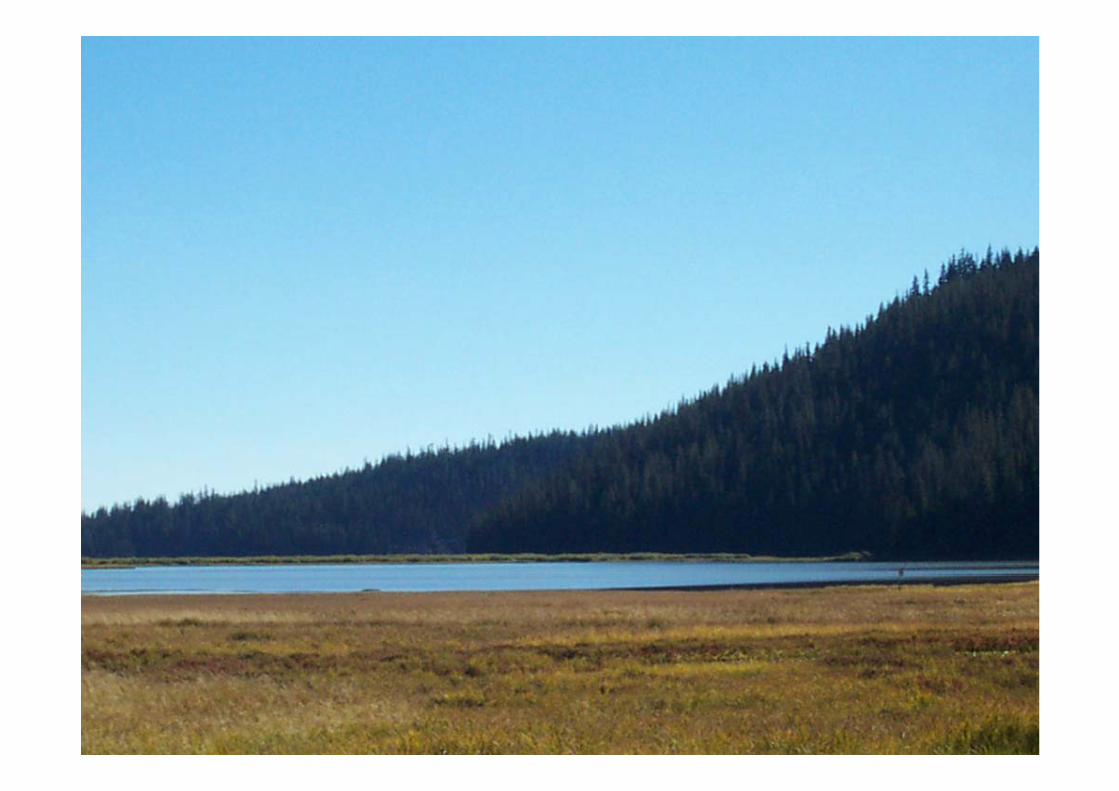
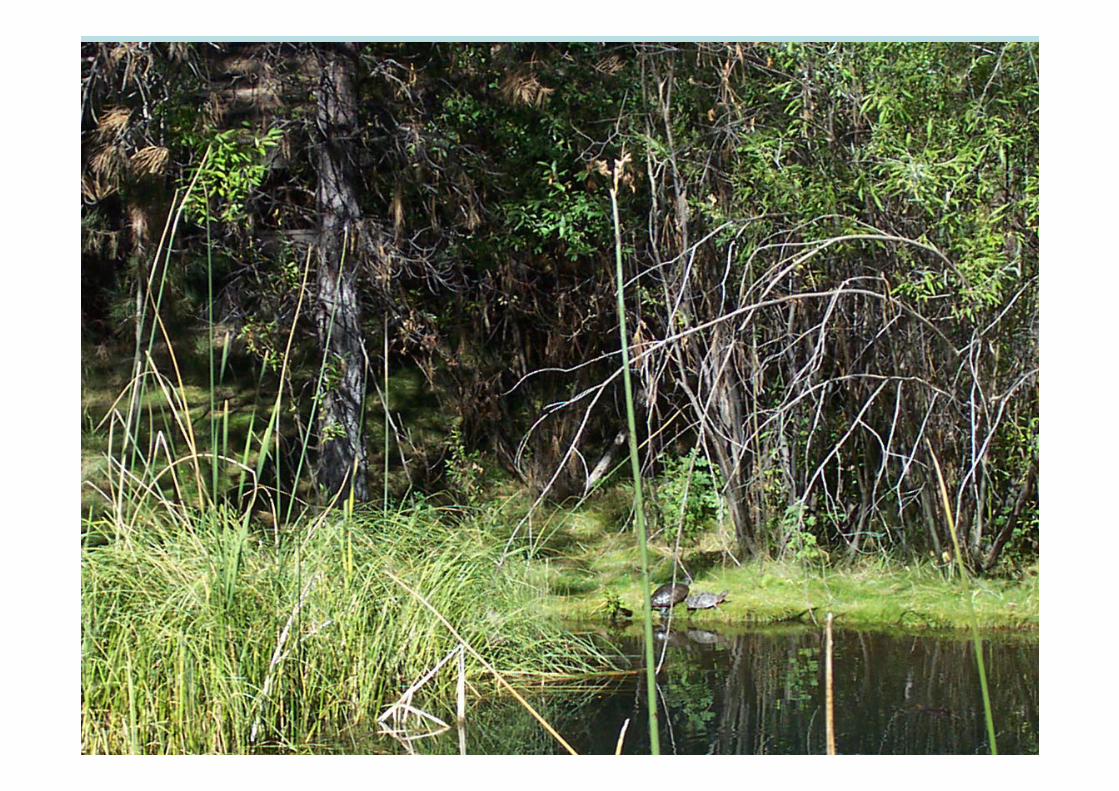
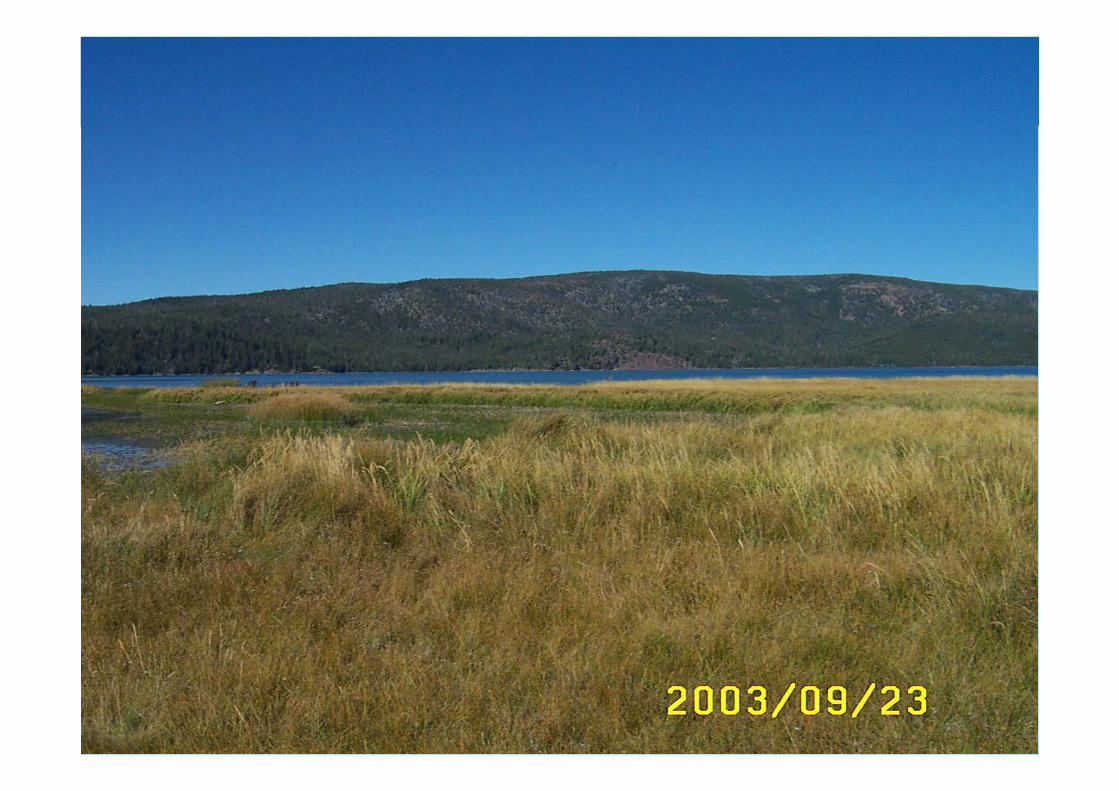
Importance of ecotones
• Buffer zones between two ecosystems - the transition zones are for ecosystems as theare for ecosystems as the membrane for cells
• Often high biodiversity, representing both the adjacentrepresenting both the adjacent ecosystems
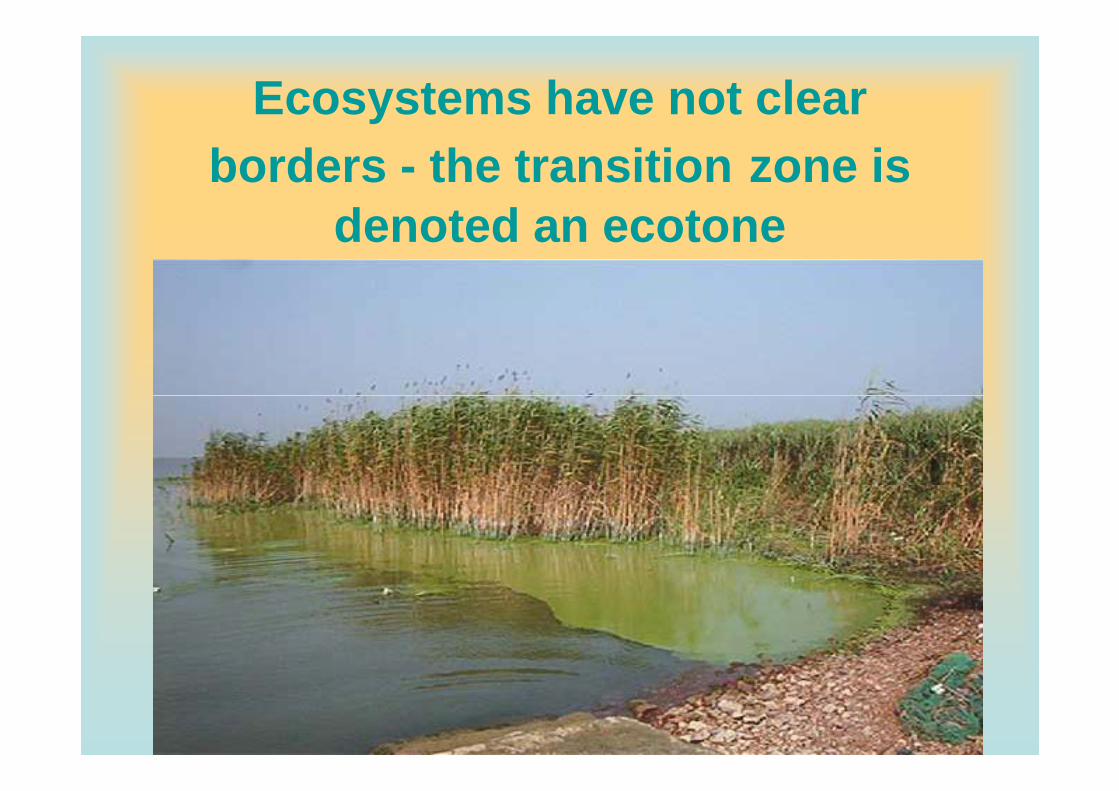
Ecosystems have not clear borders - the transition zone is
d t d tdenoted an ecotone
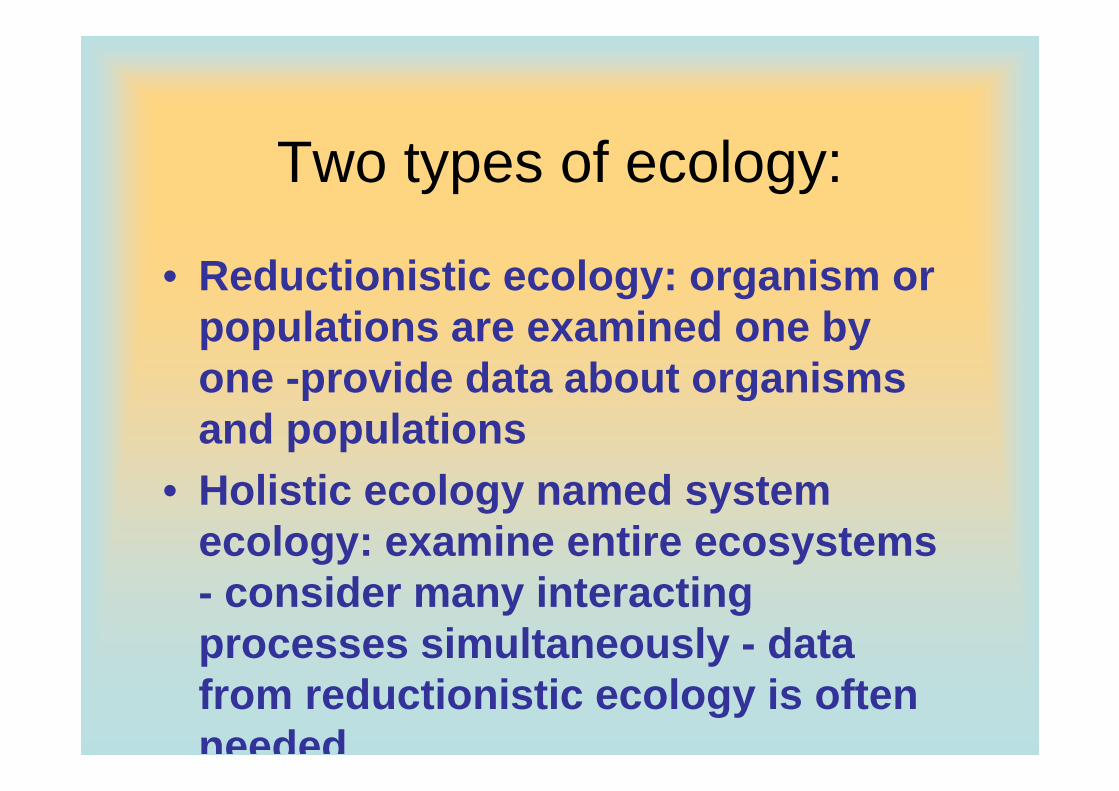
Two types of ecology:
• Reductionistic ecology: organism or populations are examined one by one -provide data about organisms p gand populations
• Holistic ecology named system• Holistic ecology named system ecology: examine entire ecosystems - consider many interacting processes simultaneously - data p yfrom reductionistic ecology is often needed
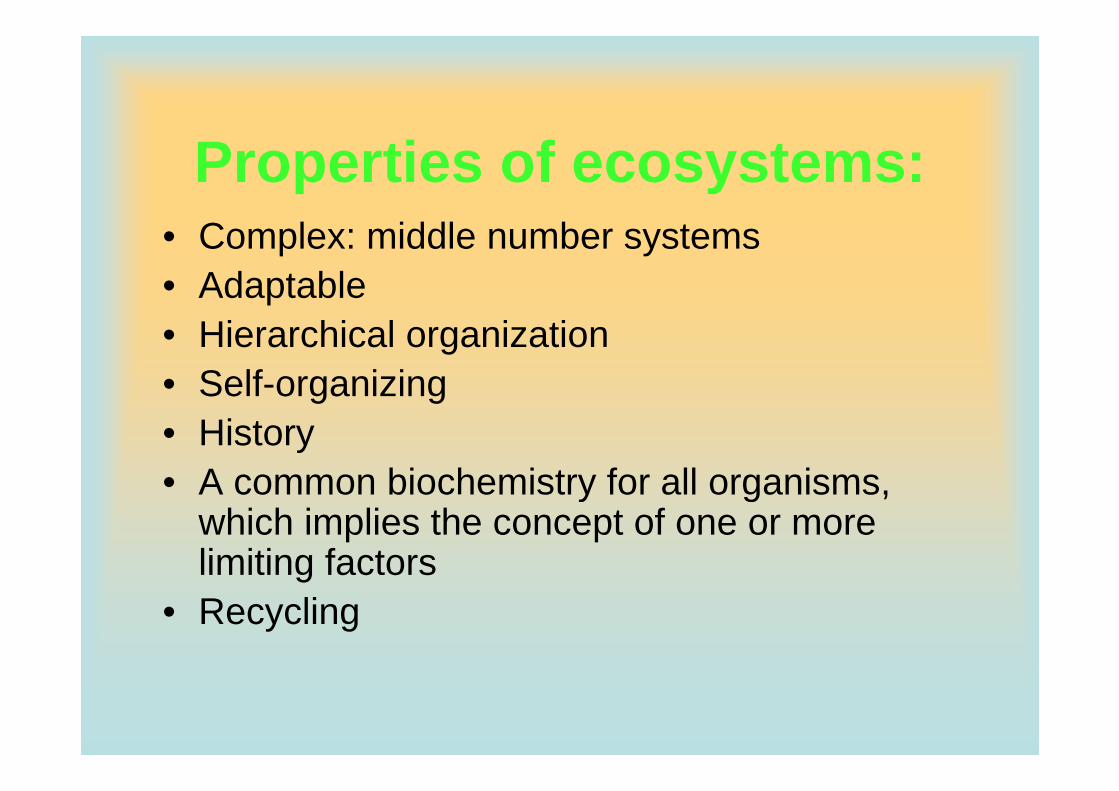
Properties of ecosystems:• Complex: middle number systems• Adaptable• Hierarchical organization • Self-organizingSelf organizing • History• A common biochemistry for all organisms• A common biochemistry for all organisms,
which implies the concept of one or more limiting factorsg ac o s
• Recycling
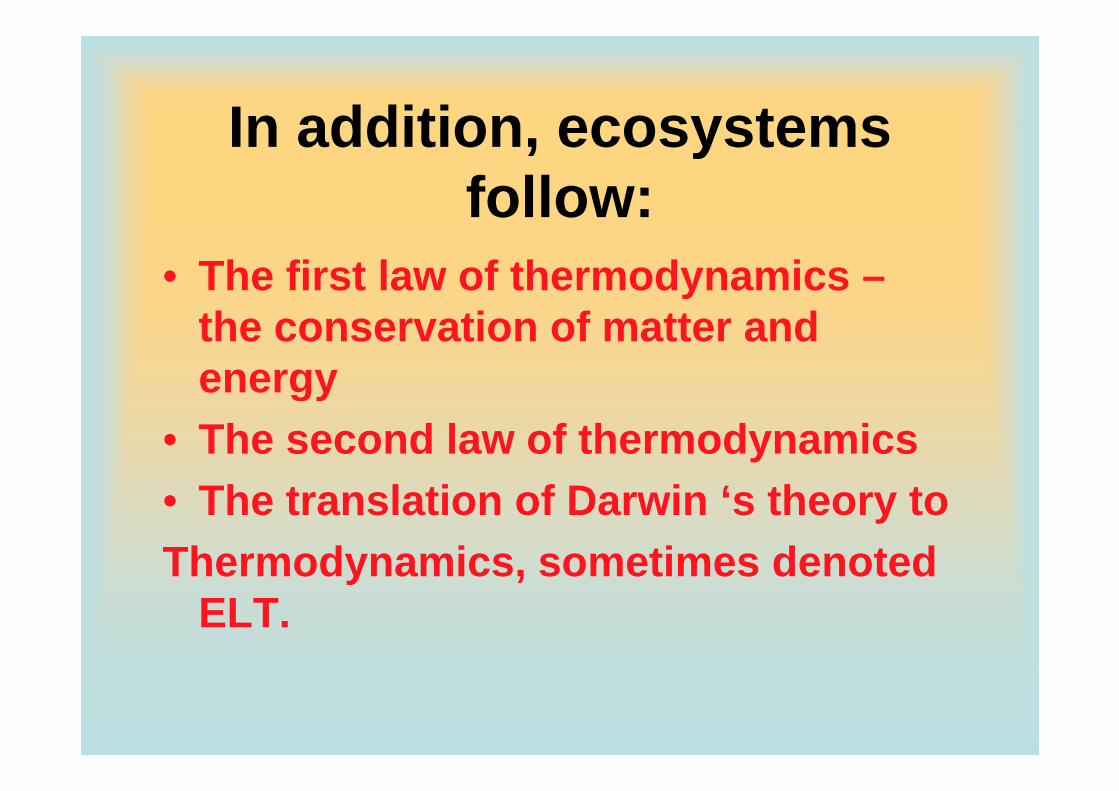
In addition ecosystemsIn addition, ecosystems follow:follow:
• The first law of thermodynamics –the conservation of matter and energygy
• The second law of thermodynamicsTh t l ti f D i ‘ th t• The translation of Darwin ‘s theory to
Thermodynamics, sometimes denotedThermodynamics, sometimes denoted ELT.
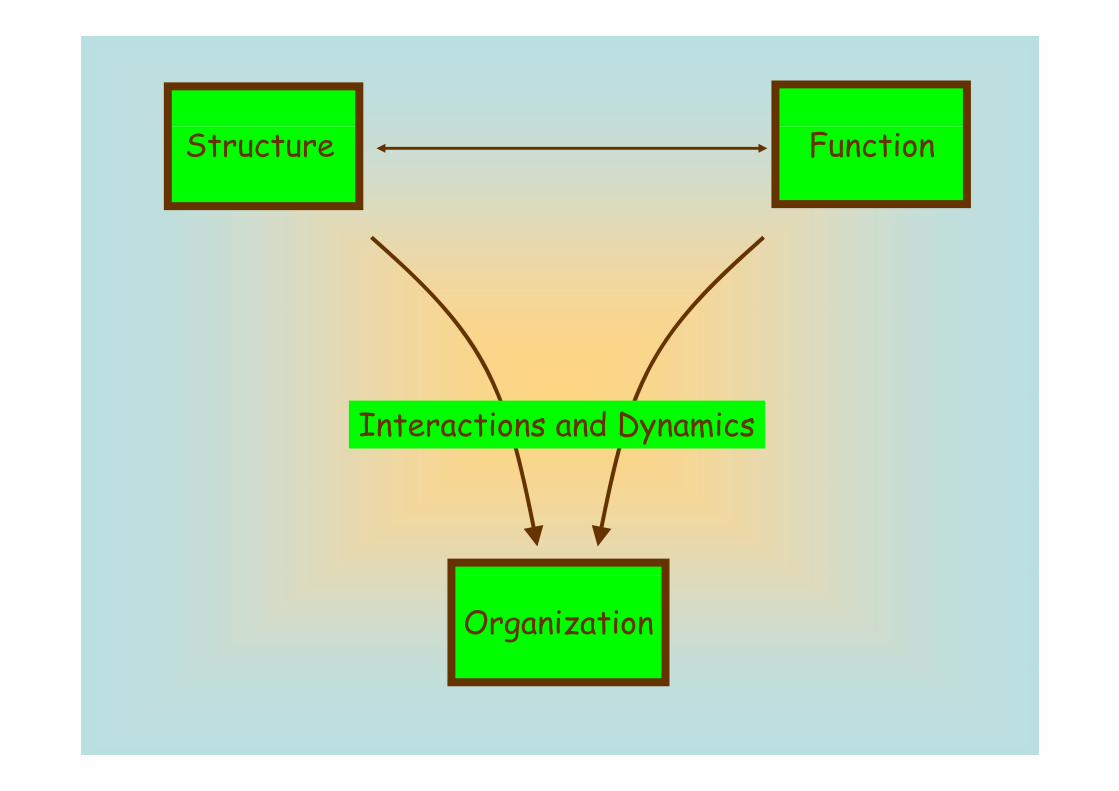
Structure Function
Interactions and Dynamics
Organization
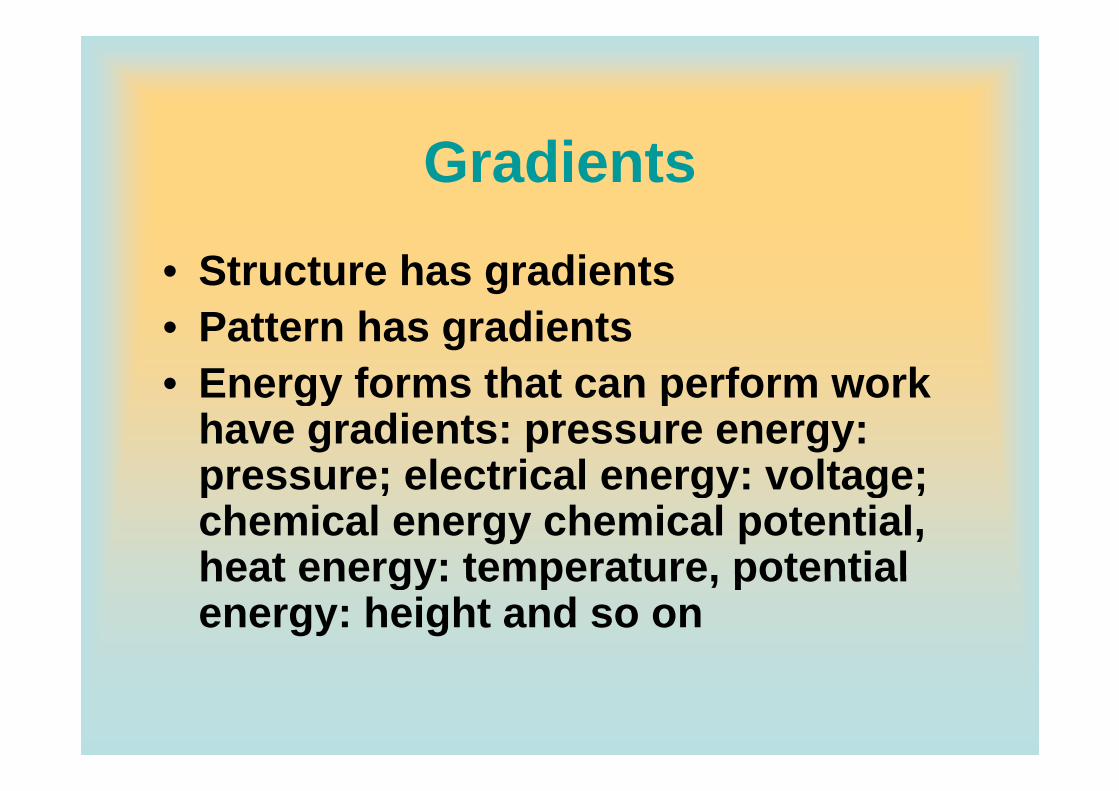
Gradients
• Structure has gradients• Pattern has gradients• Energy forms that can perform workEnergy forms that can perform work
have gradients: pressure energy: pressure; electrical energy: voltage;pressure; electrical energy: voltage; chemical energy chemical potential, heat energy: temperature potentialheat energy: temperature, potential energy: height and so on
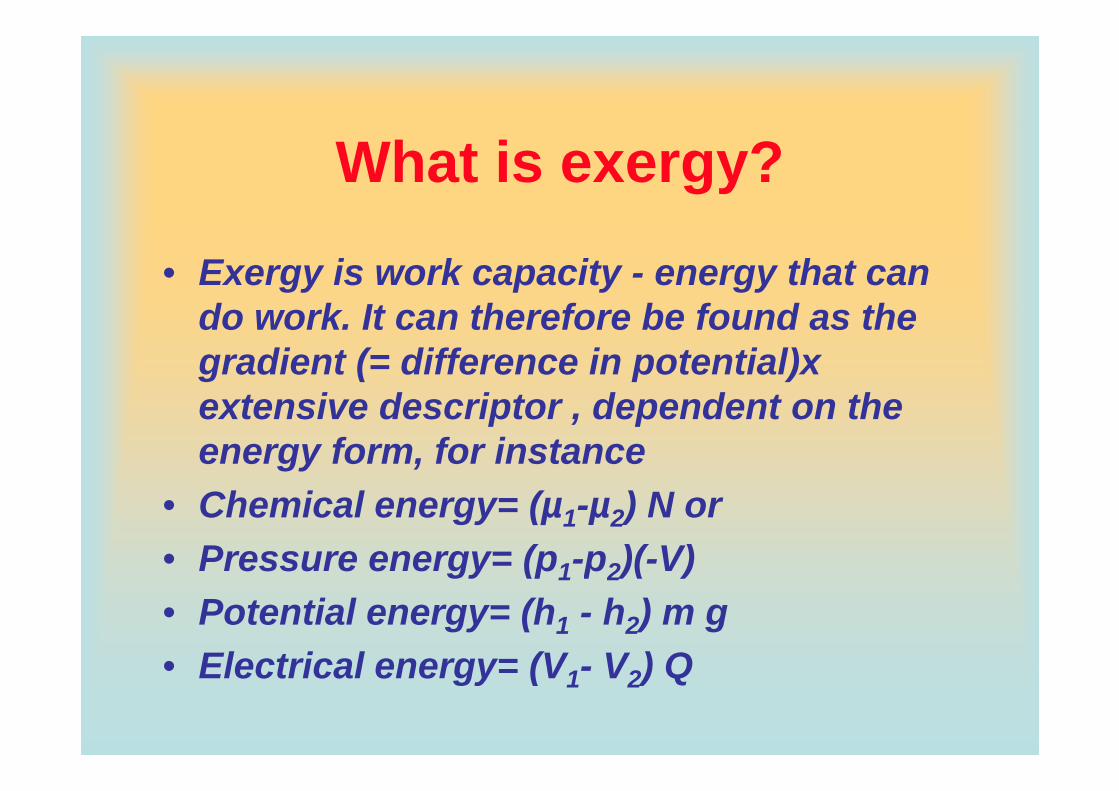
What is exergy?
• Exergy is work capacity - energy that can d k It th f b f d thdo work. It can therefore be found as the gradient (= difference in potential)x
t i d i t d d t thextensive descriptor , dependent on the energy form, for instance
• Chemical energy= (µ1-µ2) N or • Pressure energy= (p1-p2)(-V)gy (p1 p2)( )• Potential energy= (h1 - h2) m g• Electrical energy= (V V ) Q• Electrical energy= (V1- V2) Q
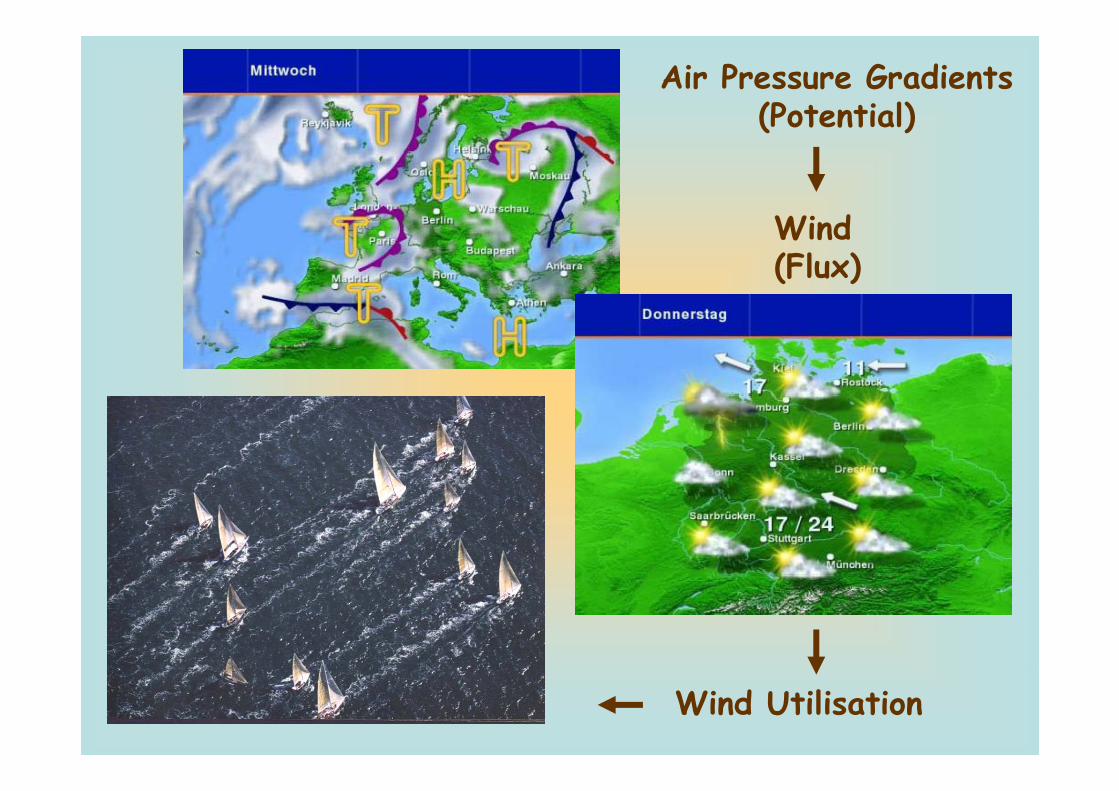
Air Pressure Gradients(Potential)(Potential)
Wi dWind(Flux)
Wind Utilisation
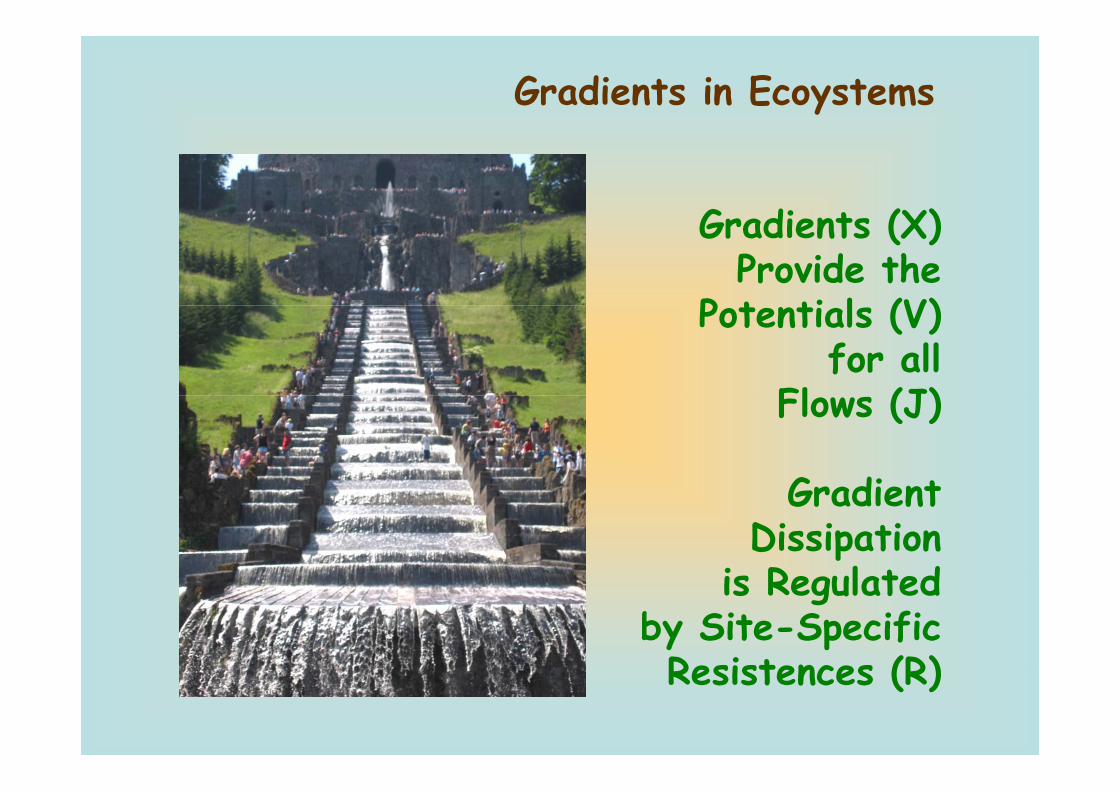
Gradients in Ecoystems
G di t (X)Gradients (X)Provide the
P t ti l (V)Potentials (V)for all
Fl (J)Flows (J)
G di tGradientDissipation
i R l t dis Regulatedby Site-SpecificR sist n s (R)Resistences (R)
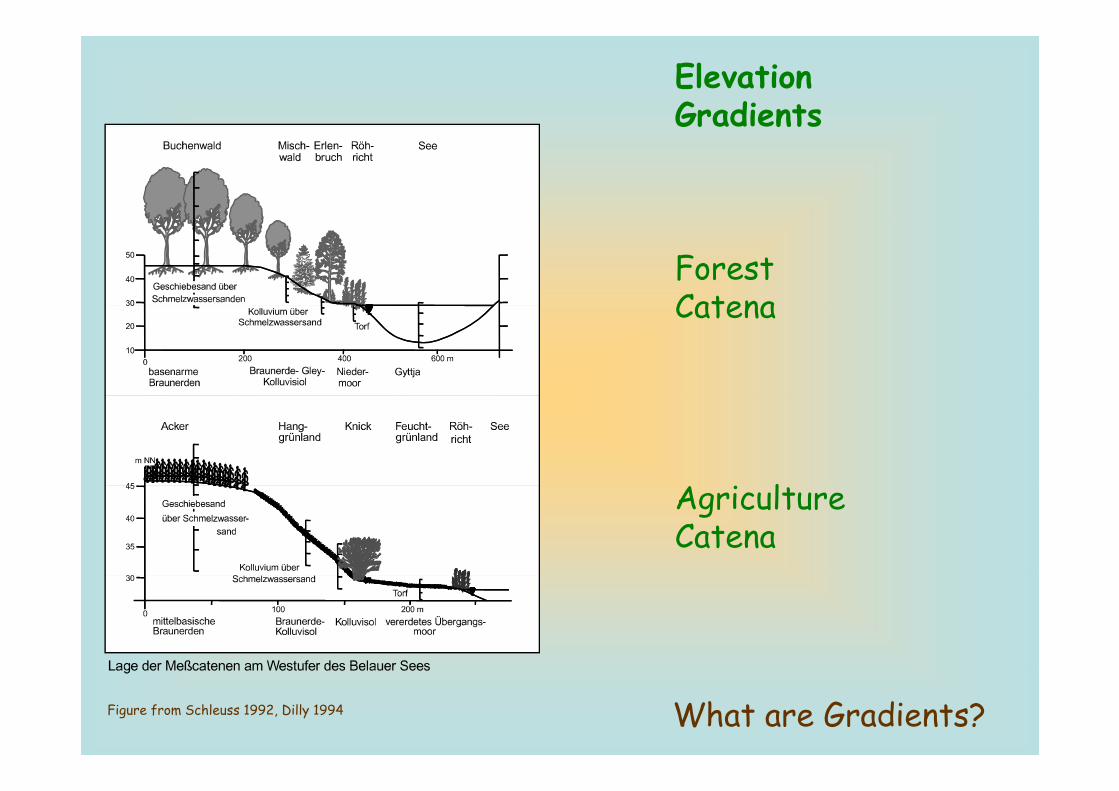
ElevationGradientsGradients
Forest CatenaCatena
lAgricultureCatena
What are Gradients?Figure from Schleuss 1992, Dilly 1994
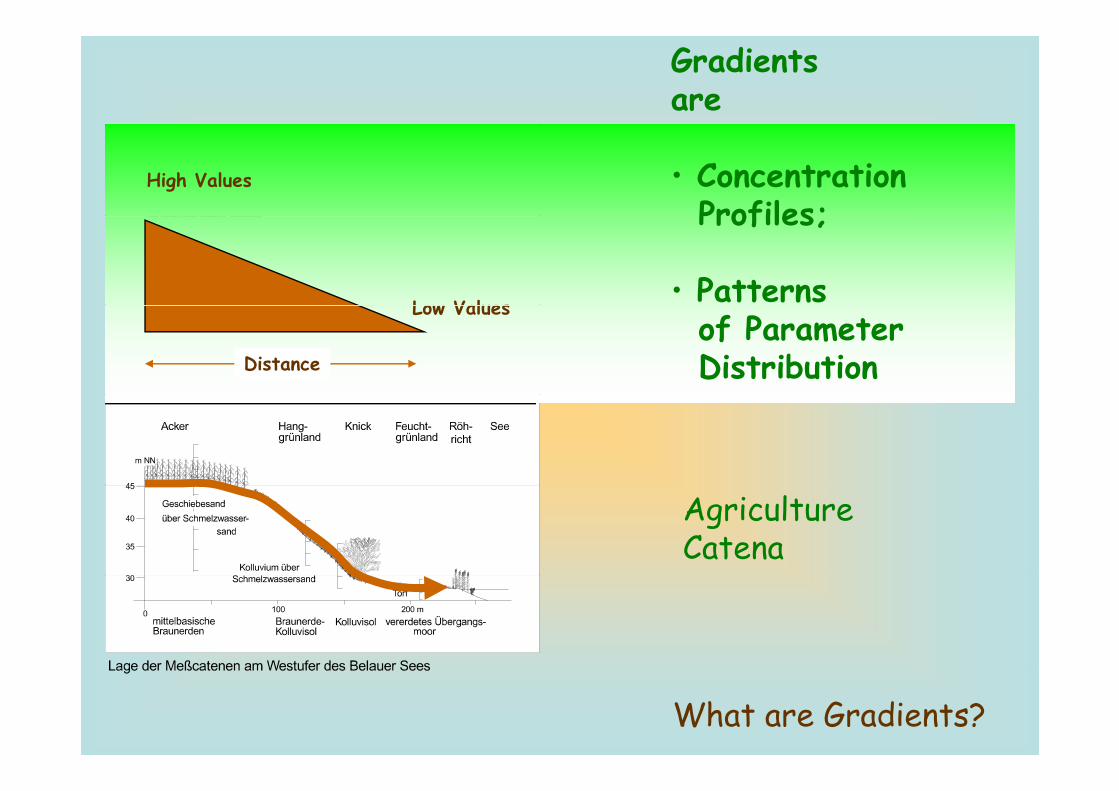
Gradientsare
• ConcentrationProfiles;
High Values
Profiles;
• PatternsLow Valuesof ParameterDistribution
Low Values
Distance
AgricultureCatena
What are Gradients?
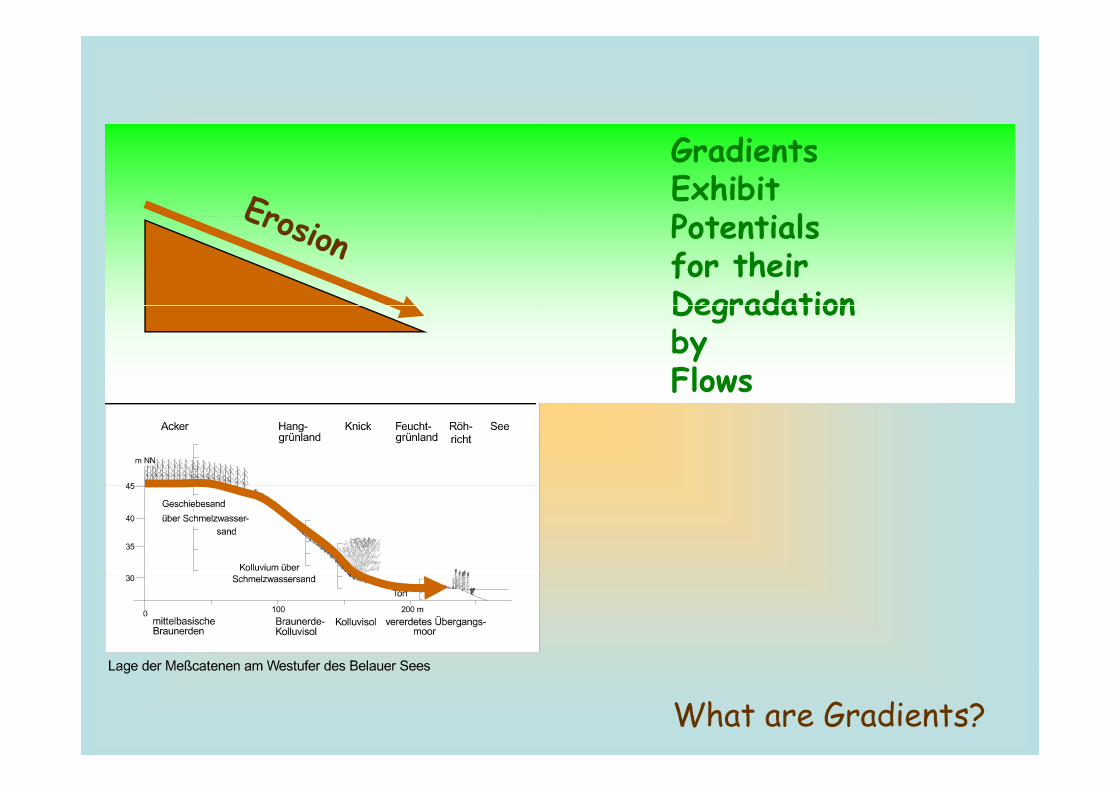
GradientsExhibitP i lPotentialsfor their DegradationDegradationbyFlows
What are Gradients?
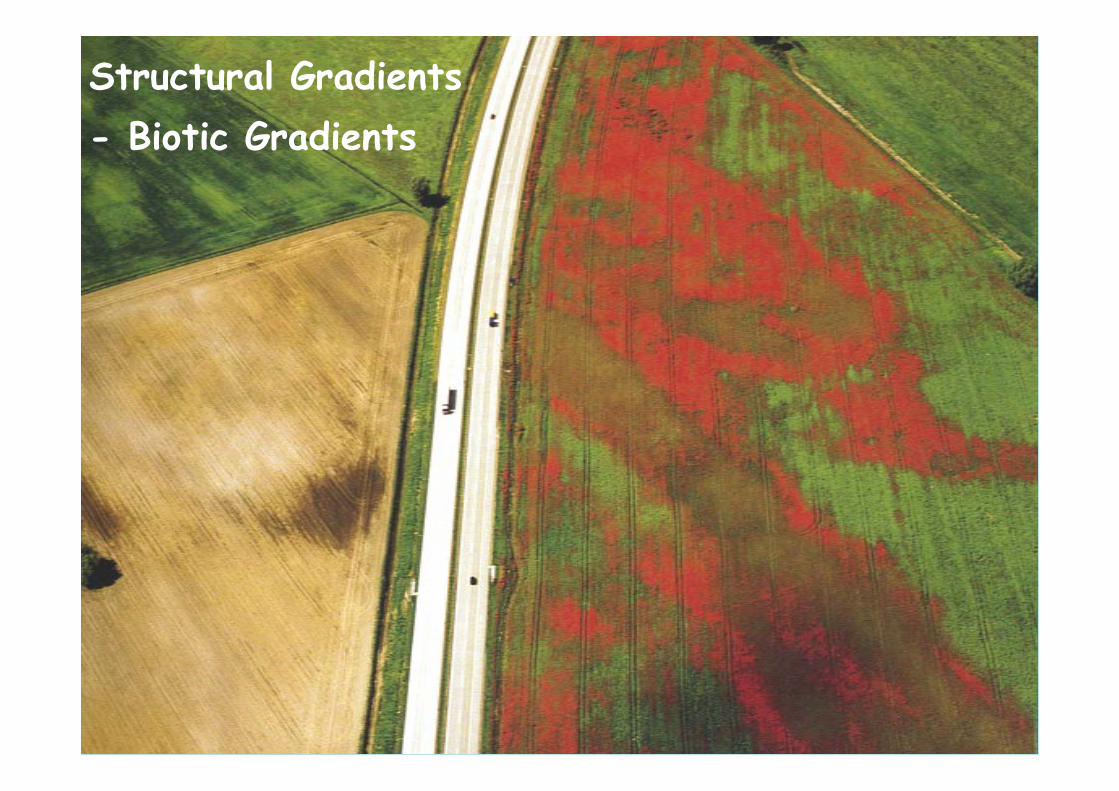
Structural GradientsBi ti G di t- Biotic Gradients
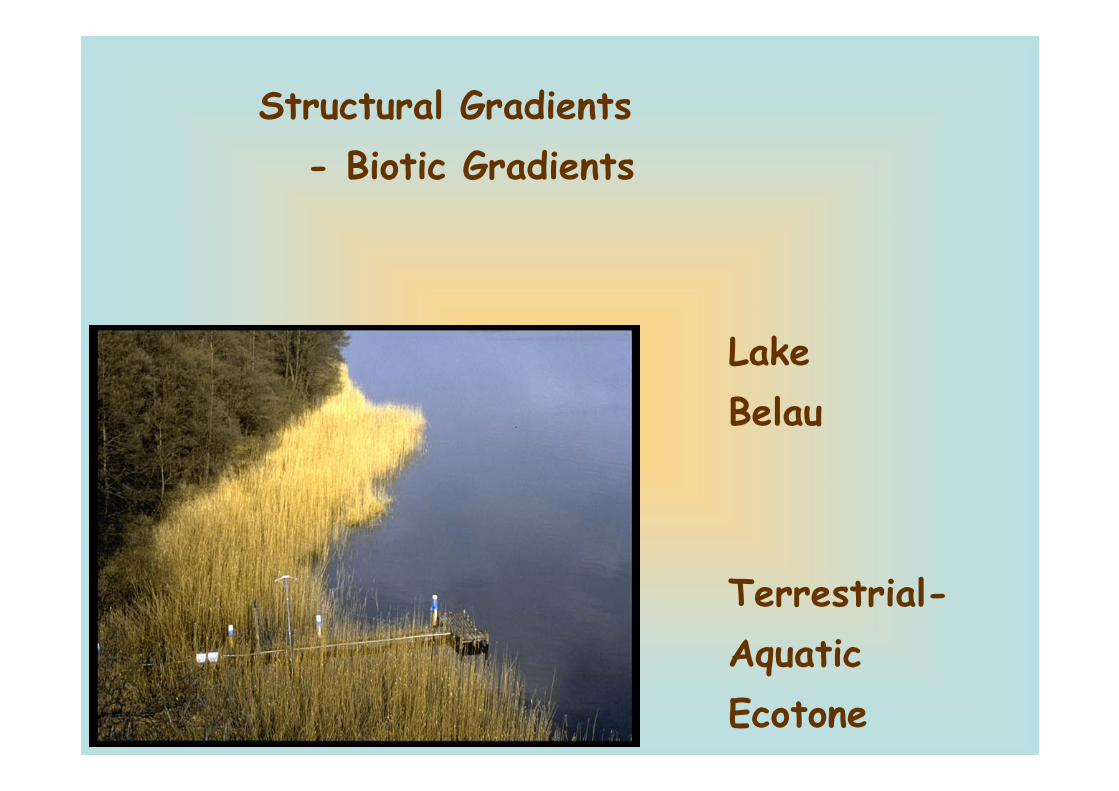
Structural Gradients- Biotic Gradients
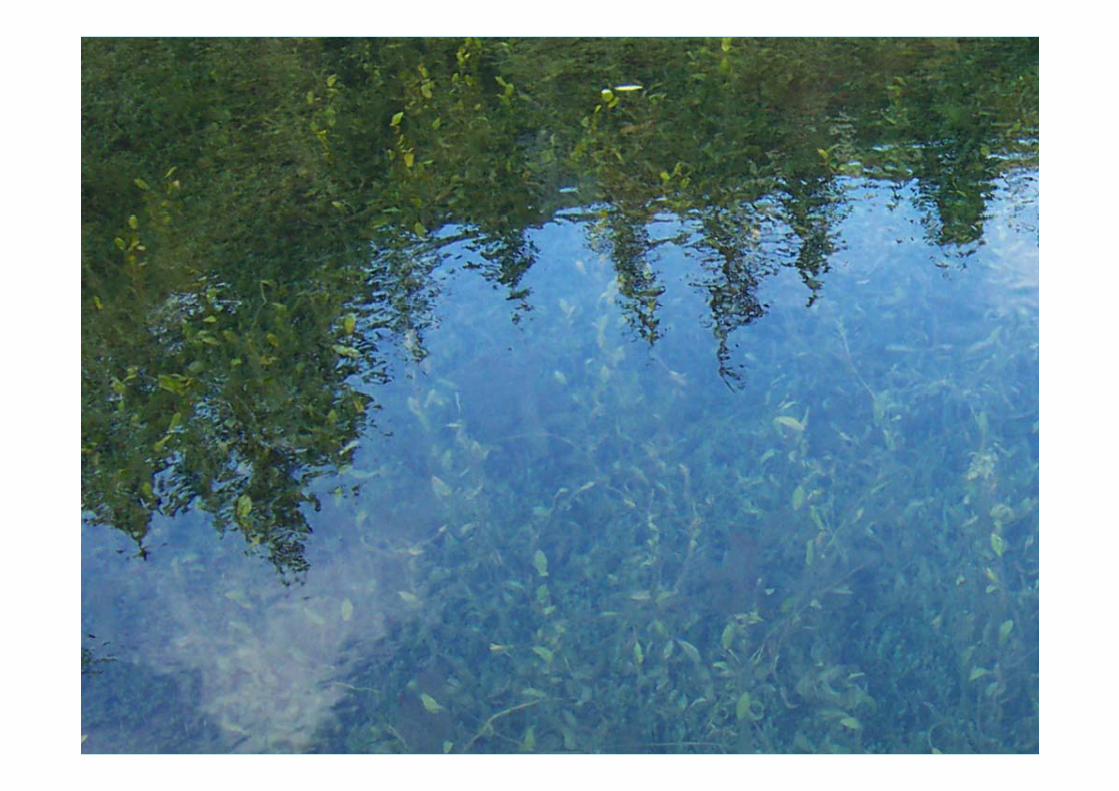
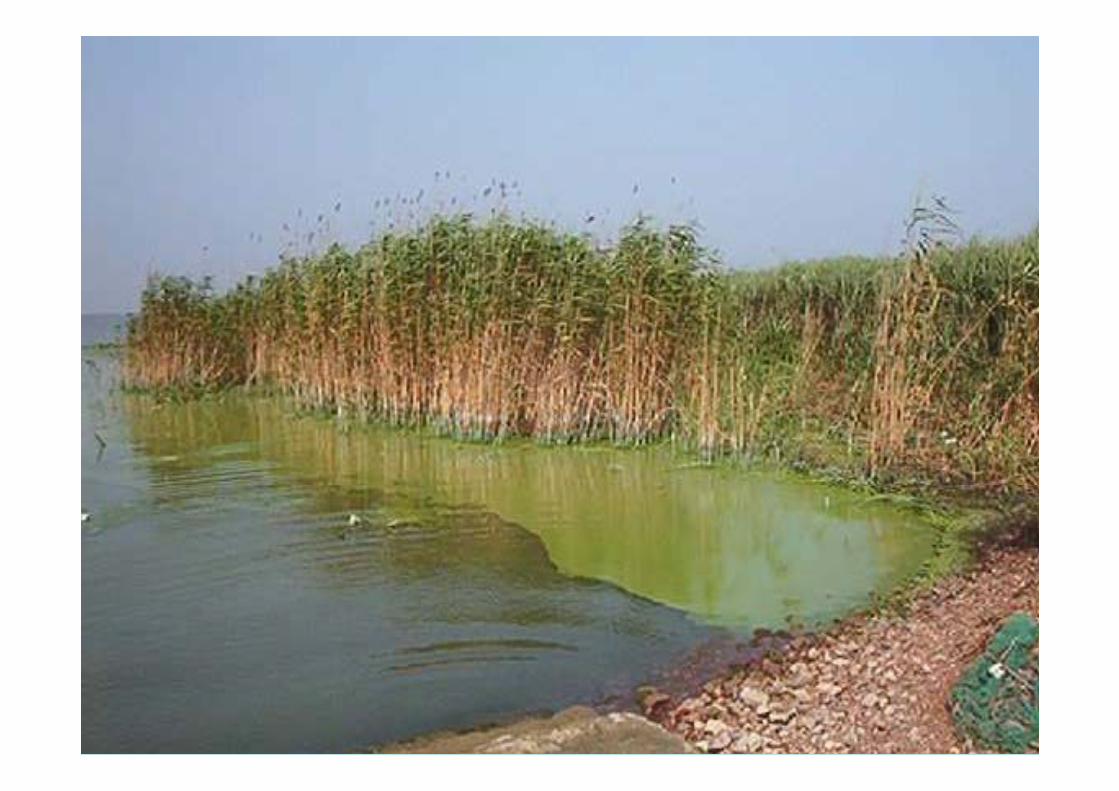
LakeBelau
Terrestrial-AquaticAquaticEcotone
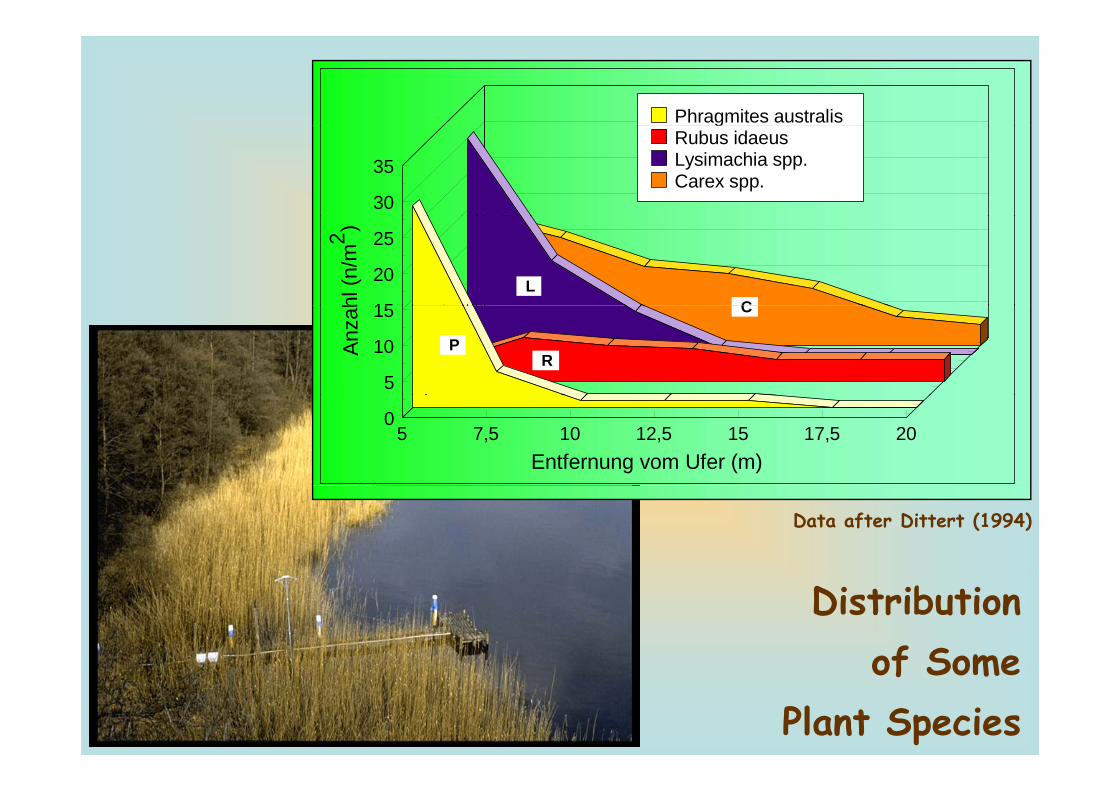
Phragmites australis
30
35
gRubus idaeusLysimachia spp.Carex spp.
15
20
25
L Chl
(n/m
)2
5
10
15
P R
C
Anza
h
5 7,5 10 12,5 15 17,5 200
Entfernung vom Ufer (m)
Data after Dittert (1994)
Distributionof Someof Some
Plant Species
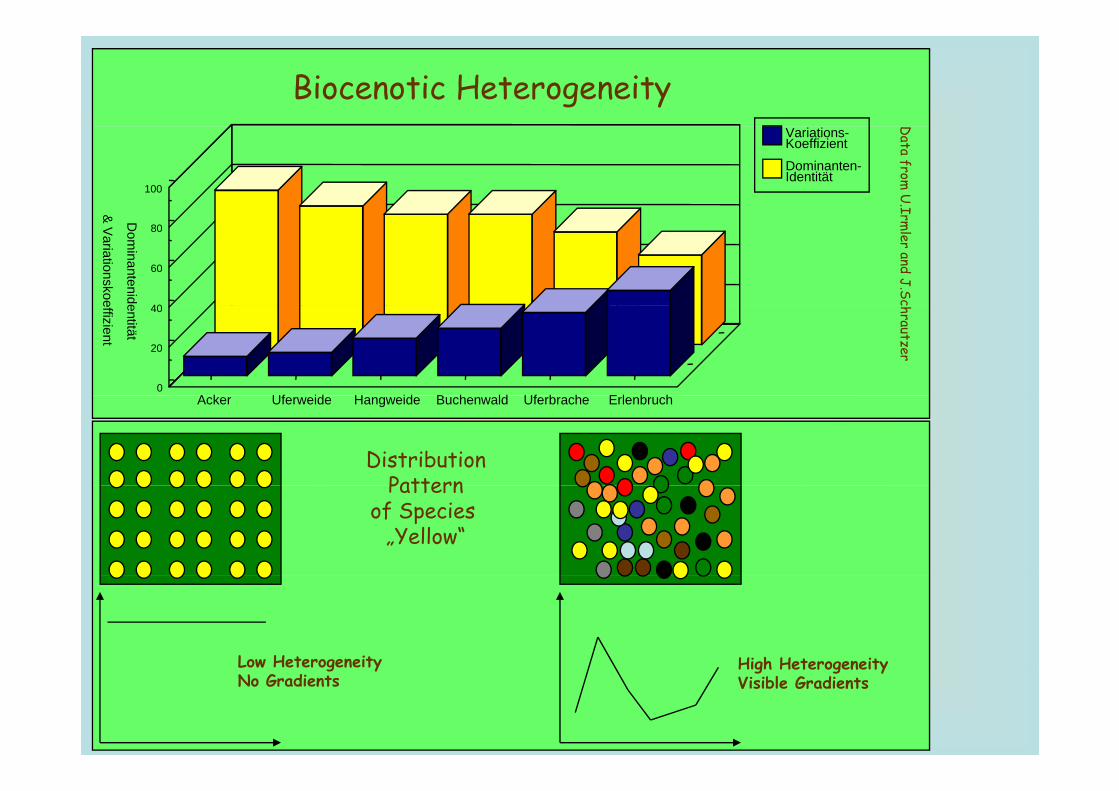
Biocenotic Heterogeneity
100
Variations-Koeffizient
Dominanten-Identität
&
Data from
U.Ir
40
60
80
Dom
inantenide
& Variationskoe
rmler and J.Sc
A k Uf id H id B h ld Uf b h E l b h0
20
40
entität
effizient
hrautzer
Acker Uferweide Hangweide Buchenwald Uferbrache Erlenbruch
DistributionPatternPattern
of Species „Yellow“
Low Heterogeneity High HeterogeneityLow HeterogeneityNo Gradients
High HeterogeneityVisible Gradients
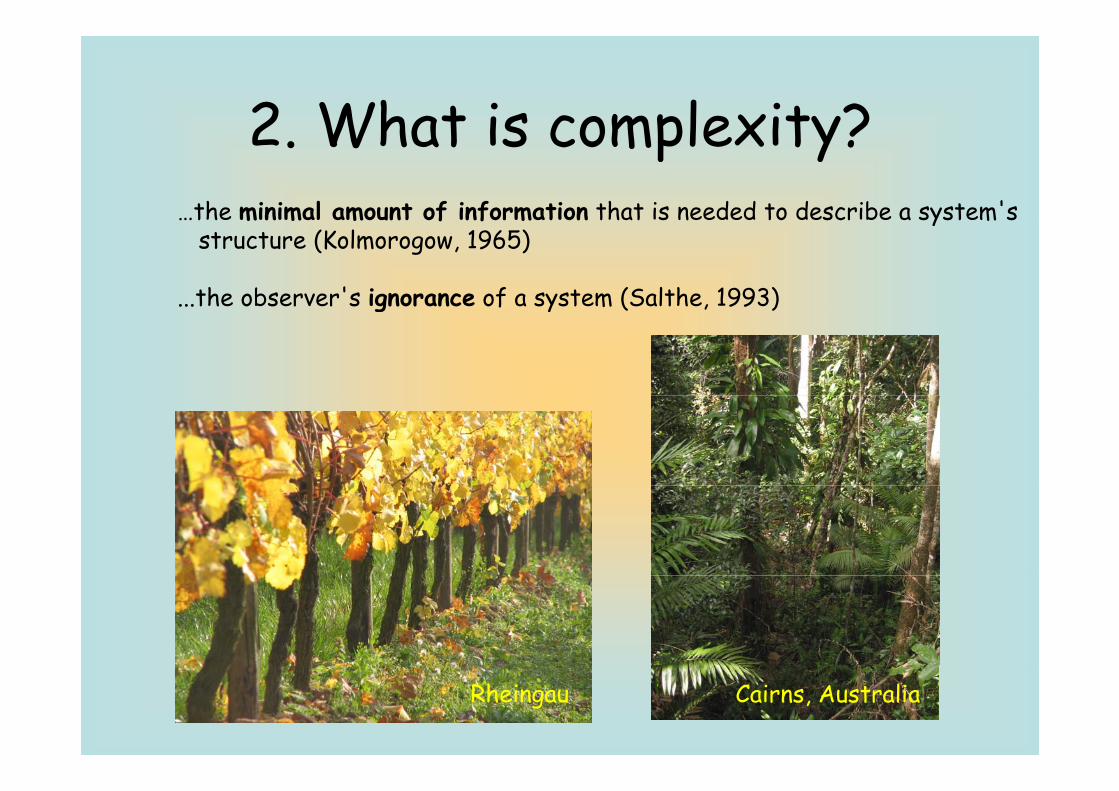
2 What is complexity?2. What is complexity?the minimal amount of information that is needed to describe a system's …the minimal amount of information that is needed to describe a system s structure (Kolmorogow, 1965)
...the observer's ignorance of a system (Salthe, 1993)...the observer s ignorance of a system (Salthe, 993)
Rheingau Cairns, Australia
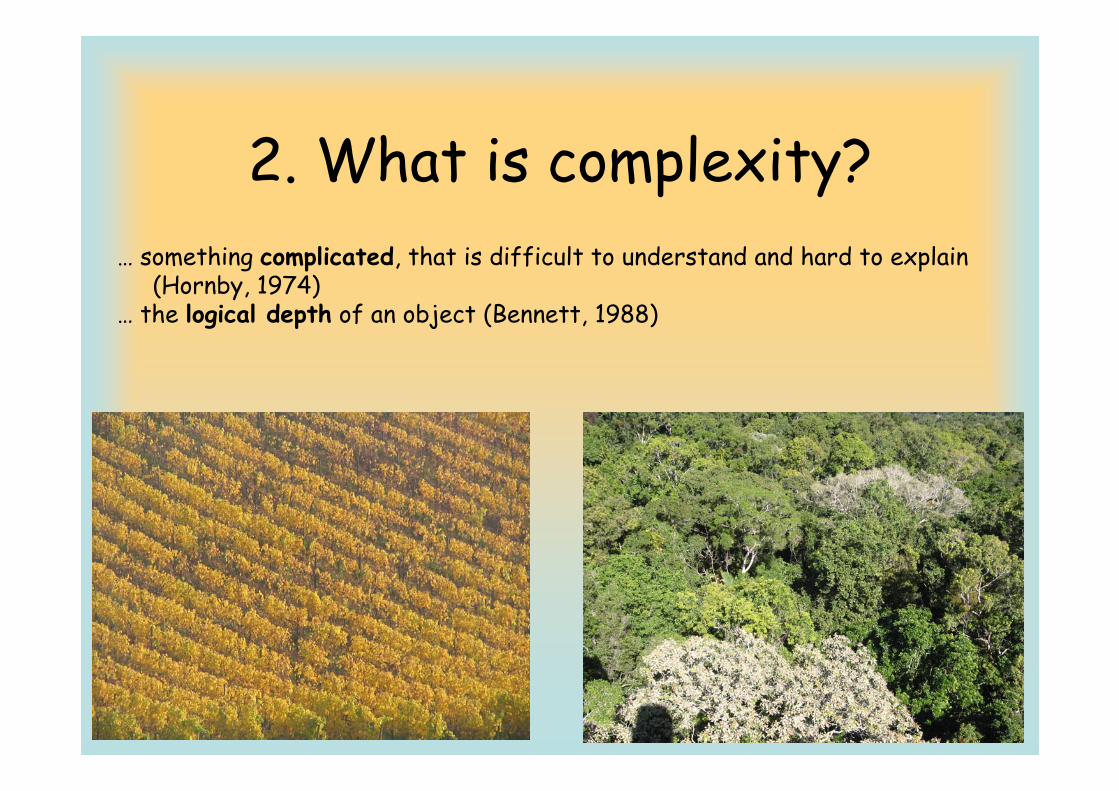
2. What is complexity?… something complicated, that is difficult to understand and hard to explain
(Hornby, 1974) h l i l d h f bj (B 1988)… the logical depth of an object (Bennett, 1988)
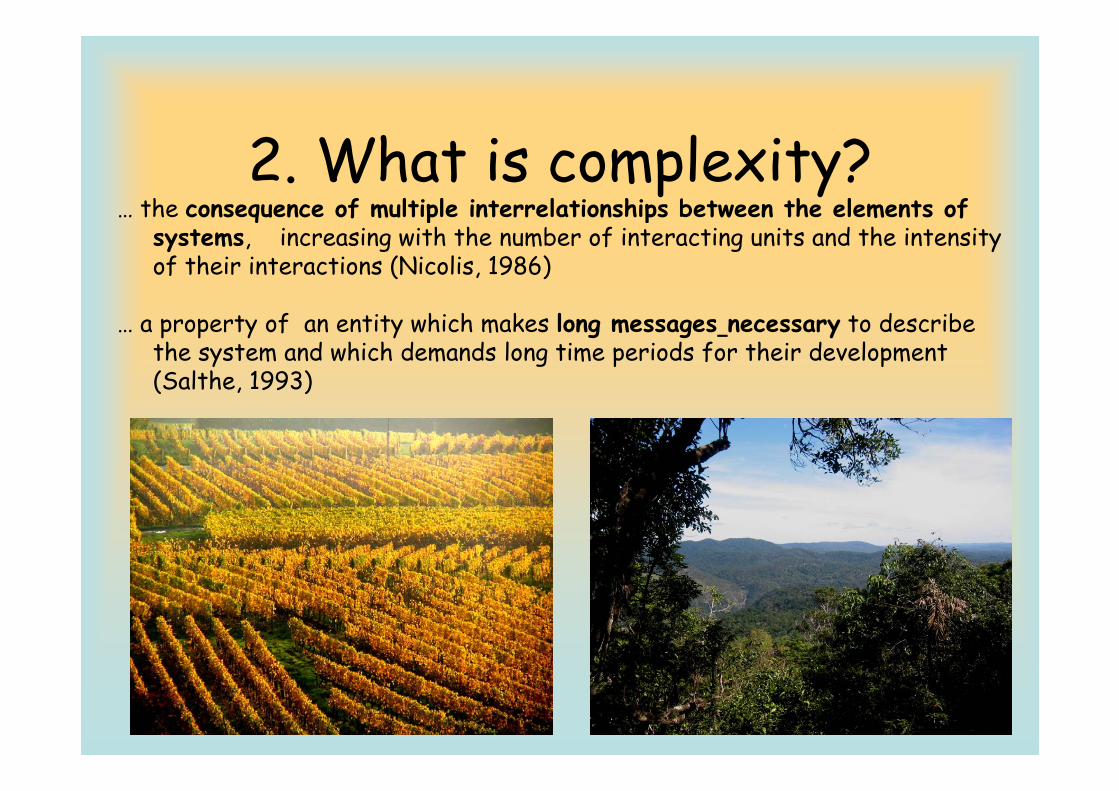
2. What is complexity?… the consequence of multiple interrelationships between the elements of … the consequence of multiple interrelationships between the elements of
systems, increasing with the number of interacting units and the intensity of their interactions (Nicolis, 1986)
… a property of an entity which makes long messages necessary to describe the system and which demands long time periods for their development (Salthe, 1993)
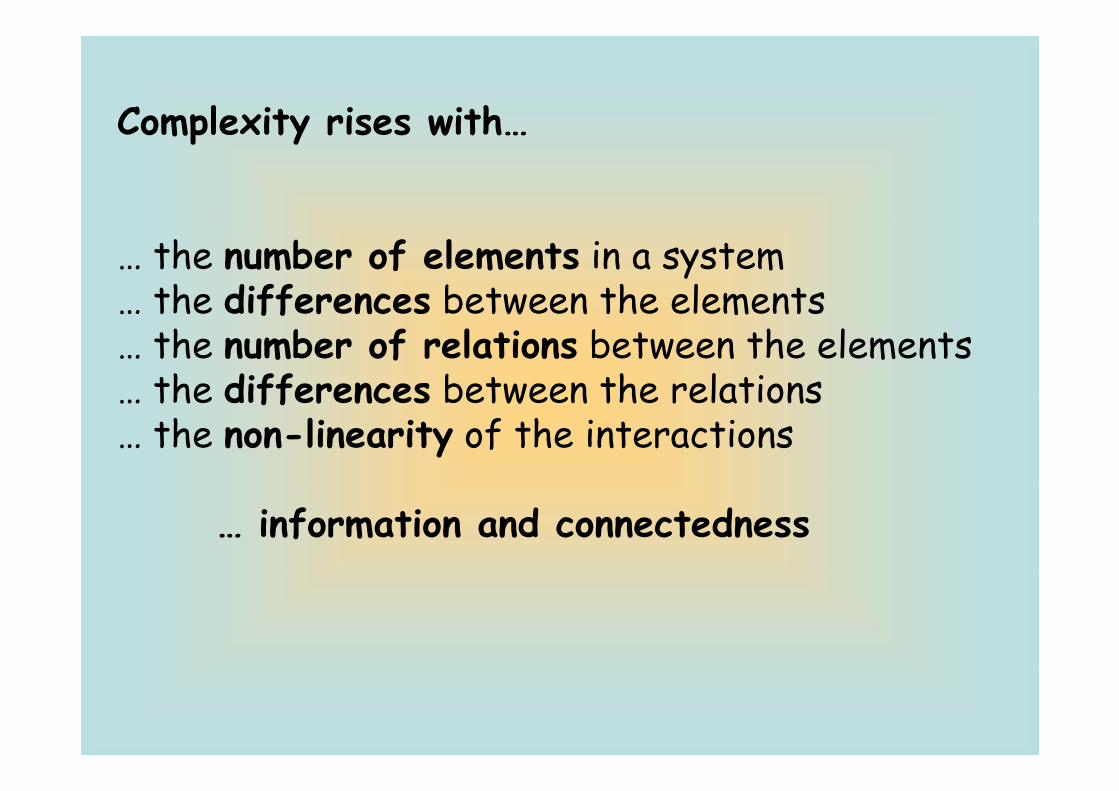
Complexity rises withComplexity rises with…
… the number of elements in a system the differences between the elements… the differences between the elements
… the number of relations between the elements the differences between the relations… the differences between the relations
… the non-linearity of the interactions
… information and connectedness
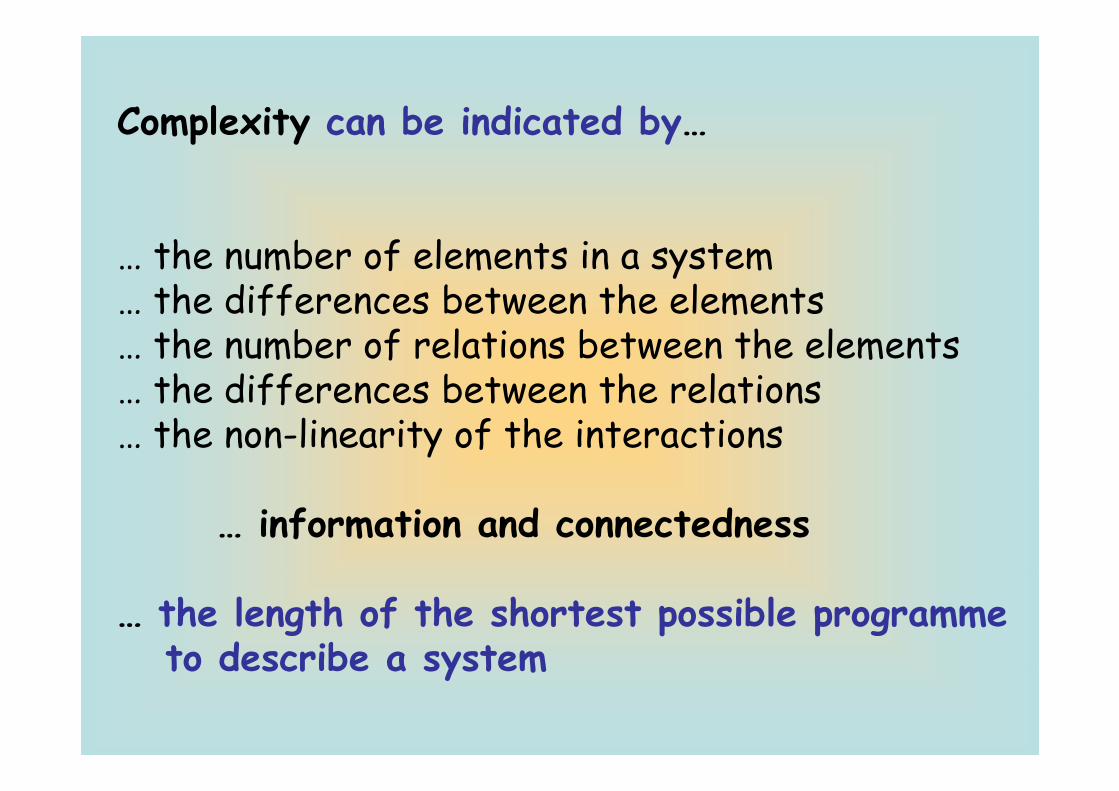
Complexity can be indicated byComplexity can be indicated by…
… the number of elements in a system the differences between the elements… the differences between the elements
… the number of relations between the elements the differences between the relations… the differences between the relations
… the non-linearity of the interactions
… information and connectedness
… the length of the shortest possible programme to describe a systemto describe a system
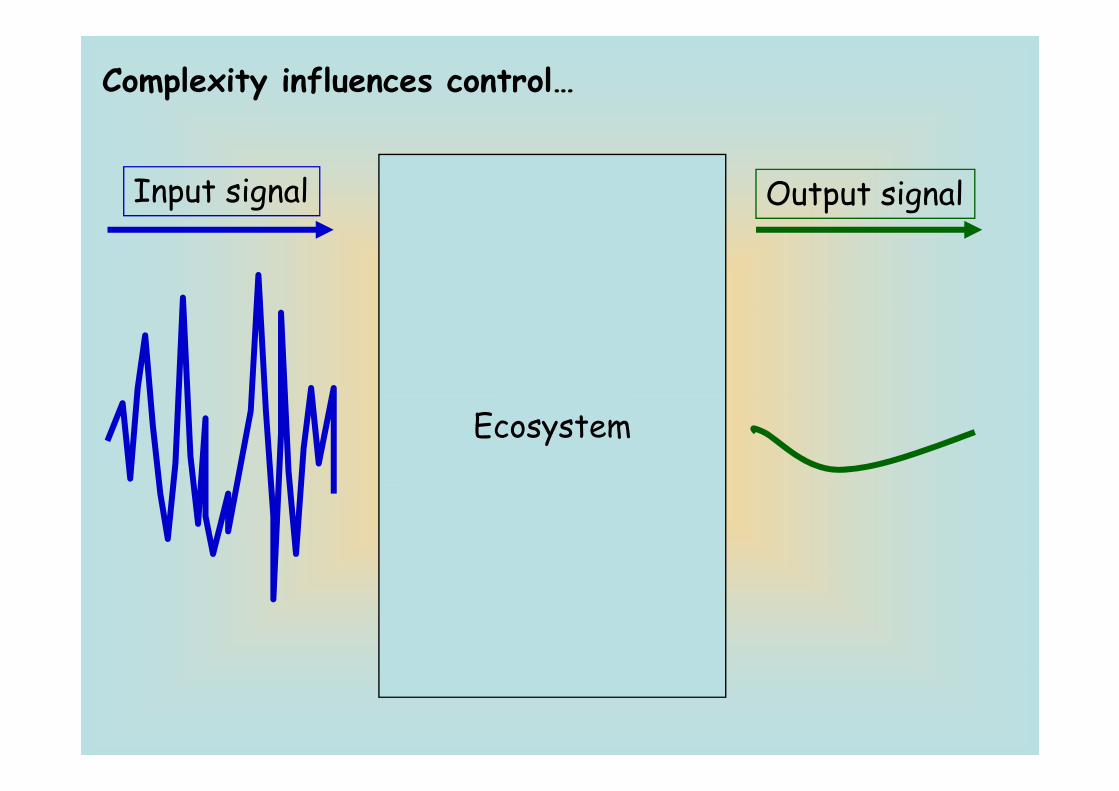
Complexity influences control…
Input signal Output signal
Ecosystem
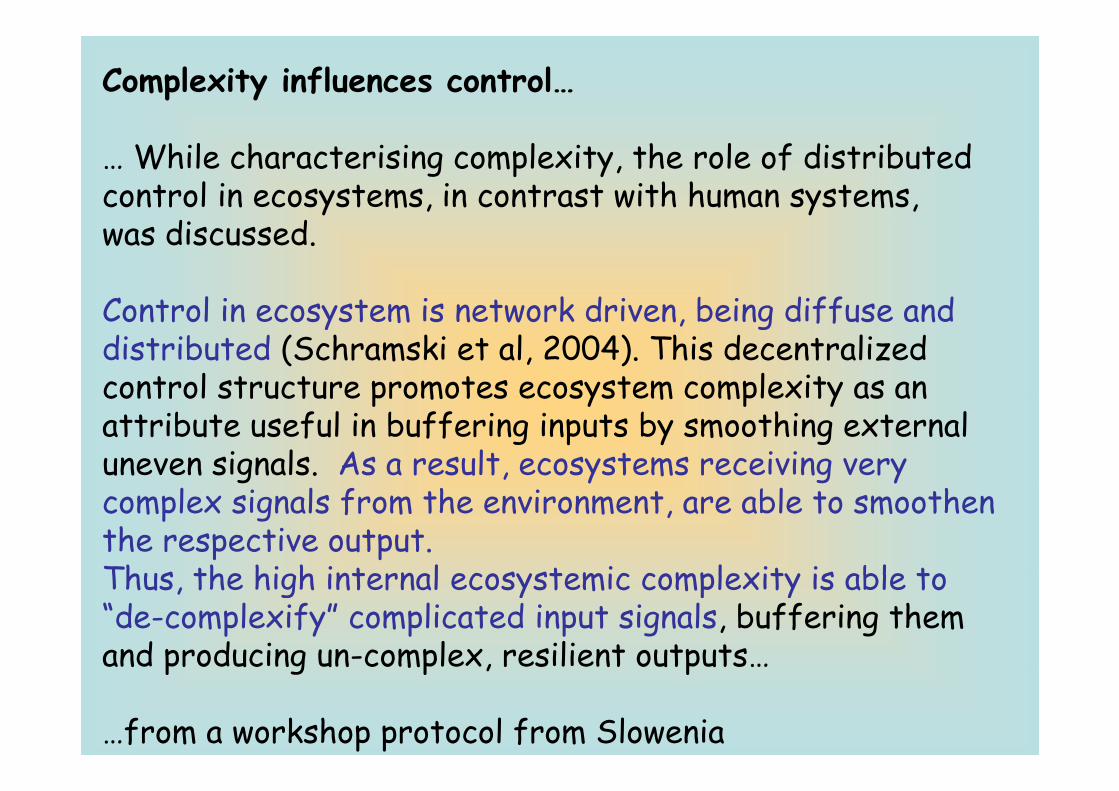
Complexity influences control…
… While characterising complexity, the role of distributed control in ecosystems, in contrast with human systems, was discussed.
Control in ecosystem is network driven being diffuse and Control in ecosystem is network driven, being diffuse and distributed (Schramski et al, 2004). This decentralized control structure promotes ecosystem complexity as an control structure promotes ecosystem complexity as an attribute useful in buffering inputs by smoothing external uneven signals. As a result, ecosystems receiving very complex signals from the environment, are able to smoothen the respective output.Thus the high internal ecosystemic complexity is able to Thus, the high internal ecosystemic complexity is able to “de-complexify” complicated input signals, buffering them and producing un-complex, resilient outputs…and producing un complex, resilient outputs…
…from a workshop protocol from Slowenia
…complexity can rise throughout ecosystem development
…one task of systems sciences is to reduce complexity
…understanding nature as a hierarchical entity can be helpful
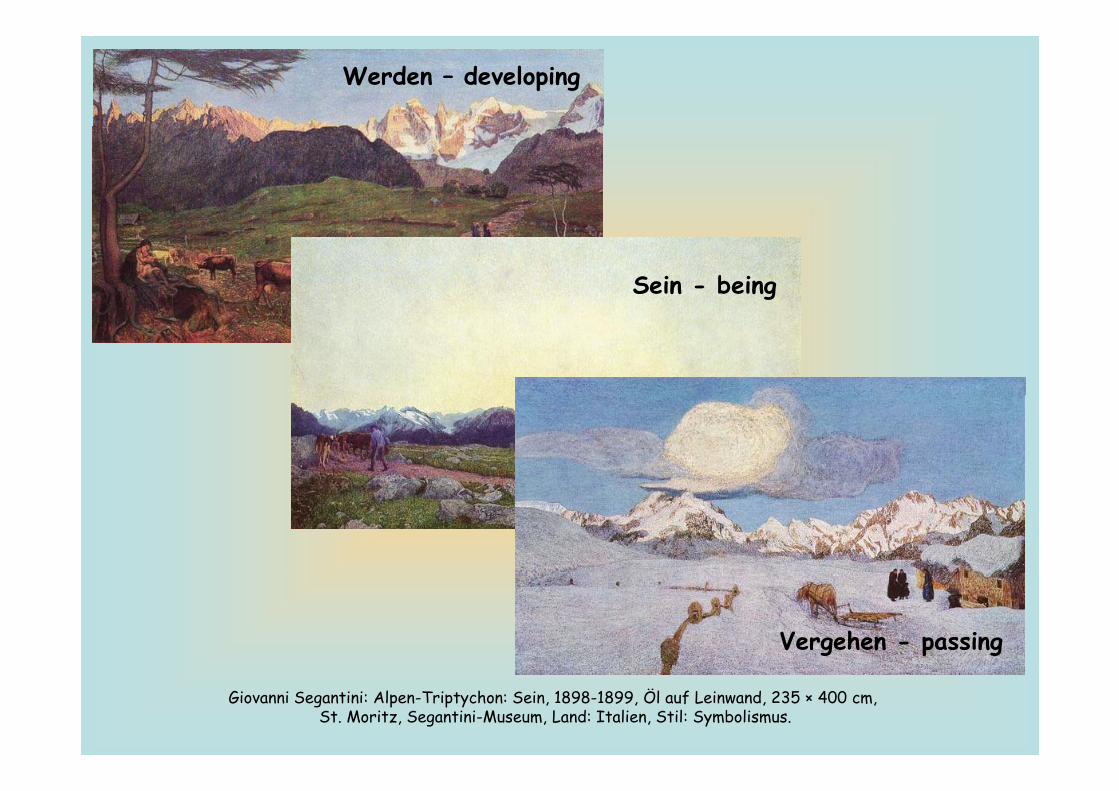
Werden – developing
Sein - being
Vergehen - passing
Giovanni Segantini: Alpen-Triptychon: Sein, 1898-1899, Öl auf Leinwand, 235 × 400 cm, St. Moritz, Segantini-Museum, Land: Italien, Stil: Symbolismus.
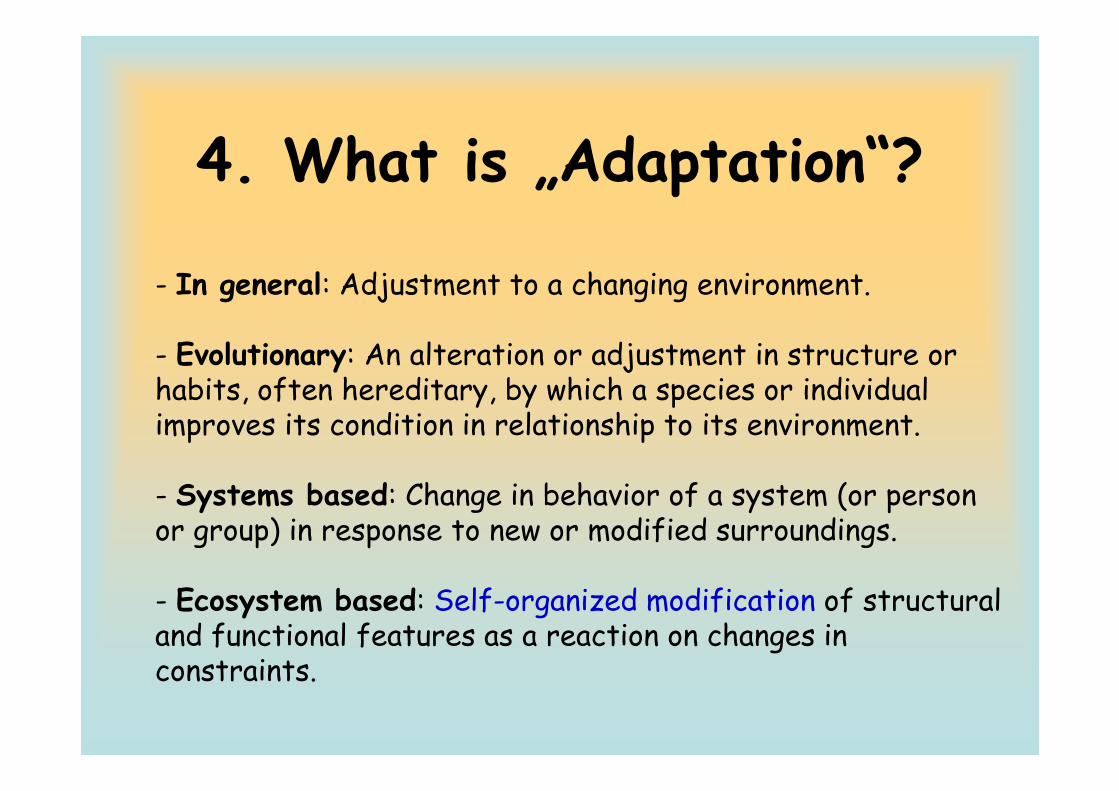
4. What is „Adaptation“?
- In general: Adjustment to a changing environment.
- Evolutionary: An alteration or adjustment in structure or habits often hereditary by which a species or individual habits, often hereditary, by which a species or individual improves its condition in relationship to its environment.
S t b d Ch i b h i f t ( - Systems based: Change in behavior of a system (or person or group) in response to new or modified surroundings.
- Ecosystem based: Self-organized modification of structural and functional features as a reaction on changes in
nst ints constraints.
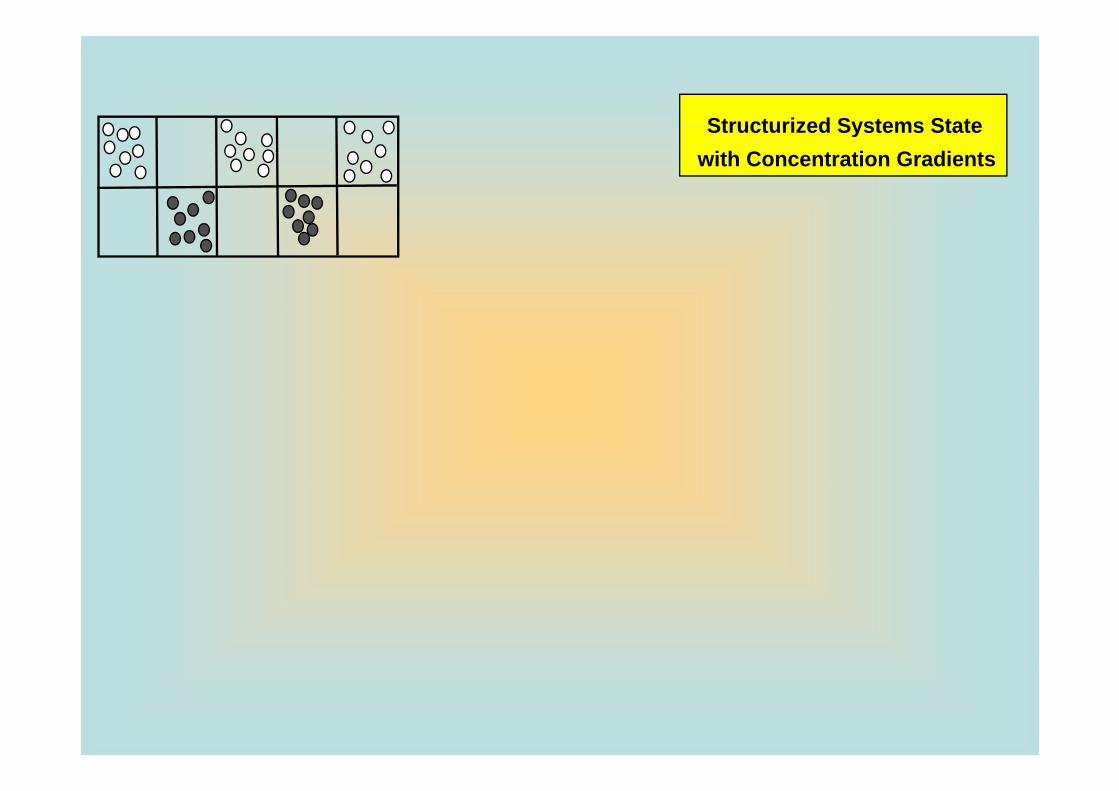
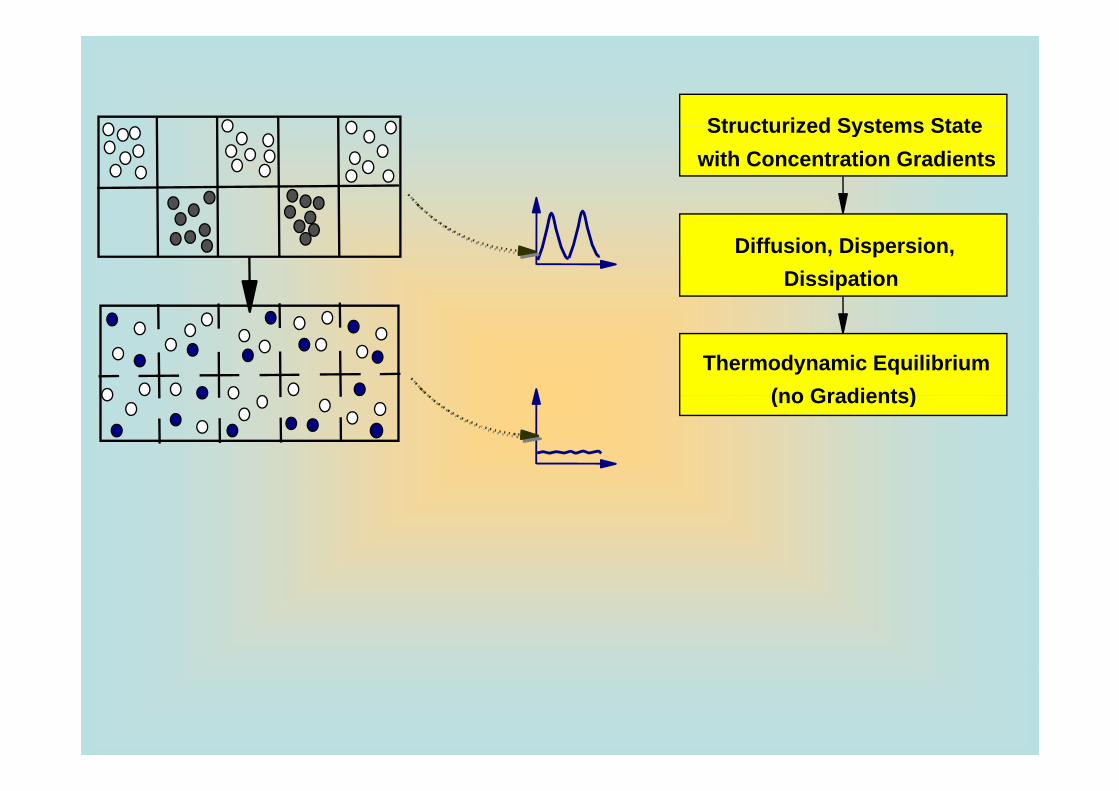
Structurized Systems StateStructurized Systems Statewith Concentration Gradients
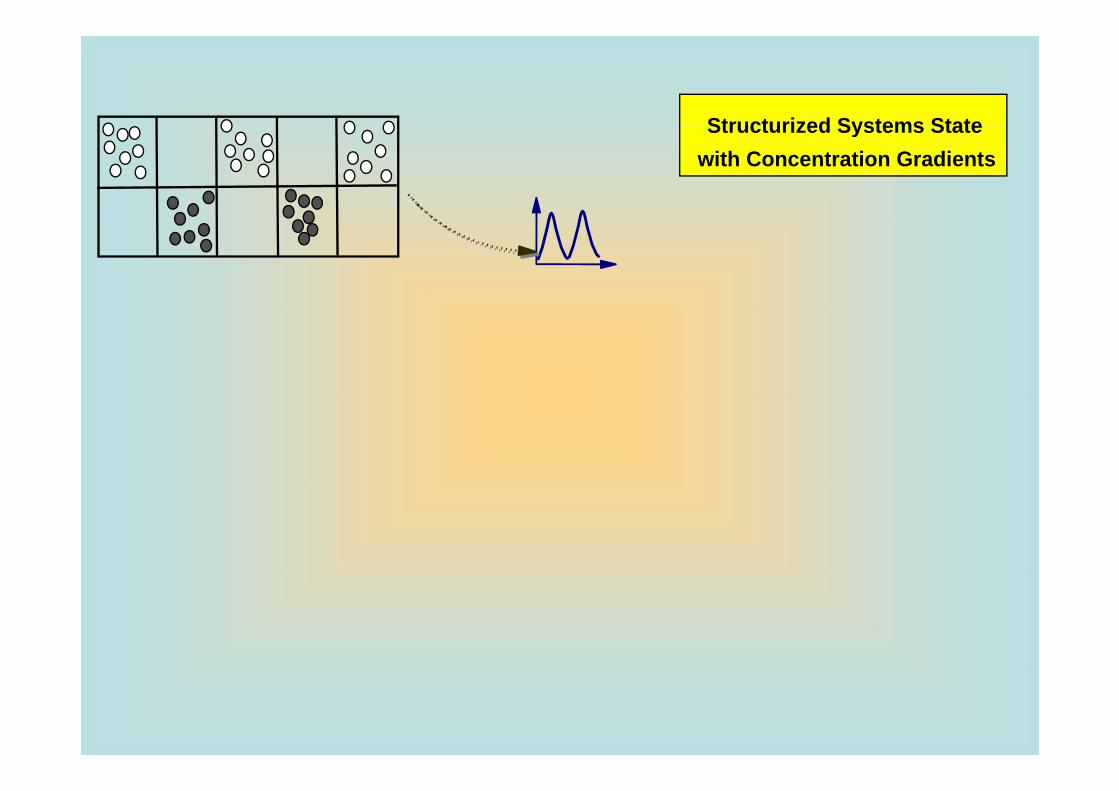
Structurized Systems StateStructurized Systems Statewith Concentration Gradients
Structurized Systems StateStructurized Systems Statewith Concentration Gradients
Diffusion, Dispersion,Dissipation
Thermodynamic Equilibrium(no Gradients)(no Gradients)
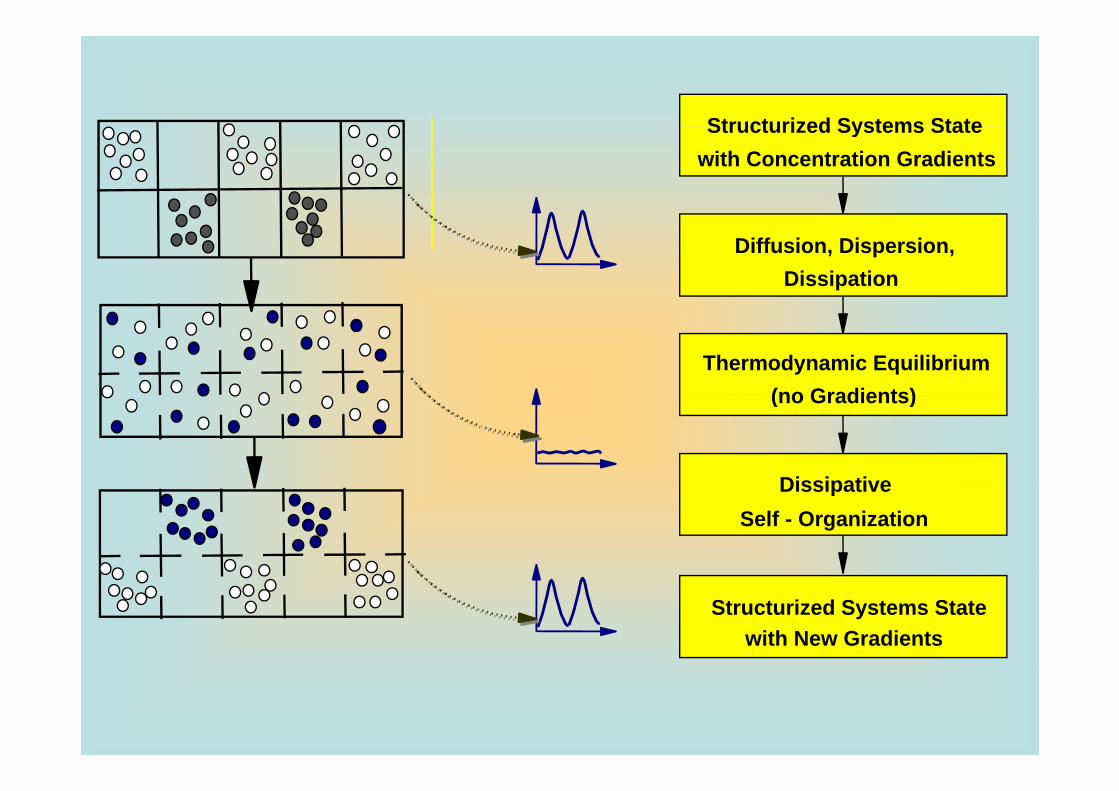
Structurized Systems StateStructurized Systems Statewith Concentration Gradients
Diffusion, Dispersion,Dissipation
Thermodynamic Equilibrium(no Gradients)(no Gradients)
DissipativeDissipativeSelf - Organization
Structurized Systems Statewith New Gradients
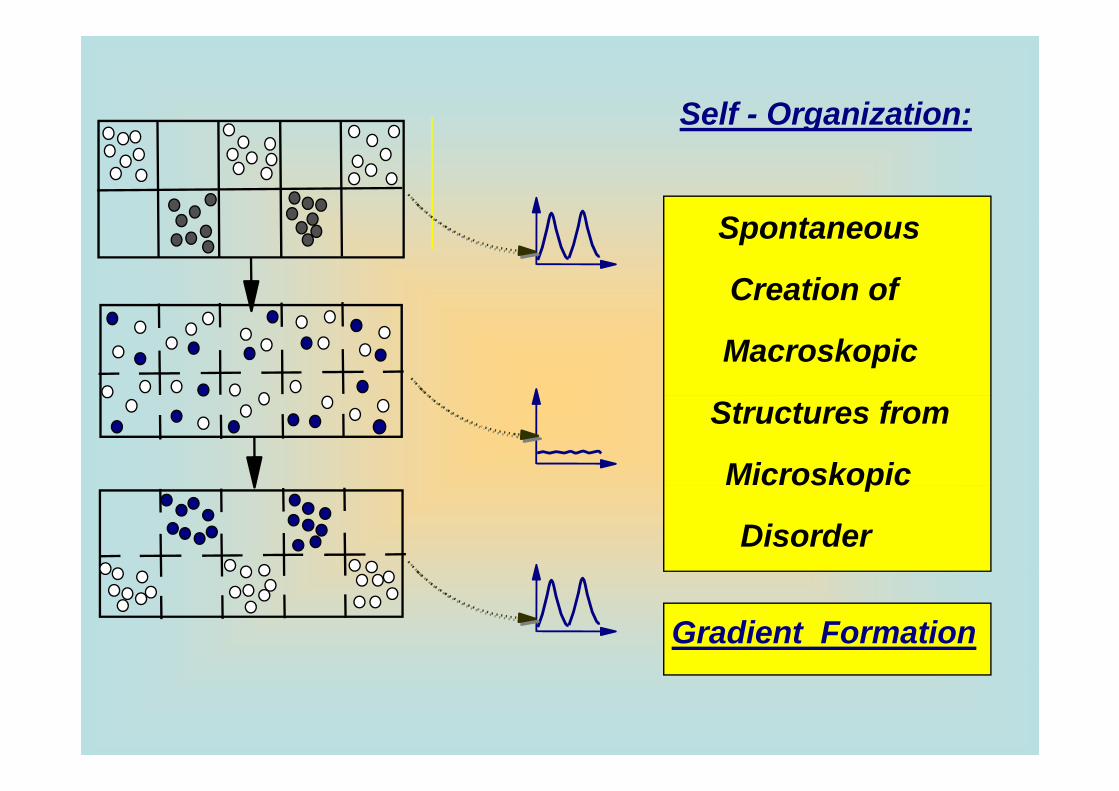
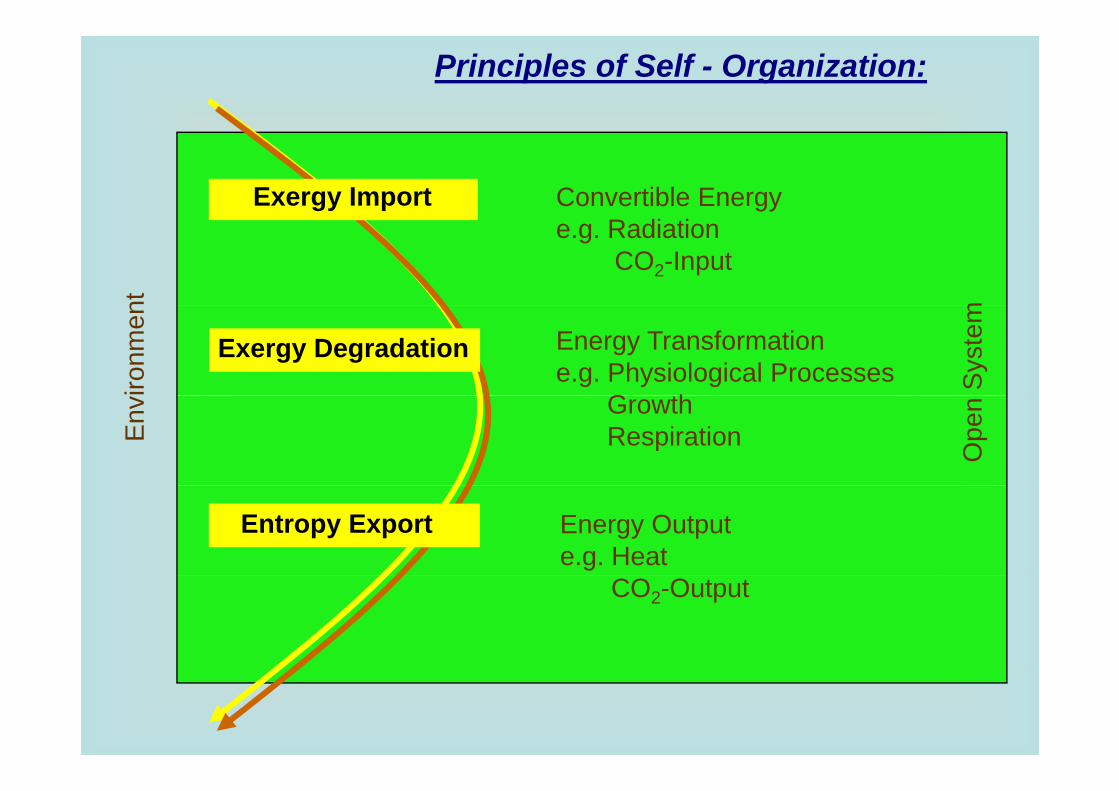
Self - Organization:g
SSpontaneous
Creation of
Macroskopic
Structures from
Microskopicc os op c
Disorder
Gradient Formation

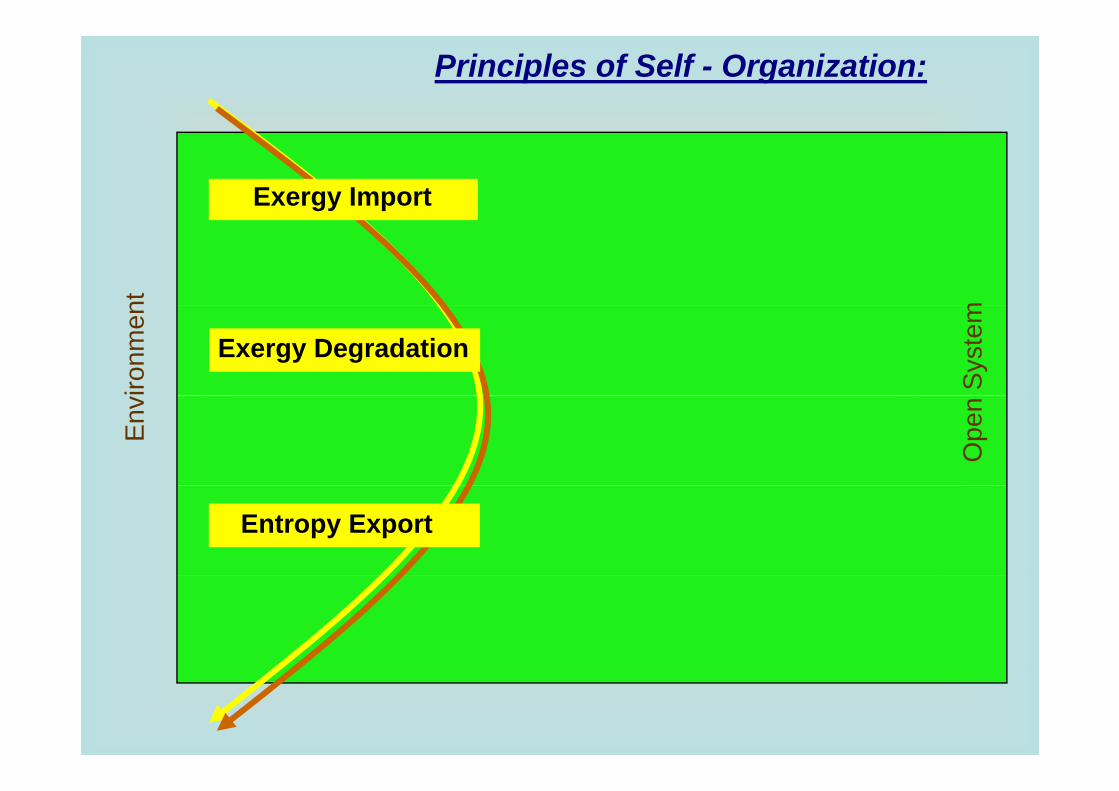
Principles of Self - Organization:
nt m
ironm
en
Sys
tem
Env
Ope
n
Principles of Self - Organization:
Exergy Import
nt m
ironm
en
Sys
tem
Exergy Degradation
Env
Ope
n
Entropy Export
Principles of Self - Organization:
Exergy Import Convertible Energye.g. Radiation
CO2-Input
nt m
Energy Transformatione.g. Physiological Processes
G thironm
en
Sys
tem
Exergy Degradation
GrowthRespirationE
nv
Ope
n
Entropy Export Energy Outpute.g. Heat
CO2-Output
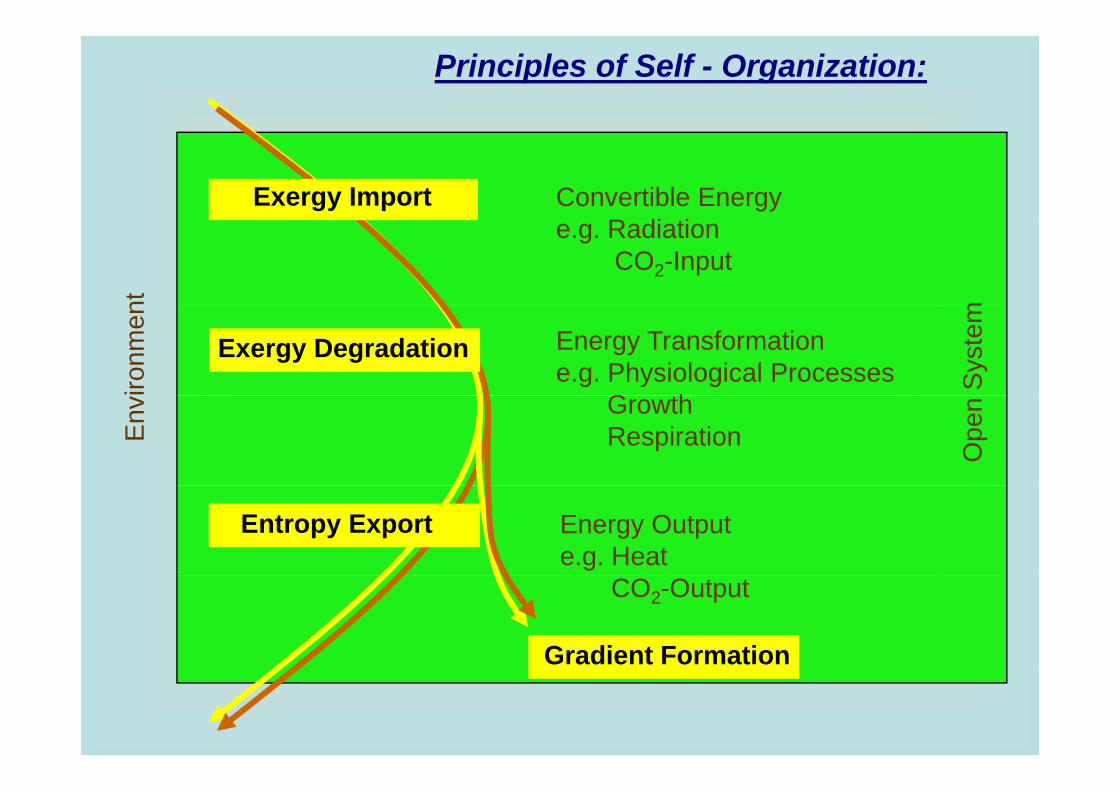
Principles of Self - Organization:
Exergy Import Convertible Energye.g. Radiation
CO2-Input
nt m
Energy Transformatione.g. Physiological Processes
G thironm
en
Sys
tem
Exergy Degradation
GrowthRespirationE
nv
Ope
n
Entropy Export Energy Outpute.g. Heat
CO2-Output
Gradient Formation
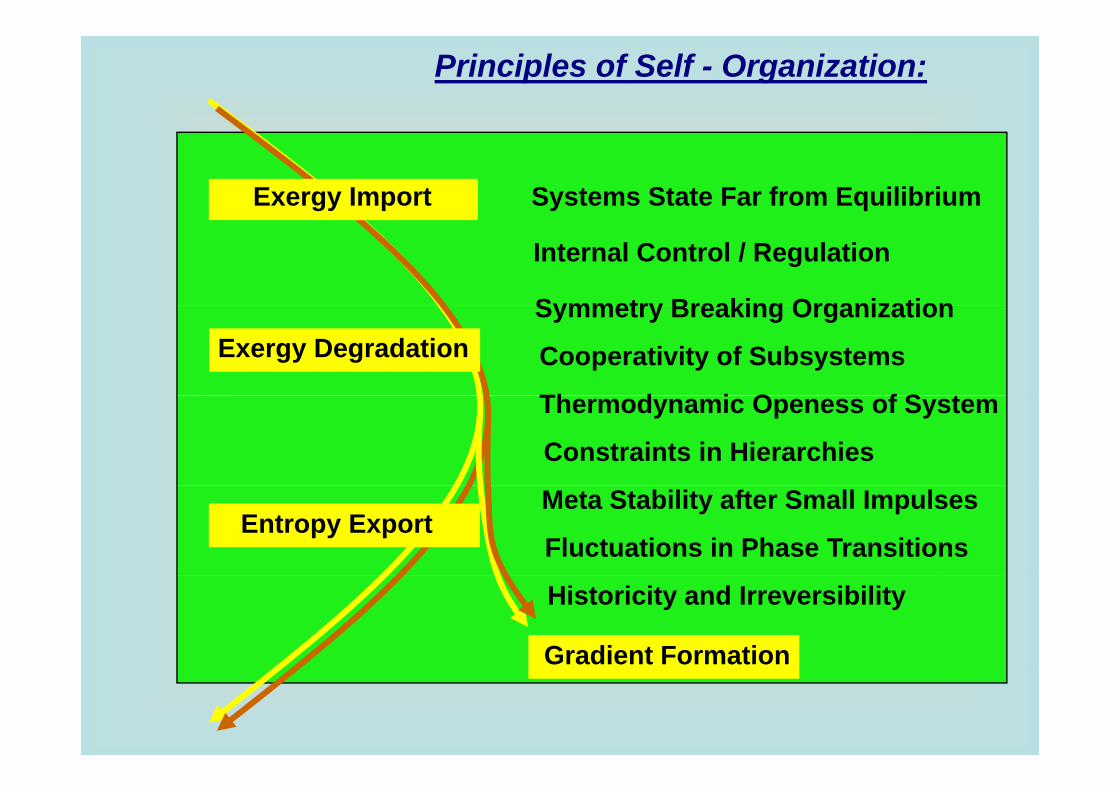
Principles of Self - Organization:
Exergy Import Systems State Far from Equilibrium
Internal Control / Regulation
Symmetry Breaking OrganizationExergy Degradation Cooperativity of Subsystems
Th d i O f S t
Symmetry Breaking Organization
Thermodynamic Openess of System
Constraints in Hierarchies
Entropy ExportMeta Stability after Small Impulses
Fluctuations in Phase Transitions
Gradient Formation
Historicity and Irreversibility
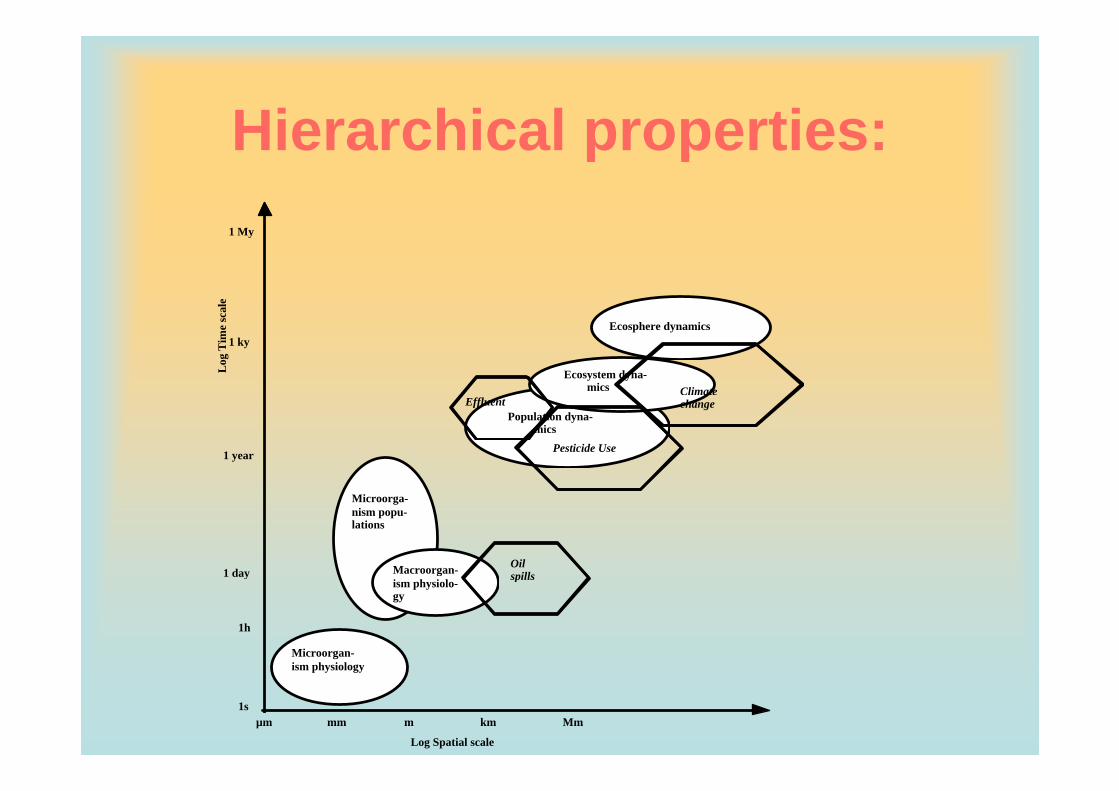
Hierarchical properties:Hierarchical properties:le
1 MyL
og T
ime
scal
1 ky
Ecosystem dyna- mics
Ecosphere dynamics
Climate
1 year
Population dyna- mics
Pesticide Use
changeEffluent
1 day
Microorga- nism popu- lations
Macroorgan- Oil spills
1h
1 day gism physiolo- gy
Microorgan- ism physiology
spills
µm mm m km Mm
Log Spatial scale
1s
ism physiology
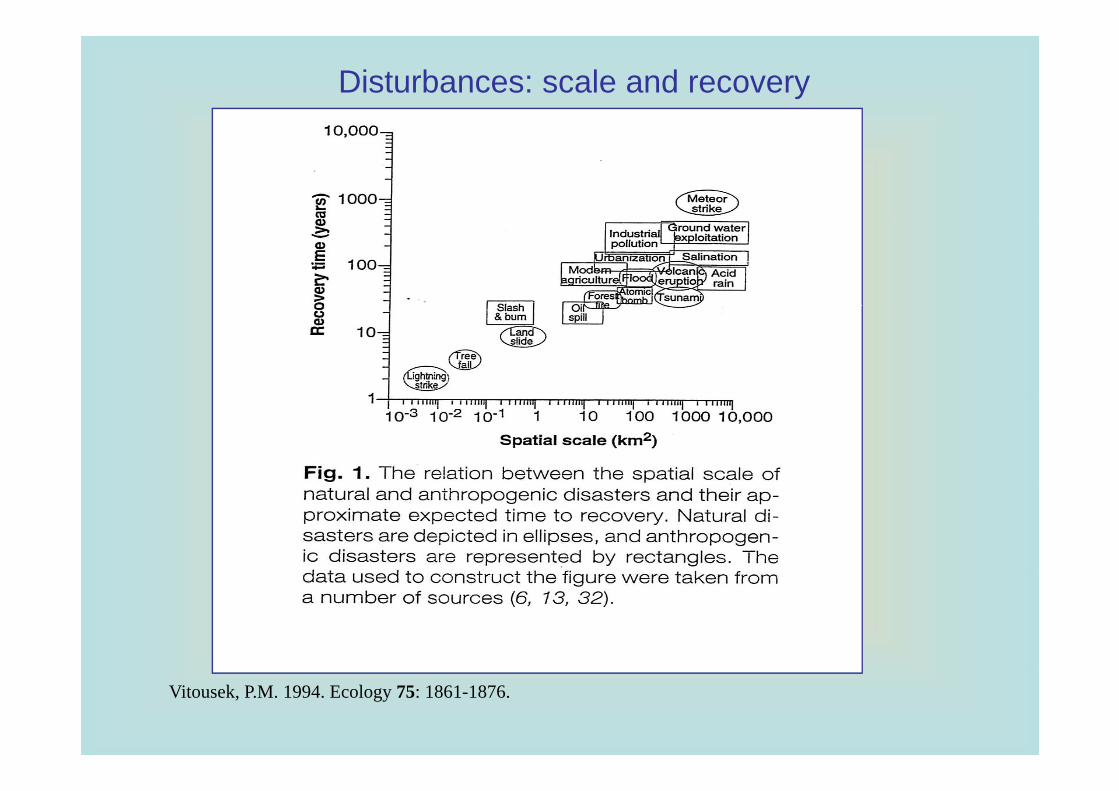
Disturbances: scale and recovery
Vitousek, P.M. 1994. Ecology 75: 1861-1876.
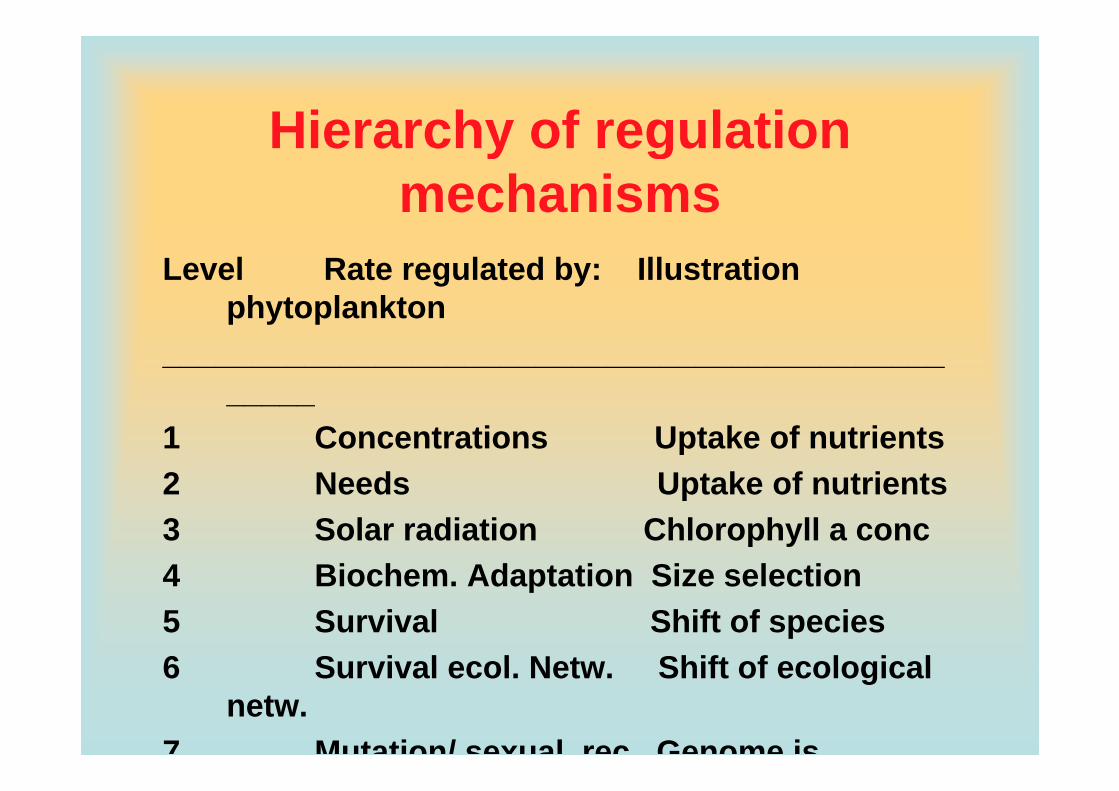
Hierarchy of regulationHierarchy of regulation mechanisms
Level Rate regulated by: Illustration phytoplanktonphytoplankton
_________________________________________________
1 Concentrations Uptake of nutrients2 Needs Uptake of nutrients2 Needs Uptake of nutrients3 Solar radiation Chlorophyll a conc4 Biochem Adaptation Size selection4 Biochem. Adaptation Size selection5 Survival Shift of species6 Survival ecol Netw Shift of ecological6 Survival ecol. Netw. Shift of ecological
netw.7 Mutation/ sexual rec Genome is
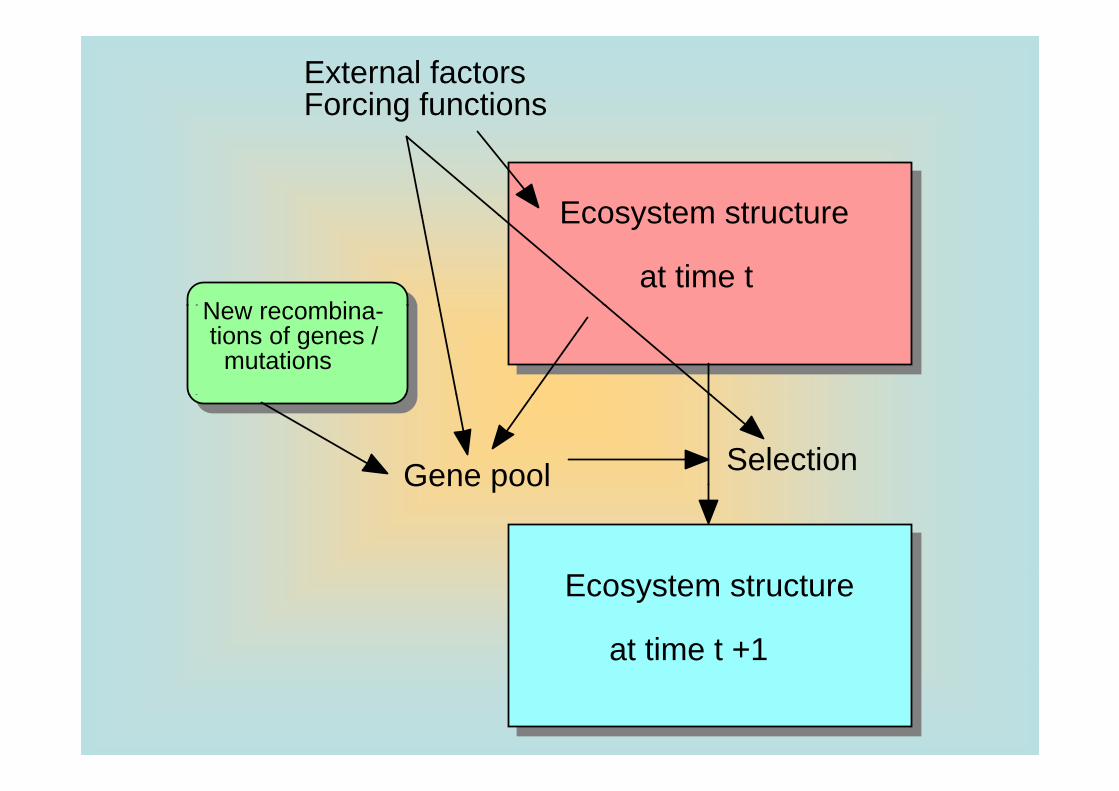
External factors Forcing functions
Ecosystem structureEcosystem structure at time t
N biNew recombina- tions of genes / mutations
Gene pool Selection
E t t t
Gene pool
Ecosystem structure at time t +1
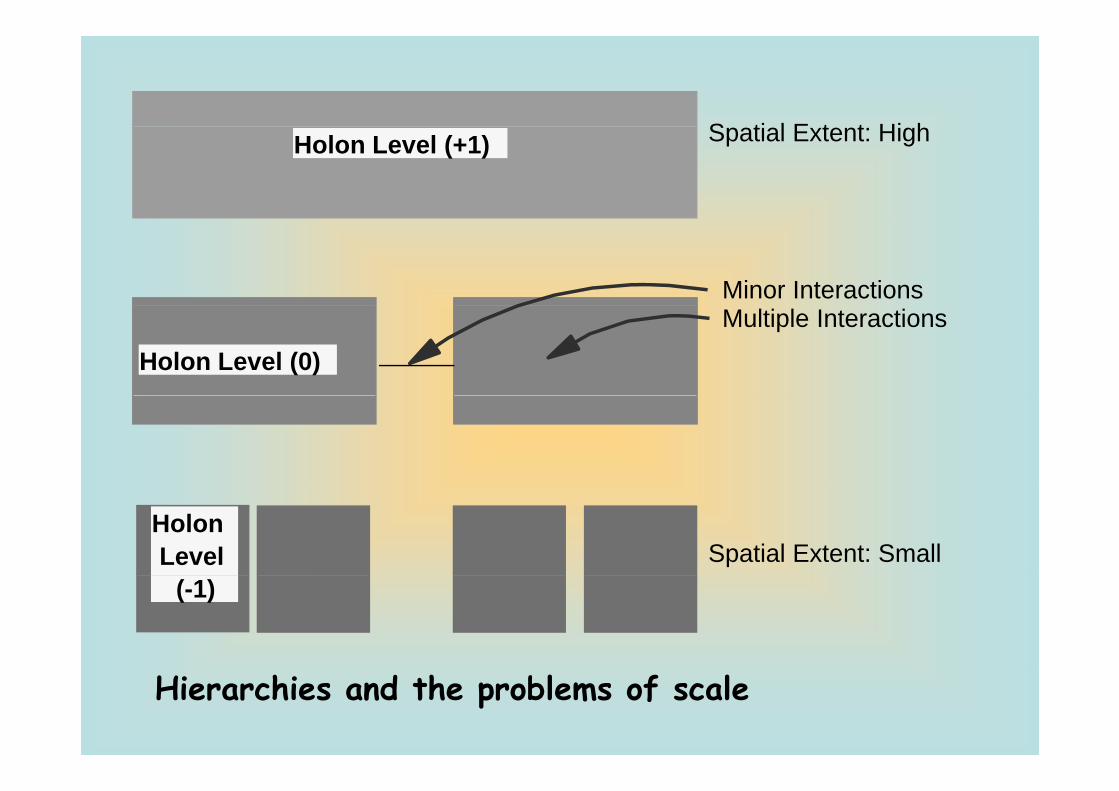
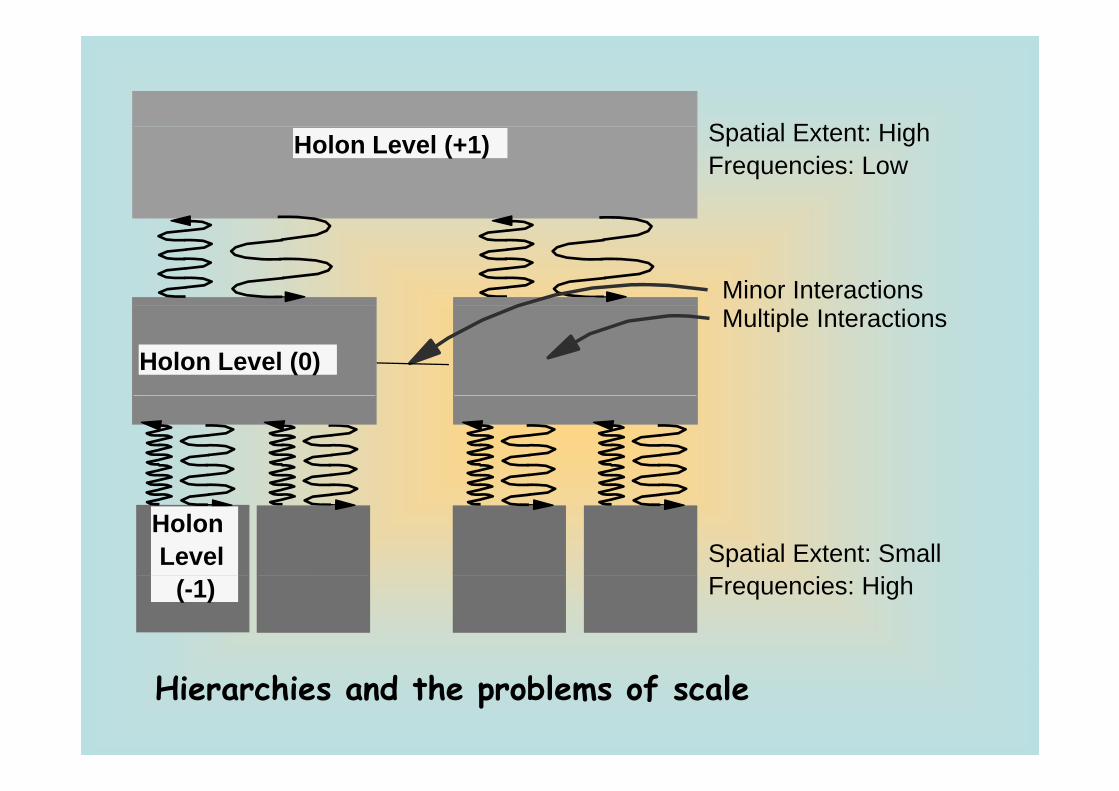
S ti l E t t Hi hHolon Level (+1) Spatial Extent: High
Minor Interactions
Holon Level (0)Multiple Interactions
Holon Level Spatial Extent: Small
(-1)
Hierarchies and the problems of scale
S ti l E t t Hi hHolon Level (+1) Spatial Extent: HighFrequencies: Low
Minor Interactions
Holon Level (0)Multiple Interactions
Holon Level Spatial Extent: Small
(-1) Frequencies: High
Hierarchies and the problems of scale
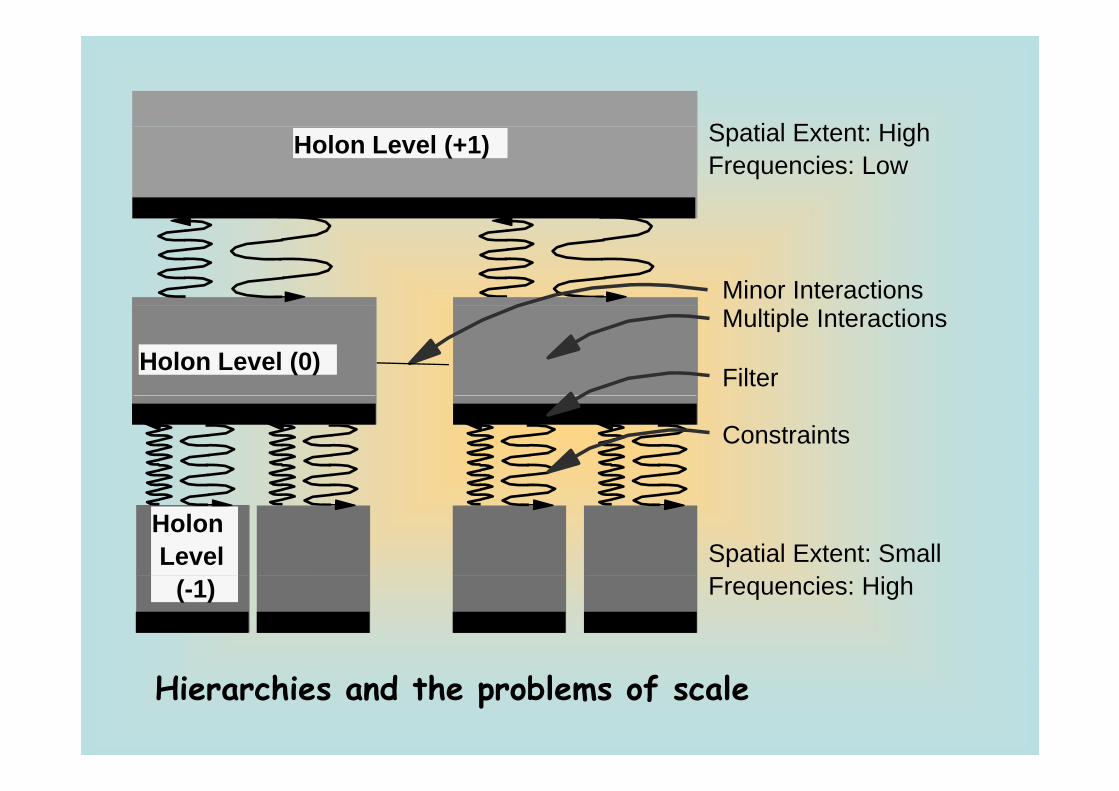
S ti l E t t Hi hHolon Level (+1) Spatial Extent: HighFrequencies: Low
Minor Interactions
Holon Level (0)Multiple Interactions
Filter
Constraints
Holon Level Spatial Extent: Small
(-1) Frequencies: High
Hierarchies and the problems of scale
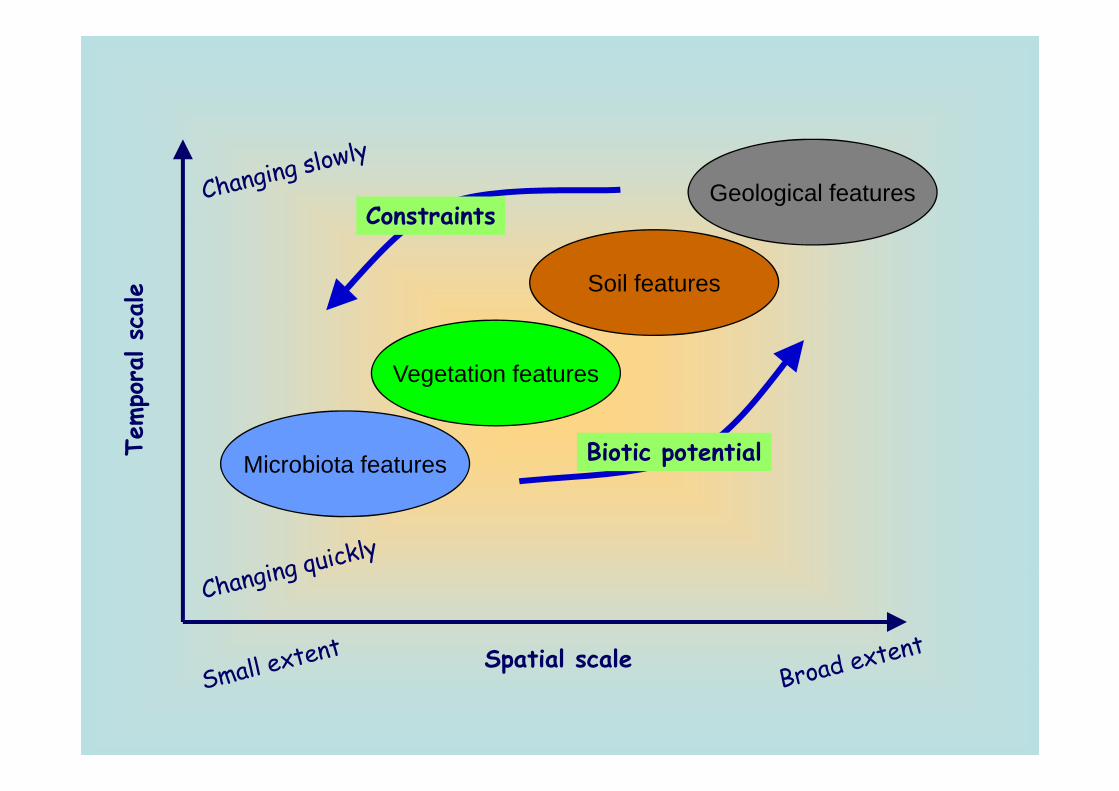
Geological featuresConstraints
ale
Constraints
Soil features
Vegetation features
pora
l sc
a
Microbiota features
Temp
Biotic potential
Spatial scaleSpatial scale
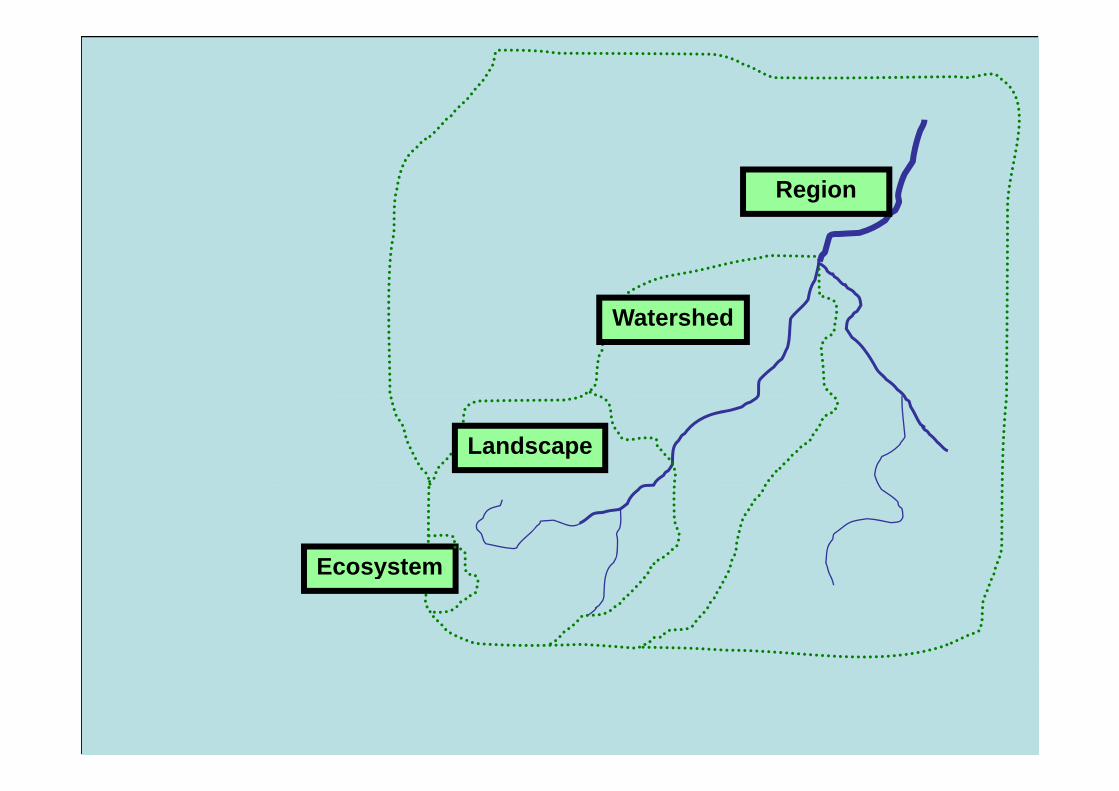
Region
Watershed
Landscape
Ecosystemy
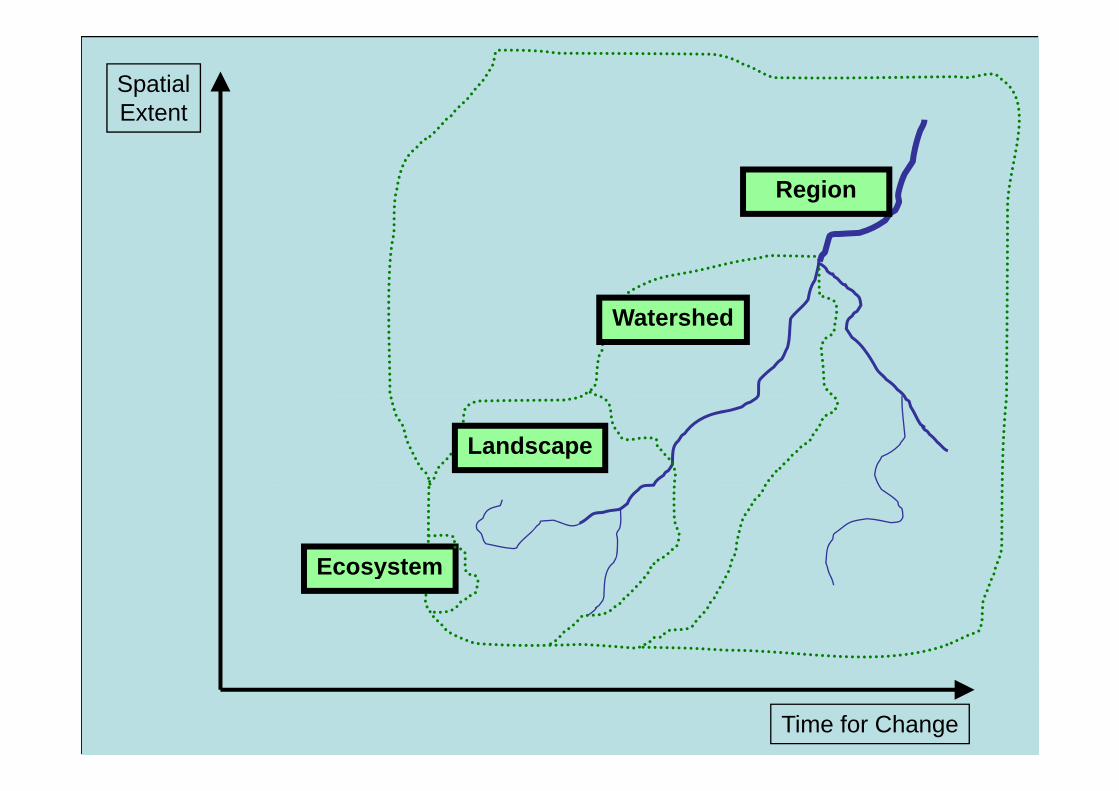
SpatialExtent
Region
Watershed
Landscape
Ecosystemy
Time for Change
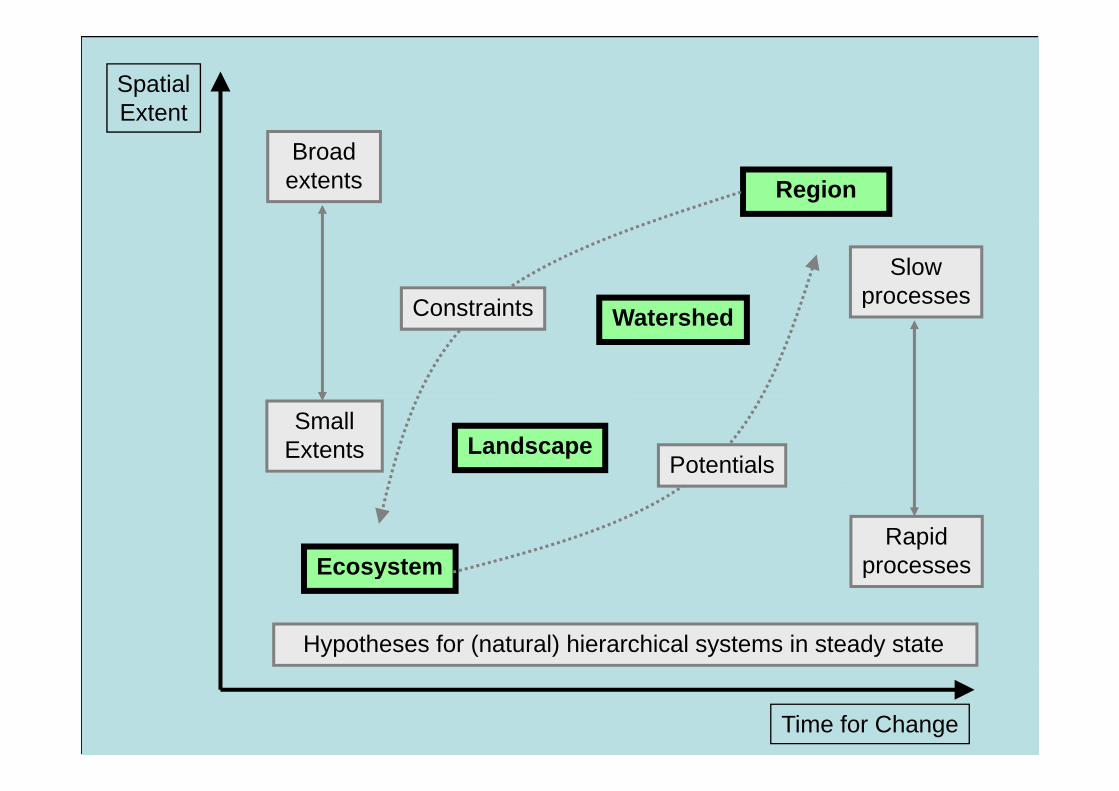
SpatialExtent
Region Broad
extents
SlowprocessesConstraints WatershedpConstraints
LandscapeSmall
Extents Potentials
EcosystemRapid
processesy p
Hypotheses for (natural) hierarchical systems in steady state
Time for Change
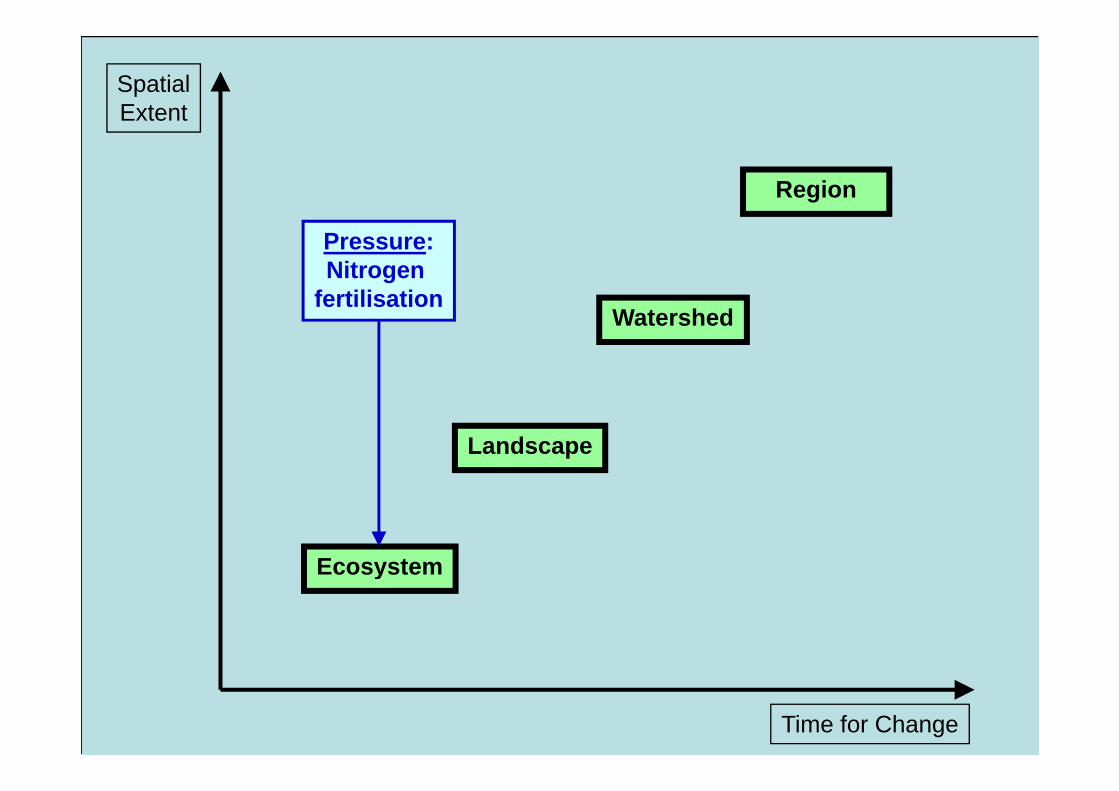
SpatialExtent
Region
Pressure:Nitrogen
fertilisationWatershed
fertilisation
Landscape
Ecosystemy
Time for Change
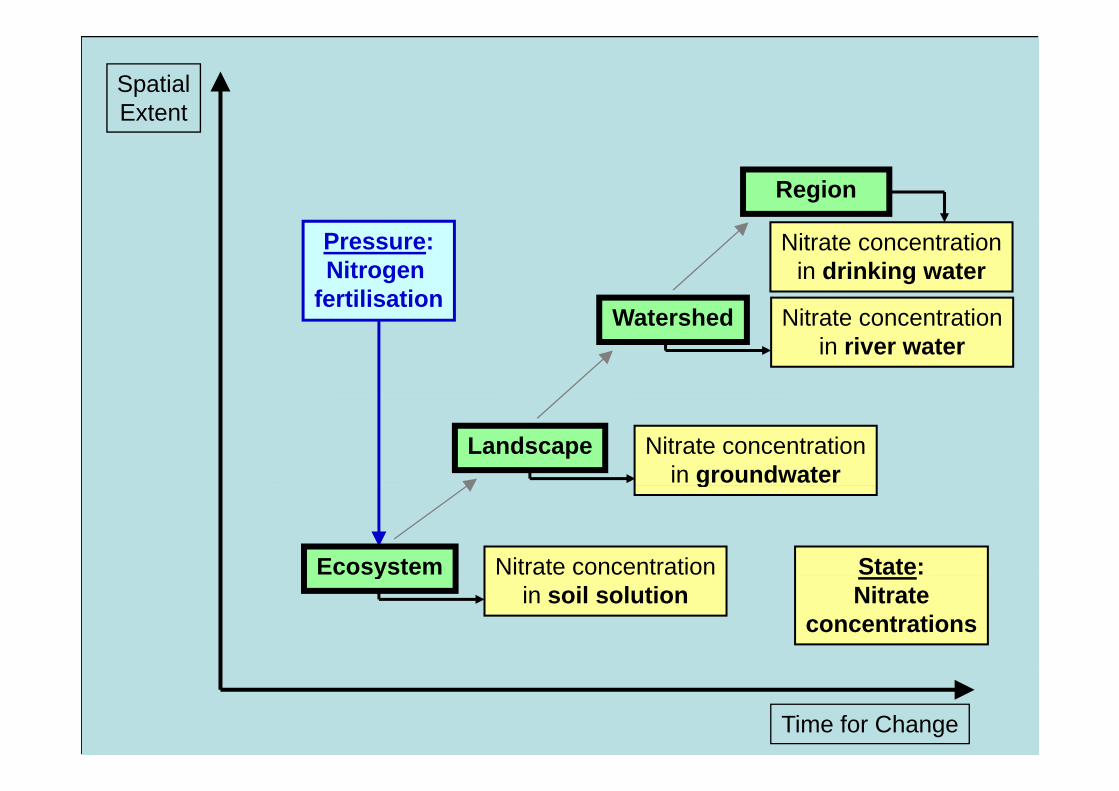
SpatialExtent
Region
Pressure:Nitrogen
fertilisation
Nitrate concentrationin drinking water
fertilisationNitrate concentration
in river waterWatershed
Nitrate concentrationin groundwater
Landscape
Nitrate concentration
g
State:Ecosystemin soil solution Nitrate
concentrations
y
Time for Change
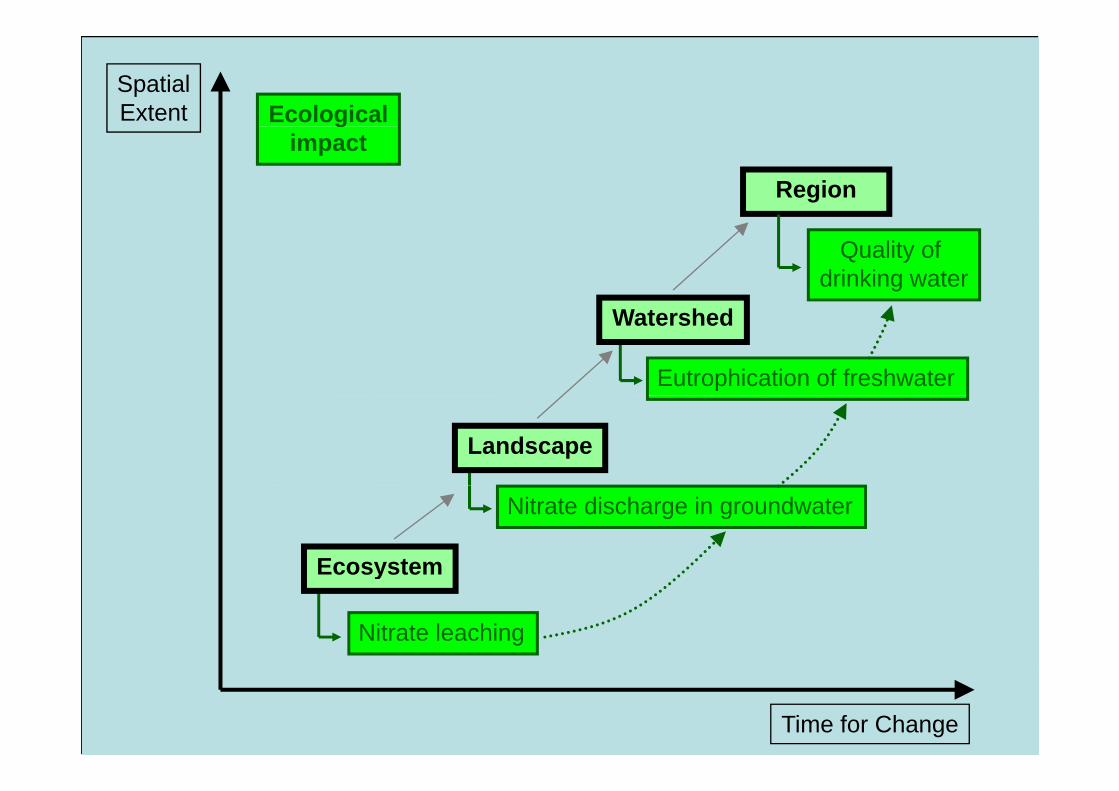
SpatialExtent Ecological
Region
gimpact
Quality of drinking water
Eutrophication of freshwater
Watershed
Landscape
Nitrate discharge in groundwater
Ecosystem
Nitrate leaching
y
Time for Change
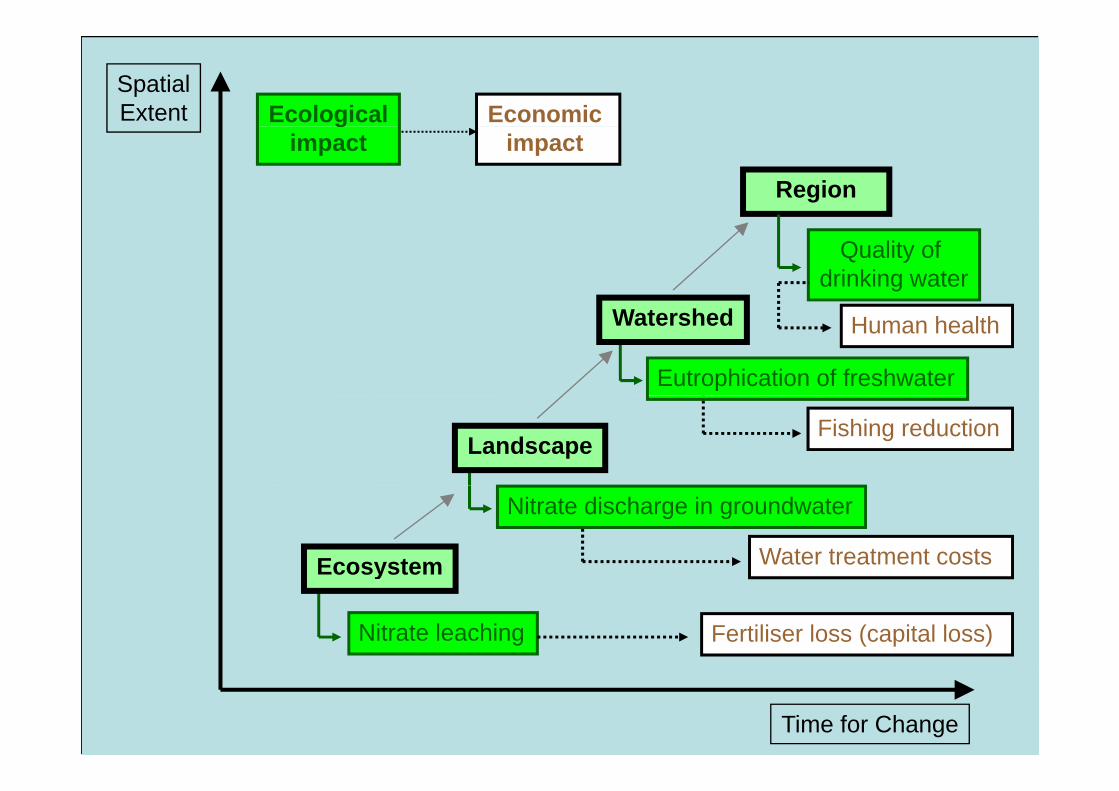
SpatialExtent Ecological Economic
Region
gimpact impact
Quality of drinking water
Watershed Human health
Eutrophication of freshwater
LandscapeFishing reduction
Ecosystem Water treatment costs
Nitrate discharge in groundwater
Nitrate leaching
y
Fertiliser loss (capital loss)
Time for Change
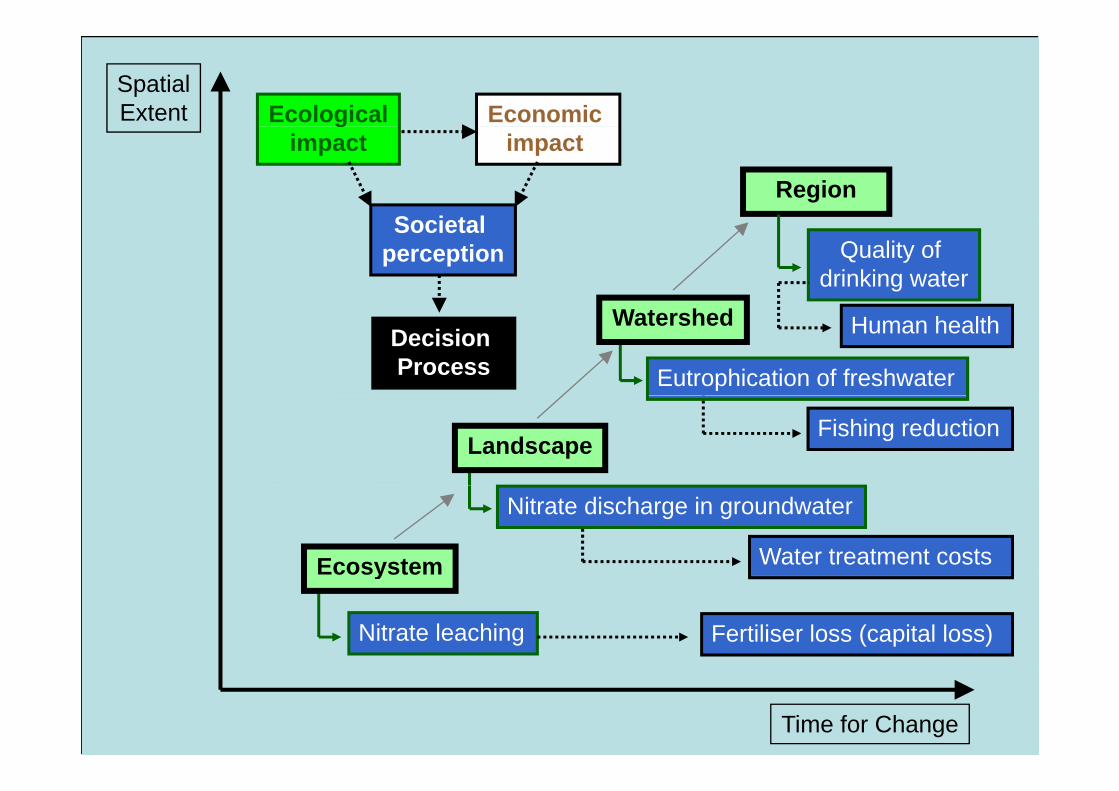
SpatialExtent Ecological Economic
Region
gimpact impact
S i t lQuality of
drinking water
Societal perception
Watershed Human health
Eutrophication of freshwater
Decision Process
LandscapeFishing reduction
Ecosystem Water treatment costs
Nitrate discharge in groundwater
Nitrate leaching
y
Fertiliser loss (capital loss)
Time for Change
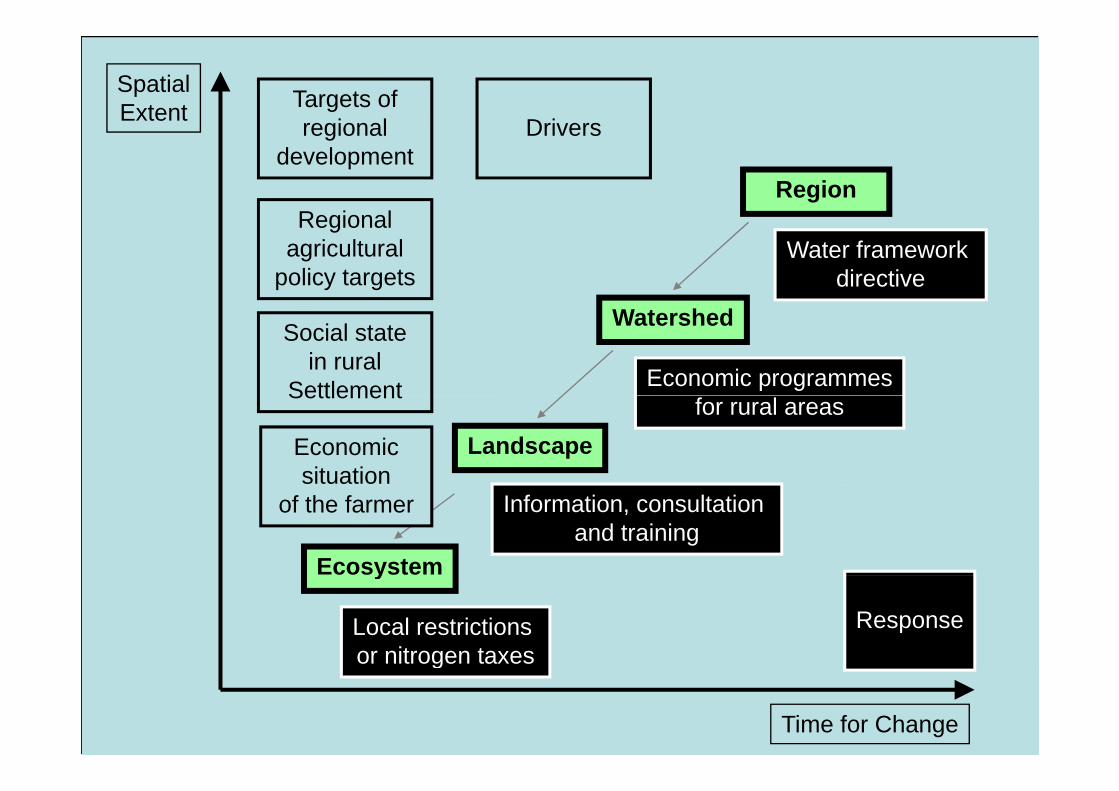
SpatialExtent Targets of
regional Drivers
Region Regional
regional development
Drivers
Water framework directive
Regional agricultural
policy targets
Watershed
Economic programmes
Social state in rural
Settlement
Landscapefor rural areas
Settlement
Economic situation
Ecosystem
Information, consultation and training
of the farmer
y
Local restrictions or nitrogen taxes
Response
Time for Change
g
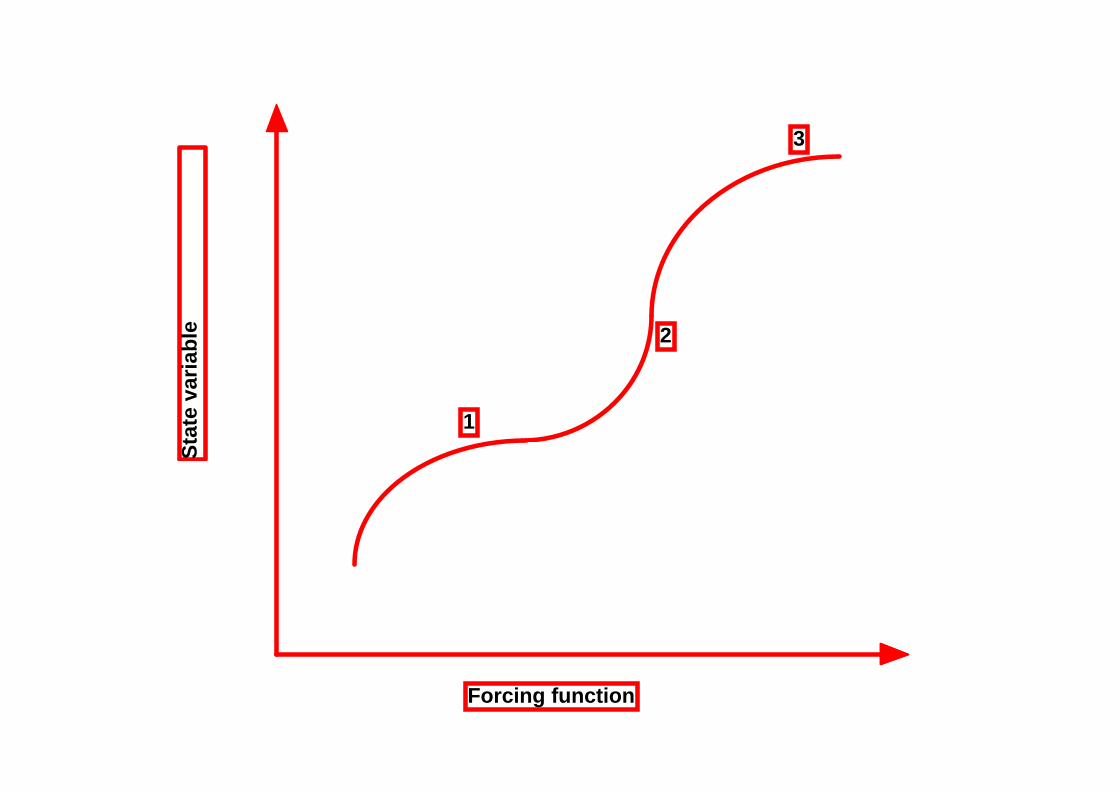
3
varia
ble 2
Stat
e v
1
Forcing function
Ecosystems have history:
• They response to external factors (f i f ti )(forcing functions)
• The same combination of numerous forcing functions will never appear again
• All the biological components areAll the biological components are currently changing their properties due to biochemical and biological adaptationto biochemical and biological adaptation - and shifts in species composition
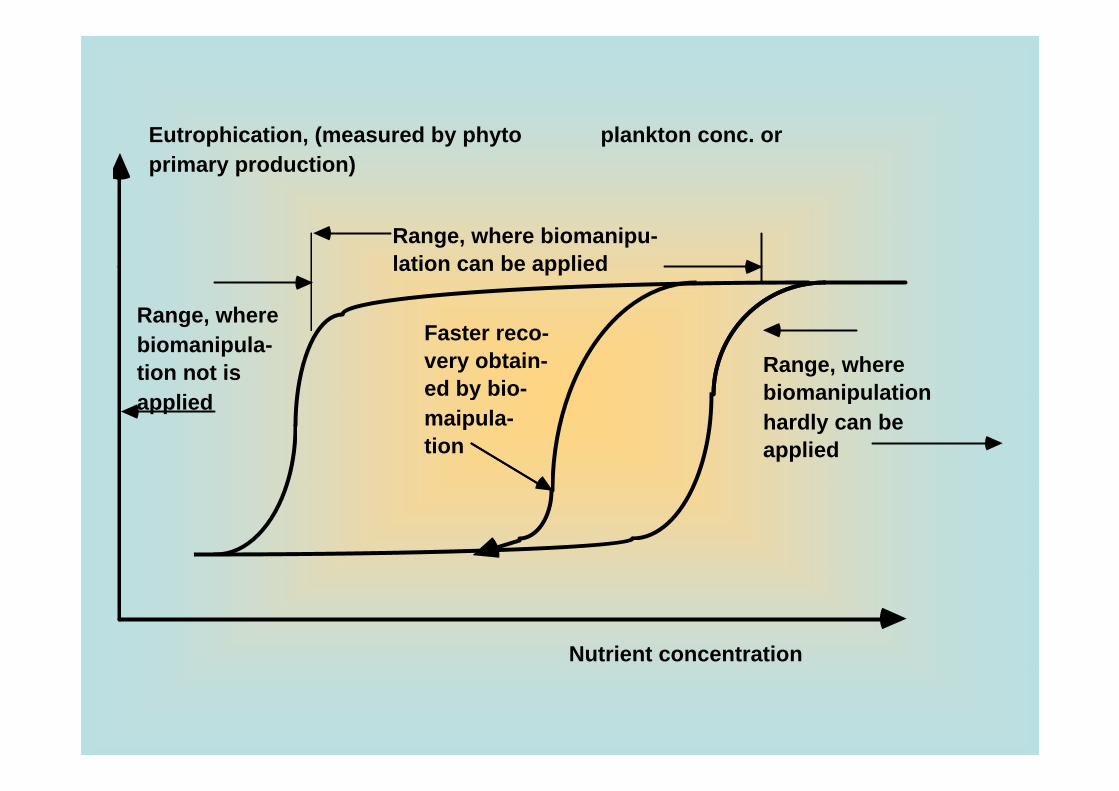
(Eutrophication, (measured by phyto plankton conc. or primary production)
Range, where biomanipu- lation can be applied
Range, where biomanipulation
Range, where biomanipula- tion not is
li d
Faster reco- very obtain- ed by bio- biomanipulation
hardly can be applied
applied ed by bio maipula- tion
Nutrient concentration
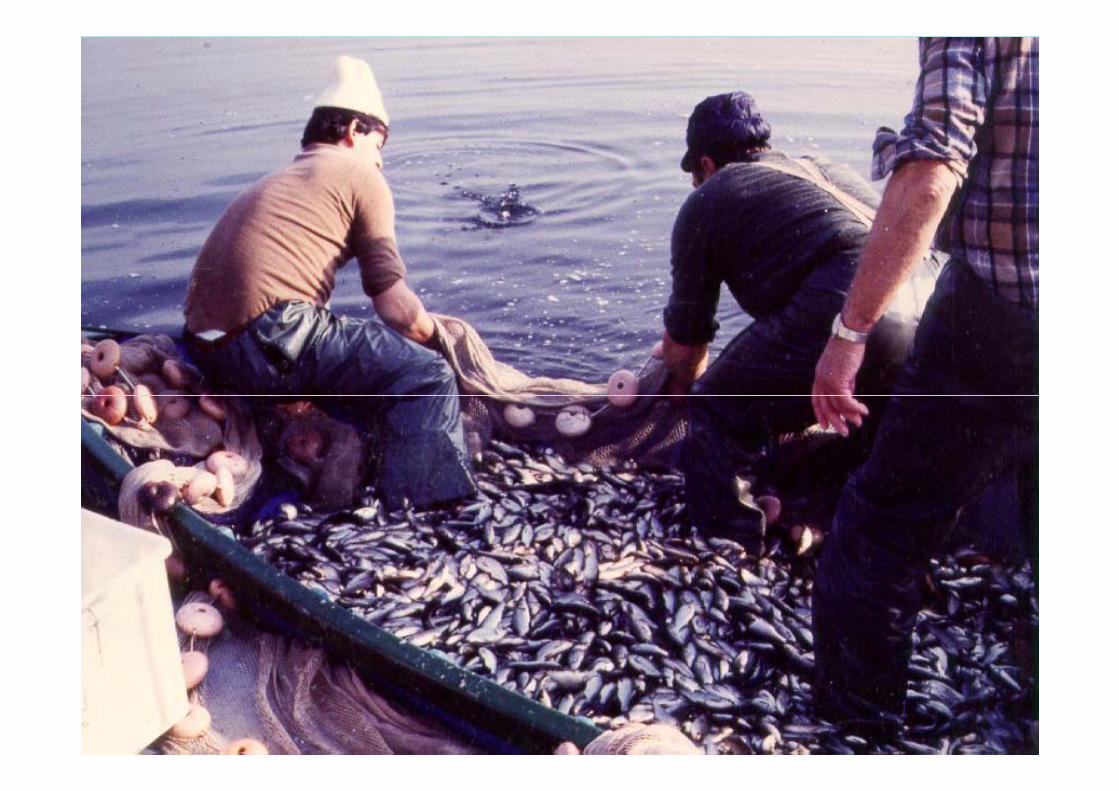
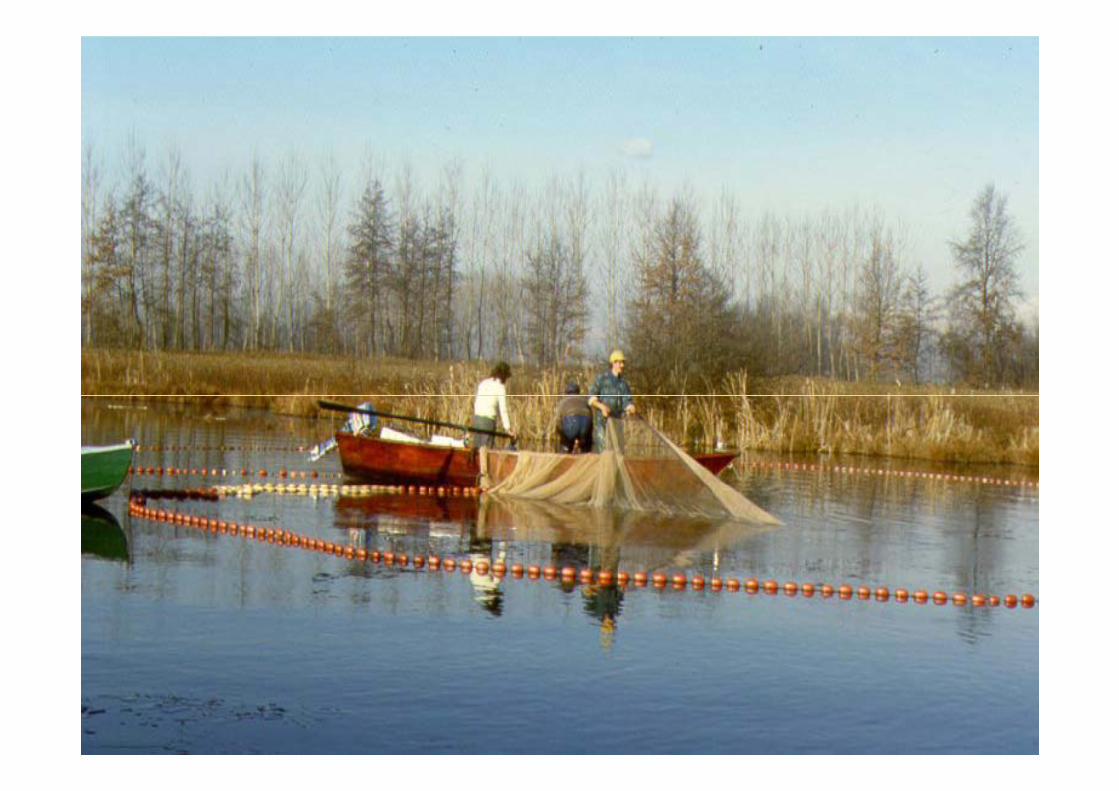
Two structures areTwo structures are competing:competing:
• Below 60 µg P/l zooplankton and carnivorous fish dominance Above 125µg P/l phytoplankton andAbove 125µg P/l phytoplankton and planktivorous fishBetween 60 and 125µg P/l both structures are possible dependentstructures are possible dependent on the history
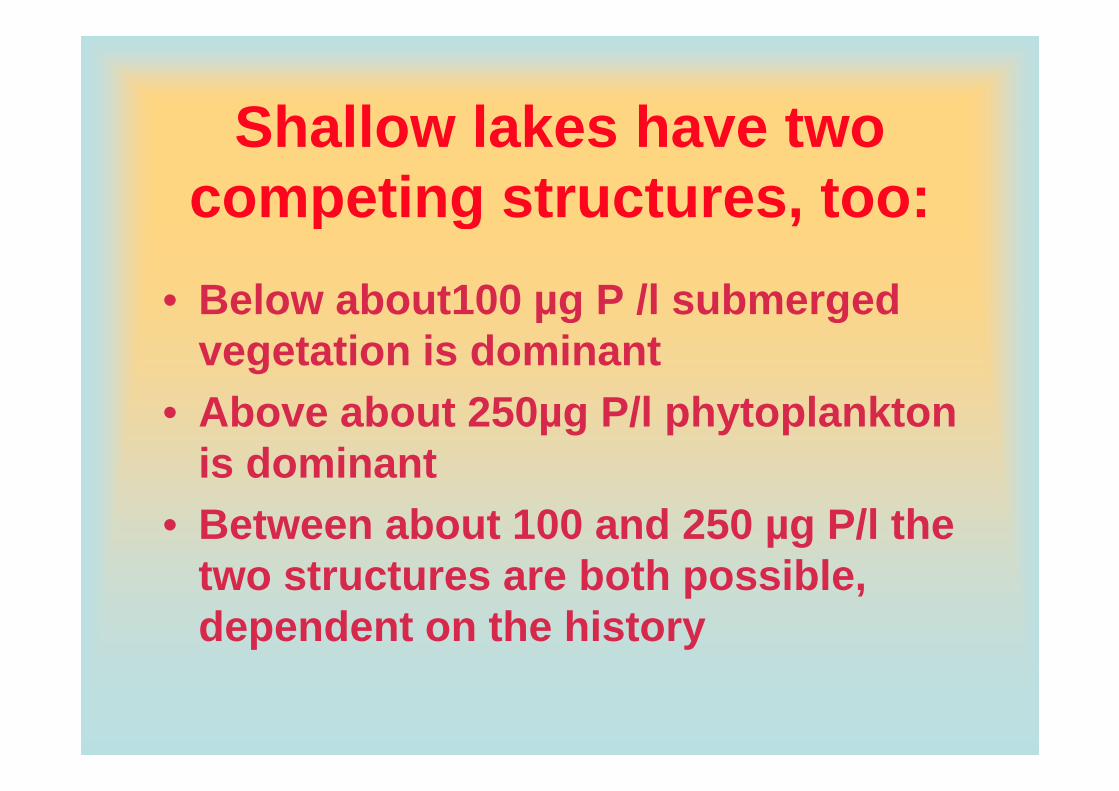
Shallow lakes have twoShallow lakes have two competing structures, too:competing structures, too:
• Below about100 µg P /l submergedBelow about100 µg P /l submerged vegetation is dominant
/• Above about 250µg P/l phytoplankton is dominant
• Between about 100 and 250 µg P/l the two structures are both possibletwo structures are both possible, dependent on the history
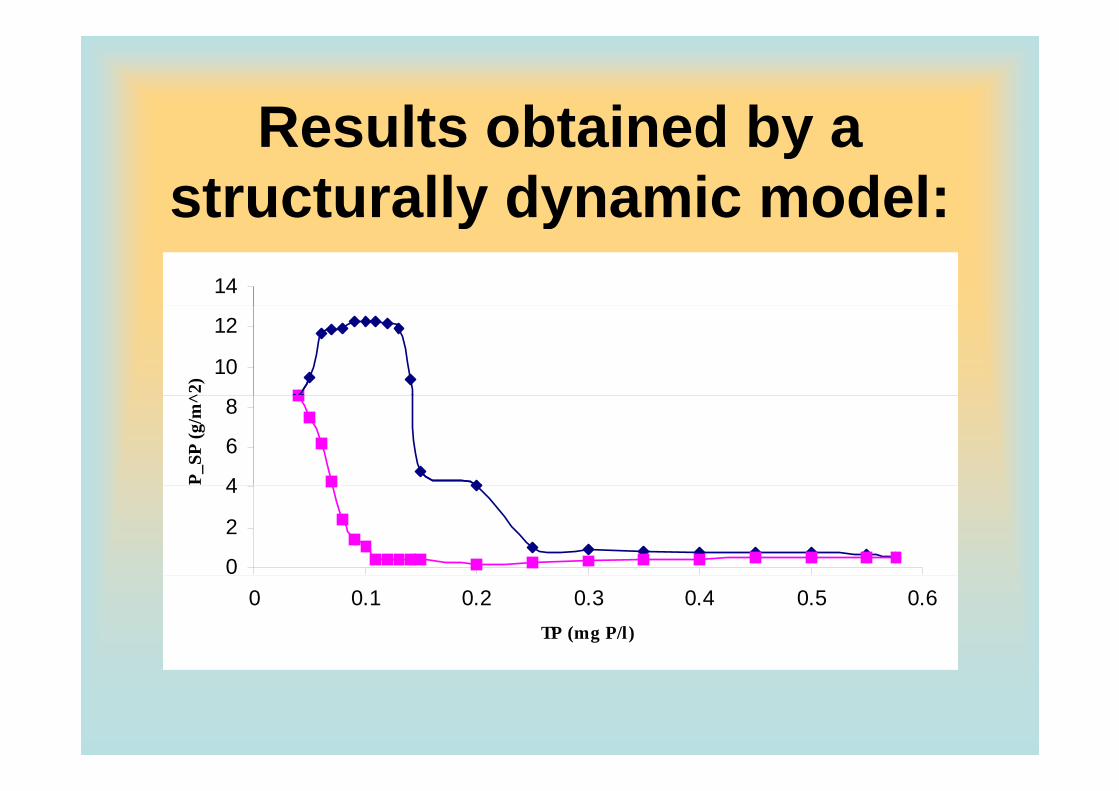
Results obtained by aResults obtained by a structurally dynamic model:structurally dynamic model:
14
10
12
^2)
4
6
8
P_SP
(g/m
^
0
2
4
0 0.1 0.2 0.3 0.4 0.5 0.6TP (mg P/l)
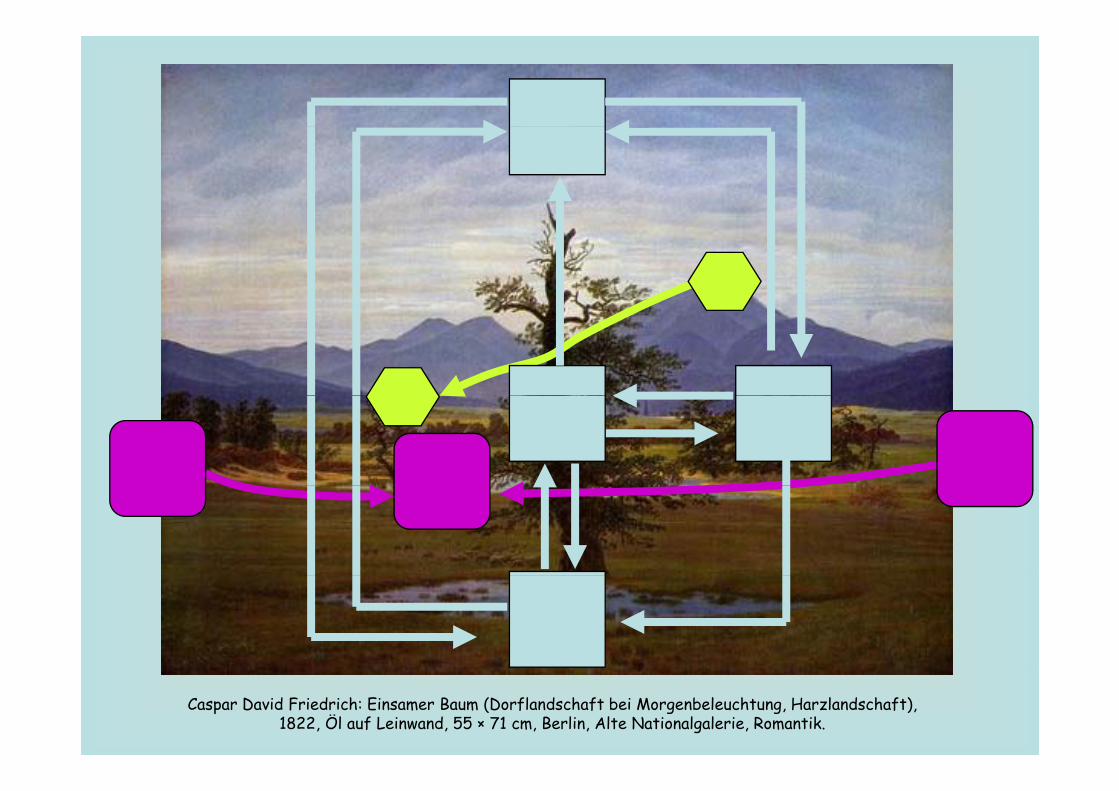
Caspar David Friedrich: Einsamer Baum (Dorflandschaft bei Morgenbeleuchtung, Harzlandschaft), 1822, Öl auf Leinwand, 55 × 71 cm, Berlin, Alte Nationalgalerie, Romantik.
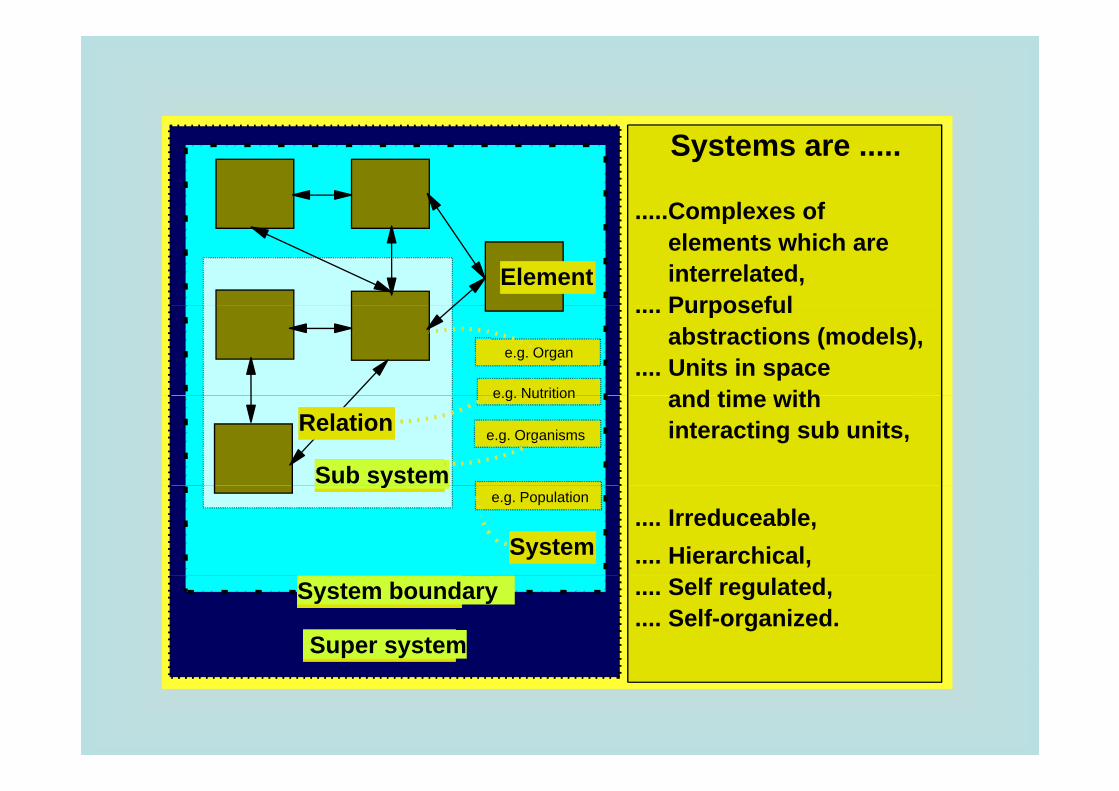
Systems are .....
.....Complexes of
Element
.....Complexes of elements which areinterrelated,Purposeful.... Purposefulabstractions (models),
.... Units in spaceand time with
e.g. Organ
e g Nutrition
Sub system
and time withinteracting sub units,e.g. Organisms
e.g. Nutrition
Relation
y
System.... Irreduceable,.... Hierarchical,
e.g. Population
System boundary
Super system
.... Self regulated,
.... Self-organized.
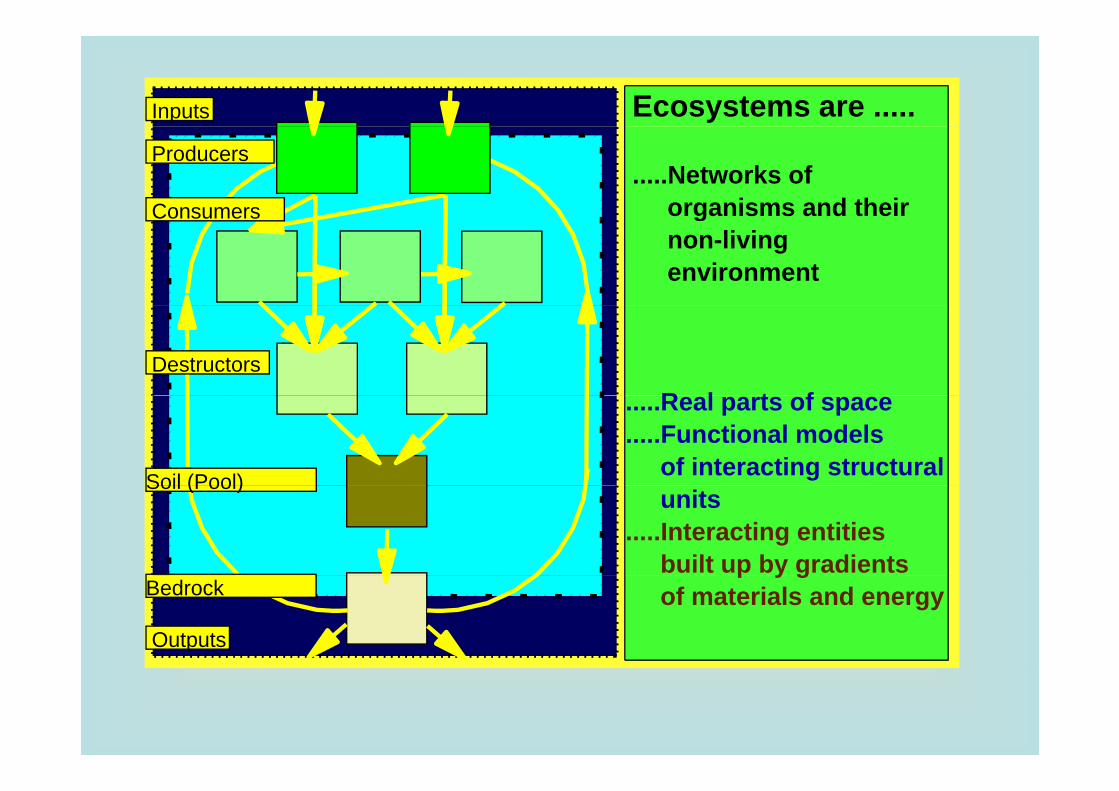
Ecosystems are .....Inputs
.....Networks of organisms and their
ProduzentenProducers
Consumers o ga s s a d t enon-living environment
Consumers
R l t fDestructors
.....Real parts of space
.....Functional models of interacting structural Soil (Pool)units
.....Interacting entities built up by gradients
Soil (Pool)
p y gof materials and energy Bedrock
Outputs
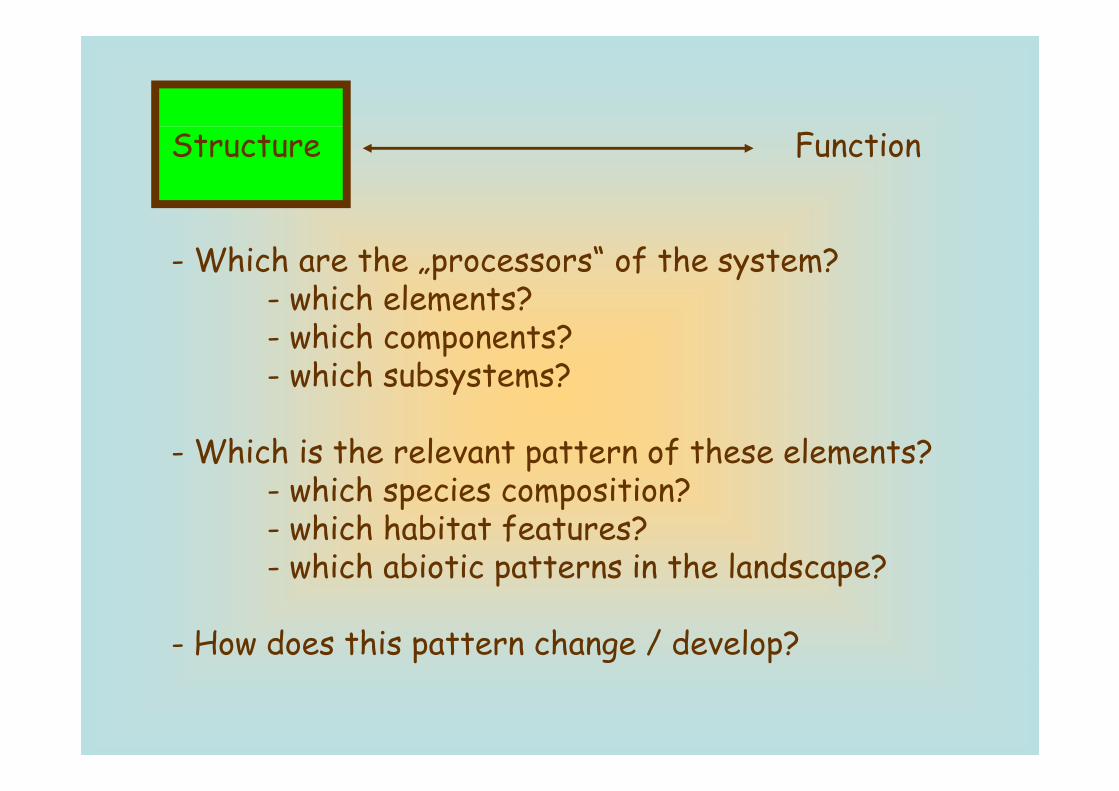
Structure Function
- Which are the „processors“ of the system?- which elements?which elements?- which components?- which subsystems?
- Which is the relevant pattern of these elements?which species composition?- which species composition?
- which habitat features?- which abiotic patterns in the landscape?which abiotic patterns in the landscape?
- How does this pattern change / develop?
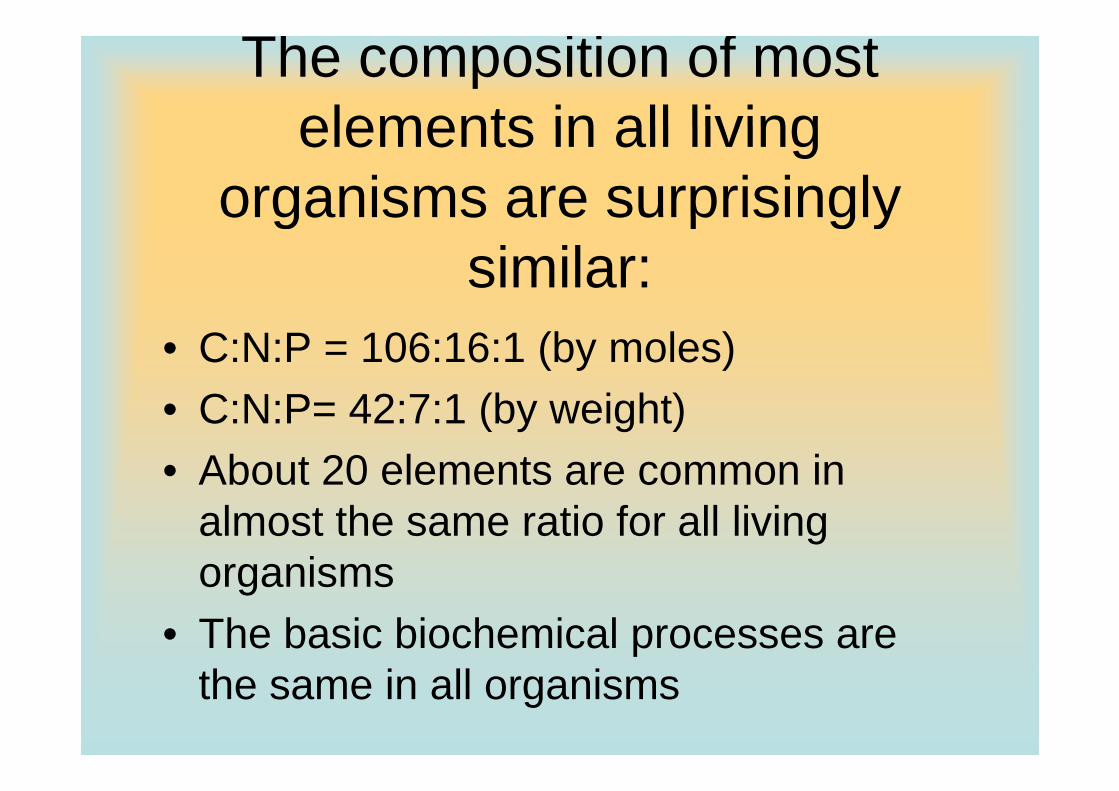
The composition of most elements in all livingelements in all living
organisms are surprisinglyorganisms are surprisingly similar:
• C:N:P = 106:16:1 (by moles)C N P 42 7 1 (b i ht)• C:N:P= 42:7:1 (by weight)
• About 20 elements are common in almost the same ratio for all living organismsorganisms
• The basic biochemical processes are the same in all organisms
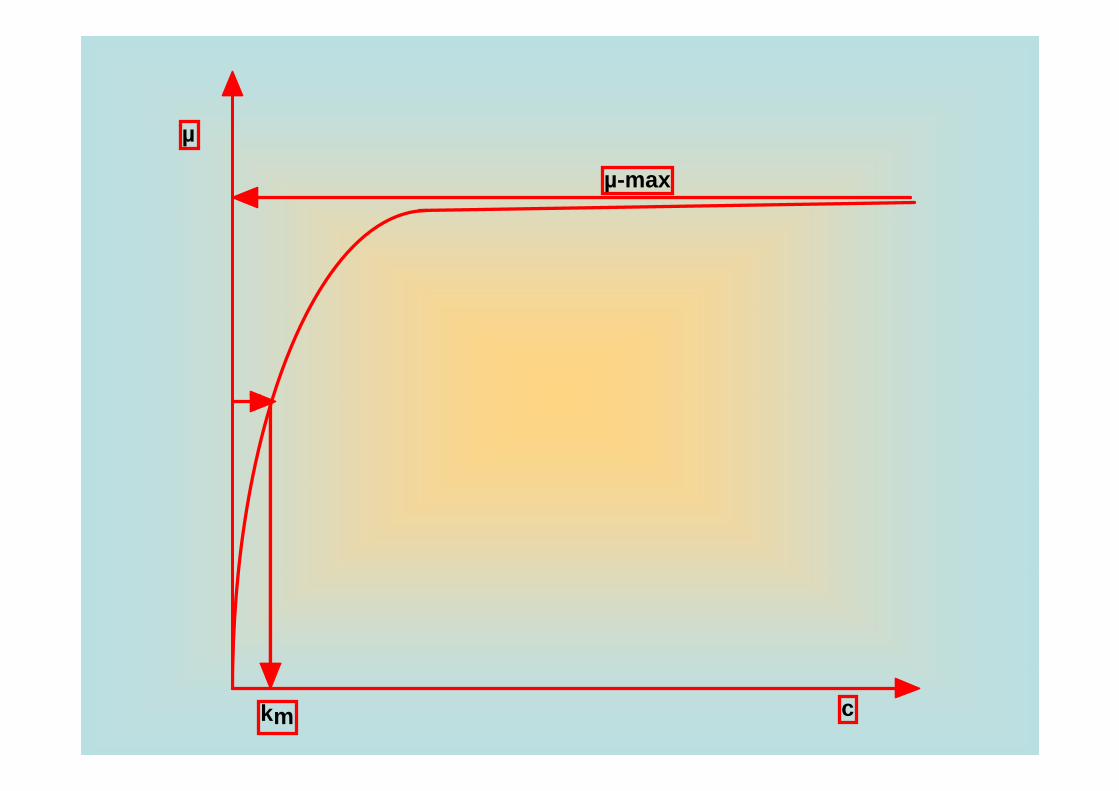
µ
µ-max
ckm
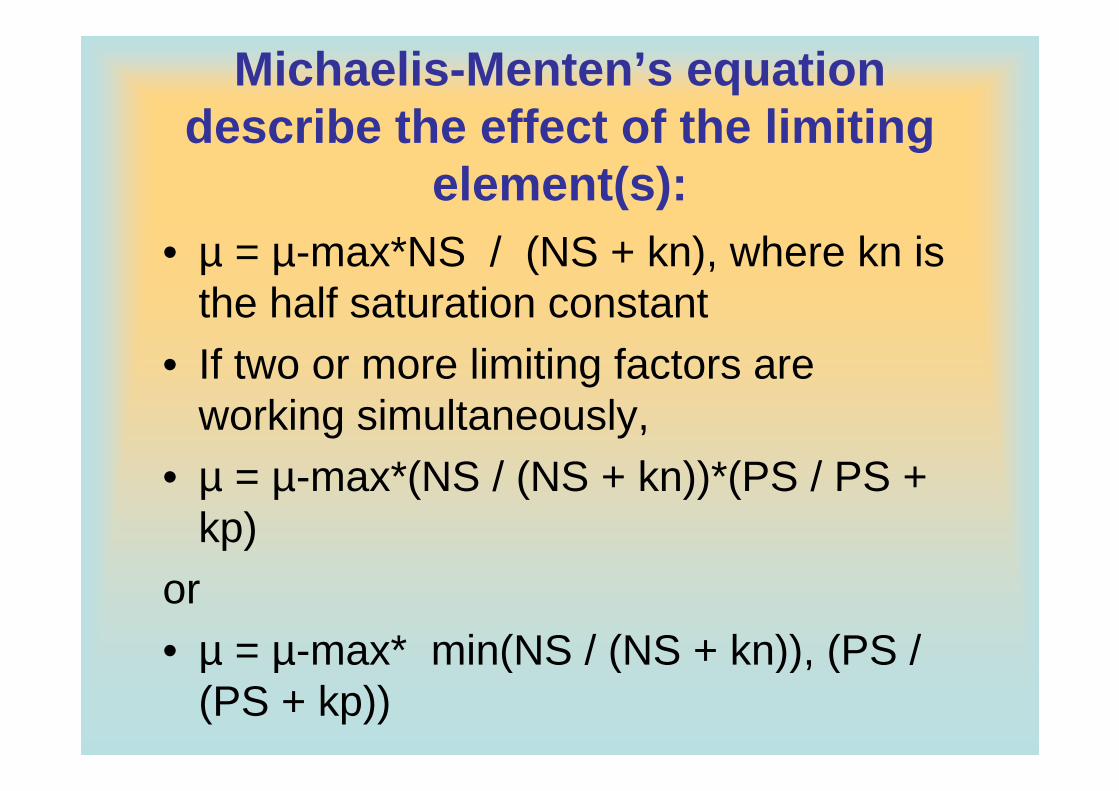
Michaelis-Menten’s equation describe the effect of the limitingdescribe the effect of the limiting
element(s):• µ = µ-max*NS / (NS + kn), where kn is
the half saturation constantthe half saturation constant• If two or more limiting factors are
working simultaneously,• µ = µ-max*(NS / (NS + kn))*(PS / PS +µ µ max (NS / (NS + kn)) (PS / PS +
kp)or• µ = µ-max* min(NS / (NS + kn)), (PS / µ µ a ( S / ( S )), ( S /
(PS + kp))
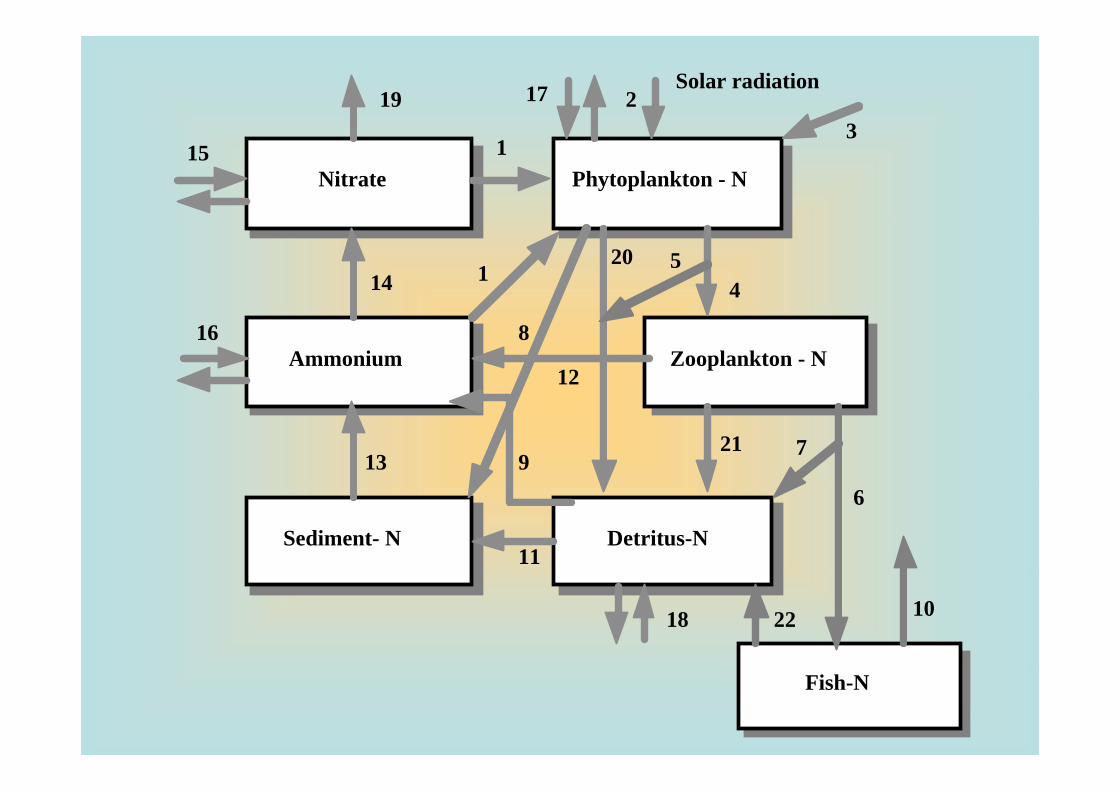
Solar radiation2
3
1719
Nitrate Phytoplankton - N1
315
1414
520
Ammonium Zooplankton - N8
12
16
913721
Sediment- N Detritus-N11
6
18 1022
Fish-N
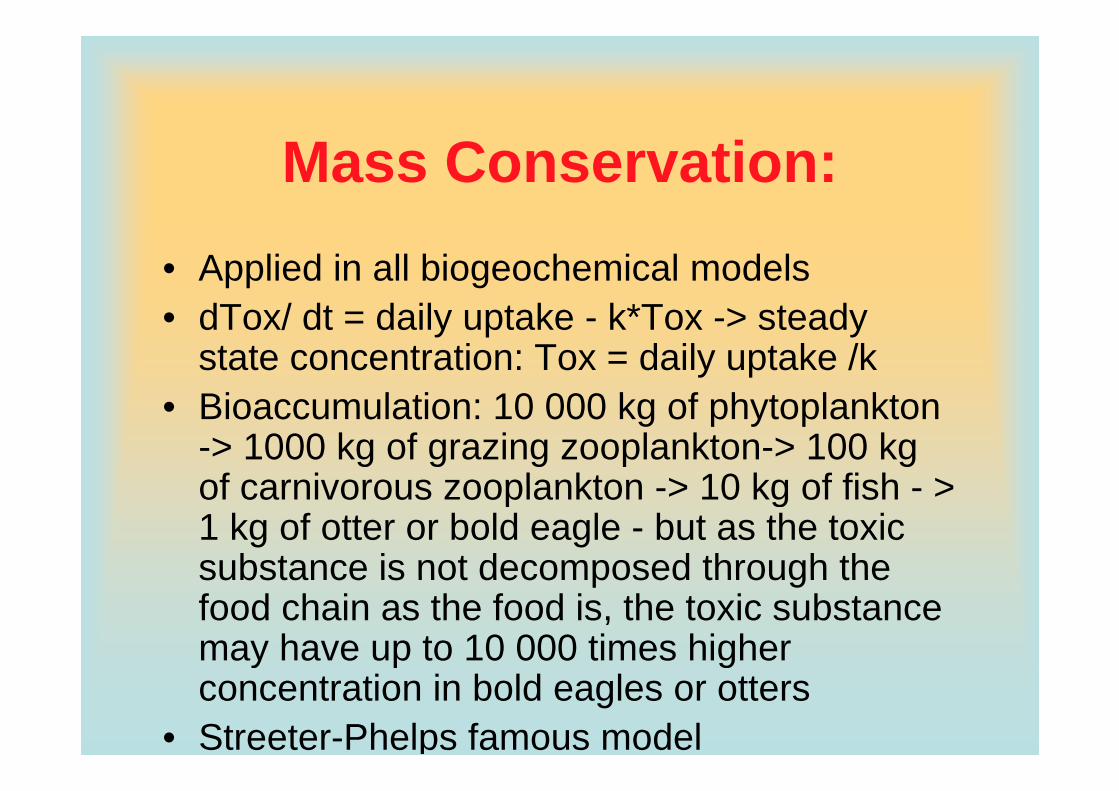
Mass Conservation:• Applied in all biogeochemical models
dT / dt d il t k k*T t d• dTox/ dt = daily uptake - k*Tox -> steady state concentration: Tox = daily uptake /kBi l ti 10 000 k f h t l kt• Bioaccumulation: 10 000 kg of phytoplankton -> 1000 kg of grazing zooplankton-> 100 kg of carnivorous zooplankton > 10 kg of fish >of carnivorous zooplankton -> 10 kg of fish - > 1 kg of otter or bold eagle - but as the toxic substance is not decomposed through thesubstance is not decomposed through the food chain as the food is, the toxic substance may have up to 10 000 times higher y p gconcentration in bold eagles or otters
• Streeter-Phelps famous model
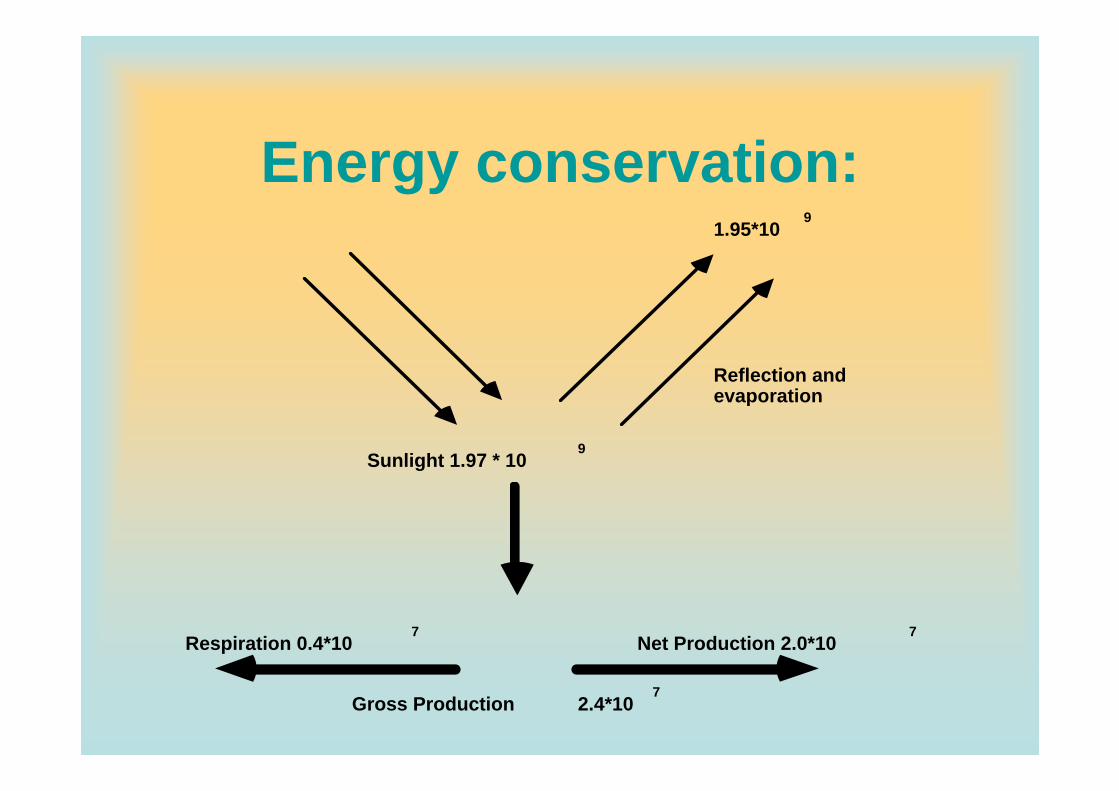
Energy conservation:9
1.95*109
Reflection and evaporation
Sunlight 1.97 * 10
evaporation
9
Respiration 0.4*10 Net Production 2.0*107 7
Gross Production 2.4*107
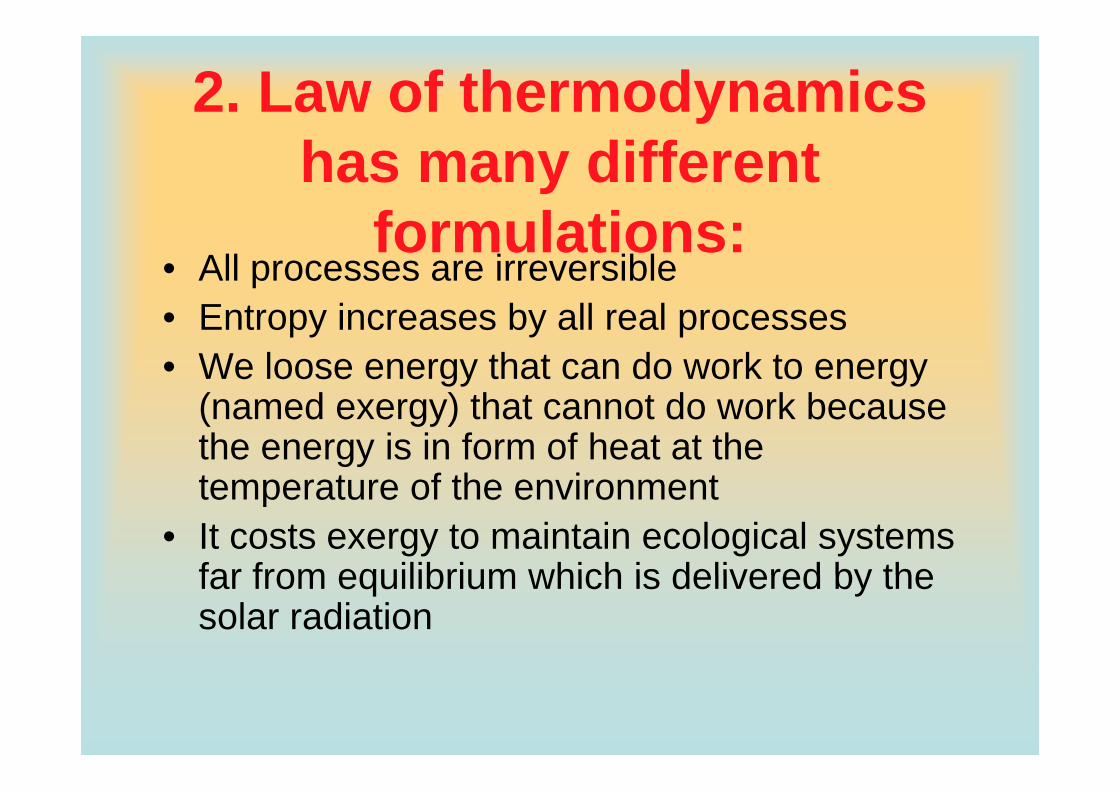
2. Law of thermodynamics has many different
f l tiformulations:• All processes are irreversible
E t i b ll l• Entropy increases by all real processes• We loose energy that can do work to energy
( d ) th t t d k b(named exergy) that cannot do work because the energy is in form of heat at the temperature of the environmenttemperature of the environment
• It costs exergy to maintain ecological systems far from equilibrium which is delivered by thefar from equilibrium which is delivered by the solar radiation
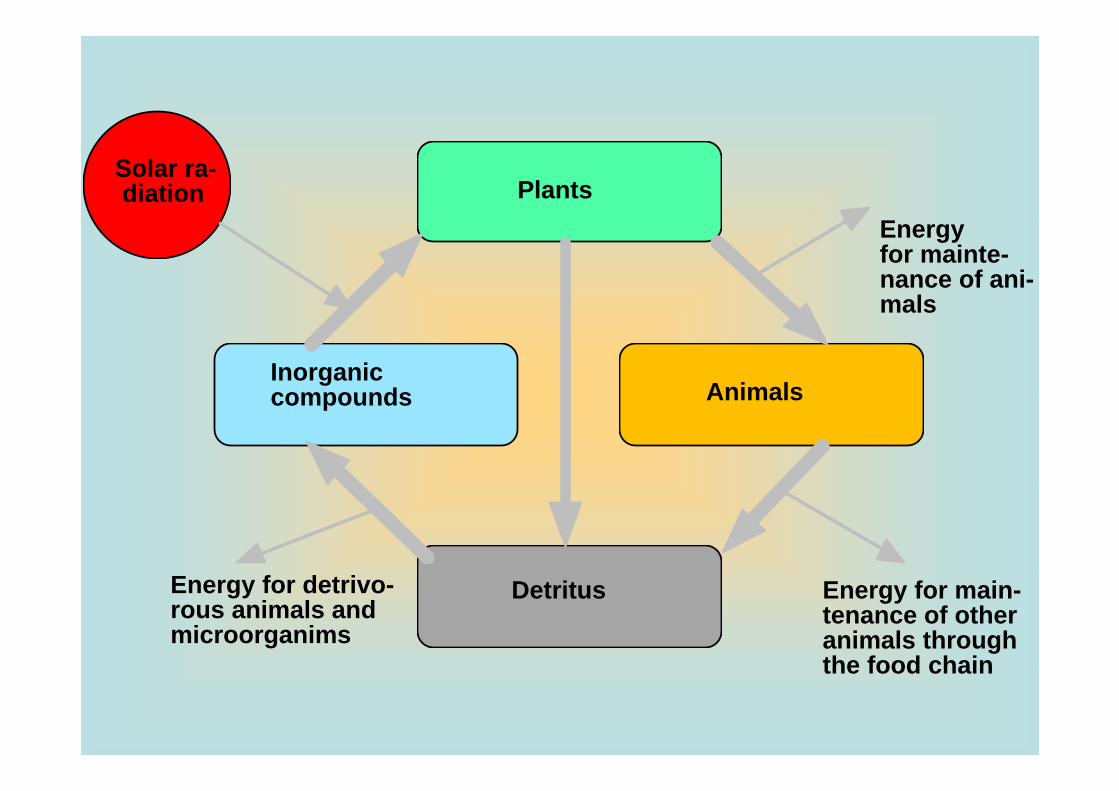
Solar ra- diation Plants
Energy for mainte- nance of ani- mals
Animals
mals
Inorganic compounds Animalscompounds
f Detritus Energy for main- tenance of other animals through the food chain
Energy for detrivo- rous animals and microorganims
the food chain
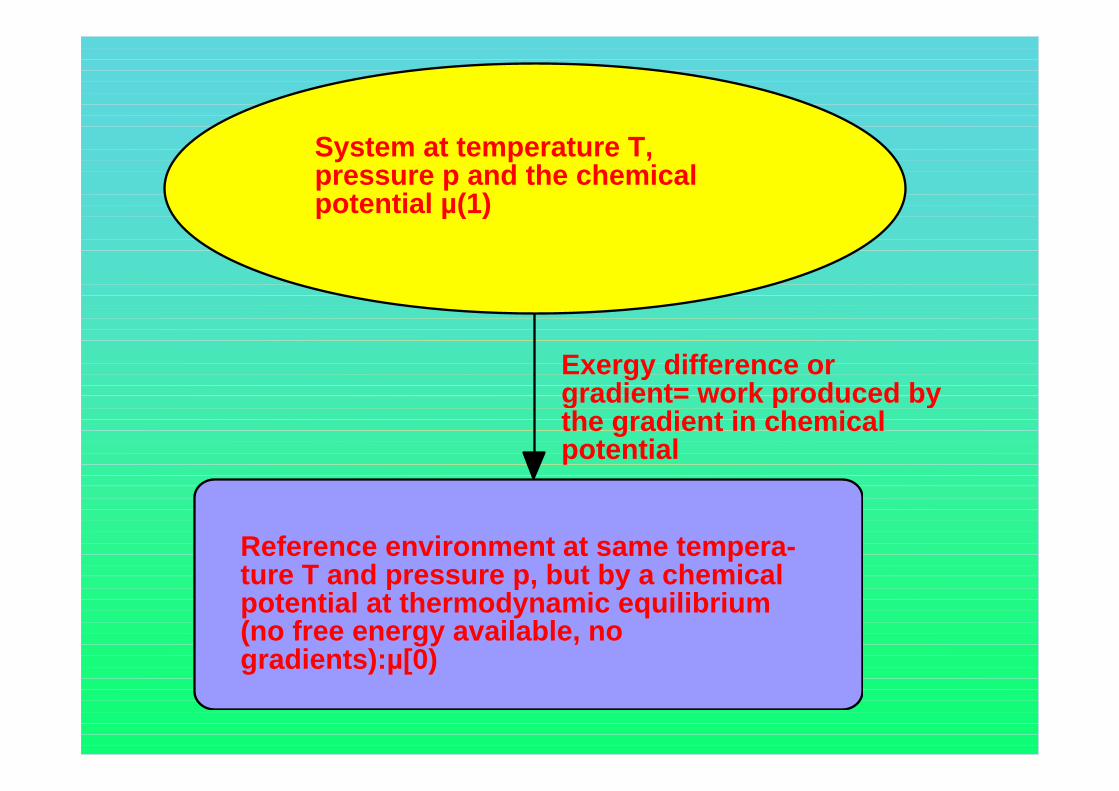
System at temperature T, pressure p and the chemical potential µ(1)p µ( )
Exergy difference or gradient= work produced bygradient= work produced by the gradient in chemical potential
Reference environment at same tempera- ture T and pressure p but by a chemicalture T and pressure p, but by a chemical potential at thermodynamic equilibrium (no free energy available, no gradients):µ[0)gradients):µ[0)
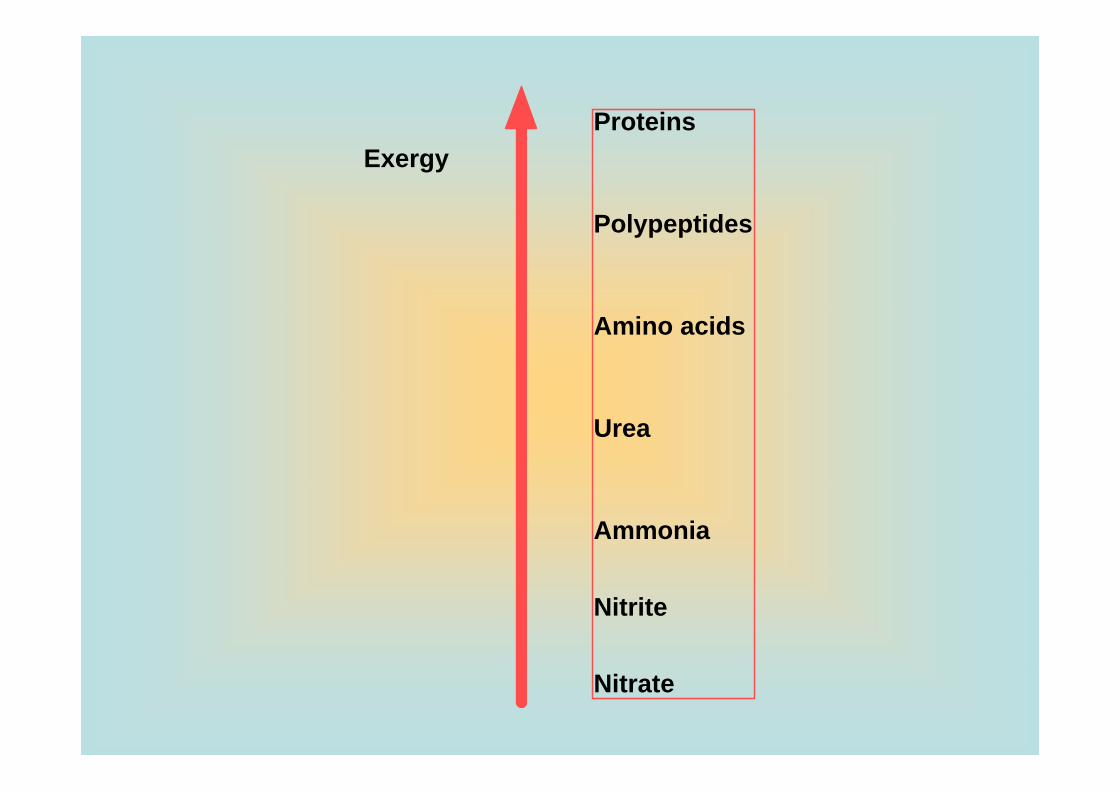
ProteinsProteins P l tid
Exergy
Polypeptides
Amino acids
Urea
Ammonia
Nitrite
Nitrate
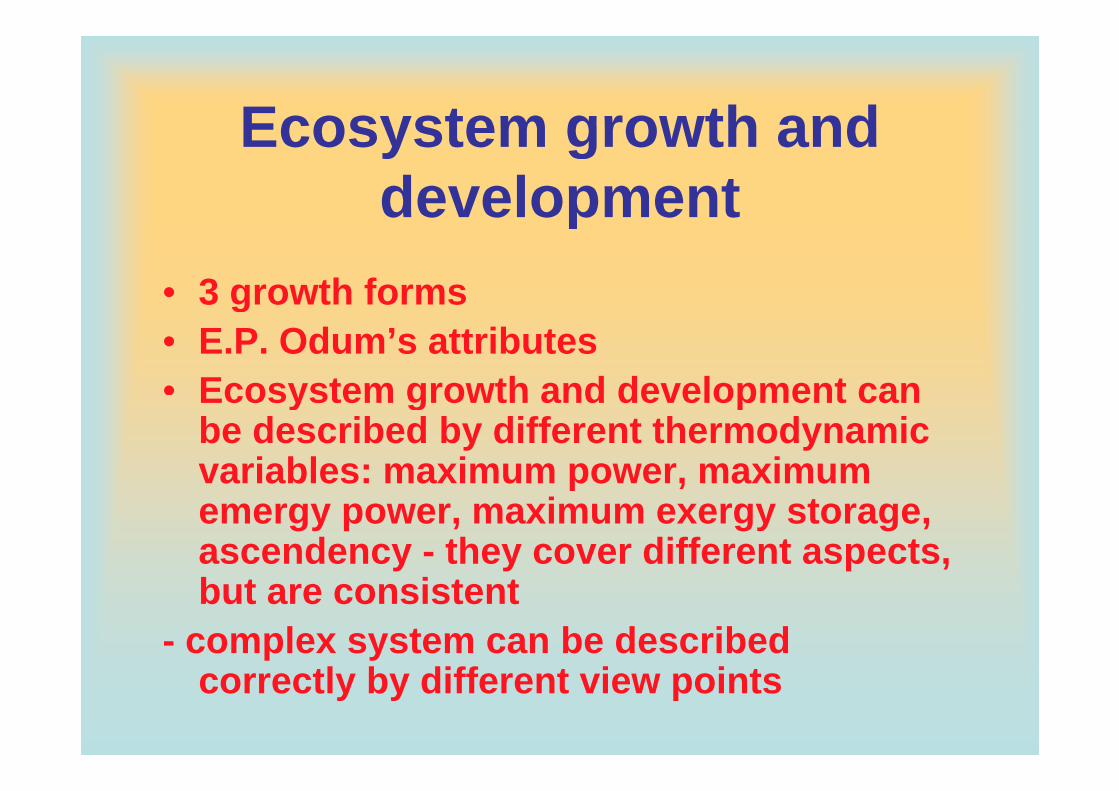
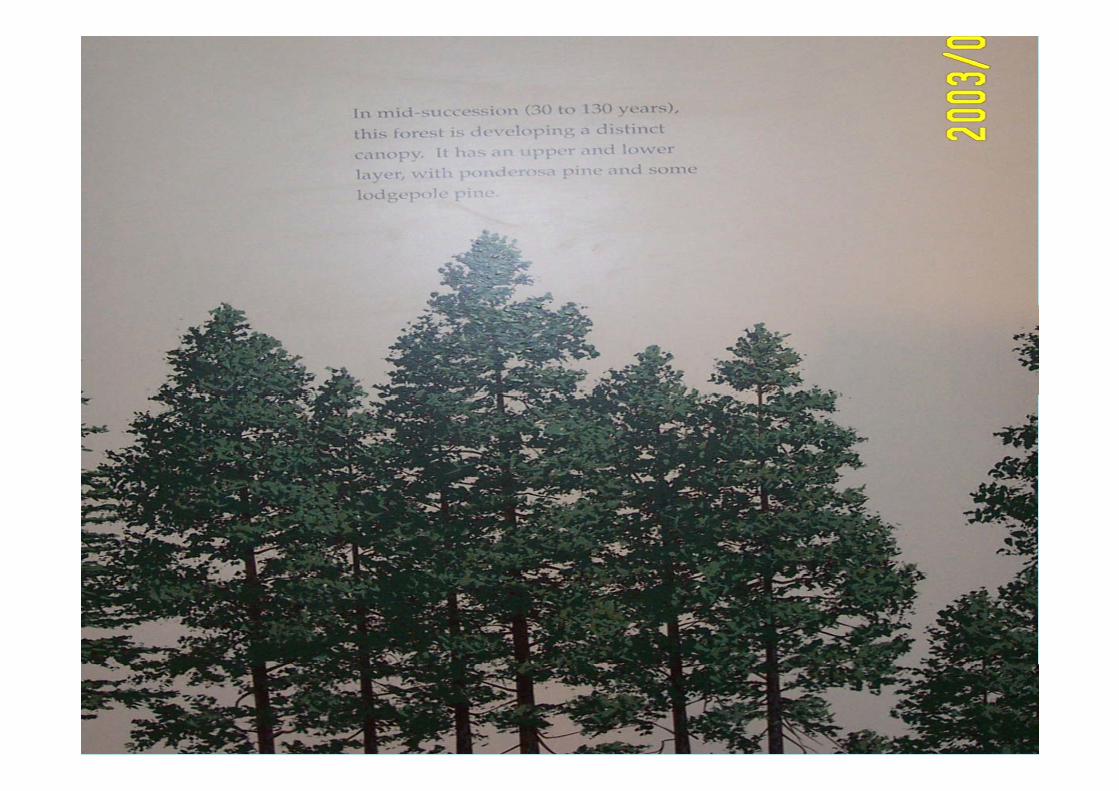
Ecosystem growth andEcosystem growth and developmentdevelopment
• 3 growth formsg• E.P. Odum’s attributes• Ecosystem growth and development canEcosystem growth and development can
be described by different thermodynamic variables: maximum power, maximum p ,emergy power, maximum exergy storage, ascendency - they cover different aspects, but are consistent
- complex system can be described correctly by different view points
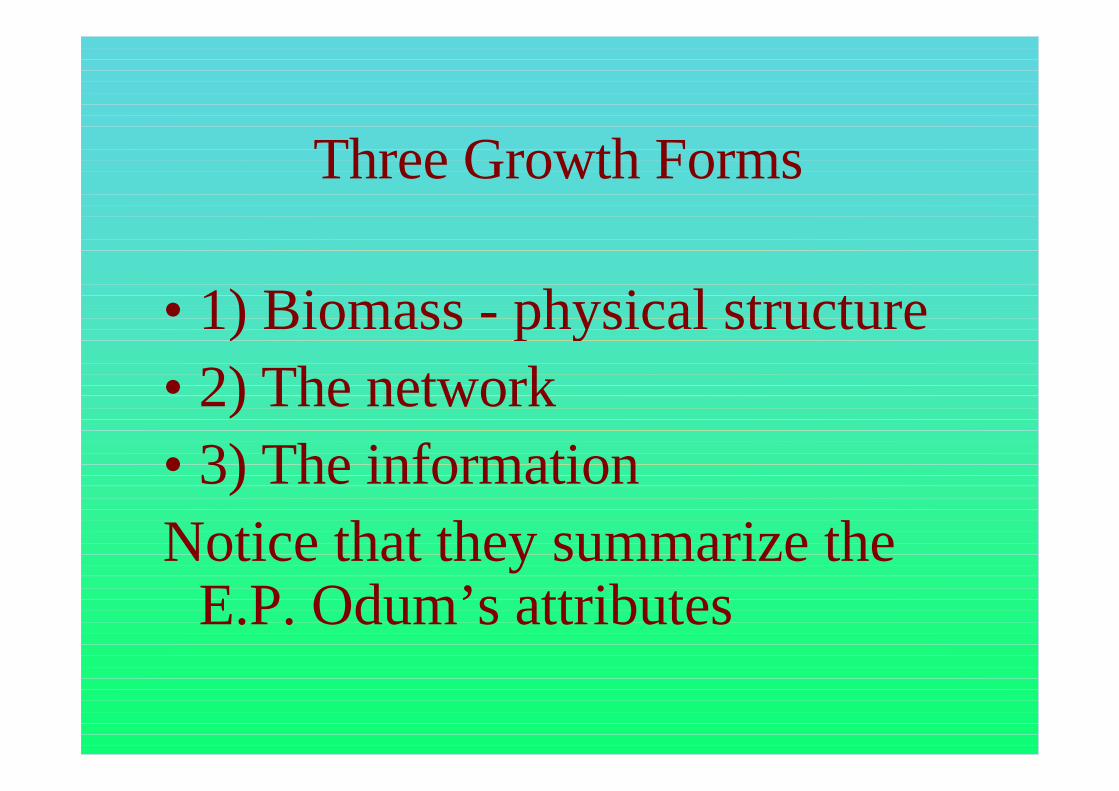
Three Growth Forms
• 1) Biomass physical structure• 1) Biomass - physical structure• 2) The network2) The network• 3) The information)Notice that they summarize the
E.P. Odum’s attributes
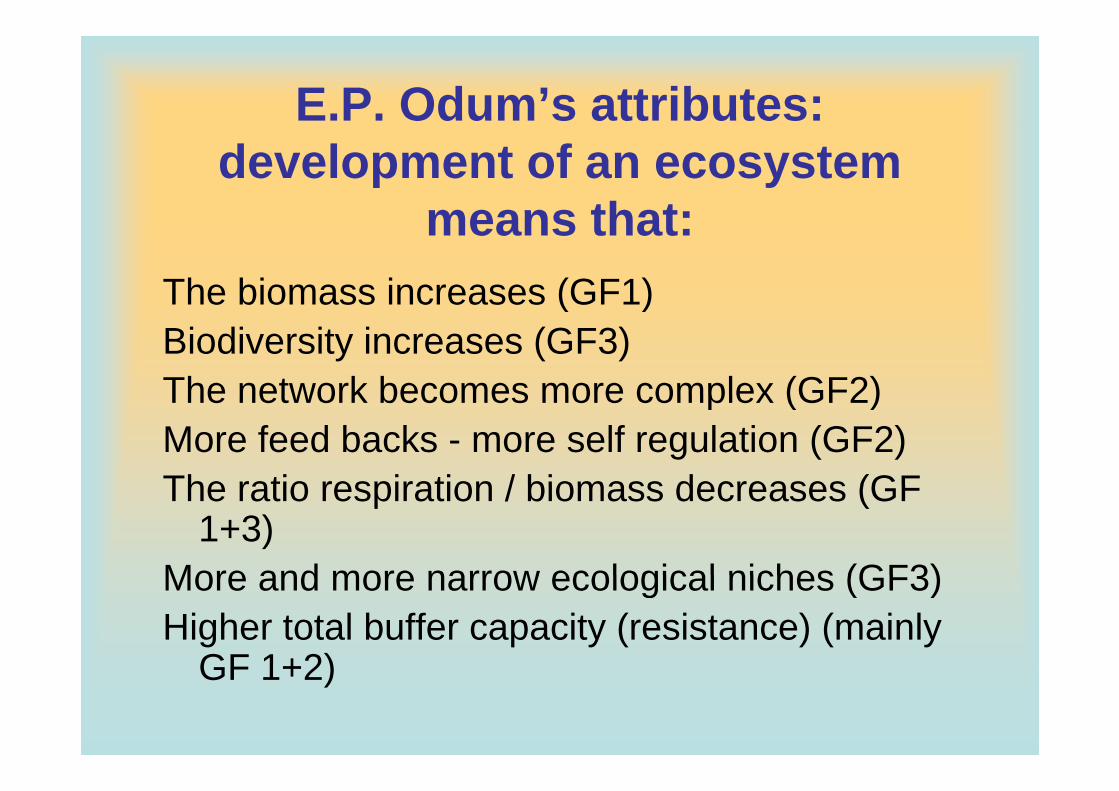
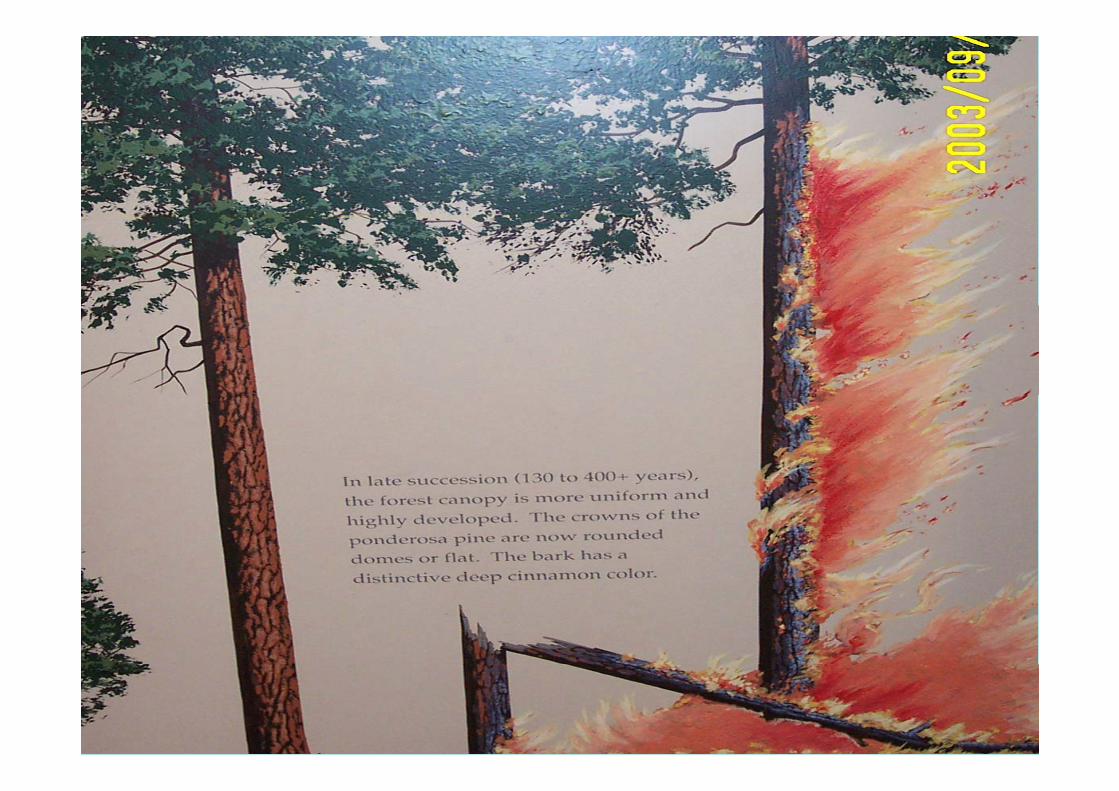
E.P. Odum’s attributes: development of an ecosystem
means that:means that:The biomass increases (GF1)( )Biodiversity increases (GF3)The network becomes more complex (GF2)The network becomes more complex (GF2)More feed backs - more self regulation (GF2)The ratio respiration / biomass decreases (GFThe ratio respiration / biomass decreases (GF
1+3)More and more narrow ecological niches (GF3)More and more narrow ecological niches (GF3)Higher total buffer capacity (resistance) (mainly
GF 1+2)GF 1+2)
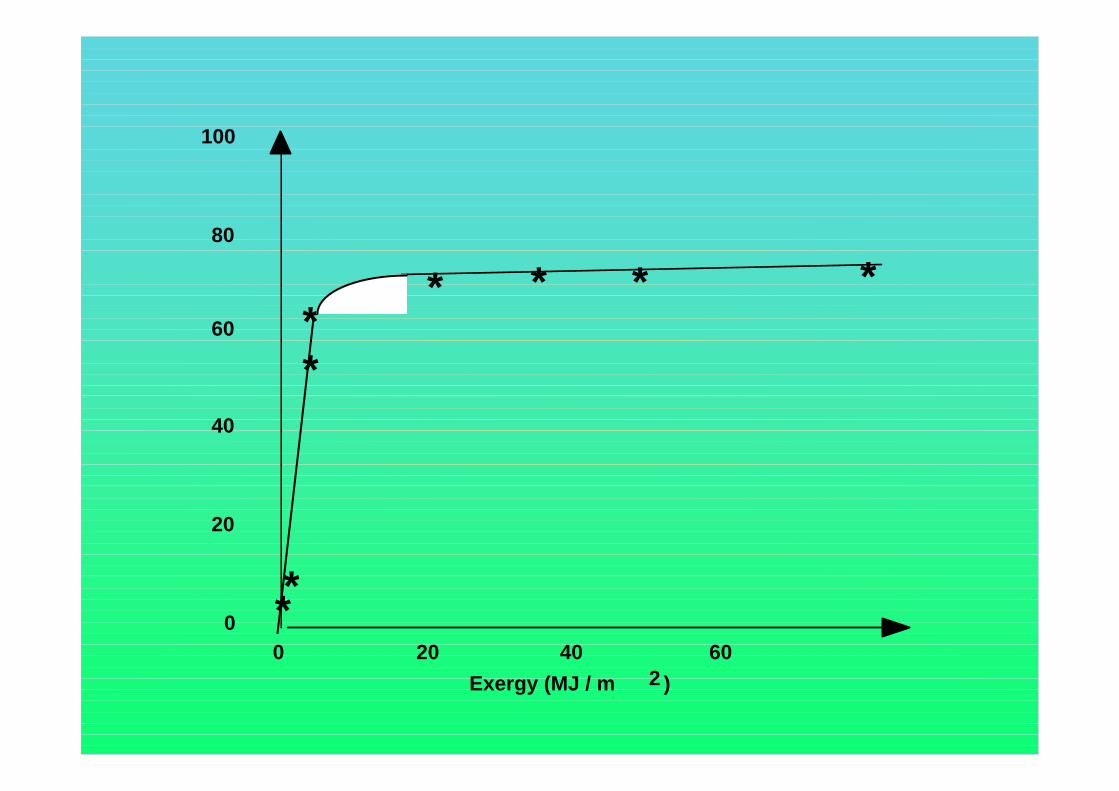
100
80
** * * *
60
**
40
20
*0 20 40 60
0**
Exergy (MJ / m 2 )
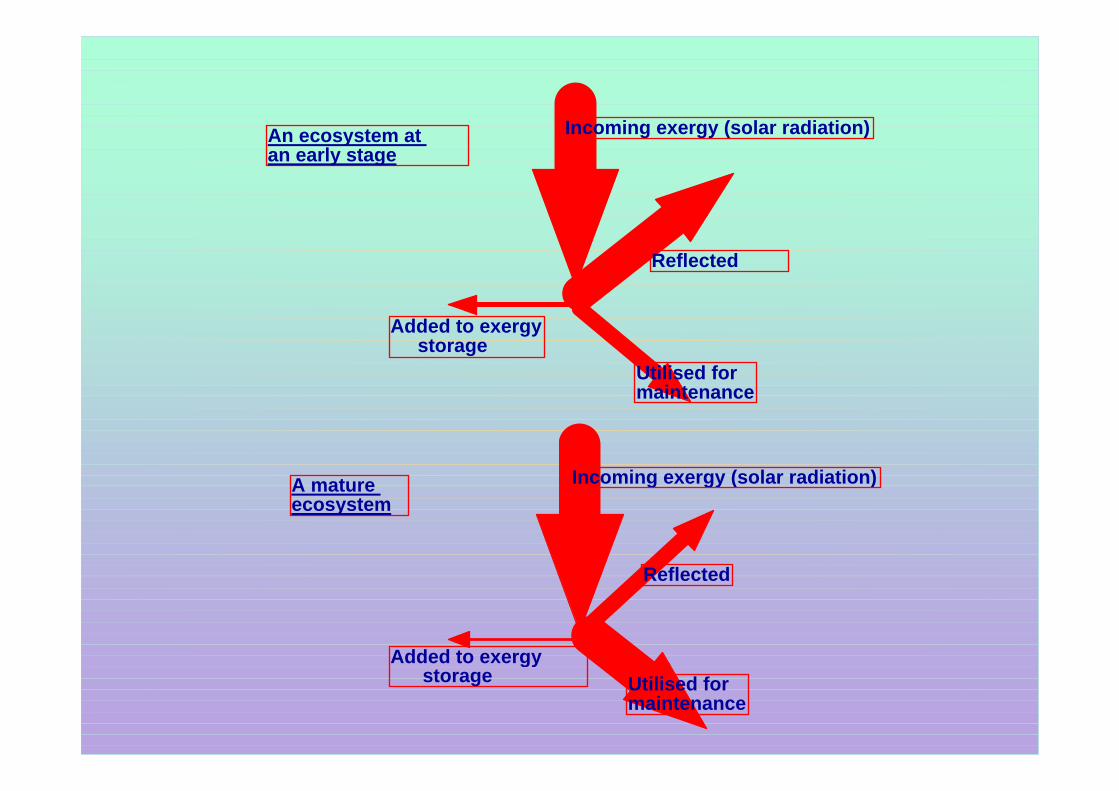
Incoming exergy (solar radiation)Incoming exergy (solar radiation)An ecosystem at an early stage
Reflected
Utilised for maintenance
Added to exergy storage
maintenance
Incoming exergy (solar radiation)A mature g gy ( )
Reflected
A mature ecosystem
Reflected
Added to exergy Utilised for maintenance
gy storage
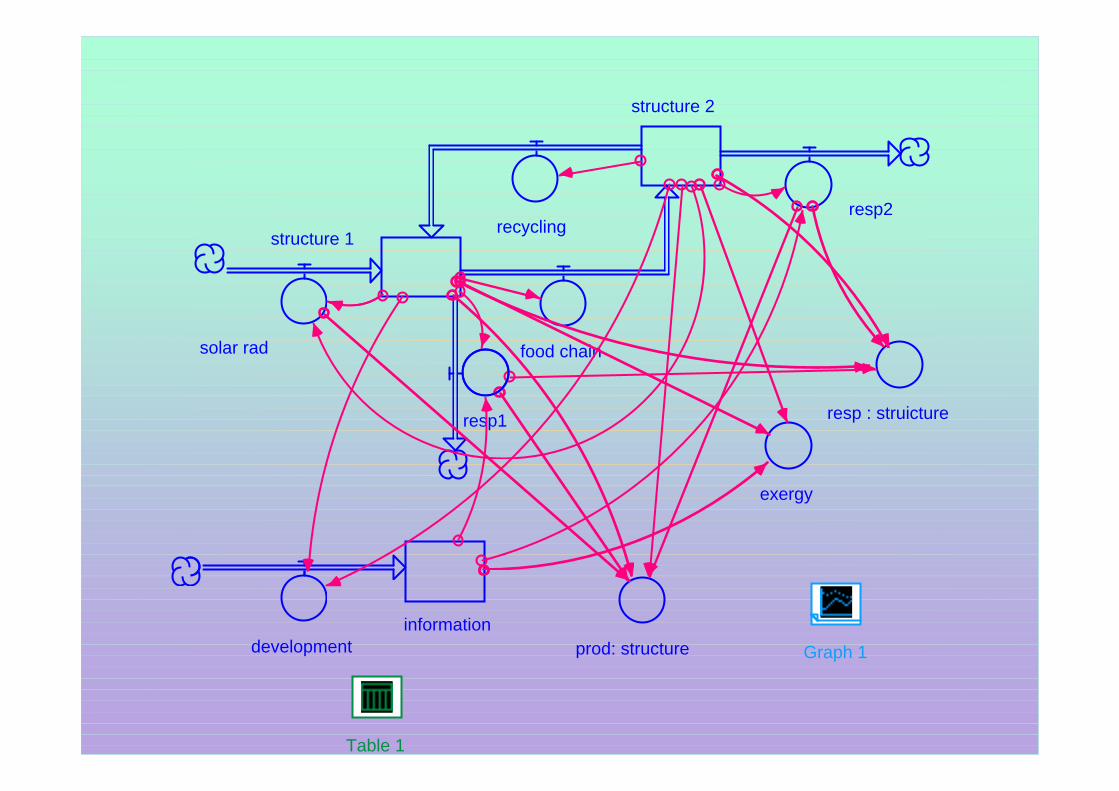
structure 2
resp2
structure 1
precycling
solar rad food chain
resp1 resp : struicture
exergy
informationdevelopment Graph 1prod: structure
Table 1
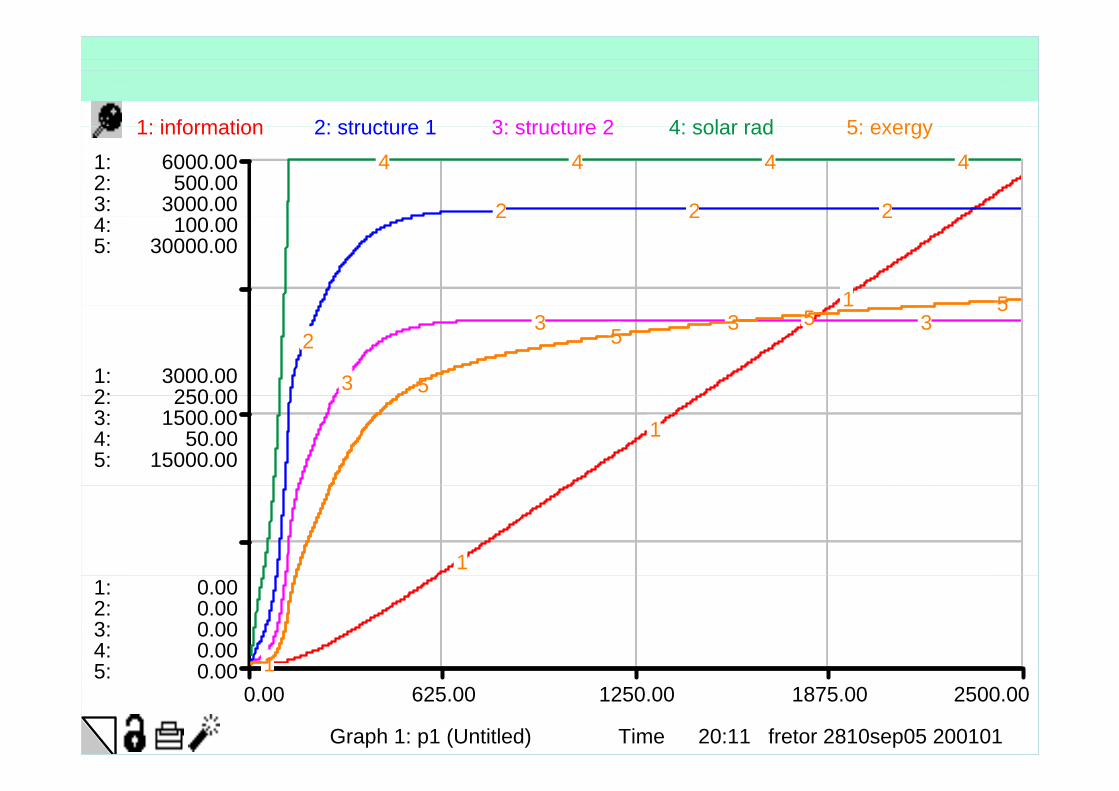
1: information 2: structure 1 3: structure 2 4: solar rad 5: exergy1:2:3:
6000.00500.00
3000.00
1: information 2: structure 1 3: structure 2 4: solar rad 5: exergy
2 2 2
4 4 4 4
4:5:
100.0030000.00
1
2 2 2
5
1:2:
3000.00250 00
1
2
3
3 3 3
5
55 5
2:3:4:5:
250.001500.00
50.0015000.00
1
11:2:3:4:5
0.000.000.000.000 00 1
20:11 fretor 2810sep05 200101
0.00 625.00 1250.00 1875.00 2500.00
Time
5: 0.00 1
Graph 1: p1 (Untitled)
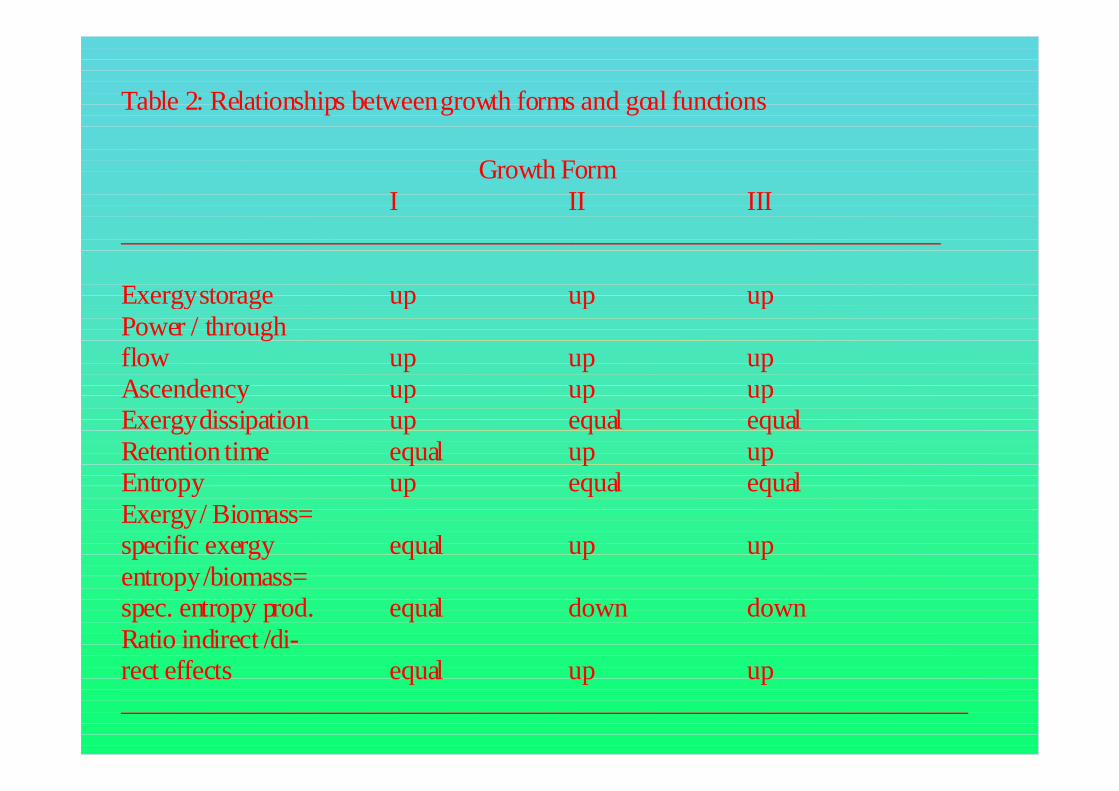
Table 2: Relationships between growth forms and goal functions
Growth FormI II III
____________________________________________________________
Exergystorage up up upgy g p p pPower / throughflow up up upAscendency up up upAscendency up up upExergy dissipation up equal equalRetention time equal up upEntropy up equal equalEntropy up equal equalExergy / Biomass=specific exergy equal up upentropy/biomass=entropy /biomass=spec. entropy prod. equal down downRatio indirect /di-
t ff t lrect effects equal up up______________________________________________________________
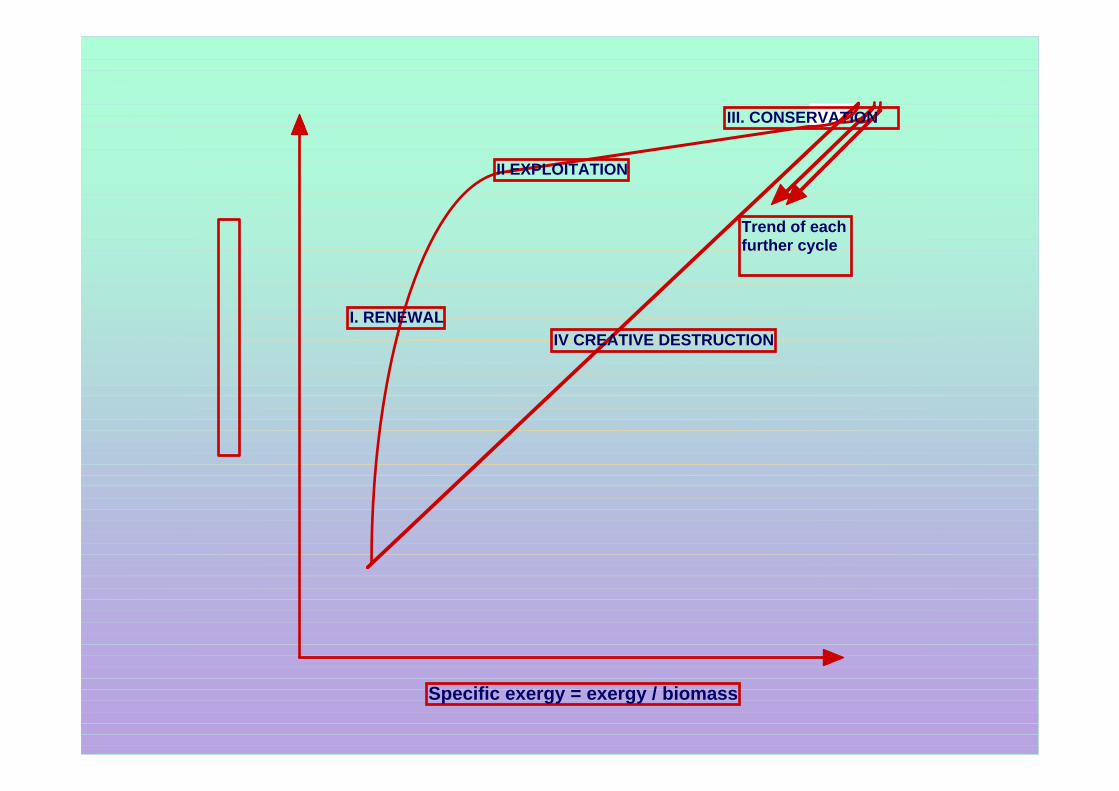
III. CONSERVATION
II EXPLOITATION
Trend of each further cycle
I. RENEWALIV CREATIVE DESTRUCTION
Specific exergy = exergy / biomass
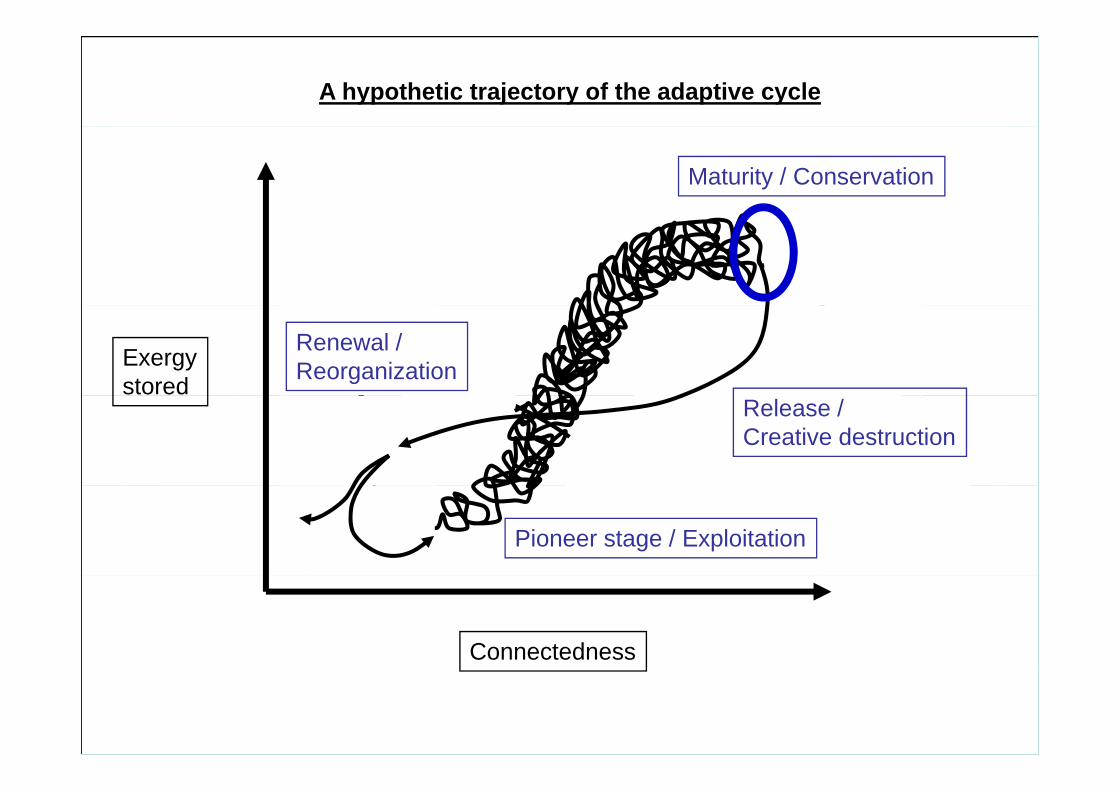
A hypothetic trajectory of the adaptive cycle
Maturity / Conservation
Exergystored
Renewal /Reorganization
Release / Creative destruction
Pioneer stage / Exploitation
Connectedness
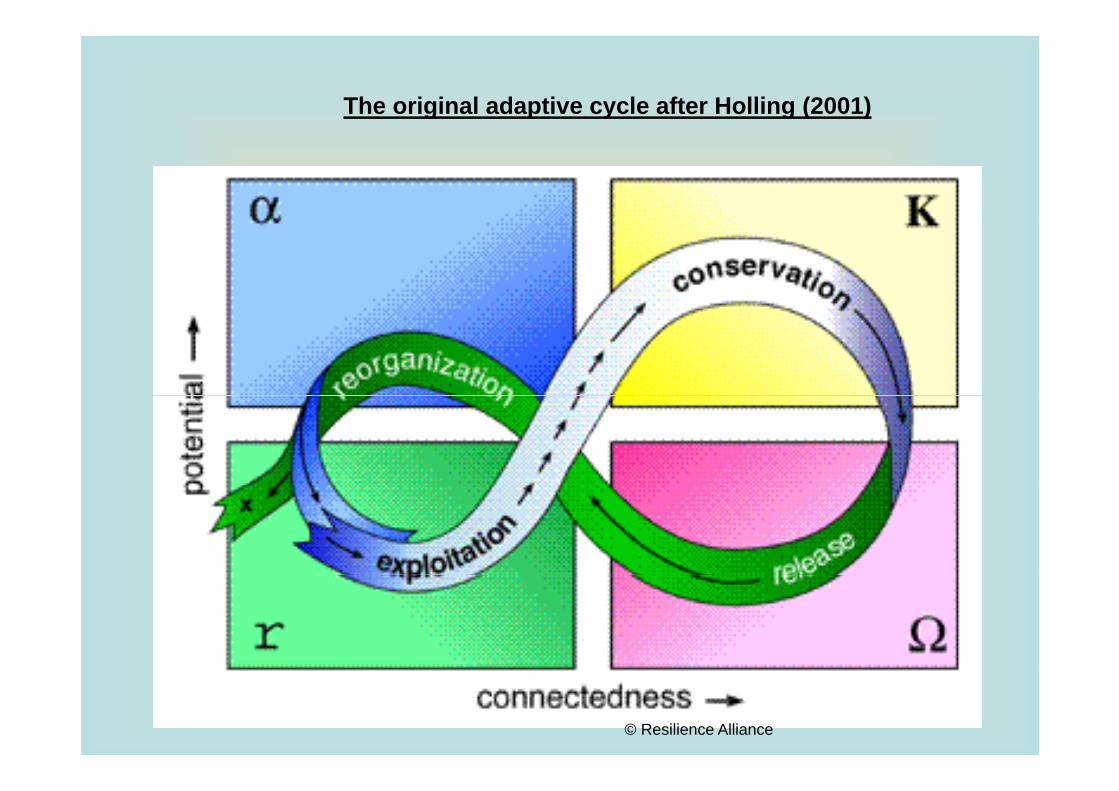
The original adaptive cycle after Holling (2001)
© Resilience Alliance
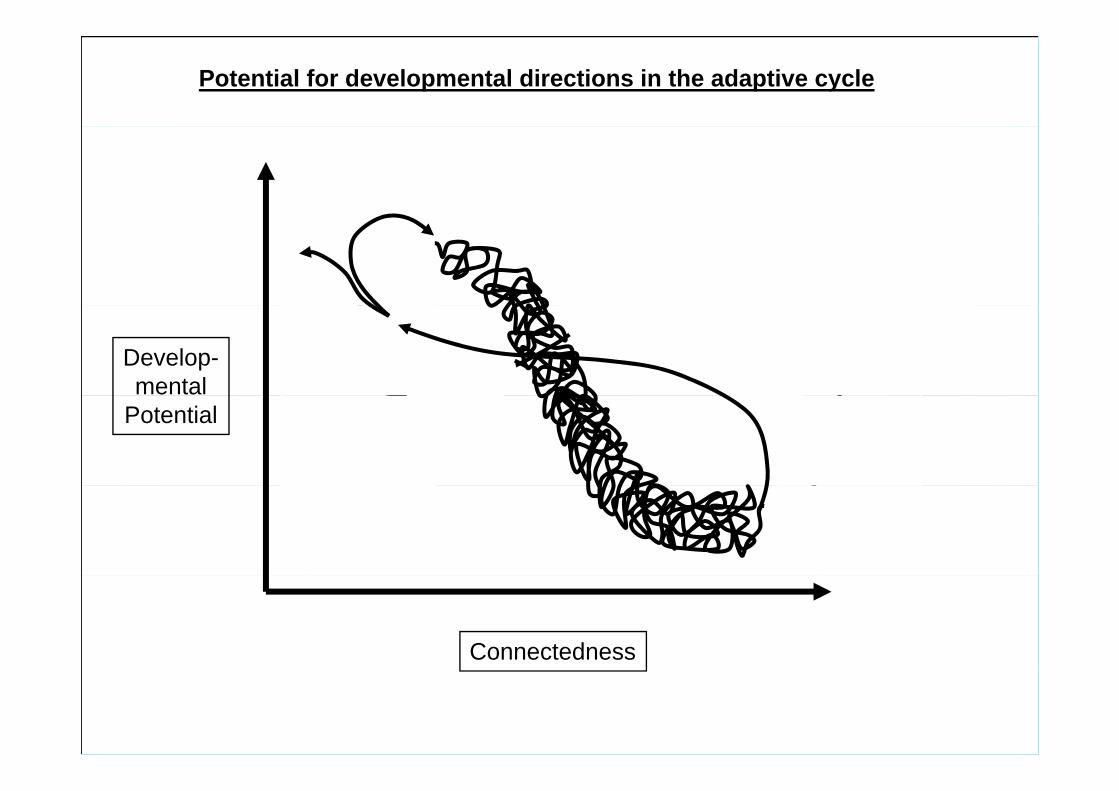
Potential for developmental directions in the adaptive cycle
Develop-mental
Potential
Connectedness
We have an ecosystem theory -
consequences:
• It should be applied to ppexplain ecological observations and applied i l i l i i !!in ecological engineering!!
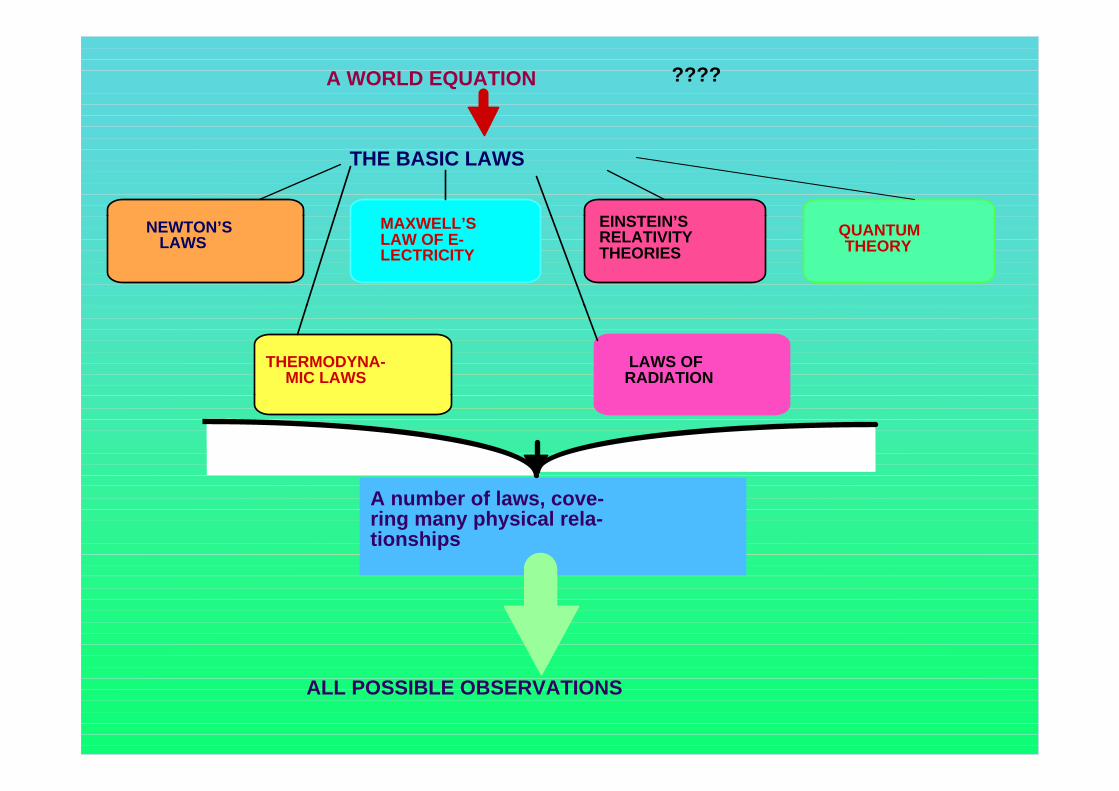
A WORLD EQUATION ????
EINSTEIN’S
THE BASIC LAWS
NEWTON’S LAWS
MAXWELL’S LAW OF E- LECTRICITY
EINSTEIN’S RELATIVITY THEORIES
QUANTUM THEORY
THERMODYNA- MIC LAWS
LAWS OF RADIATION
A number of laws, cove- ring many physical rela- tionships
ALL POSSIBLE OBSERVATIONS
THANK YOU FOR YOURTHANK YOU FOR YOUR ATTENTIONATTENTION


![[Bar-Yam, 1997] Dynamics of Complex Systems](https://img.pdfslide.us/doc/110x75/5528a6524979592e048b4ae6/bar-yam-1997-dynamics-of-complex-systems.jpg)