Embed Size (px)
Citation preview
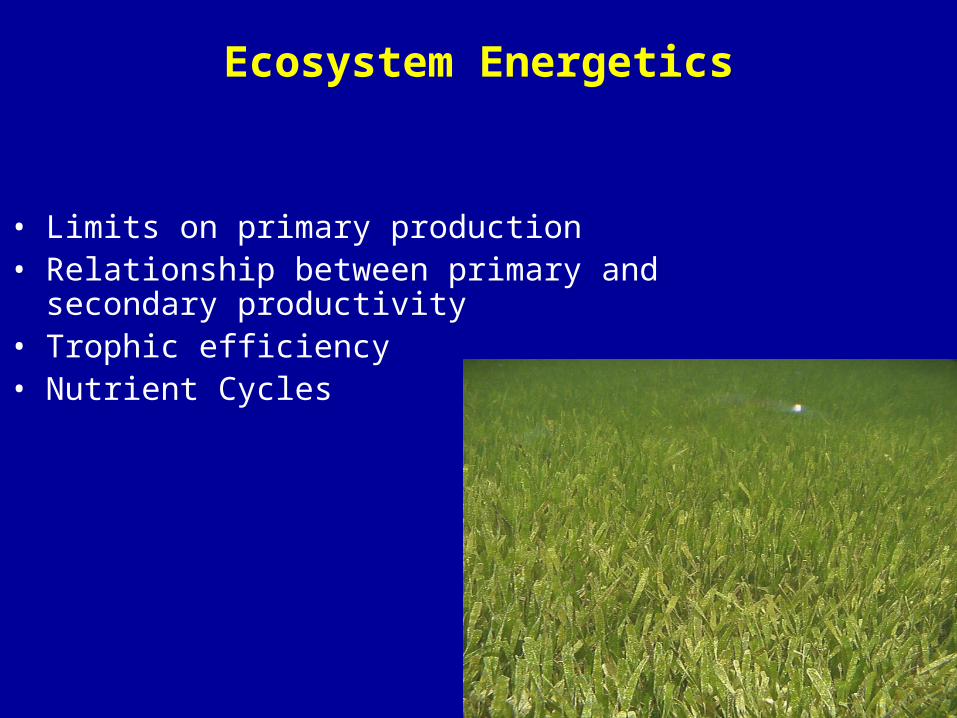
Ecosystem Energetics
• Limits on primary production• Relationship between primary and secondary
productivity• Trophic efficiency• Nutrient Cycles
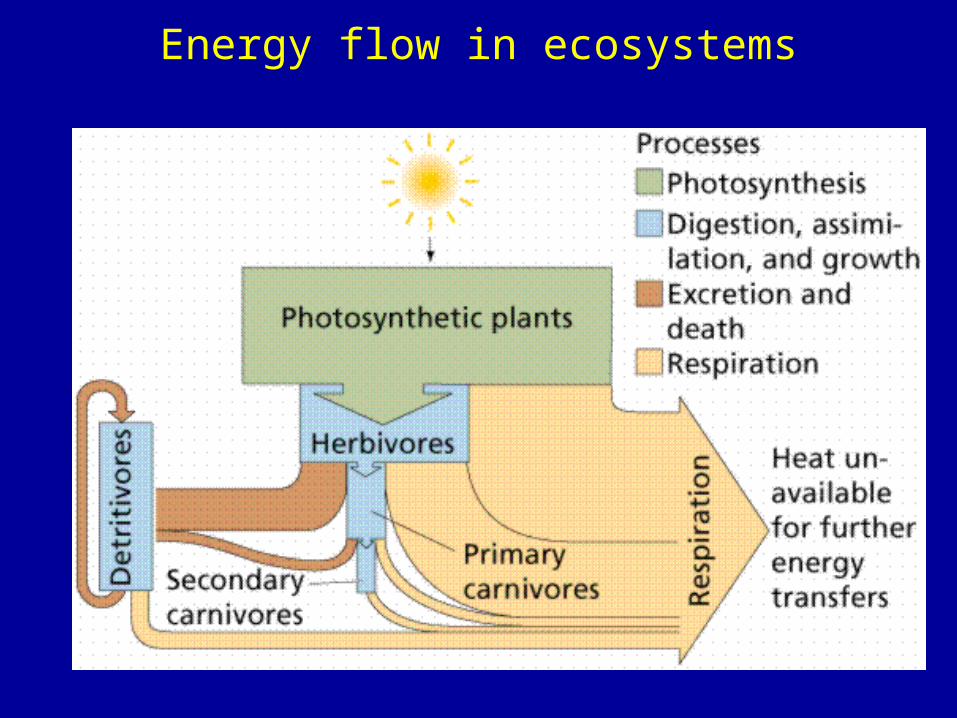
Energy flow in ecosystems

Ecosystem energetics - terminology
• Standing crop (=biomass) – amount of accumulated organic matter found in an area at a given time [g/m2]
• Productivity – rate at which organic matter is created by photosynthesis [g/m2/yr]
• Primary productivity – autotrophs
• Secondary - heterotrophs
• Gross versus net primary productivity
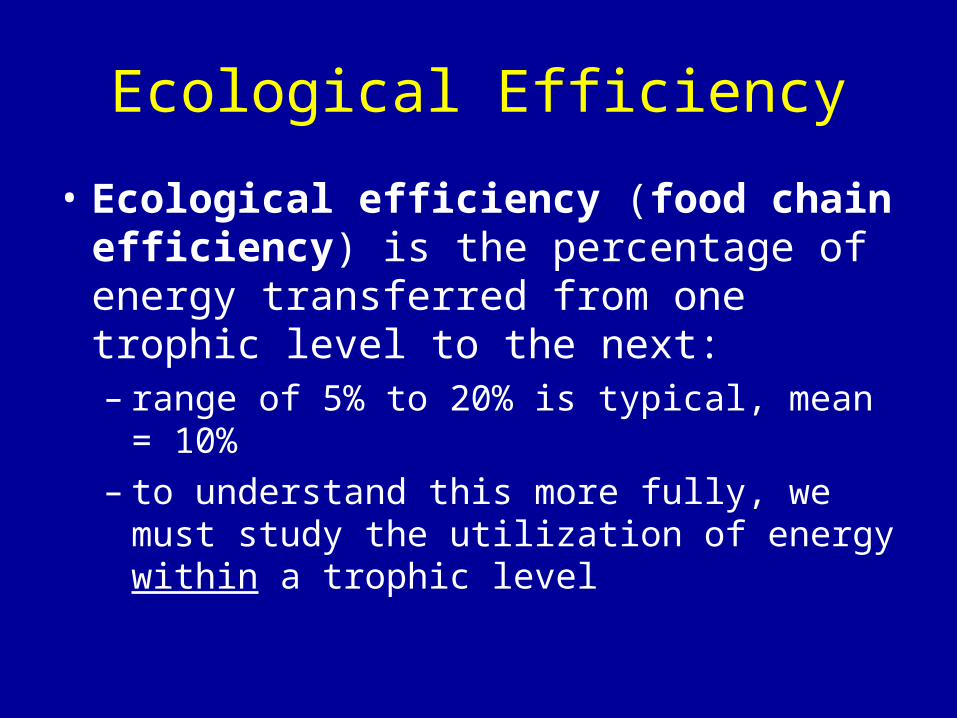
Ecological Efficiency
• Ecological efficiency (food chain efficiency) is the percentage of energy transferred from one trophic level to the next:– range of 5% to 20% is typical, mean = 10%– to understand this more fully, we must study
the utilization of energy within a trophic level
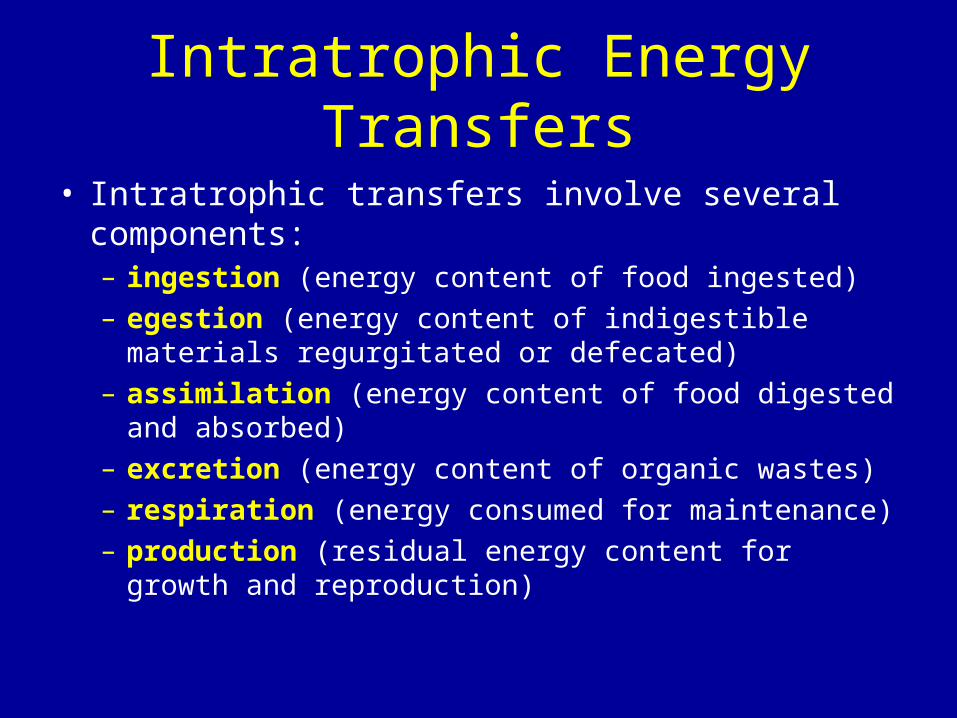
Intratrophic Energy Transfers
• Intratrophic transfers involve several components:– ingestion (energy content of food ingested)– egestion (energy content of indigestible materials
regurgitated or defecated)– assimilation (energy content of food digested and
absorbed)– excretion (energy content of organic wastes)– respiration (energy consumed for maintenance)– production (residual energy content for growth and
reproduction)

Fundamental Energy Relationships
• Components of an animal’s energy budget are related by:1) ingested - egested energy = assimilated energy
2) assimilated energy - respiration - excretion = production

Assimilation Efficiency
• Assimilation efficiency = assimilation/ingestion
• primarily a function of food quality:– seeds: 80%– young vegetation: 60-70%– plant foods of grazers, browsers: 30-40%– decaying wood: 15%– animal foods: 60-90%
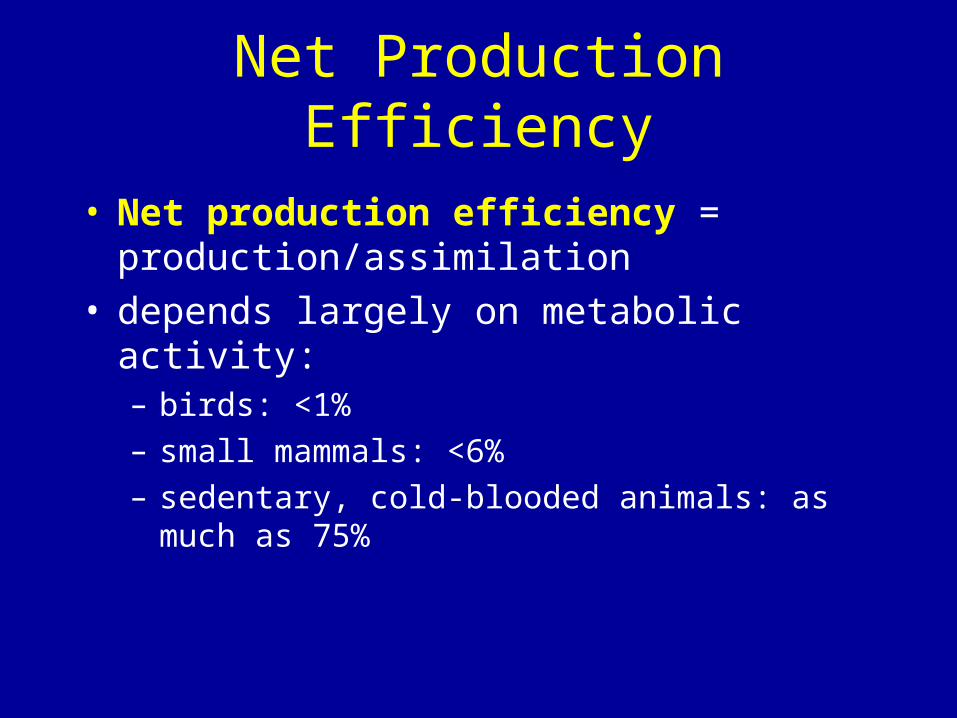
Net Production Efficiency
• Net production efficiency = production/assimilation
• depends largely on metabolic activity:– birds: <1%– small mammals: <6%– sedentary, cold-blooded animals: as much as 75%

Production Efficiency in Plants
• The concept of production efficiency is somewhat different for plants because plants do not digest and assimilate food:– net production efficiency = net production/gross
production, varies between 30% and 85%– rapidly growing plants in temperate zone have net
production efficiencies of 75-85%; their counterparts in the tropics are 40-60% efficient
NPP = GPP - RNet Primary Gross Primary Respiration Productivity Productivity

Consumption efficiency = 200/1000
Assimilation efficiency 70/200
Production efficiency = 14/70
Amt produced by trophic level n-1
Amt ingested by trophic level n
Amt egested as feces (waste) by trophic level n
Amt assimilated (i.e. absorbed into body) by trophic level n
Amt respired by trophic level n
Secondary production by trophic level n
Efficiency of energy transfer

Detritus Food Chains
• Ecosystems support two parallel food chains:– herbivore-based (relatively large animals feed on
leaves, fruits, seeds)– detritus-based (microorganisms and small animals
consume dead remains of plants and indigestible excreta of herbivores)
– herbivores consume:• 1.5-2.5% of net primary production in temperate forests• 12% in old-field habitats• 60-99% in plankton communities

Exploitation Efficiency
• When production and consumption are not balanced, energy may accumulate in the ecosystem (as organic sediments).
• Exploitation efficiency = ingestion by one trophic level/production of the trophic level below it.
• To the extent that exploitation efficiency is <100%, ecological efficiency = exploitation efficiency x gross production efficiency.
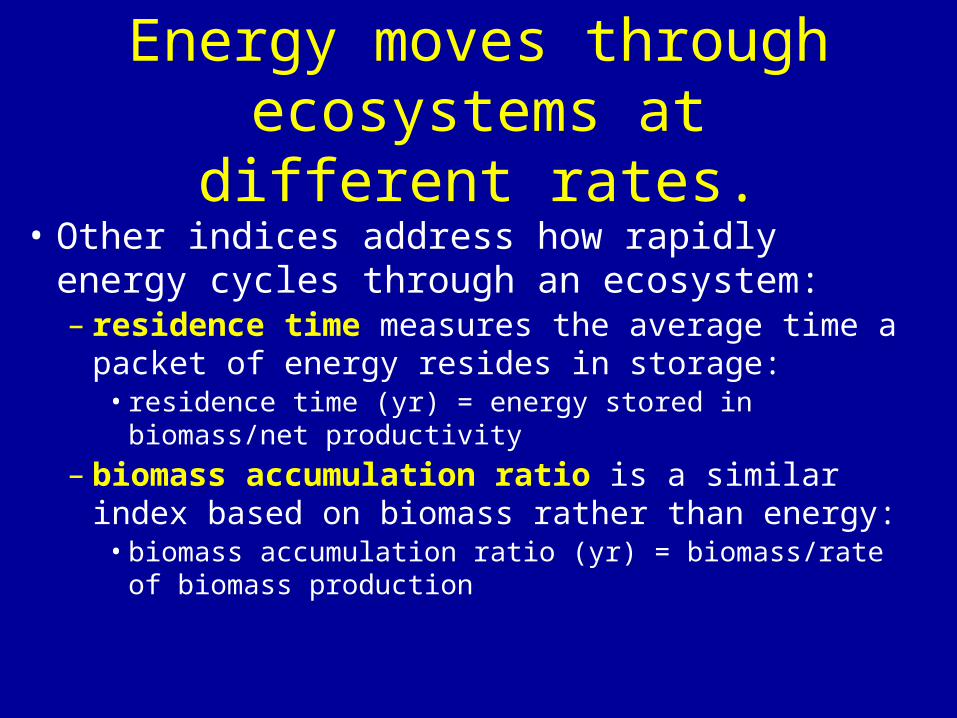
Energy moves through ecosystems at different rates.
• Other indices address how rapidly energy cycles through an ecosystem:– residence time measures the average time a
packet of energy resides in storage:• residence time (yr) = energy stored in biomass/net
productivity
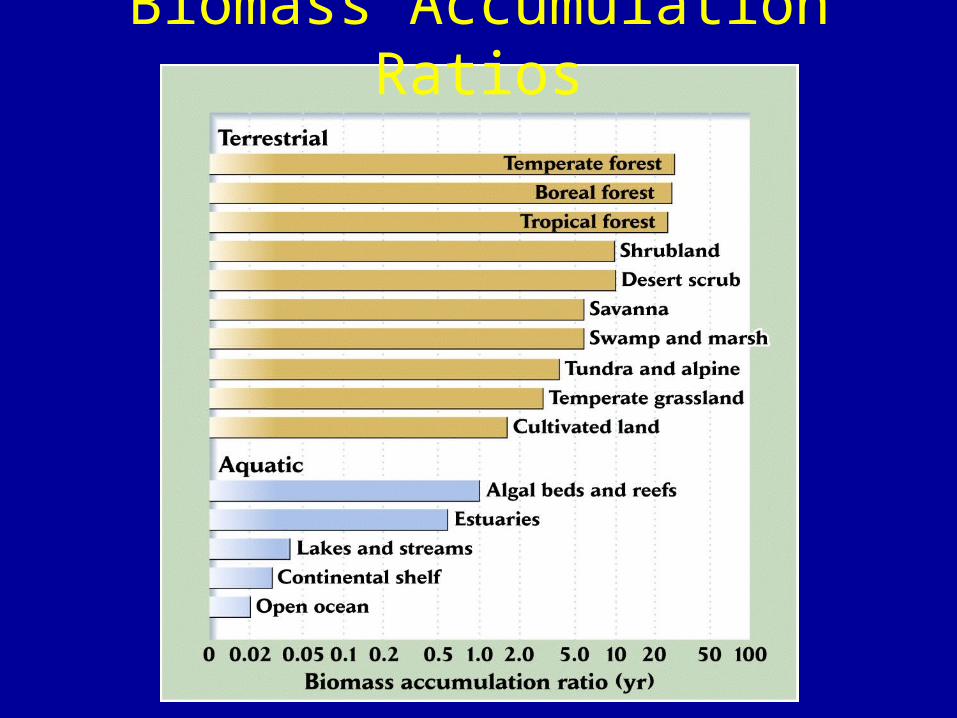
– biomass accumulation ratio is a similar index based on biomass rather than energy:
• biomass accumulation ratio (yr) = biomass/rate of biomass production
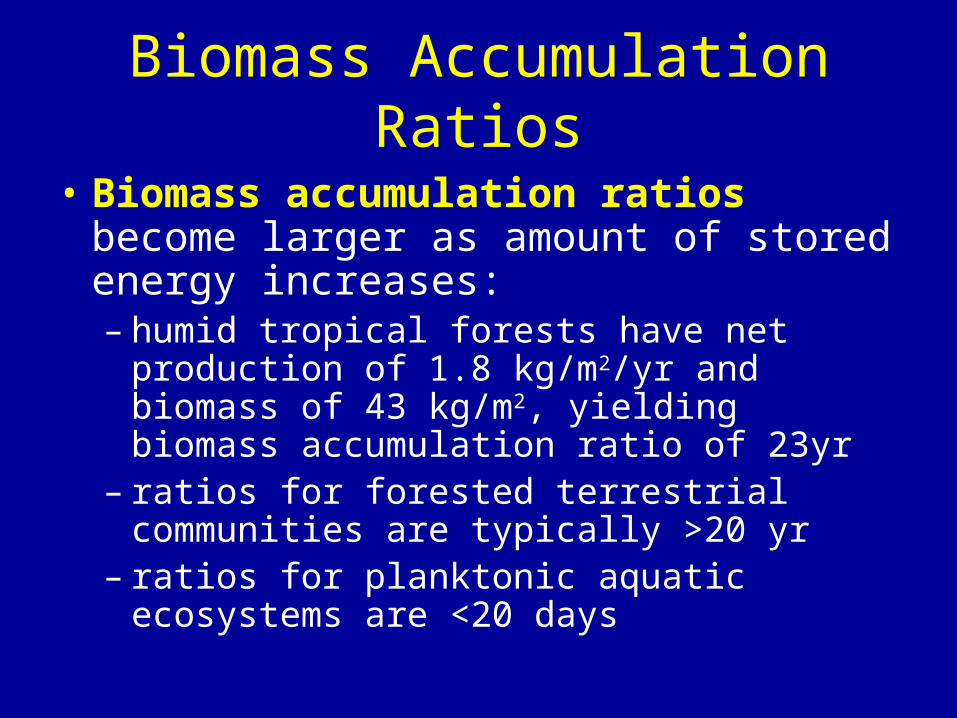
Biomass Accumulation Ratios
• Biomass accumulation ratios become larger as amount of stored energy increases:– humid tropical forests have net production of
1.8 kg/m2/yr and biomass of 43 kg/m2, yielding biomass accumulation ratio of 23yr
– ratios for forested terrestrial communities are typically >20 yr
– ratios for planktonic aquatic ecosystems are <20 days
Biomass Accumulation Ratios

Ecosystem Energetics
• Comparative studies of ecosystem energetics now exist for various systems.
• Many systems are supported mainly by autochthonous materials (produced within system).
• Some ecosystems are subsidized by input of allochthonous materials (produced outside system).

Autochthonous versus Allochthonous Production
• In streams assimilation of energy by herbivores often exceeds net primary production - difference represents energy subsidy.– autochthonous production dominates in
large rivers, lakes, marine ecosystems– allochthonous production dominates in small
streams, springs, and caves (100%)
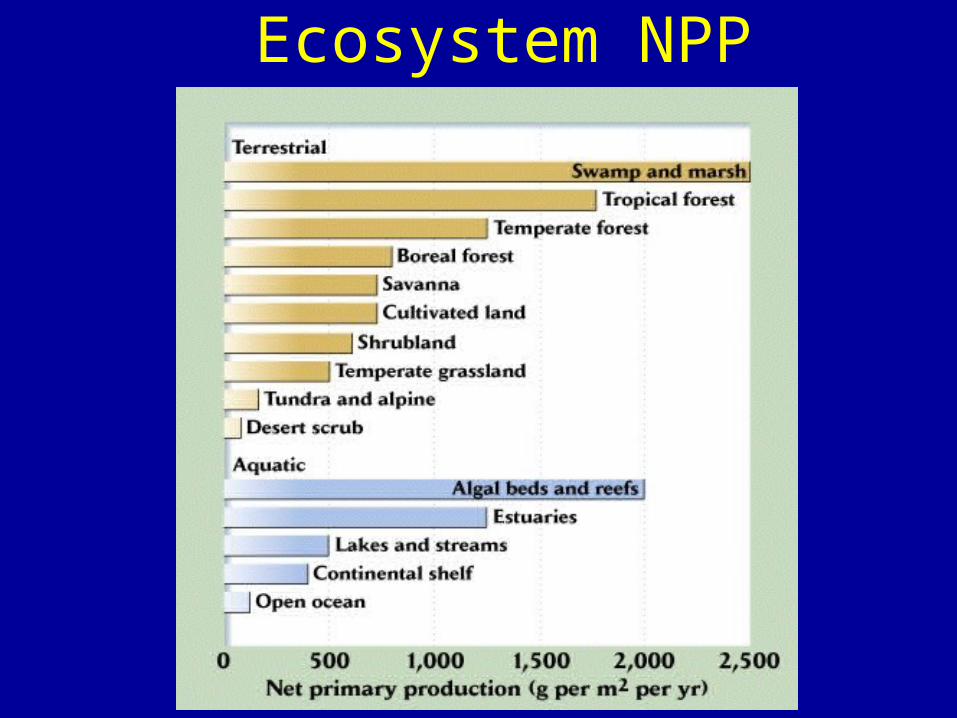
Ecosystem NPP

Energy allocation

Primary productivity limits secondary productivity
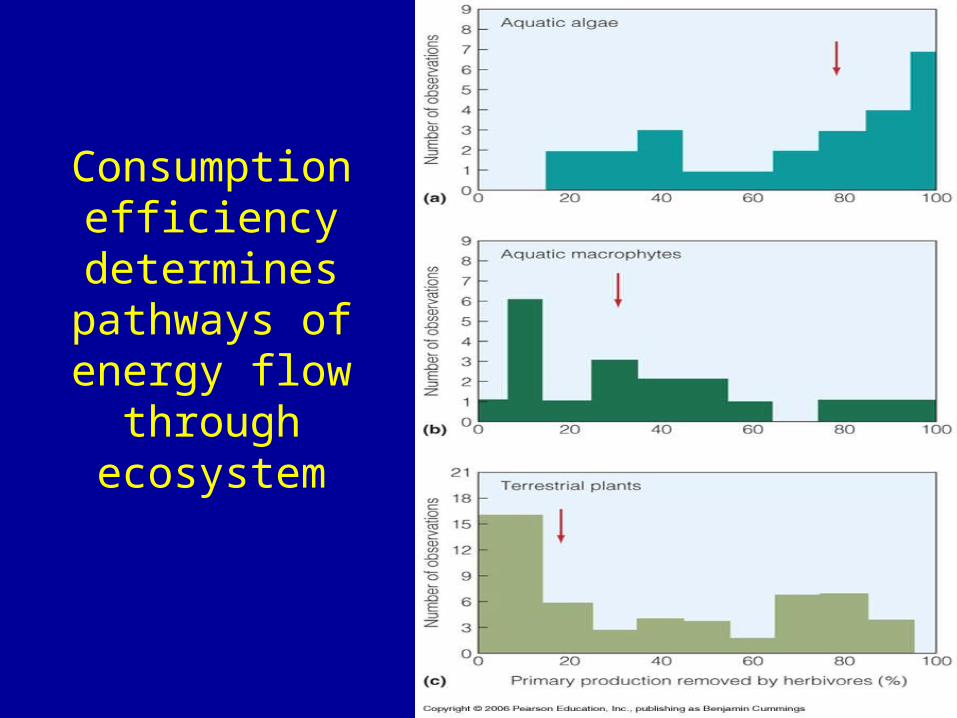
Consumption efficiency determines pathways of energy
flow through ecosystem
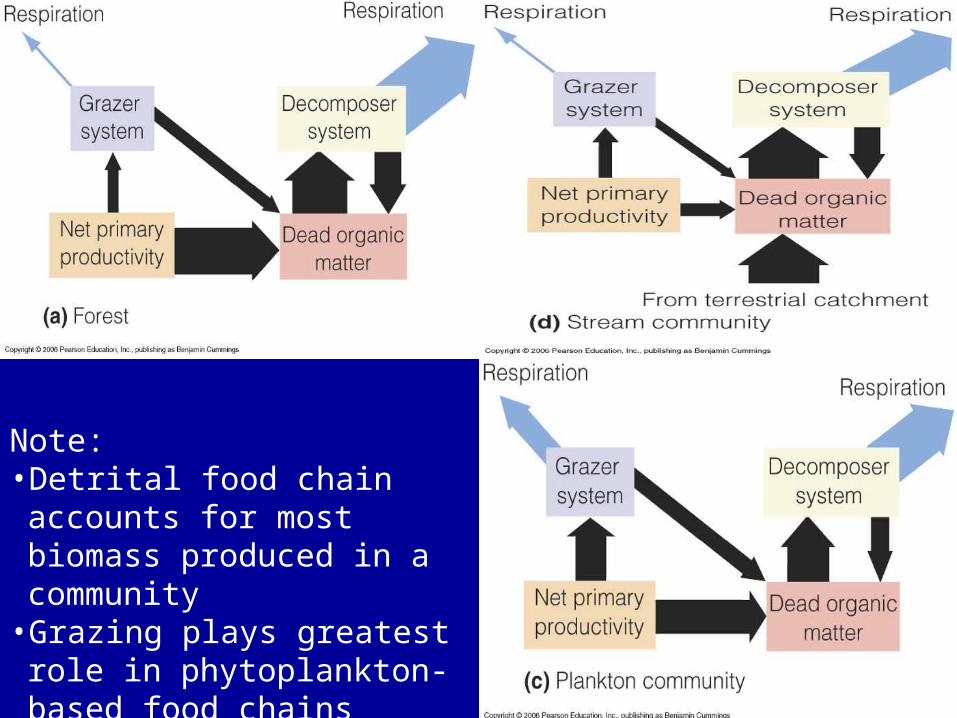
Note: • Detrital food chain accounts for
most biomass produced in a community
• Grazing plays greatest role in phytoplankton-based food chains
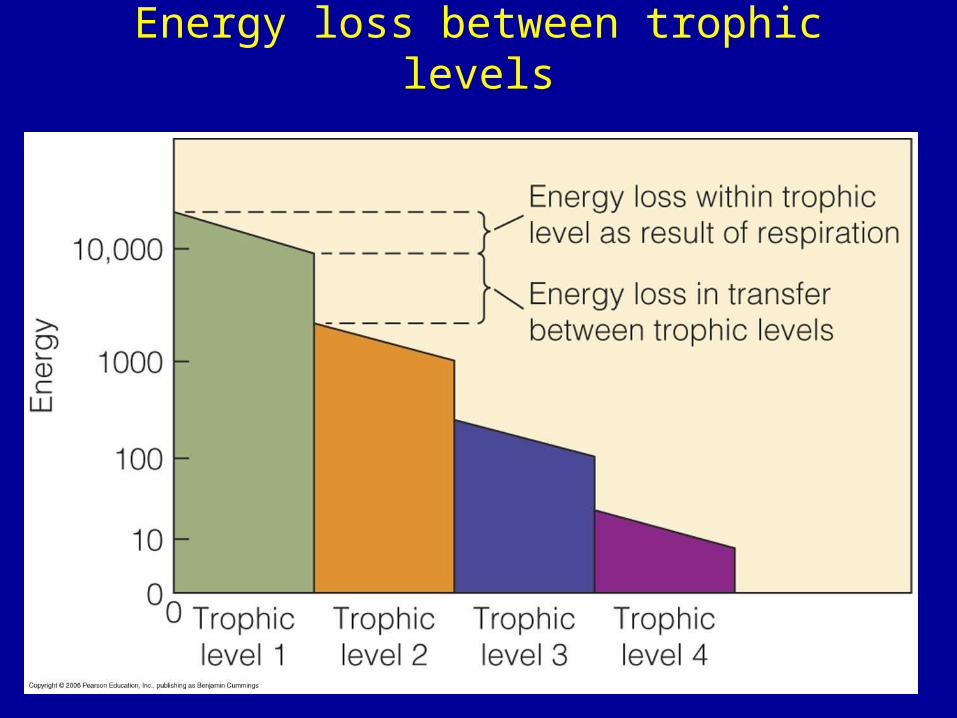
Energy loss between trophic levels

General Rules for Energy Flow through Ecosystems
1) Assimilation efficiency increases at higher trophic levels
2) Ecological efficiencies average about 10%
Thus, only about 1% of NPP ends up as production in the third trophic level

Decomposition and Mineralization
• Most material is derived from plants• Involves:
• Release of chemical energy• Mineralization (= organic --> inorganic)
• Note immobilization = reverse of mineralization• Net mineralization rate = mineralization -
immobilization

Terrestrial communities:Nutrient sources
• Weathering of rock (K, P, Ca and many others)• Fixation of CO2 (photosynthesis) and N2 • Dryfall (particles in the atmosphere)• Wetfall (snow & rain); contains
– Oxides of S, N– Aerosols
• particles high in Na, Mg, Cl, S• produced by evaporation of droplets
– Dust particles from fires, volcanoes• Ca, K, S

Terrestrial communities:Nutrient losses
• Release to atmosphere– CO2 from respiration– Volatile hydrocarbons from leaves– Aerosols– NH3 (decomposition), N2 (denitrification)
• Loss in streamflow– Dissolved nutrients– Particles

Oceans
• No outflow• Detritus sinks --> mineralization --> nutrients
end up:1. Being carried back to surface in upwelling
currents, or2. Trapped in sediment (e.g., phosphorus: 1% lost
to sediment with each cycling)

CARBON CYCLE CARBON CYCLE
4 PROCESSES MOVE CARBON THROUGH ITS CYCLE:
1) Biological
2) Geochemical
3) Mixed biochemical
4) Human Activity
CO2
CO2


NITROGEN CYCLE NITROGEN CYCLE
Nitrogen-containing nutrients include:
1) Ammonia (NH3)
2) Nitrate (NO3-)
3) Nitrite (NO2-)
4) ORGANISMS NEED NITROGEN TO MAKE AMINO ACIDS FOR BUILDING PROTEINS!!!
N2 in Atmosphere
NH3
N03- &
N02-

The nitrogen cycle
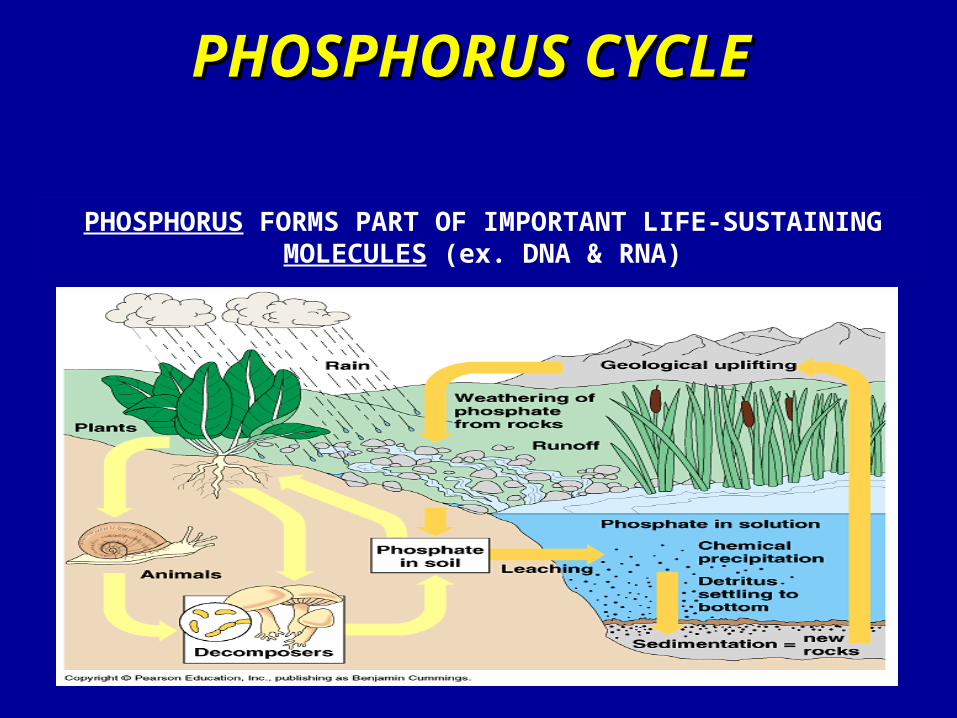
PHOSPHORUS CYCLEPHOSPHORUS CYCLE
PHOSPHORUS FORMS PART OF IMPORTANT LIFE-SUSTAINING MOLECULES (ex. DNA & RNA)
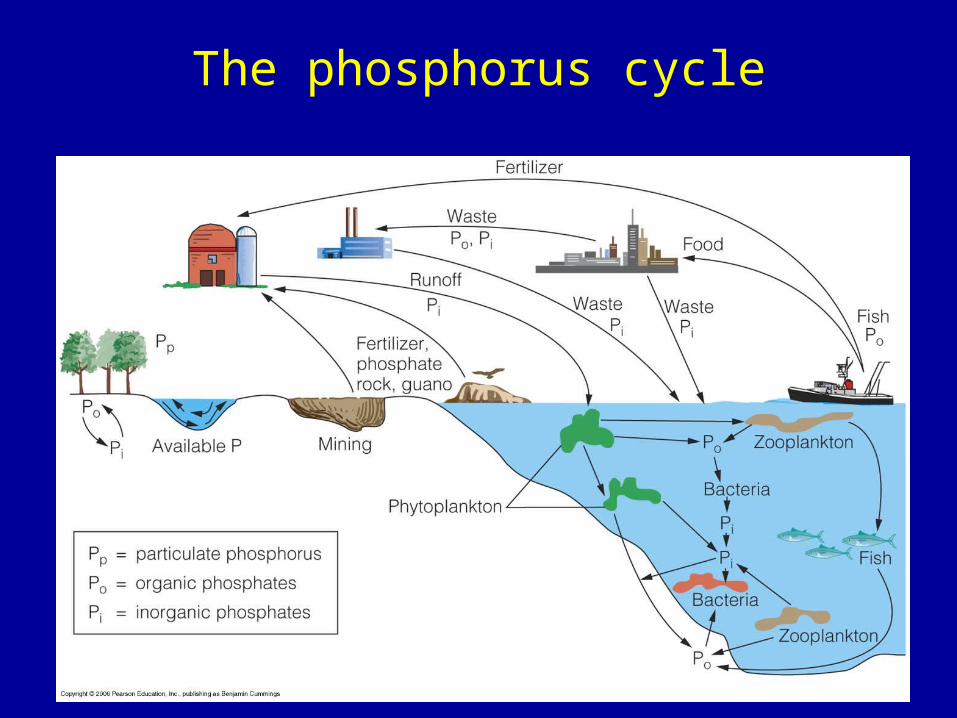
The phosphorus cycle

We’re in the Driver’s Seat - Human Activities Dominate Many Biogeochemical Cycles