Embed Size (px)
Citation preview

1
Remote Sensing Based Study on Channel Changes and Wetland Ecosystem Dynamics of
Brahmaputra River in India
Nayan Sharma1 Oinam Bakimchandra2 Bikash Ranjan Parida3
Department of Water Resources Development and Management, Indian Institute of
Technology, Roorkee- 247667, Uttranchal, India
Email: [email protected]
ABSTRACT: The study in this paper focuses on two major issues. Firstly, the study of morphology of fluvial landform through a combination of remote sensing, GIS analysis and field observation to better understand the morphological characteristics and dynamics of the Brahmaputra river with particular emphasis on bank line and width changes. Secondly, to map the dynamics of wetland ecosystem and its turbidity pattern of Deeper Beel of Brahmaputra basin using multi-temporal satellite imagery. In addition, this paper highlights the application of Rule-Based Decision Tree classifier for wetland identification and its extraction for further analysis. An attempt has also been made to link the wetland changes with the turbidity pattern observed from satellite imagery. From the channel change analysis, it is found that the average northing for right bank line of the Brahmaputra river moved about 0.47 km to the north between 1990 and 2002, while that for the left bank moved about 0.48 km to the south. The river has radically avulsed just upstream side of the Dibrugarh town and excised areas of floodplain to create new bars. The river mean width has increased from 7.99 km to 8.94 km in the total length of the river; whereas the minimum width at Pandu is slightly constricted due to the presence of the bridge. The study further revealed that the total area within the two bank-line increased by 12.10% between 1990 and 2002 due to erosion process causing channel widening. The wetland areas have rapidly shrunk from 33.5% in 1990, 21.1% in 1997 and 19.4% in 2002. The study has brought out that there is a rapid decline of wetland areas from 1990 to 1997. In addition, the study has concluded that the aquatic vegetation growth is very fast during 1990 to 1997 i.e. 0 to 6.33%, whereas its growth is steady from 1997 to 2002. Overall the wetland ecosystem has declined to 14.1 %( 405 ha) from 1990 to 2002. High Turbidity in almost entire study area is recorded in 1997 as compared to 1990 and 2002. In 2002, the spatial extent of Deeper Beel wetland area has registered decrease while at the same time, pattern of low and medium turbidity has increased. The extent of wetland area mapped in 1997 was relatively more when compared to that of 2002, with more high turbid water pattern distribution in the prominent wetland Deepor Beel of the Brahmaputra basin. The wetland area is significantly shrinking from 1990 to 2002, which clearly indicates an imperative need for restoration of wetland health and its dynamic ecosystem. The study highlights the need for satellite remote sensing for monitoring and dynamic assessment of fluvial ecosystem changes which facilitate planning for ecosystem restoration. KEYWORDS: Fluvial landform, Wetland ecosystem, Aquatic vegetation, Turbidity, Multi-temporal, Deepor Beel, Brahmaputra 1.Professor, IIT 2.Research Scholar, IIT 3.Former Project Associate

2
1. INTRODUCTION 1.1 Brahmaputra River and it’s Morphology: The Brahmaputra is a major transboundary river covering a drainage area of 580,000 sq. km., 50.5 percent of which lie in China, 33.6 percent in India, 8.1 percent in Bangladesh and 7.8 percent in Bhutan. Its basin in India is shared by provinces of Arunachal Pradesh (41.88%), Assam (36.33%), Nagaland (5.57%), Meghalaya (6.10%), Sikkim (3.75%) and West Bengal (6.47%). Originating in a great glacier mass at an altitude of 5,300 m just south of the lake Konggyu Tso in the Kailas range about 63 km southeast of Mansarovar lake in southern Tibet, the Brahmaputra flows through China (Tibet), India and Bangladesh for a total distance of 2880 km before emptying itself into the Bay of Bengal through a joint channel with the Ganga. Its total length comprises of 1625 km in Tibet, 918 km in India and 354 km in Bangladesh. Records show that devastating floods occurred in 1954, 1962, 1966, 1972, 1973, 1977, 1978, 1983, 1984, 1987, 1988, 1991, 1993, 1995, 1996, 1998 and 2004. Upwards of 9600 km2 land, that is 12.21% of the geographic area of Assam, is annually affected by floods. In 1998, the flood which came in four frightening waves, deluged 38,200 km2 or 48.65% geographic area of the state, putting in peril the lives and properties of 12.5 million people (Goswami, 1998). The study on river morphology with the use of remote sensing data is a relatively new development, and has been in practice for not more than the last 20 to 25 years in India. Murthy, 1990 studied the flood plain of Brahmaputra river using satellite imageries. Hussain, 1992 carried out morphological studies of river Brahmaputra with the help of satellite imageries. Oak, 1998 worked on the prediction of bank erosion of the Brahmaputra river on Gumi-Alikash reach (down stream of Pandu). Some erosion studies using satellite imageries in the vicinity of Majuli island and Kaziranga National Park was been studied by Space Application Centre, Ahmedabad. Singh, 2003 studied the spatio-temporal morphological analysis using satellite data for a reach of river Brahmaputra. 1.2 Wetland ecosystem of Brahmaputra Valley- Deepor Beel Assam has 3,512 wetlands each having areas over 2.25 ha and 1,120 wetlands each having areas less than 2.25 ha. Most of the wetlands in the Brahmaputra valley are oxbow lakes and hence bigger in sizes. During the period of 30s and 40s many wetlands known as Beels, marshes and swamps were seen in the rural areas. These wetlands were found to be very productive (Patar, 2005). In the fringe areas of the wetlands, different species of plants of economic importance grew. The Deepor Beel of Assam (Kamrup District) is one of the 21 national wetlands, which have been declared so far. The Deepor Beel wetland is a permanent, freshwater lake, in a former channel of the Brahmaputra river, to the south of the main river south-west of Guwahati city. It is a large natural wetland having great biological and environmental importance besides being the only major storm water storage basin for the Guwahati city. This wetland is endowed with rich floral and faunal diversity. In addition to huge congregation of residential water birds, the Deepor Beel ecosystem harbours large number of migratory waterfowl each year. The Deepor Beel has been designated as a Ramsar Site in November 2002.

3
There are eight different categories of wetlands in India differentiated by region. The flood plain of the Brahmaputra (Beels) and the marshes and swamps in the hills of North East and the Himalayan foot hills are such two categories (Prasad, 2002). For a country like India, with its vast biological and cultural diversity, a comprehensive use of remote sensing, GIS and other related technologies will be of great use in conservation. Classifying and mapping wetlands based on geomorphology, water quality and other biological attributes can lead to qualitative assessment. Results obtained could be used in planning, inventorying and monitoring wetlands in the country. Due to the large extent of wetlands, the use of ground survey methods for wetland mapping and regular updating of information is not a pragmatical approach. Satellite remote sensing has many advantages including synoptic view, multi-spectral data collection, multi-temporal coverage and cost-effectiveness (Rundquist et al. 2001). Therefore satellite remote sensing is arguably the only practical approach that can map wetlands in a convinent manner over a larger area. This study has highlighted the importance to monitor the physical extent of wetlands in Assam using multi-temporal satellite imagery. Hence the dynamic nature changes of wetlands necessitate the widespread and consistent use of satellite-based remote sensors and low-cost, affordable GIS tools for effective management and monitoring. Wetlands are areas, which are submerged under water or water-saturated land permanently or for part of the year. The water table is usually at or near the surface or the land is covered by shallow water. These include marshes, swamps, flood plains, bogs, peat lands, shallow ponds and littoral zones of large water bodies. Wetlands are formed when the excess of water accumulate on the surface of soil and make water-logging on the land during major part or whole year. This water accumulation on this surface of soil is due to impeded drainage conditions. The Ramsar Convention defines wetlands as areas of marsh, fen, peat land or water whether natural or artificial, permanent or temporary, with water that is static or flowing, fresh, brackish or saltish, including areas of marine water the depth of which at low tides does not exceed six metres. Ramsar further incorporates into its consideration for listing riparian and coastal zones adjacent to the wetlands, and islands or bodies of marine water deeper than six metres at low tide lying within the wetlands. Ramsar categorises wetlands into (i) estuaries, mangroves and tidal flats; (ii) flood plains and deltas; (iii) freshwater marshes; (iv) lakes; (v) peatlands and (vi) forested wetlands. Wetlands harbour a wide variety of flora and fauna, all of great economic, aesthetic and scientific importance. Wetlands are suitable habitats for fish, tortoise and some endangered and rare species of birds. As an ecosystem, wetlands are useful for nutrient recovery and cycling, releasing excess nitrogen, removing toxins, chemical and heavy water through absorption by plants. Wetlands help in mitigating floods, recharging aquifers and reducing surface run off and consequent erosion. During times of floods, they act as sponge which hold water and release it slowly, allowing ground water to recharge. Also, they are excellent cleansers of pollutants discharge into the water. Mangrove wetlands act as buffer against devastating storms. Some of the wetlands provide valuable areas for education research and recreation and tourism. Wetlands are a valuable natural resource for ground water recharge, flood control and water quality improvement (Rundquist et al. 2001). They provide critical habitat to a large number of wildlife species, including many endangered species, and support a rich biodiversity

4
(Ozesmi and Bauer, 2002). Wetlands also play an important role in global carbon and methane cycles, and thus could strongly feed back to, as well as being affected by, climate change (IPCC 2001). 1.3 Objectives of the Study In this paper morphological study of fluvial landform is made through a combination of remote sensing, GIS analysis and field observation to better understand the characteristics and dynamics of the Brahmaputra river with particular emphasis on bank line and width changes. Attempt has been made towards wetland ecosystem dynamics assessment in the Deepor Beel area using rule based decision tree classification technique. In addition to this, turbidity pattern identification from satellite imagery has been attempted and the results are presented here with. 2. STUDY AREA AND DATA USED In the study, digital satellite images of Indian Remote Sensing (IRS) Linear Imaging Self Scanner (LISS)-III sensor, comprising of 32 scenes for the years 1990, 1997, 2000 and 2002 are used for the study area. This area was covered by seven image frames made into a single mosaic for each period i.e.1990,1997 and 2002. In order to bring all the images under one geometric co-ordinate system, these are geo-referenced with respect to Survey of India (1:50,000 scale) toposheets using second order polynomial. A root means square error less than 0.5 pixel has been obtained and nearest neighbourhood re-sampling is adopted. 2.1. Dataset used and study area for extraction of channel form: Satellite images of the Brahmaputra river corridor were identified and selected for the study. The images selected were taken during the dry season (February) when cloud-free imagery was available and when water level, vegetation cover and other ground conditions were relatively consistent. The focused extent of the area for this analysis covered the entire Brahmaputra River from Kobo to the border with Bangladesh, a distance of 622.73 km as shown in Figure1 (a). Considering the river flows, the confluence of river tributaries, and for convenience in computing the segments, the study area of 622.73 km from Dhubri (cross section 2 at chainage 17.34 km from Bangladesh border) to Kobo (cross section 65 at chainage 640.07 km) has been divided into seven reaches as shown in Figure 1(a) and the distances between the reaches are outlined in Table 1. The bank line of the Brahmaputra river is demarcated from each set of imageries and the channel patterns are digitized using Arc Info software.

5
Figure 1(a): Brahamputra River- from Dhubri (cross section 2 at chainage 17.34 km from Bangladesh border) to Kobo (cross section 65 at chainage 640.07 km) Table 1: Description of different reaches
cross -section No Reach
No From To Distance in
km. 1 2 10 65.28 2 11 20 89.76 3 21 30 79.57 4 31 40 120.88 5 41 50 107.6 6 51 60 98.44 7 61 65 51.00
2.2 Study area and dataset used for wetland dynamic assessment and turbidity pattern identification: Deepor Beel is one of the largest and most important wetlands in the Brahmaputra valley of lower Assam and is a representative wetland type found within the biogeographic domain of Assam. It is located south of the Brahmaputra river in Kamrup district, 10 km south west of Guwahati, Assam. The geographical coordinates of Deepor Beel is around 910 35’- 910 43’ E longitude, 260 05’ - 26011’N latitude Figure 1(b). The wetland category of Deepor Beel is Inland wetlands and wetland type includes permanent freshwater lake (over 8 ha), which is a large oxbow lake. Seasonal/intermittent freshwater marshes/pools

6
on inorganic soil; includes sloughs, potholes, seasonally flooded meadows, sedge marshes. The lake supports threatened species of birds like spotbilled pelican, lesser adjutant stork, greater adjutant stork, blacknecked stork, and large whistling teal. The lake is one of the staging grounds on the migratory flyways for several species. Some of the largest congregations of aquatic birds in Assam can be seen here, particularly in winter. It supports 50 fish species belonging to 19 families. The diversity and concentration of indigenous freshwater fish species is very high. Natural breeding of some of these species takes place within the wetland itself. Phytoplankton is one of the major components of the lowest level of the producers in the Deepor Beel ecosystem. The past two decades have seen a lot of transformation in the ecological and social character of Deepor Beel and near by areas. It has been observed that natural and anthropogenic problems include:
1. Disturbance from transport artery i.e. construction of railway line along the southern boundary of the Deepor Beel;
2. Industrial development within the periphery of the Beel; 3. Large scale encroachment within the Deepor Beel area; 4. Allotting the government vacant land to private party by government settlement
department; 5. Brick making factory and soil cutting within the Beel ecosystem and erosion; 6. Hunting, trapping and killing of wild birds and mammals within and in the
adjoining areas of Deepor Beel; 7. Commercial scale forest exploitation 8. Unplanned fishing practice without controlling mesh size and using water pump,
etc. 2.3 Physical Features: (e.g. geology, geomorphology; origins - natural or artificial; hydrology; soil type; water quality; water depth water permanence; fluctuations in water level; tidal variations; catchment area; downstream area; climate) The Deepor Beel is set in a unique physiographic framework and is characterised by its active hydrologic regime. Geomorphologically, its origin and development are intimately linked with the geologic and tectonic history of the region, hydrology and channel dynamics of rivers and pattern and intensity of land use in the area. It is commonly believed that the Beel together with those adjoining it represents an abandoned channel of the Brahmaputra system. 2.4 Hydrological Values: (groundwater recharge, flood control, sediment trapping, shoreline stabilization, etc.). Deepor Beel acts as a natural stormwater reservoir during the monsoon season for the Guwahati city. At maximum flooding, it is about four metres deep: during the dry season, the depth drops to about one metre. The main sources of water are Basistha and Kalmani rivers and local monsoon run off between May and September. The Beel drains into the Brahamputra river five km. to the north, through the Khonajan channel.

7
Figure 1(b): Deepor Beel-wetland ecosystem dynamics (study area) IRS-1A, 1C, 1D satellite data have been used to delineate the wetland ecosystem from a long-term data i.e. from 1990 to 2002. From the IRS series, LISS I and LISS III data have been used, which is having different spatial and spectral resolution. For the year 1990, the sensor used is LISS I and for the year 1997 and 2002, LISS III data have been used for analyzing the wetland ecosystem dynamics in Deepor Beel. Table 2: The sensor characteristics for different satellite data used for wetland ecosystem assessment
Satellite Sensor used Year of Data acquisition
Spatial resolution (m) Spectral Bands
IRS-1A LISS I 1990 72.5
0.45 - 0.52 µm(B1) 0.52 - 0.59 µm (B2) 0.62 - 0.68 µm (B3) 0.77 - 0.86 µm (B4)
IRS-1C LISS III 1997 23.5
0.52 - 0.59 µm (B2) 0.62 - 0.68 µm (B3) 0.77 - 0.86 µm (B4) 1.55 - 1.70 µm (B5)
IRS-1D LISS III 2002 23.5
0.52 – 0.59 µm(B2) 0.62 - 0.68 µm (B3) 0.77 - 0.86 µm (B4) 1.55 - 1.70 µm (B5)

8
3. METHODOLOGY 3.1. Brahmaputra River bank-line shifting and its physical extent determination from muti- temporal satellite images: For convenience in computation and determination of bank migration, 260 N latitude has been chosen as the permanent reference line, from which all the offsets to baseline location on the digitized maps have been made. Offsets have been measured at every cross section. After digitization of the above data, the offsets measurement to left and right banks using 260 N latitude line as the base line have been carried out from cross-section 2 to 65. The X distance i.e. chainage distance of cross-section 2 to 65, have been also measured from the base line i.e. 900 E longitude line. While comparing the boundary migration for any two years (both left & right boundary) -ve sign indicates boundary migration towards south and +ve sign indicates boundary migration towards north. For left bank –ve migration shows deposition, while +ve migration shows erosion whereas for right boundary +ve migration shows deposition and –ve migration shows erosion. 3.2. Wetland Dynamics monitoring using Rule-Based classification Technique: The satellite data used to delineate the wetland ecosystem dynamics in Deepor Beel areas of Assam are IRS 1A, 1C and 1D. This has been taken from multi-temporal data set i.e. during 1990 as LISS I and 1997, 2002 as LISS III sensors. These satellite data have been used to identify the wetlands and aquatic vegetation of the Deepor Beel. GCP (Ground Control Points) collected from SOI (Survey of India) toposheets as well as from GPS (Global Positioning System) were used as bases to register on the images and were geometrically corrected. The satellite image was transformed with a standard defaulted 72.5, 23.5 m resolution i.e. default for IRS LISS I and LISS III images respectively and projected to polyconic coordinate system using nearest neighbourhood resampling in ERDAS Imagine software. From the entire scene, the whole study area was extracted using subset option in ERDAS Imagine software and FCC (False Colour Composite) displayed with the band combination of 3, 2, 1 Figure 1(b). To delineate the wetland areas the Normalized Difference Water Index (NDWI) indicator has been used for the year 1997 and 2002 and on the contrary the blue band of LISS I data is used for the year 1990. The NDWI which is obtained using the function (Green –NIR)/ (Green + NIR), is useful to demarcate the land–water boundary (McFeeters, 1996) and mathematically it can be represented as- NDWI= (Green –NIR)/ (Green + NIR) Where green is band2 (0.52-0.59µm) and NIR is band 4 (0.77-0.86µm) Application of this indicator for a multi-spectral satellite image, results in positive values for water features and zero or negative values for soil and vegetation (Chatterjee et.al. 2003). When the NDWI is applied using Band 2 (green) and Band 4 (NIR) data of the LISS-III image of the Deepor Beel region, the wetland boundaries were distinct as compared to the original image. All the images like NDWI and different bands of LISS I and LISS III are used in decision tree classifier to delineate the wetland ecosystem and aquatic vegetation in the study area

9
using ENVI software. Traditional methods for wetlands mapping with satellite data have generally focused on the use of unsupervised classification and supervised classification. Wetland classification is difficult because of spectral confusion with other land cover classes and among different types of wetlands, but can be improved by using multi- temporal and multi-scale satellite data as well as ancillary soil and topography data. A decision tree classifier is an efficient form for representing decision processes for classifying patterns in data (Parmuchi et al. 2002). It employs tree-structured rules that recursively divide that data into increasingly homogeneous subsets based on splitting criteria. At each split, the values of each explanatory variable are examined and the particular threshold value of a single variable that produces that largest reduction in a deviance measure is chosen to partition the data (Rogan et al. 2003). As a result, hierarchical, non-linear relationships within the data are revealed. The advantage of decision trees is that they are less sensitive to non-linearities in the input data than are methods that require assumptions of Gaussian distributions (Townsend, 2001). Figure 2: Schematic diagram for wetland delineation using Rule Based Decision tree classifier
The decision tree classification has been done based on the pixel criteria for each year using NDWI and LISS I and LISS III data. However during 1990 the NDWI indicator has not been used for wetland ecosystem extraction because of poor result as compared to blue band (Band 1) of LISS I data. The trees are shown in the Figure 2 with different characteristics of tree for each year.
1990
2002
1997

10
3.3 Turbidity areas/pattern identification and their spatial distribution within the identified wetland area:
Turbidity patterns were best reflected and can be observed by the band 1,i.e. Green Band of IRS 1C, LISS III image data. The higher the DN value in band 1, the higher is the turbidity. The turbidity classification is a subjective one as it is impractical to relate the quantitative values for turbidity (which are dynamic according to the season) with the reflectance. Thus, determination of the threshold for different turbidity levels needs to be carried out by examining the major (large-sized) water bodies in the area. (Prasad S.N., Ramachandra, et.al, 2002). Here in this study, multi-date LISS sensor satellite data namely 1990, 1997 and 2002 are used for identifying area of High, Medium and Low Turbidity within the Deepor Beel. This helps to link the spatial distribution of wetland with respect to the turbidity pattern within the identified/mapped region. The quantitative turbidity ratings viz., low, moderate and high were also assigned based on the hue manifested on the false colour composites and it has been extracted/delineated using Isodata algorithm (unsupervised classification) in ERDAS Imagine. Then, the spatial turbidity patterns on three different dates are mapped, which indicate the influence of turbidity on the spatial distribution of wetland areas from 1990 to 2002. This type of preliminary investigation is necessary to assess the health and the dynamic nature of wetland region. In addition, the potential utilization of multi-temporal, synoptic coverage satellite data is highlighted in this context. 4. RESULTS AND DISCUSSIONS 4.1. Channel shifting and migration pattern of Brahmaputra river course: The offsets of the digitized satellite data of 1990, 1997, 2000 and 2002 are shown in Table 3. The shift patterns of bank of various years with respect to year 1990 imageries are graphically represented in Figure 3 to 8. The positive values indicate that the stream bank has shifted northward from 1990 imagery and negative values show vice-versa.
Figure 3 Shift of Left Bank Between 1990-1997
-5
-3
-1
1
3
5
7
9
11
13
15
-50 50 150 250 350 450 550 650
X- Distance from Base Line (km)
Bank
Shi
ft on
Nor
th S
outh
Lin
e (k
m)

11
Figure 4 Shift of Right Bank Between 1990-1997-6
-4
-2
0
2
4
6
-50 50 150 250 350 450 550 650
X- Distance from Base Line (km)
Bank
Shi
ft on
Nor
th S
outh
Lin
e (k
m)
Figure 5 Shift of Left Bank Between 1990-2000
-6
-4
-2
0
2
4
6
8
10
12
14
-50 50 150 250 350 450 550 650
X- Distance from Base Line (km)
Bank
Shi
ft on
Nor
th S
outh
Lin
e (k
m)
Figure 6 Shift of Right Bank Between 1990-2000-6
-5
-4
-3
-2
-1
0
1
2
-50 50 150 250 350 450 550 650
X- Distance from Base Line (km) Bank
Shi
ft on
Nor
th S
outh
Lin
e (k
m)
Figure 7 Shift of Left Bank Between 1990-2002
-4
-2
0
2
4
6
8
10
12
14
-50 50 150 250 350 450 550 650
X- Distance from Base Line (km)
Bank
Shi
ft on
Nor
th S
outh
Lin
e (k
m)

12
Figure 8 Shift of Right Bank Between 1990-2002-8
-6
-4
-2
0
2
4
6
-50 50 150 250 350 450 550 650
X- Distance from Base Line (km)
Bank
Shi
ft on
Nor
th S
outh
Lin
e (k
m)
Table 3: Offsets of Satellite data in Km from baseline Year -1990 Year -1997 Year -2000 Year -2002 C/S No.
Chainage (X) ZL ZR ZL ZR ZL ZR ZL ZR
2 -2.592 -12.528 8.96 -11.968 11.856 -13.184 11.312 -13.872 8.464 3 6.144 -0.672 14.848 -2.88 10.416 -3.312 14.496 -3.008 9.952 4 13.04 4.832 13.184 4.336 13.536 4.208 13.184 4.256 12.208 5 20.096 8.72 15.808 6.48 15.968 6.976 16.096 6.912 16.368 6 29.264 11.344 19.968 11.52 20.016 11.28 19.6 11.264 19.824 7 37.808 11.488 26.88 11.744 26.992 11.536 27.136 11.632 27.232 8 43.552 17.264 26.544 17.232 26.672 18.336 27.168 18.112 26.88 9 51.872 19.952 23.472 20.528 23.024 20.56 22.976 20.528 23.12 10 63.952 11.568 27.36 12.48 27.552 12.144 28.016 12.544 28.496 11 70.192 10.576 25.296 11.28 26.048 11.056 26.224 11.248 26.272 12 76.512 9.488 26.928 10.944 27.68 10.688 27.808 10.944 27.872 13 84.4 6.576 20.128 8.096 22.08 7.856 22.672 8.24 23.552 14 91.584 9.04 21.168 10.032 23.072 10.128 23.248 10.288 23.504 15 101.712 16.64 26.192 14.416 24.672 14.992 25.008 14.8 25.488 16 111.264 15.856 26.432 14.144 25.152 14.224 25.648 14.08 25.792 17 127.216 9.872 27.856 9.104 26.496 8.816 27.12 8.752 26.848 18 134.56 10.432 27.824 9.568 27.2 9.664 27.52 9.568 26.944 19 142.304 11.344 16.864 10.8 16.224 10.544 16.208 10.608 16.08 20 148.304 12.24 16.4 11.808 16.064 11.824 16.192 11.856 16.144 21 156.224 14.032 20.496 13.856 20.112 13.792 20.192 13.776 20.048 22 166.096 16.528 18.352 16.352 18.064 16.512 18.128 16.496 18.032 23 171.488 19.264 24.016 19.584 24.272 19.76 24.448 19.76 24.32 24 176.8 20.672 23.36 20.848 23.664 21.008 23.872 20.944 23.792 25 182.256 21.2 30.608 22.4 31.136 21.92 31.216 21.712 30.928 26 187.792 23.936 36.064 24.976 37.28 25.152 36.928 24.272 31.552 27 193.584 26.96 35.488 28.08 38.736 28.144 39.264 27.552 36.992 28 201.264 27.44 45.136 30.448 46.4 30.096 46.608 29.648 46.016 29 205.392 29.776 46.736 32.88 48.048 34.016 47.84 32.704 48.096 30 217.776 43.936 51.184 43.28 50.752 42.784 51.408 42.672 50.576 31 223.68 49.76 57.552 47.744 55.84 47.712 56.224 47.488 56.112 32 232.64 51.088 61.568 49.152 59.728 50 60.24 48.864 60.176 33 248.768 54.176 67.456 52.512 65.776 52.704 66.304 53.328 65.824 34 257.184 55.344 67.088 53.792 66.432 54.08 66.416 54.944 67.248 35 273.024 59.888 66.096 58.544 64.512 59.312 65.184 59.008 65.504

13
36 291.632 65.728 69.536 64.144 68.416 64.72 68.928 65.648 69.376 37 303.008 62.512 71.488 61.584 70.224 62.4 71.28 62.048 71.232 38 310.064 66.08 70.88 64.864 70.96 65.904 70.512 64.144 70.24 39 317.616 70.016 78.768 68.88 77.856 69.52 79.28 68.144 78.64 40 328.544 76.016 82.592 74.624 81.312 75.408 82.784 74.72 82.64 41 337.76 77.376 83.232 76.224 83.616 77.36 84.752 77.104 84.16 42 344.832 76.592 84.944 76.592 82.576 77.552 83.712 77.6 83.36 43 355.44 71.248 83.408 71.152 83.6 71.92 85.632 72.4 84.944 44 365.152 77.184 84.992 73.872 84.016 74.768 85.52 74.608 85.28 45 382.16 82.816 99.952 81.072 100.816 81.36 100.176 81.376 99.408 46 393.36 87.376 97.216 86.272 99.264 87.52 98.416 87.664 98.288 47 403.376 88 97.68 90.496 100.608 89.856 99.664 90.784 99.664 48 412.512 90.608 98.528 91.2 100.512 89.776 100.128 90.064 100.384 49 421.008 92.72 97.52 92.928 97.632 91.76 97.536 91.696 97.712 50 428.544 98.848 110.208 97.568 109.776 97.424 110.032 97.376 108.336 51 433.216 103.12 114.416 103.008 113.952 103.024 114.192 102.864 113.936 52 438.096 106.88 120.448 106.592 120.144 106.816 120.576 106.704 120.368 53 443.36 111.52 121.936 111.264 121.6 111.44 122.432 111.056 122.544 54 448.256 115.44 132.208 115.344 132.544 115.68 132.336 116.256 132.432 55 452.944 123.376 139.536 122.96 138.896 123.36 139.696 123.2 139.408 56 457.824 128.224 147.12 127.76 146.512 128.144 147.312 128.112 146.896 57 465.12 142.496 154.864 142.112 155.456 142.4 156.736 142.448 156.688 58 473.12 151.824 163.984 151.344 163.328 152.32 164.304 152.096 163.952 59 482.336 160.416 171.392 159.616 170.768 160.752 171.6 160.512 171.408 60 492.8 165.008 179.184 163.904 178.352 165.12 179.632 164.784 179.312 61 500.496 172.416 184.24 165.504 182.72 167.104 184.416 166.432 183.84 62 510.976 174.976 187.632 166.896 185.504 170.32 187.36 167.888 188.384 63 524.624 182.96 195.664 169.376 195.744 170.8 196.784 170.528 196.528 64 530.768 184.032 203.024 173.024 207.744 173.728 207.792 173.616 210.24 65 535.36 186.224 212.288 175.984 213.712 177.616 211.968 176.672 211.968
4.2. Analysis of Reach-1 to Reach-7 as per shifting pattern observed in Multi-
temporal Imagery: The discussions of the results pertaining to various reaches are as detailed follows: Reach – 1 During the years 1990, 1997, 2000 and 2002, there is a mixed trend of erosion and deposition occurrence along the left bank of this lowermost reach. From cross-section 2 to cross-section 6, it shows deposition, while from cross-section 7 to cross-section 10, erosion is observed. In the case of right bank, there is a trend of erosion between cross-section 2 to cross-section 4 and deposition in between cross-section 5 to cross-section 10. Reach – 2 In this reach, left bank of river displayed migration towards North. It shows that it has deposition tendency. In the case of right bank also, deposition is observed. Thus the whole reach having the length of 89.76 kms is influenced by deposition. River is changing its course towards North over this reach. However the width of the river is decreased.
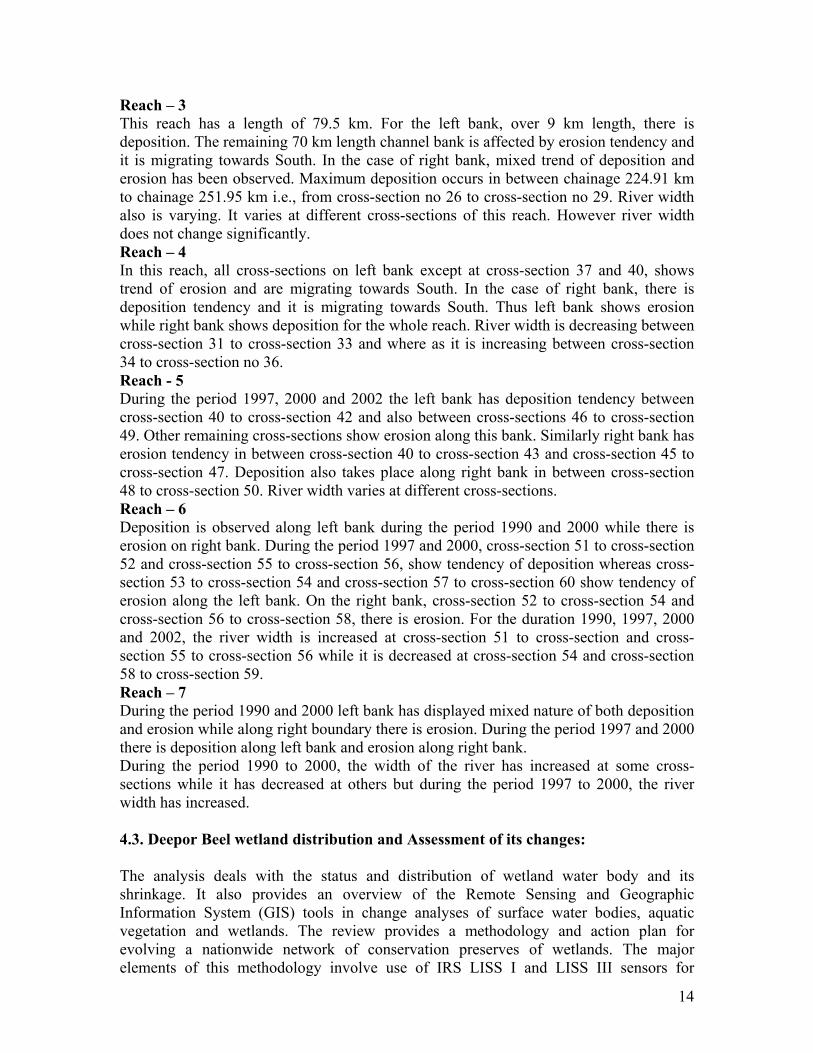
14
Reach – 3 This reach has a length of 79.5 km. For the left bank, over 9 km length, there is deposition. The remaining 70 km length channel bank is affected by erosion tendency and it is migrating towards South. In the case of right bank, mixed trend of deposition and erosion has been observed. Maximum deposition occurs in between chainage 224.91 km to chainage 251.95 km i.e., from cross-section no 26 to cross-section no 29. River width also is varying. It varies at different cross-sections of this reach. However river width does not change significantly. Reach – 4 In this reach, all cross-sections on left bank except at cross-section 37 and 40, shows trend of erosion and are migrating towards South. In the case of right bank, there is deposition tendency and it is migrating towards South. Thus left bank shows erosion while right bank shows deposition for the whole reach. River width is decreasing between cross-section 31 to cross-section 33 and where as it is increasing between cross-section 34 to cross-section no 36. Reach - 5 During the period 1997, 2000 and 2002 the left bank has deposition tendency between cross-section 40 to cross-section 42 and also between cross-sections 46 to cross-section 49. Other remaining cross-sections show erosion along this bank. Similarly right bank has erosion tendency in between cross-section 40 to cross-section 43 and cross-section 45 to cross-section 47. Deposition also takes place along right bank in between cross-section 48 to cross-section 50. River width varies at different cross-sections. Reach – 6 Deposition is observed along left bank during the period 1990 and 2000 while there is erosion on right bank. During the period 1997 and 2000, cross-section 51 to cross-section 52 and cross-section 55 to cross-section 56, show tendency of deposition whereas cross-section 53 to cross-section 54 and cross-section 57 to cross-section 60 show tendency of erosion along the left bank. On the right bank, cross-section 52 to cross-section 54 and cross-section 56 to cross-section 58, there is erosion. For the duration 1990, 1997, 2000 and 2002, the river width is increased at cross-section 51 to cross-section and cross-section 55 to cross-section 56 while it is decreased at cross-section 54 and cross-section 58 to cross-section 59. Reach – 7 During the period 1990 and 2000 left bank has displayed mixed nature of both deposition and erosion while along right boundary there is erosion. During the period 1997 and 2000 there is deposition along left bank and erosion along right bank. During the period 1990 to 2000, the width of the river has increased at some cross-sections while it has decreased at others but during the period 1997 to 2000, the river width has increased. 4.3. Deepor Beel wetland distribution and Assessment of its changes: The analysis deals with the status and distribution of wetland water body and its shrinkage. It also provides an overview of the Remote Sensing and Geographic Information System (GIS) tools in change analyses of surface water bodies, aquatic vegetation and wetlands. The review provides a methodology and action plan for evolving a nationwide network of conservation preserves of wetlands. The major elements of this methodology involve use of IRS LISS I and LISS III sensors for

15
investigating turbidity, aquatic vegetation and major geomorphological classes of wetlands using different year satellite data i.e. 1990, 1997 and 2002. The design of decision rules is the critical part of the rule-based method. By combining the information from LISS data and expert knowledge, knowledge-based decision rules within a GIS framework were designed. In this study the rule-based classification techniques have been used for identification of four major landuse/landcover classes namely wetland ecosystem, aquatic vegetation, other vegetation and other landuse. The decision rules were described as follows: Table 4(a): A rule based method and its critical pixel values for decision tree classifier for 1990
Expression Class Remarks (b1 gt 9) and (b1 lt 26) Wetland ecosystem If the condition is Yes (b4 gt 24) and (b4 lt 29) Other Vegetation If the condition is Yes
- Other Land use If the condition is No Where b1 is blue band, b4 is NIR, ‘lt’ is less than and ‘gt’ is greater than Table 4(b): A rule based method and its critical pixel values for decision tree classifier for 1997
Expression Class Remarks b1 gt 0.20 Wetland ecosystem If the condition is Yes
(b4 gt 52) and (b4 lt 90) Aquatic Vegetation If the condition is Yes (b3 gt 78) and (b3 lt 110) Other Vegetation If the condition is Yes
- Other Land use If the condition is No Where b1 is NDWI, b3 is NIR, b4 is SWIR, ‘lt’ is less than and ‘gt’ is greater than Table 4(c): A rule based method and its critical pixel values for decision tree classifier for 2002
Expression Class Remarks b1 gt 0.222 Wetland ecosystem If the condition is Yes
(b4 gt 35) and (b4 lt 67) Aquatic Vegetation If the condition is Yes (b3 gt 70) and (b3 lt 100) Other Vegetation If the condition is Yes
- Other Land use If the condition is No Where b1 is NDWI, b3 is NIR, b4 is SWIR, ‘lt’ is less than and ‘gt’ is greater than

16
Figure 9(a): Rule based wetland ecosystem classification during 1990 and 1997
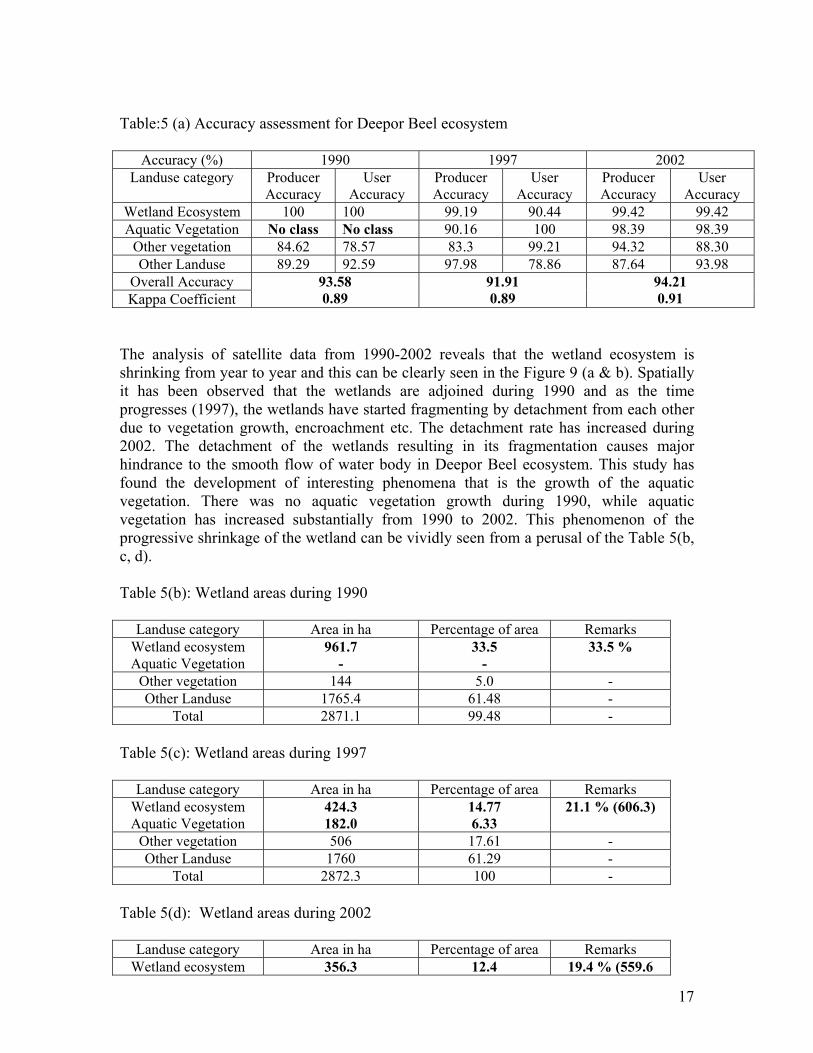
Figure 9(b): Rule based wetland ecosystem classification during 2002 From the accuracy Table 5(a), it has been shown that the overall accuracy in the classified image is 93.58, 91.91 and 94.21% for 1990, 1997 and 2002 respectively. The Kappa coefficient is 0.89, 0.89 and 0.91 for 1990, 1997 and 2002 respectively. The producers and users accuracy for the wetland ecosystem class is relatively good then other class for each year. During 1990 the aquatic vegetation doesn’t have producer and user accuracy because the study found there is no aquatic vegetation in the Deepor beel ecosystem. Thus accuracy assessment helps to assess the efficiency of the remote sensing data to detect the landuse classes.
17
Table:5 (a) Accuracy assessment for Deepor Beel ecosystem
Accuracy (%) 1990 1997 2002 Landuse category Producer
Accuracy User
Accuracy Producer Accuracy
User Accuracy
Producer Accuracy
User Accuracy
Wetland Ecosystem 100 100 99.19 90.44 99.42 99.42 Aquatic Vegetation No class No class 90.16 100 98.39 98.39
Other vegetation 84.62 78.57 83.3 99.21 94.32 88.30 Other Landuse 89.29 92.59 97.98 78.86 87.64 93.98
Overall Accuracy Kappa Coefficient
93.58 0.89
91.91 0.89
94.21 0.91
The analysis of satellite data from 1990-2002 reveals that the wetland ecosystem is shrinking from year to year and this can be clearly seen in the Figure 9 (a & b). Spatially it has been observed that the wetlands are adjoined during 1990 and as the time progresses (1997), the wetlands have started fragmenting by detachment from each other due to vegetation growth, encroachment etc. The detachment rate has increased during 2002. The detachment of the wetlands resulting in its fragmentation causes major hindrance to the smooth flow of water body in Deepor Beel ecosystem. This study has found the development of interesting phenomena that is the growth of the aquatic vegetation. There was no aquatic vegetation growth during 1990, while aquatic vegetation has increased substantially from 1990 to 2002. This phenomenon of the progressive shrinkage of the wetland can be vividly seen from a perusal of the Table 5(b, c, d). Table 5(b): Wetland areas during 1990
Landuse category Area in ha Percentage of area Remarks Wetland ecosystem Aquatic Vegetation
961.7 -
33.5 -
33.5 %
Other vegetation 144 5.0 - Other Landuse 1765.4 61.48 -
Total 2871.1 99.48 - Table 5(c): Wetland areas during 1997
Landuse category Area in ha Percentage of area Remarks Wetland ecosystem Aquatic Vegetation
424.3 182.0
14.77 6.33
21.1 % (606.3)
Other vegetation 506 17.61 - Other Landuse 1760 61.29 -
Total 2872.3 100 - Table 5(d): Wetland areas during 2002
Landuse category Area in ha Percentage of area Remarks Wetland ecosystem 356.3 12.4 19.4 % (559.6

18
Aquatic Vegetation 203.3 7.0 ha) Other vegetation 329 11.45 - Other Landuse 1983.7 69.15 -
Total 2872.3 100 - In a nutshell, wetland ecosystem and aquatic vegetation has been analyzed for the Deepor Beel wetland during 1990 to 2002. The study indicated that during 1990, wetland ecosystem was 33.5% and there was no aquatic vegetation growth in that year. However the aquatic vegetation growth has been observed in subsequent years, that is 1997 and 2002. Moreover the aquatic vegetation growth has taken place in the wetland waterbody area and thereby there is a decreasing trend of wetland areas in the Deepor Beel areas. As the aquatic vegetation growth has taken place in the wetland area, this class has been merged with the wetland area to know the decreasing trend of wetland areas from 1990 to 2002. From the Table 5(b, c, d) it can be seen that the wetland area has decreased from 33.5% (1990) to 21.1% (1997) and then to 19.4% (2002). Hence the study has brought out that there is a significant decline of wetland areas from 1990 to 1997, however the decline rate is less from 1997 to 2002. Similarly the study has indicated that the aquatic vegetation growth is very rapid during 1990 to 1997 i.e. 0 to 6.33%, whereas the growth is steady from 1997 to 2002. Overall, the wetland ecosystem has declined to 14.1%(405 ha) from 1990 to 2002, which is indication of major threats to the wetland ecosystem due to anthropogenic causes such as encroachment or due to any natural hazards. 4.4 Turbidity pattern within the Deepor Beel: Turbidity pattern within the Deepor Beel has been mapped using the multi-temporal satellite images to assess the spatial extent of turbid water within the period 1990 to 2002. In this study, the qualitative turbidity of Deepor Beel has been recorded based on hue as manifested on the FCC. The turbidity classification using satellite imagery is based on the system proposed by Space Application Centre, Ahmedabad in India. It’s seen that the turbidity of water in Deepor Beel wetland is varied and it can be spatially visualized from Figure 10. High Turbidity has been recorded in almost the entire wetland area in 1997 as compared to 1990 and 2002. In 2002, the spatial extent of wetland area decreased while pattern of low and medium turbidity increased. The extent of wetland area mapped in 1997 was relatively more compared to that of 2002, with more high turbid water pattern distribution in main Deepor Beel area. From this analysis it is seen that the intensity and pattern of high turbidity decreased from 1997 to 2002. The wetland area is shrinking from 1990 to 2002, which clearly indicates an imperative need for restoration of the wetland ecosystem. Moreover, it is seen that there is a significant development of aquatic species in the Deepor Beel wetland from 1990 to 1997 due to eutrophication. In the surrounding areas of Deepor Beel, the farmers are using more quantity of fertilizers, pesticide/herbicide to get more agricultural production; as a result the wetland ecosystem health is adversely affected and it indirectly can be inferred about increase in high turbidity pattern in 1997 from 1990.

19
Turbidity Classification
Low Turbid area ModerateTurbid area HighTurbid area
Region of Interest 0 0.7 1.4 2.1 2.80.35 Kilometers
1990: Spatial Turbidity pattern 1990: Spatial Turbidity pattern
1997: Spatial Turbidity pattern1997: Spatial Turbidity pattern
Figure 10: Spatial turbidity pattern from multi-temporal IRS LISS imagery
2002: Spatial Turbidity pattern2002: Spatial Turbidity pattern

20
5. FINDINGS
1. The river Brahmaputra has a trend of channel boundary migration towards north and south directions depending upon nature of riverbank and local flow pattern. However it is observed that the general tendency of river migration is somewhat towards south.
2. The average northing for right bank line of the Brahmaputra river moved about 0.47 km to the north between 1990 and 2002, while that for the left moved about 0.48 km to the south. The river has avulsed just upstream side of the Dibrugarh town and excised areas of floodplain to create new bars.
3. The river mean width has increased from 7.99 km to 8.94 km in the total length of the river; where as the minimum width at Pandu is slightly constricted due to the presence of the bridge. The maximum width has marginally increased from 18.11 km in 1990 to 18.13 km in 2002 at downstream side of Pandu at cross section 18 near Gumi.
4. The satellite based study brought to the fore on the ongoing major avulsion processes of the confluence zone of mainstreams of the Brahmaputra near Sadiya.The total area within the stream bank increased by 12.10% between 1990 and 2002 due to erosion process causing channel widening. Expansion of the river had taken place primarily through floodplain erosion and excision coupled with bar or island growth. Trends of expansion showed no sign of slacking and the expansion process appears to continue. The degree of braiding of individual reaches fluctuates in the short-term due to morphological response to the magnitude and duration of monsoon runoff events.
5. Deepor Beel is a Ramsar site, and one of the important wetland ecosystem in the
Brahmaputra Basin.It is encroached upon by various agencies including BSF camp, railways, nursing homes, brick kilns and is swamped by water hyacinth. Apart from a storm cushion, it is a major migratory centre and breeding ground for birds. Those are being disrupted. The dynamic nature of wetlands necessitates the widespread and consistent use of satellite-based remote sensors and low-cost, affordable GIS tools for effective management and monitoring.
6. The study revealed that wetland ecosystem of the Deepor Beel comprised 33.5%
in 1990 and there was then no aquatic vegetation. However the aquatic vegetation has been observed in subsequent years namely 1997 and 2002. The wetland area has decreased from 33.5% (1990) to 21.1% (1997) and then to 19.4% (2002). Overall the wetland ecosystem has been reduced to 14.1% (405 ha) from 1990 to 2002, which poses major threats to the wetland ecosystem due to anthropogenic factors.
21
REFERENCES
Chatterjee, C., Kumar, R. and Mani, P., 2003. Delineation of surface waterlogged areas in parts of Bihar using IRS-1C LISS III data. J. Indian Soc. Remote Sensing, 31, 57–65. Goswami, D. C., 1998. In Flood Studies in India, Geol. Soc. India, Bangalore, pp. 53–75. Goswami, S., 1998. Souvenir: National Workshop on Geodynamics of North-eastern India, Dibrugarh University, Dibrugarh, pp. 36–41. Hussain I., 1992. Investigation of morphological changes of the Brahmaputra river from Tezpur to Dhubri using Satellite data, M.E. Dissertation (WRD), WRDTC, University of Roorkee (Presently IIT-Roorkee), Roorkee, India. IPCC, 2001, Climate Change 2001, The Scientific Basis. Contribution of working group 1 to the third assessment report of the intergovernmental panel on climate changes (New York: Cambridge University Press). Jensen J., 1996. Introductory digital image processing: A remote sensing perspective, 2nd edition, New Jersey: Prentice-Hall. McFeeters, S. K., 1996. The use of normalized difference water index (NDWI) in the delineation of open water features. Int. J. Remote Sensing, 17, 1425–1432. Ozesmi, S.L. and Bauer, M.E., 2002. Satellite remote sensing of wetlands. Wetlands Ecology and Management, 10, pp. 381–402. Parmuchi, M.G., Karszenbaum, H. and Kandus, P., 2002. Mapping wetlands using multitemporal RADARSAT-1 data and a decision-based classifier. Canadian Journal of Remote Sensing, 28, pp. 175–186. Patar, K.C., 2005. Preservation of wetlands. Editorial The Assam Tribune, Guwahati, Saturday, October 1, 2005. Prasad S.N., Ramchandra T.V., Ahalya N., Sengupta T., Alok Kumar, Tiwari A.K., Vijayan V.S. and Lalitha Vijayan., 2002. Conservation of Wetlands of India - a review Tropical Ecology 43(1):173-186. Rogan, J.,Miller, J., Stow, D., Franklin, J., Levien, L. and Fisher, C., 2003. Land-cover change monitoring with classification trees using Landsat TM and ancillary data. Photogrammetric Engineering and Remote Sensing, 69, pp. 793–804. Rundouist, D., Narumalani, S. and Narayanan, R., 2001. A review of wetlands remote sensing and defining new considerations. Remote Sensing Reviews, 20, pp. 207–226. Singh L., 2003. M. Tech. Dissertation: Morphological Analysis of Brahmaputra River Using Satellite Data and GIS”, WRDTC, IIT, Roorkee, India.

22
Townsend, P.A., 2001. Mapping seasonal flooding in forested wetlands using multitemporal Radarsat SAR. Photogrammetric Engineering and Remote Sensing, 67, pp. 857–864.


![16662073 Dynamic Ecosystem Endangered Ecosystem[1]](https://img.pdfslide.us/doc/110x75/577d295b1a28ab4e1ea691a3/16662073-dynamic-ecosystem-endangered-ecosystem1.jpg)