Embed Size (px)
Citation preview
EcoSim: Null Models Software for Ecologists
Nicholas J. GotelliDepartment of BiologyUniversity of Vermont
Burlington, VT USA

Limitations of Ecological Data
• Non-normality• Small sample sizes• Non-independence

Null Model Analysis
• Monte Carlo simulation of ecological data• Generates patterns expected in the absence of a
mechanism• Allows for statistical tests of patterns• Wide applicability to community data

Steps in Null Model Analysis
• Define community metric X
• Calculate Xobs for observed data
• Randomize data subject to constraints
• Calculate Xsim for randomized data
• Repeat 1000 randomizations
• Compare Xobs to histogram of Xsim
• Measure P(Xobs Xsim)

Niche Overlap Data
Species Forest Canopy
Leaf Litter
Ground Nesting
Old Field
Urban Wetland
Solenopsis invicta 0.30 0.22 0.00 0.00 0.44 0.04
Camponotus floridanus 0.25 0.25 0.30 0.20 0.00 0.00
Crematogaster punctulata 0.98 0.02 0.00 0.00 0.00 0.00
Tapinoma sessile 0.00 0.07 0.50 0.11 0.22 0.10

Quantify Pattern as a single metric
Average pairwise niche overlap = 0.17

Randomize Overlap Data
Species Forest Canopy
Leaf Litter
Ground Nesting
Old Field
Urban Wetland
Solenopsis invicta 0.30 0.22 0.00 0.00 0.44 0.04
Camponotus floridanus 0.25 0.25 0.30 0.20 0.00 0.00
Crematogaster punctulata 0.98 0.02 0.00 0.00 0.00 0.00
Tapinoma sessile 0.00 0.07 0.50 0.11 0.22 0.10

Null Assemblage
Species Forest Canopy
Leaf Litter
Ground Nesting
Old Field
Urban Wetland
Solenopsis invicta 0.00 0.22 0.30 0.04 0.00 0.44
Camponotus floridanus 0.00 0.00 0.20 0.25 0.25 0.30
Crematogaster punctulata 0.00 0.00 0.98 0.00 0.00 0.02
Tapinoma sessile 0.10 0.22 0.11 0.50 0.07 0.00

Niche Overlap of A Single Null Community
0
2
4
6
8
10
0 0.1 0.2 0.3 0.4 0.5 0.6 0.7 0.8 0.9 1
Niche Overlap
Fre
qu
ency

Histogram of Niche Overlaps from Null Communities
0
50
100
150
200
250
300
0 0.1 0.2 0.3 0.4 0.5 0.6 0.7 0.8 0.9 1
Niche Overlap
Fre
qu
ency

Statistical Comparison with Observed Niche Overlap
0
50
100
150
200
250
300
0 0.1 0.2 0.3 0.4 0.5 0.6 0.7 0.8 0.9 1
Niche Overlap
Fre
qu
ency
• Observed = 0.17

Features of Null Models
• Distinction between pattern/process• Possibility of no effect• Principle of parsimony• Principle of falsification• Potential importance of stochastic mechanisms

Criticisms of Null Models• Ecological hypotheses cannot be stated in a way
for formal proof/disproof• Interactions between factors may confound null
model tests• Understanding only increased when null
hypothesis is rejected• Using same data to build and test model is
circular

Controversy over Null Model Analysis
• Early studies challenged conventional examples• Philosophical debate over falsification• Statistical debate over null model construction• Lack of powerful software

EcoSim Software
• Programmed in Delphi• Object-oriented design• Graphical user interface• Optimized for Windows• Supported by NSF • Created by Acquired Intelligence, Inc.

Analysis of MacArthur’s (1958) warblers
• 5 coexisting species of warblers in NE forests• Insectivores• Similar body sizes, diets• Paradox for classical niche theory• How could all species co-occur?

MacArthur’s resolution

Spatial niche segregation
25
25 25
62
1849
2525
Cape May warbler Myrtle warbler

How much niche overlap of MacArthur’s warblers would be
expected in the absence of species interactions?

Guided Tour of EcoSim

Diamond’s (1975) Assembly Rules
• Not all species combinations found in nature• Those that are not found are “forbidden”• Competition and niche adjustment lead to a small
number of stable species combinations

Connor and Simberloff’s (1979) challenge
• Assembly rules are tautologies• How much coexistence would be expected in the
absence of competition• Construction of a null model to test community
patterns

Presence-Absence Matrix
SPECIES 1F 2F 3F 4F 5F 6FSolenopsis wagneri 1 1 1 0 1 1Camponotus chromaoides 0 0 0 1 0 0Lasius neoniger 1 1 0 1 1 0Myrmica fracticornis 0 0 1 0 0 1
SITE

Connor and Simberloff’s (1979) null model
• Species by site co-occurrence matrix• Create random matrices that maintain row totals
(= species occurrences) and column totals (= number of species per site)

Criticisms of C&S null model
• Competitive effects “smuggled in” with row and column totals
• Cannot detect certain checkerboard distributions• Constraints guarantee that simulated matrices
are very similar to observed matrices

Co-occurrence Analysis with EcoSim

Evaluating Co-occurrence Algorithms
• Type I error (incorrectly rejecting null)• Type II error (incorrectly accepting null)

Evaluating Type I Error
• Use null model tests on “random matrices”• A well-behaved model should reject the null
hypothesis 5% of the time

Evaluating Type II Error
• Begin with perfectly “structured” data set• Add increasing amounts of random noise• Determine how much noise the test can tolerate
and still detect non-randomness

% Noise Added
P-value
0.05 Type I Error
Type II ErrorIdeal Curve

Summary of Error Analyses
• Best algorithm depends on co-occurrence index• Maintaining row totals (= species occurrences)
necessary to control Type I error• Modified version of C&S (fixed,fixed) has low
Type I, Type II errors for C-score

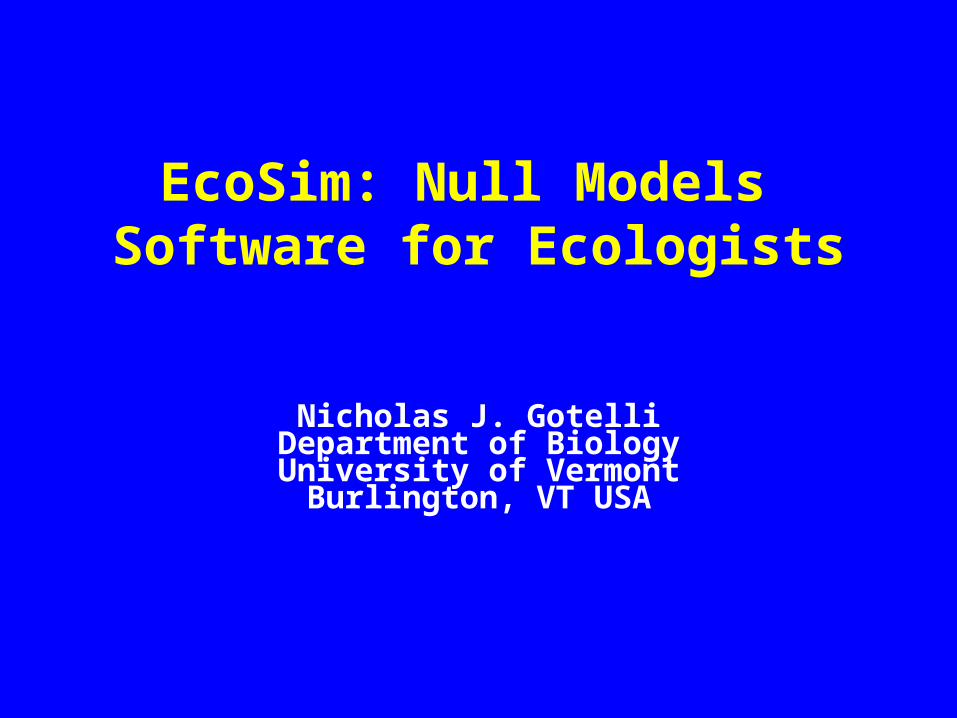
Meta-analyses of co-occurrence
• 98 presence-absence matrices from literature• analyzed for # of checkerboards, # combinations,
C-score• standardized effect size using fixed,fixed null
model

Standardized Effect Size
-10 -5 0 5 100
5
10
15
20
25C-SCORE

STANDARDIZED EFFECT SIZE
-10 -5 0 5 100
10
20
30
40
CHECKERBOARDPAIRS

Standardized effect size
-10 -5 0 5 100
15
30
45
60
75
NUMBER OF SPECIES COMBINATIONS

Results
• Larger C-score than expected by chance• More checkerboard species pairs than expected
by chance• Fewer species combinations than expected by
chance

Conclusions
• Published presence-absence matrices are highly non-random
• Patterns match the predictions of Diamond’s assembly rules model!
• Consistent with small-scale experimental studies demonstrating importance of species interactions

Causes of Non-random Co-occurrence Patterns
• Negative species interactions• Habitat checkerboards• Historical, evolutionary processes
Standardized Effect Size
-10 -5 0 5 100
5
10
15
20
25C-SCORE

Statistical covariates of effect size
• Number of species in matrix• Number of sites in matrix• % fill of matrix
Statistical covariates of effect size
• Number of species in matrix• Number of sites in matrix• % fill of matrix

Biological correlates of effect size
• Area (patch, geographic extent)• Insularity (island, mainland)• Biogeographic Province (Nearctic, Palearctic)• Latitude, Longitude• Taxonomic group (plants, mammals, birds)

Biological correlates of effect size
• Area (patch, geographic extent)• Insularity (island, mainland)• Biogeographic Province (Nearctic, Palearctic)• Latitude, Longitude• Taxonomic group (plants, mammals, birds)

Sta
nd
ard
ize
d e
ffe
ct s
ize
0
2
4
6
8

Sta
nd
ard
ize
d e
ffe
ct s
ize
0
2
4
6
8
Ectoparasites of marine fishes Gotelli & Rohde 2002

Plant Assemblage Sites Source
Flowering plants Vacant Chicago lots Crowe (1979)
Subcanopy plants Mahogany woodlots of Barbados Watts (1978)
Vascular plants Baja Islands Cody et al. (1983)
Vascular plants Greater, Lesser Antilles Beard (1948)
Vascular plants Oceanic Islands, Gulf of Guinea Exell (1944)
Genus Pelea Hawaiian Islands Stone (1969)
Vascular plants Oceanic islets near Perth, Australia Abbott & Black (1980)
Mangrove forests Great Barrier Reef, Australia Stoddart (1980)
Trees (Dry Zone) Greater, Lesser Antilles Beard (1948)
Trees (Montane) Greater, Lesser Antilles Beard (1948)
Trees (Tropical Forest) Greater, Lesser Antilles Beard (1948)
Trees (Swamps) Greater, Lesser Antilles Beard (1948)
Trees Woodlot fragments, Ontario Weaver & Kellman (1981)

Conclusion
• Homeotherm matrices highly structured• Poikilotherm matrices random co-occurrence• Ants, plant matrices highly structured• Energetic constraints may affect community co-
occurrence patterns

Conclusions• Null models are useful tools for analyses of
community structure• Species co-occurrence in published matrices is
less than expected by chance• Patterns match the predictions of Diamond’s
(1975) assembly rules model• Co-occurrence patterns differ for homeotherm vs.
poikilotherm matrices• EcoSim software available for analysis

EcoSim Website
http://homepages.together.net/~gentsmin/ecosim.htm


![Gotelli - A Primer of Ecology[1]](https://img.pdfslide.us/doc/110x75/55cf983c550346d033966ac5/gotelli-a-primer-of-ecology1.jpg)