Embed Size (px)
Citation preview
1DEPARTMENT OF ECONOMICS
EcoNZ@Otagoemail: [email protected]
ISSUE 32APRIL 2O14
A MAGAZINE ABOUT CONTEMPORARY ECONOMIC ISSUES FOR EVERYONE
ALSO IN THIS ISSUE
~ Giving to charity, but only if you have time, by Stephen Knowles & Maroš Servátka
~ The economics of propaganda, by Trent Smith
~ The economics of gender equality and female empowerment, by David Fielding
~ Shaking things up: The regional effects of the Canterbury earthquakes on productivity and tourism, by Evan Miller & Christopher Hajzler
~ Commentary on the New Zealand economy, by Alan King
Simona Fabrizi2, Steffen Lippert3, Pehr-Johan Norbäck4 & Lars Persson4
[email protected], [email protected], [email protected], [email protected]
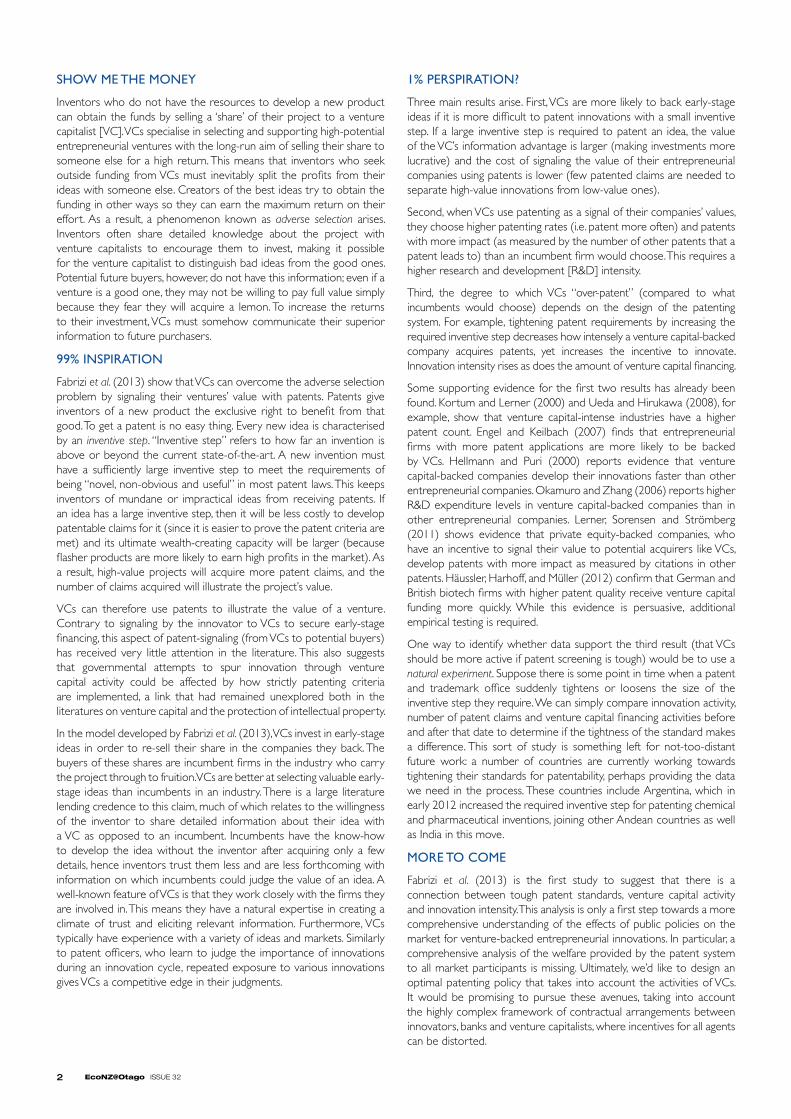
Imagine you have an idea for a revolutionary new product, but you lack the money to develop it for the market. There are several ways to get the funds you need: you could ask your family, apply for a loan at a bank, or approach a venture capitalist. Alternatively, you could sell your idea to an existing firm (known as an incumbent) that has the means to make the good. Often, family resources are insufficient and banks are too risk-averse to back early-stage ventures. You may want to avoid selling early-stage ideas to incumbents directly… they probably have the know-how to develop your invention based on just a few details and are therefore less willing to pay you for all the information. That leaves venture capitalists. Inventors typically encourage venture capitalists to invest in their projects by releasing a large number of details to them. This gives venture capitalists an information advantage (which helps them select good ideas to develop in the first place). Once the project is underway, the venture capitalist can then sell their stake in the project to an incumbent at a profit. For earnings to be high, however, the venture capitalist must effectively communicate their superior information on the idea’s quality to potential buyers. Recent research shows that the patent system can help in that process.
FROM THE EdITORYou’ve got to get paid. Obtaining resources to spend is a key (if not the key) economic activity for consumers, firms and governments in any society. This issue of EcoNZ@Otago focuses on obtaining funds. We explore how inventors acquire the necessary capital to produce new products. We also look at how firms secure high profits through the use of propaganda. Which mechanisms cause donors to delay giving money to charity are studied, as is the relationship between female empowerment and socio-economic outcomes (including income distribution). Finally, we look at the regional impact of the Christchurch earthquake on productivity and income in the tourist industry. In this issue, we call upon year 12 and year 13 secondary school students to answer important questions about youth labour markets in the 2014 EcoNZ@Otago Essay Competition. As usual, Highlights – short commentaries on economic issues – accompany selected articles.
To request previous issues of EcoNZ@Otago please contact us at the address below or visit us online at www.business.otago.ac.nz/econ/econz. The department of Economics at the University of Otago is on Facebook. Search for us at www.facebook.com and get connected!
DAN FARHAT EcoNZ@OtagoUniversity of Otago – department of EconomicsPO Box 56dunedin [email protected]
Venture capital and patenting1
1 This article is based on Fabrizi, Lippert, Norbäck and Persson (2013). This research was funded by the Royal Society of New Zealand. In 2014, this project was selected to feature in the Celebrating Marsden Research section of the Royal Society of New Zealand website (www.royalsociety.org.nz/2014/02/24/modelling-venture-capital-and-the-role-of-patents/).
2 School of Economics and Finance, Massey University.3 department of Economics, University of Otago.4 Research Institute of Industrial Economics, Stockholm.
2 EcoNZ@Otago ISSUE 32
SHOW ME THE MONEY
Inventors who do not have the resources to develop a new product can obtain the funds by selling a ‘share’ of their project to a venture capitalist [VC]. VCs specialise in selecting and supporting high-potential entrepreneurial ventures with the long-run aim of selling their share to someone else for a high return. This means that inventors who seek outside funding from VCs must inevitably split the profits from their ideas with someone else. Creators of the best ideas try to obtain the funding in other ways so they can earn the maximum return on their effort. As a result, a phenomenon known as adverse selection arises. Inventors often share detailed knowledge about the project with venture capitalists to encourage them to invest, making it possible for the venture capitalist to distinguish bad ideas from the good ones. Potential future buyers, however, do not have this information; even if a venture is a good one, they may not be willing to pay full value simply because they fear they will acquire a lemon. To increase the returns to their investment, VCs must somehow communicate their superior information to future purchasers.
99% INSPIRATION
Fabrizi et al. (2013) show that VCs can overcome the adverse selection problem by signaling their ventures’ value with patents. Patents give inventors of a new product the exclusive right to benefit from that good. To get a patent is no easy thing. Every new idea is characterised by an inventive step. “Inventive step” refers to how far an invention is above or beyond the current state-of-the-art. A new invention must have a sufficiently large inventive step to meet the requirements of being “novel, non-obvious and useful” in most patent laws. This keeps inventors of mundane or impractical ideas from receiving patents. If an idea has a large inventive step, then it will be less costly to develop patentable claims for it (since it is easier to prove the patent criteria are met) and its ultimate wealth-creating capacity will be larger (because flasher products are more likely to earn high profits in the market). As a result, high-value projects will acquire more patent claims, and the number of claims acquired will illustrate the project’s value.
VCs can therefore use patents to illustrate the value of a venture. Contrary to signaling by the innovator to VCs to secure early-stage financing, this aspect of patent-signaling (from VCs to potential buyers) has received very little attention in the literature. This also suggests that governmental attempts to spur innovation through venture capital activity could be affected by how strictly patenting criteria are implemented, a link that had remained unexplored both in the literatures on venture capital and the protection of intellectual property.
In the model developed by Fabrizi et al. (2013), VCs invest in early-stage ideas in order to re-sell their share in the companies they back. The buyers of these shares are incumbent firms in the industry who carry the project through to fruition. VCs are better at selecting valuable early-stage ideas than incumbents in an industry. There is a large literature lending credence to this claim, much of which relates to the willingness of the inventor to share detailed information about their idea with a VC as opposed to an incumbent. Incumbents have the know-how to develop the idea without the inventor after acquiring only a few details, hence inventors trust them less and are less forthcoming with information on which incumbents could judge the value of an idea. A well-known feature of VCs is that they work closely with the firms they are involved in. This means they have a natural expertise in creating a climate of trust and eliciting relevant information. Furthermore, VCs typically have experience with a variety of ideas and markets. Similarly to patent officers, who learn to judge the importance of innovations during an innovation cycle, repeated exposure to various innovations gives VCs a competitive edge in their judgments.
1% PERSPIRATION?
Three main results arise. First, VCs are more likely to back early-stage ideas if it is more difficult to patent innovations with a small inventive step. If a large inventive step is required to patent an idea, the value of the VC’s information advantage is larger (making investments more lucrative) and the cost of signaling the value of their entrepreneurial companies using patents is lower (few patented claims are needed to separate high-value innovations from low-value ones).
Second, when VCs use patenting as a signal of their companies’ values, they choose higher patenting rates (i.e. patent more often) and patents with more impact (as measured by the number of other patents that a patent leads to) than an incumbent firm would choose. This requires a higher research and development [R&d] intensity.
Third, the degree to which VCs “over-patent” (compared to what incumbents would choose) depends on the design of the patenting system. For example, tightening patent requirements by increasing the required inventive step decreases how intensely a venture capital-backed company acquires patents, yet increases the incentive to innovate. Innovation intensity rises as does the amount of venture capital financing.
Some supporting evidence for the first two results has already been found. Kortum and Lerner (2000) and Ueda and Hirukawa (2008), for example, show that venture capital-intense industries have a higher patent count. Engel and Keilbach (2007) finds that entrepreneurial firms with more patent applications are more likely to be backed by VCs. Hellmann and Puri (2000) reports evidence that venture capital-backed companies develop their innovations faster than other entrepreneurial companies. Okamuro and Zhang (2006) reports higher R&d expenditure levels in venture capital-backed companies than in other entrepreneurial companies. Lerner, Sorensen and Strömberg (2011) shows evidence that private equity-backed companies, who have an incentive to signal their value to potential acquirers like VCs, develop patents with more impact as measured by citations in other patents. Häussler, Harhoff, and Müller (2012) confirm that German and British biotech firms with higher patent quality receive venture capital funding more quickly. While this evidence is persuasive, additional empirical testing is required.
One way to identify whether data support the third result (that VCs should be more active if patent screening is tough) would be to use a natural experiment. Suppose there is some point in time when a patent and trademark office suddenly tightens or loosens the size of the inventive step they require. We can simply compare innovation activity, number of patent claims and venture capital financing activities before and after that date to determine if the tightness of the standard makes a difference. This sort of study is something left for not-too-distant future work: a number of countries are currently working towards tightening their standards for patentability, perhaps providing the data we need in the process. These countries include Argentina, which in early 2012 increased the required inventive step for patenting chemical and pharmaceutical inventions, joining other Andean countries as well as India in this move.
MORE TO COME
Fabrizi et al. (2013) is the first study to suggest that there is a connection between tough patent standards, venture capital activity and innovation intensity. This analysis is only a first step towards a more comprehensive understanding of the effects of public policies on the market for venture-backed entrepreneurial innovations. In particular, a comprehensive analysis of the welfare provided by the patent system to all market participants is missing. Ultimately, we’d like to design an optimal patenting policy that takes into account the activities of VCs. It would be promising to pursue these avenues, taking into account the highly complex framework of contractual arrangements between innovators, banks and venture capitalists, where incentives for all agents can be distorted.
3DEPARTMENT OF ECONOMICS
FURTHER READING
S Fabrizi, S Lippert, P-J Norbäck & L Persson (2013), Venture capitalists and the patenting of innovations, Journal of Industrial Economics, 61(3), 623-659.
REFERENCES
R dessi & N Yin (2012), The impact of venture capital on innovation, in d Cumming (ed), The Oxford Handbook of Venture Capital, Oxford: Oxford University Press.
d Engel & M Keilbach (2007), Firm-level implications of early stage venture capital investment: an empirical investigation, Journal of Empirical Finance, 14(2), 150-167.
C Häussler, d Harhoff & E Müller (2012), To be financed or not: The role of patents for venture capital-financing, ZEW – Centre for European Economic Research Discussion Paper No. 09-003.
T Hellmann & M Puri (2000), The interaction between product market and financing strategy: the role of venture capital, Review of Financial Studies, 13(4), 959-984.
S Kortum & J Lerner (2000), Assessing the contribution of venture capital to innovation, RAND Journal of Economics, 31(4), 674-692.
J O Lanjouw & M Schankerman (2001), Characteristics of patent litigation: A window on competition, RAND Journal of Economics, 32(1), 129-151.
J O Lanjouw & M Schankerman (2004), Protecting intellectual property rights: Are small firms handicapped?, Journal of Law and Economics, 47(1), 45-74.
J Lerner (1994), The importance of patent scope: An empirical analysis, RAND Journal of Economics, 25(2), 319-333.
J Lerner, M Sorensen & P Strömberg (2011), Private equity and long-run investment: The case of innovation, Journal of Finance, 66(2), 445-477.
H Okamuro & J X Zhang (2006), Ownership structure and R&d investment of Japanese start-up firms, CEI Working Paper Series 2006-1, Center for Economic Institutions, Institute of Economic Research, Hitotsubashi University.
P Régibeau & K Rockett (2010), Innovation cycles and learning at the patent office: does the early patent get the delay?, Journal of Industrial Economics, 58(2), 222-246.
M Ueda & M Hirukawa (2008), Venture capital and industrial innovation, CEPR Discussion Papers 7089.
E von Hippel (1988), The Sources of Innovation, New York: Oxford University Press.
Giving to charity, but only if you have timeStephen Knowles1 & Maroš Servátka2
[email protected], [email protected]
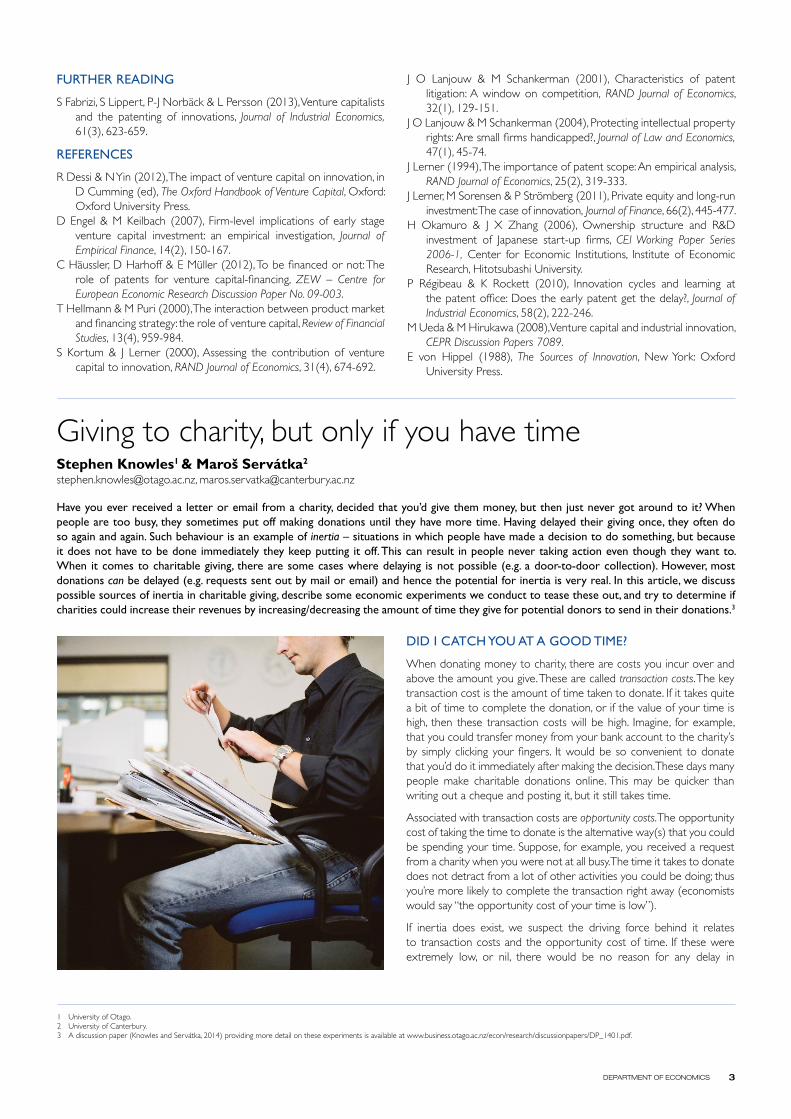
Have you ever received a letter or email from a charity, decided that you’d give them money, but then just never got around to it? When people are too busy, they sometimes put off making donations until they have more time. Having delayed their giving once, they often do so again and again. Such behaviour is an example of inertia – situations in which people have made a decision to do something, but because it does not have to be done immediately they keep putting it off. This can result in people never taking action even though they want to. When it comes to charitable giving, there are some cases where delaying is not possible (e.g. a door-to-door collection). However, most donations can be delayed (e.g. requests sent out by mail or email) and hence the potential for inertia is very real. In this article, we discuss possible sources of inertia in charitable giving, describe some economic experiments we conduct to tease these out, and try to determine if charities could increase their revenues by increasing/decreasing the amount of time they give for potential donors to send in their donations.3
DID I CATCH YOU AT A GOOD TIME?
When donating money to charity, there are costs you incur over and above the amount you give. These are called transaction costs. The key transaction cost is the amount of time taken to donate. If it takes quite a bit of time to complete the donation, or if the value of your time is high, then these transaction costs will be high. Imagine, for example, that you could transfer money from your bank account to the charity’s by simply clicking your fingers. It would be so convenient to donate that you’d do it immediately after making the decision. These days many people make charitable donations online. This may be quicker than writing out a cheque and posting it, but it still takes time.
Associated with transaction costs are opportunity costs. The opportunity cost of taking the time to donate is the alternative way(s) that you could be spending your time. Suppose, for example, you received a request from a charity when you were not at all busy. The time it takes to donate does not detract from a lot of other activities you could be doing; thus you’re more likely to complete the transaction right away (economists would say “the opportunity cost of your time is low”).
If inertia does exist, we suspect the driving force behind it relates to transaction costs and the opportunity cost of time. If these were extremely low, or nil, there would be no reason for any delay in
1 University of Otago.2 University of Canterbury.3 A discussion paper (Knowles and Servátka, 2014) providing more detail on these experiments is available at www.business.otago.ac.nz/econ/research/discussionpapers/dP_1401.pdf.
4 EcoNZ@Otago ISSUE 32
charitable giving. It is when the donation procedure is time-consuming, or if a person is occupied with other tasks, that donating to charity likely starts slipping lower down the to-do lists of potential contributors.
ECONOMISTS CAN DO IT IN LABS
In economics, a laboratory experiment involves giving participants some real money and then observing what they do with that money in order to test economic theories or hypotheses. We conducted one of these types of experiments in the New Zealand Experimental Economics Laboratory at the University of Canterbury to test the hypothesis that transaction costs induce inertia.
A number of other researchers have, in the past, used an experiment called the “dictator Game” to test hypotheses related to charitable giving. In the dictator Game, participants are given a sum of real money (or do a task, such as answer a survey, to earn the money) and are then asked how much they would like to keep and how much they would like to give away (to another player, or, in studies like ours, to a charity). We designed some variations on the standard dictator Game to test the effect of transaction costs, the opportunity cost of time and inertia on charitable donations.
Our sample was made up of students at the University of Canterbury. Participants were paid $20 (a $10 note, a $5 note, two $2 coins and a $1 coin) and then invited to give some of that money to World Vision, a humanitarian organisation dedicated to working with children, families and communities to overcome extreme poverty and injustice (www.worldvision.org.nz)4. Participants were told that the researchers would double any donations made out of a research fund. In the laboratory where the experiments took place, participants were seated at cubicles with partitions. This meant that neither other participants nor the researchers could see how much money anyone chose to donate.
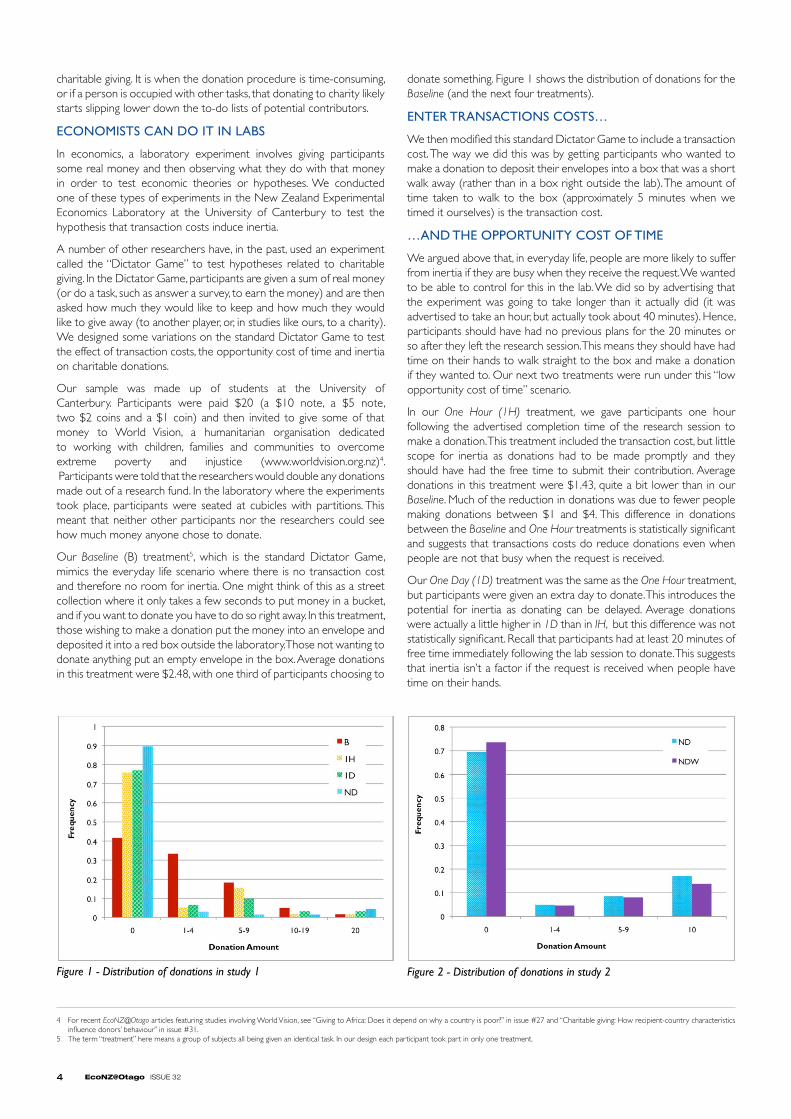
Our Baseline (B) treatment5, which is the standard dictator Game, mimics the everyday life scenario where there is no transaction cost and therefore no room for inertia. One might think of this as a street collection where it only takes a few seconds to put money in a bucket, and if you want to donate you have to do so right away. In this treatment, those wishing to make a donation put the money into an envelope and deposited it into a red box outside the laboratory. Those not wanting to donate anything put an empty envelope in the box. Average donations in this treatment were $2.48, with one third of participants choosing to
donate something. Figure 1 shows the distribution of donations for the Baseline (and the next four treatments).
ENTER TRANSACTIONS COSTS…
We then modified this standard dictator Game to include a transaction cost. The way we did this was by getting participants who wanted to make a donation to deposit their envelopes into a box that was a short walk away (rather than in a box right outside the lab). The amount of time taken to walk to the box (approximately 5 minutes when we timed it ourselves) is the transaction cost.
…AND THE OPPORTUNITY COST OF TIME
We argued above that, in everyday life, people are more likely to suffer from inertia if they are busy when they receive the request. We wanted to be able to control for this in the lab. We did so by advertising that the experiment was going to take longer than it actually did (it was advertised to take an hour, but actually took about 40 minutes). Hence, participants should have had no previous plans for the 20 minutes or so after they left the research session. This means they should have had time on their hands to walk straight to the box and make a donation if they wanted to. Our next two treatments were run under this “low opportunity cost of time” scenario.
In our One Hour (1H) treatment, we gave participants one hour following the advertised completion time of the research session to make a donation. This treatment included the transaction cost, but little scope for inertia as donations had to be made promptly and they should have had the free time to submit their contribution. Average donations in this treatment were $1.43, quite a bit lower than in our Baseline. Much of the reduction in donations was due to fewer people making donations between $1 and $4. This difference in donations between the Baseline and One Hour treatments is statistically significant and suggests that transactions costs do reduce donations even when people are not that busy when the request is received.
Our One Day (1D) treatment was the same as the One Hour treatment, but participants were given an extra day to donate. This introduces the potential for inertia as donating can be delayed. Average donations were actually a little higher in 1D than in IH, but this difference was not statistically significant. Recall that participants had at least 20 minutes of free time immediately following the lab session to donate. This suggests that inertia isn’t a factor if the request is received when people have time on their hands.
4 For recent EcoNZ@Otago articles featuring studies involving World Vision, see “Giving to Africa: does it depend on why a country is poor?” in issue #27 and “Charitable giving: How recipient-country characteristics influence donors’ behaviour” in issue #31.
5 The term “treatment” here means a group of subjects all being given an identical task. In our design each participant took part in only one treatment.
Figure 1 - Distribution of donations in study 1 Figure 2 - Distribution of donations in study 2
5DEPARTMENT OF ECONOMICS
WHAT ABOUT IF PEOPLE ARE BUSY WHEN THE REQUEST IS RECEIVED?
Recall that our conjecture is that inertia will more likely become a problem if people are busy when they receive a request. The next thing we had to do was introduce a treatment which ruled out people being able to donate when they had time on their hands. We did this in the Next Day (ND) treatment by not allowing donations to be made until the following day. Of course, some participants may have had some time on their hands the following day. The key point here is that we ruled out the option of donating as soon as the request was received when we knew for sure participants had about 20 minutes of free time available. The average donation was $1.20 in this treatment, which was statistically significantly lower than in the other treatments. There are two reasons why donations could have been lower in the ND treatment. The first is inertia: as participants had more time to donate, they put off incurring the transaction cost of donating until it was too late. The second is the fact that their effective transaction cost, which takes into account the time taken to walk to the box and how busy they are when they do so, could have been too high in this treatment for them to donate at all.
STUDY 2
In a second study conducted a few months later, we had some participants who had not taken part in any of the earlier experiments take part in the ND treatment. We also introduced a Next Day all Week (NDW) treatment. This was the same as ND, except participants in this treatment had a whole week (starting the next day) to donate.
donations had been quite low in the Nd treatment in our first study. In order to increase donations across the two treatments, which would make it easier to observe a statistically significant difference across treatments, we did a couple of things differently in this second study. The first was to pay participants $10 for showing up, then give them another $10 as a windfall gain (that is, they didn’t have to do anything to earn it). They were only asked to consider donating part or all of this extra $10 to World Vision. The second change was that we told them what World Vision would use the money for (to immunise children).
The distribution of donations for this second study is shown in Figure 2. It is clear that the changes we made to the experimental design did increase donations. If inertia kicks in when people are busy when they receive the request, we would expect donations to be lower in NDW than in ND. They were: the average donation in ND was $2.24 with 32% of participants donating, and in NW the average donation was $2.00 with 26.4% of participants donating. However, the differences across the two treatments were not statistically significant. This could be because giving people more time to donate also means it is more likely they will have a time during that week they are not too busy. The main policy implication, however, is that we failed to find statistically significant evidence that giving people more time to donate reduces donations.
WHAT THIS ALL MEANS FOR CHARITIES
Although we didn’t find evidence that giving people more time to donate affects donations, our results do have some important implications for charities: it is important to keep transaction costs low, and to ask people for donations when they are not busy. Street collections, where volunteers stand on street corners with donation buckets, are likely to meet these conditions. Another example is when charities partner with mobile phone companies and encourage people who want to make a donation of a certain amount (e.g. $5) to send a text message to a mobile number (with the money being automatically added to the donor’s phone bill and passed on to the charity). With these sorts of practices, charities can avoid losing potential contributions and pass greater benefits on to those in need.
QUESTIONS TO CONSIDER
1. Have you ever suffered from inertia, either with respect to giving money to charity, or some other activity?
2. If you are subject to inertia, what could you do to prevent this in the future?
3. Imagine you were one of the people who took part in our experiments. do you think you would have been more likely to donate if you had been in the baseline treatment than one of the other treatments? For example, would having to take a five minute walk to make a donation have made it less likely you would donate?
FURTHER READING
There is quite a large literature using either laboratory experiments (i.e. using a methodology similar to that used in our research) or field experiments (where those invited to donate typically do not realise they are taking part in a research project) to analyse motivations for charitable giving. Some examples include List and Lucking-Reiley (2002), Breman (2011), dellaVigna, List and Malmendier (2012) and Fielding and Knowles (2013).
REFERENCES
A Breman (2011), Give more tomorrow: Two field experiments on altruism and intertemporal choice, Journal of Public Economics, 95(11), 1349-1357.
S dellaVigna, J List & U Malmendier (2012), Testing for altruism and social pressure in charitable giving, Quarterly Journal of Economics, 127(1), 1-56.
d Fielding & S Knowles (2013), Can you spare some change for charity? Experimental evidence on verbal cues and loose change effects in a dictator Game, University of Otago Economics Discussion Paper No.1318, available at www.business.otago.ac.nz/econ/research/discussionpapers.
S Knowles & M Servátka (2014), Transaction costs, the opportunity cost of time and inertia in charitable giving, University of Otago Economics Discussion Paper No.1401, available at www.business.otago.ac.nz/econ/research/discussionpapers.
J A List & d Lucking-Reiley (2002), The effects of seed money and refunds on charitable giving: Experimental evidence from a university capital campaign, Journal of Political Economy, 110(1), 215-233.
Previous issues are available by emailing [email protected] with your request.
Or write to
EcoNZ@Otago
Department of Economics
University of Otago
PO Box 56
Dunedin
Select issues are also available at www.business.otago.ac.nz/econ/econz
STAy CONNECTED!
Follow us on Facebook to keep up-to-date with the latest news and events in the Department of Economics
at the University of Otago.
6 EcoNZ@Otago ISSUE 32
HIgHLIgHTS HAUNTED HOUSES
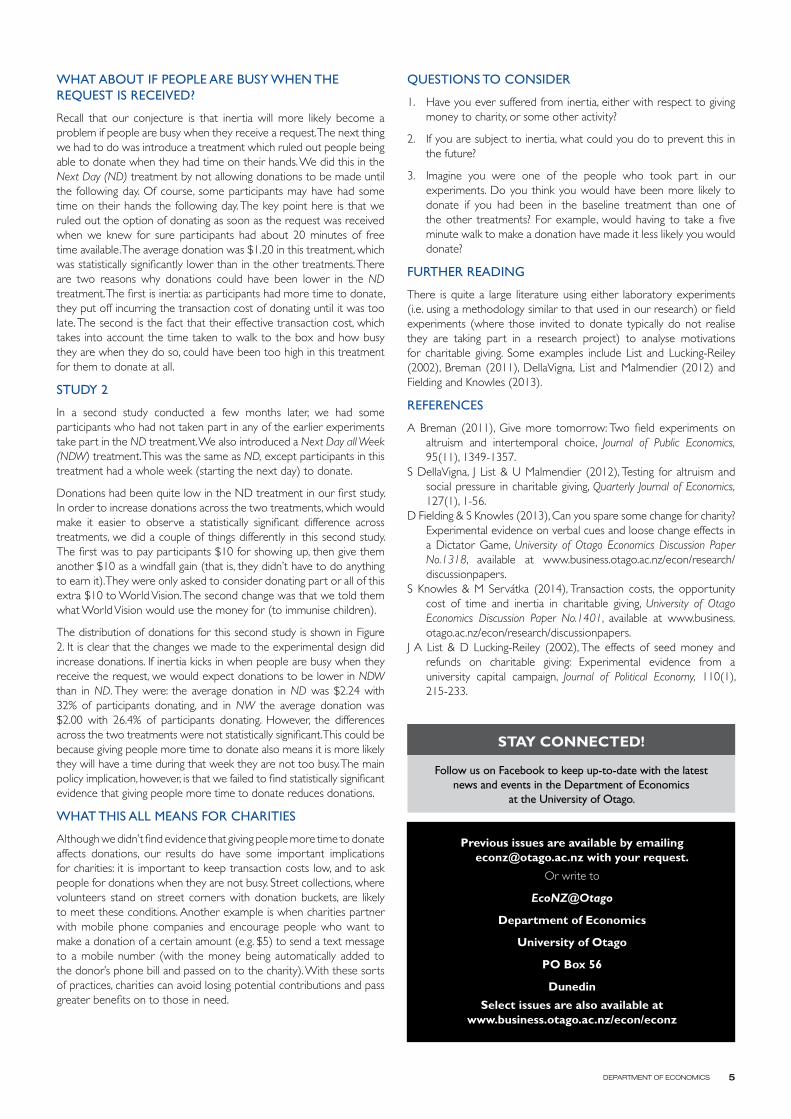
In 1989, Jeffrey Stambovsky put a US$32,500 (approximately NZ$72,850 in today’s terms) down-payment on a picturesque 18-room Victorian home overlooking the Hudson River in New York. When an architect refused to work on the property, Stambovsky began to realise that his new house wasn’t all it appeared to be. Helen Ackley, the previous owner, had professed the home was haunted when it belonged to her. She advertised the story to walking tours, newspapers and Reader’s Digest (a popular American magazine) – it became a local legend. By doing this, Ackley had stigmatised the property. This was not disclosed to Stambovsky when he purchased the house and he sued to have the sale rescinded (which it was).
Caveat emptor (“buyer beware”) is key in real estate transactions. The amount of experienced pleasure that a consumer gets from buying a product depends on its features, both real and perceived (see “Highlights: The Power of Positive Thinking” in EcoNZ@Otago Issue #29). Homes are no exception. Although the buyer usually has the property inspected and appraised by professionals before making the purchase, there is no easy way to discover if a home has sinister psychological attributes (in the words of Ghostbusters… “who ya gonna call?”). The seller may be obliged by law to disclose features of the property that relate to its physical state (termites, weak foundations, leaky pipes, and the like), but revealing potential stigmas is more of a legal grey-area. depending on the nature of the stigma, sellers may choose to hide (or just not mention) them to keep prices high during negotiations. This is risky however; a dissatisfied buyer may opt to take their case to court once the home’s reputation is discovered, imposing an added cost to the seller in the process. The question arises: should sellers be legally required to disclose a property’s adverse intangible qualities?
Affirmative. The court wasn’t saying that the home was actually haunted when they rescinded the sale in the Stambovsky v. Ackley case, only that its reputation had an adverse effect on the value Stambovsky would receive from living there (something Stambovsky wasn’t aware of when he made the deal). Paranormal activities (and the attention they draw) aren’t the only things that cause this. Would you receive as much enjoyment from living in a home after finding out someone committed suicide in the bathroom? Or if a family had been murdered in the sitting room? Or if the kitchen had been used as a meth lab? Or if fanatical religious ceremonies took place in the back garden? Or if the home was frequently burgled or targeted by rapists? Most people would be upset to learn such events took place where they lived. Further, buyers may run into difficulties selling their home later unless they also choose not to disclose these stigmas.
Negative. In the early 1980s, HIV and AIdS began to spread quickly in many parts of the world. At first, very little was understood about this deadly disease. Many of those who contracted the illness were feared, ostracised and discriminated against in their own communities. Although the American Center for disease Control [CdC] had announced in September of 1983 that HIV was not transmitted through casual contact or by contact with surfaces, the anxiety did not dissipate quickly. Laws requiring the disclosure of property stigmas would disadvantage HIV-positive sellers in real estate markets. If they do not inform the buyer of their health status, they may be sued later to have the sale rescinded. If they do reveal their health status, they would likely be forced to accept a lower price (or no sale at all) for their property than HIV-negative sellers even though science proves no danger is present. Is that fair? What about the neighbours of HIV-positive residents? Should they also be obliged to accept unfair prices for their homes? Ideally, laws should encourage enlightened thinking and evidenced-based reason. It may be damaging to social and economic progress if our laws appear to support superstition and irrational biases.
So now we have an interesting conundrum. Should laws ensure that buyers receive the experienced pleasure they pay for or should they ensure that sellers get the price they deserve? In general, it is reasonable to expect sellers to disclose any stigmas that pose a direct and immediate hazard to the buyer. For example, if there was a meth lab on site where chemicals may have leaked into the walls and carpets, or if prowlers have broken into the house on several occasions, the buyer should be notified. It is also reasonable to limit discrimination and support fair sales. A real estate transaction, and any other transaction for that matter, should not depend on a person’s race, religion, background or health status (in fact, housing legislation was amended in the US in 1988 to protect HIV-positive sellers). Spooks, spectres, and gruesome histories are, indeed, less cut-and-dry cases. If you’re a home-buyer who really cares about these things, make sure to ask before the sale is final. A seller or agent concerned about the liability associated with misrepresentation might feel compelled to give you an answer.
REFERENCES AND FURTHER READING
Aids.gov (2013), A timeline of AIdS, available at aids.gov/hiv-aids-basics/hiv-aids-101/aids-timeline/.
S C Edmiston (2010), Secrets worth keeping: Toward a principled basis for stigmatized property disclosure statutes, UCLA Law Review, 58(1), 281-320.
d M Warner (1993), Caveat spiritus: A jurisprudential reflection upon the law of haunted houses and ghosts, Valparaiso University Law Review, 28(1), 207-245.
6 EcoNZ@Otago ISSUE 32
7DEPARTMENT OF ECONOMICS
The economics of propagandaTrent Smith1
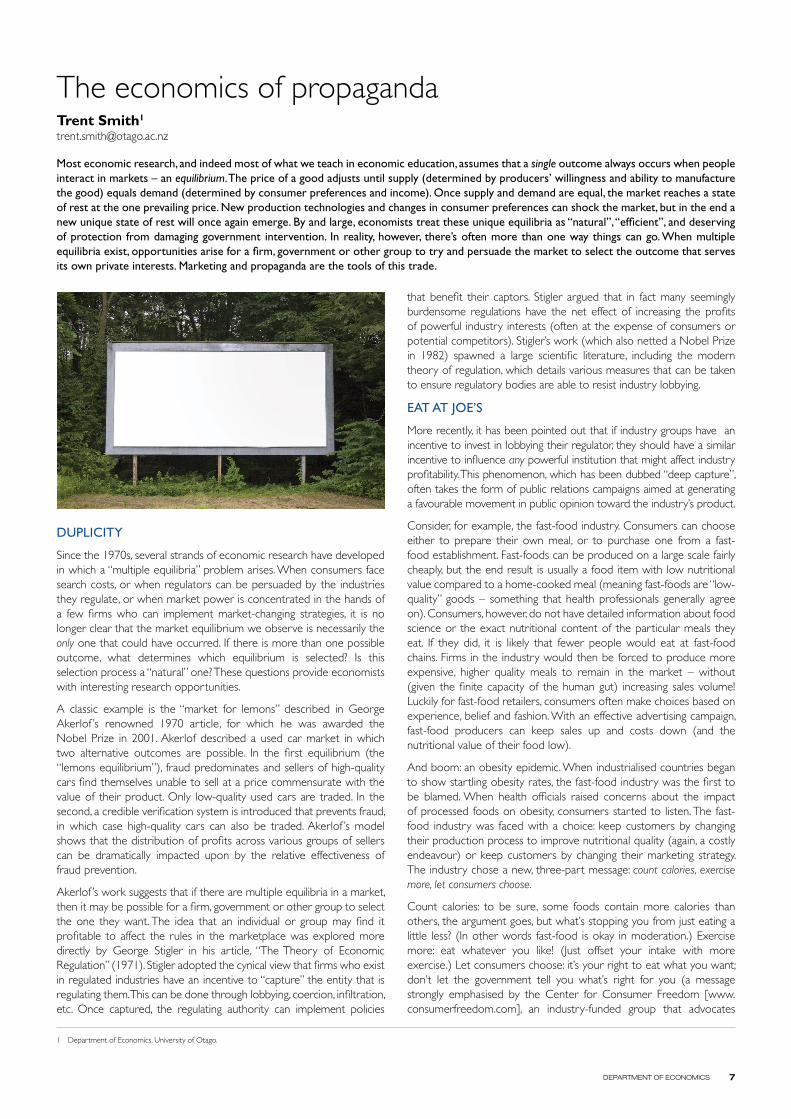
Most economic research, and indeed most of what we teach in economic education, assumes that a single outcome always occurs when people interact in markets – an equilibrium. The price of a good adjusts until supply (determined by producers’ willingness and ability to manufacture the good) equals demand (determined by consumer preferences and income). Once supply and demand are equal, the market reaches a state of rest at the one prevailing price. New production technologies and changes in consumer preferences can shock the market, but in the end a new unique state of rest will once again emerge. By and large, economists treat these unique equilibria as “natural”, “efficient”, and deserving of protection from damaging government intervention. In reality, however, there’s often more than one way things can go. When multiple equilibria exist, opportunities arise for a firm, government or other group to try and persuade the market to select the outcome that serves its own private interests. Marketing and propaganda are the tools of this trade.
DUPLICITY
Since the 1970s, several strands of economic research have developed in which a “multiple equilibria” problem arises. When consumers face search costs, or when regulators can be persuaded by the industries they regulate, or when market power is concentrated in the hands of a few firms who can implement market-changing strategies, it is no longer clear that the market equilibrium we observe is necessarily the only one that could have occurred. If there is more than one possible outcome, what determines which equilibrium is selected? Is this selection process a “natural” one? These questions provide economists with interesting research opportunities.
A classic example is the “market for lemons” described in George Akerlof ’s renowned 1970 article, for which he was awarded the Nobel Prize in 2001. Akerlof described a used car market in which two alternative outcomes are possible. In the first equilibrium (the “lemons equilibrium”), fraud predominates and sellers of high-quality cars find themselves unable to sell at a price commensurate with the value of their product. Only low-quality used cars are traded. In the second, a credible verification system is introduced that prevents fraud, in which case high-quality cars can also be traded. Akerlof ’s model shows that the distribution of profits across various groups of sellers can be dramatically impacted upon by the relative effectiveness of fraud prevention.
Akerlof ’s work suggests that if there are multiple equilibria in a market, then it may be possible for a firm, government or other group to select the one they want. The idea that an individual or group may find it profitable to affect the rules in the marketplace was explored more directly by George Stigler in his article, “The Theory of Economic Regulation” (1971). Stigler adopted the cynical view that firms who exist in regulated industries have an incentive to “capture” the entity that is regulating them. This can be done through lobbying, coercion, infiltration, etc. Once captured, the regulating authority can implement policies
that benefit their captors. Stigler argued that in fact many seemingly burdensome regulations have the net effect of increasing the profits of powerful industry interests (often at the expense of consumers or potential competitors). Stigler’s work (which also netted a Nobel Prize in 1982) spawned a large scientific literature, including the modern theory of regulation, which details various measures that can be taken to ensure regulatory bodies are able to resist industry lobbying.
EAT AT JOE’S
More recently, it has been pointed out that if industry groups have an incentive to invest in lobbying their regulator, they should have a similar incentive to influence any powerful institution that might affect industry profitability. This phenomenon, which has been dubbed “deep capture”, often takes the form of public relations campaigns aimed at generating a favourable movement in public opinion toward the industry’s product.
Consider, for example, the fast-food industry. Consumers can choose either to prepare their own meal, or to purchase one from a fast-food establishment. Fast-foods can be produced on a large scale fairly cheaply, but the end result is usually a food item with low nutritional value compared to a home-cooked meal (meaning fast-foods are “low-quality” goods – something that health professionals generally agree on). Consumers, however, do not have detailed information about food science or the exact nutritional content of the particular meals they eat. If they did, it is likely that fewer people would eat at fast-food chains. Firms in the industry would then be forced to produce more expensive, higher quality meals to remain in the market – without (given the finite capacity of the human gut) increasing sales volume! Luckily for fast-food retailers, consumers often make choices based on experience, belief and fashion. With an effective advertising campaign, fast-food producers can keep sales up and costs down (and the nutritional value of their food low).
And boom: an obesity epidemic. When industrialised countries began to show startling obesity rates, the fast-food industry was the first to be blamed. When health officials raised concerns about the impact of processed foods on obesity, consumers started to listen. The fast-food industry was faced with a choice: keep customers by changing their production process to improve nutritional quality (again, a costly endeavour) or keep customers by changing their marketing strategy. The industry chose a new, three-part message: count calories, exercise more, let consumers choose.
Count calories: to be sure, some foods contain more calories than others, the argument goes, but what’s stopping you from just eating a little less? (In other words fast-food is okay in moderation.) Exercise more: eat whatever you like! (Just offset your intake with more exercise.) Let consumers choose: it’s your right to eat what you want; don’t let the government tell you what’s right for you (a message strongly emphasised by the Center for Consumer Freedom [www.consumerfreedom.com], an industry-funded group that advocates
1 department of Economics, University of Otago.
8 EcoNZ@Otago ISSUE 32
against food regulation of any kind). All three of these messages are designed to shift blame for the obesity epidemic away from the food industry, but all three are, in various ways, misrepresentations of the scientific evidence. The end result: by affecting consumer perception, the global fast-food industry has largely forestalled regulatory intervention while maintaining the “low-nutrition” equilibrium – which happens to be the equilibrium in which their profits are highest.
GENERAL INFLUENCE
Although economic and legal scholarship have only recently begun to consider the impact of for-profit public relations on market outcomes, the methods of propaganda are not new. In fact, it was governments who were the early pioneers of innovations in persuasion. during World War I, President Woodrow Wilson’s administration struggled to garner popular support for US entry into the war. In 1917, the Committee on Public Information was established. The Committee used advertisements, posters, radio, films and speeches (at public events) to influence public opinion. Much of the messaging was literally true, but spun in such a way to present a ‘positive’, upbeat picture of the war (while stirring up ill will toward Germany). The strategy worked; an equilibrium where America provided low effort to the war was avoided, and one where America provided high effort was adopted. After the war, these methods (developed by Edward Bernays and others within the Committee on Public Information) were enthusiastically adopted by industry groups.
Interestingly, many of the early efforts at corporate propaganda in the US focused on economic education. There was concern among the large industrialists of the time that the Bolshevik Revolution in Russia, in conjunction with large inflows of immigrants spawned by World War I, would inspire a movement aimed at strengthening the power of trade unions in America (i.e., an equilibrium in which the balance of power swung away from the capitalists and into the hands of labour). Industry groups such as the National Association of Manufacturers responded with a far-reaching “Americanisation” campaign. This campaign promoted and provided educational materials and programmes for immigrants. Participants received language instruction, but they also learned that core American values included respect for free enterprise and individual freedom, and that capitalism was under threat from “the Reds”. The campaign was enormously successful in weakening trade unions, at least until the Great depression changed public attitudes. A similar campaign was mounted by American commercial interests after World War II, leading some students of economic history to conclude that a deliberate “deep capture” of the public mind generated the anti-communist hysteria of the Cold War – and resulted, again, in a weakened labour movement.
KNOW THY SELF?
Is New Zealand susceptible to deep capture? Edward Bernays, in his classic 1928 book Propaganda, eloquently explained that, like it or not, propaganda is necessary to the functioning of a modern economy: “In theory, everybody buys the best and cheapest commodities offered him on the market,” he wrote. “In practice, if everyone went around pricing, and chemically testing before purchasing, the dozens of soaps or fabrics or brands of bread which are for sale, economic life would become hopelessly jammed. To avoid such confusion, society consents to have its choice narrowed to ideas and objects brought to its attention through propaganda of all kinds.” Bernays, it appears, had discovered the “multiple equlibria” problem five decades before economic theorists worked out the details. As a founding father of the public relations profession, Bernays wrote frequently about the importance of following a publicist’s code of ethics, whereby those engaged in the practice of propaganda would refrain from using their power in ways contrary to the public interest. But what is the public’s interest? Economic theory tells us that there is reason to admire the efficiency of the “market” outcome in the context of a single, unique,
equilibrium. When multiple “market” outcomes are possible, however, there is reason to doubt that society, given a choice, would choose the outcome that maximises private or corporate profits – especially when they come at the expense of the health and well-being of the populace.
Economic theory does, however, tell us something about when to expect deep capture to be a problem. All else equal, a country will be more susceptible to “capture” when its economy is large (thus lending economies of scale to PR and lobbying campaigns), when anti-monopoly enforcement is weak (especially in the media industry), and when the public is unaware of the pecuniary motivations of those spreading the message. New Zealand may have smallness on its side, but we would do well to keep a watchful eye on those whose job it is to keep us informed.
A recent report by Myllylahti (2013) in AUT’s Centre for Journalism, Media and Democracy decried the dramatic “financialisation” of New Zealand media ownership in recent years, with large financial institutions acquiring or maintaining large shares in Sky TV, MediaWorks, APN, and FairFax Media. Meanwhile, public affairs programming has been on the decline, in favour of more entertaining (but less informative) fare such as New Zealand’s Got Talent. On the bright side, New Zealand continues to be known as a haven of press freedom: in the recently published 2013 World Press Freedom Index, we ranked 8th out of 179 countries. For evidence of such, you need look no further than the magazine you hold in your hands.
QUESTIONS TO CONSIDER
1. Can you think of any recent examples where the government (or political groups within the government) has used the media to persuade citizens to take certain actions?
2. When might a firm “choosing an equilibrium” that suits its own interests be good for everyone? (In other words, can you think of an example where a firm’s self-interest does not result in harm, but good for society?)
REFERENCES
G A Akerlof (1970), The market for “lemons”: Quality uncertainty and the market mechanism, The Quarterly Journal of Economics, 84(3), 488-500.
E Bernays (1928), Propaganda, New York: Routledge.A Carey (1995), Taking the Risk Out of Democracy: Corporate Propaganda
versus Freedom and Liberty, Chicago: University of Illinois Press. J Hanson & d Yosifon (2003), The situation: An introduction to the
situational character, critical realism, power economics and deep capture, University of Pennsylvania Law Review, 152(1), 129-346.
d Miller & W dinan (2008), A Century of Spin: How Public Relations Became the Cutting Edge of Corporate Power, London: Pluto Press.
M Myllylahti (2013), JMAD New Zealand Media Ownership Report 2013, available at www.aut.ac.nz/__data/assets/pdf_file/0010/427681/JMAd-2013-Report.pdf
T Smith & A Tasnái (2014), The economics of information, deep capture and the obesity debate, The American Journal of Agricultural Economics, forthcoming.
G J Stigler (1971), The theory of economic regulation, The Bell Journal of Economics and Management Science, 2(1), 3-21.
Wikipedia (2014), Committee on Public Information, available at en.wikipedia.org/wiki/Committee_on_Public_Information.
World Press Freedom Index, available at en.rsf.org/press-freedom-index-2013,1054.html.
9DEPARTMENT OF ECONOMICS
The economics of gender equality and female empowermentDavid Fielding1
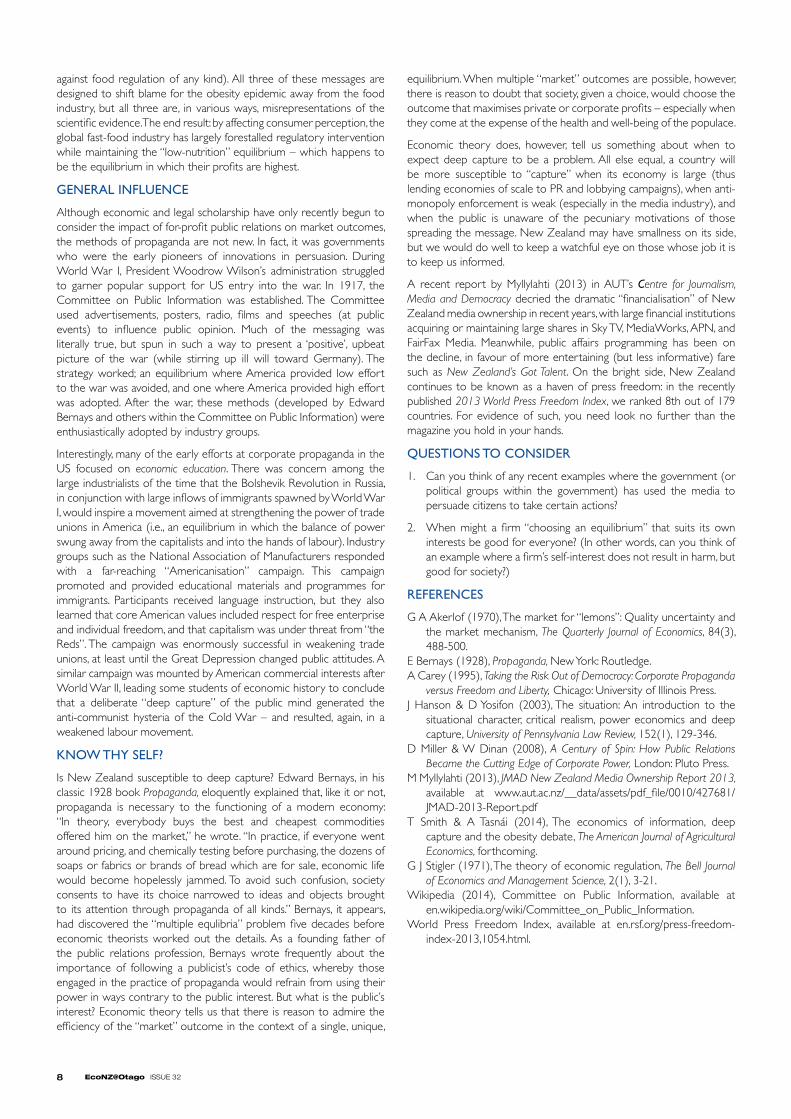
In the 1950s, fewer than 30% of working-age women in New Zealand were in paid employment, compared with around 75% of men. During the next 60 years, the male labour force participation rate remained constant while the female participation rate rose to over 60%. The average hourly female wage is now 86% of the male wage.2 There has been a corresponding increase in the number of women taking senior roles in government and business – and at the University of Otago. Although there is not yet complete gender equality with regard to employment and wages in New Zealand and other OECD countries, the gap has been shrinking steadily over time. It is no longer the case, as it was until very recently, that childbirth necessarily spells the end of a woman’s professional career. Although we have seen enormous changes in the role of women in western society during the past half-century, elsewhere the experience has not been the same.
THE GREAT DIVIDE?
In many low- and medium-income countries, the gender gap appears to be much larger than it is in the western world. For example, female labour force participation in the Middle East is below 25%; in South Asia it is below 35%.3 Why? One potential explanation for this difference is that gender equality and women’s rights are positively associated with certain aspects of social and economic development. For example, more education and improved market performance can increase a nation’s income level. It could be that higher levels of male education lead to a preference for gender equality, or that more competitive markets put pressure on employers to choose the best workers regardless of gender. Hence, we would see less disparity between men and women in richer countries.
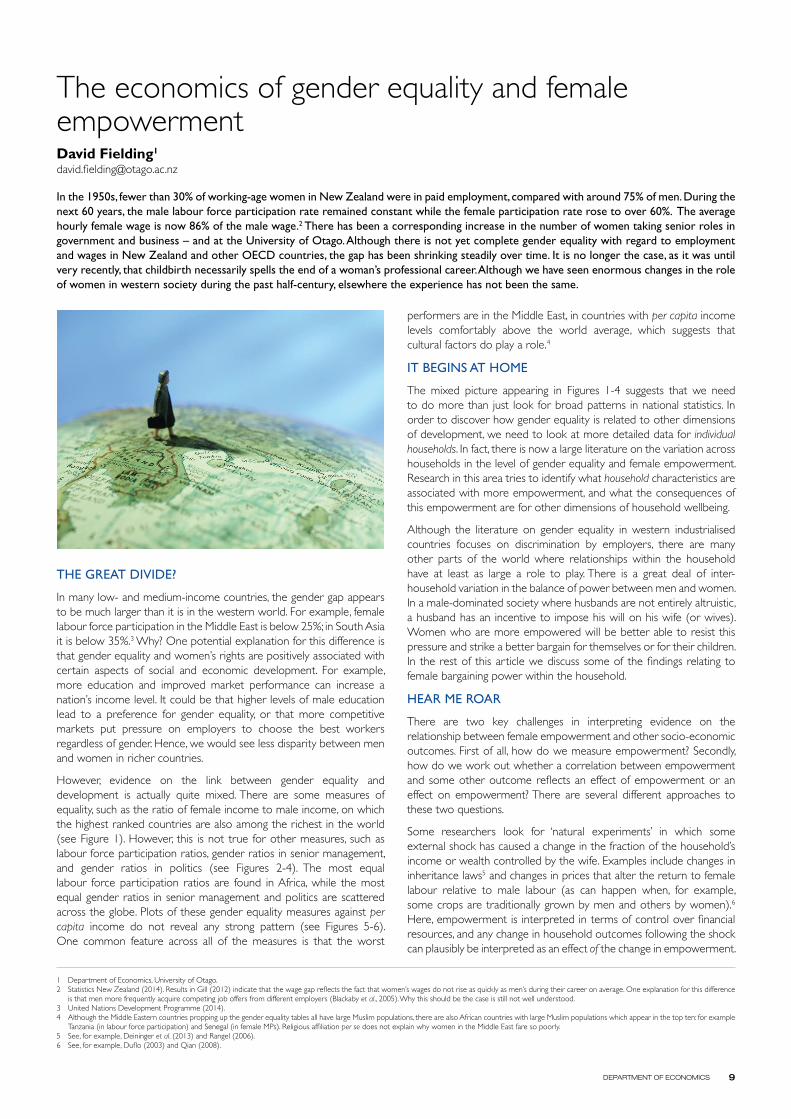
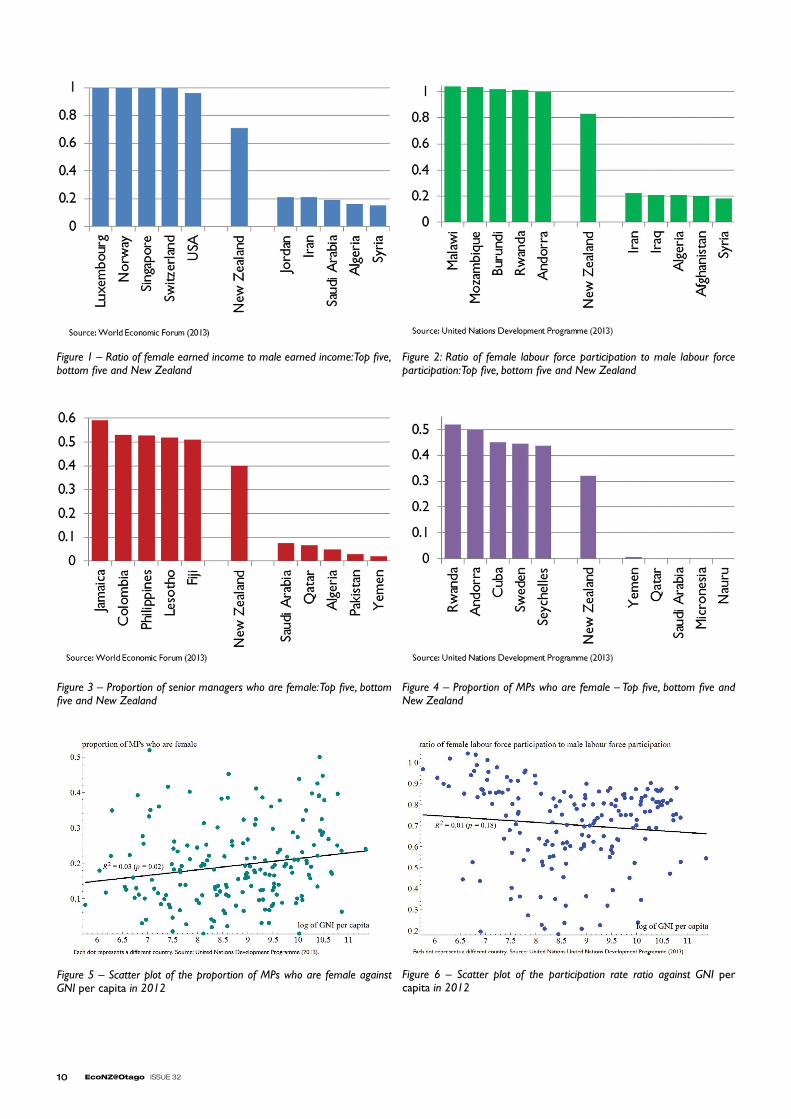
However, evidence on the link between gender equality and development is actually quite mixed. There are some measures of equality, such as the ratio of female income to male income, on which the highest ranked countries are also among the richest in the world (see Figure 1). However, this is not true for other measures, such as labour force participation ratios, gender ratios in senior management, and gender ratios in politics (see Figures 2-4). The most equal labour force participation ratios are found in Africa, while the most equal gender ratios in senior management and politics are scattered across the globe. Plots of these gender equality measures against per capita income do not reveal any strong pattern (see Figures 5-6). One common feature across all of the measures is that the worst
performers are in the Middle East, in countries with per capita income levels comfortably above the world average, which suggests that cultural factors do play a role.4
IT BEGINS AT HOME
The mixed picture appearing in Figures 1-4 suggests that we need to do more than just look for broad patterns in national statistics. In order to discover how gender equality is related to other dimensions of development, we need to look at more detailed data for individual households. In fact, there is now a large literature on the variation across households in the level of gender equality and female empowerment. Research in this area tries to identify what household characteristics are associated with more empowerment, and what the consequences of this empowerment are for other dimensions of household wellbeing.
Although the literature on gender equality in western industrialised countries focuses on discrimination by employers, there are many other parts of the world where relationships within the household have at least as large a role to play. There is a great deal of inter-household variation in the balance of power between men and women. In a male-dominated society where husbands are not entirely altruistic, a husband has an incentive to impose his will on his wife (or wives). Women who are more empowered will be better able to resist this pressure and strike a better bargain for themselves or for their children. In the rest of this article we discuss some of the findings relating to female bargaining power within the household.
HEAR ME ROAR
There are two key challenges in interpreting evidence on the relationship between female empowerment and other socio-economic outcomes. First of all, how do we measure empowerment? Secondly, how do we work out whether a correlation between empowerment and some other outcome reflects an effect of empowerment or an effect on empowerment? There are several different approaches to these two questions.
Some researchers look for ‘natural experiments’ in which some external shock has caused a change in the fraction of the household’s income or wealth controlled by the wife. Examples include changes in inheritance laws5 and changes in prices that alter the return to female labour relative to male labour (as can happen when, for example, some crops are traditionally grown by men and others by women).6
Here, empowerment is interpreted in terms of control over financial resources, and any change in household outcomes following the shock can plausibly be interpreted as an effect of the change in empowerment.
1 department of Economics, University of Otago.2 Statistics New Zealand (2014). Results in Gill (2012) indicate that the wage gap reflects the fact that women’s wages do not rise as quickly as men’s during their career on average. One explanation for this difference
is that men more frequently acquire competing job offers from different employers (Blackaby et al., 2005). Why this should be the case is still not well understood.3 United Nations development Programme (2014).4 Although the Middle Eastern countries propping up the gender equality tables all have large Muslim populations, there are also African countries with large Muslim populations which appear in the top ten: for example Tanzania (in labour force participation) and Senegal (in female MPs). Religious affiliation per se does not explain why women in the Middle East fare so poorly.5 See, for example, deininger et al. (2013) and Rangel (2006).6 See, for example, duflo (2003) and Qian (2008).
10 EcoNZ@Otago ISSUE 32
Figure 2: Ratio of female labour force participation to male labour force participation: Top five, bottom five and New Zealand
Figure 3 – Proportion of senior managers who are female: Top five, bottom five and New Zealand
Figure 4 – Proportion of MPs who are female – Top five, bottom five and New Zealand
Figure 5 – Scatter plot of the proportion of MPs who are female against GNI per capita in 2012
Figure 6 – Scatter plot of the participation rate ratio against GNI per capita in 2012
Figure 1 – Ratio of female earned income to male earned income: Top five, bottom five and New Zealand
11DEPARTMENT OF ECONOMICS
One common finding of this type of research is that, holding household income constant, shocks that raise a woman’s control over this income lead to improvements in child education or health. This suggests that the average mother values expenditure on children more than the average father, and that the amount spent on them is (at least implicitly) a consequence of bargaining within the household.
Other researchers conduct field experiments in which some households in a village are randomly chosen to receive a cash donation. The researchers then introduce some random variation in the share of the donation given directly to the husband and the share given directly to the wife. Again, a common finding is that increasing the wife’s control over resources improves child outcomes, everything else being equal.7
In this experimental literature, we infer from an outcome (such as an improvement in child health) how the bargaining power of women changes when women’s income relative to men’s changes. The actual bargaining is not measured, nor is the size of the change in women’s empowerment or how much her preferences differ from her husband’s (both of which affect the end result). An alternative approach taken by some researchers is to construct a direct measure of women’s empowerment using survey questions. For example, the researcher can ask a woman whether she makes important decisions about expenditure on consumer durables, healthcare or education; or does her husband decide; or do they share the decisions? Alternatively, one can ask how much personal autonomy the woman has: can she leave the house without her husband’s permission – always, sometimes, or never? It is then possible to estimate whether the responses to such questions are correlated with other household outcomes. This approach is commonly employed in epidemiology where researchers have found strong correlations with outcomes such as access to antenatal care, child nutrition, and vaccination against infectious diseases.8
One potential drawback of this approach is that it can be difficult to infer a causal effect from the correlation between empowerment and other household outcomes. For example, empowerment could improve women’s health by allowing them to make better choices, or alternatively better health could facilitate women’s empowerment by enabling wives to stand up to their husbands. In order to estimate the effect of empowerment on other outcomes it is necessary to find a statistical instrument: some characteristic that affects empowerment directly but influences other relevant outcomes only through its effect on empowerment. As in any other area of economics, selecting one of these instruments can be highly contentious and somewhat subjective.
One potential instrument is ethnic diversity. In many parts of the world, there is natural variation in the level of ethnic diversity across towns and villages. This variation is often a consequence of complexity in the migration patterns of different ethnic groups hundreds of years ago. There is no obvious reason why diversity should have a direct effect on household characteristics (such as the health of women and their children) but the experience of diversity is known to influence social attitudes. For example, Clingingsmith et al. (2009) find that Pakistanis who are successful in the lottery for visas9 to make the Hajj (an Islamic pilgrimage to Mecca) return from their international trip with more liberal attitudes not only towards other races but also towards women. One recent paper that uses diversity as an instrument for empowerment is Fielding and Lépine (2013). Using household survey data collected from villages in northern Senegal, a strong correlation is found between the level of ethnic diversity in a village and female empowerment as measured in the ways described in the previous paragraph.10 (There is considerable variation in the level of empowerment, from households where women are as free as those in western countries to others where all decisions are made by the husband.) Using ethnic diversity as an instrument, the authors estimate that a large fraction of the observed variation in women’s physical and mental health is due to the variation in empowerment.
THE RIGHT WAY TO LOOK AT IT
If there is evidence at the household level that empowerment raises the welfare of women, why do Figures 6-7 show no strong correlation at the national level between empowerment and per capita income, which is the variable most often used by economists to measure a country’s level of development? One potential explanation is that women’s wellbeing is not strongly correlated with household income at all. Consider the following quotation from Perry’s (2005) ethnographic study of Senegal:
‘Although her husband is the richest man in the village, Ndey proclaimed that she would rather be in her sister’s marriage to a poor farmer than in her own to a rich man. Another woman observed, “Those without money [are] the ones who take best care of their wives.”’
If this is an accurate reflection of the lives of women in developing countries, then per capita income might not be such a good measure of development after all.
REFERENCES
J R Behrman & J Hoddinott (2005), Programme evaluation with unobserved heterogeneity and selective implementation: The Mexican PROGRESA impact on child nutrition, Oxford Bulletin of Economics and Statistics, 67(4), 547-569.
d Blackaby, A L Booth & J Frank (2005), Outside offers and the gender pay gap: Empirical evidence from the UK academic labour market, Economic Journal, 115(501), F81-F107.
G J Bobonis (2009), Is the allocation of resources within the household efficient? New evidence from a randomized experiment, Journal of Political Economy, 117(3), 453-503.
d Clingingsmith, A I Khwaja & M Kremer (2009), Estimating the impact of the Hajj: Religion and tolerance in Islam’s global gathering, Quarterly Journal of Economics, 124(3), 1133-1170.
K deininger, A Goyal & H Nagarajan (2013), Women’s inheritance rights and intergenerational transmission of resources in India. Journal of Human Resources, 48(1), 114-141.
E duflo (2003), Grandmothers and granddaughters: Old-age pensions and intra-household allocation in South Africa, World Bank Economic Review, 17(1), 1-25.
d Fielding & A Lépine (2013), Female empowerment and wellbeing: Evidence from Africa, Mimeo, department of Economics, University of Otago.
M Furuta & S Salway (2006), Women’s position within the household as a determinant of maternal health care use in Nepal, International Family Planning Perspectives, 32(1), 17-27.
P Gill (2012), Employer learning and statistical discrimination in the New Zealand labour market, MBus dissertation, department of Economics, University of Otago.
P Maitra (2004), Parental bargaining, health inputs and child mortality in India, Journal of Health Economics, 23(2), 259-291.
d L Perry (2005), Wolof women, economic liberalization, and the crisis of masculinity in rural Senegal, Ethnology, 44(3), 207-226.
N Qian (2008), Missing women and the price of tea in China: The effect of sex-specific earnings on sex imbalance, Quarterly Journal of Economics, 123(3), 1251-1285.
M A Rangel (2006), Alimony rights and intrahousehold allocation of resources: Evidence from Brazil, Economic Journal, 116(513), 627-658.
Statistics New Zealand (2014), Infoshare, available at www.stats.gov.nz/infoshare.
United Nations development Programme (2014), Human Development Indicators, available at www.data.undp.org.
World Economic Forum (2013), Global Gender Gap Report, available at www.weforum.org/issues/global-gender-gap.
7 See, for example, Behrman and Hoddinott (2005) and Bobonis (2009). 8 See, for example, Furuta and Salway (2006) and Maitra (2004).9 Note, this is an example of a natural experiment.10 It is important that the different ethnic groups – in this case Fula and Wolof – live peacefully together. This approach would be unlikely to work when there was ethnic tension.
12 EcoNZ@Otago ISSUE 32
HIgHLIgHTS G4M3RS B3W4RE… PWNED BY F4RM3RS
Some people have little spare time but lots of resources, while other people have lots of free time but few resources. If those with an abundance of time offer to do a task or two for the rich-and-busy in exchange for some of the resources they lack, then everyone can be made better off. The ‘employer’ gains more leisure time while the ‘labourer’ gains access to more goods. This is the basic mechanism behind labour markets where services are traded in exchange for wages.
When thinking about labour markets, economists often conjure images of overalled workers punching time clocks, heading to their spot on the assembly line, performing their prescribed duties as goods roll down the conveyor belt, then returning home at the end of the work day with paycheck in hand. This factory-based idea of employment is still relevant in today’s world, but the factory itself is transforming into something new. To find one of these employment environments, we can look to the job markets of Azeroth.
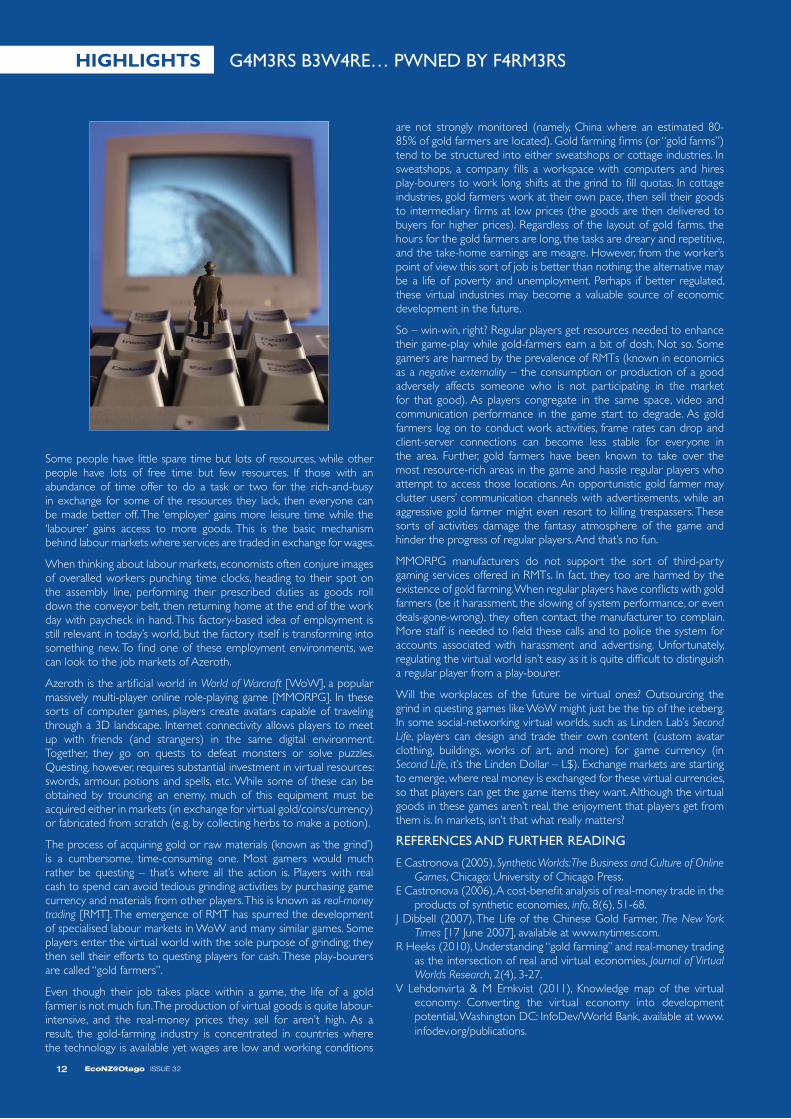
Azeroth is the artificial world in World of Warcraft [WoW], a popular massively multi-player online role-playing game [MMORPG]. In these sorts of computer games, players create avatars capable of traveling through a 3d landscape. Internet connectivity allows players to meet up with friends (and strangers) in the same digital environment. Together, they go on quests to defeat monsters or solve puzzles. Questing, however, requires substantial investment in virtual resources: swords, armour, potions and spells, etc. While some of these can be obtained by trouncing an enemy, much of this equipment must be acquired either in markets (in exchange for virtual gold/coins/currency) or fabricated from scratch (e.g. by collecting herbs to make a potion).
The process of acquiring gold or raw materials (known as ‘the grind’) is a cumbersome, time-consuming one. Most gamers would much rather be questing – that’s where all the action is. Players with real cash to spend can avoid tedious grinding activities by purchasing game currency and materials from other players. This is known as real-money trading [RMT]. The emergence of RMT has spurred the development of specialised labour markets in WoW and many similar games. Some players enter the virtual world with the sole purpose of grinding; they then sell their efforts to questing players for cash. These play-bourers are called “gold farmers”.
Even though their job takes place within a game, the life of a gold farmer is not much fun. The production of virtual goods is quite labour-intensive, and the real-money prices they sell for aren’t high. As a result, the gold-farming industry is concentrated in countries where the technology is available yet wages are low and working conditions
are not strongly monitored (namely, China where an estimated 80-85% of gold farmers are located). Gold farming firms (or “gold farms”) tend to be structured into either sweatshops or cottage industries. In sweatshops, a company fills a workspace with computers and hires play-bourers to work long shifts at the grind to fill quotas. In cottage industries, gold farmers work at their own pace, then sell their goods to intermediary firms at low prices (the goods are then delivered to buyers for higher prices). Regardless of the layout of gold farms, the hours for the gold farmers are long, the tasks are dreary and repetitive, and the take-home earnings are meagre. However, from the worker’s point of view this sort of job is better than nothing; the alternative may be a life of poverty and unemployment. Perhaps if better regulated, these virtual industries may become a valuable source of economic development in the future.
So – win-win, right? Regular players get resources needed to enhance their game-play while gold-farmers earn a bit of dosh. Not so. Some gamers are harmed by the prevalence of RMTs (known in economics as a negative externality – the consumption or production of a good adversely affects someone who is not participating in the market for that good). As players congregate in the same space, video and communication performance in the game start to degrade. As gold farmers log on to conduct work activities, frame rates can drop and client-server connections can become less stable for everyone in the area. Further, gold farmers have been known to take over the most resource-rich areas in the game and hassle regular players who attempt to access those locations. An opportunistic gold farmer may clutter users’ communication channels with advertisements, while an aggressive gold farmer might even resort to killing trespassers. These sorts of activities damage the fantasy atmosphere of the game and hinder the progress of regular players. And that’s no fun.
MMORPG manufacturers do not support the sort of third-party gaming services offered in RMTs. In fact, they too are harmed by the existence of gold farming. When regular players have conflicts with gold farmers (be it harassment, the slowing of system performance, or even deals-gone-wrong), they often contact the manufacturer to complain. More staff is needed to field these calls and to police the system for accounts associated with harassment and advertising. Unfortunately, regulating the virtual world isn’t easy as it is quite difficult to distinguish a regular player from a play-bourer.
Will the workplaces of the future be virtual ones? Outsourcing the grind in questing games like WoW might just be the tip of the iceberg. In some social-networking virtual worlds, such as Linden Lab’s Second Life, players can design and trade their own content (custom avatar clothing, buildings, works of art, and more) for game currency (in Second Life, it’s the Linden dollar – L$). Exchange markets are starting to emerge, where real money is exchanged for these virtual currencies, so that players can get the game items they want. Although the virtual goods in these games aren’t real, the enjoyment that players get from them is. In markets, isn’t that what really matters?
REFERENCES AND FURTHER READING
E Castronova (2005), Synthetic Worlds: The Business and Culture of Online Games, Chicago: University of Chicago Press.
E Castronova (2006), A cost-benefit analysis of real-money trade in the products of synthetic economies, info, 8(6), 51-68.
J dibbell (2007), The Life of the Chinese Gold Farmer, The New York Times [17 June 2007], available at www.nytimes.com.
R Heeks (2010), Understanding “gold farming” and real-money trading as the intersection of real and virtual economies, Journal of Virtual Worlds Research, 2(4), 3-27.
V Lehdonvirta & M Ernkvist (2011), Knowledge map of the virtual economy: Converting the virtual economy into development potential, Washington dC: Infodev/World Bank, available at www.infodev.org/publications.
12 EcoNZ@Otago ISSUE 32
13DEPARTMENT OF ECONOMICS
Shaking things up: The regional effects of the Canterbury earthquakes on productivity and tourismEvan Miller1 & Christopher Hajzler1
[email protected]; [email protected]
Between 2010 and 2011, the Canterbury region was shaken (both literally and psychologically) by a large number of high-intensity earthquakes. These earthquakes laid waste to New Zealand’s second largest city in a fashion not seen since the 1931 Hawke’s Bay earthquake. The damage caused to infrastructure and physical capital was extensive, further pushing down the recession-stricken New Zealand economy. In this article we quantify the effects for productivity and output in the Canterbury region, with particular attention to tourism.
COULDA, WOULDA, SHOULDA
Estimating the full economic consequences of events like the Canterbury Earthquake helps citizens and policy makers better prepare for future natural disasters of similar magnitude and scope. This requires knowledge of not only the direct damages, but also the broader economic repercussions of these damages (or indirect losses).2
Indirect losses include all losses that are not provoked by the disaster itself, but by its consequences. These arise when utilities such as water, power and sewerage are damaged. Such damages disrupt businesses and households, leading to reduced production and consumption. Many economists believe that these losses tend to be a large multiple of direct damages due to flow-on effects throughout the economy.3 Furthermore, depending on the severity of the main event and the subsequent aftershocks, productive human and physical capital may gradually leave the affected area in an attempt to relocate to a safer environment. This compounds such losses over time.
The recent literature has employed different approaches to quantifying the impacts of natural disasters. Many of these studies focus on several large earthquakes over the past few decades. For example, Cavallo, Powell and Becerra (2010), Mazzocchi and Montini (2001), and Okuyama (2002) use econometric models to assess the effects of major earthquakes in Haiti (2010), Umbria, Italy (1999) and Kobe, Japan (1995), respectively. For the analysis to accurately measure the earthquake’s true impact, one of two approaches is typically taken. One way is to look at similar events in other parts of the world using detailed historical data on the damages associated with different natural disasters. Another way is to compare the effects of the earthquake to a counterfactual: what the state of things would have been had no earthquake occurred. doing this typically relies on extensive time-series data prior to the earthquake to make out-of-sample forecasts for the region. The forecasts then serve as the counterfactual.
We can construct a counterfactual in other ways. For example, Lynham and Noy (2012), duPont and Noy (2012) and Cavallo, Galiani, Noy, and Pantano (2013) apply the “synthetic control group methodology” developed by Abadie and Gardeazabal (2003) to the analysis of natural disasters. This is a data-driven procedure that constructs a counterfactual in the absence of earthquakes using unexposed regions. To do this for Canterbury, we first select several similar regions that were unaffected by the quake. We then attempt to “recreate” each quantifiable characteristic of interest in Canterbury by forming a weighted average of the same characteristic in the unaffected regions. To find the right weights, we minimise the difference between this average and the characteristic in Canterbury before the earthquake. We then use the weights and the post-quake data for the unaffected regions to construct a post-quake average. This average serves as the “Synthetic Canterbury”. The difference between Synthetic Canterbury and the real post-quake Canterbury (“Treated Canterbury”) provides an estimate of the full costs of the earthquake.
The advantage of this approach is that it does not require a large amount of regional time-series data for the outcome variables of interest (which would be necessary for obtaining reliable counterfactuals using the “forecasting method” described above). Moreover, the evolution of many economic outcomes will partially reflect the global recession which worsened around the time of the earthquake; these would be missing in the “forecasting method” because the full effects of the recession would be absent from the pre-quake data used to form the counterfactual. This approach also does not require a large number of untreated comparison regions, provided the regions making up the synthetic control are truly unaffected by the disaster.4 However, if indirect costs associated with the earthquake spill over to any of the control regions that are assigned a positive weight in the synthetic control, this would affect the estimates that we obtain for Canterbury.5
ANOTHER DAY, ANOTHER DOLLAR
We can use the “synthetic control group method” to examine the impact of the earthquake on regional real GdP per capita, a standard measure of average income and welfare. Natural disasters reduce income through loss of infrastructure and capital, which are key inputs into production, and through the diversion of labour and disruption of daily productive activities. In estimating the weights for the control regions that make up synthetic Canterbury, regions that are most similar to Canterbury in terms of GdP per capita and related variables prior to the earthquake receive the largest weight. These variables include consents for new buildings, regional male and female labour force participation rates, population per km2 and lagged GdP. Synthetic Canterbury is comprised of Auckland (with a weight of 19.8%), Waikato (33.3%), Bay of Plenty (0.4%) and Manawatu, Wanganui and Taranaki (46.5%). The potential set of synthetic controls is restricted to North Island regions to minimise the likelihood that control regions are also affected by the earthquake through spillover effects.
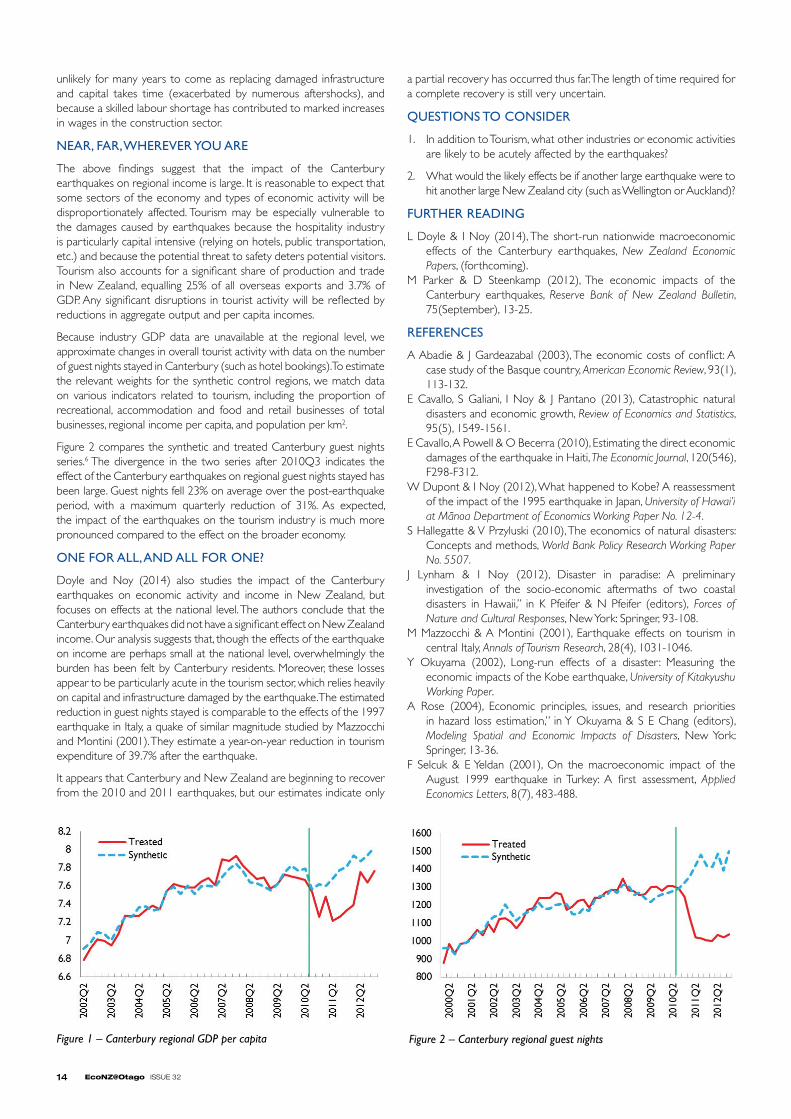
Figure 1 compares GdP per capita between Synthetic and Treated Canterbury (i.e. the real Canterbury). Prior to the first earthquake in the 3rd quarter of 2010, Synthetic Canterbury tracks observed values quite closely, indicating that Synthetic Canterbury accurately reflects Treated Canterbury. The economic downturn corresponding to the great financial crisis beginning in 2008 is also visible. Following the earthquake, we observe substantial divergence between the two series.
As the synthetic series predicts the trajectory of Canterbury GdP per capita had the region not been exposed to the earthquake and takes into account factors that affect all regions (such as the financial crisis), the difference between the series is entirely attributed to the effect of the earthquakes. This difference amounts to a 4.3% average reduction in per capita GdP over the post-earthquake period, with a maximum quarterly reduction of 7.5%. The start of the recovery is marked by the second quarter of 2012, reflecting in part the beginning of Christchurch rebuild efforts. However, a complete recovery is
1 department of Economics, University of Otago.2 See Hallegatte and Przyluski (2010).3 See Rose (2004).4 The validity of this approach also relies on the fact that the timing of large sudden natural disasters is an exogenous event.5 For example, if production and tourism are diverted away from Canterbury to other regions in New Zealand, a positive spillover effect would result and the estimated effects in our analysis would be exaggerated. 6 Synthetic Canterbury is comprised of Auckland (83.1%), Wellington (16.1%) and Bay of Plenty (0.8%).
14 EcoNZ@Otago ISSUE 32
unlikely for many years to come as replacing damaged infrastructure and capital takes time (exacerbated by numerous aftershocks), and because a skilled labour shortage has contributed to marked increases in wages in the construction sector.
NEAR, FAR, WHEREVER YOU ARE
The above findings suggest that the impact of the Canterbury earthquakes on regional income is large. It is reasonable to expect that some sectors of the economy and types of economic activity will be disproportionately affected. Tourism may be especially vulnerable to the damages caused by earthquakes because the hospitality industry is particularly capital intensive (relying on hotels, public transportation, etc.) and because the potential threat to safety deters potential visitors. Tourism also accounts for a significant share of production and trade in New Zealand, equalling 25% of all overseas exports and 3.7% of GdP. Any significant disruptions in tourist activity will be reflected by reductions in aggregate output and per capita incomes.
Because industry GdP data are unavailable at the regional level, we approximate changes in overall tourist activity with data on the number of guest nights stayed in Canterbury (such as hotel bookings). To estimate the relevant weights for the synthetic control regions, we match data on various indicators related to tourism, including the proportion of recreational, accommodation and food and retail businesses of total businesses, regional income per capita, and population per km2.
Figure 2 compares the synthetic and treated Canterbury guest nights series.6 The divergence in the two series after 2010Q3 indicates the effect of the Canterbury earthquakes on regional guest nights stayed has been large. Guest nights fell 23% on average over the post-earthquake period, with a maximum quarterly reduction of 31%. As expected, the impact of the earthquakes on the tourism industry is much more pronounced compared to the effect on the broader economy.
ONE FOR ALL, AND ALL FOR ONE?
doyle and Noy (2014) also studies the impact of the Canterbury earthquakes on economic activity and income in New Zealand, but focuses on effects at the national level. The authors conclude that the Canterbury earthquakes did not have a significant effect on New Zealand income. Our analysis suggests that, though the effects of the earthquake on income are perhaps small at the national level, overwhelmingly the burden has been felt by Canterbury residents. Moreover, these losses appear to be particularly acute in the tourism sector, which relies heavily on capital and infrastructure damaged by the earthquake. The estimated reduction in guest nights stayed is comparable to the effects of the 1997 earthquake in Italy, a quake of similar magnitude studied by Mazzocchi and Montini (2001). They estimate a year-on-year reduction in tourism expenditure of 39.7% after the earthquake.
It appears that Canterbury and New Zealand are beginning to recover from the 2010 and 2011 earthquakes, but our estimates indicate only
a partial recovery has occurred thus far. The length of time required for a complete recovery is still very uncertain.
QUESTIONS TO CONSIDER
1. In addition to Tourism, what other industries or economic activities are likely to be acutely affected by the earthquakes?
2. What would the likely effects be if another large earthquake were to hit another large New Zealand city (such as Wellington or Auckland)?
FURTHER READING
L doyle & I Noy (2014), The short-run nationwide macroeconomic effects of the Canterbury earthquakes, New Zealand Economic Papers, (forthcoming).
M Parker & d Steenkamp (2012), The economic impacts of the Canterbury earthquakes, Reserve Bank of New Zealand Bulletin, 75(September), 13-25.
REFERENCES
A Abadie & J Gardeazabal (2003), The economic costs of conflict: A case study of the Basque country, American Economic Review, 93(1), 113-132.
E Cavallo, S Galiani, I Noy & J Pantano (2013), Catastrophic natural disasters and economic growth, Review of Economics and Statistics, 95(5), 1549-1561.
E Cavallo, A Powell & O Becerra (2010), Estimating the direct economic damages of the earthquake in Haiti, The Economic Journal, 120(546), F298-F312.
W dupont & I Noy (2012), What happened to Kobe? A reassessment of the impact of the 1995 earthquake in Japan, University of Hawai’i at Mänoa Department of Economics Working Paper No. 12-4.
S Hallegatte & V Przyluski (2010), The economics of natural disasters: Concepts and methods, World Bank Policy Research Working Paper No. 5507.
J Lynham & I Noy (2012), disaster in paradise: A preliminary investigation of the socio-economic aftermaths of two coastal disasters in Hawaii,” in K Pfeifer & N Pfeifer (editors), Forces of Nature and Cultural Responses, New York: Springer, 93-108.
M Mazzocchi & A Montini (2001), Earthquake effects on tourism in central Italy, Annals of Tourism Research, 28(4), 1031-1046.
Y Okuyama (2002), Long-run effects of a disaster : Measuring the economic impacts of the Kobe earthquake, University of Kitakyushu Working Paper.
A Rose (2004), Economic principles, issues, and research priorities in hazard loss estimation,” in Y Okuyama & S E Chang (editors), Modeling Spatial and Economic Impacts of Disasters, New York: Springer, 13-36.
F Selcuk & E Yeldan (2001), On the macroeconomic impact of the August 1999 earthquake in Turkey: A first assessment, Applied Economics Letters, 8(7), 483-488.
Figure 1 – Canterbury regional GDP per capita Figure 2 – Canterbury regional guest nights
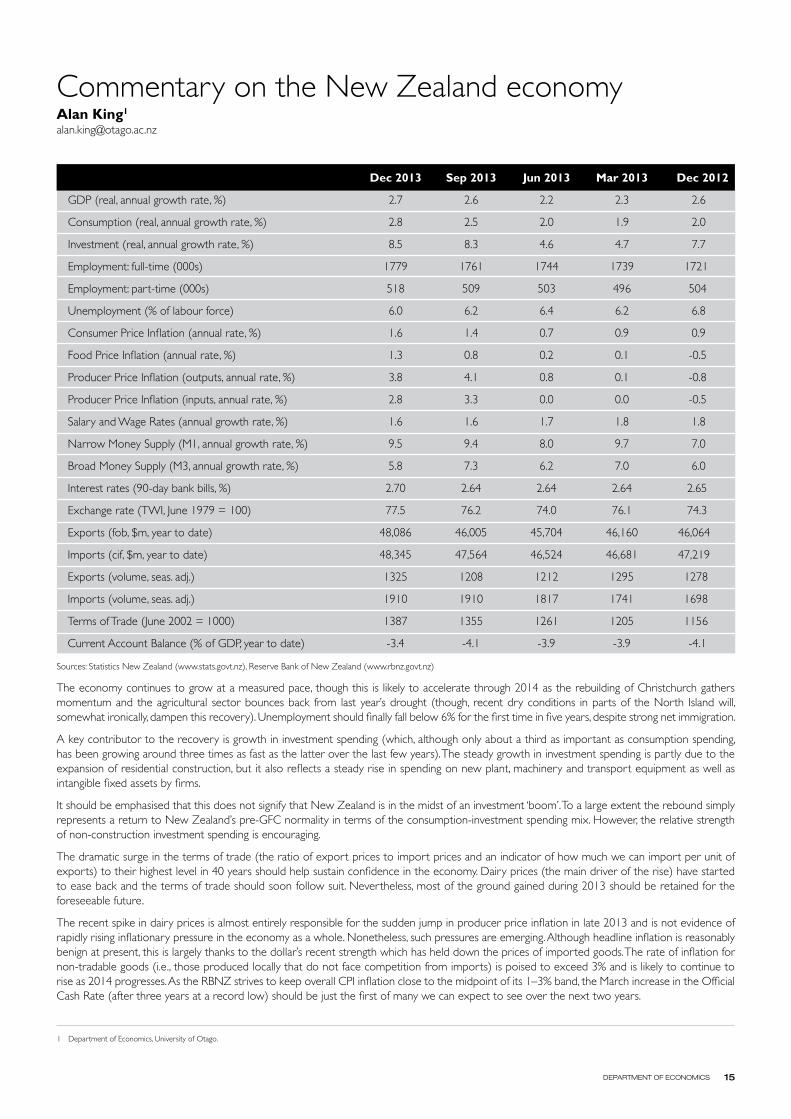
15DEPARTMENT OF ECONOMICS
Commentary on the New Zealand economyAlan King1
Dec 2013 Sep 2013 Jun 2013 Mar 2013 Dec 2012
GdP (real, annual growth rate, %) 2.7 2.6 2.2 2.3 2.6
Consumption (real, annual growth rate, %) 2.8 2.5 2.0 1.9 2.0
Investment (real, annual growth rate, %) 8.5 8.3 4.6 4.7 7.7
Employment: full-time (000s) 1779 1761 1744 1739 1721
Employment: part-time (000s) 518 509 503 496 504
Unemployment (% of labour force) 6.0 6.2 6.4 6.2 6.8
Consumer Price Inflation (annual rate, %) 1.6 1.4 0.7 0.9 0.9
Food Price Inflation (annual rate, %) 1.3 0.8 0.2 0.1 -0.5
Producer Price Inflation (outputs, annual rate, %) 3.8 4.1 0.8 0.1 -0.8
Producer Price Inflation (inputs, annual rate, %) 2.8 3.3 0.0 0.0 -0.5
Salary and Wage Rates (annual growth rate, %) 1.6 1.6 1.7 1.8 1.8
Narrow Money Supply (M1, annual growth rate, %) 9.5 9.4 8.0 9.7 7.0
Broad Money Supply (M3, annual growth rate, %) 5.8 7.3 6.2 7.0 6.0
Interest rates (90-day bank bills, %) 2.70 2.64 2.64 2.64 2.65
Exchange rate (TWI, June 1979 = 100) 77.5 76.2 74.0 76.1 74.3
Exports (fob, $m, year to date) 48,086 46,005 45,704 46,160 46,064
Imports (cif, $m, year to date) 48,345 47,564 46,524 46,681 47,219
Exports (volume, seas. adj.) 1325 1208 1212 1295 1278
Imports (volume, seas. adj.) 1910 1910 1817 1741 1698
Terms of Trade (June 2002 = 1000) 1387 1355 1261 1205 1156
Current Account Balance (% of GdP, year to date) -3.4 -4.1 -3.9 -3.9 -4.1
Sources: Statistics New Zealand (www.stats.govt.nz), Reserve Bank of New Zealand (www.rbnz.govt.nz)
The economy continues to grow at a measured pace, though this is likely to accelerate through 2014 as the rebuilding of Christchurch gathers momentum and the agricultural sector bounces back from last year’s drought (though, recent dry conditions in parts of the North Island will, somewhat ironically, dampen this recovery). Unemployment should finally fall below 6% for the first time in five years, despite strong net immigration.
A key contributor to the recovery is growth in investment spending (which, although only about a third as important as consumption spending, has been growing around three times as fast as the latter over the last few years). The steady growth in investment spending is partly due to the expansion of residential construction, but it also reflects a steady rise in spending on new plant, machinery and transport equipment as well as intangible fixed assets by firms.
It should be emphasised that this does not signify that New Zealand is in the midst of an investment ‘boom’. To a large extent the rebound simply represents a return to New Zealand’s pre-GFC normality in terms of the consumption-investment spending mix. However, the relative strength of non-construction investment spending is encouraging.
The dramatic surge in the terms of trade (the ratio of export prices to import prices and an indicator of how much we can import per unit of exports) to their highest level in 40 years should help sustain confidence in the economy. dairy prices (the main driver of the rise) have started to ease back and the terms of trade should soon follow suit. Nevertheless, most of the ground gained during 2013 should be retained for the foreseeable future.
The recent spike in dairy prices is almost entirely responsible for the sudden jump in producer price inflation in late 2013 and is not evidence of rapidly rising inflationary pressure in the economy as a whole. Nonetheless, such pressures are emerging. Although headline inflation is reasonably benign at present, this is largely thanks to the dollar’s recent strength which has held down the prices of imported goods. The rate of inflation for non-tradable goods (i.e., those produced locally that do not face competition from imports) is poised to exceed 3% and is likely to continue to rise as 2014 progresses. As the RBNZ strives to keep overall CPI inflation close to the midpoint of its 1–3% band, the March increase in the Official Cash Rate (after three years at a record low) should be just the first of many we can expect to see over the next two years.
1 department of Economics, University of Otago.
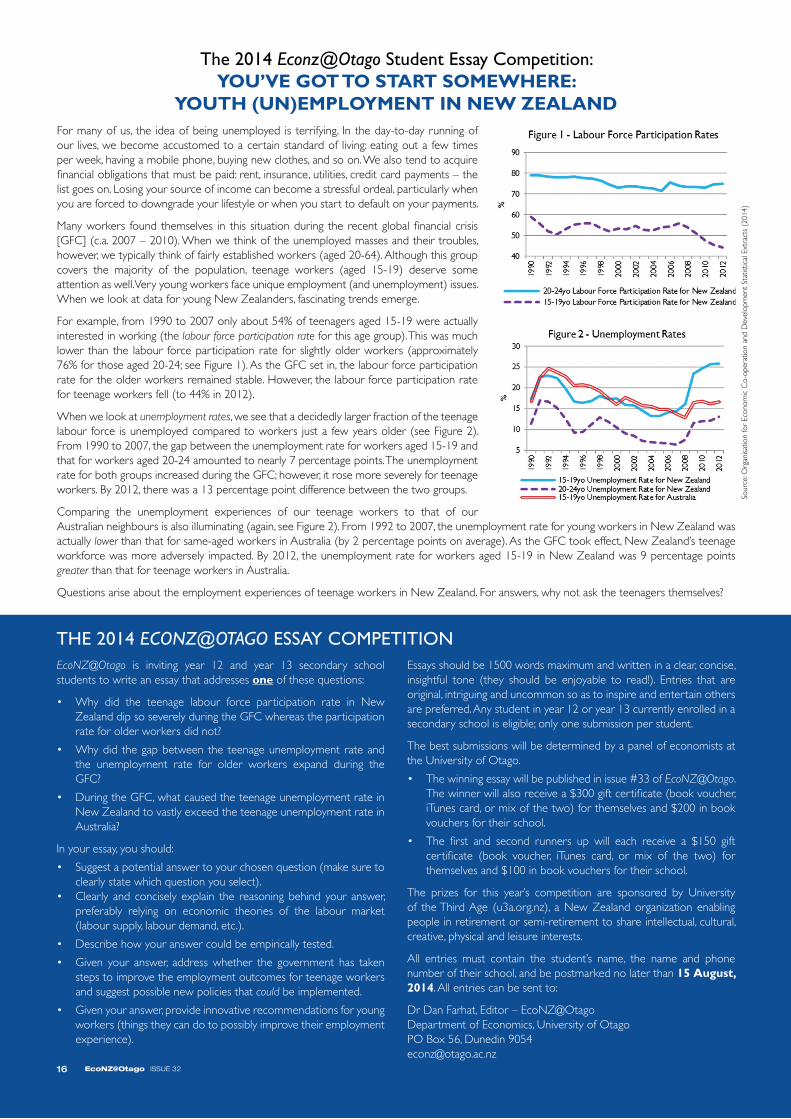
16 EcoNZ@Otago ISSUE 32
The 2014 Econz@Otago Student Essay Competition:yOU’vE gOT TO START SOMEwHERE:
yOUTH (UN)EMPLOyMENT IN NEw ZEALANDFor many of us, the idea of being unemployed is terrifying. In the day-to-day running of our lives, we become accustomed to a certain standard of living: eating out a few times per week, having a mobile phone, buying new clothes, and so on. We also tend to acquire financial obligations that must be paid: rent, insurance, utilities, credit card payments – the list goes on. Losing your source of income can become a stressful ordeal, particularly when you are forced to downgrade your lifestyle or when you start to default on your payments.
Many workers found themselves in this situation during the recent global financial crisis [GFC] (c.a. 2007 – 2010). When we think of the unemployed masses and their troubles, however, we typically think of fairly established workers (aged 20-64). Although this group covers the majority of the population, teenage workers (aged 15-19) deserve some attention as well. Very young workers face unique employment (and unemployment) issues. When we look at data for young New Zealanders, fascinating trends emerge.
For example, from 1990 to 2007 only about 54% of teenagers aged 15-19 were actually interested in working (the labour force participation rate for this age group). This was much lower than the labour force participation rate for slightly older workers (approximately 76% for those aged 20-24; see Figure 1). As the GFC set in, the labour force participation rate for the older workers remained stable. However, the labour force participation rate for teenage workers fell (to 44% in 2012).
When we look at unemployment rates, we see that a decidedly larger fraction of the teenage labour force is unemployed compared to workers just a few years older (see Figure 2). From 1990 to 2007, the gap between the unemployment rate for workers aged 15-19 and that for workers aged 20-24 amounted to nearly 7 percentage points. The unemployment rate for both groups increased during the GFC; however, it rose more severely for teenage workers. By 2012, there was a 13 percentage point difference between the two groups.
Comparing the unemployment experiences of our teenage workers to that of our Australian neighbours is also illuminating (again, see Figure 2). From 1992 to 2007, the unemployment rate for young workers in New Zealand was actually lower than that for same-aged workers in Australia (by 2 percentage points on average). As the GFC took effect, New Zealand’s teenage workforce was more adversely impacted. By 2012, the unemployment rate for workers aged 15-19 in New Zealand was 9 percentage points greater than that for teenage workers in Australia.
Questions arise about the employment experiences of teenage workers in New Zealand. For answers, why not ask the teenagers themselves?
EcoNZ@Otago is inviting year 12 and year 13 secondary school students to write an essay that addresses one of these questions:
• Why did the teenage labour force participation rate in NewZealand dip so severely during the GFC whereas the participation rate for older workers did not?
• Whydidthegapbetweentheteenageunemploymentrateandthe unemployment rate for older workers expand during the GFC?
• DuringtheGFC,whatcausedtheteenageunemploymentrateinNew Zealand to vastly exceed the teenage unemployment rate in Australia?
In your essay, you should:
• Suggestapotentialanswertoyourchosenquestion(makesuretoclearly state which question you select).
• Clearly and concisely explain the reasoningbehind your answer,preferably relying on economic theories of the labour market (labour supply, labour demand, etc.).
• Describehowyouranswercouldbeempiricallytested.
• Given your answer, address whether the government has takensteps to improve the employment outcomes for teenage workers and suggest possible new policies that could be implemented.
• Givenyouranswer,provideinnovativerecommendationsforyoungworkers (things they can do to possibly improve their employment experience).
Essays should be 1500 words maximum and written in a clear, concise, insightful tone (they should be enjoyable to read!). Entries that are original, intriguing and uncommon so as to inspire and entertain others are preferred. Any student in year 12 or year 13 currently enrolled in a secondary school is eligible; only one submission per student.
The best submissions will be determined by a panel of economists at the University of Otago.
• Thewinningessaywillbepublishedinissue#33ofEcoNZ@Otago. The winner will also receive a $300 gift certificate (book voucher, iTunes card, or mix of the two) for themselves and $200 in book vouchers for their school.
• The first and second runners up will each receive a $150 giftcertificate (book voucher, iTunes card, or mix of the two) for themselves and $100 in book vouchers for their school.
The prizes for this year’s competition are sponsored by University of the Third Age (u3a.org.nz), a New Zealand organization enabling people in retirement or semi-retirement to share intellectual, cultural, creative, physical and leisure interests.
All entries must contain the student’s name, the name and phone number of their school, and be postmarked no later than 15 August, 2014. All entries can be sent to:
dr dan Farhat, Editor – EcoNZ@Otagodepartment of Economics, University of OtagoPO Box 56, dunedin [email protected]
THE 2014 ECONZ@OTaGO ESSAY COMPETITION
16 EcoNZ@Otago ISSUE 32
Sour
ce: O
rgan
isatio
n fo
r Ec
onom
ic C
o-op
erat
ion
and
dev
elop
men
t St
atist
ical
Ext
ract
s (2
014)