Embed Size (px)
Citation preview

April 2017
Economy WatchMonitoring India’s macro-fiscalperformance

Economy Watch: April 2017 2
Contents
1 New WPI and IIP Series: significant implications for inflation and growth .................................... 4
2 Growth: PMI indicates slower recovery ....................................................................................... 5
3 Inflation: falling food price inflation pushes CPI inflation downward ........................................... 6
4 Fiscal performance: CGA indicates that the Government would meet fiscal deficit target for
FY17 .......................................................................................................................................... 7
5 India: Comparative Economic Prospects up to FY20 ................................................................... 9
6 In focus: FRBM Review Committee — proposing a new fiscal framework .................................... 11
7 Money and finance: bank credit growth for FY17 remains well below its trend .......................... 14
8 Merchandise Exports: continued high growth ............................................................................ 16
9 Global economy: global growth projected at 3.5% in 2017; structural impediments hold back
stronger recovery ..................................................................................................................... 17
10 Index of aggregate demand: moderates in March 2017 ............................................................. 19
11 Appendix: capturing macro-fiscal trends................................................................................... 20
Prepared by Macro-fiscal Unit, Policy Advisory Group, EY IndiaD. K. Srivastava, Chief Policy Advisor, EY: [email protected] Bharadwaj, Manager, EY: [email protected] Kapur, Senior Consultant, EY: [email protected] Trehan, Consultant, EY: [email protected]

Economy Watch: April 2017 3
Highlights1. The US Fed, in its April
2017 Review, has kept theFederal Funds Rateunchanged.
2. The FRBM ReviewCommittee hasrecommended ceilings of60% of GDP for generalgovernment and 40% of GDPfor the Center.
3. Annual CPI inflationdecreased to 3.0% in April2017 due to a sharp fall infood price inflation.
4. The base year of WPI and IIPseries have been revised to2011-12 from 2004-05,reflecting changes incommodity composition andthe weighting structure.
5. Taking into account theavailable information up tillFebruary 2017, the targetfor tax revenues appearsachievable. Non-taxrevenues may, however,miss the FY17 target.
6. The Government may meetthe 3.5% fiscal deficit targetas per the revisedestimates. However, therevenue deficit target islikely to be missed.
7. The Center’s capitalexpenditure contracted by(-) 1.5% during April-February FY17.
8. Merchandise exports grewat 27.6% in March 2017, thehighest rate in the last fiveyears, as compared to 17.5%in the previous month.
9. Fortnightly data indicatesthat bank credit growth haddecreased to 4.3% by end-April 2017 as compared to5.7% in the previousfortnight due to a significantfall in the growth of non-foodcredit.
10.FDI and FPI net inflows havemoved in oppositedirections. There was asudden surge in FPI inflowsin March 2017, but FDIinflows are at their lowestsince February 2014.
Foreword: Recommendations of the FRBM reviewcommittee: A 21st Century Fiscal Framework
The FRBM Review Committee’s four-volume report, which ithad submitted just a week before the presentation of the FY18Budget, has now been shared with the public. Entitled“Responsible Growth: A Debt and Fiscal Framework for 21stCentury India,” the report contains a number ofrecommendations by the Review Committee. It suggests thatthe current FRBMA (2003) should be replaced by a new DebtManagement and Fiscal Responsibility Act, 2017. Under thisnew Act, the guidance provided by the fiscal deficit ceiling of3% of GDP under the FRBM Rules (2004) should be given up.
Instead, ceilings of debt-GDP ratio are prescribed at 60% for the general government,that is, the combined debt of the Center and the states and 40% for the CentralGovernment. By implication, the states’ debt-GDP anchor is 20%.The ReviewCommittee specifies a path of adjustment of fiscal deficit and revenue deficit for aperiod of 6 years up to FY23. This path implies that the fiscal deficit of the Center becontained at 2.5% of GDP and that the revenue deficit be gradually reduced to 0.8% ofGDP by FY23. Further, the Review Committee suggests a new set of “escape clauses”aimed at providing a countercyclical role to fiscal policy. In order to provide aninstitutional support to fiscal policy, the constitution of a “Fiscal Council” has alsobeen suggested. The report of the Review Committee has led to an extensive ongoingdebate on its merits and demerits. This month’s In-Focus write-up summarizes thisdebate.
Among other important policy initiatives, the Central Government has at last startedto work on an action plan to resolve the long-standing problem of banks’ non-performing assets (NPAs). This plan involves public sector firms taking over some ofthe NPAs and allowing banks to take some necessary “haircuts,” that is, bearing partof the losses. The actual details are to be worked out by specific “overseeingcommittees.”
News emanating from the Ministry of Finance also augurs well for India’s roadinfrastructure. The ambitious National Highways Development Programme (NHDP),which includes such prestigious projects as the Golden Quadrilateral and the East-WestCorridor, would be brought to a close in six months’ time. At its closure, the NHDPwould have added 50,000 kilometers to India’s road network. The new program,named Bharatmala aims to add about 20,000 kilometers of roads. Bharatmala aims tolay a road network in all the border areas and provide road connectivity among alldistrict headquarters and to far-flung rural and remote areas, including tribal andbackward areas. The required investments are to be largely financed through MasalaBonds subscribed to by foreign investors. The Government is also considering “buyand operate” models for private investors for government-owned assets.
Another initiative being considered is the advancement of the presentation of theBudget. The FY18 Budget was presented on 1 February 2017, enabling the release offunds for the Government’s capital spending early in April 2017. A January 2018Budget presentation is being considered for FY19. Eventually, this should lead to asynchronization of the fiscal year to the calendar year. State governments are alsoinclined to move in this direction. The Madhya Pradesh government has alreadyannounced its decision to move to a January-December financial year.
After 6 months of demonetization, currency in circulation is nearly 80% of itsNovember 8 level. The pace of re-monetization has slowed down as demand forcurrency may have become less than its pre-demonetization level due to increase indigital transactions. If so, one long-term impact of demonetization for India would bestabilization at a lower currency to GDP ratio. Pre-demonetization, it was close to 12%.At present, it is 9.4%.According to available information, 10 states have by now passed the GST bill.
D.K. Srivastava,Chief Policy Advisor, EY India
Economy Watch: April 2017 4
Highlights of New WPI and IIP Series
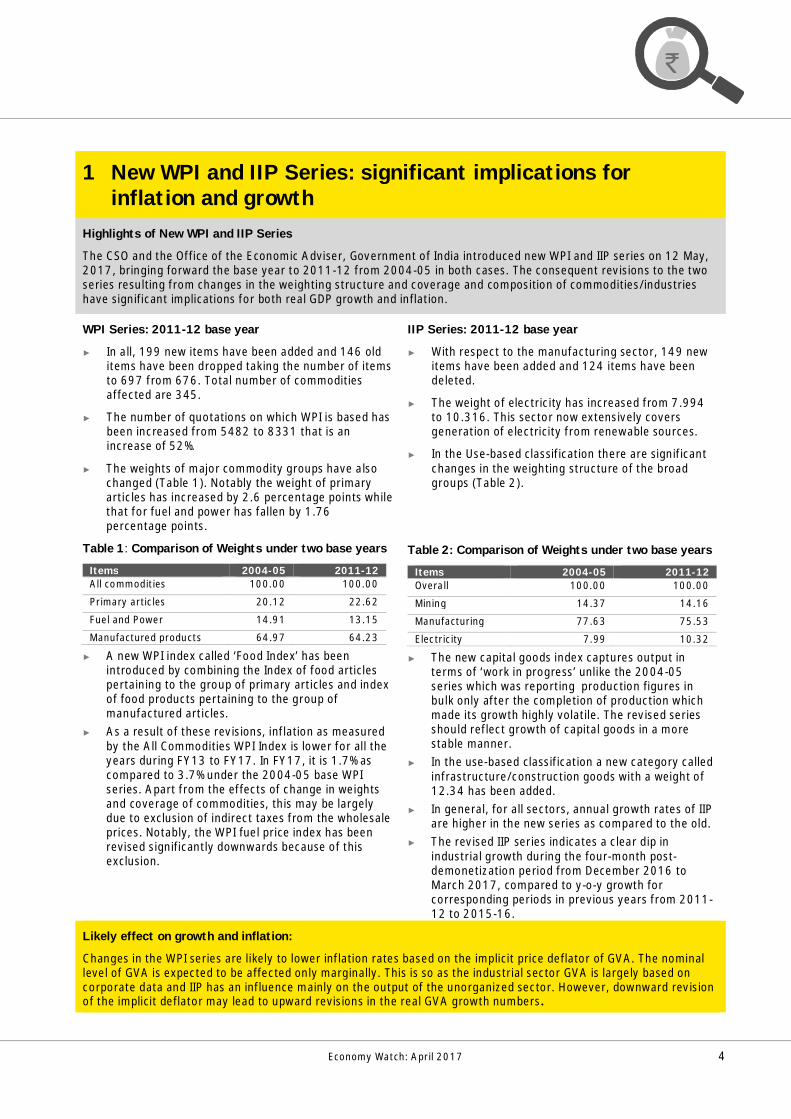
The CSO and the Office of the Economic Adviser, Government of India introduced new WPI and IIP series on 12 May,2017, bringing forward the base year to 2011-12 from 2004-05 in both cases. The consequent revisions to the twoseries resulting from changes in the weighting structure and coverage and composition of commodities/industrieshave significant implications for both real GDP growth and inflation.
WPI Series: 2011-12 base year
► In all, 199 new items have been added and 146 olditems have been dropped taking the number of itemsto 697 from 676. Total number of commoditiesaffected are 345.
► The number of quotations on which WPI is based hasbeen increased from 5482 to 8331 that is anincrease of 52%.
► The weights of major commodity groups have alsochanged (Table 1). Notably the weight of primaryarticles has increased by 2.6 percentage points whilethat for fuel and power has fallen by 1.76percentage points.
Table 1: Comparison of Weights under two base years
Items 2004-05 2011-12All commodities 100.00 100.00
Primary articles 20.12 22.62
Fuel and Power 14.91 13.15
Manufactured products 64.97 64.23
► A new WPI index called ‘Food Index’ has beenintroduced by combining the Index of food articlespertaining to the group of primary articles and indexof food products pertaining to the group ofmanufactured articles.
► As a result of these revisions, inflation as measuredby the All Commodities WPI Index is lower for all theyears during FY13 to FY17. In FY17, it is 1.7% ascompared to 3.7% under the 2004-05 base WPIseries. Apart from the effects of change in weightsand coverage of commodities, this may be largelydue to exclusion of indirect taxes from the wholesaleprices. Notably, the WPI fuel price index has beenrevised significantly downwards because of thisexclusion.
IIP Series: 2011-12 base year
► With respect to the manufacturing sector, 149 newitems have been added and 124 items have beendeleted.
► The weight of electricity has increased from 7.994to 10.316. This sector now extensively coversgeneration of electricity from renewable sources.
► In the Use-based classification there are significantchanges in the weighting structure of the broadgroups (Table 2).
Table 2: Comparison of Weights under two base years
Items 2004-05 2011-12Overall 100.00 100.00
Mining 14.37 14.16
Manufacturing 77.63 75.53
Electricity 7.99 10.32
► The new capital goods index captures output interms of ‘work in progress’ unlike the 2004-05series which was reporting production figures inbulk only after the completion of production whichmade its growth highly volatile. The revised seriesshould reflect growth of capital goods in a morestable manner.
► In the use-based classification a new category calledinfrastructure/construction goods with a weight of12.34 has been added.
► In general, for all sectors, annual growth rates of IIPare higher in the new series as compared to the old.
► The revised IIP series indicates a clear dip inindustrial growth during the four-month post-demonetization period from December 2016 toMarch 2017, compared to y-o-y growth forcorresponding periods in previous years from 2011-12 to 2015-16.
Likely effect on growth and inflation:
Changes in the WPI series are likely to lower inflation rates based on the implicit price deflator of GVA. The nominallevel of GVA is expected to be affected only marginally. This is so as the industrial sector GVA is largely based oncorporate data and IIP has an influence mainly on the output of the unorganized sector. However, downward revisionof the implicit deflator may lead to upward revisions in the real GVA growth numbers.
1 New WPI and IIP Series: significant implications forinflation and growth

Economy Watch: April 2017 5
A. Industrial growth: IIP growth improved in March 2017
Based on the new 2011-12 base IIP series, for the fiscal year as a whole, overall IIP grew at its fastestpace of 5.0% in FY17 as compared to 3.4% in FY16.
► IIP growth (with 2011-12 as base) improved marginally to 2.7% in March 2017 from 1.9% in February. As per thenew IIP series, for the fiscal year as a whole, overall IIP grew at its fastest pace of 5.0% in FY17 as compared to 3.4%in FY16.
► The manufacturing sector, which accounts for over 77% of the overall IIP, grew at a relatively fast pace of 4.9% inFY17 as compared to 3.0% in FY16.
► As per use-based industrial classification, output of capital goods industry contracted at a slower pace of (-) 1.0% inMarch 2017 as compared to (-) 3.1% in February 2017 whereas output of consumer durables contracted by (-) 0.8%.Output growth of infrastructure/construction goods marginally improved to 0.8% in March 2017.
Chart 1: IIP growth (% y-o-y)
Source: Office of the Economic Adviser, Ministry ofCommerce and Industry
Chart 2: NIKKEI PMI
Source: NIKKEI PMI, Markit Economics
B. PMI: signals a slowing down of growth in services in April 2017
PMI has remained at its March level for manufacturing but has fallen for services, indicating a slowingdown of services in April 2017.
► Headline manufacturing PMI (sa) remained above the threshold of 50 for the fourth consecutive month in April 2017,matching the March reading of 52.5 (Chart 2). Slower growth in output, stocks of purchases and employment wasoffset by stronger growth of new orders and lengthening of delivery times.
► Headline services PMI (sa) declined to 50.2 in April 2017 from 51.5 in March. Although expansion has been registeredfor three consecutive months, the April 2017 reading was the lowest in this period.
► Composite PMI Output Index (sa) declined to 51.3 in April from 52.3 in March 2017, reflecting the slower growth inservices.
-5
-2
1
4
7
10
Mar
15
May
15
Jul1
5
Sep
15
Nov
15
Jan
16
Mar
16
May
16
Jul1
6
Sep
16
Nov
16
Jan
17
Mar
17
IIP (overall)
42444648505254565860
Apr
13
Jul1
3
Oct
13
Jan
14
Apr
14
Jul1
4
Oct
14
Jan
15
Apr
15
Jul1
5
Oct
15
Jan
16
Apr
16
Jul1
6
Oct
16
Jan
17
Apr
17
PMI (mfg.) PMI (ser.) Benchmark
2 Growth: PMI indicates slower recovery
Economy Watch: April 2017 6
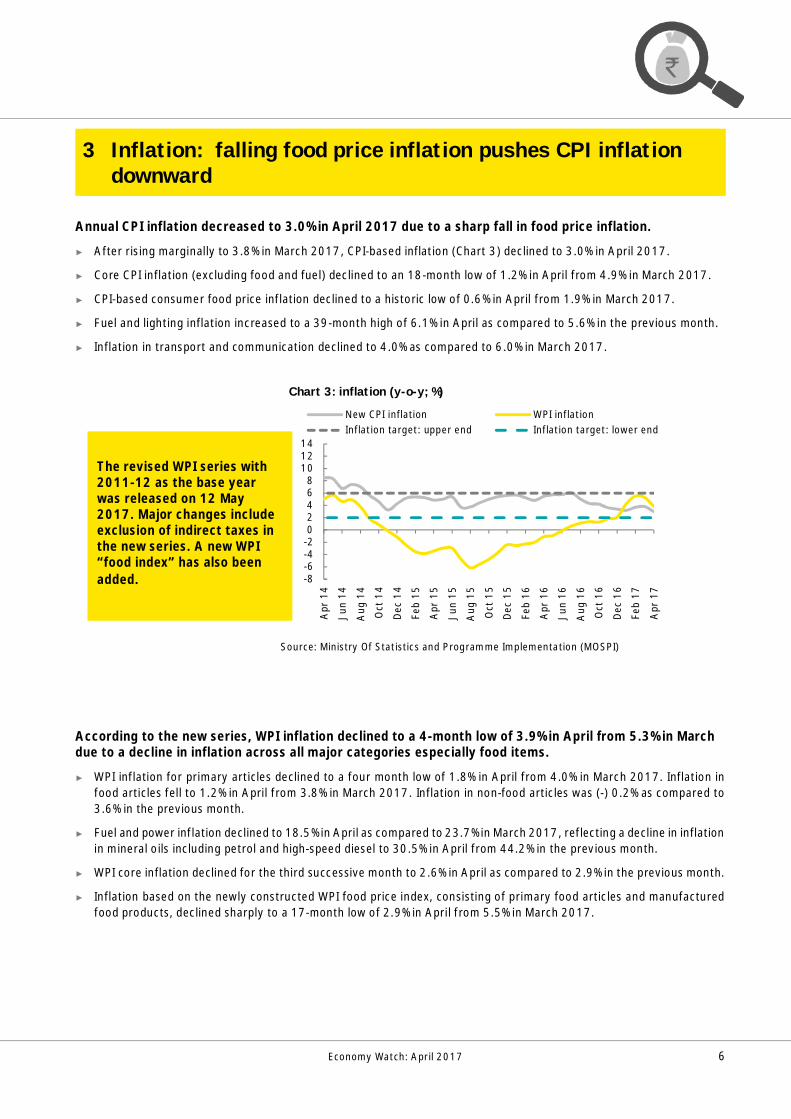
Annual CPI inflation decreased to 3.0% in April 2017 due to a sharp fall in food price inflation.
► After rising marginally to 3.8% in March 2017, CPI-based inflation (Chart 3) declined to 3.0% in April 2017.
► Core CPI inflation (excluding food and fuel) declined to an 18-month low of 1.2% in April from 4.9% in March 2017.
► CPI-based consumer food price inflation declined to a historic low of 0.6% in April from 1.9% in March 2017.
► Fuel and lighting inflation increased to a 39-month high of 6.1% in April as compared to 5.6% in the previous month.
► Inflation in transport and communication declined to 4.0% as compared to 6.0% in March 2017.
Chart 3: inflation (y-o-y; %)
Source: Ministry Of Statistics and Programme Implementation (MOSPI)
According to the new series, WPI inflation declined to a 4-month low of 3.9% in April from 5.3% in Marchdue to a decline in inflation across all major categories especially food items.
► WPI inflation for primary articles declined to a four month low of 1.8% in April from 4.0% in March 2017. Inflation infood articles fell to 1.2% in April from 3.8% in March 2017. Inflation in non-food articles was (-) 0.2% as compared to3.6% in the previous month.
► Fuel and power inflation declined to 18.5% in April as compared to 23.7% in March 2017, reflecting a decline in inflationin mineral oils including petrol and high-speed diesel to 30.5% in April from 44.2% in the previous month.
► WPI core inflation declined for the third successive month to 2.6% in April as compared to 2.9% in the previous month.
► Inflation based on the newly constructed WPI food price index, consisting of primary food articles and manufacturedfood products, declined sharply to a 17-month low of 2.9% in April from 5.5% in March 2017.
-8-6-4-202468
101214
Apr
14
Jun
14
Aug
14
Oct
14
Dec
14
Feb
15
Apr
15
Jun
15
Aug
15
Oct
15
Dec
15
Feb
16
Apr
16
Jun
16
Aug
16
Oct
16
Dec
16
Feb
17
Apr
17
New CPI inflation WPI inflationInflation target: upper end Inflation target: lower end
3 Inflation: falling food price inflation pushes CPI inflationdownward
The revised WPI series with2011-12 as the base yearwas released on 12 May2017. Major changes includeexclusion of indirect taxes inthe new series. A new WPI“food index” has also beenadded.

Economy Watch: April 2017 7
A. Tax and non-tax revenues
Taking into account the available information up till February 2017, the target for tax revenues as perthe revised estimates for FY17 appears achievable. However, non-tax revenues may fall short of theannual target.
► Growth in cumulated gross tax revenues was at 17.6% during April—February FY17. For realizing the revisedestimate for FY17, a growth of 14.9% is required in March 2017 over March 2016, which seems manageable.However, this is much higher than the corresponding value of 4.5% in the previous fiscal.
► Income tax revenues grew by 20.9% during April—February, while growth in corporation tax revenues remainedsluggish at 3.5% during April—February FY17. For realizing the revised estimate of revenues from income tax andcorporation tax for FY17, growth of 29.2% and 24%, respectively, is required in March 2017 over March 2016.
► Union excise duties witnessed a strong growth of 40.3% during April—February FY17, and a growth of 14.5% isrequired in March 2017 over March 2016 to achieve the FY17 revised estimate. Growth in service tax revenues was21.3% during April—February FY17.
► Growth in customs duties remained sluggish at 5.2% during April—February FY17. However, the FY17 revisedestimate for customs duties revenue at INR 2,17,000 crore is likely to be met.
► As per the latest available information1, tax collections have been more than the FY17 revised estimates. Directtaxes were at 100% of the annual revised estimate for FY17, while indirect taxes were at 101.3%. Overall taxcollections stood at 107.6% of the annual revised estimate for FY17.
Table 3: trends in tax and non-tax revenuesin %
ItemApril-February FY17over April-FebruaryFY16
Growth required in MarchFY17 over March FY16 tomeet the FY17 RE
Actual growth in MarchFY16 over March FY15
Revenue receipts 15.5 32.8 -13.1Gross taxes 17.6 14.9 4.5Direct tax 10.5 25.1 -3.5Corporation tax 3.5 24.0 -4.9Personal income tax 20.9 29.2 -0.8Indirect tax 23.4 1.9 20.9Customs duties 5.2 -20.4 -19.6Union excise duties 40.3 14.5 32.3Service tax 21.3 -0.4 23.9Non-tax revenue -1.1 214.7 21.0
Source (Basic Data): Monthly Accounts, Controller General of Accounts, Government of India, Union Budget for FY18
► Non-tax revenues contracted by (-) 1.1% during April—February FY17. For realizing the revised estimate of non-taxrevenues for FY17, a growth of 214.7% is required in March 2017 over the corresponding period of FY16. Thecorresponding growth value was only 21% in the previous year.
► Disinvestment receipts stood at INR46,246.5 crore for FY17. Thus, the revised estimate of INR45, 500 crore forFY17 as given in the Union Budget FY18 has been met.
1 http://pib.nic.in/newsite/erelease.aspx
4 Fiscal performance: CGA indicates that the Governmentwould meet fiscal deficit target for FY17

Economy Watch: April 2017 8
B. Expenditures: revenue and capital► Total expenditure grew by 12.7% during April—February FY17, and a growth of 11.3% is required in March 2017
over March 2016 to achieve the FY17 revised estimate.
► Growth in revenue expenditure was 15% during April—February FY17, reflecting the impact of salary and pensionrevisions based on the recommendations of the 7th Pay Commission.
► The Center’s capital expenditure contracted by (-) 1.5% during April—February. For realizing the revised estimate forFY17, capital expenditure must increase by 85.8% during the last month of FY17 over the corresponding period ofFY16 as compared to the corresponding value of (-) 4.4% in the previous fiscal (Table 4).
The Center’s capital expenditure contracted by (-) 1.5% during April–February FY17. To meet theFY17 revised estimate for capital expenditure a growth of 86% is required in the last month of FY17over the corresponding period of FY16.
Table 4: trends in expenditures (in %)
Item April–FebruaryFY17 over April–February FY16
Growth required in MarchFY17 over March FY16to meet the FY17 RE
Realized growth in March FY16over March FY15
Revenue expenditure 15.0 -1.8 19.3
Capital expenditure -1.5 85.8 -4.4
Total expenditure 12.7 11.3 15.1
Source (Basic Data): Monthly Accounts, Controller General of Accounts, Government of India, Union Budget for FY18
C. Fiscal imbalance► The Center’s fiscal deficit stood at 113.4% of the annual revised target during April—February FY17 (Table 5).
Despite subdued revenues from non-tax sources, it is expected that the Center would be able to meet its fiscal deficittarget of 3.5% of GDP for FY17 on account of buoyant tax revenues. This has also been pointed out by the ControllerGeneral of Accounts recently.
► The Center’s revenue deficit increased to 142.8% of the annual revised target during April—February FY17. Therevenue deficit target of 2.1% of GDP is likely to be missed.
As per the revised estimates for FY17 given in Budget FY18, the fiscal deficit target of 3.5% of GDP isexpected to be met. However, the revenue deficit target of 2.1% of GDP for FY17 is likely to bemissed.
Table 5: trends in fiscal and revenue deficit (INR Crores)
Fiscal deficit Revenue deficit
FY16 actual 532,791 342,736
April–February FY16 572,872 390,810
Cumulated deficit up to February 2016 as a % of actuals for FY16 107.5 114.0
March FY16 -40,081 -48,074
FY17 RE 534,274 310,998
April–February FY17 605,614 444,041
Cumulated deficit up to February 2017 as a % of annual RE for FY17 113.4 142.8
March FY17 -71,340 -133,043
Source (Basic Data): Monthly Accounts, Controller General of Accounts, Government of India, Union Budget for FY18

Economy Watch: April 2017 9
In terms of real growth rate, Indiaovertook China in FY16. By FY20,India’s growth rate at 7.8% isprojected to exceed that of China bynearly 2% points. It will exceed that ofthe EMDE group by almost 3% points.
Compared to G7 and China, India hasa significantly higher CPI inflationrate. It is also higher than theaverage EMDE rate. During FY19 andFY20, India’s inflation rate isprojected to be close to 5%.
Relative to USD, Indian rupee isexpected to depreciate by an averageof 2.6% per year during FY18 toFY20.
1.9 1.9 1.7
4.5 4.8 4.96.6 6.2 6.07.2 7.7 7.8
-2.00.02.04.06.08.0
10.012.0
2008 2010 2015 2016 2017 2018 2019
G7 EMDEs China India
2.4 2.3 2.6
4.8 5.1 5.0
02468
1012
2008 2010 2015 2016 2017 2018 2019
G7 EMDEs China India
-30
-20
-10
0
10
20
2008 2010 2015 2016 2017 2018 2019Japan Germany China India
5 India: Comparative Economic Prospects up to FY20
Forecast
Chart 4: Real GDP growth (% annual)
Chart 5: CPI Inflation rate (% y-o-y)
Chart 6: Exchange rate (-ve values representdepreciation and +ve value represent appreciation)
Forecast
Forecast

Economy Watch: April 2017 10
Relative to GDP, government debt inIndia is higher than that in China aswell as the EMDEs. Compared togroups/ countries, India is the onlycase where the debt-GDP ratio isexpected to fall. By FY20, generalgovernment debt is expected to fallto 64.3% of GDP.
At its peak in recent years, India’scapacity utilization rate was 83.2% in4QFY11. The utilization rate fell to itslowest level of 70.2% in 1QFY15.Since then, it has improved onlymarginally. In 3QFY17, it was stilllanguishing at 72.7%.
Note: For India, estimates/ forecasts pertain to fiscal years. Thus 2017 means FY18 and so on.Source (Basic Data): IMF World Economic Outlook, April 2017 and RBI
119.9
64.350.4 54.4
0
50
100
150
G7 India EMDEs China
2008 2015 2019
65.0
70.0
75.0
80.0
85.0
Q4
FY11
Q1
FY12
Q2
FY12
Q3
FY12
Q4
FY12
Q1
FY13
Q2
FY13
Q3
FY13
Q4
FY13
Q1
FY14
Q2
FY14
Q3
FY14
Q4
FY14
Q1
FY15
Q2
FY15
Q3
FY15
Q4
FY15
Q1
FY16
Q2
FY16
Q3
FY16
Q4
FY16
Q1
FY17
Q2
FY17
Q3
FY17
72.770.2
Chart 7: General government gross debt as % of GDP
Chart 8: Capacity utilization: relative to previous peak
Economy Watch: April 2017 11
Introduction
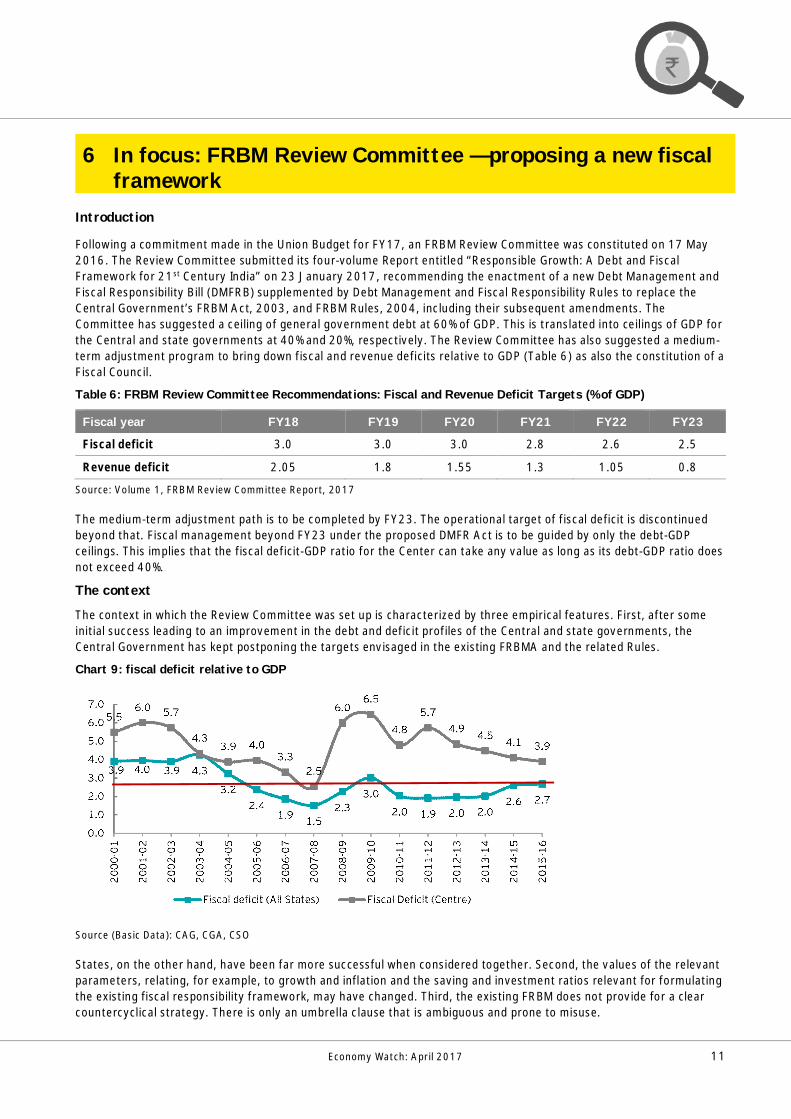
Following a commitment made in the Union Budget for FY17, an FRBM Review Committee was constituted on 17 May2016. The Review Committee submitted its four-volume Report entitled “Responsible Growth: A Debt and FiscalFramework for 21st Century India” on 23 January 2017, recommending the enactment of a new Debt Management andFiscal Responsibility Bill (DMFRB) supplemented by Debt Management and Fiscal Responsibility Rules to replace theCentral Government’s FRBM Act, 2003, and FRBM Rules, 2004, including their subsequent amendments. TheCommittee has suggested a ceiling of general government debt at 60% of GDP. This is translated into ceilings of GDP forthe Central and state governments at 40% and 20%, respectively. The Review Committee has also suggested a medium-term adjustment program to bring down fiscal and revenue deficits relative to GDP (Table 6) as also the constitution of aFiscal Council.
Table 6: FRBM Review Committee Recommendations: Fiscal and Revenue Deficit Targets (% of GDP)
Fiscal year FY18 FY19 FY20 FY21 FY22 FY23
Fiscal deficit 3.0 3.0 3.0 2.8 2.6 2.5
Revenue deficit 2.05 1.8 1.55 1.3 1.05 0.8
Source: Volume 1, FRBM Review Committee Report, 2017
The medium-term adjustment path is to be completed by FY23. The operational target of fiscal deficit is discontinuedbeyond that. Fiscal management beyond FY23 under the proposed DMFR Act is to be guided by only the debt-GDPceilings. This implies that the fiscal deficit-GDP ratio for the Center can take any value as long as its debt-GDP ratio doesnot exceed 40%.
The context
The context in which the Review Committee was set up is characterized by three empirical features. First, after someinitial success leading to an improvement in the debt and deficit profiles of the Central and state governments, theCentral Government has kept postponing the targets envisaged in the existing FRBMA and the related Rules.
Chart 9: fiscal deficit relative to GDP
Source (Basic Data): CAG, CGA, CSO
States, on the other hand, have been far more successful when considered together. Second, the values of the relevantparameters, relating, for example, to growth and inflation and the saving and investment ratios relevant for formulatingthe existing fiscal responsibility framework, may have changed. Third, the existing FRBM does not provide for a clearcountercyclical strategy. There is only an umbrella clause that is ambiguous and prone to misuse.
6 In focus: FRBM Review Committee — proposing a new fiscalframework

Economy Watch: April 2017 12
Examining the Review Committee’s recommendations
There is an on-going debate as to whether the Review Committee has come up with recommendations that constitute asignificant improvement over the existing FRBM and whether it can serve as an effective framework for guiding fiscalpolicy to usher in “responsible growth” within the constraints of fiscal discipline during the 21st century, as promised bythe title of the report. First, there were significant differences within the Review Committee, signified by a strongminute of dissent by one of the committee members, Mr. Arvind Subramanian, who is Chief Economic Advisor, Ministryof Finance.
Following the publication of the FRBM review committee report, there has been a spate of commentaries on therecommendations. In a recent article (The Hindu, 28 April 2017), N.K. Singh, Chairman of the Review Committee, liststhe difficulties that states will face in meeting the 20% debt-GDP ratio target as specified by the Review Committee.Rathin Roy (Business Standard, 13 April 2017) emphasizes why a Fiscal Council is important in the context of “asecretive governance culture like ours, where peripatetic decisions are common place.” Sukumar Mukhopadhayaya(Business Standard, 30 April 2017) argues that the proposed Fiscal Council is superfluous and pernicious. M.S.Ahluwalia (The Mint, 28 April, 2017) argues that the new Act should allow for adjustment of the medium-term fiscaldeficit targets once every two years, to reflect revisions in the expected medium-term growth rate. Ajay Shah (BusinessStandard, 30 April, 2017) and Datta and Pandey (The Wire, 17 April, 2017) argue that any changes in the targets of theFRBM Act and Rules can be made through the route of a Money Bill, which needs to be passed by the Lok Sabha only.Shah advocates the inclusion of the fiscal responsibility rule in the Constitution itself. Jayati Ghosh (Frontline, onlineversion, print edition, 12 May 2017) contends that rigid rules about debt-GDP targets, which are arbitrary in any case,“will unnecessarily constrain fiscal policies at a time when external circumstances and internal developmental goalsboth call for more flexibility.” Indira Rajaraman (The Mint, 5 May 2017) points to inconsistencies between the debt-GDPtargets and their corresponding steady state values. Further, she advocates the use of rainfall deficiency as a trigger forrelaxation of borrowing targets rather than the ones proposed by the Review Committee. In a recent two-partcontribution (Business Standard, 8 and 9 May 2017), Pronab Sen compares the relative merits of the analysis of theReview Committee and its recommendations vis-à-vis those in the minute of dissent. He suggests several modificationsto the countercyclical strategy. Rangarajan and Srivastava (Business Line, 16 May 2017) suggest that there should beno rush to amend the existing law or push through a new bill until there is convincing evidence that India’s financialsavings have fallen for good. They recommend that first the reference values of debt and deficit should be madeanalytically consistent and brought in line with their sustainable values.
We consider here four aspects of the Review Committee’s report: (a) role of the prescribed debt-GDP ratio as ananchor, (b) escape clauses and countercyclical policies, (c) role of states in overall fiscal policy and (d) instruments toimprove implementation effectiveness.
a. Debt-GDP ratio as a ceiling
Considering the general government, the Review Committee has recommended the target values of debt and deficitlevels relative to GDP to be achieved by FY23 as 60% and 5%. The corresponding numbers of the Central Governmentare 40% and 2.5% and for state governments, 20% and 2.5%. The prescribed debt-GDP ratios remain valid after FY23,but the fiscal deficit numbers do not. The underlying nominal growth is 11.5% and the available space for borrowing forthe general government is 5% linked to the household sector’s financial saving.
Source: Estimates based on Fiscal Deficit to GDP ratios specified by the Review Committee*Under FRBM Review Committee assumptions and long-term general government borrowing of 5% of GDP
While the Review Committee defines specific ceilings for the debt-GDP ratio at 40% and 20% for the Center and states, inthe minute of dissent it is argued that the only requirement should be a continuous fall in the debt-GDP ratio.
24.24%
20%
25%
30%
35%
40%
45%
50%
FY17
FY21
FY25
FY29
FY33
FY37
FY41
FY45
FY49
FY53
FY57
FY61
FY65
FY69
FY73
FY77
Prescribed Debt-GDP ceiling (40%)24.24%
19%
20%
21%
22%
23%
24%
25%
FY17
FY21
FY25
FY29
FY33
FY37
FY41
FY45
FY49
FY53
FY57
FY61
FY65
FY69
FY73
FY77
Prescribed Debt-GDP ceiling (20%)
Chart 10: Evolution of Center's Debt-GDP Chart 11: Evolution of states’ Debt-GDP ratio*

Economy Watch: April 2017 13
In the case of the Center, for the defined reform path up to FY23, the debt-GDP ratios do continue to decline. In thecase of states, however, if the principle of equal sharing of the borrowing space between the Center and the states,advocated by the Review Committee (p. 59, Volume 1) is followed, the debt-GDP ratio would steadily increase. In thecase of the Center, the defined ceiling appears to lose relevance progressively if the fiscal deficit-GDP ratio beyondFY23 is kept at 2.5%. In the case of the states, the proposed debt ceiling of 20% never becomes relevant if equalitybetween the fiscal deficits of the Center and all states is maintained. The convergence to their respective steady stateor sustainable levels of the debt-GDP ratio is illustrated in Charts 10 and 11, starting with initial values of 49.4% and21% for the Center and states respectively and using the fiscal deficit path specified by the Review Committee up toFY23. Beyond that, the fiscal deficit-GDP ratio is kept at 2.5% for the Center as well as the states. The difference in theprescribed ceiling values of the debt-GDP ratio and their corresponding steady state values have significant implicationsfor the countercyclical strategy, and they also imply significant political economy risks close to future election years.These possibilities open up if beyond FY23, for most years, the fiscal deficit to GDP ratio is kept at 2.5% for the Center.The Center’s debt-GDP ratio will keep falling, moving further and further away from the prescribed debt-GDP ceiling of40%. Then, a sudden upsurge in the fiscal deficit to GDP ratio can be undertaken without breaching the limit of 40%.This would be useful when responding to an economic slowdown but counterproductive if it is used close to futureelection years.
b. Escape clauses and counter-cyclical fiscal policy
The Review Committee has suggested certain “escape” clauses, where the Central Government can breach the path offiscal deficit prescribed in the proposed bill. Such escape is permitted on account of (a) over-riding considerations ofnational security and acts of war, calamities of national proportion and collapse of agriculture severely affecting farmoutput and incomes, (b) far-reaching structural reforms in the economy with unanticipated fiscal implications and (c)decline in real output growth of at least 3 percentage points below its average of the previous four quarters. The firsttwo clauses are qualitative in nature. These require an assessment of the prevailing economic conditions where theproposed Fiscal Council may play a role. Clause (c) adds a quantitative and verifiable guidance. The note of dissentemphasizes that the proposed escape clause could prove to be pro-cyclical. The proposed relaxation in the fiscal deficitlimit cannot be initiated if the fall in the growth is less than 3% points. If and when fiscal action is initiated for a large fallin growth rate, an extra fiscal deficit of only 0.5% of GDP may prove to be inadequate. In any case, this clause, althoughintegral to the proposed Act, will have relevance only up to FY23, as the departure is defined only in relation to a fiscaldeficit target and there is no fiscal deficit target beyond FY23 in the proposed Bill.
c. Role of states
The Review Committee does not envisage any role for the states in supplementing the Center’s macro-stabilizationefforts. The 0.5% departure is permitted only for the Central Government. Without coordinating their efforts with stategovernments in India, where some of the states are very large, the Center’s stabilization efforts may prove to be lesseffective if the country faces any major economic slowdown.
d. Improving effectiveness of implementation
During the previous decade, the acceptance of the role of fiscal legislations to promote fiscal discipline increasedsignificantly. The Central Government and progressively all the states enacted their fiscal responsibility legislations.Partly as a result of high growth, by 2007-08 significant progress was made toward achieving the desired targets. Afterthat, a significant asymmetry in the fiscal performance of the Center and the states appeared. States as a whole and,with a limited number of exceptions, individually, continued to meet their FRL targets, and the Central Governmentcontinued to miss its own as pointed out in the 2016 CAG Report2.
The main problem in implementing the existing Center’s FRBMA has been lack of implementation teeth. First, in theCenter’s case, the fiscal deficit target is not part of the Act but only the Rules. The Rules also specify the rates of annualreduction of fiscal and revenue deficits. Being part of the Rules, these reduction rates and targets have been frequentlyrevised through administrative orders. These changes then become part of the Budget, which being a Money Bill isrequired to be passed only by the Lok Sabha, although a discussion may happen in the Rajya Sabha. At the minimum,what is required is that the fiscal deficit target should become part of the Act rather than the Rules. Further, anydepartures from the borrowing targets should be discussed explicitly in the Parliament.
2Report No. 27 of 2016, Department of Economic Affairs, Ministry of Finance, “Report of the Comptroller and Auditor General of Indiaon Compliance of Fiscal Responsibility and Budget Management Act, 2003 for the year 2014-15”; Web link (accessed on 7 May 2017)http://www.cag.gov.in/sites/default/files/audit_report_files/Union_Civil_Compliance_Report_27_2016_Full.pdf

Economy Watch: April 2017 14
A. Monetary sectori. Monetary policy► In the monetary policy review held on 6 April 2017, the RBI’s Monetary Policy Committee retained the policy repo
rate at 6.25% (Chart 12). To address the issue of excess liquidity, the reverse repo rate was increased by 25 basispoints to 6.0%.
► Persistence of core CPI inflation (CPI inflation excluding food and fuel items) and hardening of global oil prices poseda challenge to the inflation outlook.
In its April 2017 policy review, the RBI, while maintaining a neutral policy stance, retained its policyrepo rate unchanged at 6.25% but increased the reverse repo rate from 5.75% to 6.0%.
ii. Money stock► Growth in broad money (M3) reached a 4-month high of 10.6% (y-o-y) in March 2017 as compared to 6.5% in
February 2017 (Table A4). Growth in time deposits, accounting for over 76% of the broad money stock, recoveredto 12.6% in March 2017 from 11.2% in February 2017.
► Narrow money (M1) grew by 3.6% in March 2017, reversing its contractionary trend since November 2016. M1 hadcontracted by (-) 10.6% in February 2017 (Chart 13), reflecting the effect of demonetization. By 28 April 2017,currency in circulation (excluding non-demonetized currency) was 76.9% of the total demonetized currency.
iii. Aggregate credit and deposits► Growth in bank credit recovered to 8.7% in March 2017 from a historic low of 4.8% in February 2017 (Chart 14).
Credit growth for the entire fiscal year FY17 stood at 8.1% (9.7% in FY16), well below the previous 5-year averagegrowth of 14.2%. Non-food credit grew by 9.6% in March 2017 as compared to 4.9% in February 2017, while foodcredit sharply contracted by (-) 48.8%.
► Credit growth to industries continued to decline for 6 months in a row, although at a slower pace of (-) 1.9% in March2017 as compared to (-) 5.2% in February 2017. Credit to the services sector, accounting for nearly 25% of non-food credit, grew by 19.5% in March 2017 as compared to 7.7% in February 2017. The y-o-y growth of personalloans recovered to 16.7% in March 2017 from 12.0% in February 2017 (Chart 15).
► Growth in aggregate bank deposits improved to 15.9% (y-o-y) in March 2017 from 12.8% in February 2017.
7 Money and finance: bank credit growth for FY17 remainswell below its trend
Chart 12: movements in repo rate Chart 13: growth in narrow and broad money
6.25
456789
10
Apr
10
Oct
10
Apr
11
Oct
11
Apr
12
Oct
12
Apr
13
Oct
13
Apr
14
Oct
14
Apr
15
Oct
15
Apr
16
Oct
16
Apr
17
Repo rate
-25
-15
-5
5
15
25
Mar
10
Sep
10
Mar
11
Sep
11
Mar
12
Sep
12
Mar
13
Sep
13
Mar
14
Sep
14
Mar
15
Sep
15
Mar
16
Sep
16
Mar
17
Narrow money (M1) Broad money (M3)
Source: Data Base on Indian Economy, RBI

Economy Watch: April 2017 15
Chart 14: growth in credit and deposits Chart 15: growth in industrial and personal loans
B. Financial sectori. Interest rates► MCLR was maintained at 7.75% in March 2017. It was lowered earlier in January 2017, when it was brought down
from 8.65% in December 2016. Since its introduction in April 2016, MCLR has been reduced by a total of 1.20percentage points.
► Banks continued to maintain the interest rate on term deposits (>1 year) at 6.75% in March 2017. The CentralGovernment, on 31 March 2017, slashed interest rates on small savings by 10 basis points to align them withmarket rates with effect from 1 April 2017. We expect that the move may prompt banks to lower deposit rates in thenear future.
► For the first time since August 2016, the average yield on 10-year government securities crossed the 7% mark inMarch 2017 as it rose to 7.12% from 6.98% in February 2017. Yields were influenced by heightened risks to India’sinflation trajectory leading to a shift in the RBI’s policy stance from accommodative to neutral.
ii. FPI and stock market
► The benchmark S&P NIFTY increased further toan all-time high as it reached 9,047 points inMarch 2017, gaining nearly 234 points from8,813 points in February 2017(Chart 16).Investors’ confidence was boosted by strongequity inflows from overseas investors. Inaddition, a historic win for the ruling NDAGovernment in the state of UP further upliftedthe market sentiments.
► As per provisional data, overall FII inflows roseto a 17-month peak of US$9.4 billion in March2017 from US$3.5 billion in February. Net FPIinflows increased to a 5-year peak of US$9.0billion in March 2017 from US$2.4 billion inFebruary 2017. Meanwhile, net FDI inflowsmoderated to US$0.4 billion in March 2017from US$1.1 billion in February 2017.
► Cumulated FIIs were significantly higher in FY17 at US$43.8 billion as compared to US$31.9 billion in FY16 due to asharp increase in net foreign portfolio inflows. Net FPI inflows stood at US$7.9 billion in FY17 as compared to a netoutflow of US$4.1 billion. Net FDI inflows, however, were marginally lower at US$35.9 billion in FY17 (US$36.0billion in FY16)
05
1015202530
Mar
08Se
p08
Mar
09Se
p09
Mar
10Se
p10
Mar
11Se
p11
Mar
12Se
p12
Mar
13Se
p13
Mar
14Se
p14
Mar
15Se
p15
Mar
16Se
p16
Mar
17
Aggregate deposits (% ann)Bank credit (% ann)
Source: Data Base on Indian Economy, RBI
-10
0
10
20
30
40
Mar
09Se
p09
Mar
10Se
p10
Mar
11Se
p11
Mar
12Se
p12
Mar
13Se
p13
Mar
14Se
p14
Mar
15Se
p15
Mar
16Se
p16
Mar
17
Credit to industry (% ann)Personal loans (% ann)
Source: Data Base on Indian Economy, RBI
Chart 16: stock market movement
0
2000
4000
6000
8000
10000
-10
-5
0
5
10
15
Mar
-201
3
Jul-2
013
Nov
-201
3
Mar
-201
4
Jul-2
014
Nov
-201
4
Mar
-201
5
Jul-2
015
Nov
-201
5
Mar
-201
6
Jul-2
016
Nov
-201
6
Mar
-201
7
Net FPI US$ million (LHS) S&P CNX NIFTY Index (RHS)

Economy Watch: April 2017 16
8 Merchandise Exports: continued high growth
A. Current account balanceCAB as a percentage of GDP deteriorated to (-) 1.4% in 3QFY17 (Table 7, Chart 18) from (-) 0.6% in the previousquarter. Merchandise trade balance worsened to (-) US$33.3 billion in 3QFY17 as compared to (-) US$25.6 billion in2QFY17. Services balance improved marginally to US$17.6 billion as compared to US$16.3 billion in the previousquarter. According to the RBI, the current account deficit for FY17 is likely to remain muted at less than 1% of GDP.
Table 7: current account balance
CAB(- deficit/+surplus)
(US$ billion)
CAB as a %of nominal
GDP
Goods accountnet
(US$ billion)
Servicesaccount net(US$ billion)
Incomeaccount
net(US$ billion)
Transfersnet
(US$ billion)
FY13 -88.2 -4.8 -195.7 64.9 -21.5 64.0
FY14 -32.4 -1.7 -147.6 73.0 -23.0 65.3
FY15 -26.8 -1.3 -144.9 76.6 -24.1 65.7
FY16 -22.0 -1.0 -130.1 53.7 -17.8 47.7
4QFY16 -0.3 -0.1 -24.8 16.1 -6.6 15.1
1QFY17 -0.3 -0.1 -23.8 15.8 -6.2 14.2
2QFY17 -3.4 -0.6 -25.6 16.3 -7.9 14.0
3QFY17 -7.9 -1.4 -33.3 17.6 -6.2 14.0Source: Database on Indian Economy, RBI
B. Merchandise trade and exchange rate► Merchandise exports grew at 27.6% in March, the highest rate in the last five years, as compared to 17.5% in the
February 2017 (Chart 17). On an annual basis, export growth turned positive and reached a 5-year high of 5.0% inFY17 (-15.5% in FY16).
► The increase (y-o-y) was primarily due to a substantial rise in the growth rate of exports of petroleum goods, gemsand jewelry, and drugs and pharmaceuticals to 69.1%, 12.5% and 5.5% respectively from 27.6%, 2.3% and (-) 4.1% inthe previous month. At 46.7%, growth in the exports of engineering goods was sustained at a high rate for thesecond successive month.
► Growth (y-o-y) in overall imports and oil imports reached a 5-year high of 45.3% and 101.4% in March as comparedto 21.8% and 60.0% respectively in February 2017.
► Due to a sharper rise (m-o-m basis) in imports as compared to exports in absolute terms, India’s merchandise tradedeficit increased to US$10.4 billion from US$8.9 billion in February 2017.
► The Indian rupee strengthened further to INR65.9 per US dollar in March from INR67.1 per US dollar in February2017 on account of higher capital inflows.
Chart 17: developments in merchandise trade Chart 18: CAD
-60-40-200204060
-30-20-10
0102030
Mar
12
Jul1
2N
ov12
Mar
13
Jul1
3N
ov13
Mar
14Ju
l14
Nov
14M
ar15
Jul1
5
Nov
15M
ar16
Jul1
6N
ov16
Mar
17
Trade balance (US$ billion, LHS)Exports (% ann, RHS)
Source: Ministry of Commerce and Industry
-8-6-4-202
-40
-30
-20
-10
0
1QFY
11
3QFY
11
1QFY
12
3QFY
12
1QFY
13
3QFY
13
1QFY
14
3QFY
14
1QFY
15
3QFY
15
1QFY
16
3QFY
16
1QFY
17
3QFY
17
CAD (US$ billion, LHS) CAD (% of GDP, RHS)
Source: Data Base on Indian Economy, RBI

Economy Watch: April 2017 17
A. Global growth outlook► The IMF (WEO, April 2017) projected global growth to increase from an estimated 3.1% in 2016 to 3.5% in 2017 and
3.6% in 2018, an upward revision of 0.1% points for 2017 relative to October (Chart 19). Growth in advancedeconomies has been revised upward at 2% in 2017 and 2018. Growth in EMDEs is projected at 4.5% and 4.8% in2017 and 2018 respectively largely due to a stabilization/recovery in many commodity exporters.
► GDP in the US is projected to grow at a faster pace of 2.3% and2.5% in 2017 and 2018 respectively, reflecting momentum fromthe second half of 2016.
► Growth in the Euro area is projected at 1.7% in 2017 and 1.6% in2018 supported by an expansionary fiscal stance, accommodativefinancial conditions and a weak euro. In the UK, GDP growth isprojected at 2% in 2017 and 1.5% in 2018, higher than theJanuary WEO Update forecasts, reflecting stronger-than-expectedperformance since the June Brexit vote.
► In Japan, a comprehensive revision of the national accounts led to an upward revision of historical growth rates andplaced the 2016 growth estimate at 1%, significantly higher than that projected in the October 2016 WEO. Growth isprojected at 1.2% in 2017 due to strong net exports but is expected to fall to 0.6% in 2018 with the withdrawal offiscal support and a recovery of imports.
► Growth in China is projected at 6.6% in 2017, slowing to 6.2% in 2018. These are, however, higher than the JanuaryWEO Update forecasts reflecting stronger-than-expected momentum in 2016 and the anticipation of continuedpolicy support. Both Brazil and Russia are expected to emerge from recession in 2017 helped by recoveringcommodity and crude oil prices.
Chart 19: global growth projections Chart 20: global crude and coal prices
Source: IMF World Economic Outlook, April 2017*forecast pertains to fiscal year
3.6
1.71.4
0.6
1.6
1.5
2.5
1.6
6.2
7.7
3.5
0.2
1.4
1.2
1.7
2.0
2.3
0.8
6.6
7.2
0.0 5.0 10.0
Global growth
Brazil
Russia
Japan
Euro area
The UK
The US
South Africa
China
India*
2017
2018
-100
-50
0
50
100
150
200
Apr
09A
ug09
Dec
09A
pr10
Aug
10D
ec10
Apr
11A
ug11
Dec
11A
pr12
Aug
12D
ec12
Apr
13A
ug13
Dec
13A
pr14
Aug
14D
ec14
Apr
15A
ug15
Dec
15A
pr16
Aug
16D
ec16
Apr
17
Coal average price (US$/mt)Coal inflation rate (% ann)Crude Oil (US$/brl)
Souce: World Bank, Pinksheet
9 Global economy: global growth projected at 3.5% in 2017;structural impediments hold back stronger recovery
The IMF projects world growth to risefrom 3.1% in 2016 to 3.5% in 2017 and3.6% in 2018. However, persistentstructural problems such as lowproductivity growth and inward lookingpolicies in advanced economies haveheld back a stronger recovery.

Economy Watch: April 2017 18
B. Global energy prices► Global crude prices, after dropping temporarily in March, recovered to US$52.2/bbl. (Chart 20). In April 2017. The
World Bank forecasts crude oil prices to rise to an average of US$55/bbl. in 2017, an increase of 26% over 2016,reflecting balancing forces: upward pressure on prices from production cuts agreed by OPEC/non-OPEC producingcountries and downward pressure from persistently high stocks, supported by the faster-than-expected rebound ofthe US shale oil industry.
► Average global coal prices increased marginally to US$76.8/mt in April 2017 from US$74.5/mt in March. In China,coal production was reduced by 16% in 2016. According to the World Bank, coal prices are expected to averageUS$70/ton in 2017, up 6% from 2016.
Economy Watch: April 2017 19
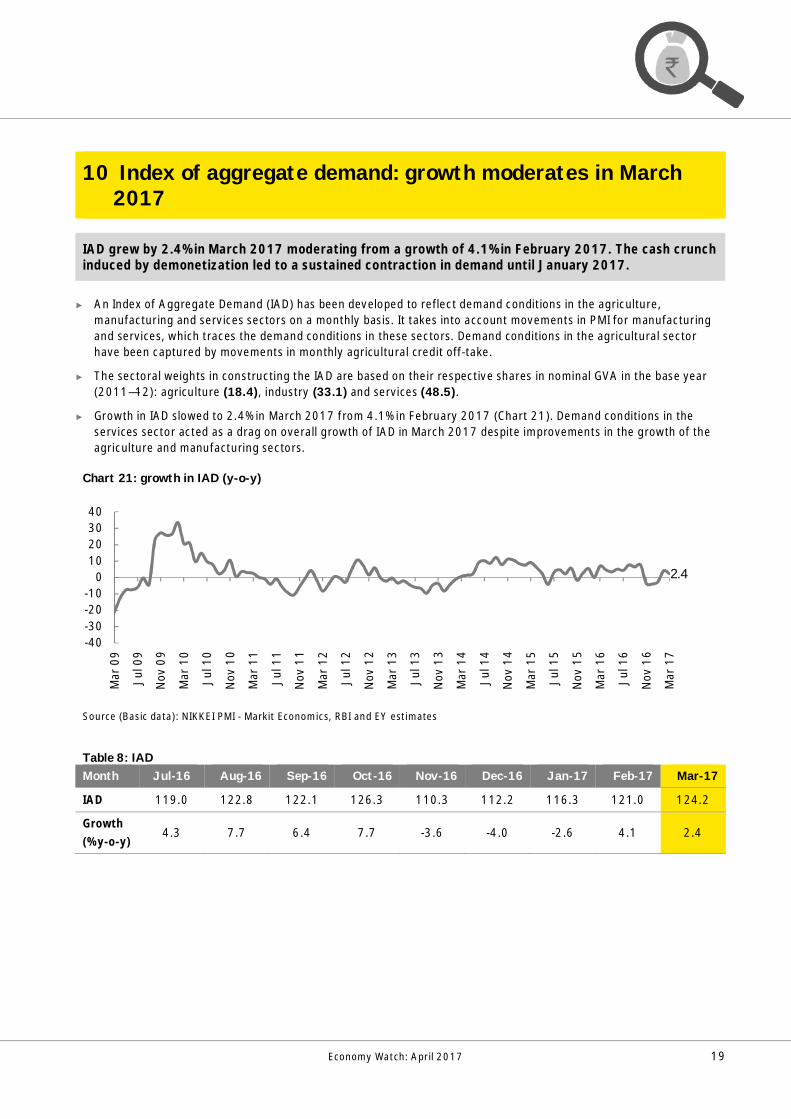
IAD grew by 2.4% in March 2017 moderating from a growth of 4.1% in February 2017. The cash crunchinduced by demonetization led to a sustained contraction in demand until January 2017.
► An Index of Aggregate Demand (IAD) has been developed to reflect demand conditions in the agriculture,manufacturing and services sectors on a monthly basis. It takes into account movements in PMI for manufacturingand services, which traces the demand conditions in these sectors. Demand conditions in the agricultural sectorhave been captured by movements in monthly agricultural credit off-take.
► The sectoral weights in constructing the IAD are based on their respective shares in nominal GVA in the base year(2011—12): agriculture (18.4), industry (33.1) and services (48.5).
► Growth in IAD slowed to 2.4% in March 2017 from 4.1% in February 2017 (Chart 21). Demand conditions in theservices sector acted as a drag on overall growth of IAD in March 2017 despite improvements in the growth of theagriculture and manufacturing sectors.
Chart 21: growth in IAD (y-o-y)
Source (Basic data): NIKKEI PMI - Markit Economics, RBI and EY estimates
Table 8: IADMonth Jul-16 Aug-16 Sep-16 Oct-16 Nov-16 Dec-16 Jan-17 Feb-17 Mar-17
IAD 119.0 122.8 122.1 126.3 110.3 112.2 116.3 121.0 124.2
Growth(% y-o-y)
4.3 7.7 6.4 7.7 -3.6 -4.0 -2.6 4.1 2.4
2.4
-40-30-20-10
010203040
Mar
09
Jul0
9
Nov
09
Mar
10
Jul1
0
Nov
10
Mar
11
Jul1
1
Nov
11
Mar
12
Jul1
2
Nov
12
Mar
13
Jul1
3
Nov
13
Mar
14
Jul1
4
Nov
14
Mar
15
Jul1
5
Nov
15
Mar
16
Jul1
6
Nov
16
Mar
17
10 Index of aggregate demand: growth moderates in March2017

Economy Watch: April 2017 20
Table A1: industrial growth indicators (annual, quarterly and monthly growth rates, y-o-y)
Fiscalyear/quarter/month
IIP Mining Manufacturing Electricity Fiscal
year/quarter/month
PMI mfg. PMI ser.
% change y-o-yFY14 3.3 -0.2 3.6 6.0 FY14 50.5 48.5FY15 4.1 -1.3 3.8 14.8 FY15 52.2 51.7FY16 3.4 4.3 3.0 5.7 FY16 51.3 51.7FY17 5.0 5.3 4.9 5.8 FY17 51.6 51.01Q FY17 7.8 7.5 7.6 10.0 1QFY17 51.0 51.72Q FY17 5.3 -1.5 6.5 3.1 2QFY17 52.2 52.93Q FY17 4.4 6.7 3.8 6.1 3QFY17 52.1 49.34Q FY17 2.8 7.7 1.8 4.3 4QFY17 51.2 50.2Dec-16 2.6 10.8 0.9 6.4 Jan-17 50.4 48.7Jan-17 3.8 8.6 3.0 5.1 Feb-17 50.7 50.3Feb-17 1.9 4.6 1.4 1.2 Mar-17 52.5 51.5Mar-17 2.7 9.7 1.2 6.2 Apr-17 52.5 50.2
Source: Office of the Economic Adviser- Ministry of Commerce and Industry and NIKKEI PMI-Markit Economics
Table A2: inflation indicators (annual, quarterly and monthly growth rates, y-o-y)
Source: Office of the Economic Adviser, Ministry of Commerce and Industry and MOSPI
11 Appendix: capturing macro-fiscal trends
Fiscalyear/quarter/month
CPI Food PriceIndex
Fuel andlighting
WPI Food Index Mfg.products
Fuel andpower
% change y-o-y % change y-o-yFY14 9.4 12.1 7.7 5.2 9.6 3.0 7.1FY15 5.9 6.4 4.2 1.3 4.3 2.6 -6.1FY16 4.9 4.9 5.3 -3.7 1.2 -1.8 -19.7FY17 4.5 4.2 3.3 1.7 5.9 1.3 -0.21QFY17 5.7 7.2 3.0 -0.7 6.9 -0.6 -13.62QFY17 5.2 6.1 2.8 1.0 7.2 0.8 -6.83QFY17 3.7 2.2 3.2 1.7 4.8 1.9 1.74QFY17 3.5 1.5 4.3 5.0 4.8 3.2 21.7Jan-17 3.2 0.6 3.3 4.3 3.8 3.3 3.8Feb-17 3.7 2.0 3.9 5.5 5.2 3.2 5.2Mar-17 3.8 1.9 5.6 5.3 5.5 3.0 5.5Apr-17 3.0 0.6 6.1 3.9 2.9 2.7 2.9
Economy Watch: April 2017 21
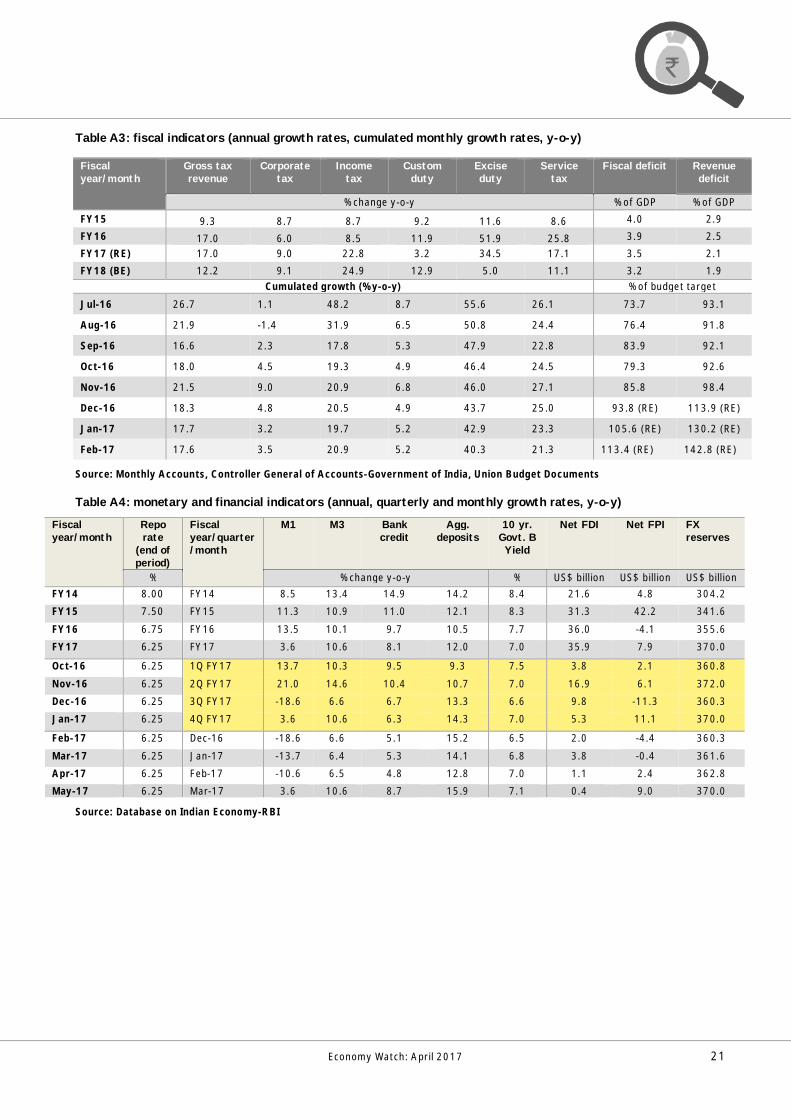
Table A3: fiscal indicators (annual growth rates, cumulated monthly growth rates, y-o-y)
Source: Monthly Accounts, Controller General of Accounts-Government of India, Union Budget Documents
Table A4: monetary and financial indicators (annual, quarterly and monthly growth rates, y-o-y)
Fiscalyear/month
Reporate
(end ofperiod)
Fiscalyear/quarter/month
M1 M3 Bankcredit
Agg.deposits
10 yr.Govt. BYield
Net FDI Net FPI FXreserves
% % change y-o-y % US$ billion US$ billion US$ billionFY14 8.00 FY14 8.5 13.4 14.9 14.2 8.4 21.6 4.8 304.2
FY15 7.50 FY15 11.3 10.9 11.0 12.1 8.3 31.3 42.2 341.6
FY16 6.75 FY16 13.5 10.1 9.7 10.5 7.7 36.0 -4.1 355.6
FY17 6.25 FY17 3.6 10.6 8.1 12.0 7.0 35.9 7.9 370.0
Oct-16 6.25 1Q FY17 13.7 10.3 9.5 9.3 7.5 3.8 2.1 360.8
Nov-16 6.25 2Q FY17 21.0 14.6 10.4 10.7 7.0 16.9 6.1 372.0
Dec-16 6.25 3Q FY17 -18.6 6.6 6.7 13.3 6.6 9.8 -11.3 360.3
Jan-17 6.25 4Q FY17 3.6 10.6 6.3 14.3 7.0 5.3 11.1 370.0
Feb-17 6.25 Dec-16 -18.6 6.6 5.1 15.2 6.5 2.0 -4.4 360.3
Mar-17 6.25 Jan-17 -13.7 6.4 5.3 14.1 6.8 3.8 -0.4 361.6
Apr-17 6.25 Feb-17 -10.6 6.5 4.8 12.8 7.0 1.1 2.4 362.8
May-17 6.25 Mar-17 3.6 10.6 8.7 15.9 7.1 0.4 9.0 370.0
Source: Database on Indian Economy-RBI
Fiscalyear/month
Gross taxrevenue
Corporatetax
Incometax
Customduty
Exciseduty
Servicetax
Fiscal deficit Revenuedeficit
% change y-o-y % of GDP % of GDPFY15 9.3 8.7 8.7 9.2 11.6 8.6 4.0 2.9
FY16 17.0 6.0 8.5 11.9 51.9 25.8 3.9 2.5
FY17 (RE) 17.0 9.0 22.8 3.2 34.5 17.1 3.5 2.1
FY18 (BE) 12.2 9.1 24.9 12.9 5.0 11.1 3.2 1.9Cumulated growth (% y-o-y) % of budget target
Jul-16 26.7 1.1 48.2 8.7 55.6 26.1 73.7 93.1
Aug-16 21.9 -1.4 31.9 6.5 50.8 24.4 76.4 91.8
Sep-16 16.6 2.3 17.8 5.3 47.9 22.8 83.9 92.1
Oct-16 18.0 4.5 19.3 4.9 46.4 24.5 79.3 92.6
Nov-16 21.5 9.0 20.9 6.8 46.0 27.1 85.8 98.4
Dec-16 18.3 4.8 20.5 4.9 43.7 25.0 93.8 (RE) 113.9 (RE)
Jan-17 17.7 3.2 19.7 5.2 42.9 23.3 105.6 (RE) 130.2 (RE)
Feb-17 17.6 3.5 20.9 5.2 40.3 21.3 113.4 (RE) 142.8 (RE)
Economy Watch: April 2017 22
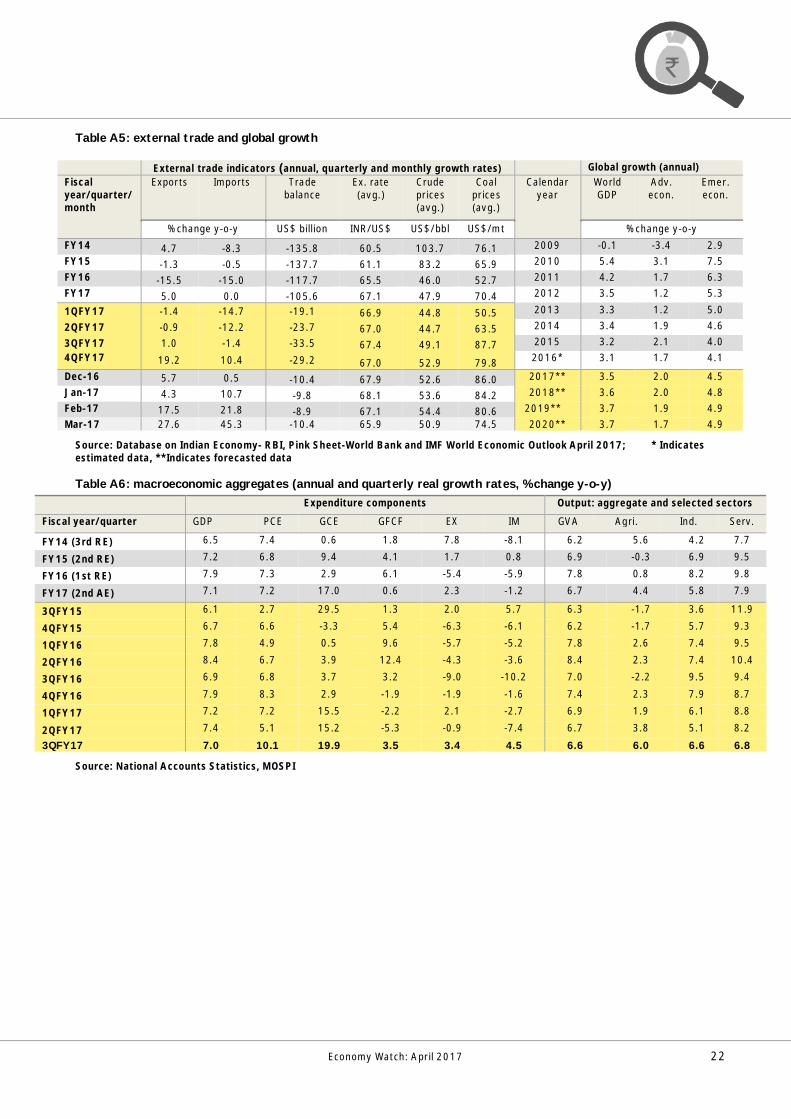
Table A5: external trade and global growth
Source: Database on Indian Economy- RBI, Pink Sheet-World Bank and IMF World Economic Outlook April 2017; * Indicatesestimated data, **Indicates forecasted data
Table A6: macroeconomic aggregates (annual and quarterly real growth rates, % change y-o-y)Expenditure components Output: aggregate and selected sectors
Fiscal year/quarter GDP PCE GCE GFCF EX IM GVA Agri. Ind. Serv.
FY14 (3rd RE) 6.5 7.4 0.6 1.8 7.8 -8.1 6.2 5.6 4.2 7.7
FY15 (2nd RE) 7.2 6.8 9.4 4.1 1.7 0.8 6.9 -0.3 6.9 9.5
FY16 (1st RE) 7.9 7.3 2.9 6.1 -5.4 -5.9 7.8 0.8 8.2 9.8
FY17 (2nd AE) 7.1 7.2 17.0 0.6 2.3 -1.2 6.7 4.4 5.8 7.9
3QFY15 6.1 2.7 29.5 1.3 2.0 5.7 6.3 -1.7 3.6 11.9
4QFY15 6.7 6.6 -3.3 5.4 -6.3 -6.1 6.2 -1.7 5.7 9.3
1QFY16 7.8 4.9 0.5 9.6 -5.7 -5.2 7.8 2.6 7.4 9.5
2QFY16 8.4 6.7 3.9 12.4 -4.3 -3.6 8.4 2.3 7.4 10.4
3QFY16 6.9 6.8 3.7 3.2 -9.0 -10.2 7.0 -2.2 9.5 9.4
4QFY16 7.9 8.3 2.9 -1.9 -1.9 -1.6 7.4 2.3 7.9 8.7
1QFY17 7.2 7.2 15.5 -2.2 2.1 -2.7 6.9 1.9 6.1 8.8
2QFY17 7.4 5.1 15.2 -5.3 -0.9 -7.4 6.7 3.8 5.1 8.2
3QFY17 7.0 10.1 19.9 3.5 3.4 4.5 6.6 6.0 6.6 6.8
Source: National Accounts Statistics, MOSPI
External trade indicators (annual, quarterly and monthly growth rates) Global growth (annual)Fiscalyear/quarter/month
Exports Imports Tradebalance
Ex. rate(avg.)
Crudeprices(avg.)
Coalprices(avg.)
Calendaryear
WorldGDP
Adv.econ.
Emer.econ.
% change y-o-y US$ billion INR/US$ US$/bbl US$/mt % change y-o-yFY14 4.7 -8.3 -135.8 60.5 103.7 76.1 2009 -0.1 -3.4 2.9FY15 -1.3 -0.5 -137.7 61.1 83.2 65.9 2010 5.4 3.1 7.5FY16 -15.5 -15.0 -117.7 65.5 46.0 52.7 2011 4.2 1.7 6.3FY17 5.0 0.0 -105.6 67.1 47.9 70.4 2012 3.5 1.2 5.3
1QFY17 -1.4 -14.7 -19.1 66.9 44.8 50.5 2013 3.3 1.2 5.0
2QFY17 -0.9 -12.2 -23.7 67.0 44.7 63.5 2014 3.4 1.9 4.6
3QFY17 1.0 -1.4 -33.5 67.4 49.1 87.7 2015 3.2 2.1 4.04QFY17 19.2 10.4 -29.2 67.0 52.9 79.8 2016* 3.1 1.7 4.1
Dec-16 5.7 0.5 -10.4 67.9 52.6 86.0 2017** 3.5 2.0 4.5Jan-17 4.3 10.7 -9.8 68.1 53.6 84.2 2018** 3.6 2.0 4.8Feb-17 17.5 21.8 -8.9 67.1 54.4 80.6 2019** 3.7 1.9 4.9Mar-17 27.6 45.3 -10.4 65.9 50.9 74.5 2020** 3.7 1.7 4.9

Economy Watch: April 2017 23
List of abbreviationsSr. no Abbreviations Description
1 bbl. Barrel2 CAB Current account balance3 CPI Consumer Price Index4 CSO Central Statistical Organization5 disc. Discrepancies6 EMDEs Emerging market and developing economies7 FII Foreign investment inflows8 FPI Foreign portfolio investment9 FRBM Fiscal Responsibility and Budget Management
10 FY Fiscal year (April—March)11 GFCE Government final consumption expenditure12 GFCF Gross fixed capital formation13 GST Goods and Services Tax14 GVA Gross value added15 IAD Index of Aggregate Demand16 IIP Index of Industrial Production17 IMF International Monetary Fund18 MCLR Marginal cost of funds based lending rate19 m-o-m Month-on-month20 MPC Monetary Policy Committee21 NDU Non-departmental undertaking22 NEXP Net exports (exports minus imports of goods and services)23 OPEC Organization of the Petroleum Exporting Countries24 PFCE Private final consumption expenditure25 PMI Purchasing Managers’ Index (reference value = 50)26 PSU Public sector undertaking27 RE Revised estimate28 WEO World Economic Outlook29 WPI Wholesale Price Index30 y-o-y Year on year
Our officesAhmedabad2nd floor, Shivalik IshaanNear C.N. VidhyalayaAmbawadiAhmedabad - 380 015Tel: + 91 79 6608 3800Fax: + 91 79 6608 3900
Bengaluru6th, 12th & 13th floor“UB City”, Canberra BlockNo.24 Vittal Mallya RoadBengaluru - 560 001Tel: + 91 80 4027 5000
+ 91 80 6727 5000+ 91 80 2224 0696
Fax: + 91 80 2210 6000
Ground Floor, ‘A’ wingDivyasree Chambers# 11, O’Shaughnessy RoadLangford GardensBengaluru - 560 025Tel: +91 80 6727 5000Fax: +91 80 2222 9914
Chandigarh1st Floor, SCO: 166-167Sector 9-C, Madhya MargChandigarh - 160 009Tel: +91 172 331 7800Fax: +91 172 331 7888
ChennaiTidel Park, 6th & 7th FloorA Block (Module 601,701-702)No.4, Rajiv Gandhi SalaiTaramani, Chennai - 600 113Tel: + 91 44 6654 8100Fax: + 91 44 2254 0120
Delhi NCRGolf View Corporate Tower BSector 42, Sector RoadGurgaon - 122 002Tel: + 91 124 464 4000Fax: + 91 124 464 4050
3rd & 6th Floor, Worldmark-1IGI Airport Hospitality DistrictAerocity, New Delhi - 110 037Tel: + 91 11 6671 8000Fax + 91 11 6671 9999
4th & 5th Floor, Plot No 2BTower 2, Sector 126NOIDA - 201 304Gautam Budh Nagar, U.P.Tel: + 91 120 671 7000Fax: + 91 120 671 7171
HyderabadOval Office, 18, iLabs CentreHitech City, MadhapurHyderabad - 500 081Tel: + 91 40 6736 2000Fax: + 91 40 6736 2200
Jamshedpur1st Floor, Shantiniketan BuildingHolding No. 1, SB Shop AreaBistupur, Jamshedpur – 831 001Tel: +91 657 663 1000BSNL: +91 657 223 0441
Kochi9th Floor, ABAD NucleusNH-49, Maradu POKochi - 682 304Tel: + 91 484 304 4000Fax: + 91 484 270 5393
Kolkata22 Camac Street3rd Floor, Block ‘C’Kolkata - 700 016Tel: + 91 33 6615 3400Fax: + 91 33 2281 7750
Mumbai14th Floor, The Ruby29 Senapati Bapat MargDadar (W), Mumbai - 400 028Tel: + 91 22 6192 0000Fax: + 91 22 6192 1000
5th Floor, Block B-2Nirlon Knowledge ParkOff. Western Express HighwayGoregaon (E)Mumbai - 400 063Tel: + 91 22 6192 0000Fax: + 91 22 6192 3000
PuneC-401, 4th floorPanchshil Tech ParkYerwada(Near Don Bosco School)Pune - 411 006Tel: + 91 20 6603 6000Fax: + 91 20 6601 5900

Ernst & Young LLP
EY | Assurance | Tax | Transactions | Advisory
About EY
EY is a global leader in assurance, tax,transaction and advisory services. The insightsand quality services we deliver help build trustand confidence in the capital markets and ineconomies the world over. We developoutstanding leaders who team to deliver on ourpromises to all of our stakeholders. In so doing,we play a critical role in building a better workingworld for our people, for our clients and forour communities.
EY refers to the global organization, and mayrefer to one or more, of the member firms ofErnst & Young Global Limited, each of which is aseparate legal entity. Ernst & Young GlobalLimited, a UK company limited by guarantee,does not provide services to clients. For moreinformation about our organization, please visitey.com.
Ernst & Young LLP is one of the Indian client serving memberfirms of EYGM Limited. For more information about ourorganization, please visit www.ey.com/in.
Ernst & Young LLP is a Limited Liability Partnership, registeredunder the Limited Liability Partnership Act, 2008 in India, havingits registered office at 22 Camac Street, 3rd Floor, Block C,Kolkata - 700016
© 2017 Ernst & Young LLP. Published in India.
All Rights Reserved.
EYIN1705-050
ED None
This publication contains information in summary form and istherefore intended for general guidance only. It is not intended tobe a substitute for detailed research or the exercise ofprofessional judgment. Neither Ernst & Young LLP nor any othermember of the global Ernst & Young organization can accept anyresponsibility for loss occasioned to any person acting orrefraining from action as a result of any material in thispublication. On any specific matter, reference should be made tothe appropriate advisor.