Embed Size (px)
Citation preview

Ineichen Research & Management – www.ineichen-rm.com
Risk Management Research Flash Update
- 1 - 03 March 2018
Main messages and important changes
Source: IR&M. *Good news from an economic point of view and/or from the perspective of the investor who is long equities, bonds, commodities, etc. The small insert counts the “Y” and “N”s.
Economy Valuation Risk
Table lists the most recent main messages from our research reports as well as the most important changes.
sss
Good
news*
Date Main Flash EPS Price Main messages and/or important changes ?
03-Mar Average consumer sentiment, positive since 2016, might have reversed in February. N
03-Mar US consumer is very confident, as confident as back in 2000. ?
03-Mar Multiple measures related to China and France have fallen sharply. N
03-Mar EPS mom. for German Industr. turned positive, negative for French and Jap. Utilities.
03-Mar Denmark: Long-term price momentum for the KFX Index turned negative. N
26-Feb Eurozone: Long-term price momentum for Euro Stoxx 50 turned negative. N
23-Feb The music might have just stopped playing, January the point of maximum bullishness. N
23-Feb Overall changes were strongly negatively biased. N
23-Feb 88% of regime tests were positive, compared to 97% in 18 January update. N
23-Feb Preliminary PMIs fall sharply. N
23-Feb Economic momentum in China and UK reversed to negative. N
23-Feb Economic and business sentiment remains negative, consumer sentiment positive.
19-Feb Inflation is trendless. Y
19-Feb QE is ending. Santa is leaving. N
19-Feb Finland: Long-term price momentum turned positive. Y
12-Feb US economic health check looks good: only 1 red flag from list of 22 tests. Y
12-Feb Economic sentiment remains falling; consumer sentiment remains rising.
12-Feb Velocity of money might have bottomed. N
12-Feb Long-term momentum in bonds continues turning negative. N
05-Feb US non-farm payrolls exeeded expectations and are only falling mildly.
05-Feb Canadian Energy: long-term earnings momentum turned positive. Y
05-Feb Price momentum in bonds remains negative and US real estate turned negative. N
02-Feb Overall changes were positively biased. Y
Update Momentum mon.
Publication
Frequency Page
IR&M publications per year count
Risk management update 15-25 60-100
Flash update 25-50 1-20
Earnings momentum monitor 25-40 3
Price momentum monitor 45-50 5-7
Special report 3-4 20-80
Note that we have added a column recently indicating whether the line item is positive or negative, where applicable. This column allows for a quick glance of whether “things” (macro, earnings, and price) are generally improving or worsening. Since early September, the ratio of positive to negative was 3:1 (57:19).
Good news? Aug Sep Oct Nov Dec Jan Feb
Y 10 11 18 9 8 13 5
N 6 9 2 8 2 5 12
Ratio 1.7 1.2 9.0 1.1 4.0 2.6 0.4

Ineichen Research & Management – www.ineichen-rm.com
Risk Management Research Flash Update
- 2 - 03 March 2018
Some random remarks
Economy Valuation Risk
• Some say “trade wars are good.” Misquoting Gordon Gekko too, I say boring is good.
• Your author is Swiss. One of the many stereotypes of the Swiss is that they are
perceived—by the global non-Swiss community—as boring. Or, as an English-speaking non-Swiss once put it to me: “The Swiss do not have a monopoly in the humour department.”
• One Switzerland-demystifier, Clare O’Dea in “The Naked Swiss,” traces the Swiss-are-dull idea to Fyodor Dostoyevsky, the Russian author who travelled Europe in 1862, including Switzerland, and thought that pan-slavism was a good idea, while capitalism wasn’t. What
most stereotypers don’t know, is that humour is actually and quite literally our middle
name. “Witz” means joke in German and, literally, it’s part of “Switzerland”.
• The Greek philosopher Posidonius (135-51 BC) described the “Swiss,” the Helvetians that were a Celtic people who arrived between 200 and 100 BC, as “rich in gold but peaceful.”
(“Peaceful” as in boring.) The Celts were among the first people of Europe to work with iron. They also are credited of introducing money; the latter being something many can relate to Switzerland in one way or another.
• My risk management research is often quite boring. This is intentional, not a personality disorder. You are not supposed to be having fun, as per the Soros quote in the upper right.
Furthermore, nowcasting is supposed to be pretty dull too. It is forecasting that is the
flashy part of our industry, with nowcasters not being finance’s most eccentric.
• Markets and economies often trend with the daily or weekly or monthly wiggling around
the trend line not being much else than noise. Nowcasting aims to identify those trends through measurement. The measurement allows for high conviction, i.e., allowing for a
more efficient asset allocation and risk management process. However, trends reverse.
• It is both, trends as well as mean reversion, that are powerful concepts in finance. While trends are boring, the ensuing mean reversion is, sort of, an intermittent departure from
dullness. In that sense, I believe my nowcasting research just got a bit less boring during February.
*As quoted in The Winning Investment Habits of Warren Buffett & George Soros (2006) by Mark Tier, p. 217. **“Dull Government,” Saturday Review, 16 February 1856. ***Freedman, David H. (2010) “Wrong – Why experts*
keep failing us—and how to know when not to trust them, *Scientists, financial wizards, doctors, relationship gurus, celebrity CEOs, high-powered consultants, health officials, and more,” New York: Little, Brown and
Company, p. 84.
“If investing is entertaining, if
you’re having fun, you’re probably not making any money. Good investing is boring.”
—George Soros (b. 1930), American hedge fund manager*
“[D]ullness in matters of
government is a good sign, and not a bad one - in particular, dullness in parliamentary
government is a test of its excellence, an indication of its success. The truth is, all the best business is a little dull.”
—Walter Bagehot (1826-1877),
British journalist, businessman, and essayist**
“One important difference between researchers and gurus is that while gurus often traffic in exotic, dramatic claims,
researchers tend to avoid making extreme claims in much the same
way pilots think twice before reporting UFOs—doing so is a
good way to be branded a flake by colleagues.”
—David H. Freedman (b. 1954). American science and business
journalist***
Ineichen Research & Management – www.ineichen-rm.com
Risk Management Research Flash Update
- 3 - 03 March 2018
Q2 17 Q3 17 Q4 17 r SD
2.51 2.83 2.78 Average
2.2 2.3 2.5 United States
3.7 3.0 2.9 Canada
0.4 1.4 2.1 Brazil
1.8 1.6 1.5 Mexico
2.4 2.8 2.7 Eurozone
2.3 2.7 2.9 Germany
1.9 2.3 2.5 France
1.6 1.7 1.6 I taly
3.1 3.1 3.1 Spain
3.3 3.0 2.9 Netherlands
1.9 1.7 1.4 United Kingdom
0.5 1.2 1.9 Switzerland
6.9 6.8 6.8 China
1.5 1.9 1.5 Japan
5.7 6.5 7.2 India
2.5 1.8 n.a. Russia
1.9 2.8 n.a. l Australia
2.7 3.8 3.0 South Korea
5.0 5.1 5.2 Indonesia
2.3 3.2 3.3 Taiwan
2.8 5.5 3.6 Singapore
3.9 3.7 3.4 Hong Kong
03 2003 to 03 2017
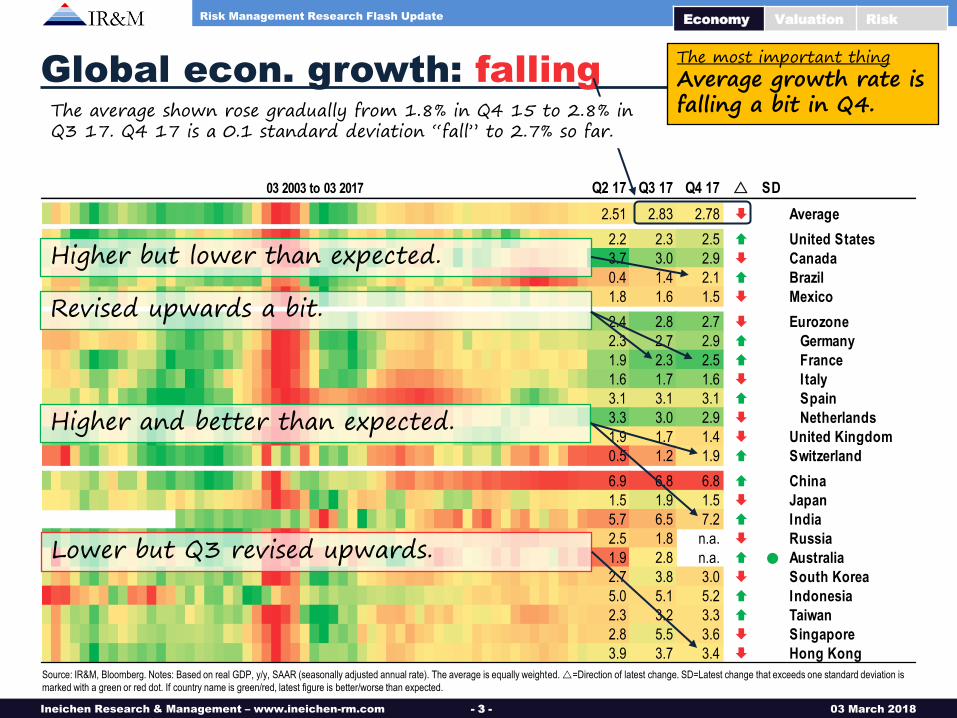
Global econ. growth: falling
Source: IR&M, Bloomberg. Notes: Based on real GDP, y/y, SAAR (seasonally adjusted annual rate). The average is equally weighted. r=Direction of latest change. SD=Latest change that exceeds one standard deviation is
marked with a green or red dot. If country name is green/red, latest figure is better/worse than expected.
Economy Valuation Risk
Fun fact China has the highest growth rate, but the deepest red. (Because our colour-coding is based on an economy’s own history, rather than absolute growth. 7% is low for China, 3.1% is high for Spain, etc.)
The most important thing
Average growth rate is falling a bit in Q4.
Lower but Q3 revised upwards.
Higher but lower than expected.
The average shown rose gradually from 1.8% in Q4 15 to 2.8% in Q3 17. Q4 17 is a 0.1 standard deviation “fall” to 2.7% so far.
Revised upwards a bit.
Higher and better than expected.

Ineichen Research & Management – www.ineichen-rm.com
Risk Management Research Flash Update
- 4 - 03 March 2018
Nov Dec Jan r SD
3.1 2.9 4.3 l Average
3.8 3.4 3.7 US
2.8 2.3 2.0 Canada
4.7 4.3 n.a. Brazil
-1.4 -0.7 n.a. Mexico
3.7 5.2 n.a. l Eurozone
5.5 6.5 n.a. Germany
2.5 4.5 n.a. l France
2.3 4.9 n.a. I taly
4.9 6.6 n.a. Spain
4.4 5.2 n.a. Netherlands
2.6 0.0 n.a. l UK
7.1 8.7 n.a. Turkey
6.2 8.1 n.a. Sweden
-1.3 0.3 n.a. Norway
6.1 6.2 n.a. China
3.6 4.4 2.7 Japan
-3.6 -1.5 2.9 l Russia
-1.1 -4.6 4.6 l South Korea
#N/A N/A#N/A N/A#N/A N/A#N/A N/A#N/A N/A#N/A N/A#N/A N/A#N/A N/A#N/A N/A#N/A N/A#N/A N/A#N/A N/A#N/A N/A#N/A N/A#N/A N/A#N/A N/A#N/A N/A#N/A N/A#N/A N/A#N/A N/A#N/A N/A#N/A N/A#N/A N/A#N/A N/A#N/A N/A#N/A N/A#N/A N/A#N/A N/A#N/A N/A#N/A N/A#N/A N/A#N/A N/A#N/A N/A#N/A N/A#N/A N/A 5.1 n.a. n.a. Indonesia
1.3 1.2 n.a. Taiwan
5.7 -3.4 17.9 l Singapore
Feb 2008 to Oct 2017
Industr. production: positive
Source: IR&M, Bloomberg. Notes: Based on y/y industrial production. Industrial production is generally perceived as a lagging indicator. The average is equal weighted. In the case of a figure not available, the previous one is
used to calculate the latest average. r=Direction of latest change. SD=Latest change that exceeds one standard deviation is marked with a green or red dot. If name is green/red, latest figure is better/worse than expected.
Economy Valuation Risk
Industrial production (IP) is perceived as a coincident economic indicator but is of higher frequency than GDP data.
-20
-15
-10
-5
0
5
10
15
2008 2009 2010 2011 2012 2013 2014 2015 2016 2017 2018
History of the average
IP remains positive. December surprises on the upside, generally.
Higher, better than expected and Dec revised upwards.
Lower and below expectations.
Ineichen Research & Management – www.ineichen-rm.com
Risk Management Research Flash Update
- 5 - 03 March 2018
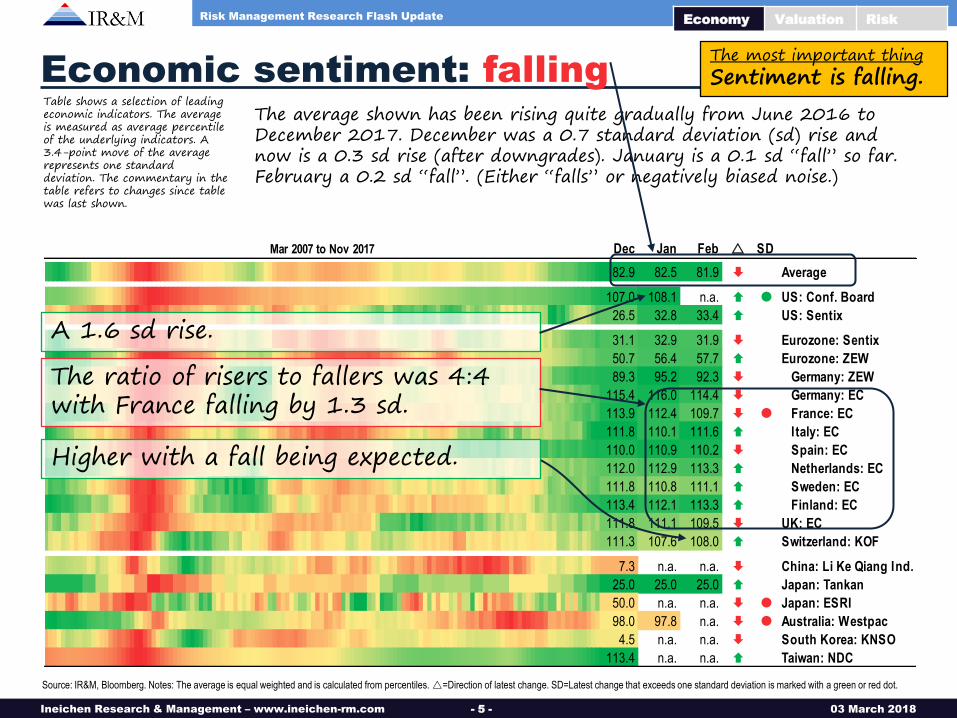
Economic sentiment: falling
Source: IR&M, Bloomberg. Notes: The average is equal weighted and is calculated from percentiles. r=Direction of latest change. SD=Latest change that exceeds one standard deviation is marked with a green or red dot.
Economy Valuation Risk
The average shown has been rising quite gradually from June 2016 to December 2017. December was a 0.7 standard deviation (sd) rise and now is a 0.3 sd rise (after downgrades). January is a 0.1 sd “fall” so far. February a 0.2 sd “fall”. (Either “falls” or negatively biased noise.)
Table shows a selection of leading economic indicators. The average is measured as average percentile of the underlying indicators. A 3.4-point move of the average represents one standard deviation. The commentary in the table refers to changes since table was last shown.
The most important thing
Sentiment is falling.
Dec Jan Feb r SD
82.9 82.5 81.9 Average
107.0 108.1 n.a. l US: Conf. Board
26.5 32.8 33.4 US: Sentix
31.1 32.9 31.9 Eurozone: Sentix
50.7 56.4 57.7 Eurozone: ZEW
89.3 95.2 92.3 Germany: ZEW
115.4 116.0 114.4 Germany: EC
113.9 112.4 109.7 l France: EC
111.8 110.1 111.6 I taly: EC
110.0 110.9 110.2 Spain: EC
112.0 112.9 113.3 Netherlands: EC
111.8 110.8 111.1 Sweden: EC
113.4 112.1 113.3 Finland: EC
111.8 111.1 109.5 UK: EC
111.3 107.6 108.0 Switzerland: KOF
7.3 n.a. n.a. China: Li Ke Qiang Ind.
25.0 25.0 25.0 Japan: Tankan
50.0 n.a. n.a. l Japan: ESRI
98.0 97.8 n.a. l Australia: Westpac
4.5 n.a. n.a. South Korea: KNSO
113.4 n.a. n.a. Taiwan: NDC
Mar 2007 to Nov 2017
A 1.6 sd rise.
The ratio of risers to fallers was 4:4 with France falling by 1.3 sd.
Higher with a fall being expected.

Ineichen Research & Management – www.ineichen-rm.com
Risk Management Research Flash Update
- 6 - 03 March 2018
Jan Feb Mar r SD
70.3 71.0 n.a. Average
17.7 13.1 n.a. US: Empire State Fed
22.2 25.8 n.a. US: Philadelphia Fed
14.0 28.0 n.a. l US: Richmond Fed
33.4 37.2 n.a. US: Dallas Fed
0.1 n.a. n.a. US: Chicago Fed
106.9 n.a. n.a. l US: NFIB small biz opt.
8 8 n.a. l Canada: BoC
59.0 58.8 n.a. Brazil: CNI
1.56 1.48 n.a. Eurozone: EC
117.6 115.4 n.a. l Germany: IFO
114 112 n.a. France: INSEE
109.9 110.6 n.a. I taly: ISEA
1.8 1.9 n.a. Belgium: NBB
35 33 n.a. UK: Lloyds
34.5 25.8 n.a. Switzerland: CS/CFA
-3.0 -3.0 n.a. Russia: FSSS
51.3 50.3 n.a. China: CFLP
1.0 7.2 n.a. l Japan: Small biz (JFC)
11.8 n.a. n.a. Australia: NAB Conf.
82 77 82 l South Korea: BoK
-37.8 -19.0 n.a. l New Zealand: NBNZ
May 2007 to Dec 2017
Business sentiment: stalling
Source: IR&M, Bloomberg. Notes: The average is equal weighted and is calculated from percentiles. r=Direction of latest change. SD=Latest change that exceeds one standard deviation is marked with a green or red dot.
Economy Valuation Risk
Business sentiment has been ping-ponging between “stalling” and “rising” and “falling” over the past months. December was a 0.3 sd “fall.” January was unchanged. February is a 0.1 sd “rise” so far.
Table shows a selection of indicators for business sentiment. The average is measured as average percentile of the indicators. A 6-point move of the average represents one standard deviation (sd).
The most important thing
Business sentiment is flat.
Lower and in line with expectations.
A 2.0 sd rise and much better than expected.
Lower and below expectations but January revised upwards.
Higher with a fall being expected.
Smallest of upticks.
Small fall.
Sizable reversal after fall.

Ineichen Research & Management – www.ineichen-rm.com
Risk Management Research Flash Update
- 7 - 03 March 2018
Jan Feb Mar r SD
79.8 78.1 n.a. Average
95.7 99.7 n.a. US: UoMichigen
124.3 130.8 n.a. l US: Conf Board
n.a. n.a. n.a. l Canada: OECD
88.8 87.4 n.a. Brazil: FGV
84.2 n.a. n.a. l Mexico: INEGI
1.4 0.1 n.a. Eurozone: EC
10.8 11.0 10.8 Germany: GfK
104 100 n.a. l France: INSEE
115.5 115.6 n.a. I taly: ISTAT
1.3 0.4 n.a. Spain: EC
24 23 n.a. Netherlands: CBS
8.2 8.5 n.a. Denmark: DNB
110.4 n.a. n.a. l Ireland: I IB
-51.0 -53.0 n.a. Greece: EC
-9 -10 n.a. UK: GfK
n.a. n.a. n.a. Switzerland: UBS
107.2 104.7 n.a. Sweden: NIER
n.a.n.a. n.a. n.a. l China: NBSC
44.7 44.3 n.a. Japan: ESRI
105.1 102.8 n.a. Australia: Westpac
109.9 108.2 n.a. South Korea: BoK
126.9 127.7 n.a. New Zealand: ANZ
Apr 2007 to Dec 2017
Consumer sentiment: falling
Source: IR&M, Bloomberg. Notes: The average is equal weighted and is calculated from percentiles. r=Direction of latest change. SD=Latest change that exceeds one standard deviation is marked with a green or red dot.
Economy Valuation Risk
Table shows a selection of indicators for consumer sentiment. The average is measured as average percentile of the indicators. A 4-point move of the average represents one standard deviation. The commentary in the table refer to changes since last shown.
Consumer sentiment has been rising more or less gradually from April 2016 to January 2018. February was a 0.5 standard deviation fall (so far). The last fall that was stronger than that was in July 2016 (-0.8 sd).
The most important thing
Sentiment fell in February.
Lower and below expectations.
Higher and better than expected.
Lower.
A 2.1 fall and below expectations.
Small fall.

Ineichen Research & Management – www.ineichen-rm.com
Risk Management Research Flash Update
- 8 - 03 March 2018
PMI: sharp falls in Europe
Source: IR&M, Bloomberg. Notes: PMI stands for Purchasing Manager Index and is a diffusion index. A figure above 50 means the economy is improving, below 50 means the economy is worsening. The average is equally
weighted. *The direction of the latest change is shown with an arrow. Changes larger than one standard deviation are marked with a red or green dot. A green/red highlight means figure was better/worse than expected.
Economy Valuation Risk
High Low Jan Feb
58.5 48.5 57.2 57.0 Average
60.8 47.8 59.1 60.8 l USA (ISM)
55.7 50.7 55.5 55.3 USA (Markit)
55.9 47.5 55.9 55.6 Canada (Markit)
59.9 51.4 58.9 58.0 l EU (Markit)
60.6 51.2 59.6 58.6 l Eurozone (Markit)
63.3 50.5 61.1 60.6 Germany (Markit)
58.8 48.0 58.4 55.9 l France (Markit)
58.4 48.5 55.3 55.2 UK (Markit)
63.4 51.7 62.5 63.4 Netherlands (Markit)
59.0 49.8 59.0 56.8 l Italy (Markit)
56.1 51.0 55.2 56.0 Spain (Markit)
65.6 47.3 65.3 65.5 Switzerland (CS)
65.2 51.0 57.0 59.9 Sweden (Swedbank)
59.1 44.2 58.4 57.5 Norway (Danske Bank)
54.8 47.7 54.8 54.1 Japan (Markit/JMMA)
59.8 44.2 58.7 57.5 Australia (AIG)
59.9 51.1 55.6 n.a. New Zealand (BoNZ)
56.9 46.1 56.9 56.0 Taiwan (Markit)
51.2 46.1 50.7 50.3 South Korea (Markit)
51.5 44.4 51.1 n.a. Hong Kong (Markit)**
53.1 48.5 53.1 52.7 Singapore (SIoPMM)
3-year
Mar 2015 to Dec 2017 r * High Low Jan Feb
58.8 50.0 56.7 56.5 Average
59.9 51.6 59.9 n.a. USA (ISM Non-Man.)
59.2 49.7 53.3 55.9 l USA (Markit)
56.8 51.5 56.8 n.a. EU (Markit)
58.0 52.2 58.0 56.7 l Eurozone (Markit)
57.3 50.9 57.3 55.3 l Germany (Markit)
60.4 47.2 59.2 57.9 France (Markit)
59.5 47.4 53.0 n.a. UK (Markit)
57.7 49.8 57.7 n.a. Italy (Markit)
60.3 54.1 56.9 n.a. Spain (Markit)
64.6 52.6 61.3 n.a. Sweden (Swedbank)
53.7 48.2 51.9 n.a. Japan (Markit)
57.7 45.0 54.9 n.a. Australia (AIG)
3-year
Mar 2015 to Dec 2017 r *
The ratio of risers to fallers was 6:17, i.e., clearly negative. There were more negative outliers than positive outliers. The former are in Europe, the later in the US. France and Eurozone fell by more than two standard deviation, as the preliminary estimates implied they would.
Latest
Change
Change > 1 standard dev.
Red: below exp. Green: above exp.
Manufacturing Services
Ineichen Research & Management – www.ineichen-rm.com
Risk Management Research Flash Update
- 9 - 03 March 2018
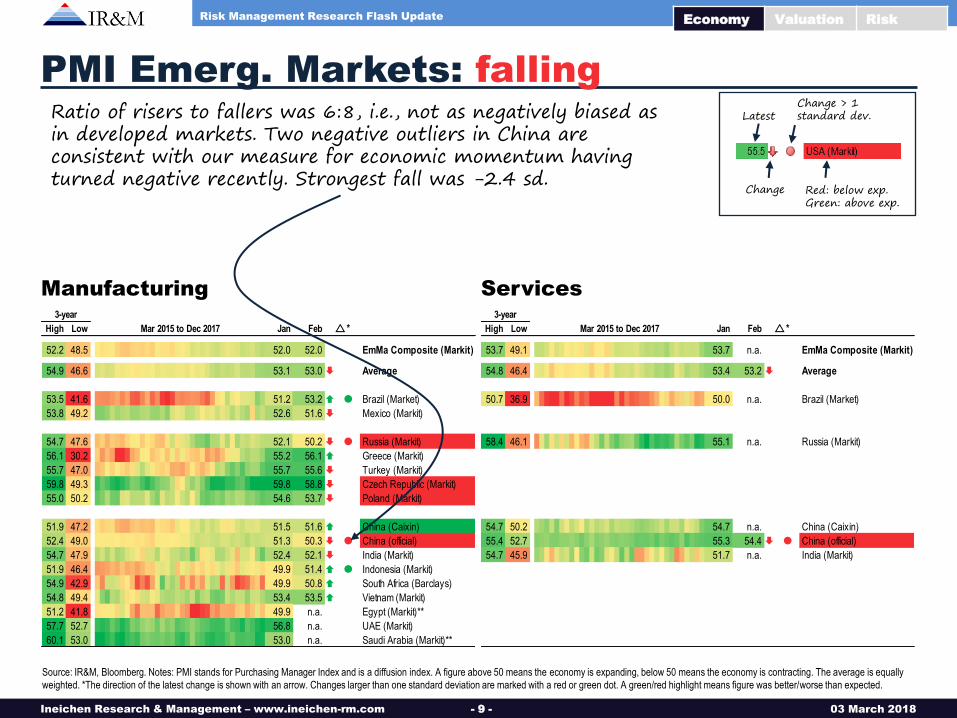
Ratio of risers to fallers was 6:8, i.e., not as negatively biased as in developed markets. Two negative outliers in China are consistent with our measure for economic momentum having turned negative recently. Strongest fall was -2.4 sd.
PMI Emerg. Markets: falling
Source: IR&M, Bloomberg. Notes: PMI stands for Purchasing Manager Index and is a diffusion index. A figure above 50 means the economy is expanding, below 50 means the economy is contracting. The average is equally
weighted. *The direction of the latest change is shown with an arrow. Changes larger than one standard deviation are marked with a red or green dot. A green/red highlight means figure was better/worse than expected.
Economy Valuation Risk
Manufacturing Services
High Low Jan Feb
52.2 48.5 52.0 52.0 EmMa Composite (Markit)
54.9 46.6 53.1 53.0 Average
53.5 41.6 51.2 53.2 l Brazil (Market)
53.8 49.2 52.6 51.6 Mexico (Markit)
54.7 47.6 52.1 50.2 l Russia (Markit)
56.1 30.2 55.2 56.1 Greece (Markit)
55.7 47.0 55.7 55.6 Turkey (Markit)
59.8 49.3 59.8 58.8 Czech Republic (Markit)
55.0 50.2 54.6 53.7 Poland (Markit)
51.9 47.2 51.5 51.6 China (Caixin)
52.4 49.0 51.3 50.3 l China (official)
54.7 47.9 52.4 52.1 India (Markit)
51.9 46.4 49.9 51.4 l Indonesia (Markit)
54.9 42.9 49.9 50.8 South Africa (Barclays)
54.8 49.4 53.4 53.5 Vietnam (Markit)
51.2 41.8 49.9 n.a. Egypt (Markit)**
57.7 52.7 56.8 n.a. UAE (Markit)
60.1 53.0 53.0 n.a. Saudi Arabia (Markit)**
3-year
Mar 2015 to Dec 2017 r* High Low Jan Feb
53.7 49.1 53.7 n.a. EmMa Composite (Markit)
54.8 46.4 53.4 53.2 Average
50.7 36.9 50.0 n.a. Brazil (Market)
58.4 46.1 55.1 n.a. Russia (Markit)
54.7 50.2 54.7 n.a. China (Caixin)
55.4 52.7 55.3 54.4 l China (official)
54.7 45.9 51.7 n.a. India (Markit)
3-year
Mar 2015 to Dec 2017 r*
Latest
Change
Change > 1 standard dev.
Red: below exp. Green: above exp.

Ineichen Research & Management – www.ineichen-rm.com
Risk Management Research Flash Update
- 10 - 03 March 2018
20
30
40
50
60
70
0
5
10
15
20
25
2005 2006 2007 2008 2009 2010 2011 2012 2013 2014 2015 2016 2017 2018
PM
I
Ind
us
tria
l ou
tpu
t, y
oy
Industrial output, yoy (lhs) PMI (CFLP, rhs) New Export Orders PMI (CFLP, rhs)
China industrial output: stable
Source: IR&M, Bloomberg. January industrial output incorporated in February figures due to Lunar New Year. *Annualised average monthly return in month that follows subsequent month, i.e., March returns for January PMI.
Economy Valuation Risk
The PMI indicators shown here have been going sideways for years. Industrial production seems stable too. No trajectories breached. However, the new export order that features in our regime test in the upper right fell below 50 for the first time since October 2016, as mentioned in the 2 February update. Now a second regime test turned negative.
New export orders PMI Return, pa* Tenure, %
rising (12M average) 20.7% 50
falling (12M average) 5.9% 50
above 50 14.2% 64
below 50 8.1% 36
PMI Return, pa* Tenure, %
No 2 sd fall(s) within last 4M 15.9% 94
2 sd fall(s) within last 4M -14.3% 6
Shanghai Composite (Jan 2005-)
Ineichen Research & Management – www.ineichen-rm.com
Risk Management Research Flash Update
- 11 - 03 March 2018
0
20
40
60
80
100
120
140
0 20 40 60 80 100 120 140 160
Co
nfe
ren
ce
Bo
ard
Co
ns.
Co
nf.
Ex
pe
cta
tio
ns
Conference Board Consumer Confidence
Recovery
Recession
Boom
Slowdown
02-2009
06-2008
02-200102-2018 (latest)
05-1983
12-1973
"Path" since 1967
Ave
rage
sin
ce 1
967
= 93
Average since 1967 = 91
04-1967
01-2000
12-2013
12-2014
12-2012
"Trading range" in 2015/2016
12-2015
"Red alert" zone(path Jan-Jun 2008)
12-2016
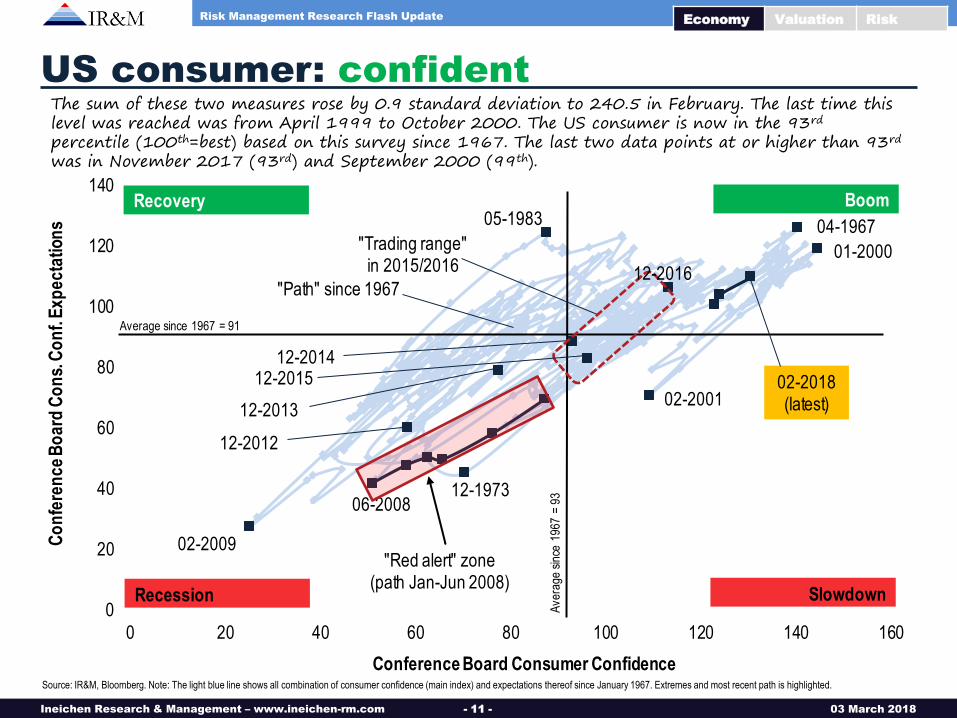
US consumer: confident
Source: IR&M, Bloomberg. Note: The light blue line shows all combination of consumer confidence (main index) and expectations thereof since January 1967. Extremes and most recent path is highlighted.
The sum of these two measures rose by 0.9 standard deviation to 240.5 in February. The last time this level was reached was from April 1999 to October 2000. The US consumer is now in the 93rd percentile (100th=best) based on this survey since 1967. The last two data points at or higher than 93rd was in November 2017 (93rd) and September 2000 (99th).
Economy Valuation Risk

Ineichen Research & Management – www.ineichen-rm.com
Risk Management Research Flash Update
- 12 - 03 March 2018
-50
-40
-30
-20
-10
0
10
20
30
40
0 0.5 1 1.5 2 2.5 3 3.5
Ric
hm
on
d F
ed
Ma
nu
fac
turi
ng
Ind
ex
Richmond Fed: Service Sector Expected Trends
Recovery
Recession
Boom
Slowdown
02-2009
02-2018 (latest)
03-2004
08-2008
05-2006
Av
erag
e si
nce
1993
"Trading range"since 1993
12-2014
11-2009
"Path"since 2007
04-2010
"Red alert zone"(H1 2008)
12-2015Av erage since 1993
12-2016
Richmond Fed: off the charts Indicator (vertical axis) is a diffusion index and above 0 means economic expansion.
Economy Valuation Risk
November we titled “off the charts” as November was outside the dotted line. February is off the charts too. It’s the 100th percentile since 1994.
Source: IR&M, Bloomberg.
Notes: Dotted line shows “trading range” since 1993, blue-dotted lines show path since 2007. “Red alert zone” refers to six observations in the first half of 2008. *Average annualised monthly return of subsequent month.
Richmond Fed Manufact. Index Return, pa* Tenure, %
above -10 4.3% 87
below -10 -5.5% 13
No 3 sd fall(s) within last 4M 3.7% 93
3 sd fall(s) within last 4M -14.5% 7
S&P 500 (Jan 1994 -)

Ineichen Research & Management – www.ineichen-rm.com
Risk Management Research Flash Update
- 13 - 03 March 2018
UK economy: improving again
Source: IR&M, Bloomberg. Note: Survey is based on 200 companies with revenues more than GBP1m. *Annualised average monthly returns in subsequent month.
-80
-60
-40
-20
0
20
40
60
80
-8
-6
-4
-2
0
2
4
6
8
2002 2003 2004 2005 2006 2007 2008 2009 2010 2011 2012 2013 2014 2015 2016 2017 2018
Llo
yd
s B
an
k B
us
ines
s B
aro
me
ter
UK
GD
P
UK GDP (lhs) Lloyds Bank Business Barometer (rhs) 6-month average
Bre
xit v
ote
Economy Valuation Risk
The average is rising and the latest observation was a non-event.
Random post-Brexit remark: If one agrees that many western economies require structural reform to get productivity up, then Brexit could be a good thing. A recession often means short-term-pain-for-long-term-gain. Most industrialised economies currently prefer short-term-pain-relief-for-long-term-pain via ZIRP and NIRP. The UK’s opportunity to break with that latter pattern could mean that the market can clear (the short-term pain) and capital re-allocated more efficiently (which then results in long-term gain).
Lloyds Business Barometer Return, pa* Tenure, %
rising (6M average) 4.2% 51
falling (6M average) 2.1% 49
above 0 5.5% 93
below 0 -25.3% 7
FTSE 100 (Jan 2002-)

Ineichen Research & Management – www.ineichen-rm.com
Risk Management Research Flash Update
- 14 - 03 March 2018
0
1
2
3
4
5
6
0
500
1000
1500
2000
2500
3000
1980 1985 1990 1995 2000 2005 2010 2015
Un
em
plo
ym
ent r
ate
, %
To
pix
Topix (lhs) Unemployment rate (rhs) Rise > 2 sd Fall < -2 sd
Japan unemployment: low
The graph shows the Topix Index with the unemployment rate, large swings marked.
Source: IR&M, Bloomberg. *Annualised average monthly return in month that follows subsequent month.
Economy Valuation Risk
Unemployment rate fell by 0.3% (2.8 standard deviation) in January to 2.4% last seen in 1993
Unemployment rate: Return, pa* Tenure, %
falling (12M average) 7.9% 47
rising (12M average) 3.0% 53
Topix (Jan 1980 -)
Ineichen Research & Management – www.ineichen-rm.com
Risk Management Research Flash Update
- 15 - 03 March 2018
-40
-30
-20
-10
0
10
20
30
40
50
60
60
70
80
90
100
110
120
130
140
150
160
1990 1992 1994 1996 1998 2000 2002 2004 2006 2008 2010 2012 2014 2016 2018
SM
I (1
-ye
ar
retu
rn, %
)
KO
F
KOF LEI below average of 100 KOF Leading Indicator (lhs) 1Y return of SMI (rhs)
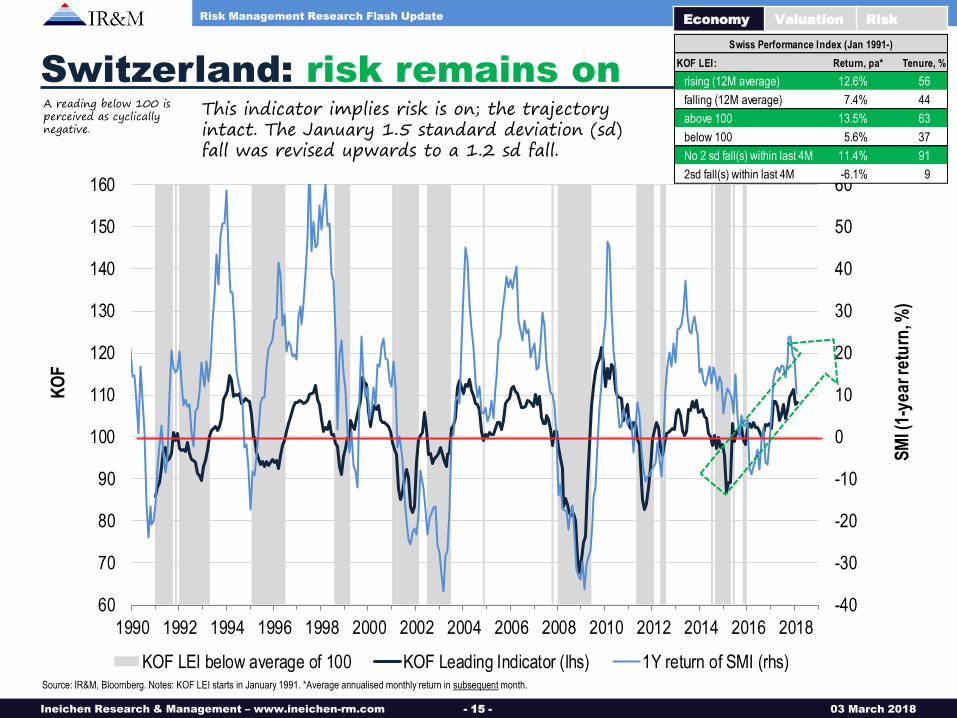
Switzerland: risk remains on
Source: IR&M, Bloomberg. Notes: KOF LEI starts in January 1991. *Average annualised monthly return in subsequent month.
This indicator implies risk is on; the trajectory intact. The January 1.5 standard deviation (sd) fall was revised upwards to a 1.2 sd fall.
Economy Valuation Risk
A reading below 100 is perceived as cyclically negative.
KOF LEI: Return, pa* Tenure, %
rising (12M average) 12.6% 56
falling (12M average) 7.4% 44
above 100 13.5% 63
below 100 5.6% 37
No 2 sd fall(s) within last 4M 11.4% 91
2sd fall(s) within last 4M -6.1% 9
Swiss Performance Index (Jan 1991-)
Ineichen Research & Management – www.ineichen-rm.com
Risk Management Research Flash Update
- 16 - 03 March 2018
4500
5000
5500
6000
6500
7000
7500
8000
8500
9000
9500
10000
-120
-100
-80
-60
-40
-20
0
20
40
60
80
100
2006 2007 2008 2009 2010 2011 2012 2013 2014 2015 2016 2017 2018
SM
I
CS
/CF
A E
co
no
mic
Ex
pe
cta
tio
ns
CS/CFA ind. below zero CS/CFA Switzerland Expectation of Economic Growth (lhs) SMI (rhs)
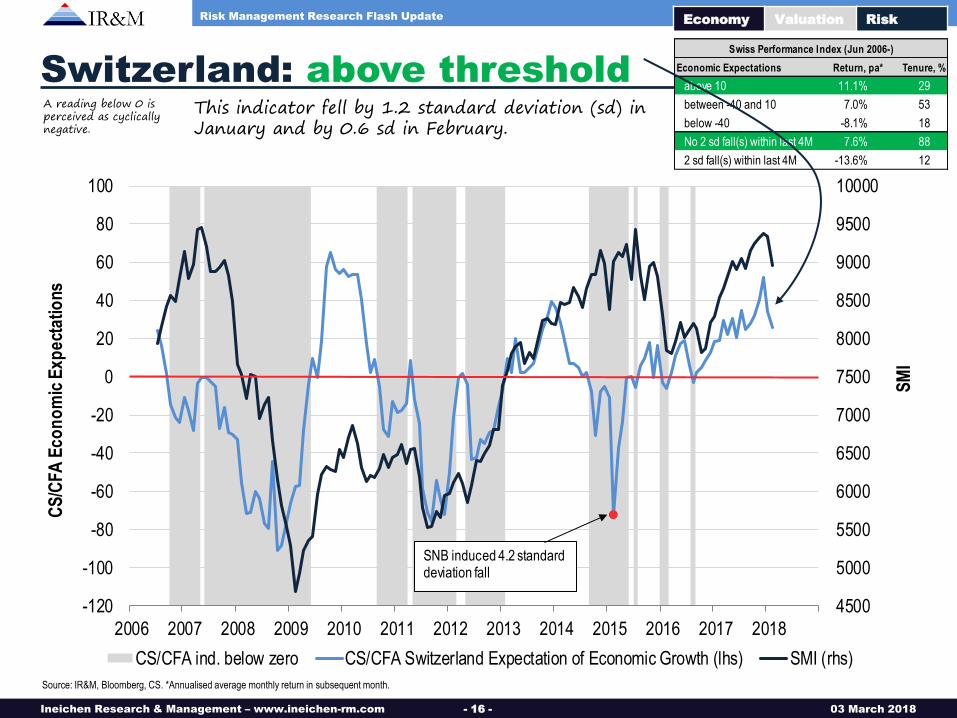
SNB induced 4.2 standard deviation fall
Switzerland: above threshold
Source: IR&M, Bloomberg, CS. *Annualised average monthly return in subsequent month.
Economy Valuation Risk
A reading below 0 is perceived as cyclically negative.
This indicator fell by 1.2 standard deviation (sd) in January and by 0.6 sd in February.
Economic Expectations Return, pa* Tenure, %
above 10 11.1% 29
between -40 and 10 7.0% 53
below -40 -8.1% 18
No 2 sd fall(s) within last 4M 7.6% 88
2 sd fall(s) within last 4M -13.6% 12
Swiss Performance Index (Jun 2006-)

Ineichen Research & Management – www.ineichen-rm.com
Risk Management Research Flash Update
- 17 - 03 March 2018
70
75
80
85
90
95
100
105
110
115
120
0
5,000
10,000
15,000
20,000
25,000
30,000
35,000
40,000
45,000
50,000
2000 2002 2004 2006 2008 2010 2012 2014 2016 2018
Ita
lian
Bu
sin
es
s C
on
fid
en
ce
FT
SE
MIB
FTSE MIB (lhs) Italy: Business confidence (rhs) 12-month average (rhs)
Current percentile of business confidence: 88th Ren
zi a
ssum
es o
ffice
in F
ebru
ary
2014
Ren
zi le
aves
offi
cein
Dec
embe
r20
16
Italy business conf.: rising
Source: IR&M, Bloomberg, ISTAT. *Annualised average monthly return in subsequent month.
Economy Valuation Risk
Business confidence is rising and the two tests in the insert imply risk is on. (The 4-month average started falling in Janaury though.)
Graph contrasts a business confidence indicator with the stock market.
I talian Business Confidence Return, pa* Tenure, %
rising (6M average) 10.1% 52
falling (6M average) -13.2% 48
rising (12M average) 4.4% 49
falling (12M average) -7.0% 51
FTSE MIB (Jan 2000-)

Ineichen Research & Management – www.ineichen-rm.com
Risk Management Research Flash Update
- 18 - 03 March 2018
80
85
90
95
100
105
110
115
120
0
20
40
60
80
100
120
140
1995 1997 1999 2001 2003 2005 2007 2009 2011 2013 2015 2017
Co
ns
um
er
Co
nfi
de
nc
e In
dic
ato
r
MS
CI
Ita
ly
MSCI Italy (lhs) Consumer Confidence (rhs) Rise > 1.5 sd Fall < -1.5 sd
Current percentile: 96th
Italy cons. confidence: rising
Source: IR&M, Bloomberg, ISTAT. *Annualised monthly return in subsequent month.
Economy Valuation Risk
Consumer sentiment is rising when judged by a 12-month moving average. December was a 0.9 sd rise, January a 0.4 sd fall, February a non-event.
Consumer confidence: Return, pa* Tenure, %
rising (12M average) 9.5% 53
falling (12M average) -1.8% 47
above 100 5.8% 60
below 100 0.3% 40
No 1.5 sd fall(s) within last 4M 10.3% 74
1.5 sd fall(s) within last 4M -13.4% 26
MSCI Italy (Jan 1995 -)

Ineichen Research & Management – www.ineichen-rm.com
Risk Management Research Flash Update
- 19 - 03 March 2018
60
70
80
90
100
110
120
130
60 70 80 90 100 110 120
Ec
on
om
ic T
en
den
cy In
dic
ato
r (N
IER
)
Business Confidence (NIER)
Recovery
Recession
Boom
Slowdown
09-2017
03-2009
Av erage since 1997
Av
erag
e si
nce
1997
11-2008
06-2009
02-2018 (latest)
overall pathsince 1997
12-2014
12-201612-2015
12-2017
Sweden: worsening
Sweden was in the 100th percentile since 1997 from September to November 2017. From December to February 2018 it fell to 95th, 89th, and 88th. The movement, therefore, is from the upper right towards the lower left. One regime test implies lower future returns.
Source: IR&M, Bloomberg, NIER (National Institute of Economic Research). *Annualised monthly return in subsequent month. **Both indicators above 100 and 4-month average of Economic Tendency Index rising.
Economy Valuation Risk
NIER indicators: Return, pa* Tenure, %
in upper/right quadrant and rising** 17.8% 39
not 2.3% 61
Economic tendency indicator: Return, pa* Tenure, %
No 2 sd fall(s) within 4M 11.1% 92
2 sd fall(s) within 4M -17.0% 8
MSCI Sweden (Jan 1997 -)
Ineichen Research & Management – www.ineichen-rm.com
Risk Management Research Flash Update
- 20 - 03 March 2018
-5
-4
-3
-2
-1
0
1
2
3
4
5
TW
SE
Na
sdaq
Kos
pi 2
00
S&
P/A
SX
200
Sha
ngh
ai C
omp.
DA
XK
Ha
ng S
eng
Nik
kei 2
25
IBE
X 3
5
S&
P 5
00
CA
C 4
0
S&
P/T
SX
60
Nift
y
FT
SE
MIB
Eur
o S
TO
XX
50
IBO
V
FT
SE
10
0
SM
I
CR
B C
omm
.
Go
ld fu
t.
Co
ppe
r fu
t.
Oil
(WT
I) f
ut.
US
Tre
asu
ry fu
t.
Ge
rman
Bun
d fu
t.
JGB
fut.
EU
R
JPY
GB
P
CH
F
Bitc
oin
VIX
MO
VE
VX
Y
US
HY
sp
rea
d
1-w
ee
k c
ha
ng
e in
sta
nd
ard
de
via
tio
n*
Commodities (c10Y)Cyclicality**High Low
1-week change to 02 Mar 2018
(against USD) Risk***
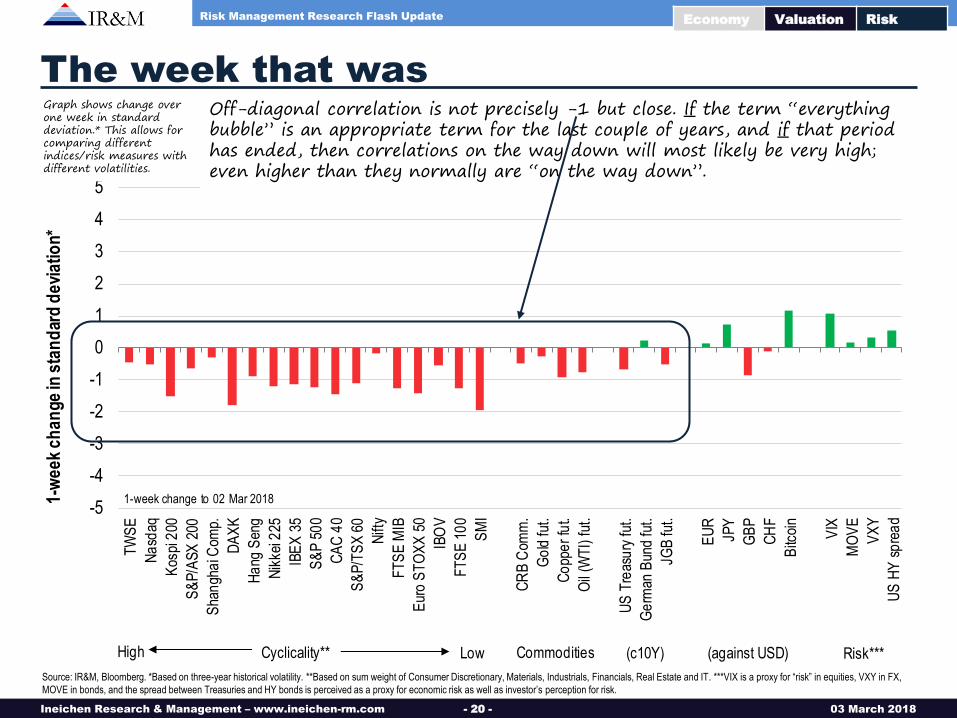
The week that was
Source: IR&M, Bloomberg. *Based on three-year historical volatility. **Based on sum weight of Consumer Discretionary, Materials, Industrials, Financials, Real Estate and IT. ***VIX is a proxy for “risk” in equities, VXY in FX,
MOVE in bonds, and the spread between Treasuries and HY bonds is perceived as a proxy for economic risk as well as investor’s perception for risk.
Economy Valuation Risk
Off-diagonal correlation is not precisely -1 but close. If the term “everything bubble” is an appropriate term for the last couple of years, and if that period has ended, then correlations on the way down will most likely be very high; even higher than they normally are “on the way down”.
Graph shows change over one week in standard deviation.* This allows for comparing different indices/risk measures with different volatilities.
“Never try to sell at the top. It isn't wise. Sell after a reaction if
there is no rally.”
—Edwin Lefevre (1871-1943), American journalist and writer***

Ineichen Research & Management – www.ineichen-rm.com
Risk Management Research Flash Update
- 21 - 03 March 2018
0
200
400
600
800
1000
1200
1400
1600
1800
2000
1990 1992 1994 1996 1998 2000 2002 2004 2006 2008 2010 2012 2014 2016 2018
Rya
n L
abs
10-y
ear
Trea
sury
To
tal R
etu
rn In
dex
Ryan Labs 10-year Treasury Total Return Index
Technically speaking…
Fundamental analysts as well as finance academics both make fun of technical analysis. (The word “voodoo” is occasionally used.) However, one of the formations that has merit and also has a footing in empirical research is the so-called head-and-shoulder formation, shown in green. (A formation Professor Andrew Lo* “signed off” as being worth the practitioner’s attention in 2000.) It’s a pattern that marks a top. The idea is that if the so-called neckline is taken from above, all bets are off, i.e., the trend is broken and it’s a bear market.
Economy Valuation Risk
Source: IR&M, Bloomberg.
*“Foundations of technical analysis: computational algorithms, statistical inference, and empirical implementation”, by Andrew Lo, Harry Mamaysky and Jiang Wang, Journal of Finance, August 2000.

Ineichen Research & Management – www.ineichen-rm.com
Risk Management Research Flash Update
- 22 - 03 March 2018
0
500
1000
1500
2000
2500
3000
1990 1992 1994 1996 1998 2000 2002 2004 2006 2008 2010 2012 2014 2016 2018
S&
P 5
00
Ind
ex
S&P 500 Index Daily loss worse than 2 standard deviation
Trivia: putting things into perspective
Source: IR&M, Bloomberg.
At the moment it is difficult to assess whether the most recent negative outliers resemble 1998, 2000, 2007, 2011, or 2015.
Economy Valuation Risk
Ineichen Research & Management – www.ineichen-rm.com
Risk Management Research Flash Update
- 23 - 03 March 2018
400
600
800
1000
1200
1400
1600
1800
2000
2200
2400
1990 1992 1994 1996 1998 2000 2002 2004 2006 2008 2010 2012 2014 2016 2018
MS
CI
Wo
rld
MSCI World All 8 stock markets* fall by 1 standard deviation or more
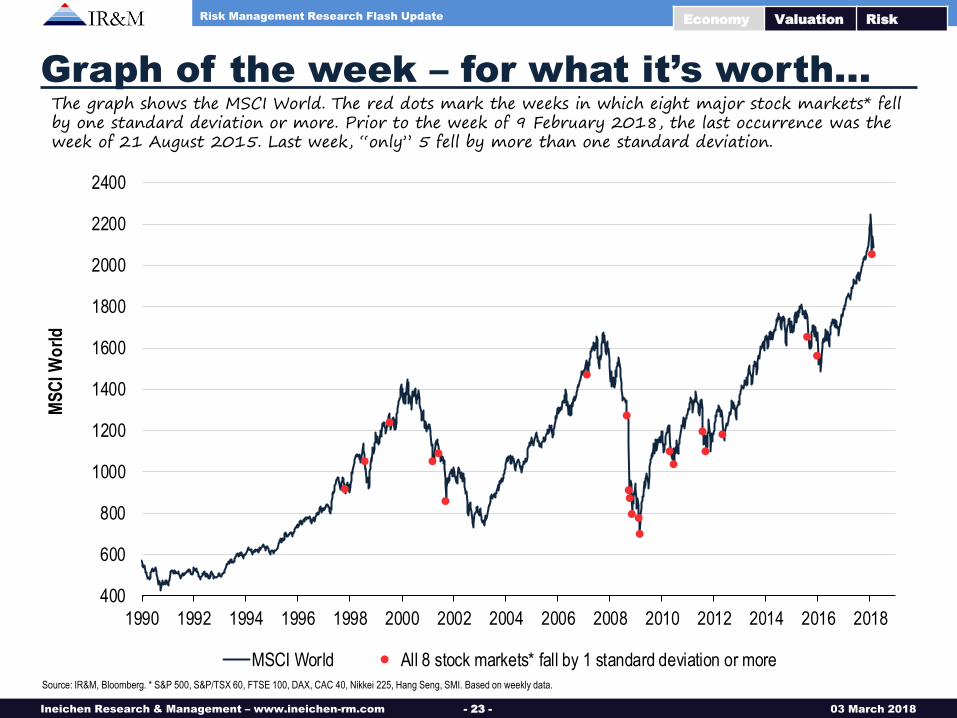
Graph of the week – for what it’s worth…
Source: IR&M, Bloomberg. * S&P 500, S&P/TSX 60, FTSE 100, DAX, CAC 40, Nikkei 225, Hang Seng, SMI. Based on weekly data.
The graph shows the MSCI World. The red dots mark the weeks in which eight major stock markets* fell by one standard deviation or more. Prior to the week of 9 February 2018, the last occurrence was the week of 21 August 2015. Last week, “only” 5 fell by more than one standard deviation.
Economy Valuation Risk
Ineichen Research & Management – www.ineichen-rm.com
Risk Management Research Flash Update
- 24 - 03 March 2018
Copyright © 2018 by Ineichen Research and Management AG, Switzerland All rights reserved. Reproduction or retransmission in whole or in part is prohibited except by permission. The information set forth in this document has been obtained from publicly available sources, unless stated otherwise. All information contained in this report is based on information obtained from sources which Ineichen Research and Management (“IR&M”) believes to be reliable. IR&M provides this report without guarantee of any kind regarding its contents. This document is for information purposes only and should not be construed as investment advice or an offer to sell (nor the solicitation of an offer to buy) any of the securities it refers to. The information has not been independently verified by IR&M or any of its affiliates. Neither IR&M nor any of its affiliates makes any representations or warranties regarding, or assumes any responsibility for the accuracy, reliability, completeness or applicability of, any information, calculations contained herein, or of any assumptions underlying any information, calculations, estimates or projections contained or reflected herein. Neither this document nor the securities referred to herein have been registered or approved by any regulatory authority of any country or jurisdiction. This material is confidential and intended solely for the information of the person to whom it has been delivered and may not be distributed in any jurisdiction where such distribution would constitute a violation of applicable law or regulation. While this document represents the author’s understanding at the time it was prepared, no representation or warranty, either expressed or implied, is provided in relation to the accuracy, completeness or reliability of the information contained herein, nor it is intended to be a complete statement or summary of the securities markets or developments referred to in the document. It should not be regarded by recipients as a substitute for the exercise of their own judgment. Investing in securities and other financial products entails certain risks, including the possible loss of the entire amount invested. Certain investments in particular, including those involving structured products, futures, options and other derivatives, are complex, may entail substantial risk and are not suitable for all investors. The price and value of, and income produced by, securities and other financial products may fluctuate and may be adversely impacted by exchange rates, interest rates or other factors. Information available on such securities may be limited. The securities described herein may not be eligible for sale in all jurisdictions or to certain categories of investors. You should obtain advice from your own tax, financial, legal and accounting advisers to the extent that you deem necessary and only make investment decisions on the basis of your objectives, experience and resources. Past performance is not necessarily indicative of future results. Unless specifically stated otherwise, all price information is indicative only. No liability whatsoever is accepted for any loss (whether direct, indirect or consequential) that may arise from any use of the information contained in or derived from this document. IR&M does not provide tax advice and nothing contained herein is intended to be, or should be construed as a, tax advice. Recipients of this report should seek tax advice based on the recipient’s own particular circumstances from an independent tax adviser.
Disclaimer