Embed Size (px)
DESCRIPTION
The pre-treatment step has a significant influence on the performance ofbioenergy chains, especially on logistics. In nowadays conditions it is important tohave technologies allowing to convert biomass at modest scales into dense energycarriers that ease transportation and handling. There are such technologies ascharring and torrefaction. It is a thermal treatment of organic waste (only woodybiomass is considered as a raw material in this work), which aims to produce afuel with increased energy density. Wood processing is attractive under meaningof green house gas emissions.
Citation preview
LAPPEENRANTA UNIVERSITY OF TECHNOLOGY
FACULTY OF TECHNOLOGY
BIOENERGY TECHNOLOGY
MASTER’S THESIS
ECONOMY OF CONVERTING WOOD TO BIOCOAL
Supervisors and Examiners: Professor D.Sc. Esa Vakkilainen
Professor D.Sc. Timo Hyppänen
Lappeenranta, 2010
Gleb Bagramov
ii
ABSTRACT
Lappeenranta University of Technology
Faculty of Technology
Bioenrgy Technology
Gleb Bagramov
Economy of converting wood to biocoal
Master’s Thesis
2010
113 pages, 44 figures, 37 tables, 2 appendices
Examiners: Professor D.Sc. Esa Vakkilainen
Professor D.Sc. Timo Hyppänen
Keywords: Torrefaction, charcoal, co-combustion, TOP technology, charcoal
briquette, wood briquette torrefaction, ability to pay of biocoal, production cost
The pre-treatment step has a significant influence on the performance of
bioenergy chains, especially on logistics. In nowadays conditions it is important to
have technologies allowing to convert biomass at modest scales into dense energy
carriers that ease transportation and handling. There are such technologies as
charring and torrefaction. It is a thermal treatment of organic waste (only woody
biomass is considered as a raw material in this work), which aims to produce a
fuel with increased energy density. Wood processing is attractive under meaning
of green house gas emissions.
Charring and torrefaction are promising technologies due to its high process
efficiency. It may be also attractive in the future as a renewable fuel with
improved storage properties, increased energy density (compared to raw wood)
for co-combustion and/or gasification.
iii
TABLE OF CONTENTS
1 INTRODUCTION .......................................................................................... 9
2 GENERAL OVERVIEW ............................................................................. 11
2.1 Cost effective climate change .............................................................................................11
2.2 Estimation of the woody biomass potential........................................................................13
2.3 World trade of the wood-based fuels .................................................................................15 2.3.1 Review of the market situation ......................................................................................15 2.3.2 Production of the wood-based fuels ...............................................................................16 2.3.3 Trade flows of the wood-based fuels .............................................................................20 2.3.4 Trade patterns...............................................................................................................26 2.3.5 Discussion ....................................................................................................................27 2.3.6 Conclusion ...................................................................................................................27
2.4 Competition for wood between material and energy use...................................................28
3 WOOD TO BIOCOAL................................................................................. 32
3.1 Charcoal production ..........................................................................................................32 3.1.1 Pyrolysis of the wood. Basic concept.............................................................................34 3.1.2 The process of the charcoal production..........................................................................35 3.1.3 Current technologies .....................................................................................................46 3.1.4 Main charcoal consumers..............................................................................................53 3.1.5 Charcoal briquette production .......................................................................................54
3.2 Torrefaction of the wood....................................................................................................57 3.2.1 Torrefaction principle. Research of the Mark J Prins team .............................................57 3.2.2 Current technologies .....................................................................................................64 3.2.3 Wood briquette torrefaction ..........................................................................................68
3.3 Co-combustion....................................................................................................................73
4 TECHNICAL AND ECONOMIC ANALYSIS OF THE BIOCOAL PRODUCTION................................................................................................ 80
4.1 Charcoal production in Russia Federation........................................................................80
4.2 Charcoal briquette production in Finland.........................................................................81
4.3 Torrefied briquette production in Brazil...........................................................................82
4.4 Ability to pay of biocoal at the Finnish market .................................................................84
4.5 Preliminary analysis of the investment and operation costs of the biocoal (TOP pellet) production plant located in Finland ........................................................................................87
5 FUTURE ASPECTS OF THE WOODY BIOMASS CONVERSION........ 97
5.1 Production of charcoal and combustion of paralytic vapors .............................................99

iv
5.2 Production of charcoal/torrefied fuel and/or synthetic gas by means of biomass gasification .............................................................................................................................101
5.3 Production of charcoal and bio-oil. The use of bio-oils as fuels in advanced cycles........102
5.4 Bio-oil separation. Bio-refinery........................................................................................103
6 CONCLUSIONS......................................................................................... 106
REFERENCES .............................................................................................. 108
APPENDIX
v
LIST OF ABBRIVEATIONS
a Year
ACB Accelerated Carbonization Biomass
Al Aluminum
As Arsenic
B Boron
BAP Biomass Action Plan
Ca Calcium
CH4 Methane
CHP Combined heat and power production
CO Carbon monoxide
CO2 Carbon dioxide
cm3 Cubic centimeter
daf Dry ash free
EBES AG European Bioenergy Services
ECN Energy Research Center of Netherlands
EU European Union
EUR The official currency of Eurozone
FAO Food and Agriculture Organization
Fe Iron
g Gram
GHG Greenhouse gas
GJ Gigajoule (109Joule)
GWh Gigawatt hour
H2 Hydrogen
h hour
ha Hectare
HDB High density briquette
IEA International Energy Agency
IUFRO The Global Network for Forest Science Cooperation
kg Kilogram
kJ Kilojoules (103Joule)
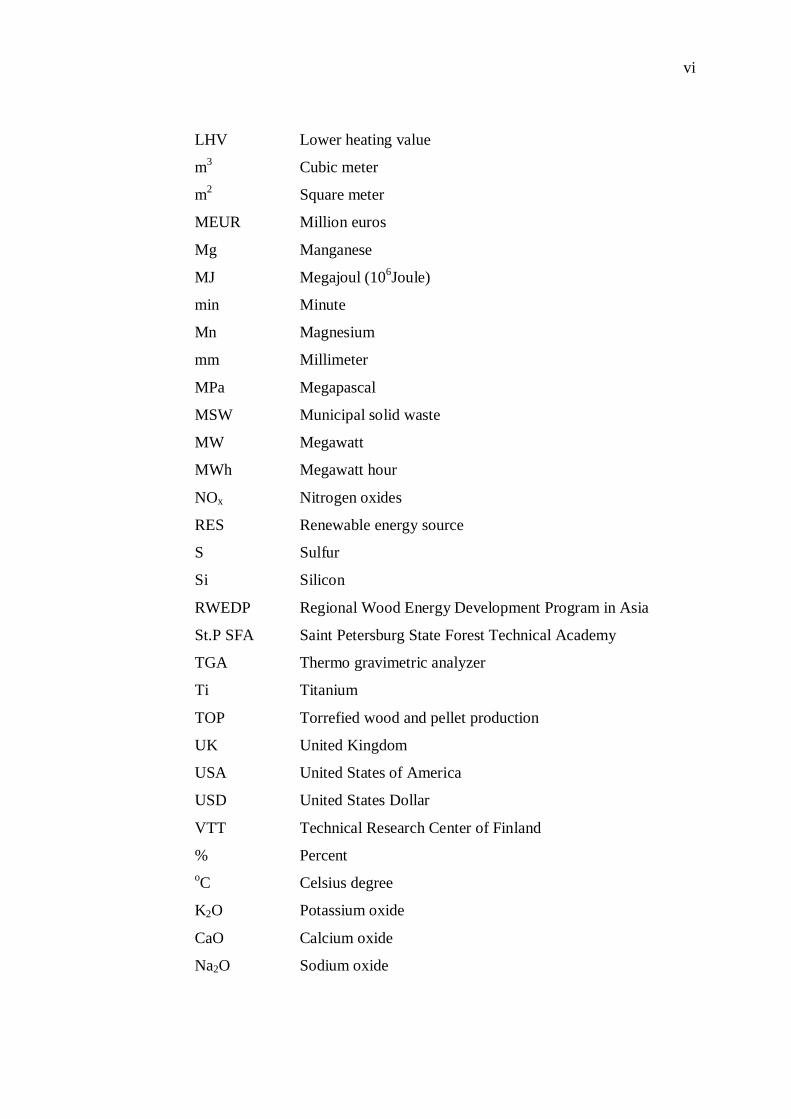
vi
LHV Lower heating value
m3 Cubic meter
m2 Square meter
MEUR Million euros
Mg Manganese
MJ Megajoul (106Joule)
min Minute
Mn Magnesium
mm Millimeter
MPa Megapascal
MSW Municipal solid waste
MW Megawatt
MWh Megawatt hour
NOx Nitrogen oxides
RES Renewable energy source
S Sulfur
Si Silicon
RWEDP Regional Wood Energy Development Program in Asia
St.P SFA Saint Petersburg State Forest Technical Academy
TGA Thermo gravimetric analyzer
Ti Titanium
TOP Torrefied wood and pellet production
UK United Kingdom
USA United States of America
USD United States Dollar
VTT Technical Research Center of Finland
% Percent oC Celsius degree
K2O Potassium oxide
CaO Calcium oxide
Na2O Sodium oxide

vii
ACKNOWLEDGEMENTS
This Master’s Thesis was carried out at the Lappeenranta University of
Technology between January and June 2010. I would like to thank my
supervisors Timo Hyppänen and especial Esa Vakkilainen for his valuable help
and useful advices during my work.
I would like to express my gratitude to Dubovy V.K. from Saint Petersburg
Forestry Institute for his big interest in my thesis and comments. Special thanks to
the manager of the plant in Suolahti (Finland) who kindly gave me interesting
information.
Many thanks to my close friends for their advices and sense of humor.
Finally, I would like to thank my family for all their support throughout my
studies
Lappeenranta, 17th of May 2010 Gleb Bagramov
viii
FOREWORD
Today there are many definitions related to the processes of producing coal from
wood: torrefaction, roasting, wood cooking, mild pyrolysis, pre pyrolysis, mild
thermal treatment and others. Try to specify it. Definitions “wood cooking” and
“mild thermal treatment” does not represent the exact meaning of the process;
“mild pyrolysis” and “pre pyrolysis” are not correct definitions because anyway
pyrolysis occurs. Wood fractions show different thermal behavior. Three zones
may therefore be distinguished in weight loss curves of wood: hemicelluloses, the
most reactive compounds, decompose at temperature in the range of 225–325o ,
cellulose at 305– 375o and lignin gradually over the temperature range of 250 –
500o . [Mark J. Prins, Krzysztof J., 2006]. By process definition, in this case,
torrefaction is the most suitable because under its meaning the process of the
hemicelluloses decomposition in the range 225-325o is supposed. But the
processes of producing charcoal may occur in higher temperature ranges. For
most areas of consumption, coal is considered qualitative, when the process is
completed at 450 - 550o . The product of the woody biomass treatment in high
temperature rates is charcoal (charring) but currently there is common word for all
types of wood conversion – biocoal. It is used not to mix mineral coal with coal
made from different types of biomass.
9
1 INTRODUCTION
Bioenergy provides about 10 percent of the world’s total primary energy supply
(47.2 EJ of bioenergy out of a total of 479 EJ in 2005, i.e. 9.85 percent). Most of
this is for use in the residential sector (for heating and cooking). In 2005
bioenergy represented 78 percent of all renewable energy produced. A full 97
percent of biofuels are made of solid biomass, 71 percent of which is used in the
residential sector [IEA 2006].
The European Union (EU) aims to achieve an ambitious 10% share of biofuels by
2020 [European Commission. Green Paper, 2006]. Driven by this target the
demand in biofuels in Europe is strongly increasing. With this short-term
development comes the need for an integrated long-term vision for biofuels. The
role of technological learning (and associated cost reductions) is also a crucial
factor affecting the possible market diffusion of various 1st and 2nd generation
biofuels. However, the EU import dependency in foreign energy is rising. Unless
domestic energy becomes more competitive in the next 20–30 years, around 70%
of the EU’s energy needs are expected to be met by imported products - some
from regions threatened by insecurity [European Commission. Green Paper,
2006].
At the national, regional and global levels there are as a rule three main drivers for
the development of bioenergy and biofuels. These are climate change, energy
security and rural development. The political motivation to support biofuels arises
from each individual driver or combinations. Policies designed to target one driver
can be detrimental to another. Modern biomass is becoming increasingly
important to countries as a low-carbon, distributed, renewable component of
national energy matrices.
Traditional biomass including fuelwood, charcoal and animal dung, continue to be
important sources of bioenergy in many parts of the world. To date, wood fuels
represent by far the most common sources of bioenergy and not only for less
developed regions. Wood fuels provide energy security service for large segments
of society and wood fuels technology is developing and expanding rapidly.
10
Modern bioenergy depends on efficient conversion technologies for applications
at household, small business and industrial scales.
The forestry segment can be utilized to generate electricity, heat, combined heat
and power, and other forms of bioenergy. Generally, the majority of biomass-
derived electricity is produced using a steam cycle process, in which biomass is
burned in a boiler to generate high-pressure steam, that flows over a series of
aerodynamic blades causing a turbine to rotate, which in response turns a
connected electric generator to produce electricity. Compacted forms of biomass
such as wood pellets and briquettes can also be used for combustion. This system
is known as the direct-fired system and is similar to the electricity generation
process of most fossil-fuel fired power plants.
Over recent years, especially co-firing of biomass materials in coal fired boilers
has increased, and some gasification technologies are nearing commercialization.
Co-firing biomass with coal is currently the most cost-efficient way of
incorporating renewable technology into conventional power production to use
existing power plant infrastructure without major modifications. Co-combustion
coal and biomass in large-scale coal plants is claimed to have significantly higher
combustion efficiency (up to 45 percent) than dedicated-biomass plants (30 to 35
percent using dry biomass and 22 percent for MSW). Co-combustion technology
options have been tested in Northern Europe, the United States, and Australia in
approximately 150 installations using woody and agricultural residues.
This work focuses on conventional technologies of charcoal production and future
aspects of torrefied wood production, their techno-economic analysis, respective
impacts, in terms of costs and energy uses in various chains for biomass
production and use.
11
2 GENERAL OVERVIEW
2.1 Cost effective climate change
In December 2005, the EC adopted a Biomass Action Plan (BAP), including
measures to increase the use of biomass for heat, electricity and transport [EC,
2005]. The included impact assessment proposes and examines a scenario in
which slightly more than three-fourths of the total bioenergy increase occurs in
stationary applications and about one-fourth comes from the transport sector. The
BAP also announced the development of future legislation on renewable energy in
heating to stimulate the use of biomass for heat.
The EU can increase bioenergy use by using more domestic resources or by
increasing the import of biofuels from the rest of the world. The opportunities for
producing biomass differ considerably between member states, and an increased
intra-European bioenergy trade in biomass and biofuels has been proposed as a
way to realize the bioenergy potential in EU25 [Ericsson and Nilsson, 2006].
Central and Eastern European countries, especially, appear to have a substantial
bioenergy potential compared to prospective domestic demand, and the estimated
production costs are lower than in Western European countries [Faaij A., 2005].
The present world trade in wood fuels is described in Hillring (2006) and the EC-
funded project EUBIONET II.
The regional and global potentials for biomass are uncertain [Berndes et al.,
2003]. But, it is clear that the potential of the long-term global supply is low
compared to the future required amount of climate-neutral energy in a world
aiming at ambitious CO2 stabilization targets [Azar C., 2005]. Therefore, it is
important to discuss both in which sector to use scarce biomass resources and
whether different policy objectives relevant to bioenergy agree on the order of
priority for the different options for using biomass for energy.
RES technologies are in general more labor intensive than conventional energy
technologies and bioenergy has the highest employment-creation potential
[ECOTEC, 1999]. Rural regions in particular can benefit from the establishment
of bioenergy industries and the related production of biomass. Since the expansion
12
of RES also involves establishing biomass conversion facilities in rural areas, an
even larger share of the estimated job opportunities would occur in rural regions.
The trade in biomass and biofuels both within and from other world regions to EU
requires further investigation. However, there are some lessons and
recommendations that are valid for policy at the EU level.
First of all, it can be concluded that if climate change mitigation and import
dependency reduction are the top priorities, bioenergy options based on
lignocellulosic resources should be promoted. Cost-effective ways to initiate
markets for lignocellulosic biomass in the EU, which can stimulate the
establishment and development of a supply infrastructure leading to cost
reductions along the biomass supply chain, need to be found.
In some countries, the implementation of biomass co-firing can serve as an
important initial market for lignocellulosic biomass. In other countries, biomass
use in district heating systems may be the best early option. The strategies have in
common that they will target heat and electricity generation since the technologies
for the production of second-generation biofuels for transport from lignocellulosic
feedstocks have not yet been fully demonstrated on a commercial scale.
In addition to support for basic research as well as demo and pilot biofuel plants,
new initiatives are desirable to stimulate the development of the lignocellulosic
supply systems.
Increased energy efficiency is one important element, which will likely need to be
complemented with additional measures in order to ensure that efficiency gains do
not induce increased energy service consumption negating the benefits. The
notion about global biomass scarcity relative to the future required levels of
climate neutral energy in a world aiming at ambitious CO2 stabilization targets
[Azar, 2005] makes the energy conservation argument strong also when
considering the option of large-scale bioenergy import from third countries to
mitigate domestic biomass scarcity in EU. Thus, energy efficiency and other
energy conservation measures should be promoted regardless of whether the fuels
are of fossil or biospheric origin.
13
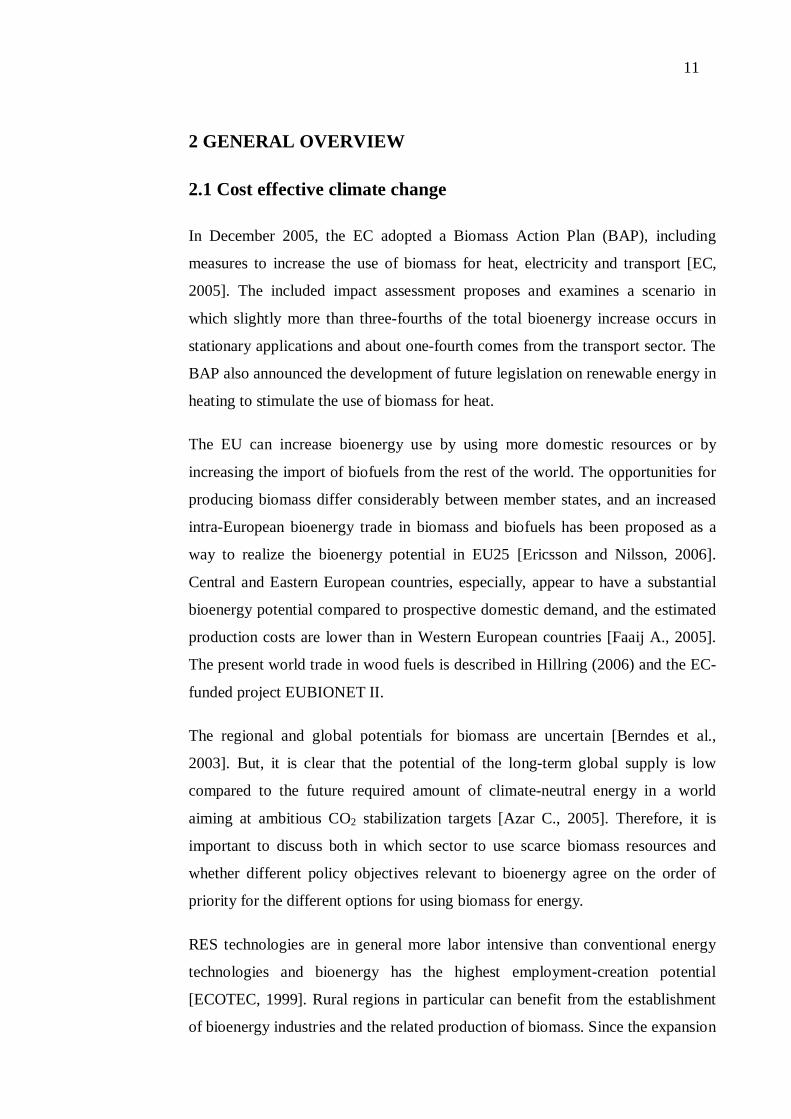
Biomass is an important energy source to create a more sustainable society.
However, nature has created a large diversity of biomass, not to forget the
modifications men makes to biomass to use it in industrial or domestic
applications. Hence the composition and properties of biomass is subjected to
many natural and human factors. Some of these need to be improved seriously to
enable their application as sustainable fuel in highly efficient biomass-to-energy
chains. This can be achieved through charring/torrefaction. Moreover, besides the
thermal conversion of biomass also logistic properties can be improved through
charring when it is combined with densification (pelletisation/briquetting). By this
combination very energy dense fuel pellets and briquettes are produced [Patrick
C.A. Bergman, 2005]. It can help to reduce significantly transportation costs
(Table 1).
Table 1: Transportation parameters of the untreated/charred biomass
Untreated Biomass Charred Biomass
Bulky Dense, If Pelletized, Etc.
Moist Dry (3-10%),
Fibrous Easily Crushed
Perishable Does not rot
Waste Valuable fuel
Expensive to transport Energy dense
2.2 Estimation of the woody biomass potential
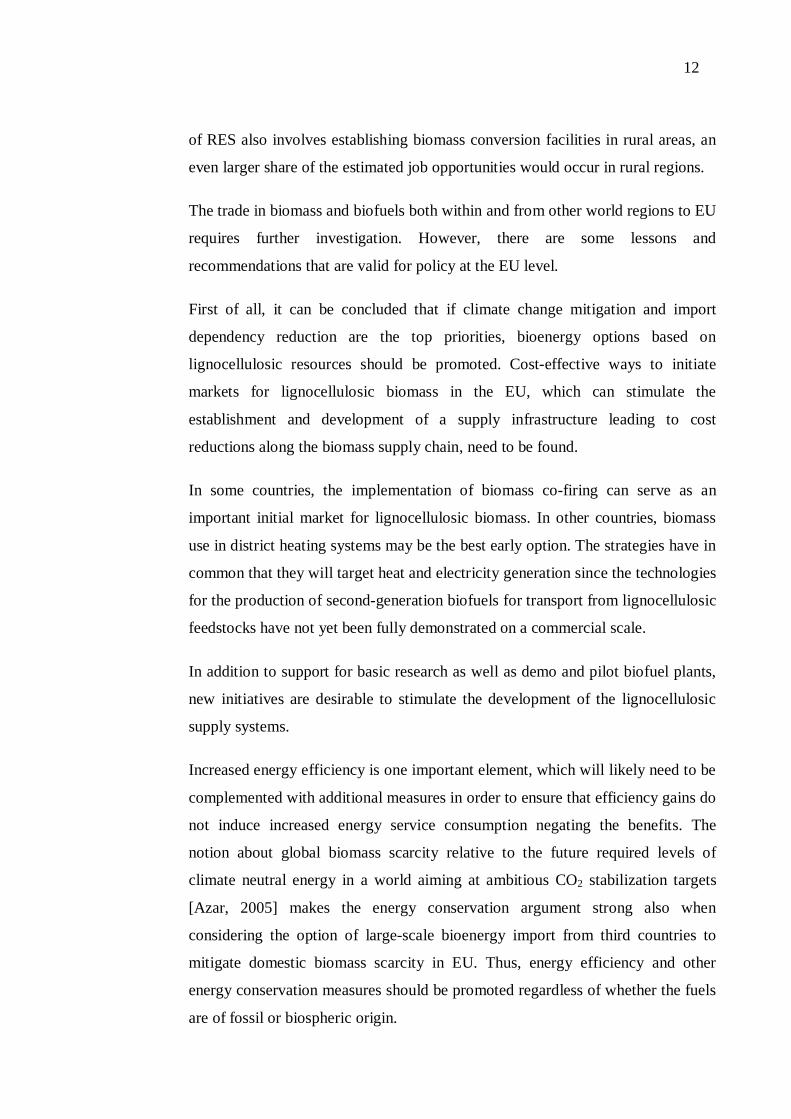
It is estimated that there are 30% of the earth’s land area of forest worldwide
(Table 2), of which about 95% are natural forests and 5% are plantations [FAO,
2001]. Tropical and subtropical forests comprise 56% of the world’s forests, while
temperate and boreal forests account for 44% [FAO, 2001]. The average area of
forest and wooded land per inhabitant varies regionally (Table 2). The area varies
between 6.6 ha in Oceania, 0.2 ha in Asia, and 1.4 ha in Europe (3.4 ha in the
Nordic countries) [FAO, 2001]. This fact indicates that the potential contribution
14
of wood to the energy supply also varies from country to country. There are also
large regional differences in accessibility to forests [FAO, 2001].
Table 2: Forest resources, area (ha), year (2000), [FAO 2001, FAO 2002]
Land area Forest area % Plantations Forest area
per capita Region
106 ha 106 ha 106 ha ha
Africa 2978 649 21.8 8 0.8
Asia 3084 547 17.8 115 0.2
Europe 2259 1039 46.0 32 1.4
North and
Central
America
2136 549 25.7 2 1.1
Oceania 849 197 23.3 3 6.6
South Africa 1754 885 50.5 10 2.6
World 13063 3869 29.6 171 0.6
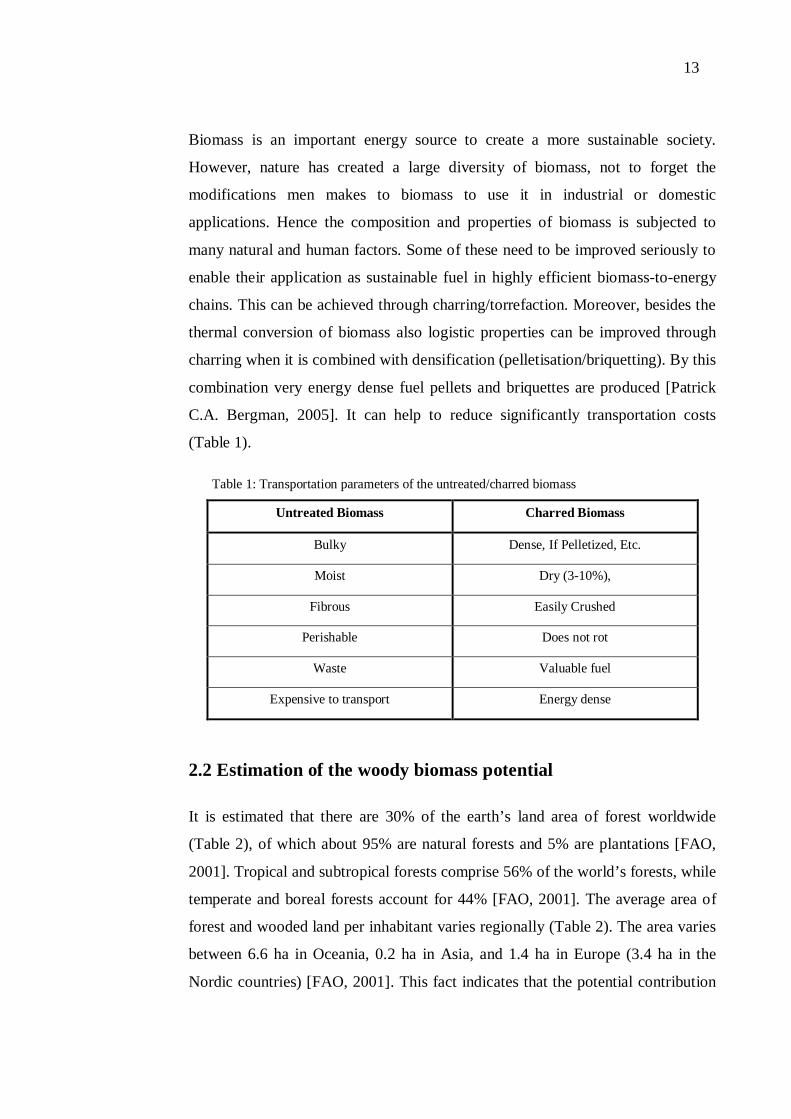
The total above-ground wood volume (m3) and woody biomass (tonnes) in forest
has been estimated in 166 countries, representing 99% of the world’s forest area
[FAO, 2001]. The world’s total aboveground biomass in forests is 420 (109)
tonnes (Table 3), of which more than 40% is located in South America and about
27% is in Brazil alone. The worldwide average above-ground woody biomass is
109 tonnes/ha [FAO, 2001]. Biomass currently represents approximately 14% of
world’s final energy consumption. About 25% of the usage is in industrialized
countries, where a significant level of investment in environmental protection has
been made to meet emissions standards, especially air emissions. The other 75%
of primary energy use of biomass is in heat production for developing country
household energy needs and in process heat production for biomass-based
industries through the use of their generated residues [Overend RP. 2002].
15
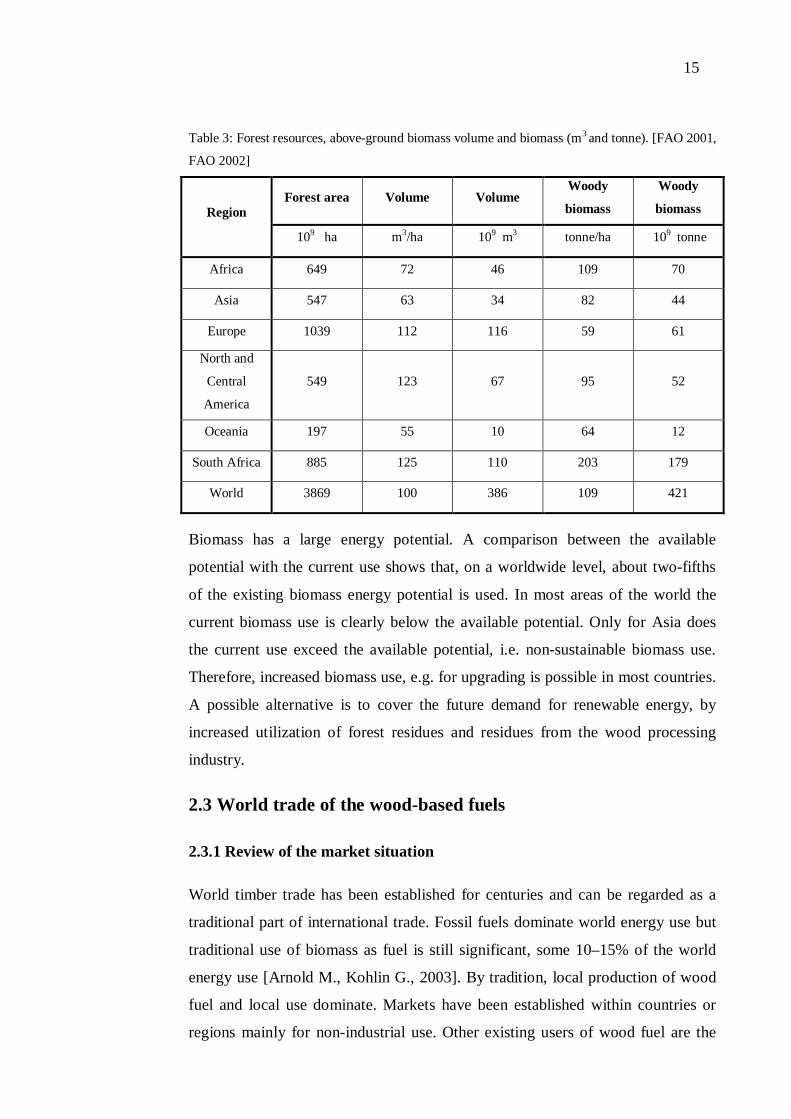
Table 3: Forest resources, above-ground biomass volume and biomass (m3 and tonne). [FAO 2001,
FAO 2002]
Forest area Volume Volume Woody
biomass
Woody
biomass Region
109 ha m3/ha 109 m3 tonne/ha 109 tonne
Africa 649 72 46 109 70
Asia 547 63 34 82 44
Europe 1039 112 116 59 61
North and
Central
America
549 123 67 95 52
Oceania 197 55 10 64 12
South Africa 885 125 110 203 179
World 3869 100 386 109 421
Biomass has a large energy potential. A comparison between the available
potential with the current use shows that, on a worldwide level, about two-fifths
of the existing biomass energy potential is used. In most areas of the world the
current biomass use is clearly below the available potential. Only for Asia does
the current use exceed the available potential, i.e. non-sustainable biomass use.
Therefore, increased biomass use, e.g. for upgrading is possible in most countries.
A possible alternative is to cover the future demand for renewable energy, by
increased utilization of forest residues and residues from the wood processing
industry.
2.3 World trade of the wood-based fuels
2.3.1 Review of the market situation
World timber trade has been established for centuries and can be regarded as a
traditional part of international trade. Fossil fuels dominate world energy use but
traditional use of biomass as fuel is still significant, some 10–15% of the world
energy use [Arnold M., Kohlin G., 2003]. By tradition, local production of wood
fuel and local use dominate. Markets have been established within countries or
regions mainly for non-industrial use. Other existing users of wood fuel are the
16
forest products industry, especially pulp and paper industries. The forest products
industry produces large quantities of wood as by-products which may be used as
fuel. Forest resources are spread all over the globe. Some areas have very large
forest resources, e.g. tropical and boreal areas. Countries with large forest
resources are Brazil, Indonesia, Russia and Canada. Demand for timber products
is connected to dense and fast growing populations.
In recent years all over the world have recognized the concept based on new
understanding of global and commodity issues. This refers to renewable sources
of energy and raw materials including fuelwood, charcoal and animal dung, that
continue to be important sources of bioenergy in many parts of the world.
Currently, wood fuels represent by far the most common sources of bioenergy and
not only for less developed regions. Wood fuels provide energy security service
for large segments of society and wood fuels technology is developing and
expanding rapidly. The main industrial use is for heat production, electricity
production both in stand-alone plants and in combined heat and power plants
(CHP plants).
The European Union countries have jointly signed the Kyoto Agreement and have
rather ambitious plans for reduction of greenhouse gases. This development
increases the demand for all renewable energy including wood fuel. Asian
countries have a very fast growing economy and are studying the possibilities to
increase the use of renewables. The timber trade is well established in this region.
Wood-fuel consumption for Asian RWEDP countries 3 is estimated at 10,000 PJ
per year [Regional study on wood energy today and tomorrow in Asia, [Bangkok,
1997]. Increase in wood fuel use by 1.6% per year is reported and the value today
is 30 billion USD per annum. Most of this utilization is available at local markets.
Typical prices are 40 USD per tonne.
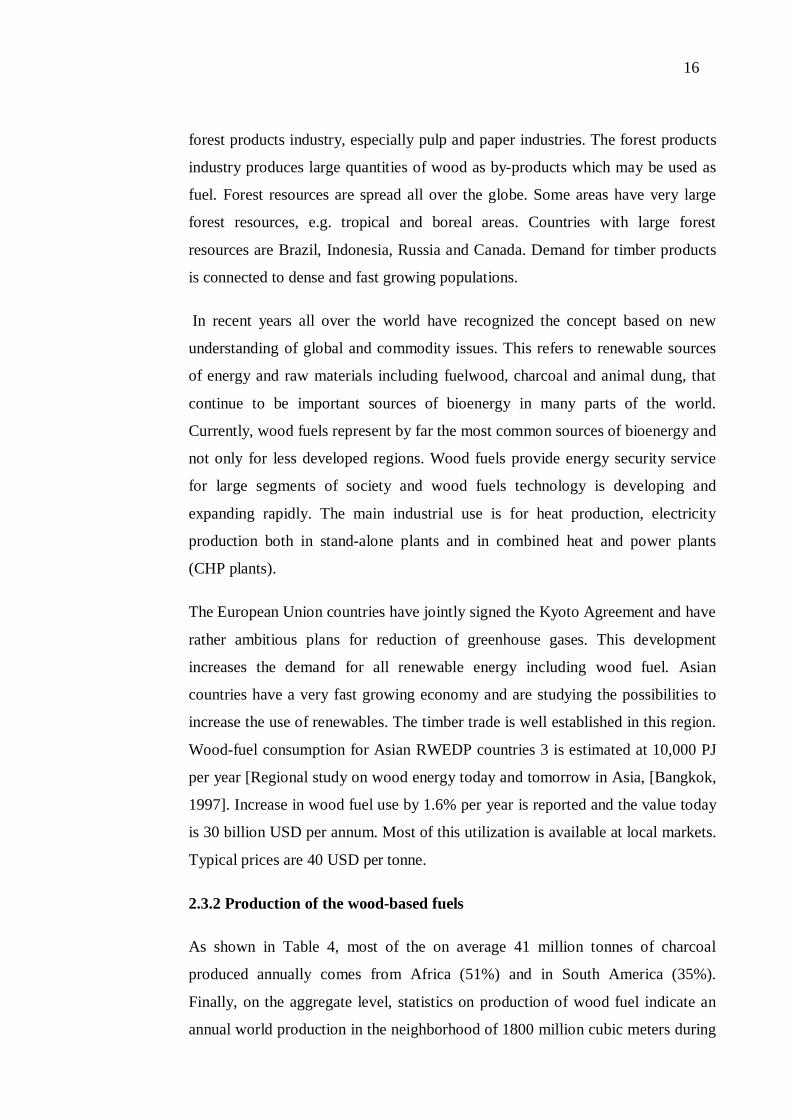
2.3.2 Production of the wood-based fuels
As shown in Table 4, most of the on average 41 million tonnes of charcoal
produced annually comes from Africa (51%) and in South America (35%).
Finally, on the aggregate level, statistics on production of wood fuel indicate an
annual world production in the neighborhood of 1800 million cubic meters during
17
the 2000–2002 period. Asia, at approximately 44%, and Africa, 30%, again are
the major producing regions (Table 5).
Table 4: World production of wood charcoal by region, absolute (in million metric tons) and
relative numbers, [FAO, 2003]
2000 2001 2002 Region
106 m3 share % 106 m3 share % 106 m3 share %
Africa 19.8 50.3 20.9 51.3 21.7 51.2
Asia 4.2 10.6 4.3 10.6 4.4 10.3
Europe 0.3 0.7 0.0 0.1 0.0 0.1
North and
Central
America
1.2 3.1 1.2 3.0 1.2 2.9
Oceania 0.0 0.0 0.0 0.0 0.0 0.0
South
America 13.8 35.1 14.0 34.3 14.8 34.9
World 39.2 100.0 40.8 100.0 42.4 100.0
Table 5: World production of wood by region, absolute (million cubic meters) and relative
numbers, [FAO, 2003]
2000 2001 2002 Region
106 m3 share % 106 m3 share % 106 m3 share %
Africa 527.5 29.5 534.5 29.9 552.4 30.7
Asia 797.5 44.5 795.5 44.5 782.2 43.4
Europe 109.2 6.1 101.4 5.7 105.7 5.9
North and
Central
America
155.6 8.7 156.3 8.7 158.6 8.8
Oceania 12.2 0.7 12.6 0.7 13.0 0.7
South
America 188.5 10.5 189.2 10.6 189.4 10.5
World 1790.7 100.0 1789.2 100.0 1801.3 100.0
18
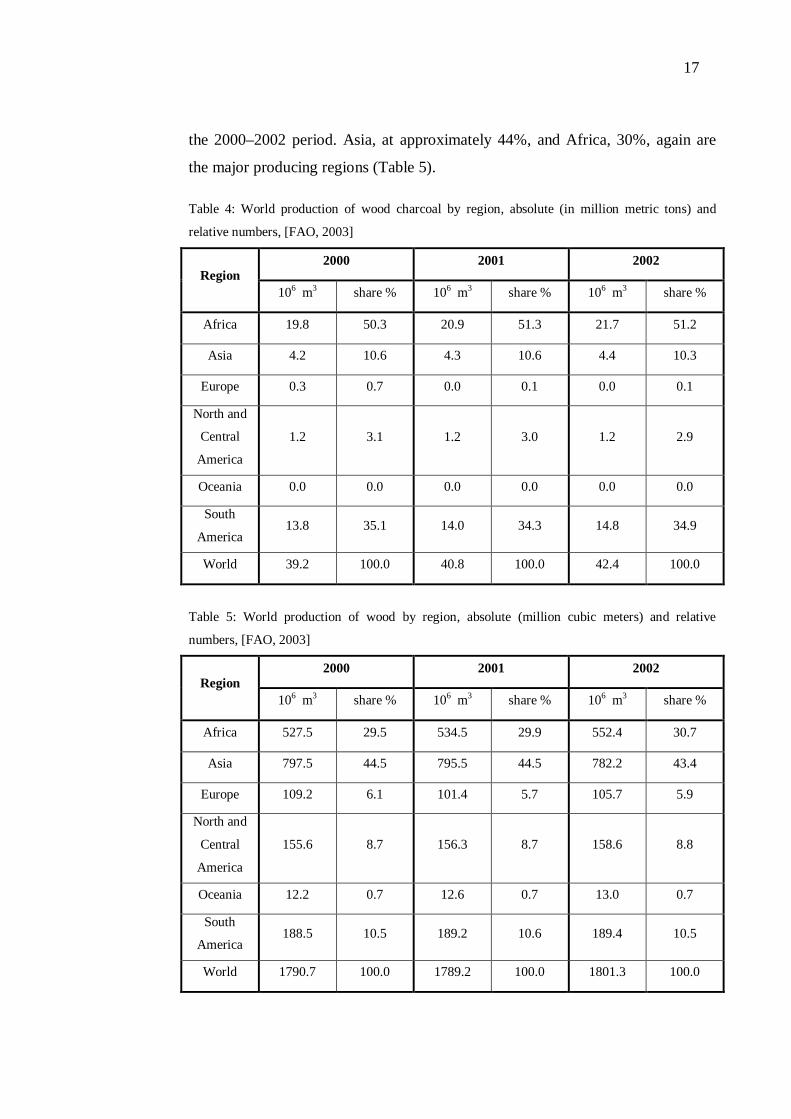
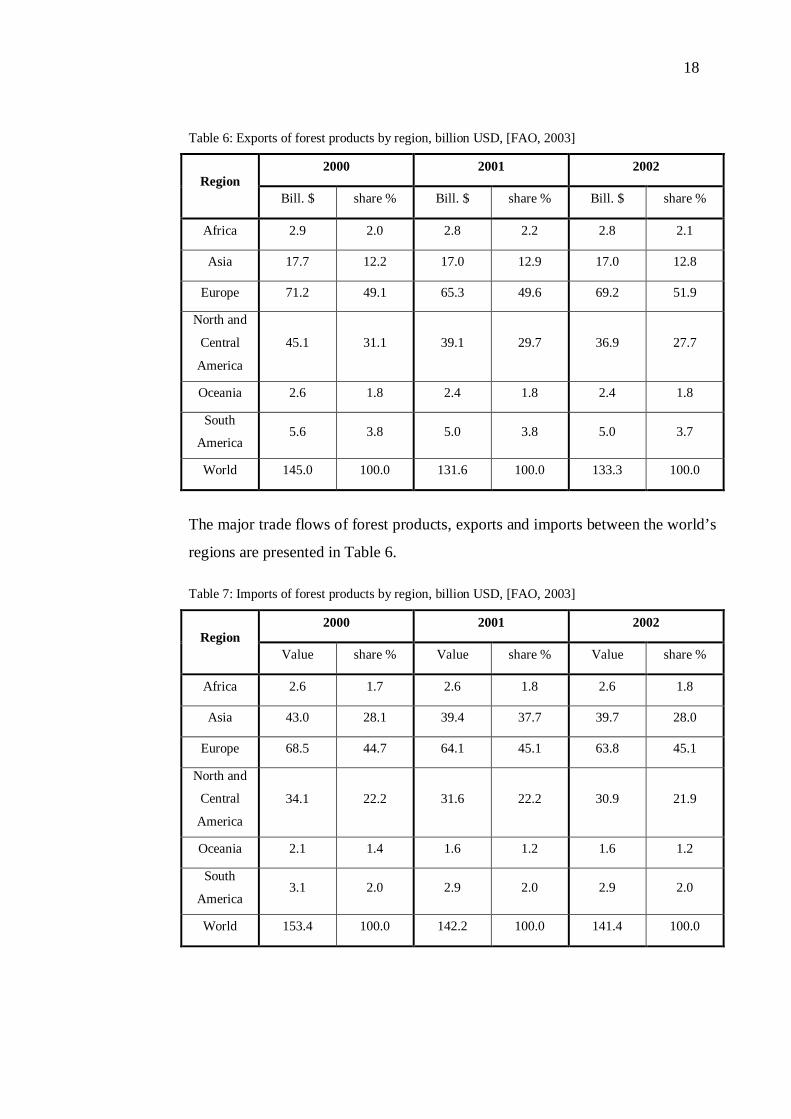
Table 6: Exports of forest products by region, billion USD, [FAO, 2003]
2000 2001 2002 Region
Bill. $ share % Bill. $ share % Bill. $ share %
Africa 2.9 2.0 2.8 2.2 2.8 2.1
Asia 17.7 12.2 17.0 12.9 17.0 12.8
Europe 71.2 49.1 65.3 49.6 69.2 51.9
North and
Central
America
45.1 31.1 39.1 29.7 36.9 27.7
Oceania 2.6 1.8 2.4 1.8 2.4 1.8
South
America 5.6 3.8 5.0 3.8 5.0 3.7
World 145.0 100.0 131.6 100.0 133.3 100.0
The major trade flows of forest products, exports and imports between the world’s
regions are presented in Table 6.
Table 7: Imports of forest products by region, billion USD, [FAO, 2003]
2000 2001 2002 Region
Value share % Value share % Value share %
Africa 2.6 1.7 2.6 1.8 2.6 1.8
Asia 43.0 28.1 39.4 37.7 39.7 28.0
Europe 68.5 44.7 64.1 45.1 63.8 45.1
North and
Central
America
34.1 22.2 31.6 22.2 30.9 21.9
Oceania 2.1 1.4 1.6 1.2 1.6 1.2
South
America 3.1 2.0 2.9 2.0 2.9 2.0
World 153.4 100.0 142.2 100.0 141.4 100.0
19
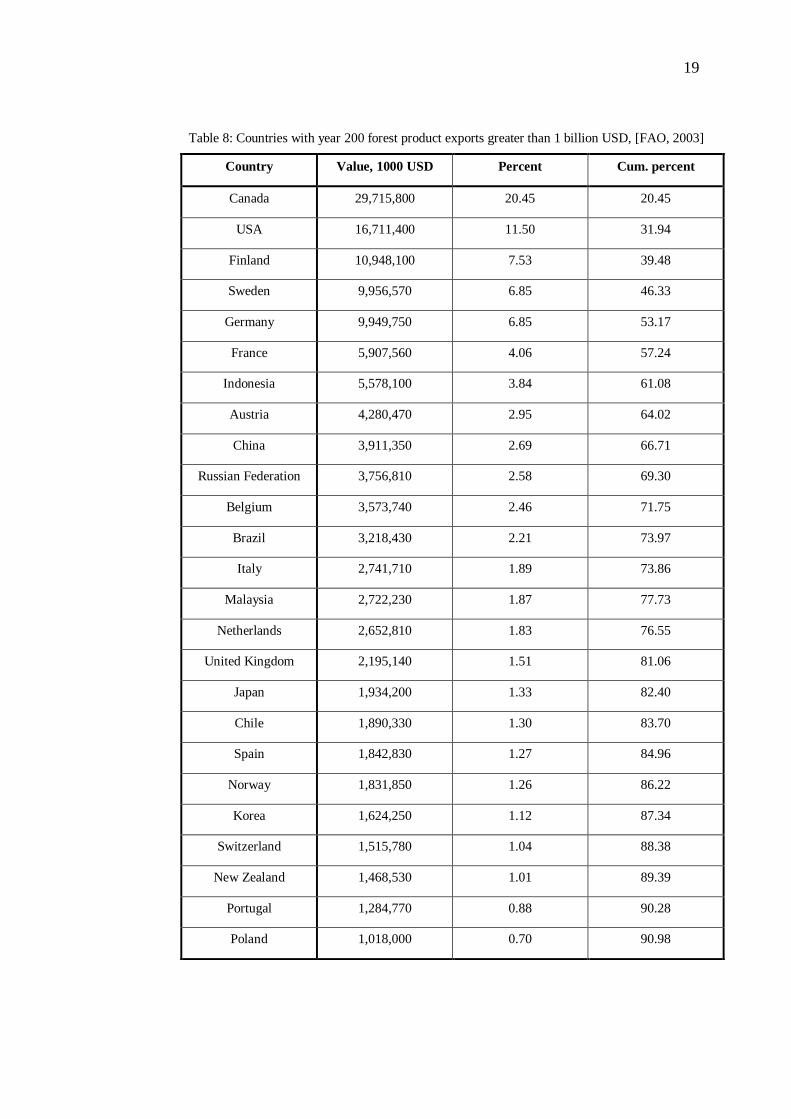
Table 8: Countries with year 200 forest product exports greater than 1 billion USD, [FAO, 2003]
Country Value, 1000 USD Percent Cum. percent
Canada 29,715,800 20.45 20.45
USA 16,711,400 11.50 31.94
Finland 10,948,100 7.53 39.48
Sweden 9,956,570 6.85 46.33
Germany 9,949,750 6.85 53.17
France 5,907,560 4.06 57.24
Indonesia 5,578,100 3.84 61.08
Austria 4,280,470 2.95 64.02
China 3,911,350 2.69 66.71
Russian Federation 3,756,810 2.58 69.30
Belgium 3,573,740 2.46 71.75
Brazil 3,218,430 2.21 73.97
Italy 2,741,710 1.89 73.86
Malaysia 2,722,230 1.87 77.73
Netherlands 2,652,810 1.83 76.55
United Kingdom 2,195,140 1.51 81.06
Japan 1,934,200 1.33 82.40
Chile 1,890,330 1.30 83.70
Spain 1,842,830 1.27 84.96
Norway 1,831,850 1.26 86.22
Korea 1,624,250 1.12 87.34
Switzerland 1,515,780 1.04 88.38
New Zealand 1,468,530 1.01 89.39
Portugal 1,284,770 0.88 90.28
Poland 1,018,000 0.70 90.98
20
2.3.3 Trade flows of the wood-based fuels
Data on trade flows in wood fuels are obtained from the European Forest Institute
(EFI) [European Forest Institute, 2003]. This database is constructed from United
Nations COMTRADE data and is elaborated and maintained by B. Michie and P.
Wardle at the European Forest Institute. Trade flows between different countries
of a wide range of forestry-related products and over several years can be
extracted from the database. When it comes to trade in wood fuels, the database
contains a handful of products that are relevant. Data are focused on [FAO, 2003]:
- charcoal;
- wood chips and wood particles;
- fuel wood;
- wood residues.
This database does not contain explicit data on trade in wood pellets (or
briquettes). Data on trade are presented in the different wood-based fuels by
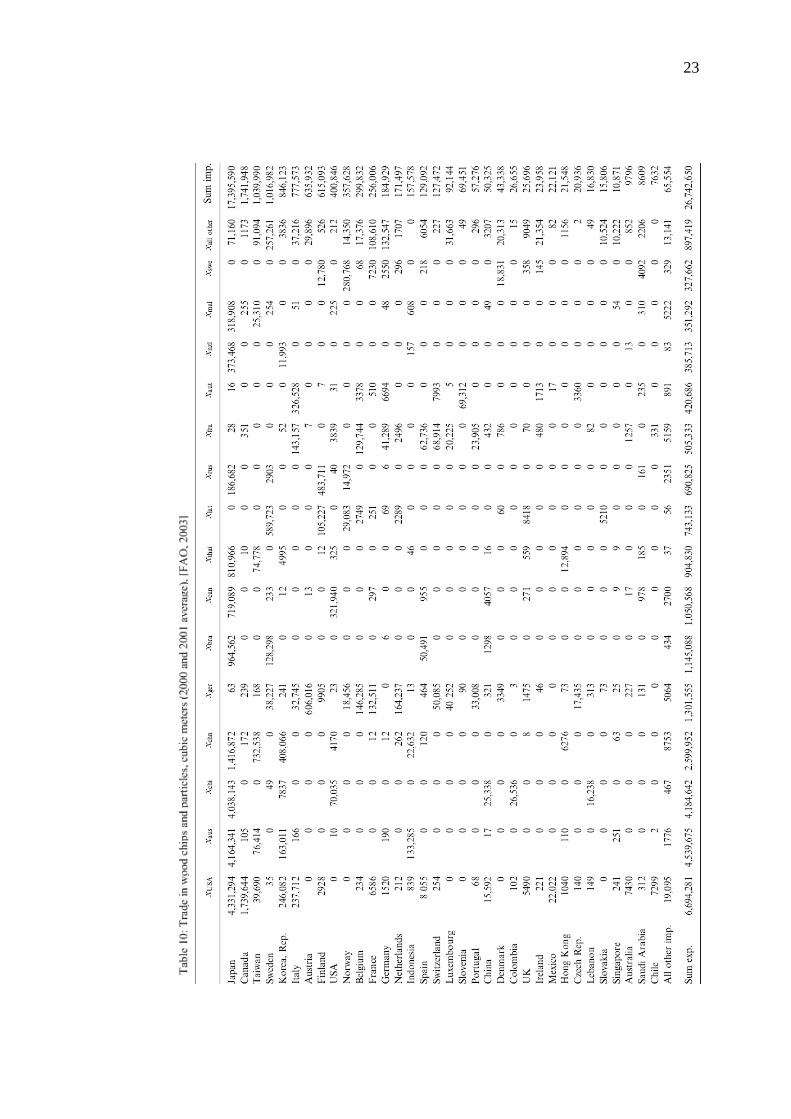
means of export/import matrices. In Tables 9-11 the major features of trade in
charcoal, wood chips and particles, fuel wood and wood residues are analyzed.
Among these, charcoal and fuel wood are likely to be used for energy purposes,
while chips/particles and residues are potentially used for energy, but may also
have other uses for example in the forest products industry (pulp mills and particle
board industries). It is not clear from the statistics for which purpose these two
latter product categories are traded. The data are extracted from the EFI database
one country at a time. Deriving complete global trade statistics on several
commodities in this way is rather cumbersome; therefore, the following procedure
was followed. Based on an expansion of the list of forest exports in Table 8, the
25 largest countries in terms of forest product exports were identified. It is
assumed that these countries are also large exporters of wood-based fuels. For
each of these countries, total export volumes of the above-mentioned fuel
categories, distributed by importing countries, have been obtained from the
database. These country data were then sorted by export and import volumes,
respectively, to obtain the export/import matrices. The matrices (Tables 9-12)
should be read in the following way. The data columns represent values for a
given exporting country (indicated by the ‘x’-prefix to the abbreviated country
21
name). Also, the exporting countries (columns) are ordered according to the size
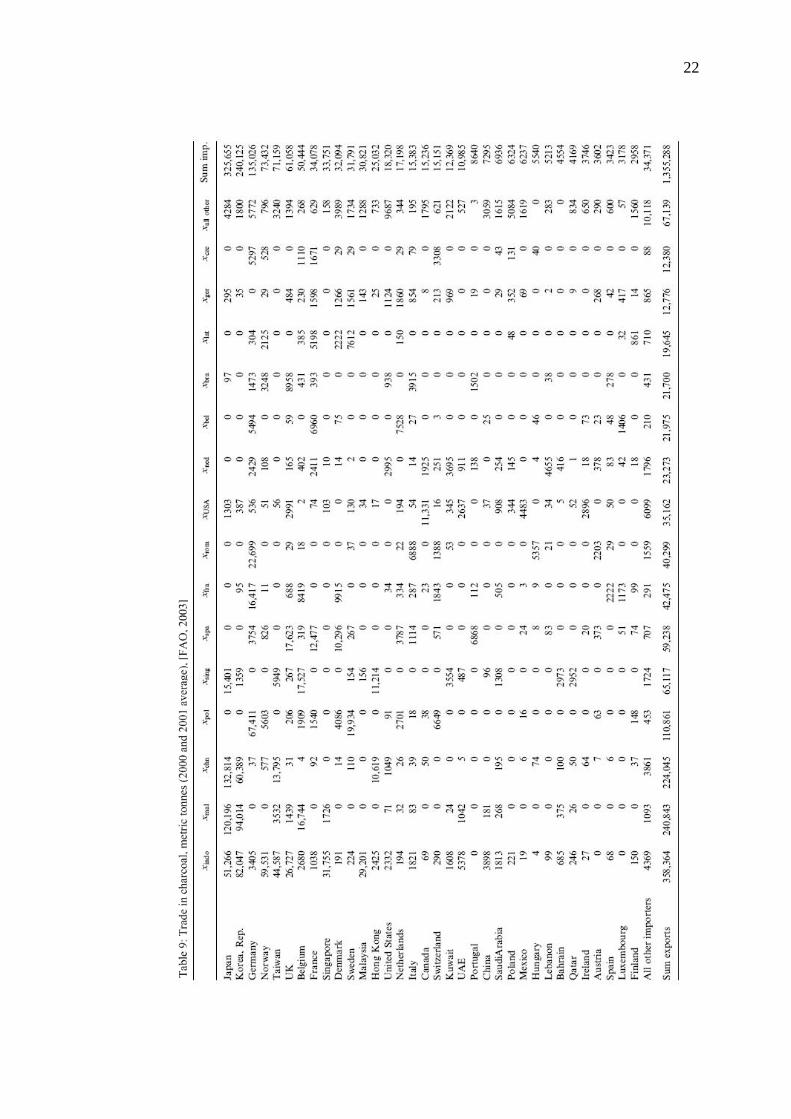
of the total export volume. In Table 9, we find that Indonesia (x-indo) is the
largest exporter of charcoal (358,364 tonnes) followed by Malaysia (240,843
tonnes). Due to space constraints these tables do not contain the full matrices,
only the 15 largest exporters are presented individually. The remaining 19
countries (of a total of 34 also including all other importing countries) are
aggregated in the ‘x-other’-column. The same procedure is for Tables 9-12. Each
line in the table represents the single importing countries. These are also sorted by
size, and Table 9 demonstrates that Japan is the largest importer of charcoal
(325,655 tonnes) followed by the Republic of Korea and Germany. The individual
cells in the table’s show which amounts are imported by the country in the table
line from the country in the table column. The tables thus show the trade flows
between the different countries, and it is expected that the largest volumes of trade
appear in the upper left corner of the table. As seen in Table 9, more than half of
the world trade in charcoal originates in the Asian countries of Indonesia,
Malaysia and China, with Japan and Korea being the major importers. Germany is
by far the largest European importer, followed by Norway and UK. Poland is the
largest exporter of charcoal in Europe, followed by Spain and France. Trade in
wood chips and particles are summarized in Table 10. Again Japan is the largest
importer, now by far, accounting for well over 60% of world trade. Four countries
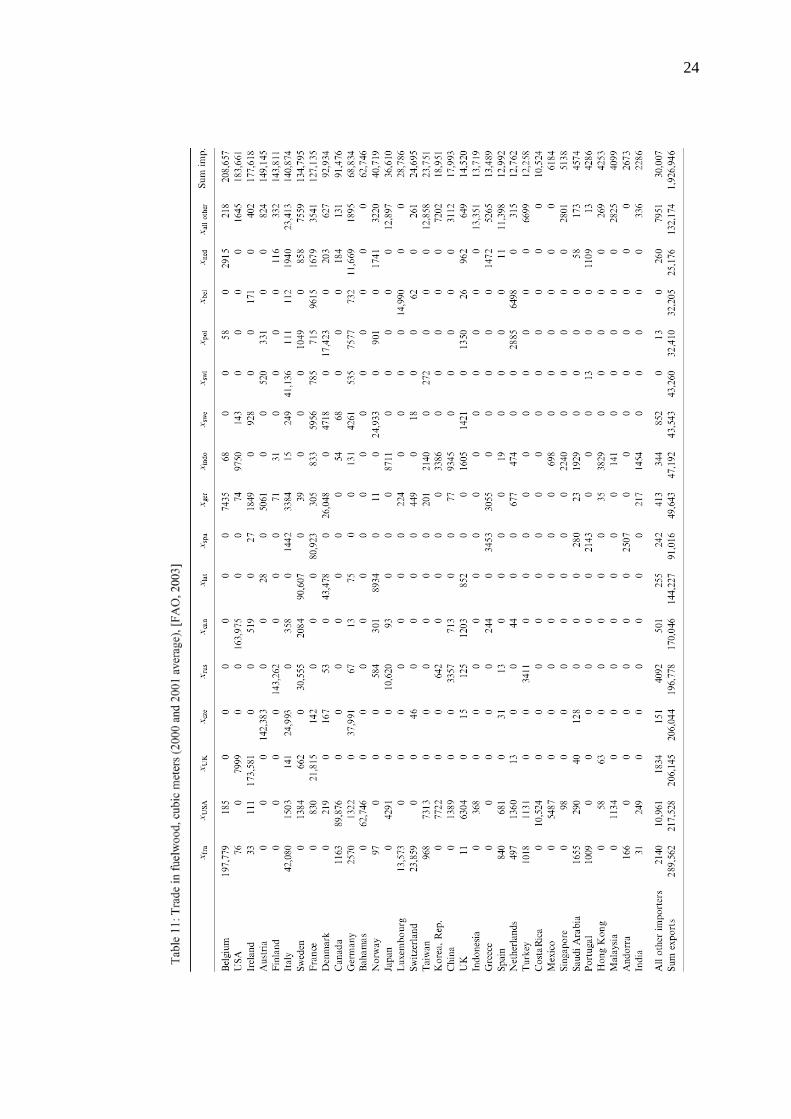
dominate exports: USA, Australia, Chile and China. The fuel wood trade shows a
different structure (Table 11). This trade takes place mainly within countries in
Europe and North America. In North America, the trade is in both directions
between Canada and USA. In Europe, France, UK, The Czech Republic, Russia
and Latvia are the largest exporters while Belgium and Ireland are the largest
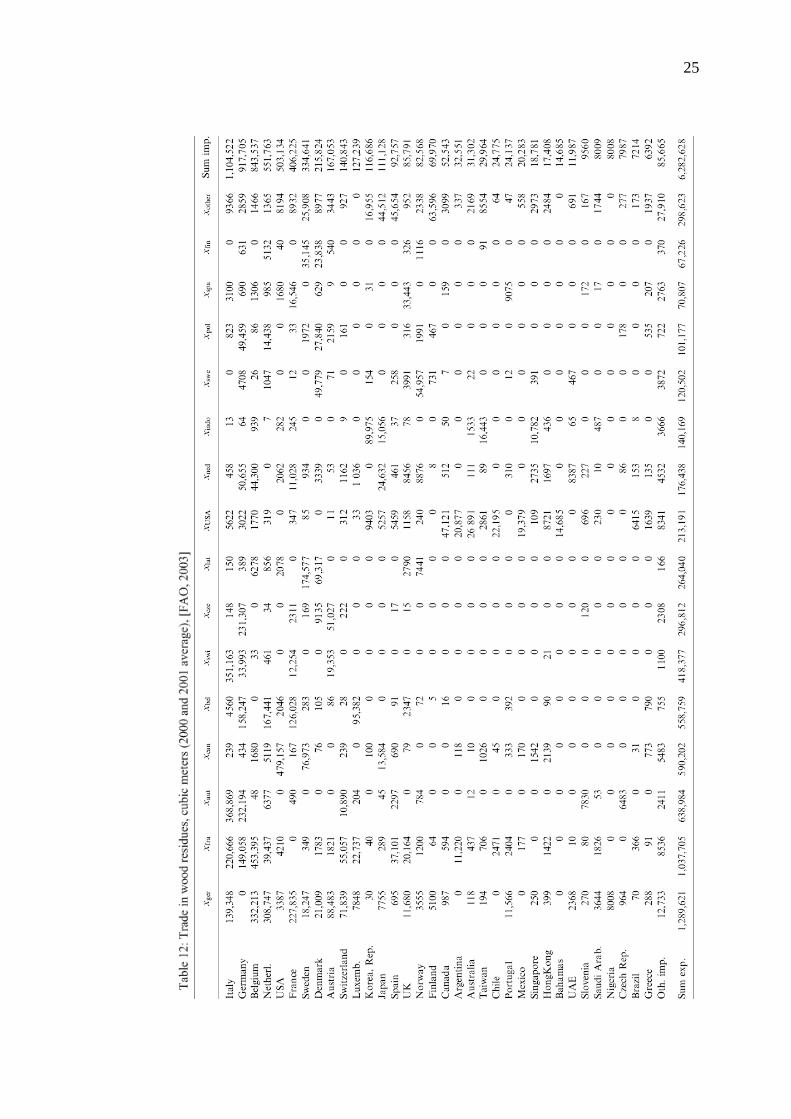
importers. A similar pattern is evident in the trade of wood residues (Table 12).
Germany, France and Austria, together with Canada are the largest exporting
countries. The bulk of Canadian exports go to USA, while exports from the
European countries go to large importers such as Italy, Germany, Belgium, the
Netherlands and France.
22
23
24
25
26
2.3.4 Trade patterns
The international trade patterns show different pictures. Export of round wood
dominates from Asia while more upgraded assortments like sawn wood show a
pattern with Europe as the dominant region.
Africa and Asia dominate charcoal production. Quantities are significant and are
here estimated to be 1800 million cubic meters. Export in forest products origins
mainly from Europe, America and Asia and importing regions are often in the
same geographic area.
Trade in wood fuel is rather new and not as established as for round wood or sawn
wood. Fuelwood is imported mainly to European countries like Belgium, Ireland
and Austria but also the United States of America. Exporters are France and the
United States of America, Japan, Korea, Germany and Norway, which reflect
large demand and strong or rather strong economies. Large exporters are
Indonesia, Malaysia and China. These patterns reflect the demand for resources
but also the market situation were domestic wood fuel may be more expensive
than imported wood fuel. This is a situation similar to most other traded products
and nothing unique for bioenergy.
Dominant importers of wood chips and particles are by far Japan but surprisingly
also countries rich in forest resources per capita like Canada and Sweden. Large
exporting countries are the United States of America, Austria and China.
When the demand for renewable energy increases these trade patterns may be
changed. Countries with large forest resources will increase their export and
countries dependent on fossil fuels in today’s energy system will increase their
import. There is a risk that less-developed countries will export their renewable
energy in favor of fossil fuels while high industrialized and developed countries
will benefit. As long as forest resources are larger than the demand this could be a
good solution in the short run but in the longer run other patterns with more local
use may occur.
27
2.3.5 Discussion
Forest resources are identified as one of the major supplies of renewable energy as
wood fiber in different forms. Today, round wood is used for domestic heating all
over the world using traditional techniques. Sometimes it is purchased on the open
market but it is more common for local forest land owners to cut their energy
supply for the cold season and may be for cooking from their own small wood
lots. Controlled firewood cutting also occurs on public lands by local users. This
small-scale use of wood for energy has a high value for the user and constitutes a
significant level of cuttings and energy but could be a problem when cutting is
illegal. Commercially, logging residues like tops and branches are already
established for energy extraction in some Nordic countries and in North America.
Wood-based energy production could be expected to increase for heat and steam
production. However for electricity production in CHP new technologies must be
developed to reach profitability and to prevent price increases on electricity. It
leads to the conclusion of a short-term increase for heat production and a longer
perspective for CHP to be economically advantageous. The trend is for an
increased use of wood in different markets - first of low cost and lower qualities,
and later of more expensive, processed products. This is true for both forest
products industry and for the energy industry. New quality regulations or
certification could also influence this trend. The competition starts with low-value
fiber, possibly without any other commercial use and when demands rises, other
wood or better timber qualities will be affected. The energy industries, where
some are very powerful and financially strong, look for new fuels from the forest
sector, from the waste sector, from the agriculture sector and elsewhere. For them
biofuels is one renewable energy source competing with another, i.e. solar panels,
wind energy, small-scale hydro or other techniques.
2.3.6 Conclusion
In the past years environmental concern has also become a strong driver behind
the increased interest for wood energy. Bioenergy/wood-fuel promotion policy in
certain countries and within the European Union indicate an increased
28
competition between traditional users of wood fiber, round wood and
manufacturing by-products and users of wood fuel.
A new actor has appeared on the scene for wood raw material - the modern
biofuel energy production industry. What this will lead to in the future is an open
question, the development of the future energy and forestry policies as well as
market prices and the availability of woody biomass for energy purposes will
impact on the answer. International trade in wood fuel is strong in Europe,
Southeast Asia and North America. However, trade are in these regions is limited
to certain countries. The short-term trend is that countries and regions with a
stronger position in economy and development will increase their use and import
of wood fuel while less developed countries will continue their development
based on fossil fuels. This might be changed in the long term.
2.4 Competition for wood between material and energy use
Bioenergy — energy from biomass — can play an important role in combating
climate change as well as e.g. improving the security of energy supply in Europe.
However, plant biomass is used for a large number of purposes, as apart from
energy it also provides food, feed, clothing, paper, bioplastics and building
materials. There can therefore be direct competition between different uses of the
same type of biomass, or competition for land on which to grow biomass, also
with other uses of land, e.g. for nature protection.
The political outlook has played a decisive role in the development of the
production potential of woody biomass on agriculture land for energy purposes
and for paper production. But the importance of the attitude of politicians has
become less as oil prices have increased. The state of the oil economy has forced
politicians of all types to become increasingly interested in all alternative energy
sources. To bridge the remaining gaps in energy availability, both politicians and
scientists have to contribute. [Commission of Oil Independency, Sweden, 2006].
Some countries such as Sweden, which has no fossil energy resources, forestry
and agriculture are of considerable significance for energy supply.
29
Already, about 20% of energy currently used comes from forestry [Energy in
Sweden, 2004]. In a world conference of IUFRO in Brisbane, Australia, it was
stated in the session on Short Rotation Forestry that access to energy rules the
world. Particular reference was made to the very rapidly increasing oil imports by
China and the interest of the USA in supporting the dictatorship of Saudi Arabia.
Even if this statement is somewhat exaggerated, it shows the political importance
of access to energy and thus the importance of forestry and agriculture, an
importance not always realized and fully understood by politicians and by the
public [Christersson L., 2006, p. 79-81].
The concepts most discussed in today’s biological world are sustainability and
biodiversity, but there is no clear and universally accepted definition of either. No
one asks: sustainability for whom or for what? In the general debate, these two
concepts replace previous concerns about the effect of acid rain, needle drop,
overproduction, leakage of chemicals and others. Together with the imminent
shortage of oil [Christersson L., 2003, p. 5–20] and alarm about an increasing
greenhouse effect, they are the cause of severe pressure on the development of
agroforestry and silviculture. In Sweden, where district heating systems have
already been developed and constructed in almost all villages and towns, and
where there is a trend for private home owners to replace electricity and oil
heating with utilization of chips from forestry, competition for wood for industrial
purposes and for the energy market will arise [Christersson L., 2003, p. 5–20].
Once again, Swedish forest industries are expected to face the threat of shortage
of wood [Enander G., 2003; Dockered B., 2003]. The last time this was predicted
was in the 1960s, when a lack of wood in the 1990s was forecast [SOU, 1968, p.
9]. However, such a deficit never occurred. In the 1960s, development of nuclear
power plants was in full swing in Sweden and very few people were discussing
shortage of oil and oil prices. On the other hand, it was estimated at the end of the
1980s and at the beginning of 1990s that never before had there been so much
wood in Swedish forests [Lindevall B., 1992]. The annual growth of Swedish
forests today is about 105 million m3, of which only 80–85 million m3 is
harvested [VMR, 2005; Skogsdata., 2005]. But now again a new deficit is being
predicted, exacerbated by the damage caused by the storms in January 2005
30
[Björheden R., 2005]. Today people fear a competition for wood between the
paper industry and the energy industry. This has not yet arisen but with increasing
oil prices it may be imminent. However, there are many differences of opinion
about the situation [Thuresson T., 2002].
The forest products industry; i.e. sawmills, the panel industry and the pulp and
paper industry are the main industrial users of timber and wood fiber. The
industry produces wood and paper products but also produces by-products during
the process. By-products trade and use are complex with rather complicated trade
patterns. For example, in the production of sawn wood the mill produces
significant amounts of sawdust and chips, which are used in the pulp- and board
industry. Bark is mainly used for internal energy use at the mill, and sometimes by
local municipalities. At worse it is deposited in landfills. What is ‘new’ in this
market balance is the increased demand for wood for energy outside the forest
products industry. This creates competition between traditional users and the
energy industry, mainly regarding small diameter wood and by-products. The
waste sector has grown strong in recent years, in Europe mainly due to EU waste
legislation. The result is that large amounts of fiber are being recycled for use in
the paperboard industry and for energy use.
It was concluded that there is a future for a sustainable biofuels industry but that
feedstock production must avoid agricultural land that would otherwise be used
for food production. This is because the displacement of existing agricultural
production, due to biofuel demand, is accelerating land-use change and, if left
unchecked, will reduce biodiversity and may even cause greenhouse gas
emissions rather than savings. The introduction of biofuels should be significantly
slowed until adequate controls to address displacement effects are implemented
and are demonstrated to be effective. A slowdown will also reduce the impact of
biofuels on food commodity prices, notably oil seeds, which have a detrimental
effect upon the poorest people.
Specific incentives must stimulate advanced technology. In the past years
environmental concern has become a strong driver. Advanced/new technologies
have the potential to produce biofuels with higher greenhouse gas savings and
31
have the benefit of being able to use a wider range of feedstocks. Energy fuel
production using for example charring/torrefaction technologies maybe can help
to avoid the use of land that would otherwise be used for food or paper
production. This is because this technology can use current feedstocks such as
wood waste, agriculture waste. Also it should be considered further necessity of
pellets production and using efficiency. In the case of poor prospects in this
direction it would allow redirect feedstocks using in pellet production for charcoal
production. Charcoal production technology exists but requires technical and
economical analysis to get the answer whether this trend of new energy fuel
production is appropriate. It is the question of this work.
32
3 WOOD TO BIOCOAL
3.1 Charcoal production
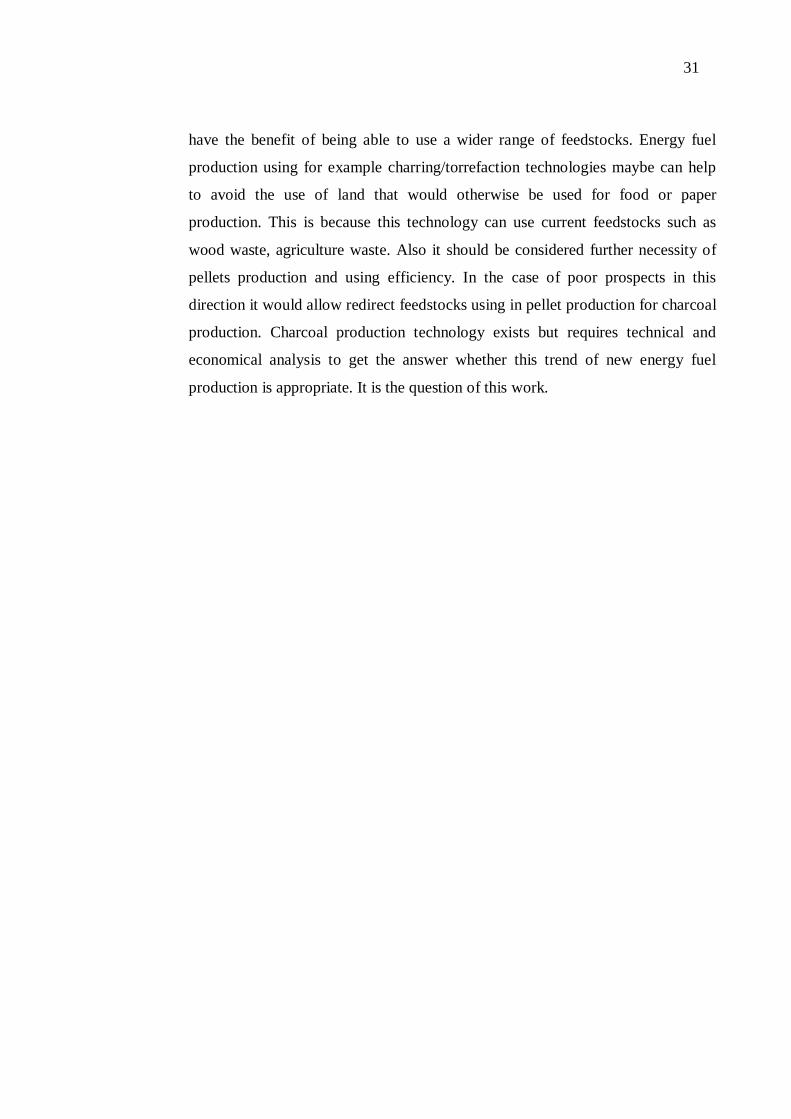
Historically, charring was faulty process: charring heap, and various primitive
"barrels" (Figure 1). Note, that since the late 19th century, thanks to medical
advances have seen a dramatic increase in population, especially its increased
density in the European part of the country and the Western Trans-Urals. In the
last century rapidly growing demand for commodities, which are required for the
manufacture of charcoal. As a result, the pressure on nature, produced by
environmentally dirty industry, has become a threat to the survival of nature itself.
Figure 1: Charring heap
To date, many Asian countries and especial Brazil are still using the simplest
methods of producing charcoal. In 2005 there were produced about 45.5 millions
tonnes per year of charcoal in the world. More than 13 millions tons of this
amounts has made Brazil [FAO, 2005]. This is explained by the fact that huge
energy consumer in Brazil is the steel industry, which consumes this charcoal and
it is more profitable to use domestic sources.
33
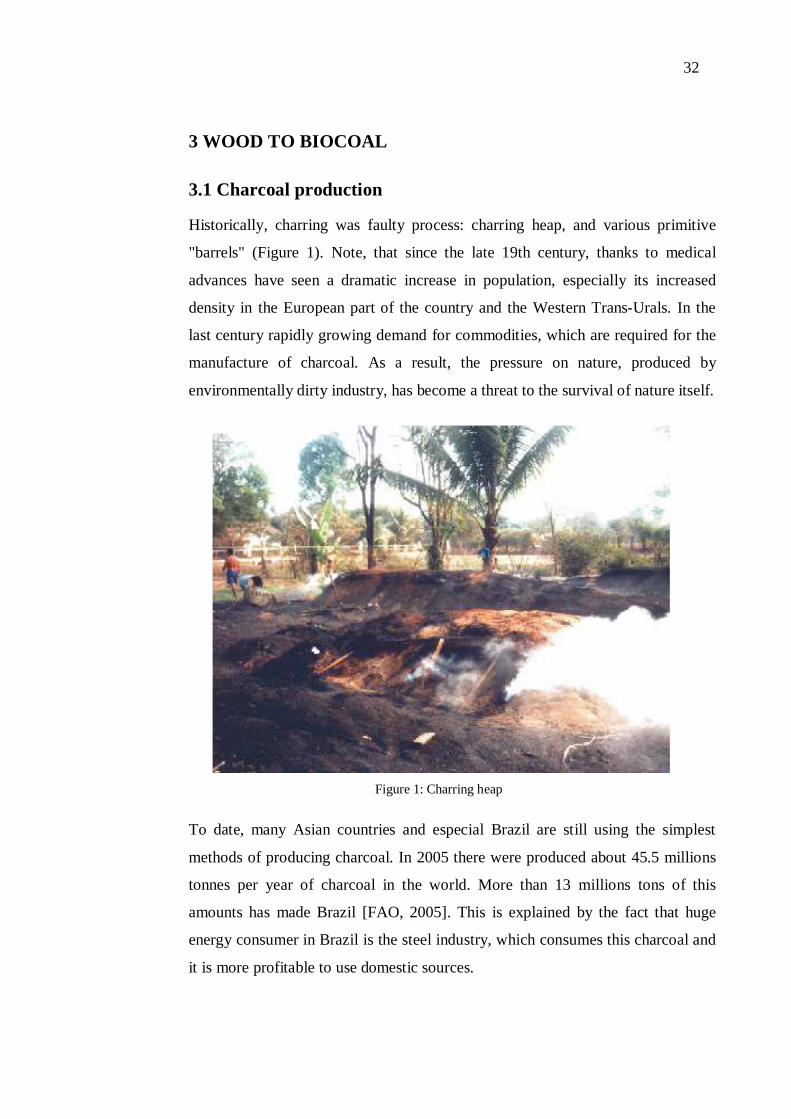
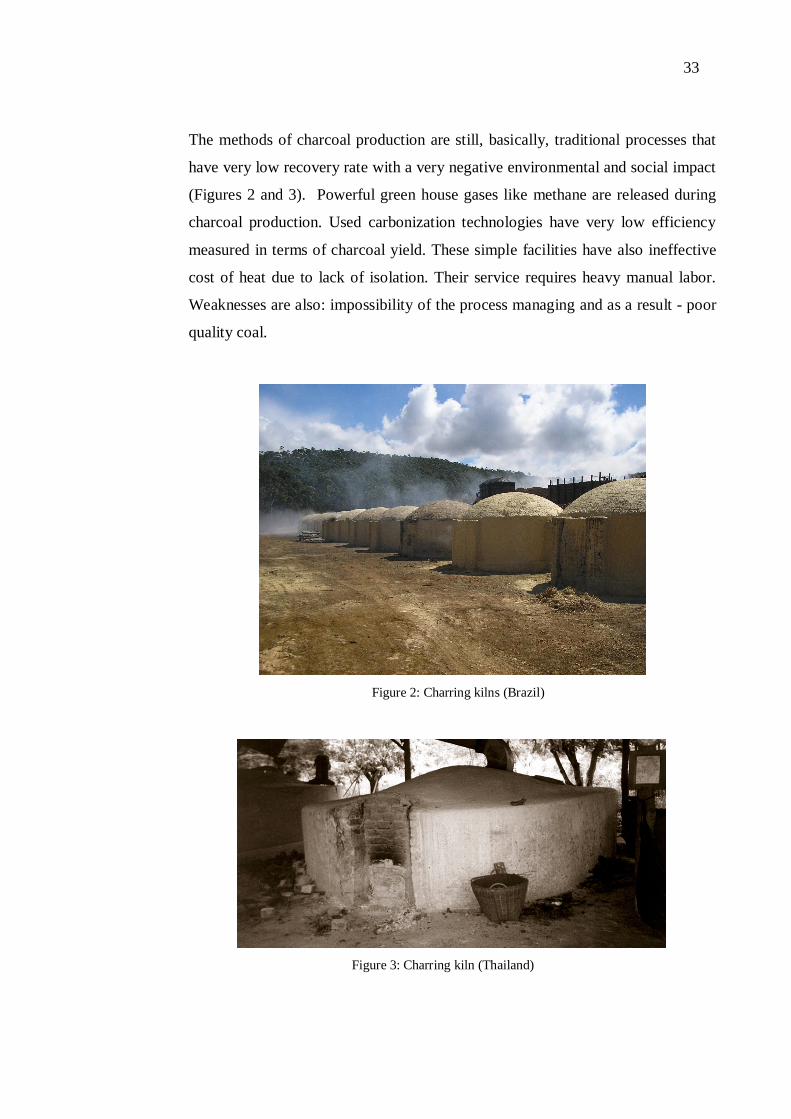
The methods of charcoal production are still, basically, traditional processes that
have very low recovery rate with a very negative environmental and social impact
(Figures 2 and 3). Powerful green house gases like methane are released during
charcoal production. Used carbonization technologies have very low efficiency
measured in terms of charcoal yield. These simple facilities have also ineffective
cost of heat due to lack of isolation. Their service requires heavy manual labor.
Weaknesses are also: impossibility of the process managing and as a result - poor
quality coal.
Figure 2: Charring kilns (Brazil)
Figure 3: Charring kiln (Thailand)
34
Based on provisions described above it is clear that such installations (methods)
have no future. For further organization of the production of charcoal are needed
installations allowing to receive high-quality coal from waste wood of various
natural composition. These installations must meet the following conditions:
- Performance on raw material corresponds to the volume of waste in the
enterprise. Thus, long-distance transports of raw materials are excluded
because of more expensive production costs;
- In a small performance impractical to process liquid products. They should
be burned, covering the needs of the process in the warmth;
- The installation should be clean. Necessary to exclude the emissions into
the environment and pollution;
- Installation should be simple to manufacture;
- The installation should be easy to manage, explosion and fire safety. It is
necessary to provide continuity of installation.
3.1.1 Pyrolysis of the wood. Basic concept
Charring/torrefaction are pyrolysis processes. To understand the specificity of the
wood treatment it is necessary to consider main provisions of the pyrolysis of the
wood.
Thermal decomposition (pyrolysis) of wood - is the decomposition of wood in the
absence of oxygen at elevated temperatures. In the result of this process are solid,
liquid and gaseous products. Solid products remain in the form of charcoal, and
liquid and gaseous products stand together in the form of vapor-gas mixture.
Vapor mixture, if necessary, is divided by the cooling of gases to obtain
condensate. The condensate can be recycled to the acetic acid, methanol, tar and
other products, and non-condensing gases are burned.
The process of decomposition of wood during pyrolysis can be divided into four
stages: 1 – drying (ends at about 150oC), 2 - the beginning of decomposition (150-
280oC). During this period begins expansion less heat-resistant components of
wood with the release of reaction water, carbon dioxide, carbon monoxide, acetic
acid and some other products, changes the chemical and elemental composition; 3
35
- formation, evaporation of the main products of decomposition of wood (directly
- pyrolysis reactions), occurring at 280-400oC with heat (exothermic process); 4 –
carbonization of the charcoal to the final temperature, usually no higher than 450-
600oC and removal of the rest of volatile compounds. All stages, except stage 3,
require heat supply.
The thermal effect of the process of thermal decomposition of wood depends on
the pyrolysis conditions and practically does not depend on the type and design of
the installation. Magnitude lower thermal effect is 1000-1250 kJ/kg, or 5.6% of
the calorific value of the original timber.
The first component of wood - xylan, even at temperatures below 150oC, starts to
decompose, but mostly its decay occurs at 250-260oC with the formation of
furfural, acetic acid and gases. Lignin decomposition begins at about 200oC, a
process due to hetero-and homolytic dissociation of chemical bonds between
structural units of lignin within them leads to the formation of low molecular
weight volatile compounds and a complete restructuring of the primary structure
of lignin. The process of depolymerization of cellulose occurs at temperatures
above 300oC. Cellulose and lignin during the pyrolysis give the yield of coal, gas
and tar. Output of coal from cellulose is 35%, and from lignin about 50%. Gases
obtained by the lignin decomposition contain about 50% CO, 35-40% of CH4 and
only a little CO2, while the cellulose yield is a low-calorie gas containing more
than 60% of CO2. Methane formation occurs mainly due to methoxyl groups of
lignin.
The aromatic compounds contained in the resin (phenols, etc.), are formed by
thermal decomposition of lignin, aliphatic compounds - mainly from cellulose and
other polysaccharides. Also there is a formation of methanol from cellulose and
small amounts from lignin [Gordon L.V., 1988].
3.1.2 The process of the charcoal production
The main idea of the charcoal/torrefied wood production is based on provisions
described in previous section (Pyrolysis of the wood. Basic concept).
36
The result of the process taking place during the charring affect the rate of heating
of biomass, residence time of raw materials at a given temperature, the final
heating temperature, initial moisture content, particle size of wood, type of the
installation. A variety of secondary reactions take place simultaneously with the
primary decomposition of wood. Some of them lead to an additional splitting of
the decomposition products, others to the polymerization of primary products. The
composition of the final products depends mostly on the residence time in the hot
zone of the vapor mixture formed during the initial decomposition. According to
regularity of the pyrolysis process, it can be argued that the longer the process and
the higher the temperature, the more thermally stable products are formed.
The table 13 shows the yield of products of thermal decomposition (wood and
bark) of the main species growing in the European part of the world. These
findings should be viewed as the average, as output is also dependent on growth
conditions, age of trees, even from part of the trunk, which was treated [Gordon
L.V., 1988].
Size of particles of raw material affects the duration of the pyrolysis and the type
of used equipment. Dispersion (small) raw material has, compared with lump,
high specific surface and good flow ability. Since the pyrolysis of wood - a
process of joint heat and mass transfer, the specific surface of the material has a
direct impact on its speed [Yuriev U.L., 2007], which can be seen, for example,
from the basic equation of heat transfer:
Q = k · A · T,
where Q - the amount of heat passing through the interface per unit time, W; k-
heat transfer coefficient, [W/m2 ]; A- the heat transfer surface, [m2]; T –
temperature gradient, [ ].
37
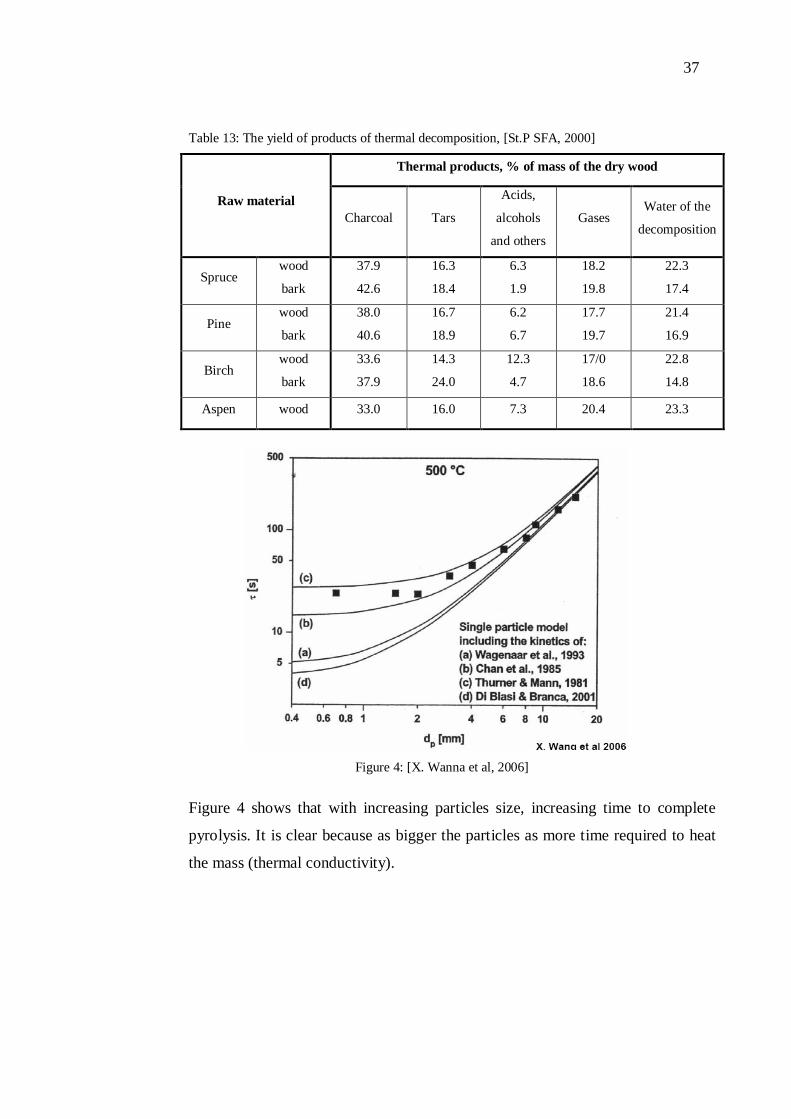
Table 13: The yield of products of thermal decomposition, [St.P SFA, 2000]
Thermal products, % of mass of the dry wood
Raw material Charcoal Tars
Acids,
alcohols
and others
Gases Water of the
decomposition
Spruce wood
bark
37.9
42.6
16.3
18.4
6.3
1.9
18.2
19.8
22.3
17.4
Pine wood
bark
38.0
40.6
16.7
18.9
6.2
6.7
17.7
19.7
21.4
16.9
Birch wood
bark
33.6
37.9
14.3
24.0
12.3
4.7
17/0
18.6
22.8
14.8
Aspen wood 33.0 16.0 7.3 20.4 23.3
Figure 4: [X. Wanna et al, 2006]
Figure 4 shows that with increasing particles size, increasing time to complete
pyrolysis. It is clear because as bigger the particles as more time required to heat
the mass (thermal conductivity).
38
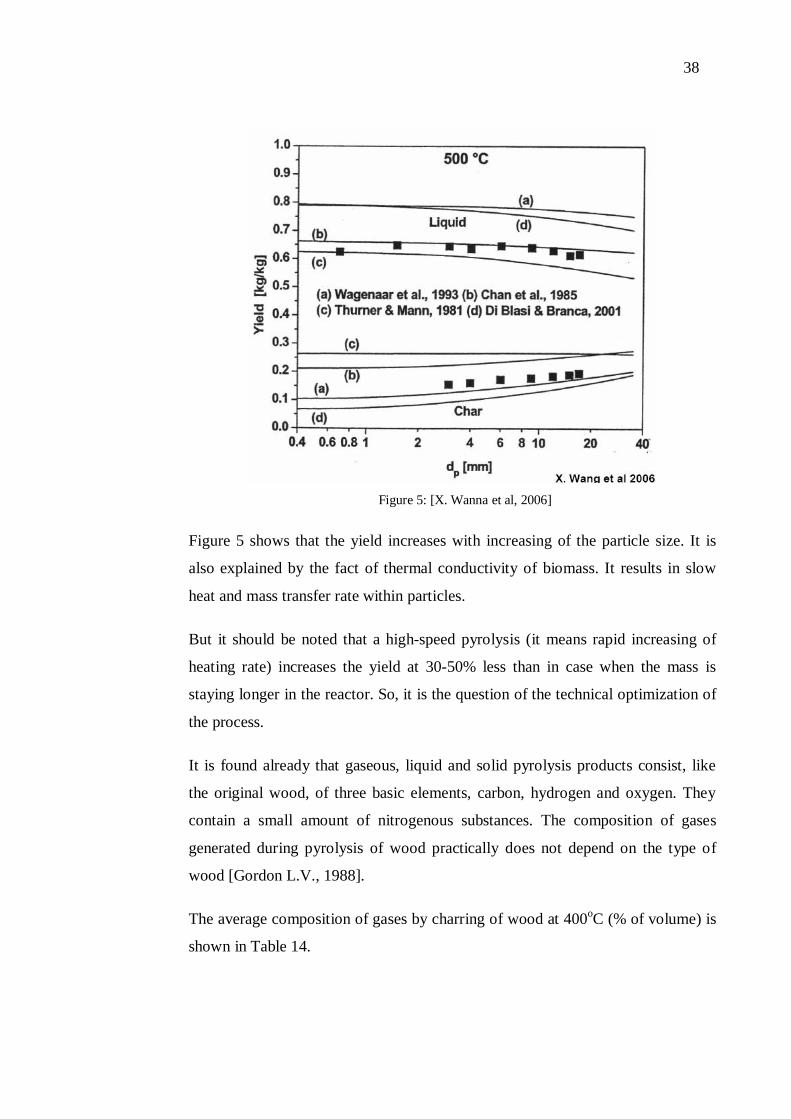
Figure 5: [X. Wanna et al, 2006]
Figure 5 shows that the yield increases with increasing of the particle size. It is
also explained by the fact of thermal conductivity of biomass. It results in slow
heat and mass transfer rate within particles.
But it should be noted that a high-speed pyrolysis (it means rapid increasing of
heating rate) increases the yield at 30-50% less than in case when the mass is
staying longer in the reactor. So, it is the question of the technical optimization of
the process.
It is found already that gaseous, liquid and solid pyrolysis products consist, like
the original wood, of three basic elements, carbon, hydrogen and oxygen. They
contain a small amount of nitrogenous substances. The composition of gases
generated during pyrolysis of wood practically does not depend on the type of
wood [Gordon L.V., 1988].
The average composition of gases by charring of wood at 400oC (% of volume) is
shown in Table 14.
39
Table 14: Gas components of charred wood obtained at 400oC, [Gordon L.V., 1988]
Gas components, % Wood species
02 CO 4 C2H4 2
Birch 49.0 28.4 18.2 1.4 3.0
Pine 49.5 28.5 18.0 1.0- 3.0
Spruce 48.0 28.0 19.0 1.0 4.0
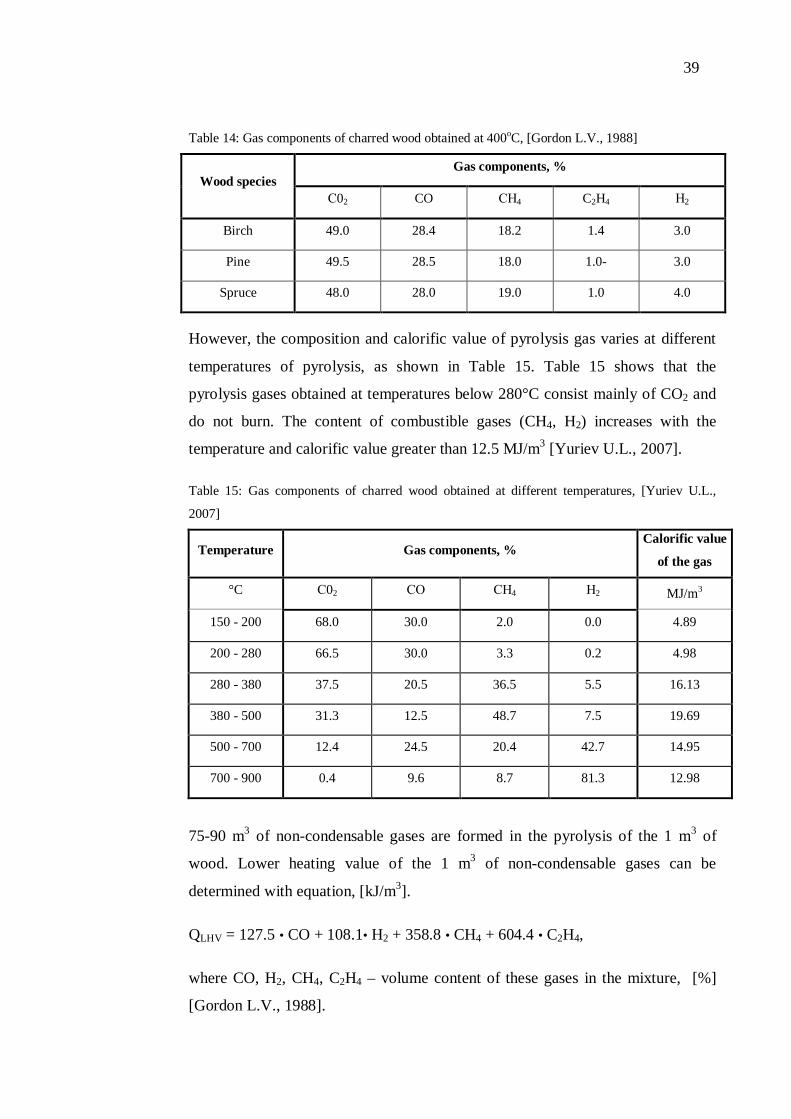
However, the composition and calorific value of pyrolysis gas varies at different
temperatures of pyrolysis, as shown in Table 15. Table 15 shows that the
pyrolysis gases obtained at temperatures below 280°C consist mainly of CO2 and
do not burn. The content of combustible gases (CH4, H2) increases with the
temperature and calorific value greater than 12.5 MJ/m3 [Yuriev U.L., 2007].
Table 15: Gas components of charred wood obtained at different temperatures, [Yuriev U.L.,
2007]
Temperature Gas components, % Calorific value
of the gas
°C 02 4 2 MJ/m3
150 - 200 68.0 30.0 2.0 0.0 4.89
200 - 280 66.5 30.0 3.3 0.2 4.98
280 - 380 37.5 20.5 36.5 5.5 16.13
380 - 500 31.3 12.5 48.7 7.5 19.69
500 - 700 12.4 24.5 20.4 42.7 14.95
700 - 900 0.4 9.6 8.7 81.3 12.98
75-90 m3 of non-condensable gases are formed in the pyrolysis of the 1 m3 of
wood. Lower heating value of the 1 m3 of non-condensable gases can be
determined with equation, [kJ/m3].
QLHV = 127.5 • CO + 108.1• H2 + 358.8 • CH4 + 604.4 • C2H4,
where CO, H2, CH4, C2H4 – volume content of these gases in the mixture, [%]
[Gordon L.V., 1988].
40
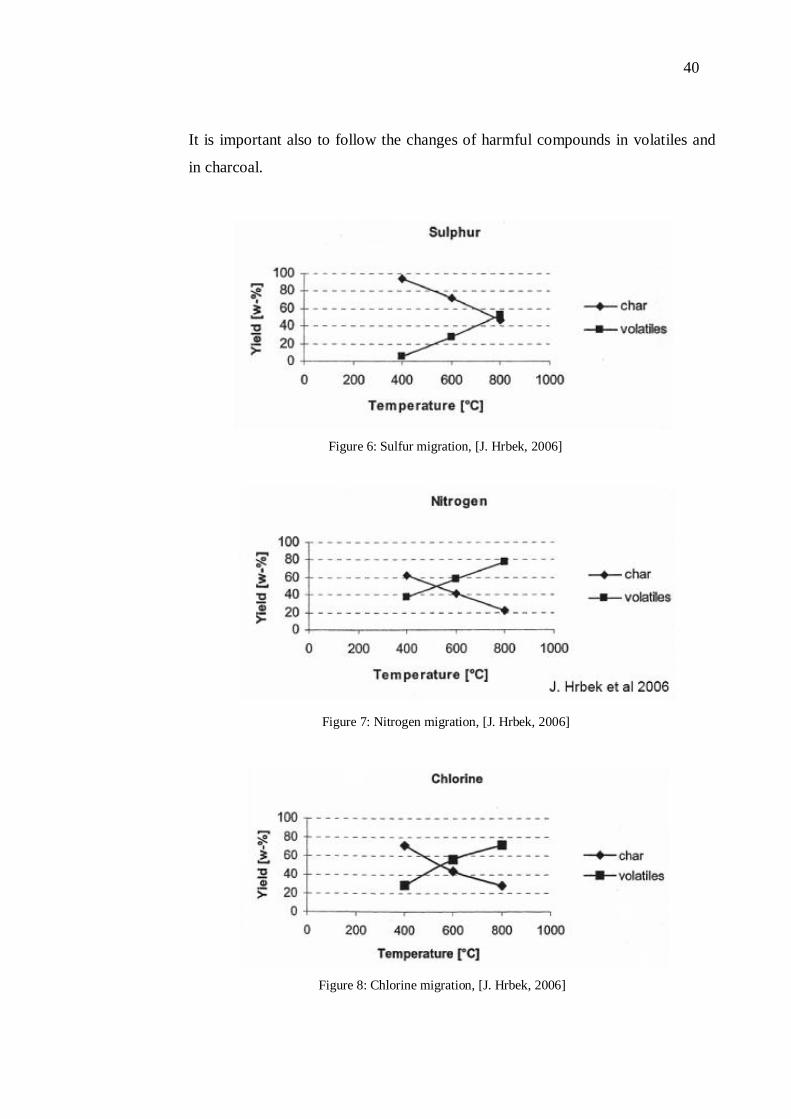
It is important also to follow the changes of harmful compounds in volatiles and
in charcoal.
Figure 6: Sulfur migration, [J. Hrbek, 2006]
Figure 7: Nitrogen migration, [J. Hrbek, 2006]
Figure 8: Chlorine migration, [J. Hrbek, 2006]
41
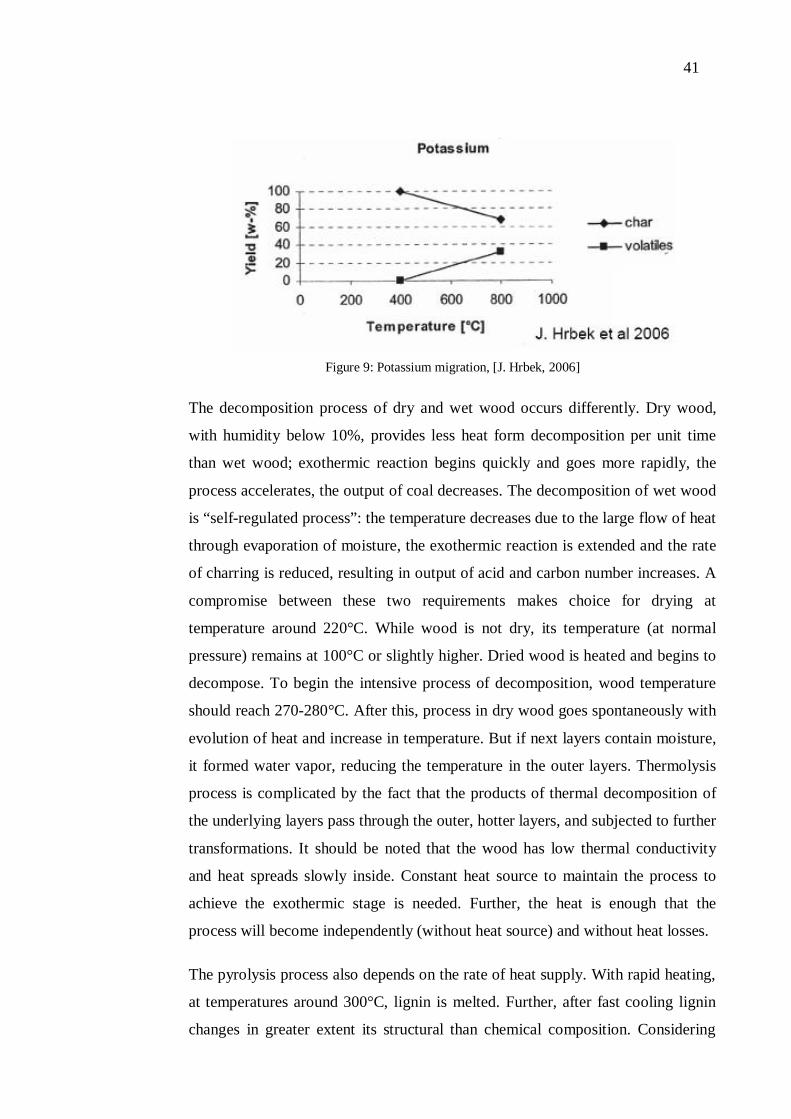
Figure 9: Potassium migration, [J. Hrbek, 2006]
The decomposition process of dry and wet wood occurs differently. Dry wood,
with humidity below 10%, provides less heat form decomposition per unit time
than wet wood; exothermic reaction begins quickly and goes more rapidly, the
process accelerates, the output of coal decreases. The decomposition of wet wood
is “self-regulated process”: the temperature decreases due to the large flow of heat
through evaporation of moisture, the exothermic reaction is extended and the rate
of charring is reduced, resulting in output of acid and carbon number increases. A
compromise between these two requirements makes choice for drying at
temperature around 220°C. While wood is not dry, its temperature (at normal
pressure) remains at 100°C or slightly higher. Dried wood is heated and begins to
decompose. To begin the intensive process of decomposition, wood temperature
should reach 270-280°C. After this, process in dry wood goes spontaneously with
evolution of heat and increase in temperature. But if next layers contain moisture,
it formed water vapor, reducing the temperature in the outer layers. Thermolysis
process is complicated by the fact that the products of thermal decomposition of
the underlying layers pass through the outer, hotter layers, and subjected to further
transformations. It should be noted that the wood has low thermal conductivity
and heat spreads slowly inside. Constant heat source to maintain the process to
achieve the exothermic stage is needed. Further, the heat is enough that the
process will become independently (without heat source) and without heat losses.
The pyrolysis process also depends on the rate of heat supply. With rapid heating,
at temperatures around 300°C, lignin is melted. Further, after fast cooling lignin
changes in greater extent its structural than chemical composition. Considering
42
the process, it should be noted that the rate of heating in the installation with the
external heating is determined by heat transfer, heat conduction and radiation, but
inside the unit of natural thermal convection from the wall to the wood. The
slowest processes - thermal conductivity through the wall of the installation is
decisive for the rate of the overall process. At moderate temperatures, the rate of
heat supply in the pyrolysis is not high, so the processes are the predominant in
coal formation [Gordon L.V., 1988].
Charcoal products
Under identical conditions of charring of different wood species, charcoal has
nearly the same composition. With increasing charring temperature, the yield of
coal decreases, but at the same time quality of such charcoal is better (Table 16).
Coal must be produced with respect to certain conditions. Otherwise, in one case,
the charcoal can be fragile, which has many cracks because of an excess of
oxygen. In another case, the charcoal is not “ready” because of the low
temperature or duration of the process. It contains smut, has a brown color,
burning with flame.
Ash and moisture
The ash content of charcoal ranges from 1 to 4%, while the ash content of coal
from a large timber land delivery usually does not exceed 1.5%. Coal, discharged
from the installation does not contain moisture, but it absorbs from the air to a
maximum moisture content of 10-15% [Gordon L.V., 1988]. (Detailed ash
analyses see in the chapter “Co-combustion”).
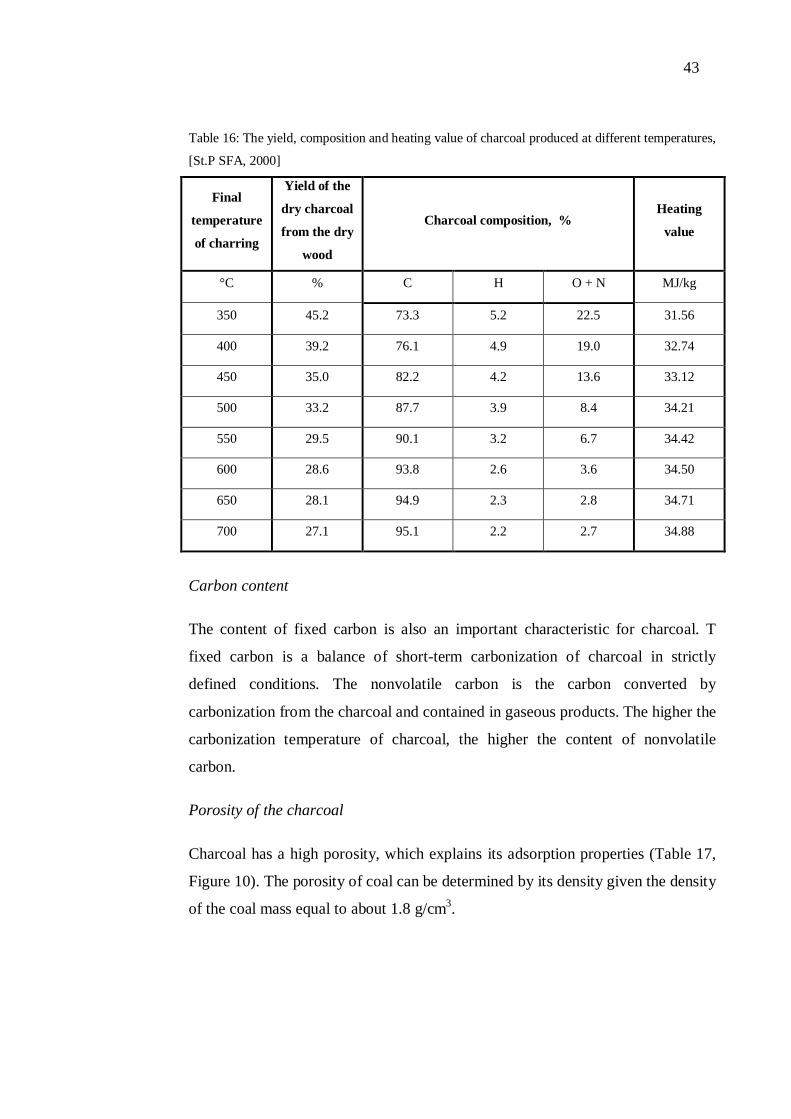
43
Table 16: The yield, composition and heating value of charcoal produced at different temperatures,
[St.P SFA, 2000]
Final
temperature
of charring
Yield of the
dry charcoal
from the dry
wood
Charcoal composition, % Heating
value
°C % C H O + N MJ/kg
350 45.2 73.3 5.2 22.5 31.56
400 39.2 76.1 4.9 19.0 32.74
450 35.0 82.2 4.2 13.6 33.12
500 33.2 87.7 3.9 8.4 34.21
550 29.5 90.1 3.2 6.7 34.42
600 28.6 93.8 2.6 3.6 34.50
650 28.1 94.9 2.3 2.8 34.71
700 27.1 95.1 2.2 2.7 34.88
Carbon content
The content of fixed carbon is also an important characteristic for charcoal. T
fixed carbon is a balance of short-term carbonization of charcoal in strictly
defined conditions. The nonvolatile carbon is the carbon converted by
carbonization from the charcoal and contained in gaseous products. The higher the
carbonization temperature of charcoal, the higher the content of nonvolatile
carbon.
Porosity of the charcoal
Charcoal has a high porosity, which explains its adsorption properties (Table 17,
Figure 10). The porosity of coal can be determined by its density given the density
of the coal mass equal to about 1.8 g/cm3.
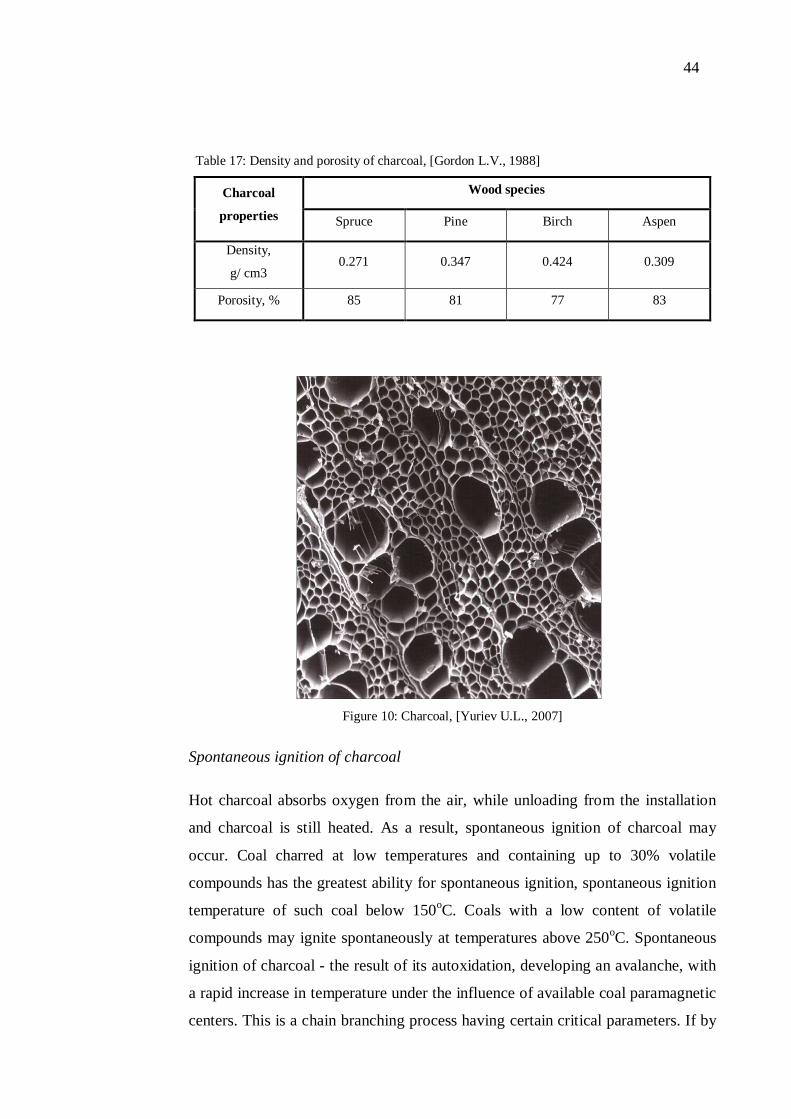
44
Table 17: Density and porosity of charcoal, [Gordon L.V., 1988]
Wood species Charcoal
properties Spruce Pine Birch Aspen
Density,
g/ cm3 0.271 0.347 0.424 0.309
Porosity, % 85 81 77 83
Figure 10: Charcoal, [Yuriev U.L., 2007]
Spontaneous ignition of charcoal
Hot charcoal absorbs oxygen from the air, while unloading from the installation
and charcoal is still heated. As a result, spontaneous ignition of charcoal may
occur. Coal charred at low temperatures and containing up to 30% volatile
compounds has the greatest ability for spontaneous ignition, spontaneous ignition
temperature of such coal below 150oC. Coals with a low content of volatile
compounds may ignite spontaneously at temperatures above 250oC. Spontaneous
ignition of charcoal - the result of its autoxidation, developing an avalanche, with
a rapid increase in temperature under the influence of available coal paramagnetic
centers. This is a chain branching process having certain critical parameters. If by
45
contact of coal with air these settings are not being exceeded, then the coal will
not ignite. Therefore, it is concluded that the stabilization of the hot charcoal can
be accomplished by a controlled cooling of charcoal with air. Under certain
conditions coal absorbs oxygen from the air slowly, not warming up, stable and
loses the ability of spontaneous ignition. Such coals have the temperature of
spontaneous ignition at 340oC. It should be noted that at low ambient temperature
charcoal is cooled too quickly and do not have time to stabilize.
Raw material
Raw material for charring can be divided into 3 groups. The first group includes
birch and hardwood – beech, ash, hornbeam, elm, oak, maple; the second -
deciduous - aspen, alder, linden, poplar, willow; third group consists of conifers -
pine, spruce, cedar, fir, larch.
The yield of charcoal from softwood slightly higher than from hardwood, but the
quality of charcoal from the hardwood is higher. The content of the bark in the
raw material increases the ash content of coal, so the presence of the bark is not
desirable, but in industrial practice removal of the bark is usually not produced.
It should be noted that birch wood and especial aspen wood in older age is often
struck rot, and if not properly stored it in stock, the processes of decay is
accelerating. This leads to a decrease in wood mass per unit volume and decrease
in the yield of pyrolysis products, in addition, the charcoal is small and fragile.
Along with special harvested wood different kind of woody biomass can be used
also, which by their chemical composition not much different from the stemwood.
Agricultural waste as bagasse (sugar cane stalks after sugar extraction), leaves of
sugar cane, coffee husks and straw, are a potentially powerful source of raw
materials for biocoal production. The feature of such raw materials is a high ash
content and low mechanical strength [Yuriev U.L., 2007].
46
3.1.3 Current technologies
Estimation of charcoal production value
Charcoal is produced more than in 130 countries around the world, i.e. almost all
countries with forest resources. Assessment of production control is carried out by
FAO. These data are available in the statistical database of FAO [FAOSTAT]
online. The vast majority of data is tentative, because only 10-15% of global
production of charcoal, as reported by FAO, is based on statistics reported by the
countries themselves.
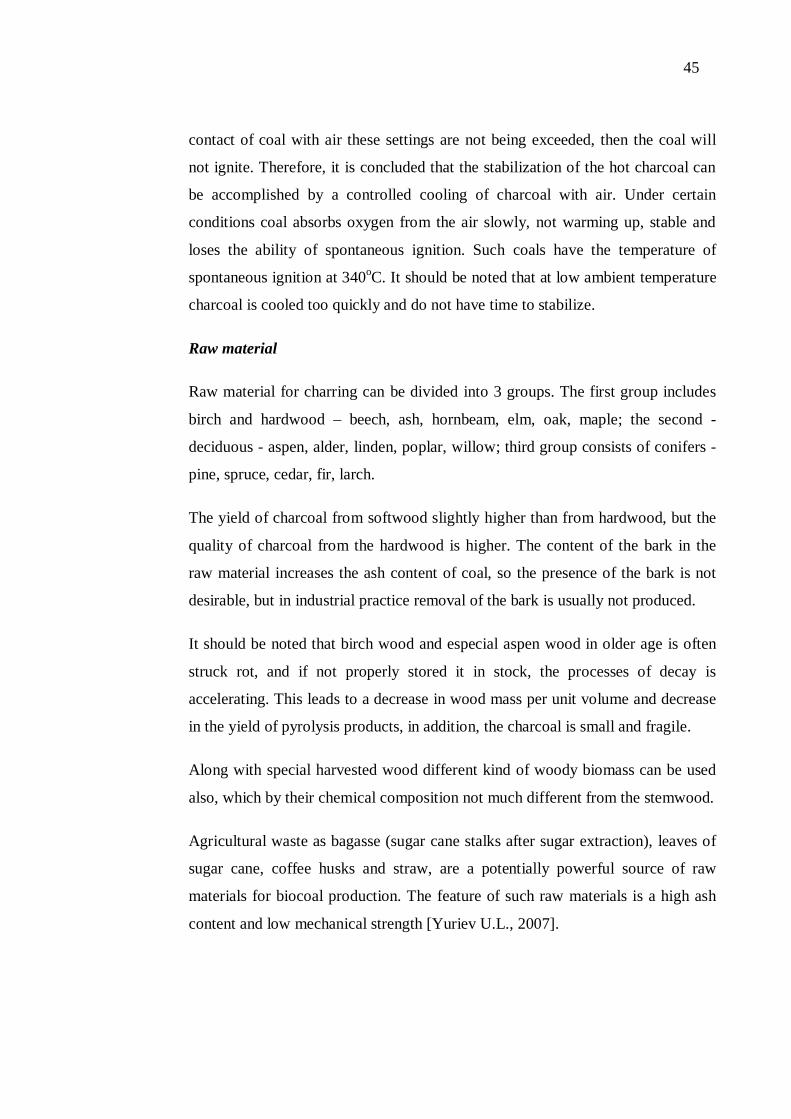
The geographical distribution of charcoal world production (45.5 million tonnes
estimated by FAO, 2005.) is shown in Figure 11.
23,2
15,7
4,5
1,6 0,50
5
10
15
20
25
Figure 11: Distribution of charcoal world production, [FAO, 2005]
From Figure 11 it follows that more than half of charcoal world production (51%)
are in Africa. Europe's share is about 1%, the Americas and Oceania account for
38%, 10% in Asia. FAO estimates that in 2005 there were 9 countries, each of
which produced more than 1 million tons of charcoal per year, as shown in Figure
12.
47
13,1
3,5 3,3
1,7 1,7 1,4 1,3 1,3 1
0
2
4
6
8
10
12
14
Brazil
Thailan
d
Egypt
Tanzan
ia
Congo
Ethiopia
Nigeria
Zambia
India
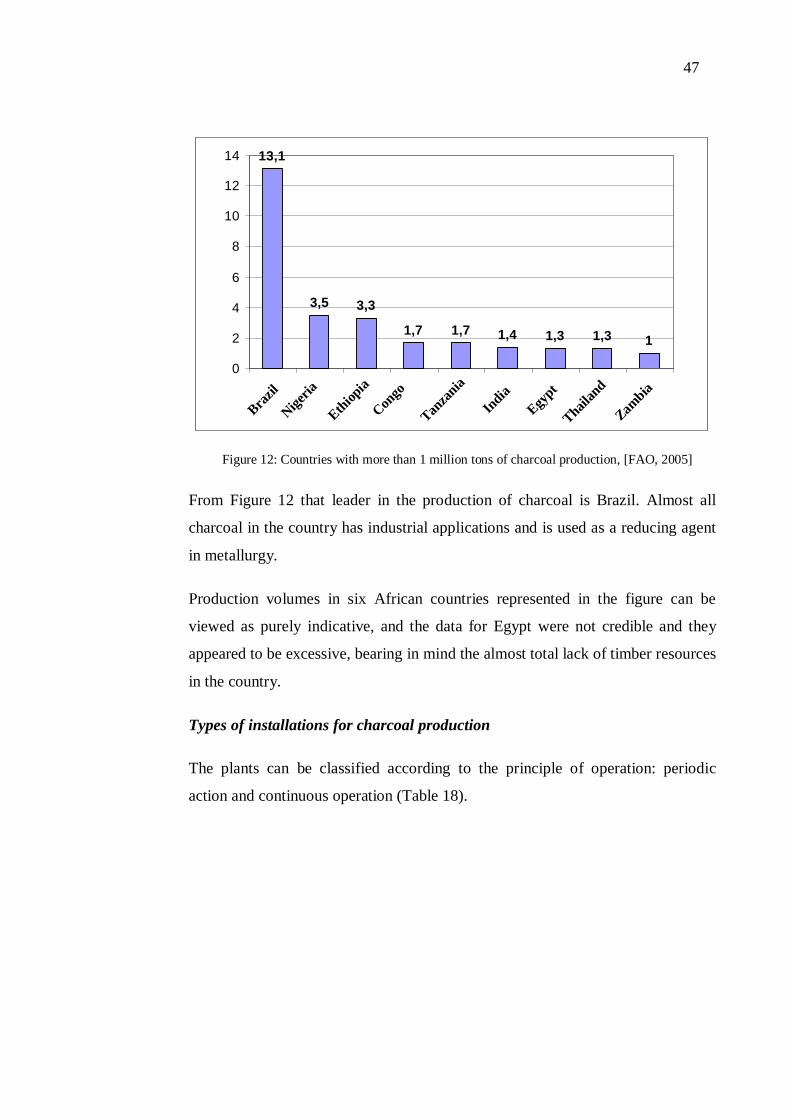
Figure 12: Countries with more than 1 million tons of charcoal production, [FAO, 2005]
From Figure 12 that leader in the production of charcoal is Brazil. Almost all
charcoal in the country has industrial applications and is used as a reducing agent
in metallurgy.
Production volumes in six African countries represented in the figure can be
viewed as purely indicative, and the data for Egypt were not credible and they
appeared to be excessive, bearing in mind the almost total lack of timber resources
in the country.
Types of installations for charcoal production
The plants can be classified according to the principle of operation: periodic
action and continuous operation (Table 18).
48
Table 18: Types of installations
Types of the installations Yield, %
Bath process
Earth pits and mounds >10
Brick, concrete, and metal kilns 20-25
Retorts 30
Continuous process
Retorts and Lambiotte retorts 30-35
Multiple hearth reactors 25-30
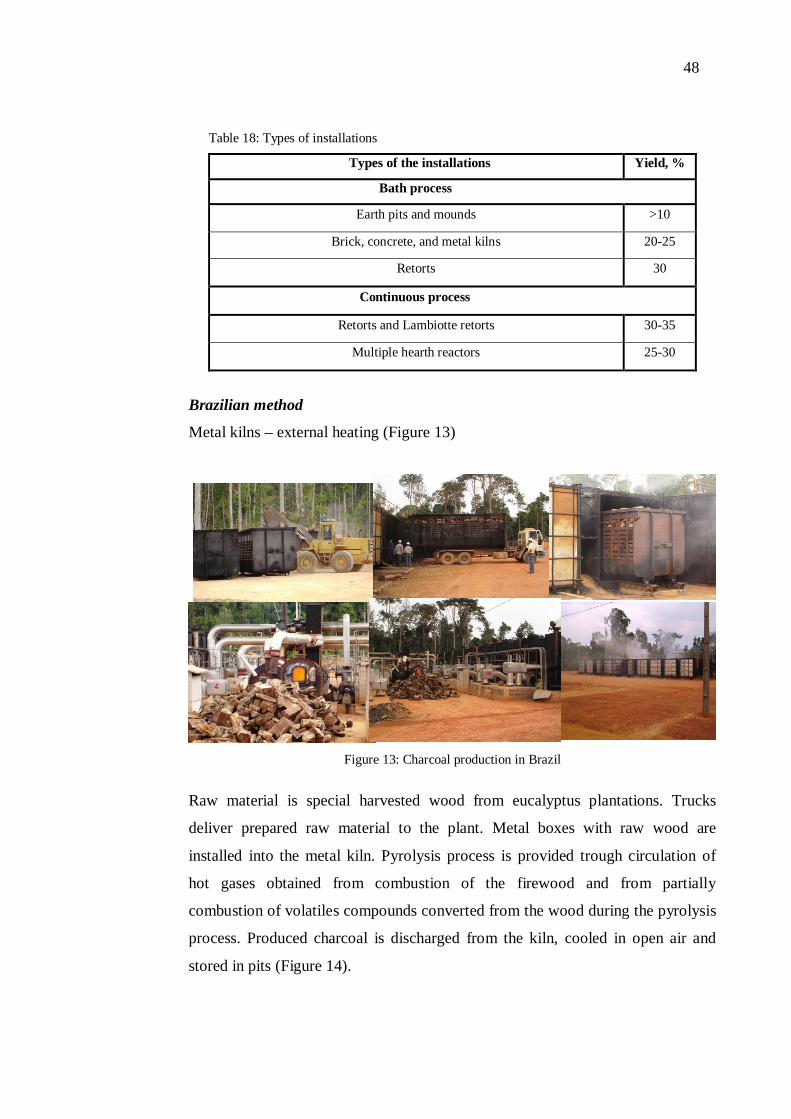
Brazilian method
Metal kilns – external heating (Figure 13)
Figure 13: Charcoal production in Brazil
Raw material is special harvested wood from eucalyptus plantations. Trucks
deliver prepared raw material to the plant. Metal boxes with raw wood are
installed into the metal kiln. Pyrolysis process is provided trough circulation of
hot gases obtained from combustion of the firewood and from partially
combustion of volatiles compounds converted from the wood during the pyrolysis
process. Produced charcoal is discharged from the kiln, cooled in open air and
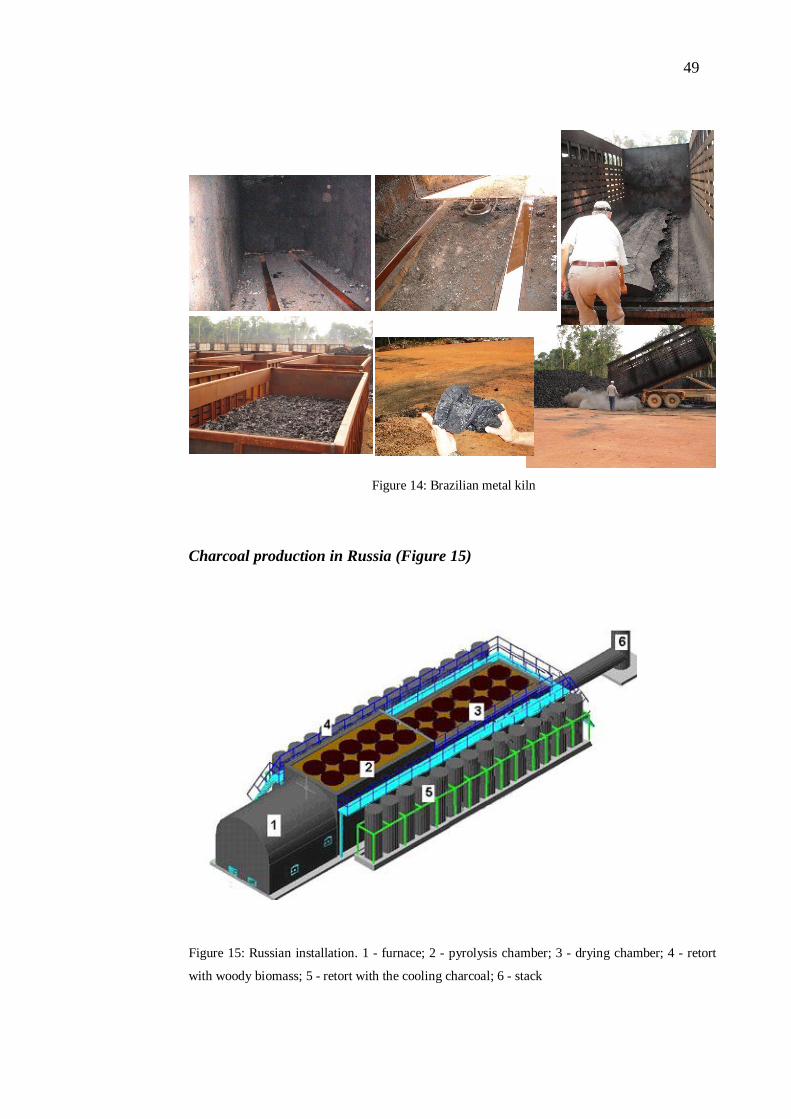
stored in pits (Figure 14).
49
Figure 14: Brazilian metal kiln
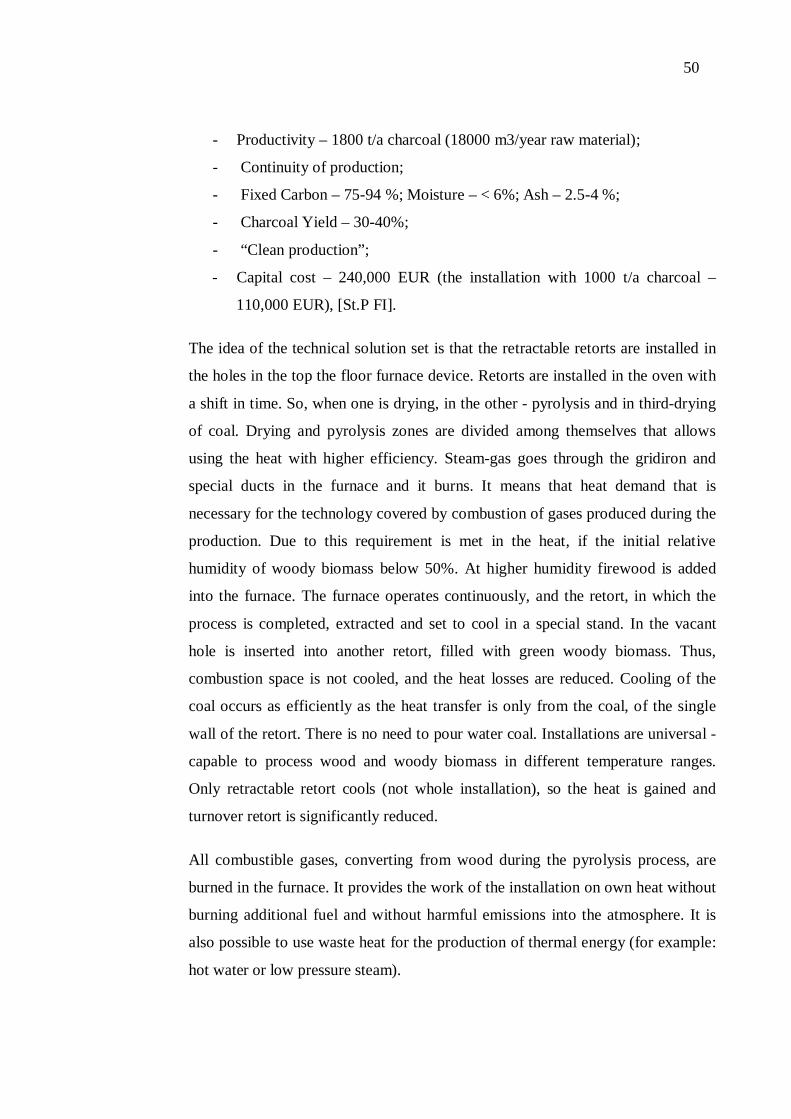
Charcoal production in Russia (Figure 15)
Figure 15: Russian installation. 1 - furnace; 2 - pyrolysis chamber; 3 - drying chamber; 4 - retort
with woody biomass; 5 - retort with the cooling charcoal; 6 - stack
50
- Productivity – 1800 t/a charcoal (18000 m3/year raw material);
- Continuity of production;
- Fixed Carbon – 75-94 %; Moisture – < 6%; Ash – 2.5-4 %;
- Charcoal Yield – 30-40%;
- “Clean production”;
- Capital cost – 240,000 EUR (the installation with 1000 t/a charcoal –
110,000 EUR), [St.P FI].
The idea of the technical solution set is that the retractable retorts are installed in
the holes in the top the floor furnace device. Retorts are installed in the oven with
a shift in time. So, when one is drying, in the other - pyrolysis and in third-drying
of coal. Drying and pyrolysis zones are divided among themselves that allows
using the heat with higher efficiency. Steam-gas goes through the gridiron and
special ducts in the furnace and it burns. It means that heat demand that is
necessary for the technology covered by combustion of gases produced during the
production. Due to this requirement is met in the heat, if the initial relative
humidity of woody biomass below 50%. At higher humidity firewood is added
into the furnace. The furnace operates continuously, and the retort, in which the
process is completed, extracted and set to cool in a special stand. In the vacant
hole is inserted into another retort, filled with green woody biomass. Thus,
combustion space is not cooled, and the heat losses are reduced. Cooling of the
coal occurs as efficiently as the heat transfer is only from the coal, of the single
wall of the retort. There is no need to pour water coal. Installations are universal -
capable to process wood and woody biomass in different temperature ranges.
Only retractable retort cools (not whole installation), so the heat is gained and
turnover retort is significantly reduced.
All combustible gases, converting from wood during the pyrolysis process, are
burned in the furnace. It provides the work of the installation on own heat without
burning additional fuel and without harmful emissions into the atmosphere. It is
also possible to use waste heat for the production of thermal energy (for example:
hot water or low pressure steam).
51
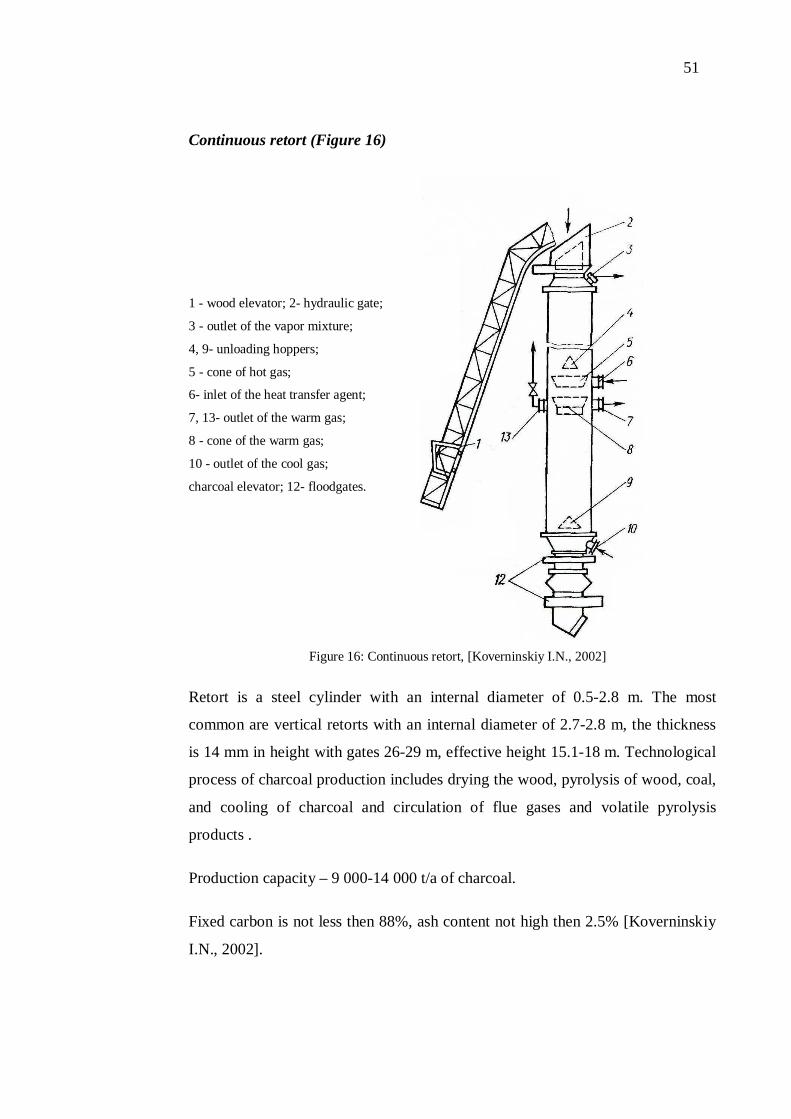
Continuous retort (Figure 16)
1 - wood elevator; 2- hydraulic gate;
3 - outlet of the vapor mixture;
4, 9- unloading hoppers;
5 - cone of hot gas;
6- inlet of the heat transfer agent;
7, 13- outlet of the warm gas;
8 - cone of the warm gas;
10 - outlet of the cool gas;
charcoal elevator; 12- floodgates.
Figure 16: Continuous retort, [Koverninskiy I.N., 2002]
Retort is a steel cylinder with an internal diameter of 0.5-2.8 m. The most
common are vertical retorts with an internal diameter of 2.7-2.8 m, the thickness
is 14 mm in height with gates 26-29 m, effective height 15.1-18 m. Technological
process of charcoal production includes drying the wood, pyrolysis of wood, coal,
and cooling of charcoal and circulation of flue gases and volatile pyrolysis
products .
Production capacity – 9 000-14 000 t/a of charcoal.
Fixed carbon is not less then 88%, ash content not high then 2.5% [Koverninskiy
I.N., 2002].
52
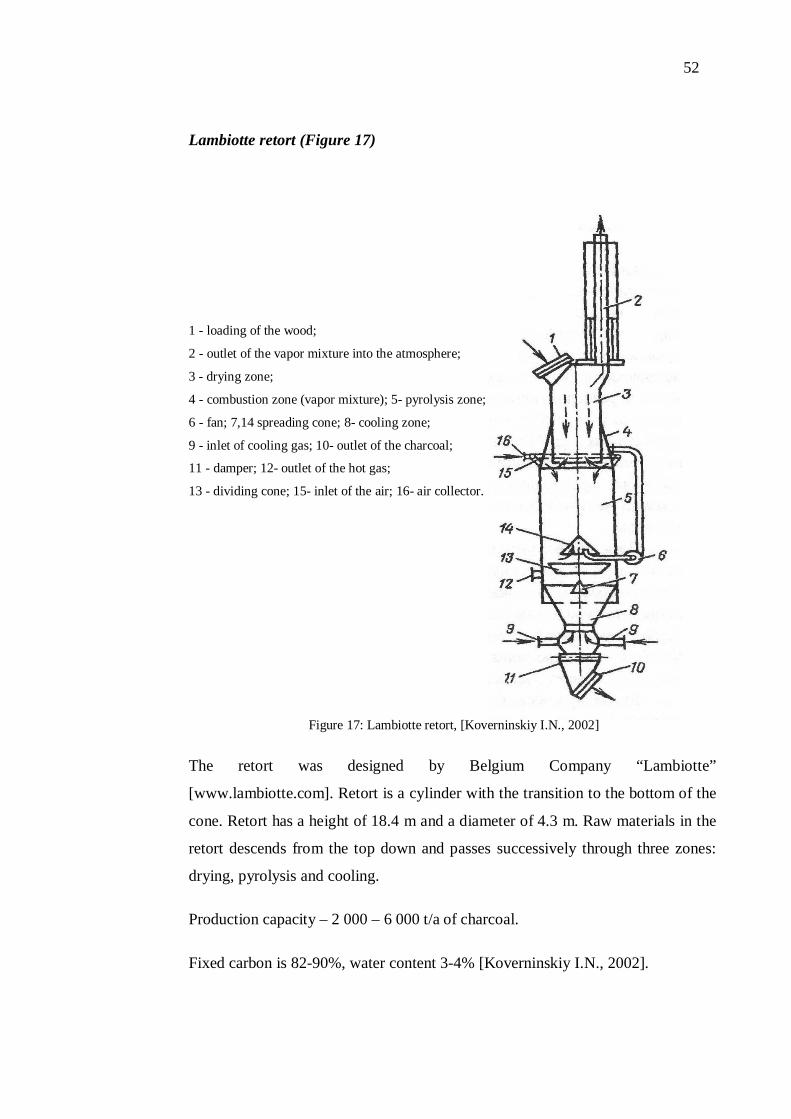
Lambiotte retort (Figure 17)
1 - loading of the wood;
2 - outlet of the vapor mixture into the atmosphere;
3 - drying zone;
4 - combustion zone (vapor mixture); 5- pyrolysis zone;
6 - fan; 7,14 spreading cone; 8- cooling zone;
9 - inlet of cooling gas; 10- outlet of the charcoal;
11 - damper; 12- outlet of the hot gas;
13 - dividing cone; 15- inlet of the air; 16- air collector.
Figure 17: Lambiotte retort, [Koverninskiy I.N., 2002]
The retort was designed by Belgium Company “Lambiotte”
[www.lambiotte.com]. Retort is a cylinder with the transition to the bottom of the
cone. Retort has a height of 18.4 m and a diameter of 4.3 m. Raw materials in the
retort descends from the top down and passes successively through three zones:
drying, pyrolysis and cooling.
Production capacity – 2 000 – 6 000 t/a of charcoal.
Fixed carbon is 82-90%, water content 3-4% [Koverninskiy I.N., 2002].
53
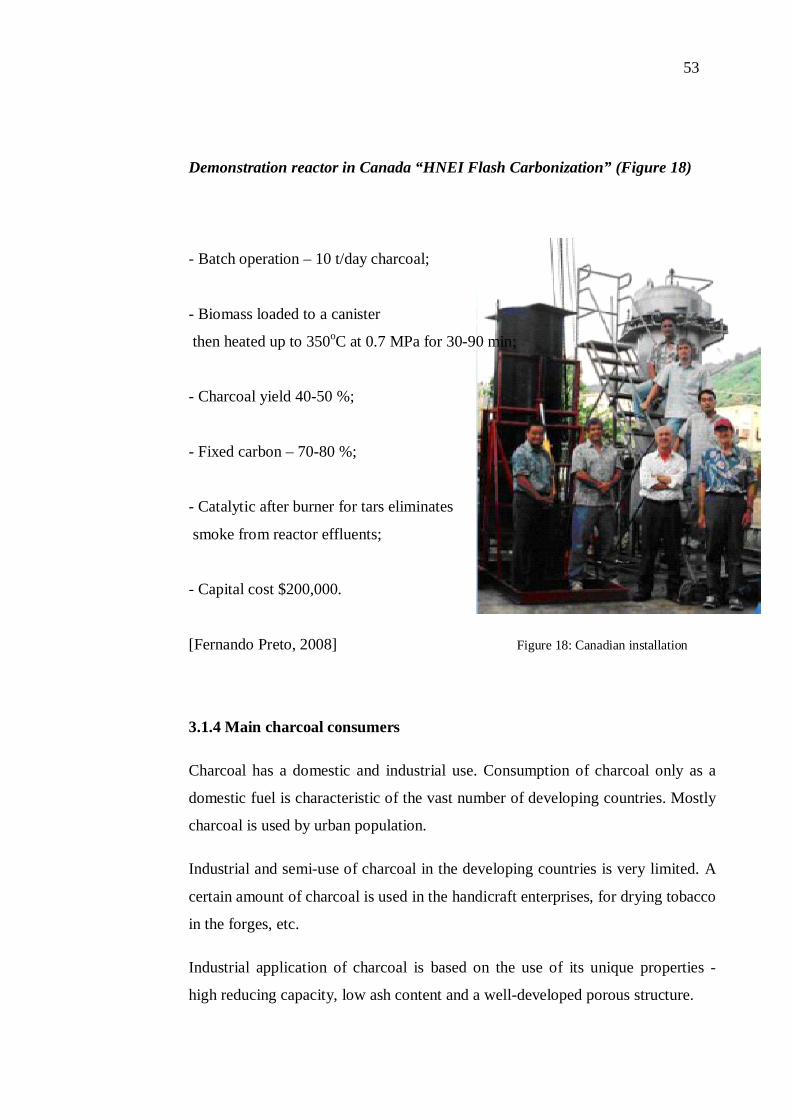
Demonstration reactor in Canada “HNEI Flash Carbonization” (Figure 18)
- Batch operation – 10 t/day charcoal;
- Biomass loaded to a canister
then heated up to 350oC at 0.7 MPa for 30-90 min;
- Charcoal yield 40-50 %;
- Fixed carbon – 70-80 %;
- Catalytic after burner for tars eliminates
smoke from reactor effluents;
- Capital cost $200,000.
[Fernando Preto, 2008] Figure 18: Canadian installation
3.1.4 Main charcoal consumers
Charcoal has a domestic and industrial use. Consumption of charcoal only as a
domestic fuel is characteristic of the vast number of developing countries. Mostly
charcoal is used by urban population.
Industrial and semi-use of charcoal in the developing countries is very limited. A
certain amount of charcoal is used in the handicraft enterprises, for drying tobacco
in the forges, etc.
Industrial application of charcoal is based on the use of its unique properties -
high reducing capacity, low ash content and a well-developed porous structure.
54
Crushed charcoal is used in the production of granulated ferrous metals, in the
production of steel, cast iron, galvanized wire, glass, heat treatment of steel parts.
Charcoal can be also processed into activated charcoal, which is used in the
sorption technique to capture and return to the production of valuable organic
solvents, for the separation of gas mixtures, as an absorbent and as a basis for
catalytic and chemisorptions-active additives, in water purification, in medicine
for the absorption of various harmful substances [Koverninskiy I.N., 2002].
Currently, such property of the charcoal like porosity is under careful
consideration because of the possibility to use charcoal in the form of fertilizer. It
can be added to agricultural land. This is a natural additive which helps catalyze
the action of both organic and chemical fertilizers used on crops. A single
treatment can help increase yields for several years. The use of charcoal dates
back to pre-Columbian Indian civilizations, as reflected in their Terra Preta – very
fertile fields surrounded by poorer soils – which has been the subject of much
scientific research. The use of charcoal helps in carbon sequestration, whilst at the
same time reducing the consumption of fertilizers and bringing a spectacular
improvement in yields.
However, currently, metallurgy is the main industrial consumer of charcoal,
where it is used in the smelting of iron and ferro-alloys, such as ferrosilicon and
silicon.
3.1.5 Charcoal briquette production
The idea of the charcoal briquettes production was arisen because of large amount
of the charcoal fine particles produced during pyrolysis process of waste wood,
especially in installations with heavy duty and forced mixing of the material. Fine
particles of the charcoal had no sales. With the time the competitiveness of
charcoal briquettes became higher, since their quality can be adjusted within wide
limits, and they are well preserved during transportation over long distances and
cheaper to handle unlike usual charcoal. The advantages of charcoal briquettes to
lump charcoal are desirable size, strength and porosity. In consequence,
manufacturers whose plants are located a long distance from their markets
generally briquette their charcoal, both to take advantage of these economies.
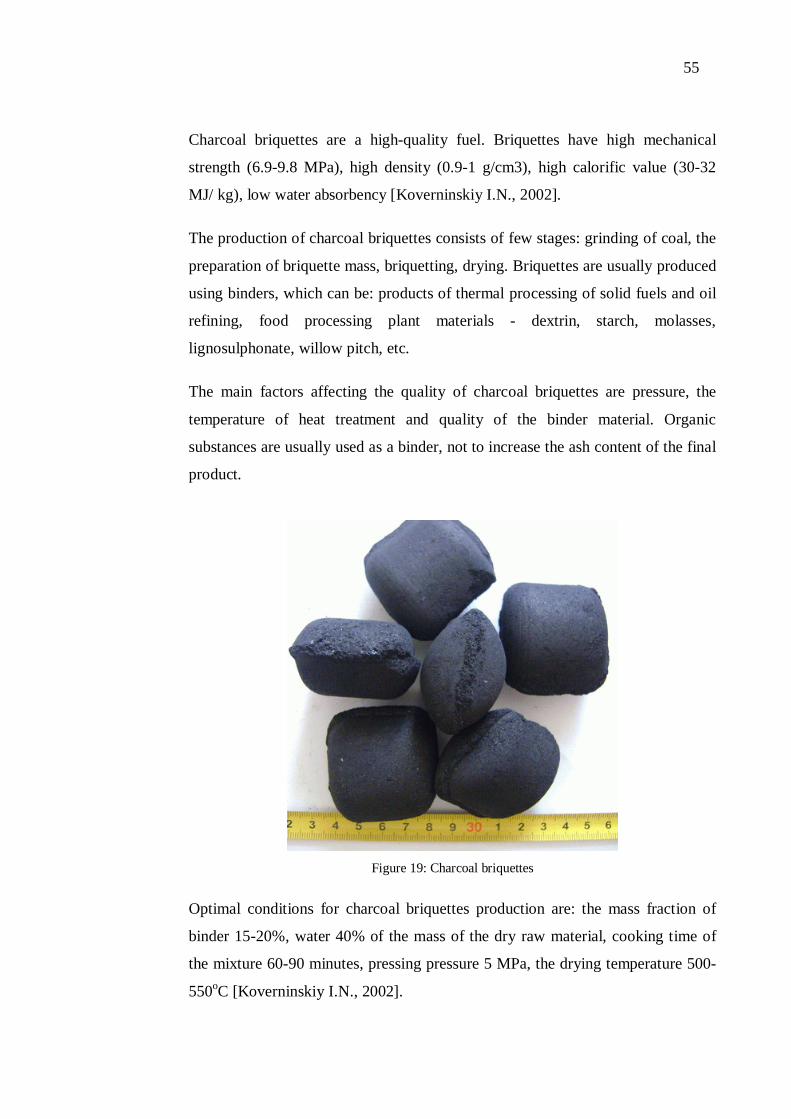
55
Charcoal briquettes are a high-quality fuel. Briquettes have high mechanical
strength (6.9-9.8 MPa), high density (0.9-1 g/cm3), high calorific value (30-32
MJ/ kg), low water absorbency [Koverninskiy I.N., 2002].
The production of charcoal briquettes consists of few stages: grinding of coal, the
preparation of briquette mass, briquetting, drying. Briquettes are usually produced
using binders, which can be: products of thermal processing of solid fuels and oil
refining, food processing plant materials - dextrin, starch, molasses,
lignosulphonate, willow pitch, etc.
The main factors affecting the quality of charcoal briquettes are pressure, the
temperature of heat treatment and quality of the binder material. Organic
substances are usually used as a binder, not to increase the ash content of the final
product.
Figure 19: Charcoal briquettes
Optimal conditions for charcoal briquettes production are: the mass fraction of
binder 15-20%, water 40% of the mass of the dry raw material, cooking time of
the mixture 60-90 minutes, pressing pressure 5 MPa, the drying temperature 500-
550oC [Koverninskiy I.N., 2002].
56
Production of charcoal briquettes does not represent a significant environmental
hazard, as a binder (for example starch), non-toxic and does not emit harmful
substances during drying. Drying of charcoal briquettes are usually carried out by
hot air and no danger to the environment. However, dust emissions are during
charcoal briquettes production, so it is needed an effective dust control. Costs of
charcoal briquettes production are mainly related to the cost of raw materials and
energy.
The plant in Suolahti, Finland (KS Party Oy) can be considered as an example of
charcoal briquettes production. The building of factory has begun in 1944 with
help of State. In that time the general production was a fuel produced from tar for
tanks (biodiesel). After the end of the war the factory was sold to a private owner,
and the main production was a tar till 1970, but produced charcoal was being sold
for different aims. As a demand for a tar became low, so the general product is a
production of charcoal for a grill. In 1977 the first line for packing of briquettes
was effected, by the pressing of charcoal dust. The name of KS Party Oy has been
given to the company in 1999 and till now the general product are charcoal and
briquettes produced by the pressing of charcoal dust [KS Party Oy].
The line of briquettes production consists of screw conveyor, mixers, press,
packaging line, weigher, drying kiln and generator with burner and fan [KS Party
Oy, 2010]. Three hangars for the production and the manufacture building are
located on the territory of the plant. There is also the building (old plant) where tar
was produced but it is partially destroyed.
57
Table 19: Certificate of the charcoal briquettes quality, [KS Party Oy, 2010]
Certificate of the charcoal briquettes quality
Analysis 1
Properties of the
charcoal briquette Method Unit
Volatiles (daf) % 7.2
Water vapor (105oC) V20 % 0.9
Ash content (550oC) V20 % 4.6
Analysis 2
Volatiles (daf) % 13
Water vapor V20 % 1.8
Ash content V20 % 6.3
3.2 Torrefaction of the wood
3.2.1 Torrefaction principle. Research of the Mark J Prins team
There were made two researches: first research was devoted to study the kinetics
of the process and the second to analysis of products obtained by torrefaction.
As was sad in the beginning, the wood fractions show different thermal behavior.
Three zones may therefore be distinguished in weight loss curves of wood:
hemicelluloses, the most reactive compounds, decompose at temperature in the
range of 225 – 325o , cellulose at 305 – 375o and lignin gradually over the
temperature range of 250 – 500o . The research of the Mark J. Princs team was
addressed specifically the first zone, i.e., a process also known as torrefaction -
decomposition of hemicellulose in the relatively low temperature range of 225–
300o .
The weight loss kinetics of lignocellulosic fuels have been determined in many
different experimental devices. Such devices include thermogravimetric analyzers
(TGA), tube furnaces and fluidized bed reactors (Figure 20). The research
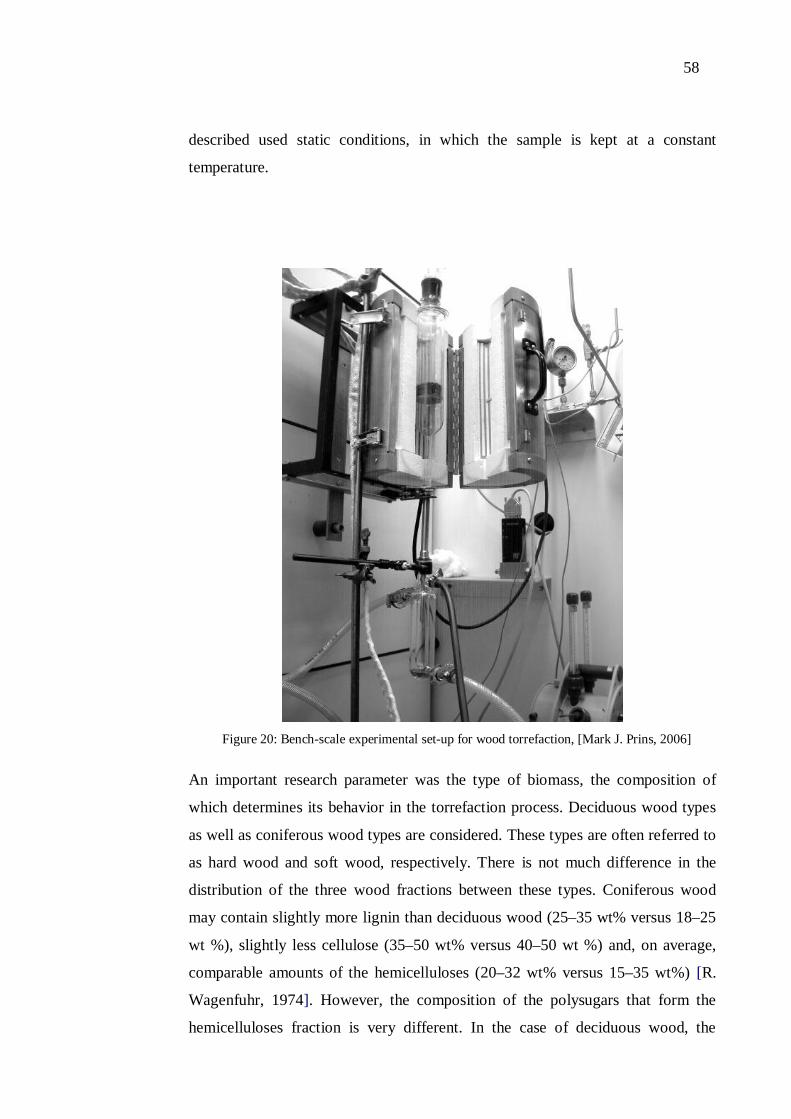
58
described used static conditions, in which the sample is kept at a constant
temperature.
Figure 20: Bench-scale experimental set-up for wood torrefaction, [Mark J. Prins, 2006]
An important research parameter was the type of biomass, the composition of
which determines its behavior in the torrefaction process. Deciduous wood types
as well as coniferous wood types are considered. These types are often referred to
as hard wood and soft wood, respectively. There is not much difference in the
distribution of the three wood fractions between these types. Coniferous wood
may contain slightly more lignin than deciduous wood (25–35 wt% versus 18–25
wt %), slightly less cellulose (35–50 wt% versus 40–50 wt %) and, on average,
comparable amounts of the hemicelluloses (20–32 wt% versus 15–35 wt%) [R.
Wagenfuhr, 1974]. However, the composition of the polysugars that form the
hemicelluloses fraction is very different. In the case of deciduous wood, the
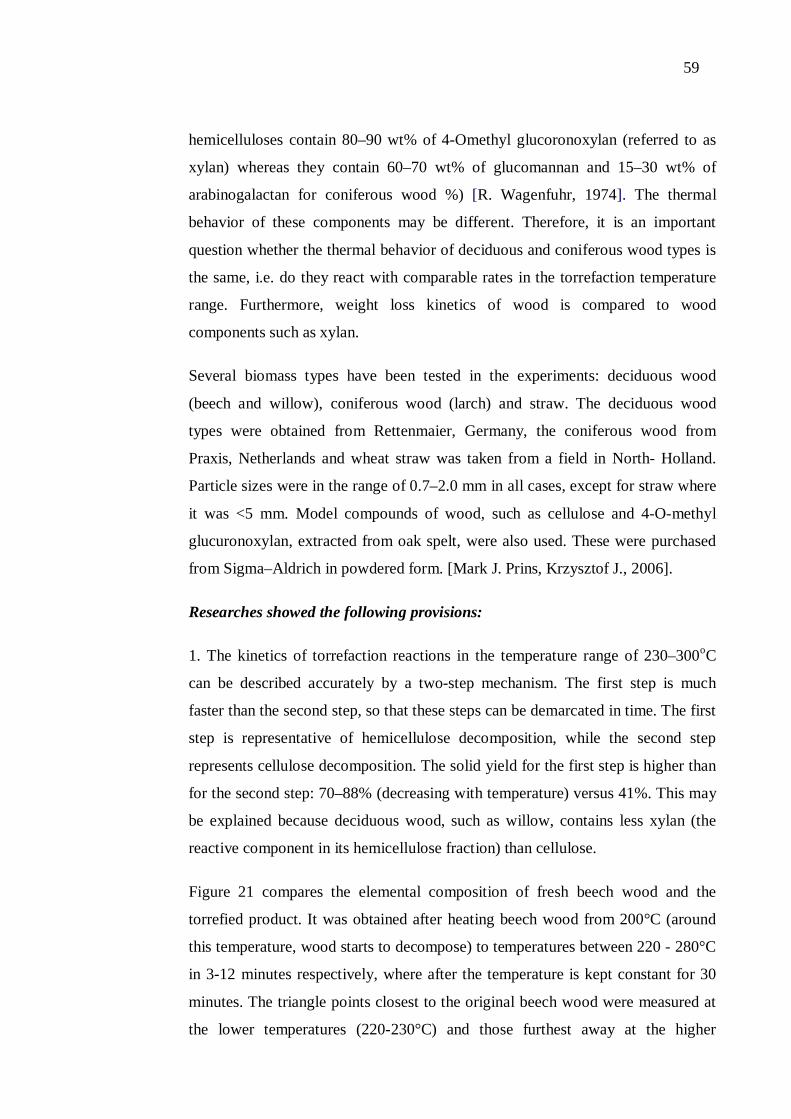
59
hemicelluloses contain 80–90 wt% of 4-Omethyl glucoronoxylan (referred to as
xylan) whereas they contain 60–70 wt% of glucomannan and 15–30 wt% of
arabinogalactan for coniferous wood %) [R. Wagenfuhr, 1974]. The thermal
behavior of these components may be different. Therefore, it is an important
question whether the thermal behavior of deciduous and coniferous wood types is
the same, i.e. do they react with comparable rates in the torrefaction temperature
range. Furthermore, weight loss kinetics of wood is compared to wood
components such as xylan.
Several biomass types have been tested in the experiments: deciduous wood
(beech and willow), coniferous wood (larch) and straw. The deciduous wood
types were obtained from Rettenmaier, Germany, the coniferous wood from
Praxis, Netherlands and wheat straw was taken from a field in North- Holland.
Particle sizes were in the range of 0.7–2.0 mm in all cases, except for straw where
it was <5 mm. Model compounds of wood, such as cellulose and 4-O-methyl
glucuronoxylan, extracted from oak spelt, were also used. These were purchased
from Sigma–Aldrich in powdered form. [Mark J. Prins, Krzysztof J., 2006].
Researches showed the following provisions:
1. The kinetics of torrefaction reactions in the temperature range of 230–300oC
can be described accurately by a two-step mechanism. The first step is much
faster than the second step, so that these steps can be demarcated in time. The first
step is representative of hemicellulose decomposition, while the second step
represents cellulose decomposition. The solid yield for the first step is higher than
for the second step: 70–88% (decreasing with temperature) versus 41%. This may
be explained because deciduous wood, such as willow, contains less xylan (the
reactive component in its hemicellulose fraction) than cellulose.
Figure 21 compares the elemental composition of fresh beech wood and the
torrefied product. It was obtained after heating beech wood from 200°C (around
this temperature, wood starts to decompose) to temperatures between 220 - 280°C
in 3-12 minutes respectively, where after the temperature is kept constant for 30
minutes. The triangle points closest to the original beech wood were measured at
the lower temperatures (220-230°C) and those furthest away at the higher
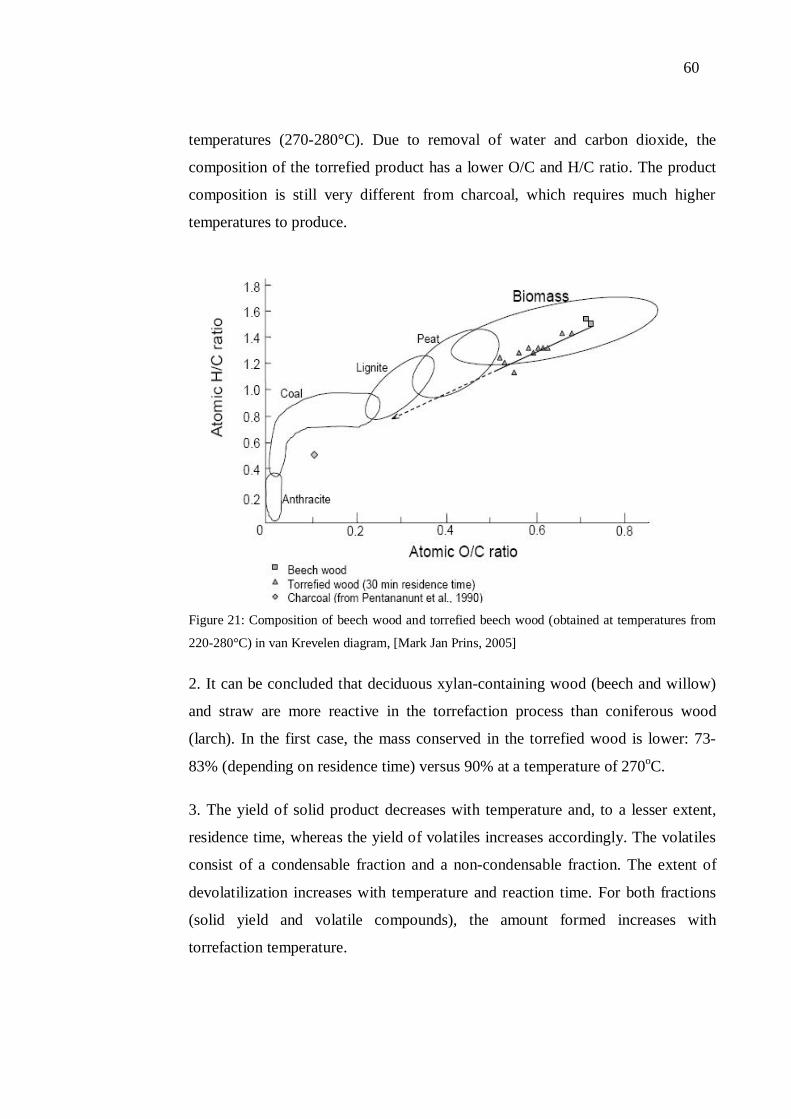
60
temperatures (270-280°C). Due to removal of water and carbon dioxide, the
composition of the torrefied product has a lower O/C and H/C ratio. The product
composition is still very different from charcoal, which requires much higher
temperatures to produce.
Figure 21: Composition of beech wood and torrefied beech wood (obtained at temperatures from
220-280°C) in van Krevelen diagram, [Mark Jan Prins, 2005]
2. It can be concluded that deciduous xylan-containing wood (beech and willow)
and straw are more reactive in the torrefaction process than coniferous wood
(larch). In the first case, the mass conserved in the torrefied wood is lower: 73-
83% (depending on residence time) versus 90% at a temperature of 270oC.
3. The yield of solid product decreases with temperature and, to a lesser extent,
residence time, whereas the yield of volatiles increases accordingly. The volatiles
consist of a condensable fraction and a non-condensable fraction. The extent of
devolatilization increases with temperature and reaction time. For both fractions
(solid yield and volatile compounds), the amount formed increases with
torrefaction temperature.
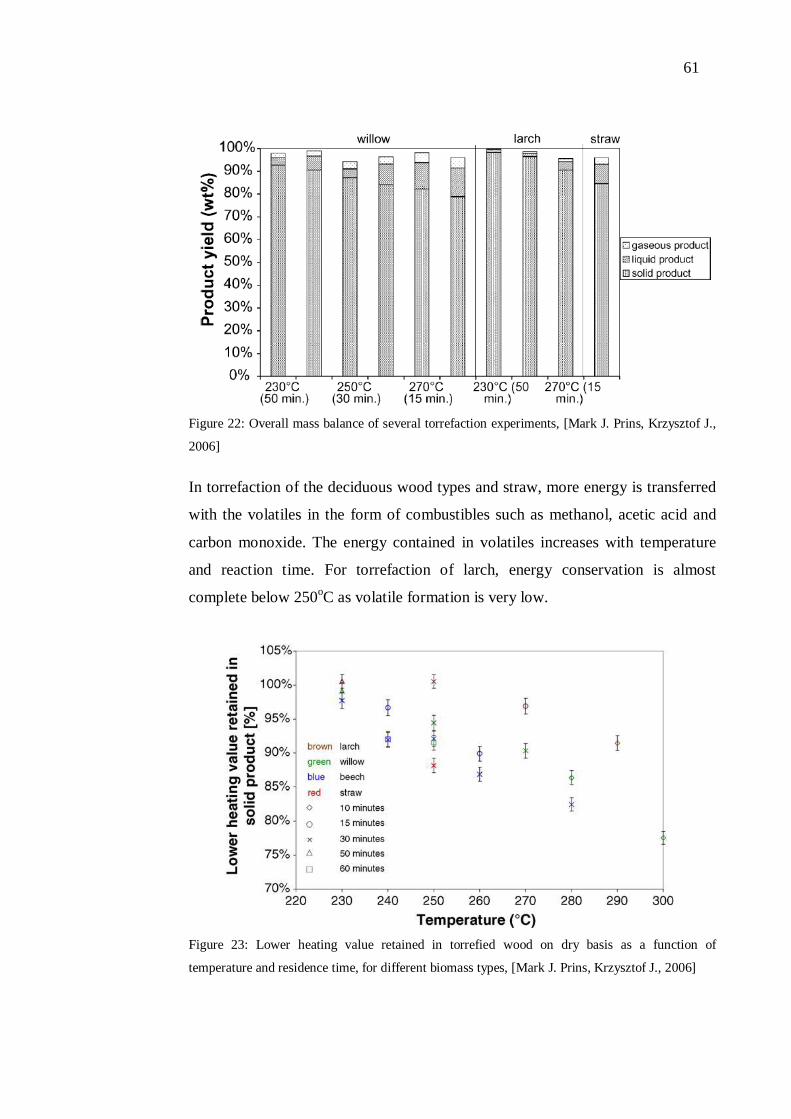
61
Figure 22: Overall mass balance of several torrefaction experiments, [Mark J. Prins, Krzysztof J.,
2006]
In torrefaction of the deciduous wood types and straw, more energy is transferred
with the volatiles in the form of combustibles such as methanol, acetic acid and
carbon monoxide. The energy contained in volatiles increases with temperature
and reaction time. For torrefaction of larch, energy conservation is almost
complete below 250oC as volatile formation is very low.
Figure 23: Lower heating value retained in torrefied wood on dry basis as a function of
temperature and residence time, for different biomass types, [Mark J. Prins, Krzysztof J., 2006]
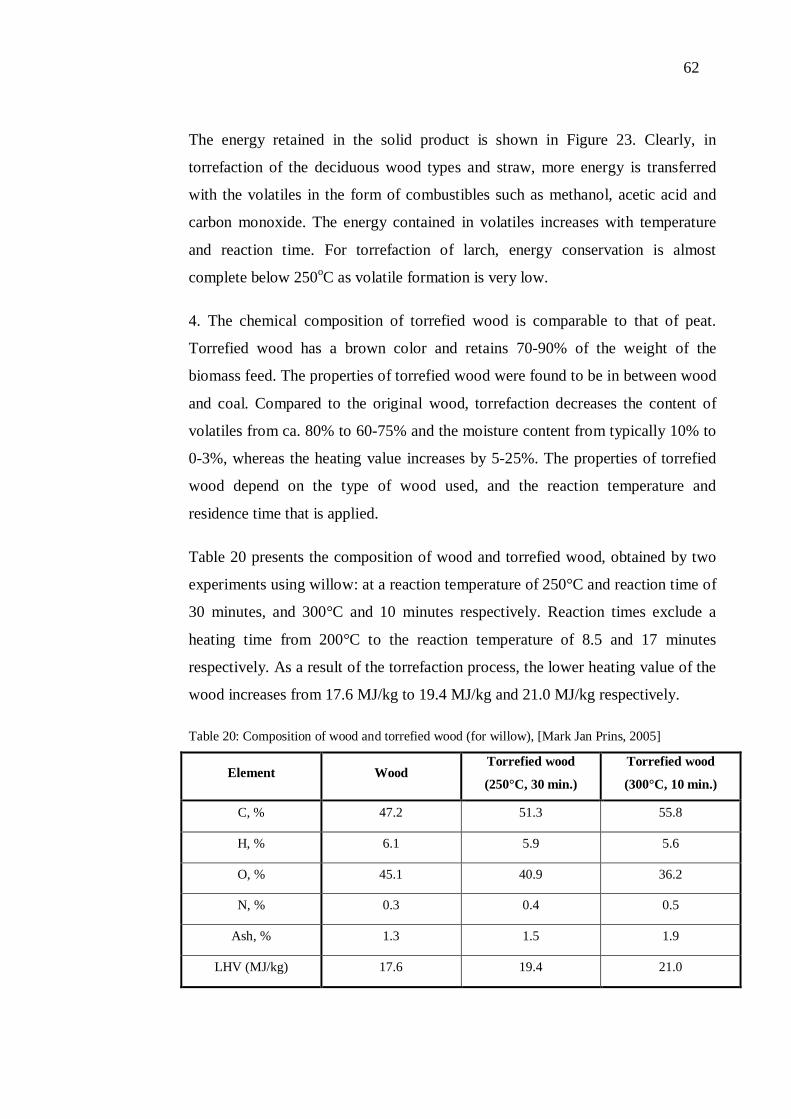
62
The energy retained in the solid product is shown in Figure 23. Clearly, in
torrefaction of the deciduous wood types and straw, more energy is transferred
with the volatiles in the form of combustibles such as methanol, acetic acid and
carbon monoxide. The energy contained in volatiles increases with temperature
and reaction time. For torrefaction of larch, energy conservation is almost
complete below 250oC as volatile formation is very low.
4. The chemical composition of torrefied wood is comparable to that of peat.
Torrefied wood has a brown color and retains 70-90% of the weight of the
biomass feed. The properties of torrefied wood were found to be in between wood
and coal. Compared to the original wood, torrefaction decreases the content of
volatiles from ca. 80% to 60-75% and the moisture content from typically 10% to
0-3%, whereas the heating value increases by 5-25%. The properties of torrefied
wood depend on the type of wood used, and the reaction temperature and
residence time that is applied.
Table 20 presents the composition of wood and torrefied wood, obtained by two
experiments using willow: at a reaction temperature of 250°C and reaction time of
30 minutes, and 300°C and 10 minutes respectively. Reaction times exclude a
heating time from 200°C to the reaction temperature of 8.5 and 17 minutes
respectively. As a result of the torrefaction process, the lower heating value of the
wood increases from 17.6 MJ/kg to 19.4 MJ/kg and 21.0 MJ/kg respectively.
Table 20: Composition of wood and torrefied wood (for willow), [Mark Jan Prins, 2005]
Element Wood Torrefied wood
(250°C, 30 min.)
Torrefied wood
(300°C, 10 min.)
C, % 47.2 51.3 55.8
H, % 6.1 5.9 5.6
O, % 45.1 40.9 36.2
N, % 0.3 0.4 0.5
Ash, % 1.3 1.5 1.9
LHV (MJ/kg) 17.6 19.4 21.0
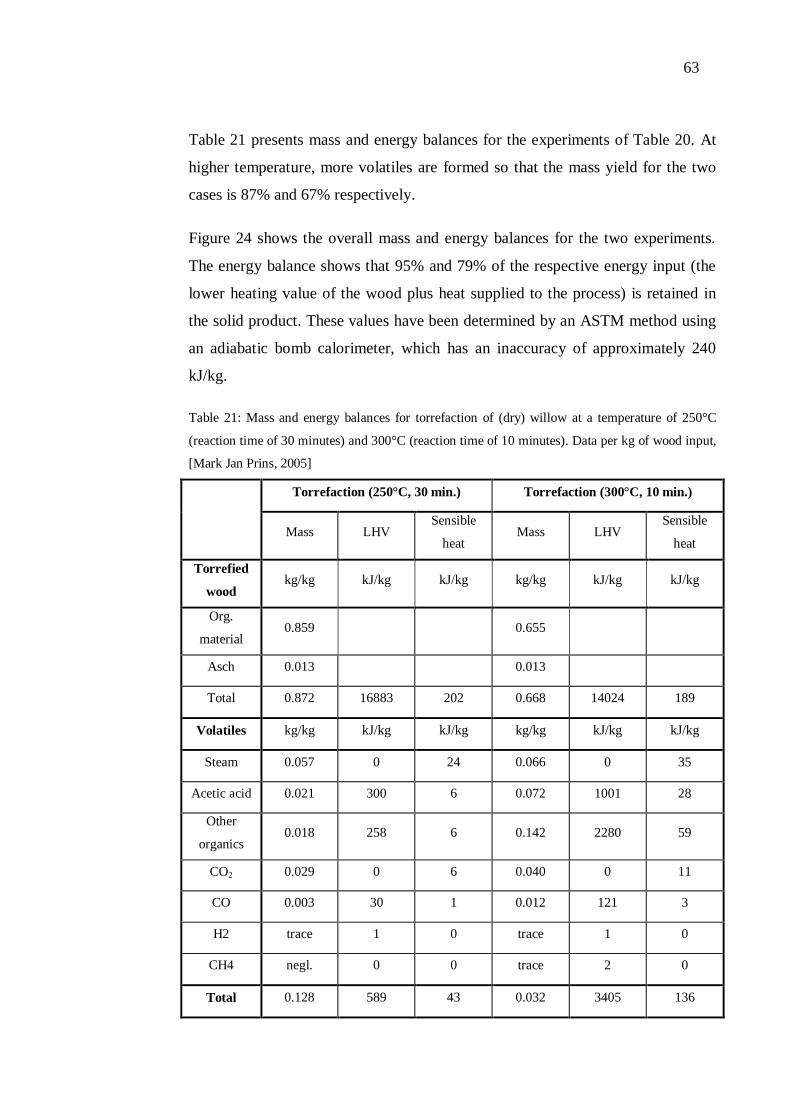
63
Table 21 presents mass and energy balances for the experiments of Table 20. At
higher temperature, more volatiles are formed so that the mass yield for the two
cases is 87% and 67% respectively.
Figure 24 shows the overall mass and energy balances for the two experiments.
The energy balance shows that 95% and 79% of the respective energy input (the
lower heating value of the wood plus heat supplied to the process) is retained in
the solid product. These values have been determined by an ASTM method using
an adiabatic bomb calorimeter, which has an inaccuracy of approximately 240
kJ/kg.
Table 21: Mass and energy balances for torrefaction of (dry) willow at a temperature of 250°C
(reaction time of 30 minutes) and 300°C (reaction time of 10 minutes). Data per kg of wood input,
[Mark Jan Prins, 2005]
Torrefaction (250°C, 30 min.) Torrefaction (300°C, 10 min.)
Mass LHV
Sensible
heat Mass LHV
Sensible
heat
Torrefied
wood kg/kg kJ/kg kJ/kg kg/kg kJ/kg kJ/kg
Org.
material 0.859 0.655
Asch 0.013 0.013
Total 0.872 16883 202 0.668 14024 189
Volatiles kg/kg kJ/kg kJ/kg kg/kg kJ/kg kJ/kg
Steam 0.057 0 24 0.066 0 35
Acetic acid 0.021 300 6 0.072 1001 28
Other
organics 0.018 258 6 0.142 2280 59
CO2 0.029 0 6 0.040 0 11
CO 0.003 30 1 0.012 121 3
H2 trace 1 0 trace 1 0
CH4 negl. 0 0 trace 2 0
Total 0.128 589 43 0.032 3405 136
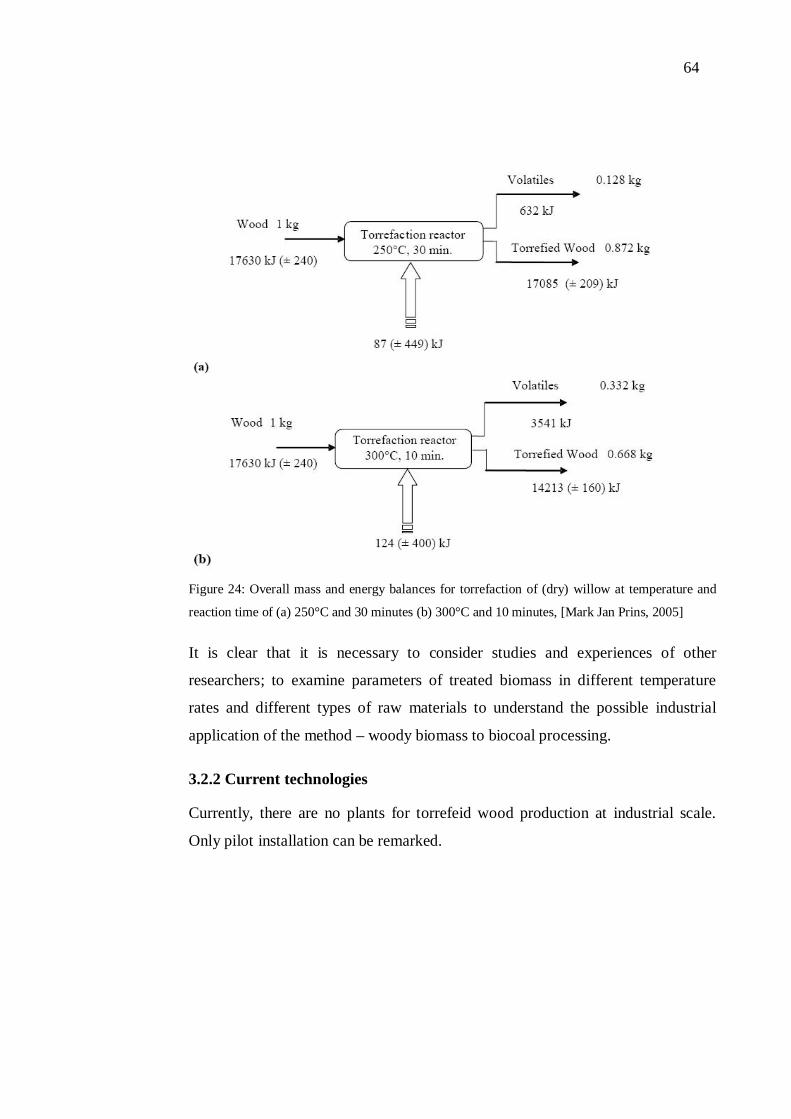
64
Figure 24: Overall mass and energy balances for torrefaction of (dry) willow at temperature and
reaction time of (a) 250°C and 30 minutes (b) 300°C and 10 minutes, [Mark Jan Prins, 2005]
It is clear that it is necessary to consider studies and experiences of other
researchers; to examine parameters of treated biomass in different temperature
rates and different types of raw materials to understand the possible industrial
application of the method – woody biomass to biocoal processing.
3.2.2 Current technologies
Currently, there are no plants for torrefeid wood production at industrial scale.
Only pilot installation can be remarked.
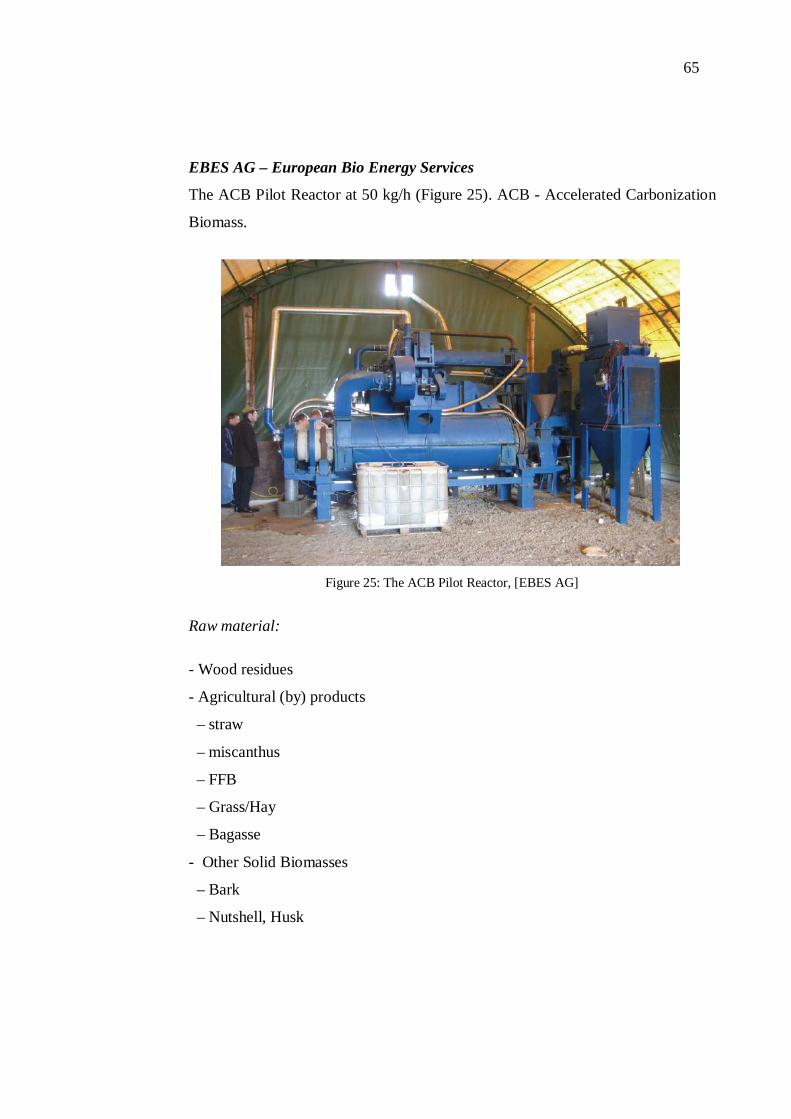
65
EBES AG – European Bio Energy Services
The ACB Pilot Reactor at 50 kg/h (Figure 25). ACB - Accelerated Carbonization
Biomass.
Figure 25: The ACB Pilot Reactor, [EBES AG]
Raw material:
- Wood residues
- Agricultural (by) products
– straw
– miscanthus
– FFB
– Grass/Hay
– Bagasse
- Other Solid Biomasses
– Bark
– Nutshell, Husk
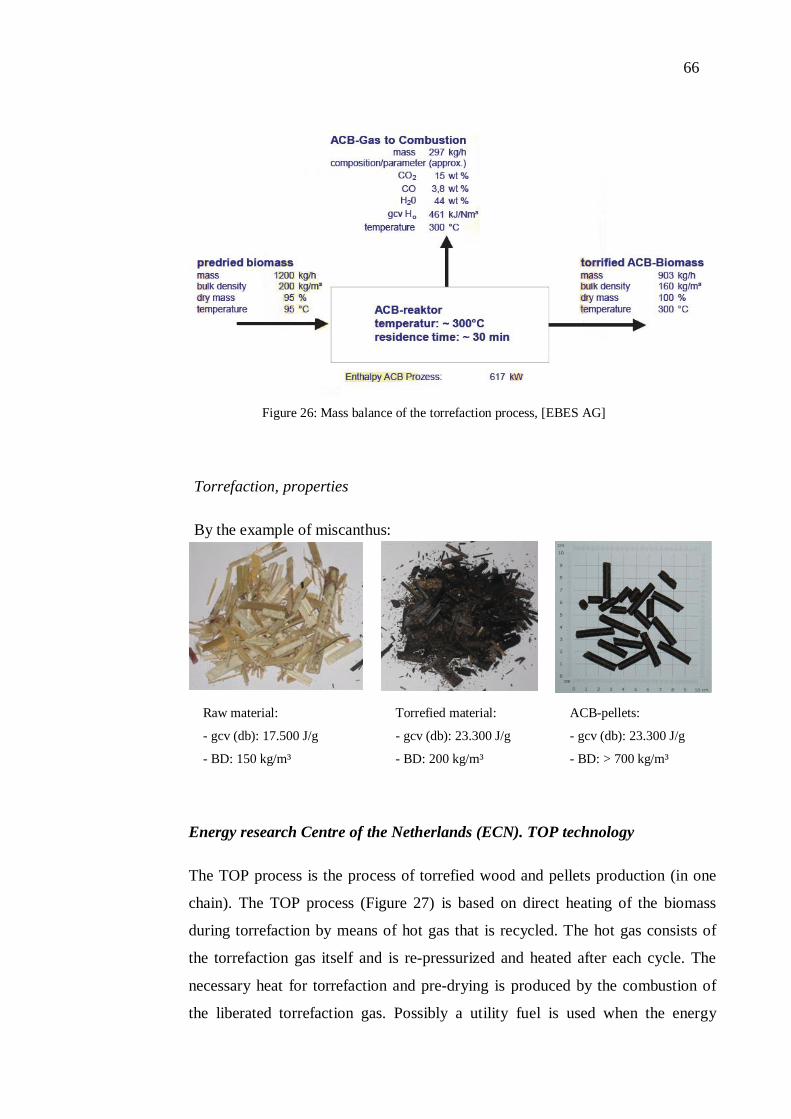
66
Figure 26: Mass balance of the torrefaction process, [EBES AG]
Energy research Centre of the Netherlands (ECN). TOP technology
The TOP process is the process of torrefied wood and pellets production (in one
chain). The TOP process (Figure 27) is based on direct heating of the biomass
during torrefaction by means of hot gas that is recycled. The hot gas consists of
the torrefaction gas itself and is re-pressurized and heated after each cycle. The
necessary heat for torrefaction and pre-drying is produced by the combustion of
the liberated torrefaction gas. Possibly a utility fuel is used when the energy
Torrefaction, properties
By the example of miscanthus:
Raw material:
- gcv (db): 17.500 J/g
- BD: 150 kg/m³
Torrefied material:
- gcv (db): 23.300 J/g
- BD: 200 kg/m³
ACB-pellets:
- gcv (db): 23.300 J/g
- BD: > 700 kg/m³
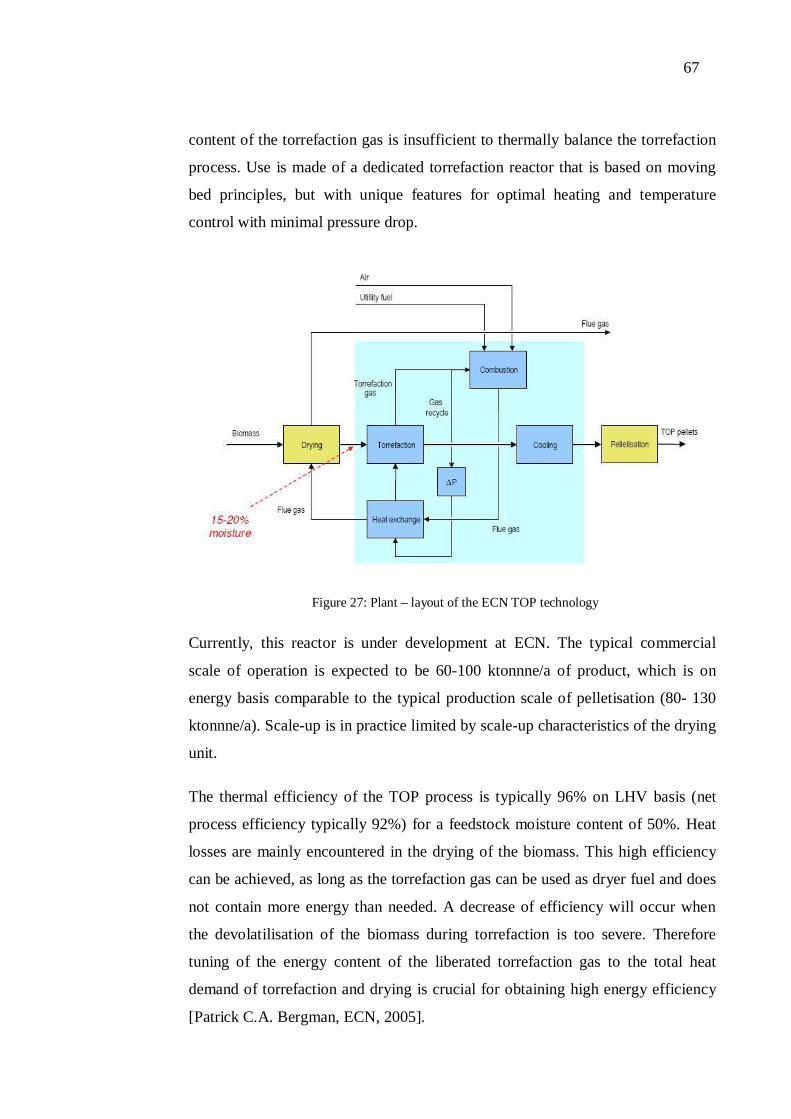
67
content of the torrefaction gas is insufficient to thermally balance the torrefaction
process. Use is made of a dedicated torrefaction reactor that is based on moving
bed principles, but with unique features for optimal heating and temperature
control with minimal pressure drop.
Figure 27: Plant – layout of the ECN TOP technology
Currently, this reactor is under development at ECN. The typical commercial
scale of operation is expected to be 60-100 ktonnne/a of product, which is on
energy basis comparable to the typical production scale of pelletisation (80- 130
ktonnne/a). Scale-up is in practice limited by scale-up characteristics of the drying
unit.
The thermal efficiency of the TOP process is typically 96% on LHV basis (net
process efficiency typically 92%) for a feedstock moisture content of 50%. Heat
losses are mainly encountered in the drying of the biomass. This high efficiency
can be achieved, as long as the torrefaction gas can be used as dryer fuel and does
not contain more energy than needed. A decrease of efficiency will occur when
the devolatilisation of the biomass during torrefaction is too severe. Therefore
tuning of the energy content of the liberated torrefaction gas to the total heat
demand of torrefaction and drying is crucial for obtaining high energy efficiency
[Patrick C.A. Bergman, ECN, 2005].
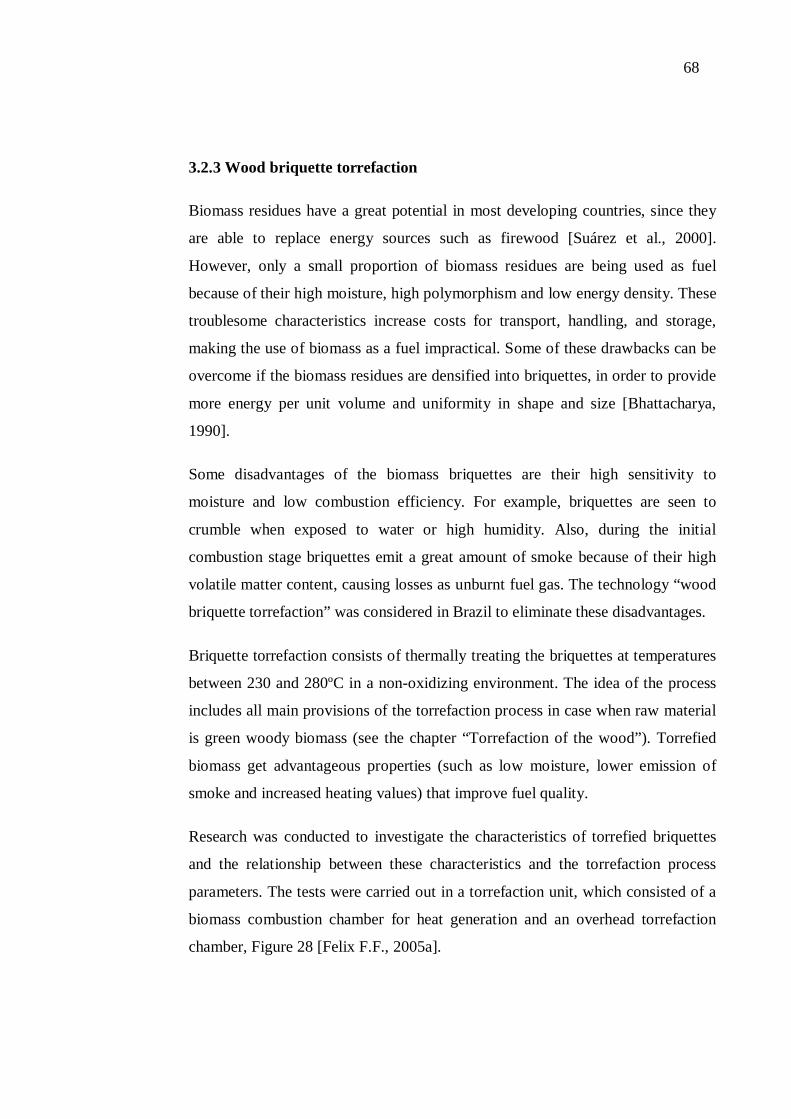
68
3.2.3 Wood briquette torrefaction
Biomass residues have a great potential in most developing countries, since they
are able to replace energy sources such as firewood [Suárez et al., 2000].
However, only a small proportion of biomass residues are being used as fuel
because of their high moisture, high polymorphism and low energy density. These
troublesome characteristics increase costs for transport, handling, and storage,
making the use of biomass as a fuel impractical. Some of these drawbacks can be
overcome if the biomass residues are densified into briquettes, in order to provide
more energy per unit volume and uniformity in shape and size [Bhattacharya,
1990].
Some disadvantages of the biomass briquettes are their high sensitivity to
moisture and low combustion efficiency. For example, briquettes are seen to
crumble when exposed to water or high humidity. Also, during the initial
combustion stage briquettes emit a great amount of smoke because of their high
volatile matter content, causing losses as unburnt fuel gas. The technology “wood
briquette torrefaction” was considered in Brazil to eliminate these disadvantages.
Briquette torrefaction consists of thermally treating the briquettes at temperatures
between 230 and 280ºC in a non-oxidizing environment. The idea of the process
includes all main provisions of the torrefaction process in case when raw material
is green woody biomass (see the chapter “Torrefaction of the wood”). Torrefied
biomass get advantageous properties (such as low moisture, lower emission of
smoke and increased heating values) that improve fuel quality.
Research was conducted to investigate the characteristics of torrefied briquettes
and the relationship between these characteristics and the torrefaction process
parameters. The tests were carried out in a torrefaction unit, which consisted of a
biomass combustion chamber for heat generation and an overhead torrefaction
chamber, Figure 28 [Felix F.F., 2005a].
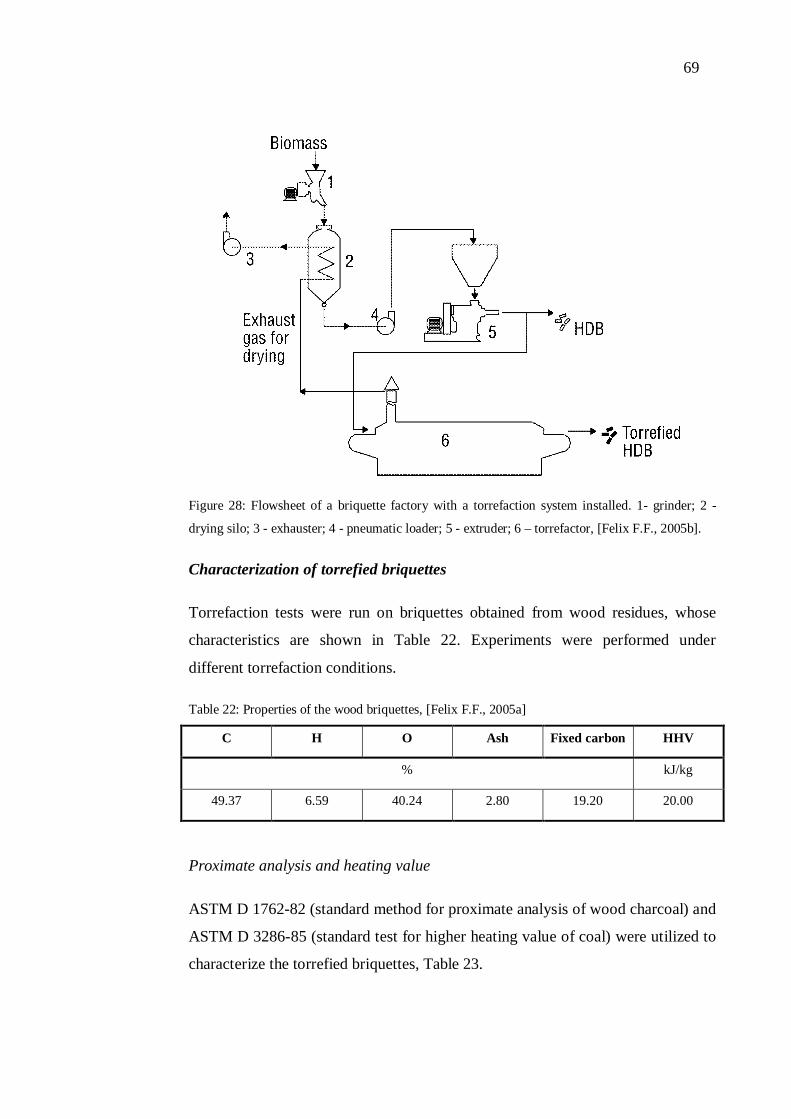
69
Figure 28: Flowsheet of a briquette factory with a torrefaction system installed. 1- grinder; 2 -
drying silo; 3 - exhauster; 4 - pneumatic loader; 5 - extruder; 6 – torrefactor, [Felix F.F., 2005b].
Characterization of torrefied briquettes
Torrefaction tests were run on briquettes obtained from wood residues, whose
characteristics are shown in Table 22. Experiments were performed under
different torrefaction conditions.
Table 22: Properties of the wood briquettes, [Felix F.F., 2005a]
C H O Ash Fixed carbon HHV
% kJ/kg
49.37 6.59 40.24 2.80 19.20 20.00
Proximate analysis and heating value
ASTM D 1762-82 (standard method for proximate analysis of wood charcoal) and
ASTM D 3286-85 (standard test for higher heating value of coal) were utilized to
characterize the torrefied briquettes, Table 23.
70
Table 23: Proximate analysis and higher heating value of torrefied wood briquettes, [Felix F.F.,
2005a]
Temperature Time Volatile
content Fixed carbon Ash HHV
ºC hour % kJ/kg
0.5 75.2 18.2 6.6 20.456
1 74.6 19.0 6.4 20.989 220
1.5 73.6 19.8 6.6 21.065
0.5 65.2 27.0 7.8 21.209
1 65.0 27.2 7.8 22.061 250
1.5 60.0 32.1 7.9 22.674
0.5 55.7 34.6 9.7 22.772
1 52.1 38.2 9.7 22.981 270
1.5 41.0 49.2 9.8 23.066
From the results of Table 23 it also can be concluded (as in case of green woody
biomass torrefaction) that the temperature has more effect on the briquettes than
the residence time.
Since combustion and torrefaction processes take place in separate chambers, it is
relatively easy to control biomass torrefaction temperature and residence time
inside the torrefaction chamber. This allows a high degree of standardization in
production of torrefied briquettes for different energy applications.
Elemental analysis
Data from elemental analysis was obtained from a CH analyzer (D 3178-84:
standard test method for carbon and hydrogen). Table 24 shows a summary of
elemental analysis results for briquettes torrefied under different conditions. It can
be observed that as torrefaction parameters increase the elemental carbon fraction
rises too, suggesting a decrease in the molecular H/C and O/C ratios. Thus, the
degree of aromatization and oxygenation of briquettes decreases proportionally
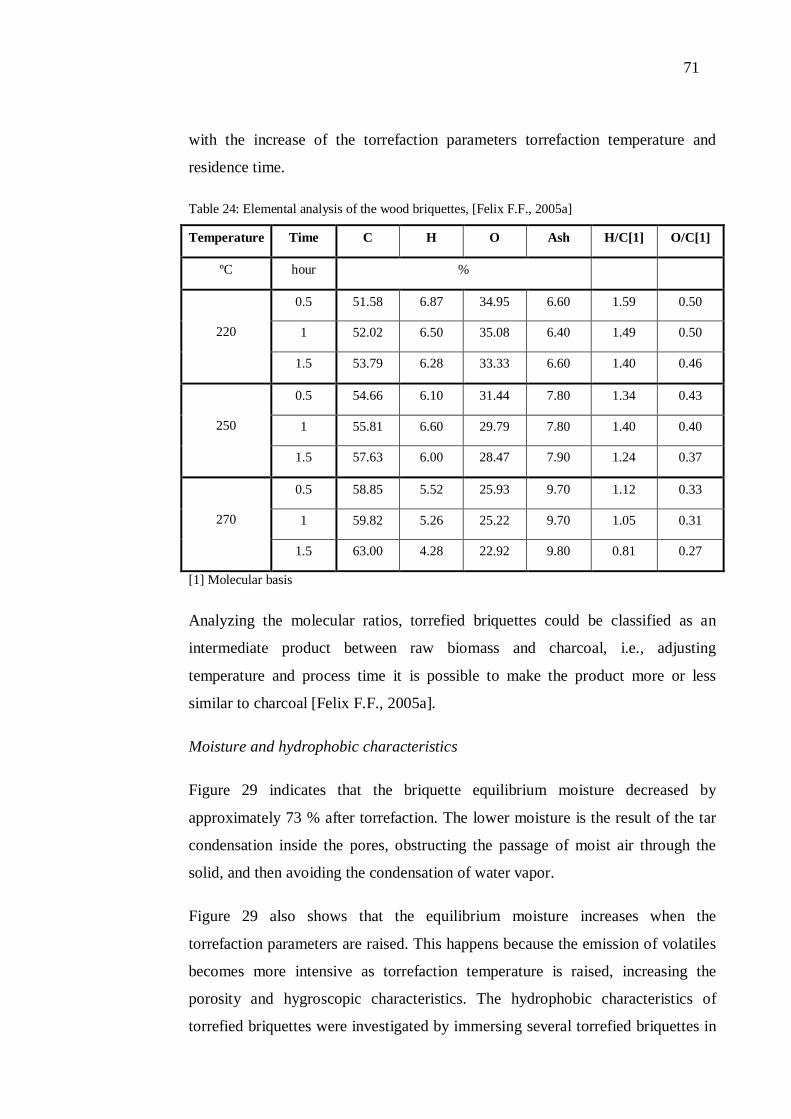
71
with the increase of the torrefaction parameters torrefaction temperature and
residence time.
Table 24: Elemental analysis of the wood briquettes, [Felix F.F., 2005a]
Temperature Time C H O Ash H/C[1] O/C[1]
ºC hour %
0.5 51.58 6.87 34.95 6.60 1.59 0.50
1 52.02 6.50 35.08 6.40 1.49 0.50 220
1.5 53.79 6.28 33.33 6.60 1.40 0.46
0.5 54.66 6.10 31.44 7.80 1.34 0.43
1 55.81 6.60 29.79 7.80 1.40 0.40 250
1.5 57.63 6.00 28.47 7.90 1.24 0.37
0.5 58.85 5.52 25.93 9.70 1.12 0.33
1 59.82 5.26 25.22 9.70 1.05 0.31 270
1.5 63.00 4.28 22.92 9.80 0.81 0.27
[1] Molecular basis
Analyzing the molecular ratios, torrefied briquettes could be classified as an
intermediate product between raw biomass and charcoal, i.e., adjusting
temperature and process time it is possible to make the product more or less
similar to charcoal [Felix F.F., 2005a].
Moisture and hydrophobic characteristics
Figure 29 indicates that the briquette equilibrium moisture decreased by
approximately 73 % after torrefaction. The lower moisture is the result of the tar
condensation inside the pores, obstructing the passage of moist air through the
solid, and then avoiding the condensation of water vapor.
Figure 29 also shows that the equilibrium moisture increases when the
torrefaction parameters are raised. This happens because the emission of volatiles
becomes more intensive as torrefaction temperature is raised, increasing the
porosity and hygroscopic characteristics. The hydrophobic characteristics of
torrefied briquettes were investigated by immersing several torrefied briquettes in
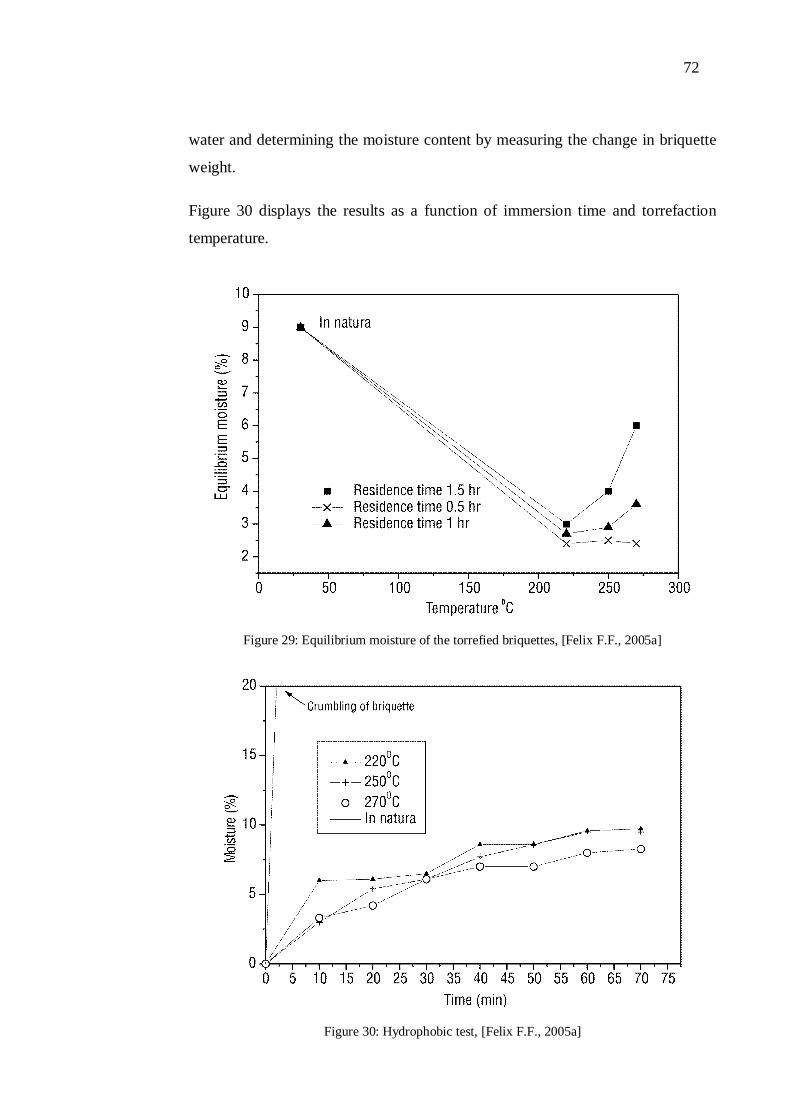
72
water and determining the moisture content by measuring the change in briquette
weight.
Figure 30 displays the results as a function of immersion time and torrefaction
temperature.
Figure 29: Equilibrium moisture of the torrefied briquettes, [Felix F.F., 2005a]
Figure 30: Hydrophobic test, [Felix F.F., 2005a]
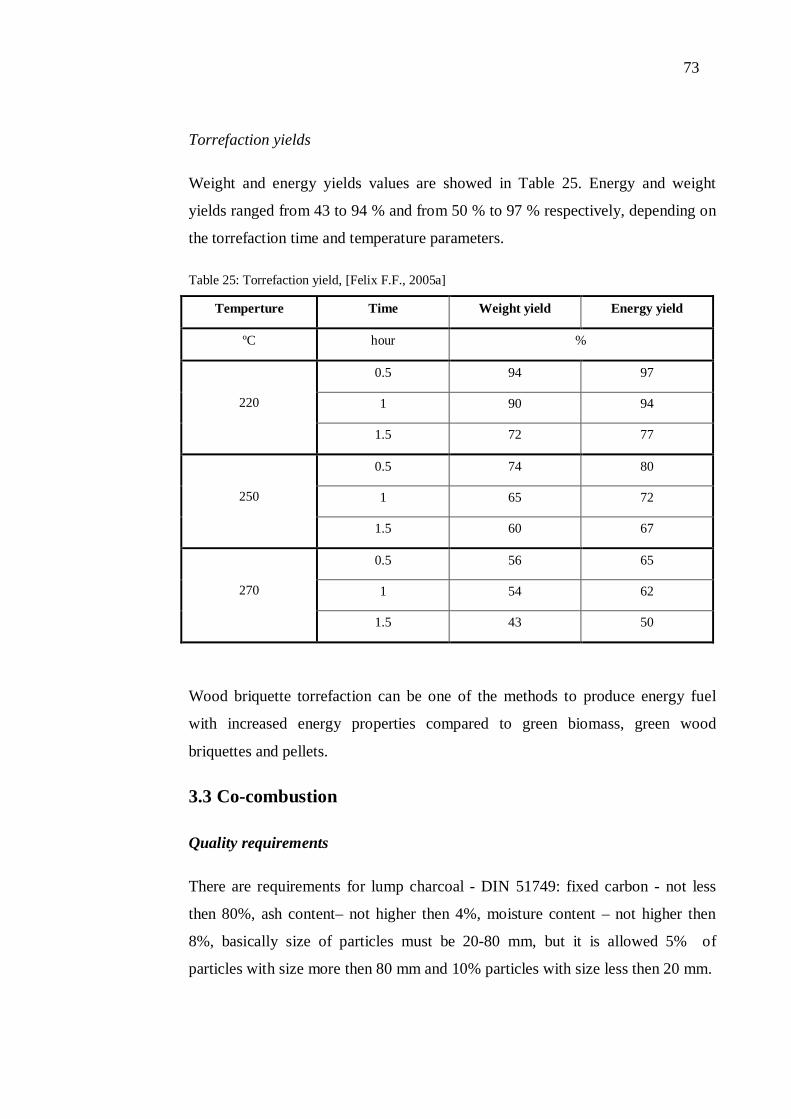
73
Torrefaction yields
Weight and energy yields values are showed in Table 25. Energy and weight
yields ranged from 43 to 94 % and from 50 % to 97 % respectively, depending on
the torrefaction time and temperature parameters.
Table 25: Torrefaction yield, [Felix F.F., 2005a]
Temperture Time Weight yield Energy yield
ºC hour %
0.5 94 97
1 90 94 220
1.5 72 77
0.5 74 80
1 65 72 250
1.5 60 67
0.5 56 65
1 54 62 270
1.5 43 50
Wood briquette torrefaction can be one of the methods to produce energy fuel
with increased energy properties compared to green biomass, green wood
briquettes and pellets.
3.3 Co-combustion
Quality requirements
There are requirements for lump charcoal - DIN 51749: fixed carbon - not less
then 80%, ash content– not higher then 4%, moisture content – not higher then
8%, basically size of particles must be 20-80 mm, but it is allowed 5% of
particles with size more then 80 mm and 10% particles with size less then 20 mm.
74
The quality of charcoal produced in developing countries for domestic
consumption, is controlled by very weak, as a means of control is largely absent.
Since the main amount of charcoal is used as domestic fuel, then it is required to
sufficiently high calorific value. Strength indicator is also essential, since
produced charcoal must to withstand transportation from the place of production
to local consumers (up to 200 km) without the formation of a large number of fine
particles.
In the case of charcoal as an energy fuel, more stringent requirements should be
presented. The charcoal should have primarily a minimum ash content, high fixed
carbon content, high energy density, high calorific value and satisfactory strength,
allowing to transport it with minimal losses. It should be noted that charcoal
produced from a mixture of tropical species, may have ash content up to 10%, and
practically unsuitable for industrial use even if its strength is satisfactory.
Charcoal produced from eucalyptus wood (usually grown on plantations) and
from coconut shells have a relatively high quality. It is a solid charcoal with a
relatively low (4%) ash content.
The content and composition of the ash in charcoal is variable. It depends not only
on the temperature and the method of pyrolysis but also on wood species, the ratio
of wood and bark, growing place of wood, cutting time and transportation method
to the plant. The ash content, in hardwood, especially in aspen is higher then in
conifers. Moreover, different parts of the tree have different ash content, as shown
in table 26, 27.
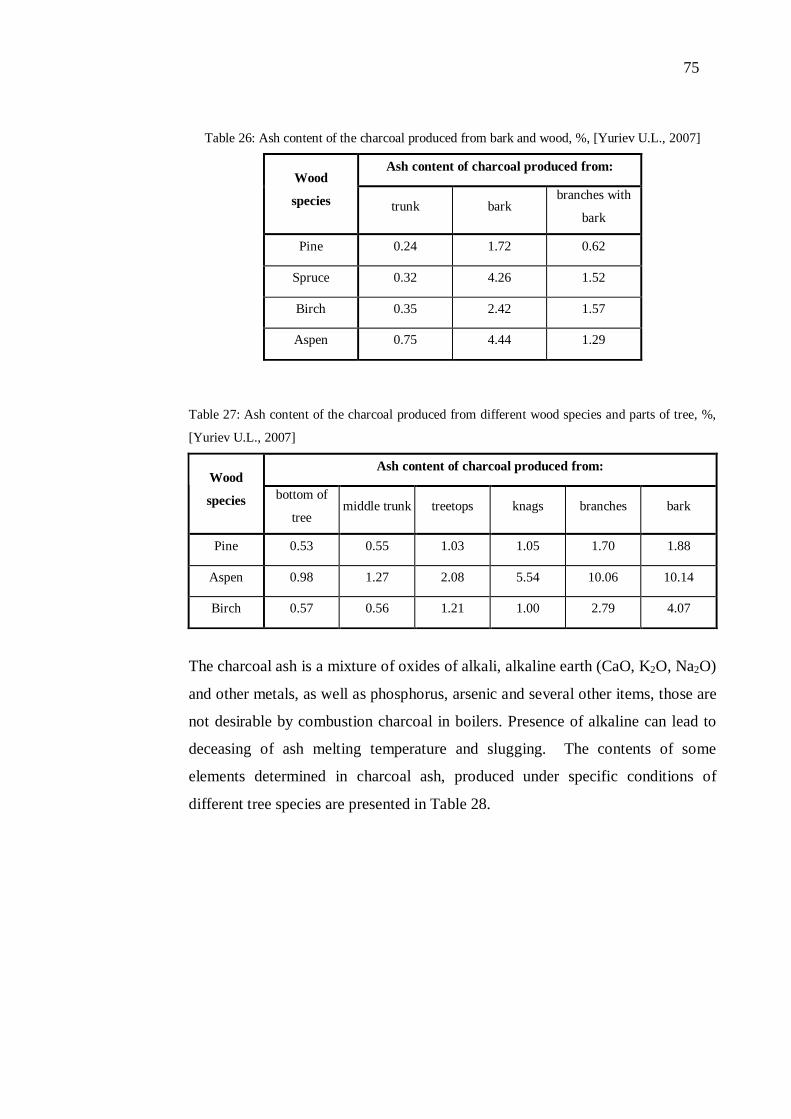
75
Table 26: Ash content of the charcoal produced from bark and wood, %, [Yuriev U.L., 2007]
Ash content of charcoal produced from: Wood
species trunk bark branches with
bark
Pine 0.24 1.72 0.62
Spruce 0.32 4.26 1.52
Birch 0.35 2.42 1.57
Aspen 0.75 4.44 1.29
Table 27: Ash content of the charcoal produced from different wood species and parts of tree, %,
[Yuriev U.L., 2007]
Ash content of charcoal produced from: Wood
species bottom of
tree middle trunk treetops knags branches bark
Pine 0.53 0.55 1.03 1.05 1.70 1.88
Aspen 0.98 1.27 2.08 5.54 10.06 10.14
Birch 0.57 0.56 1.21 1.00 2.79 4.07
The charcoal ash is a mixture of oxides of alkali, alkaline earth (CaO, K2O, Na2O)
and other metals, as well as phosphorus, arsenic and several other items, those are
not desirable by combustion charcoal in boilers. Presence of alkaline can lead to
deceasing of ash melting temperature and slugging. The contents of some
elements determined in charcoal ash, produced under specific conditions of
different tree species are presented in Table 28.

76
Table 28: The content of some elements in charcoal ash, %, [Yuriev U.L., 2007]
Elemental content of total ash content A
sh, %
Si Fe Al Mg Mn P Ti As
Birch
1.94 1.62 0.36 0.28 36.0 6.22 3.23 1.69 0.35 0.036 0.0007
2.78 4.37 1.24 0.56 31.5 4.71 1.36 0.84 1.14 0.03 0.0007
3.20 4.12 0.51 3.31 17.4 3.32 1.31 1.14 0.12 0.01 0.0007
1.42 4.26 0.56 1.27 36.9 5.97 1.87 1.56 0.10 0.03 0.0012
1.30 1.08 0.41 0.68 29.1 4.33 3.63 1.43 0.07 0.049 0.0002
Beech
2.42 2.73 0.28 0.17 30.2 5.25 1.37 1.53 0.048 0.017 0.0008
1.47 1.88 0.13 0.05 33.2 5.10 2.22 2.58 0.034 0.031 0.0018
Pine
0.75 11.5 1.29 2.03 26.8 2.29 2.20 0.96 0.16 0.046 0.0002
The content of such elements like phosphor and sulfur is very low that gives to
charcoal large emission benefits compared to coal.
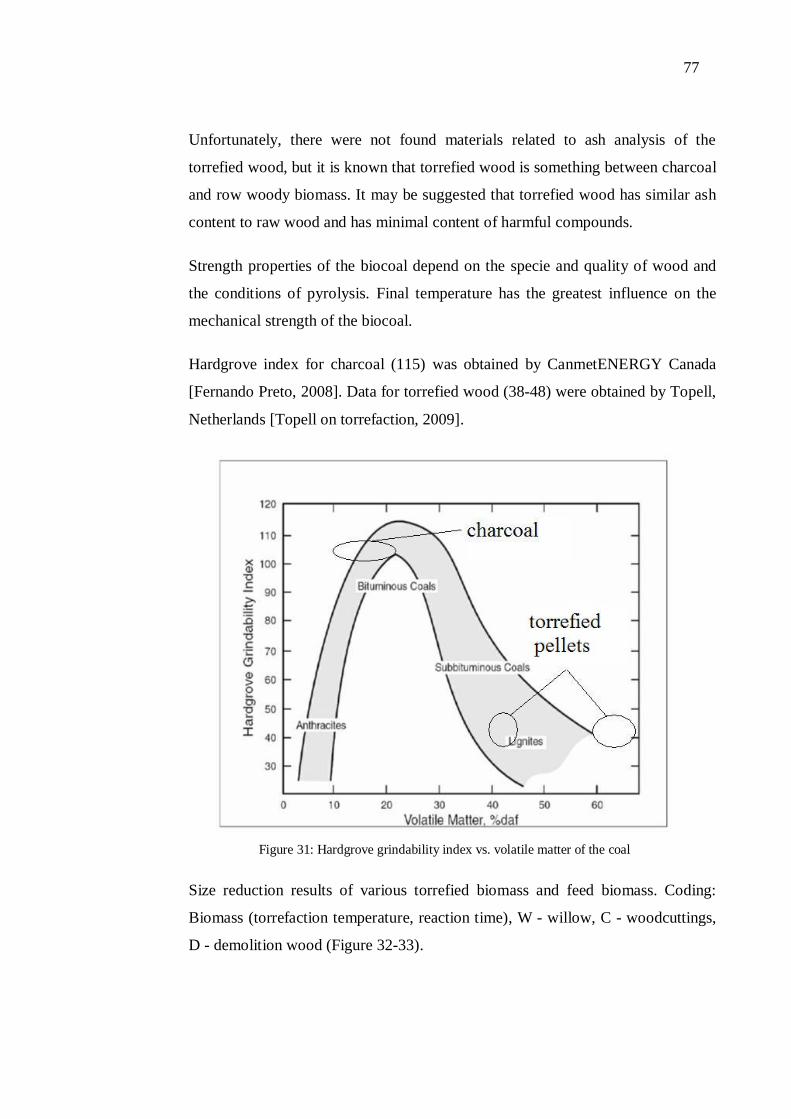
77
Unfortunately, there were not found materials related to ash analysis of the
torrefied wood, but it is known that torrefied wood is something between charcoal
and row woody biomass. It may be suggested that torrefied wood has similar ash
content to raw wood and has minimal content of harmful compounds.
Strength properties of the biocoal depend on the specie and quality of wood and
the conditions of pyrolysis. Final temperature has the greatest influence on the
mechanical strength of the biocoal.
Hardgrove index for charcoal (115) was obtained by CanmetENERGY Canada
[Fernando Preto, 2008]. Data for torrefied wood (38-48) were obtained by Topell,
Netherlands [Topell on torrefaction, 2009].
Figure 31: Hardgrove grindability index vs. volatile matter of the coal
Size reduction results of various torrefied biomass and feed biomass. Coding:
Biomass (torrefaction temperature, reaction time), W - willow, C - woodcuttings,
D - demolition wood (Figure 32-33).
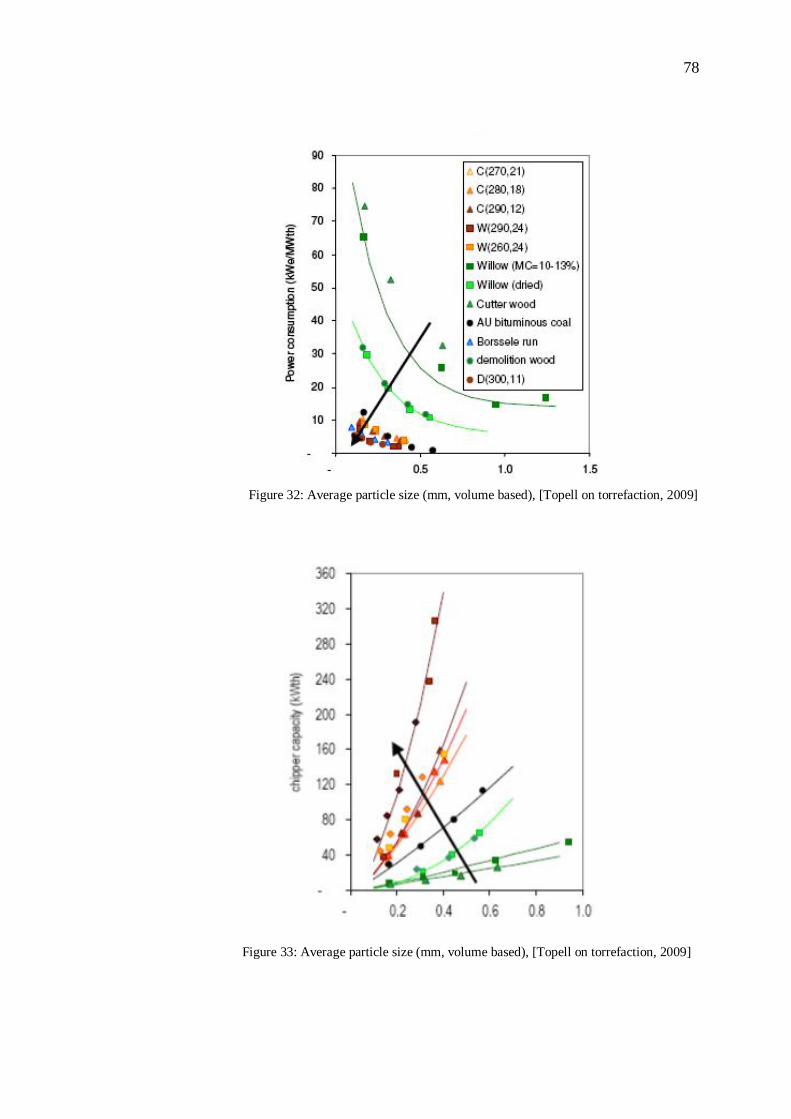
78
Figure 32: Average particle size (mm, volume based), [Topell on torrefaction, 2009]
Figure 33: Average particle size (mm, volume based), [Topell on torrefaction, 2009]
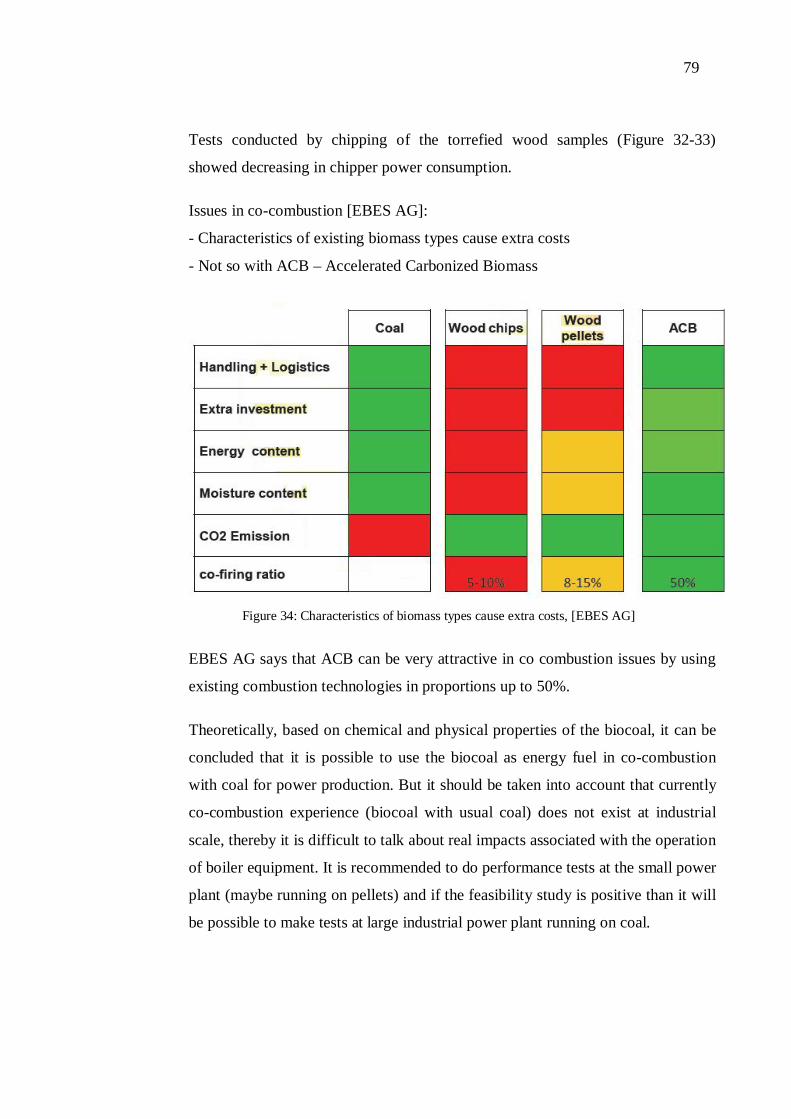
79
Tests conducted by chipping of the torrefied wood samples (Figure 32-33)
showed decreasing in chipper power consumption.
Issues in co-combustion [EBES AG]:
- Characteristics of existing biomass types cause extra costs
- Not so with ACB – Accelerated Carbonized Biomass
Figure 34: Characteristics of biomass types cause extra costs, [EBES AG]
EBES AG says that ACB can be very attractive in co combustion issues by using
existing combustion technologies in proportions up to 50%.
Theoretically, based on chemical and physical properties of the biocoal, it can be
concluded that it is possible to use the biocoal as energy fuel in co-combustion
with coal for power production. But it should be taken into account that currently
co-combustion experience (biocoal with usual coal) does not exist at industrial
scale, thereby it is difficult to talk about real impacts associated with the operation
of boiler equipment. It is recommended to do performance tests at the small power
plant (maybe running on pellets) and if the feasibility study is positive than it will
be possible to make tests at large industrial power plant running on coal.
80
4 TECHNICAL AND ECONOMIC ANALYSIS OF THE
BIOCOAL PRODUCTION
4.1 Charcoal production in Russia Federation
There were examined the charcoal production plant located in Russia Federation
and estimated the operation cost of one tonne of charcoal (Table 29). The plant
has the following operation parameters:
- Production capacity ~ 1000 tonne of charcoal per year;
- Raw material – in form of logs in length 2-6 m (hardwood species);
further, cut raw material is loaded into the installation; Moisture content
Wmax = 55%, Waverag = 35%;
- Operation of the main production – continuous, 3 shifts of 8 hour;
- The use of primary fuel (to provide heat demand) – 0.0041% of the annual
plant productivity.
The constructive solutions that provide savings of heat allow to ensure work for
their own heat practically without burning additional fuel and also to use heat
surpluses for the production of thermal energy. By lowering the temperature of
flue gases it is possible to generate heat in the form of steam or hot water by
installing of waste heat recovery boiler. Parameters of the recovery boiler:
- Production capacity – 0,4 MW;
- Steam production capacity – summer – 650 kg/h, winter – 500 kg/h,
pressure – 0,06MPa.
Properties of the produced charcoal:
- Calorific value – 32 MJ/kg;
- Moisture content < 6%;
- Ash content < 2,5 %;
- Fixed carbon > 90%.
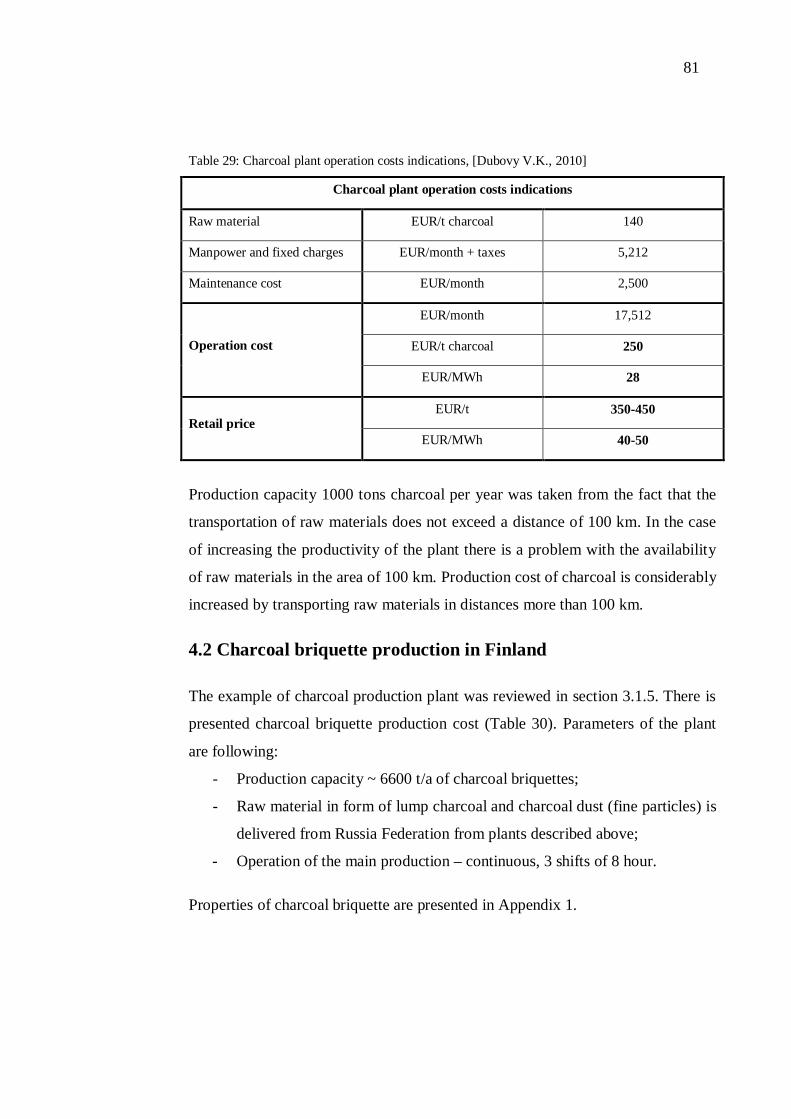
81
Table 29: Charcoal plant operation costs indications, [Dubovy V.K., 2010]
Charcoal plant operation costs indications
Raw material EUR/t charcoal 140
Manpower and fixed charges EUR/month + taxes 5,212
Maintenance cost EUR/month 2,500
EUR/month 17,512
EUR/t charcoal 250 Operation cost
EUR/MWh 28
EUR/t 350-450 Retail price
EUR/MWh 40-50
Production capacity 1000 tons charcoal per year was taken from the fact that the
transportation of raw materials does not exceed a distance of 100 km. In the case
of increasing the productivity of the plant there is a problem with the availability
of raw materials in the area of 100 km. Production cost of charcoal is considerably
increased by transporting raw materials in distances more than 100 km.
4.2 Charcoal briquette production in Finland
The example of charcoal production plant was reviewed in section 3.1.5. There is
presented charcoal briquette production cost (Table 30). Parameters of the plant
are following:
- Production capacity ~ 6600 t/a of charcoal briquettes;
- Raw material in form of lump charcoal and charcoal dust (fine particles) is
delivered from Russia Federation from plants described above;
- Operation of the main production – continuous, 3 shifts of 8 hour.
Properties of charcoal briquette are presented in Appendix 1.
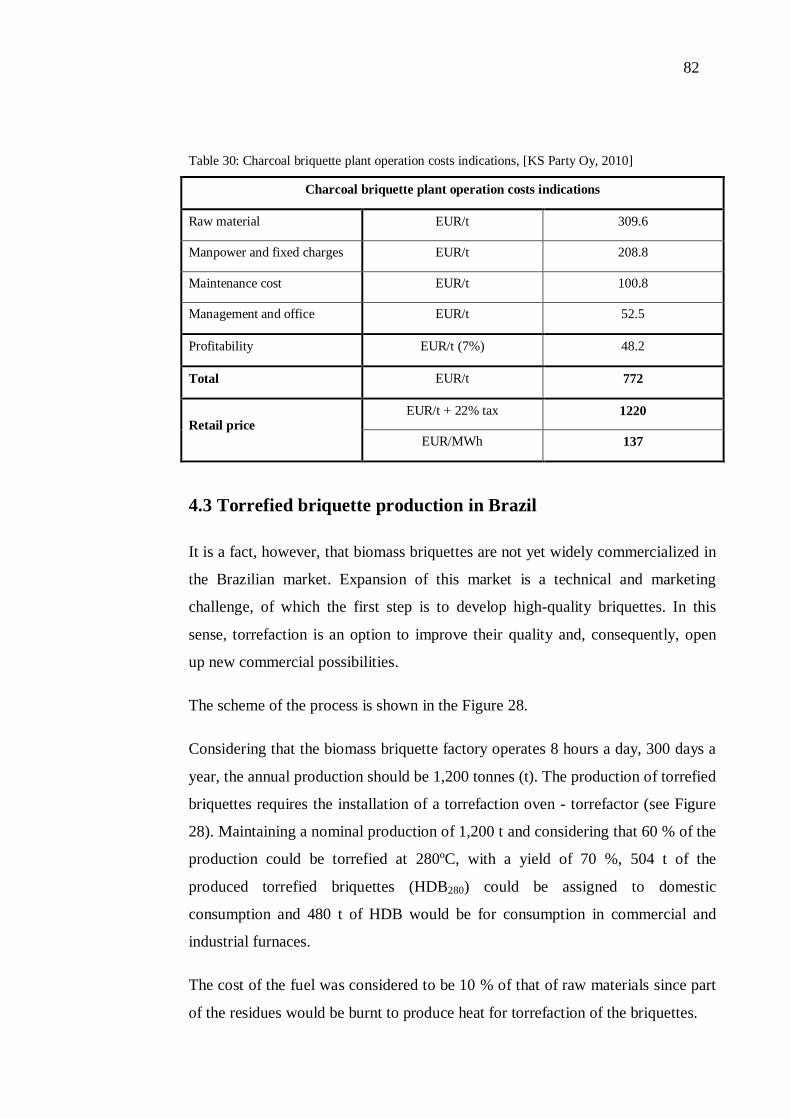
82
Table 30: Charcoal briquette plant operation costs indications, [KS Party Oy, 2010]
Charcoal briquette plant operation costs indications
Raw material EUR/t 309.6
Manpower and fixed charges EUR/t 208.8
Maintenance cost EUR/t 100.8
Management and office EUR/t 52.5
Profitability EUR/t (7%) 48.2
Total EUR/t 772
EUR/t + 22% tax 1220 Retail price
EUR/MWh 137
4.3 Torrefied briquette production in Brazil
It is a fact, however, that biomass briquettes are not yet widely commercialized in
the Brazilian market. Expansion of this market is a technical and marketing
challenge, of which the first step is to develop high-quality briquettes. In this
sense, torrefaction is an option to improve their quality and, consequently, open
up new commercial possibilities.
The scheme of the process is shown in the Figure 28.
Considering that the biomass briquette factory operates 8 hours a day, 300 days a
year, the annual production should be 1,200 tonnes (t). The production of torrefied
briquettes requires the installation of a torrefaction oven - torrefactor (see Figure
28). Maintaining a nominal production of 1,200 t and considering that 60 % of the
production could be torrefied at 280ºC, with a yield of 70 %, 504 t of the
produced torrefied briquettes (HDB280) could be assigned to domestic
consumption and 480 t of HDB would be for consumption in commercial and
industrial furnaces.
The cost of the fuel was considered to be 10 % of that of raw materials since part
of the residues would be burnt to produce heat for torrefaction of the briquettes.
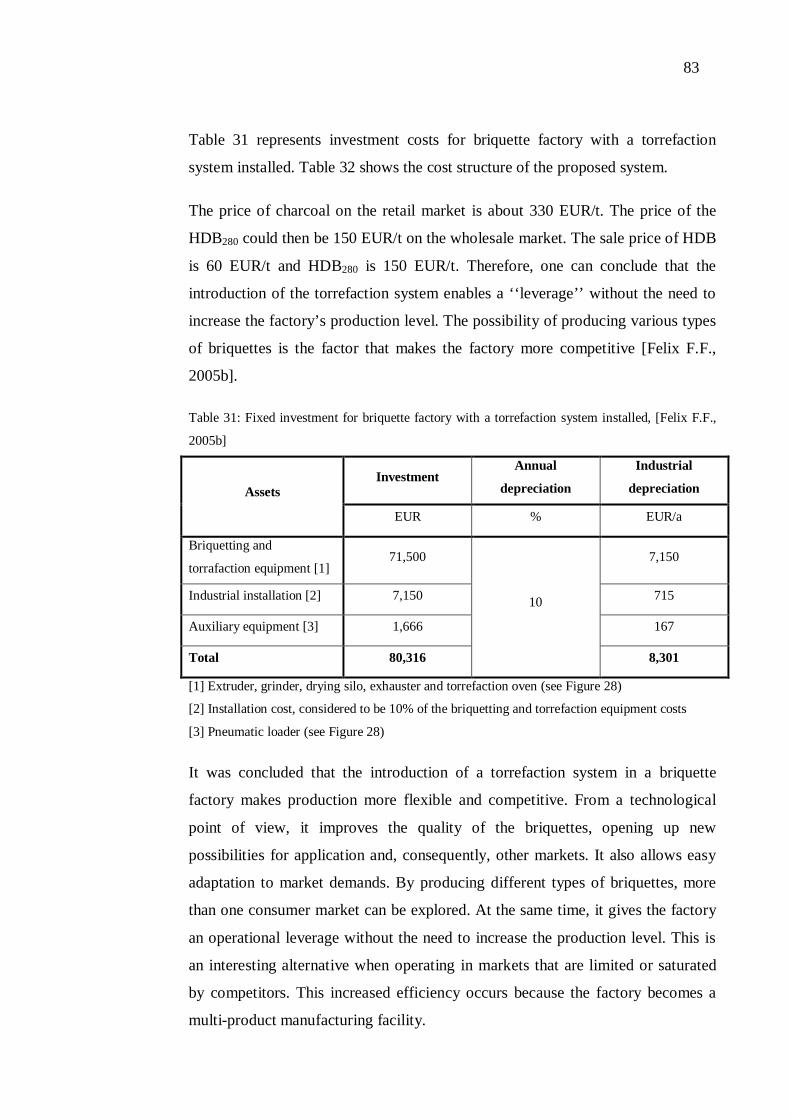
83
Table 31 represents investment costs for briquette factory with a torrefaction
system installed. Table 32 shows the cost structure of the proposed system.
The price of charcoal on the retail market is about 330 EUR/t. The price of the
HDB280 could then be 150 EUR/t on the wholesale market. The sale price of HDB
is 60 EUR/t and HDB280 is 150 EUR/t. Therefore, one can conclude that the
introduction of the torrefaction system enables a ‘‘leverage’’ without the need to
increase the factory’s production level. The possibility of producing various types
of briquettes is the factor that makes the factory more competitive [Felix F.F.,
2005b].
Table 31: Fixed investment for briquette factory with a torrefaction system installed, [Felix F.F.,
2005b]
Investment Annual
depreciation
Industrial
depreciation Assets
EUR % EUR/a
Briquetting and
torrafaction equipment [1] 71,500 7,150
Industrial installation [2] 7,150 715
Auxiliary equipment [3] 1,666 167
Total 80,316
10
8,301
[1] Extruder, grinder, drying silo, exhauster and torrefaction oven (see Figure 28)
[2] Installation cost, considered to be 10% of the briquetting and torrefaction equipment costs
[3] Pneumatic loader (see Figure 28)
It was concluded that the introduction of a torrefaction system in a briquette
factory makes production more flexible and competitive. From a technological
point of view, it improves the quality of the briquettes, opening up new
possibilities for application and, consequently, other markets. It also allows easy
adaptation to market demands. By producing different types of briquettes, more
than one consumer market can be explored. At the same time, it gives the factory
an operational leverage without the need to increase the production level. This is
an interesting alternative when operating in markets that are limited or saturated
by competitors. This increased efficiency occurs because the factory becomes a
multi-product manufacturing facility.
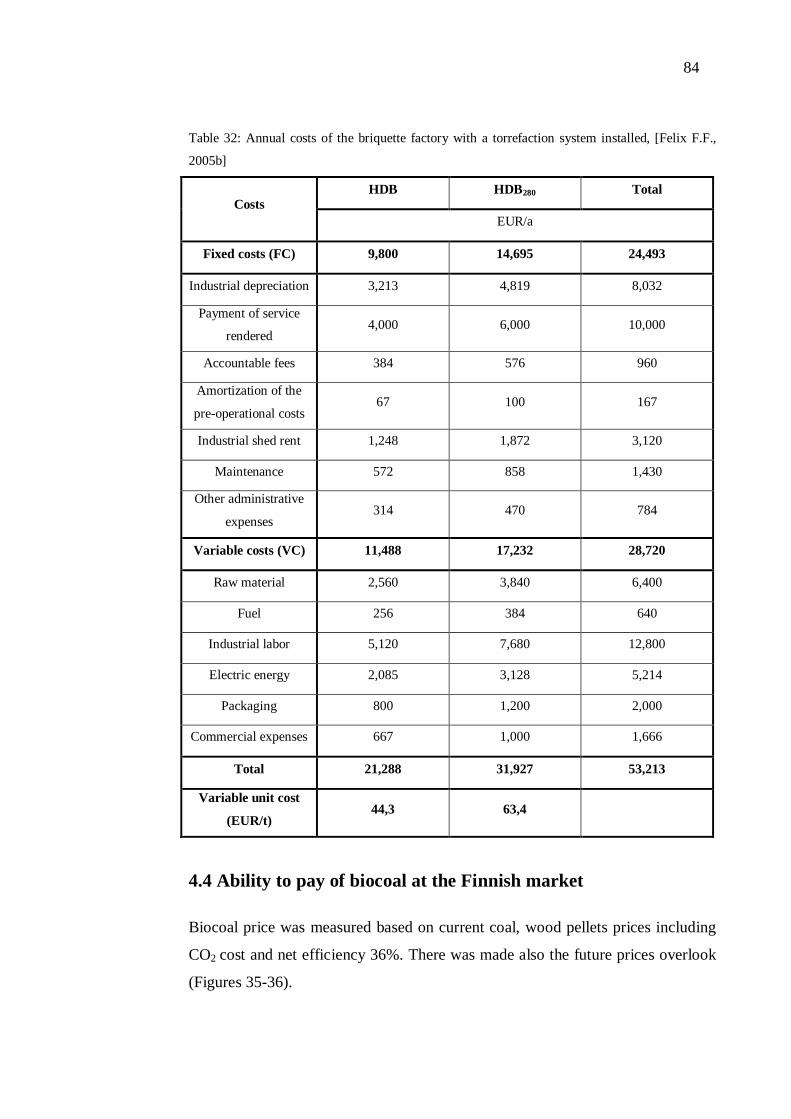
84
Table 32: Annual costs of the briquette factory with a torrefaction system installed, [Felix F.F.,
2005b]
HDB HDB280 Total Costs
EUR/a
Fixed costs (FC) 9,800 14,695 24,493
Industrial depreciation 3,213 4,819 8,032
Payment of service
rendered 4,000 6,000 10,000
Accountable fees 384 576 960
Amortization of the
pre-operational costs 67 100 167
Industrial shed rent 1,248 1,872 3,120
Maintenance 572 858 1,430
Other administrative
expenses 314 470 784
Variable costs (VC) 11,488 17,232 28,720
Raw material 2,560 3,840 6,400
Fuel 256 384 640
Industrial labor 5,120 7,680 12,800
Electric energy 2,085 3,128 5,214
Packaging 800 1,200 2,000
Commercial expenses 667 1,000 1,666
Total 21,288 31,927 53,213
Variable unit cost
(EUR/t) 44,3 63,4
4.4 Ability to pay of biocoal at the Finnish market
Biocoal price was measured based on current coal, wood pellets prices including
CO2 cost and net efficiency 36%. There was made also the future prices overlook
(Figures 35-36).
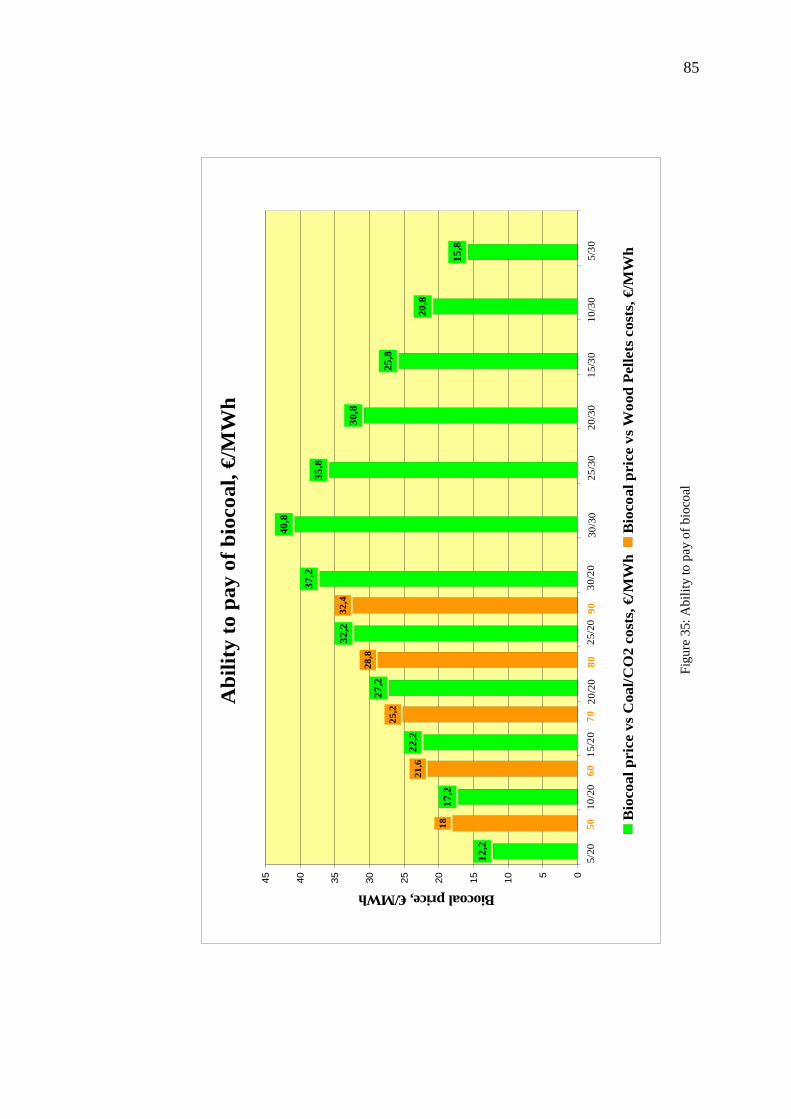
85
Abi
lity
to p
ay o
f bio
coal
, €/M
Wh
12,2
17,2
22,2
27,2
32,2
37,2
40,8
35,8
30,8
25,8
20,8
15,8
18
21,6
25,2
28,8
32,4
051015202530354045
Biocoal price, €/MWh
Bio
coal
pri
ce v
s C
oal/C
O2
cost
s, €
/MW
hB
ioco
al p
rice
vs
Woo
d Pe
llets
cos
ts, €
/MW
h
5/20
15/3
020
/30
25/3
030
/30
30/2
025
/20
20/2
015
/20
10/2
05/
3010
/30
5090
8070
60
Figu
re 3
5: A
bilit
y to
pay
of b
ioco
al
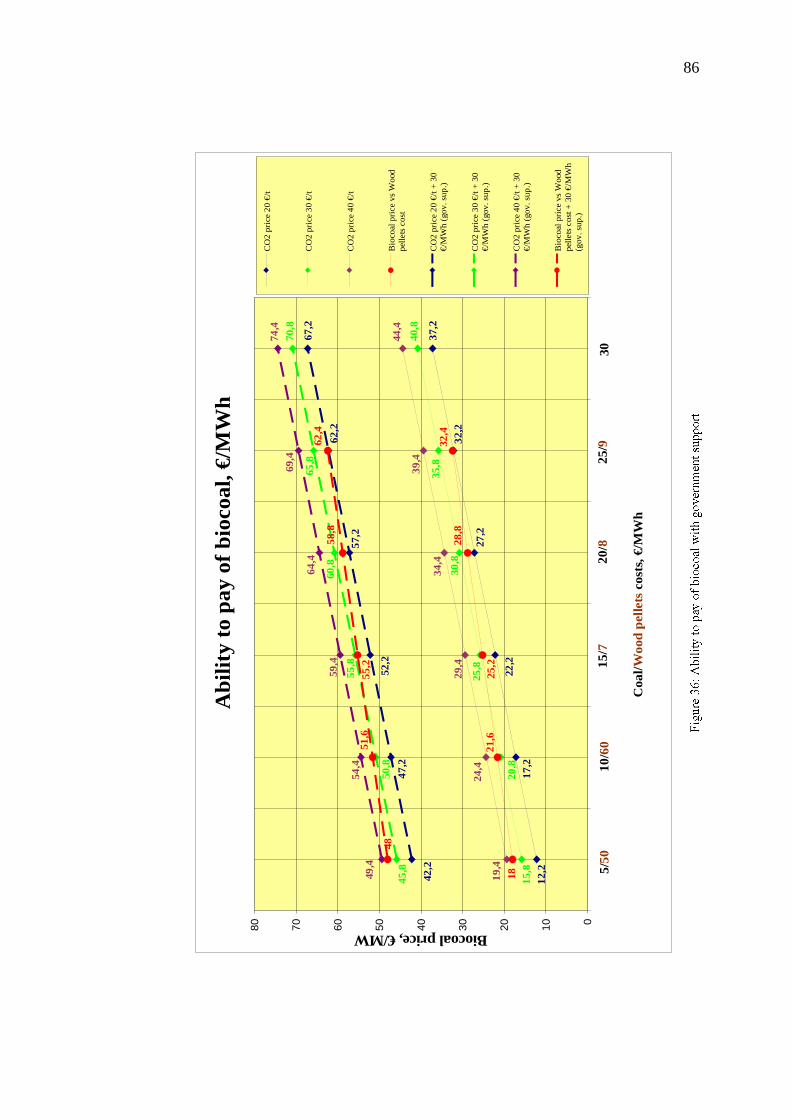
86
Abi
lity
to p
ay o
f bio
coal
, €/M
Wh
37,2
67,2
32,2
27,2
12,2
17,2
22,2
40,8
35,8
20,8
15,8
25,8
30,8
44,4
39,4
34,4
29,4
24,4
19,4
32,4
21,6
18
25,2
28,8
62,2
57,2
52,2
47,2
42,2
55,8
50,8
45,8
60,8
65,8
70,8
74,4
69,4
64,4
59,4
49,4
54,4
55,2
51,6
62,4
58,8
48
01020304050607080
Coa
l/Woo
d pe
llets
cos
ts, €
/MW
h
Biocoal price, €/MW
CO
2 pr
ice
20 €
/t
CO
2 pr
ice
30 €
/t
CO
2 pr
ice
40 €
/t
Bio
coal
pric
e vs
Woo
dpe
llets
cos
t
CO
2 pr
ice
20 €
/t +
30€/
MW
h (g
ov. s
up.)
CO
2 pr
ice
30 €
/t +
30€/
MW
h (g
ov. s
up.)
CO
2 pr
ice
40 €
/t +
30€/
MW
h (g
ov. s
up.)
Bio
coal
pric
e vs
Woo
dpe
llets
cos
t + 3
0 €/
MW
h(g
ov. s
up.)
5/50
3025
/9 020
/8 015
/7 010
/60
87
Figure 36 presents roughly estimated biocoal prices including government
support. By electricity production using biomass (replacement of coal)
government supports in the amount of 30 EUR/MWh for bioelectricity [Esa
Vakkilainen, 2010].
4.5 Preliminary analysis of the investment and operation costs of
the biocoal (TOP pellet) production plant located in Finland
Many companies, mainly from the wood industry, which have appropriate raw
material available for the production of biocoal (TOP pellets) are already active in
this field or are thinking of entering this market. To start a biocoal production
plant it is essential to calculate their production costs in advance in order to
consider and investigate specific framework conditions of the producer for an
economic operation.
Estimation of biocoal plant investment cost, investigations and calculations of the
production costs of biocoal under consideration of relevant parameters and
different production patterns have been performed in this section. The calculations
are based on data on planned TOP pellet production plant [Topell on torrefaction,
2009], TOP technology, [Mark J. Prins, 2006] and data on existing wood pellet
production plant (UPM-Kymmene).
TOP pellet plant investment costs
Two cases of investment costs were taken into account. The first case the new
biocoal production plant (Figure 34). The general investment includes investments
for construction, offices, main and auxiliary equipment as well as market
introduction and planning. Investments amounted ~ 12 MEUR. Low general
investment costs can be achieved by using existing infrastructure (Table 33).
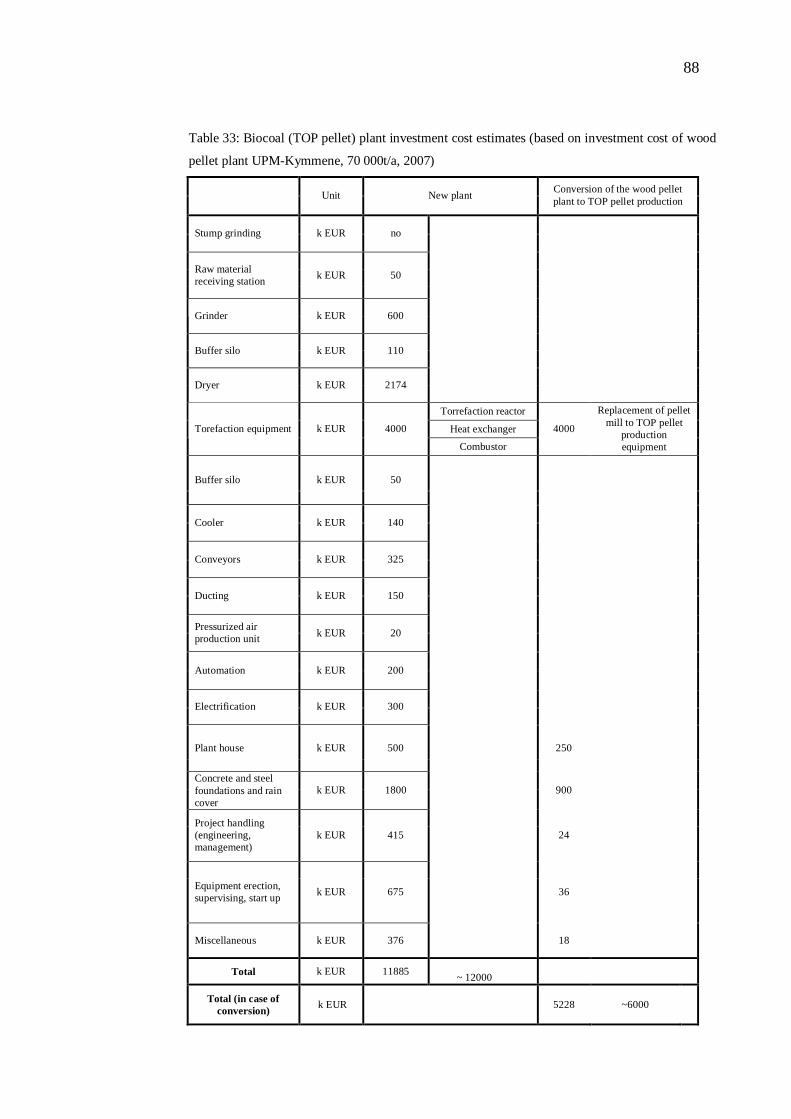
88
Table 33: Biocoal (TOP pellet) plant investment cost estimates (based on investment cost of wood
pellet plant UPM-Kymmene, 70 000t/a, 2007)
Unit New plant Conversion of the wood pellet
plant to TOP pellet production
Stump grinding k EUR no
Raw material receiving station k EUR 50
Grinder k EUR 600
Buffer silo k EUR 110
Dryer k EUR 2174
Torrefaction reactor
Heat exchanger Torefaction equipment k EUR 4000
Combustor
4000
Replacement of pellet mill to TOP pellet
production equipment
Buffer silo k EUR 50
Cooler k EUR 140
Conveyors k EUR 325
Ducting k EUR 150
Pressurized air production unit k EUR 20
Automation k EUR 200
Electrification k EUR 300
Plant house k EUR 500 250
Concrete and steel foundations and rain cover
k EUR 1800 900
Project handling (engineering, management)
k EUR 415 24
Equipment erection, supervising, start up k EUR 675 36
Miscellaneous k EUR 376
18
Total k EUR 11885 ~ 12000
Total (in case of conversion) k EUR
5228 ~6000
89
Biocoal (TOP pellet) production costs
Two production patterns were examined for estimation of the biocoal production
costs: integrated biocoal production plant and stand alone plant (Figure 37-38).
The following main parameters were taken into account for biocoal production
costs calculations:
The efficiency of conversion wood to biocoal: 60%, 90%;
The raw material costs as well as the water content and the bulk density of
the raw material used; raw material costs (wood) – 20/30/40 EUR/m3 (0,9
MWh/m3 solid);
The price for electricity required for electrical installations;
The maintenance cost;
The heat costs for drying of the raw material;
The heat cost for torrefaction process.
Integrated biocoal production plant (Figure 37)
In case of the integrated plant there was investigated that there is free waste heat
source (with temperature ~ 300°C) from some industrial processes. In addition
there is also needed the heat for drying of the raw material (Figure 37).
As was marked above, one of the main parameters is the efficiency of conversion
which was taken: 60% and 90%. Moreover there was accepted that combustible
gases produced during torrefaction process can be burned in the furnace of boiler
at industrial plant (Figure 37), thereby reduce consumption of primary fuel and in
the result reduce biocoal production cost. Estimated biocoal production costs are
presented in Tables 34-35.
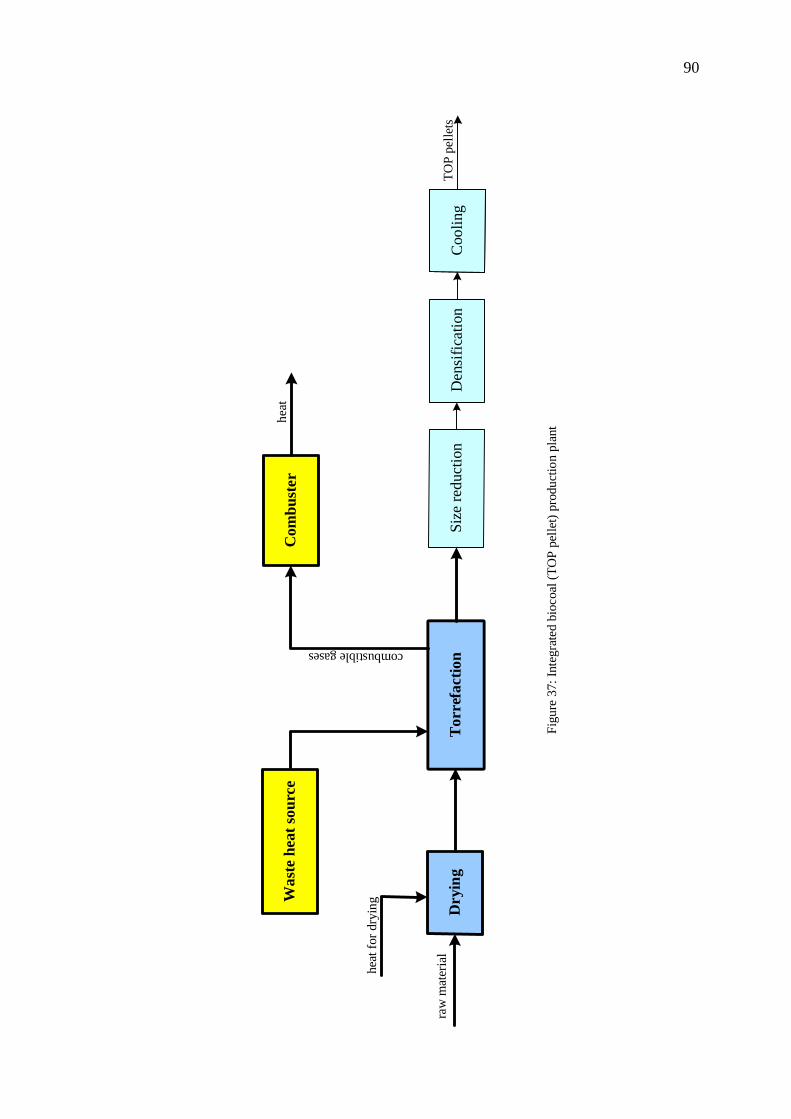
90
Was
te h
eat s
ourc
eC
ombu
ster
Dry
ing
Tor
refa
ctio
nD
ensi
ficat
ion
Size
redu
ctio
nC
oolin
gra
w m
ater
ial
heat
for d
ryin
g
combustible gasesTO
P pe
llets
heat
Figu
re 3
7: In
tegr
ated
bio
coal
(TO
P pe
llet)
prod
uctio
n pl
ant
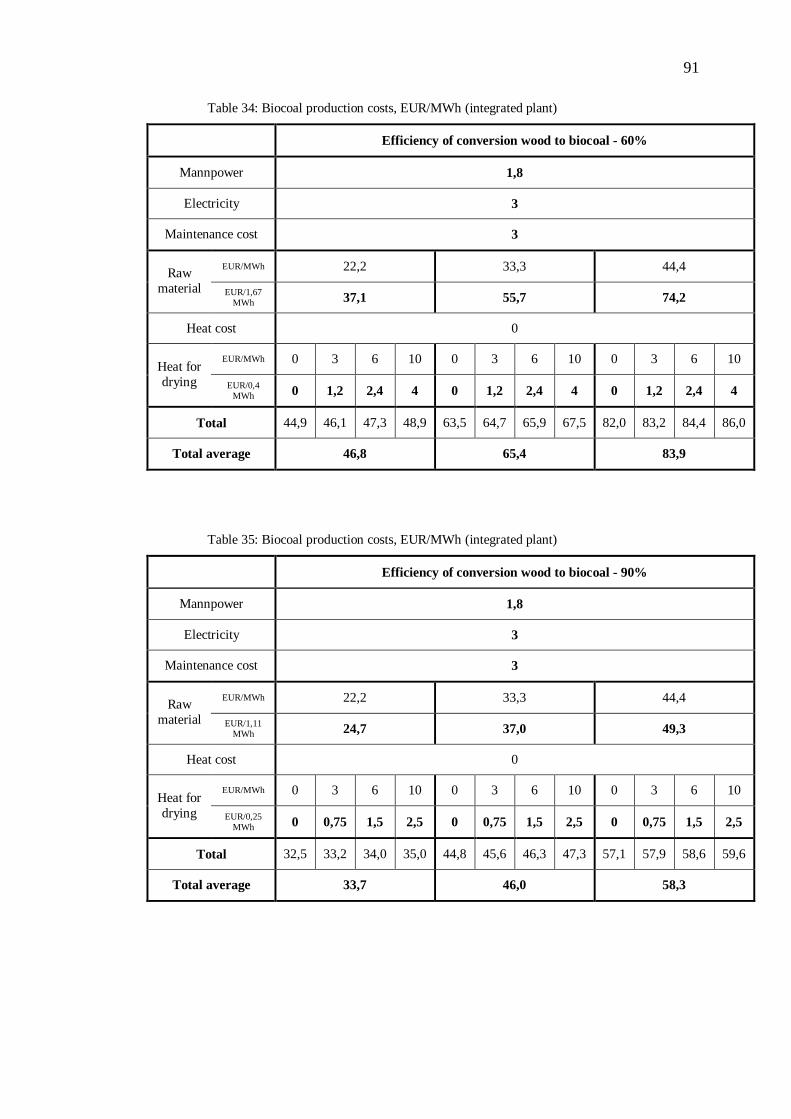
91
Table 34: Biocoal production costs, EUR/MWh (integrated plant)
Efficiency of conversion wood to biocoal - 60%
Mannpower 1,8
Electricity 3
Maintenance cost 3
EUR/MWh 22,2 33,3 44,4 Raw material EUR/1,67
MWh 37,1 55,7 74,2
Heat cost 0
EUR/MWh 0 3 6 10 0 3 6 10 0 3 6 10 Heat for drying EUR/0,4
MWh 0 1,2 2,4 4 0 1,2 2,4 4 0 1,2 2,4 4
Total 44,9 46,1 47,3 48,9 63,5 64,7 65,9 67,5 82,0 83,2 84,4 86,0
Total average 46,8 65,4 83,9
Table 35: Biocoal production costs, EUR/MWh (integrated plant)
Efficiency of conversion wood to biocoal - 90%
Mannpower 1,8
Electricity 3
Maintenance cost 3
EUR/MWh 22,2 33,3 44,4 Raw material EUR/1,11
MWh 24,7 37,0 49,3
Heat cost 0
EUR/MWh 0 3 6 10 0 3 6 10 0 3 6 10 Heat for drying EUR/0,25
MWh 0 0,75 1,5 2,5 0 0,75 1,5 2,5 0 0,75 1,5 2,5
Total 32,5 33,2 34,0 35,0 44,8 45,6 46,3 47,3 57,1 57,9 58,6 59,6
Total average 33,7 46,0 58,3
92
The material mass balance with efficiency of conversion 60%:
1.67 MWh is needed for production of 1 MWh of biocoal (TOP pellet).
- 100% - raw material – 1.67 MWh;
- 90% - biocoal (TOP pellet) – 1MWh;
- 35% - combustible gases – 0.58 MWh;
- 5% - losses – 0.083 MWh.
35% (0.58 MWh) of combustible gases can be burned in the boiler of the
industrial plant, thus reducing the biocoal production cost.
The material mass balance with efficiency of conversion 90%:
1.11 MWh is needed for production of 1 MWh of biocoal (TOP pellet).
- 100% - raw material – 1.11 MWh;
- 90% - biocoal (TOP pellet) – 1MWh;
- 5% - combustible gases – 0.055 MWh;
- 5% - losses – 0.055 MWh.
5% (0,055 MWh) of combustible gases can be burned in the boiler of the
industrial plant, thus also reducing the biocoal production cost.
Stand alone biocoal production plant (Figure 38)
In case of stand alone biocoal production plant there is need in heat for drying of
the material as well as the heat for directly torrefaction process. The scheme of
biocoal production is based on “TOP technology” where combustor and heat
exchanger are installed. The process is provided with heat through combustion of
the primary fuel (woody biomass for example) and combustible gases produced
during torrefaction process (Figure 38). Estimated biocoal costs are presented in
Tables 36-37.
The material mass balances are the same like in case of integrated plant.
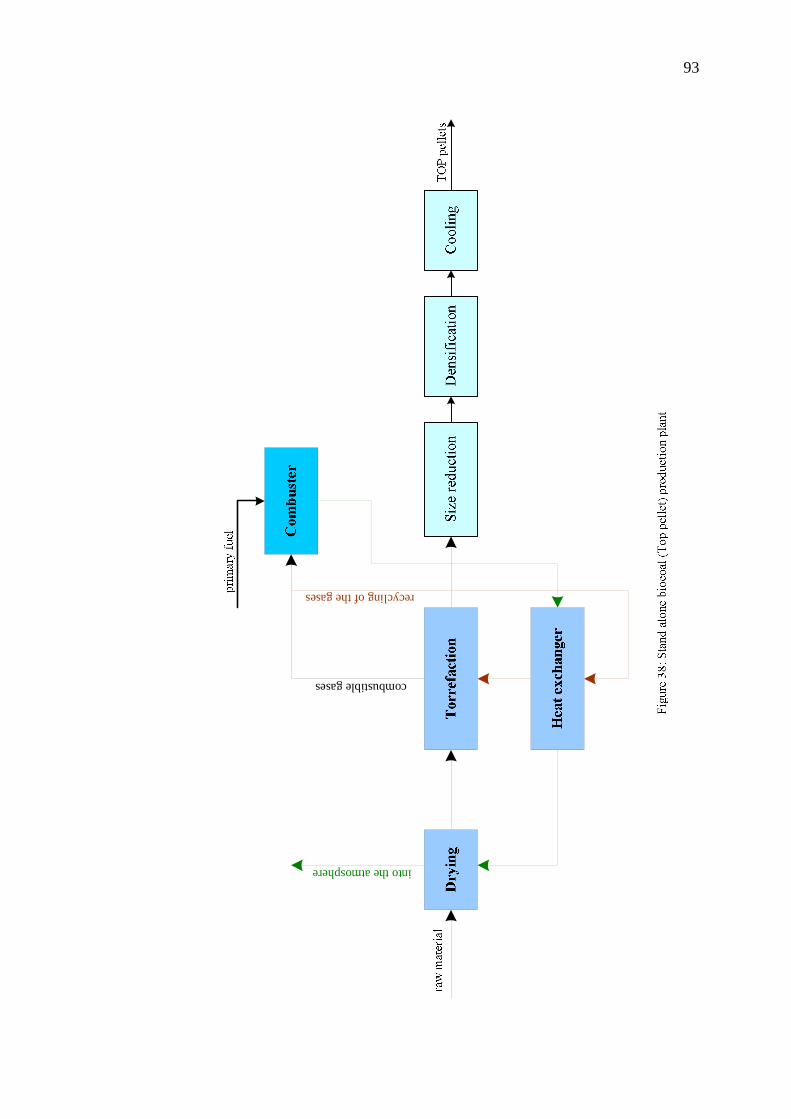
93
combustible gases
recycling of the gases
into the atmosphere
96
Obviously, that economy of biocoal production is strongly dependent on the raw
material cost. The efficiency of conversion plays also an important role.
A strong influence on the technical solutions is given by heat demand for thermal
treatment and drying. However, the possibilities to influence the heat demand are
confined to the choice of the process scheme (Figure 37-38).
The combination of a biocoal (TOP pellet) production plant with pulp and paper
mill or biomass CHP plant could be a good solution due to decreasing investment
costs for heat producing equipment (combustor, heat exchanger). Therefore, the
heat cost required for the process could be lower because only the operating and
consumption costs of the pulp and paper mill or CHP plant are included in the
heat price, at the same time heat production and heat consumption can be
optimally adjusted. As stated before, the formed combustible gases from
torrefaction process can be burned in the boiler of industrial plant, thus reducing
consumption of primary fuel.
The direct approximate economic comparisons of different biocoal production
costs indications showed that integrated plant with the efficiency of conversion
90% and stand alone plant with the same efficiency are most cost effective.
The question how large should be biocoal production plant is closely related to
availability of the raw material. Taking into account that raw material for biocaol
production is the same in case of wood pellet production (woody biomass) it can
be concluded from wood pellet production studies that the transportation distance
for raw material should not be more than 200 km (in best case ~ 100 km). The
plant production capacity influences all production cost factors (except raw
material costs) and can contribute substantially for decreasing of biocoal
production costs.
97
5 FUTURE ASPECTS OF THE WOODY BIOMASS
CONVERSION
The wood has a complex polymer structure. Based on this statement it would be
interesting to consider existing wood conversion technologies, because the future
development of a controlled, flexible, multi-products and integrated carbonization
industry is a pressing need. The improvement of carbonization industry could be
framed into a more ambitious strategy for the creation of a global biomass
economy. A global biomass economy requires the development of units for the
initial biomass conversion near to biomass resources, centers of densification and
larger centralized conversion units or bio-refineries allowing the production of
electricity, bio-fuels, fertilizers and chemicals at costs competitive with the ones
obtained by the petroleum economy.
Condensable liquids could represent up to 42 mass% of the initial biomass. The
total condensation of pyrolysis vapors leads to the formation of a liquid made up
of two phases: bio-oil (pyroligneous acid) and tar. Water is the main component
of pyroligneous acid. In addition to water, several other chemical compounds
exist in bio-oil, for example: acetic acid, sugars, methanol, acetone, etc. Their
recovery in the XIX century was made at industrial scale. The partial
condensation at temperatures higher than 60oC leads to the formation of an oily
material commonly known as whole pyrolysis oil. Pyroligneous acid with very
low contents of tar materials is obtained with the further condensation of lighter
fractions.
The studied charcoal and torrefied wood compared to the mineral coal don bj n
not contain practically sulfur, mercury and has lower ash content. All this makes
the charcoal the best option in the process of iron reduction. Charcoal and
torrefied wood are an appropriate feedstocks for gasification. It can be gasified in
conventional single step gasifiers to produce a synthesis gas with very low tar
content.
Biocarbo (http://www.biocarbo.com) in association with Vallourec &
Mannesmann Tubes (V&M) is the only Brazilian company commercializing
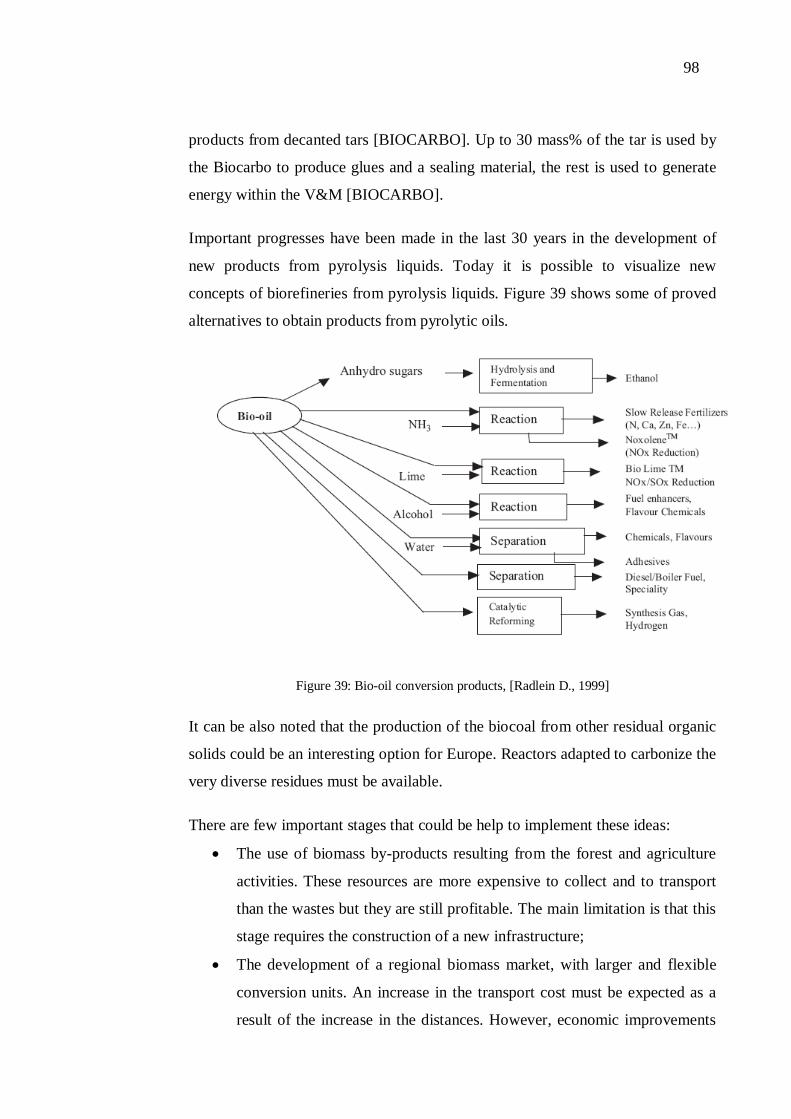
98
products from decanted tars [BIOCARBO]. Up to 30 mass% of the tar is used by
the Biocarbo to produce glues and a sealing material, the rest is used to generate
energy within the V&M [BIOCARBO].
Important progresses have been made in the last 30 years in the development of
new products from pyrolysis liquids. Today it is possible to visualize new
concepts of biorefineries from pyrolysis liquids. Figure 39 shows some of proved
alternatives to obtain products from pyrolytic oils.
Figure 39: Bio-oil conversion products, [Radlein D., 1999]
It can be also noted that the production of the biocoal from other residual organic
solids could be an interesting option for Europe. Reactors adapted to carbonize the
very diverse residues must be available.
There are few important stages that could be help to implement these ideas:
The use of biomass by-products resulting from the forest and agriculture
activities. These resources are more expensive to collect and to transport
than the wastes but they are still profitable. The main limitation is that this
stage requires the construction of a new infrastructure;
The development of a regional biomass market, with larger and flexible
conversion units. An increase in the transport cost must be expected as a
result of the increase in the distances. However, economic improvements
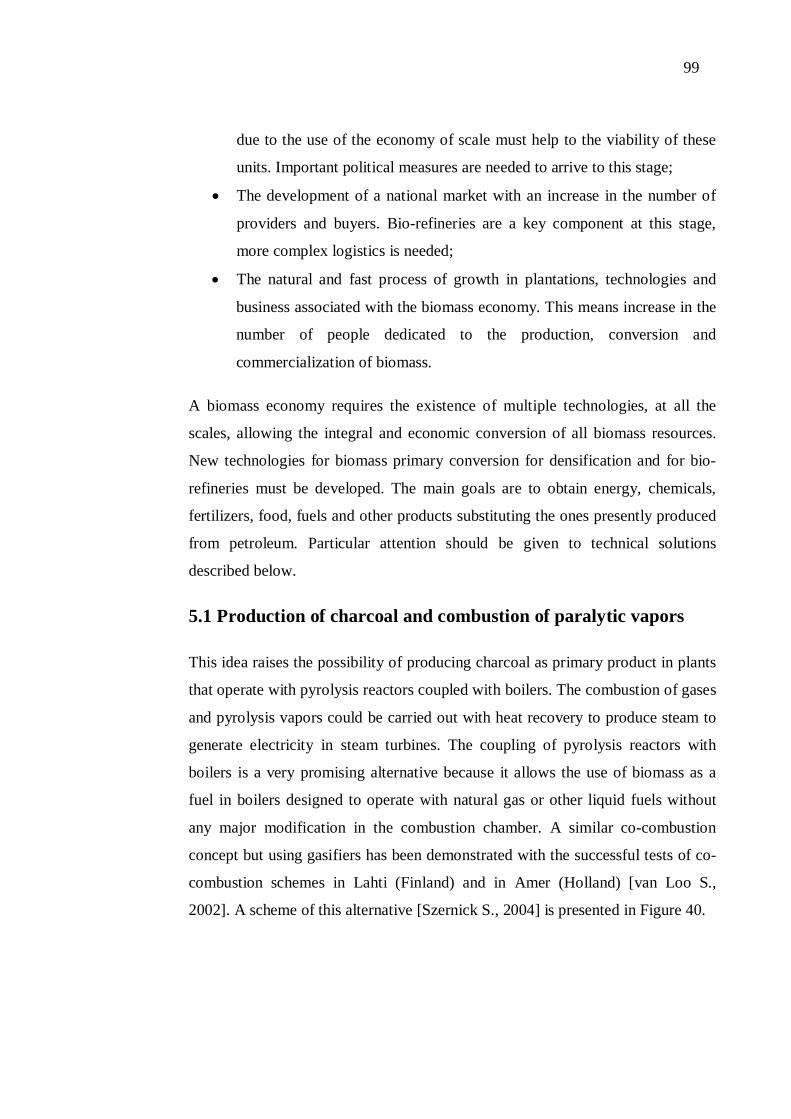
99
due to the use of the economy of scale must help to the viability of these
units. Important political measures are needed to arrive to this stage;
The development of a national market with an increase in the number of
providers and buyers. Bio-refineries are a key component at this stage,
more complex logistics is needed;
The natural and fast process of growth in plantations, technologies and
business associated with the biomass economy. This means increase in the
number of people dedicated to the production, conversion and
commercialization of biomass.
A biomass economy requires the existence of multiple technologies, at all the
scales, allowing the integral and economic conversion of all biomass resources.
New technologies for biomass primary conversion for densification and for bio-
refineries must be developed. The main goals are to obtain energy, chemicals,
fertilizers, food, fuels and other products substituting the ones presently produced
from petroleum. Particular attention should be given to technical solutions
described below.
5.1 Production of charcoal and combustion of paralytic vapors
This idea raises the possibility of producing charcoal as primary product in plants
that operate with pyrolysis reactors coupled with boilers. The combustion of gases
and pyrolysis vapors could be carried out with heat recovery to produce steam to
generate electricity in steam turbines. The coupling of pyrolysis reactors with
boilers is a very promising alternative because it allows the use of biomass as a
fuel in boilers designed to operate with natural gas or other liquid fuels without
any major modification in the combustion chamber. A similar co-combustion
concept but using gasifiers has been demonstrated with the successful tests of co-
combustion schemes in Lahti (Finland) and in Amer (Holland) [van Loo S.,
2002]. A scheme of this alternative [Szernick S., 2004] is presented in Figure 40.
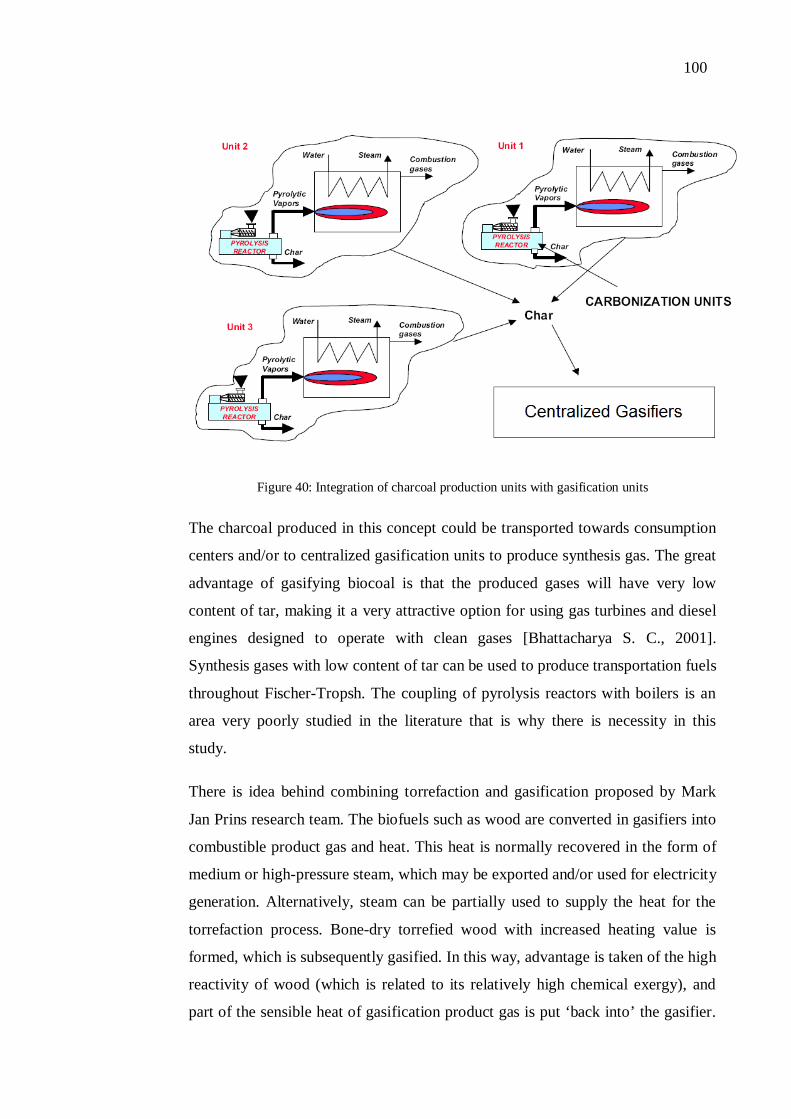
100
Figure 40: Integration of charcoal production units with gasification units
The charcoal produced in this concept could be transported towards consumption
centers and/or to centralized gasification units to produce synthesis gas. The great
advantage of gasifying biocoal is that the produced gases will have very low
content of tar, making it a very attractive option for using gas turbines and diesel
engines designed to operate with clean gases [Bhattacharya S. C., 2001].
Synthesis gases with low content of tar can be used to produce transportation fuels
throughout Fischer-Tropsh. The coupling of pyrolysis reactors with boilers is an
area very poorly studied in the literature that is why there is necessity in this
study.
There is idea behind combining torrefaction and gasification proposed by Mark
Jan Prins research team. The biofuels such as wood are converted in gasifiers into
combustible product gas and heat. This heat is normally recovered in the form of
medium or high-pressure steam, which may be exported and/or used for electricity
generation. Alternatively, steam can be partially used to supply the heat for the
torrefaction process. Bone-dry torrefied wood with increased heating value is
formed, which is subsequently gasified. In this way, advantage is taken of the high
reactivity of wood (which is related to its relatively high chemical exergy), and
part of the sensible heat of gasification product gas is put ‘back into’ the gasifier.
101
The design of a torrefaction reactor, which is placed in front of the gasifier, is
similar to a drier. In this case, indirect heat transfer based on heat conduction is
selected, which allows precise temperature control. A steam tube drier, possibly
with rotation to promote contact between the solid particles and hot steam tubes,
may be used [Mark Jan Prins, 2005].
It is expected also that, in the near future, gasification systems can be coupled
with fuel cell systems that convert hydrogen gas to electricity or heat using an
electrochemical process with very little air emissions and water vapour as the
primary exhaust. When the costs of fuel cells and biomass gasifiers come down,
these systems could proliferate.
5.2 Production of charcoal/torrefied fuel and/or synthetic gas by
means of biomass gasification
Syngas is the name granted to gases generated in the process of gasification of
mineral coal, biomass, natural gas or other organic remainders. It consists mainly
of CO and hydrogen. Transportation fuels can be produced from syngas using the
Fischer-Tropsch synthesis.
The range of products immediately obtainable from syngas extends from bulk
chemicals like ammonia and methanol, through industrial gases to utilities such as
clean fuel gas and electricity. Some of the catalytic pathways to convert syngas
are presented in Figure 41. Syngas conversion technologies to obtain mixed
alcohols, NH3, aldehydes, ethanol, waxes, diesel, olefins, formaldehyde, MTBE,
DME has been extensively documented in the literature [Spath P.L., 2003].
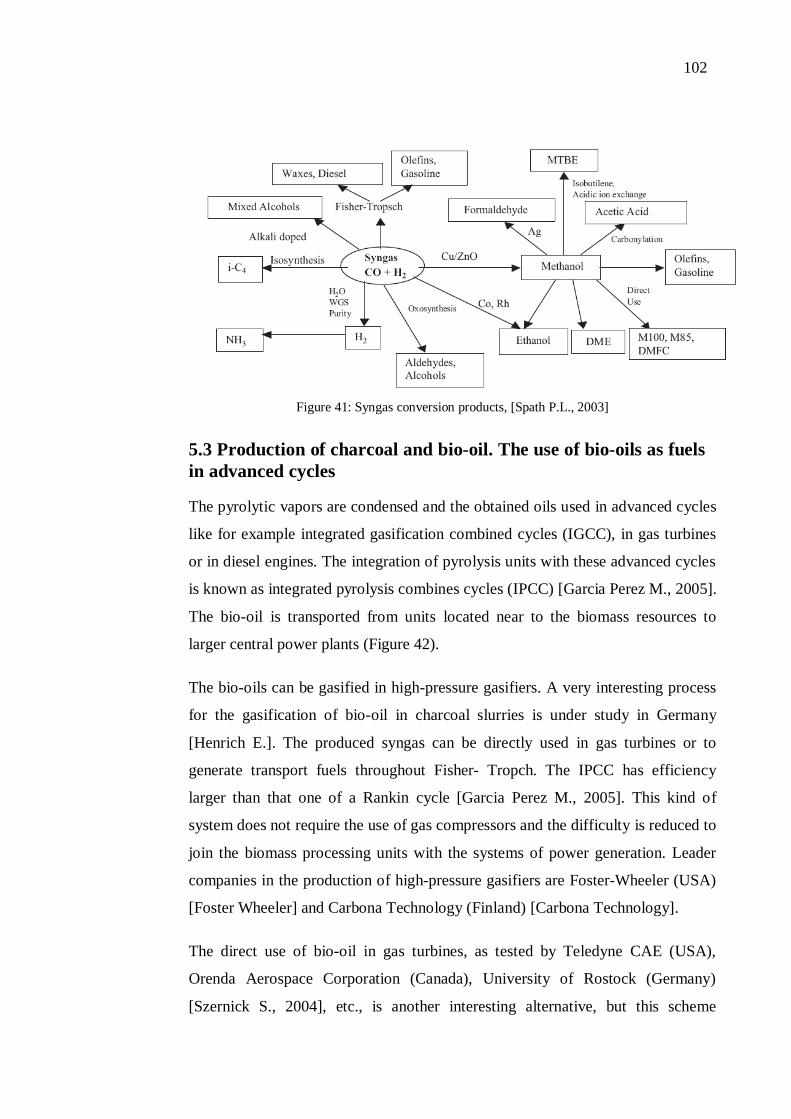
102
Figure 41: Syngas conversion products, [Spath P.L., 2003]
5.3 Production of charcoal and bio-oil. The use of bio-oils as fuels in advanced cycles
The pyrolytic vapors are condensed and the obtained oils used in advanced cycles
like for example integrated gasification combined cycles (IGCC), in gas turbines
or in diesel engines. The integration of pyrolysis units with these advanced cycles
is known as integrated pyrolysis combines cycles (IPCC) [Garcia Perez M., 2005].
The bio-oil is transported from units located near to the biomass resources to
larger central power plants (Figure 42).
The bio-oils can be gasified in high-pressure gasifiers. A very interesting process
for the gasification of bio-oil in charcoal slurries is under study in Germany
[Henrich E.]. The produced syngas can be directly used in gas turbines or to
generate transport fuels throughout Fisher- Tropch. The IPCC has efficiency
larger than that one of a Rankin cycle [Garcia Perez M., 2005]. This kind of
system does not require the use of gas compressors and the difficulty is reduced to
join the biomass processing units with the systems of power generation. Leader
companies in the production of high-pressure gasifiers are Foster-Wheeler (USA)
[Foster Wheeler] and Carbona Technology (Finland) [Carbona Technology].
The direct use of bio-oil in gas turbines, as tested by Teledyne CAE (USA),
Orenda Aerospace Corporation (Canada), University of Rostock (Germany)
[Szernick S., 2004], etc., is another interesting alternative, but this scheme
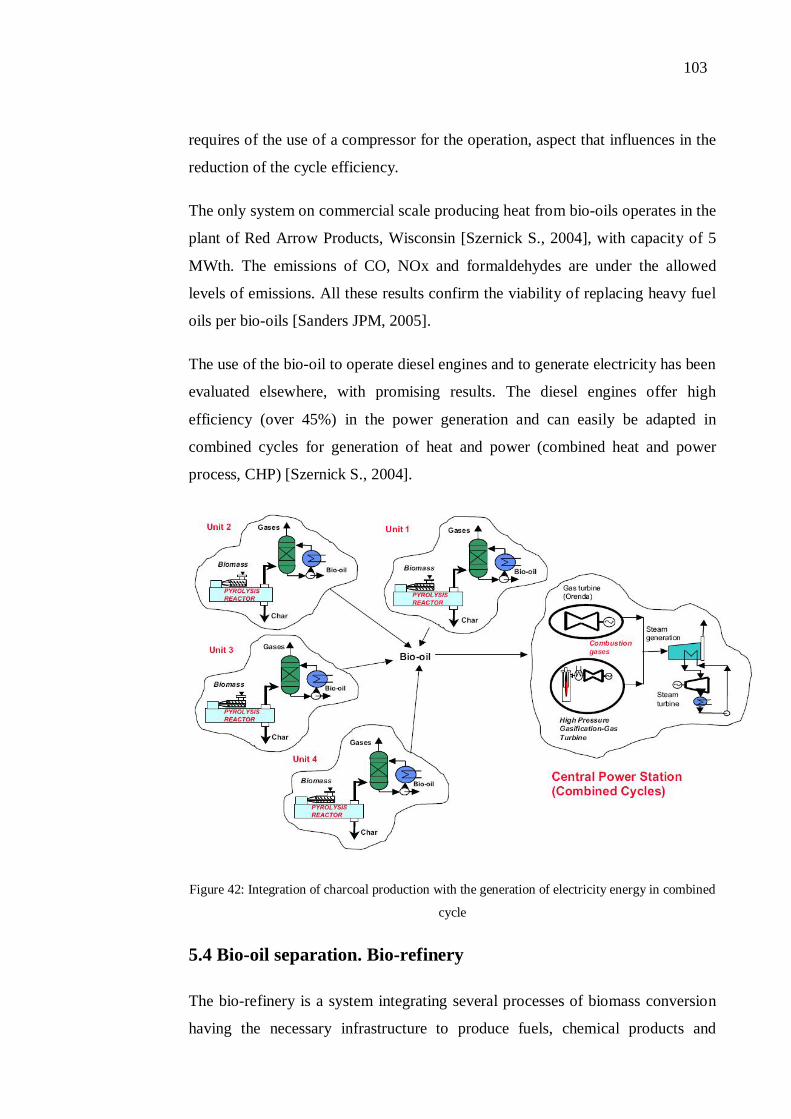
103
requires of the use of a compressor for the operation, aspect that influences in the
reduction of the cycle efficiency.
The only system on commercial scale producing heat from bio-oils operates in the
plant of Red Arrow Products, Wisconsin [Szernick S., 2004], with capacity of 5
MWth. The emissions of CO, NOx and formaldehydes are under the allowed
levels of emissions. All these results confirm the viability of replacing heavy fuel
oils per bio-oils [Sanders JPM, 2005].
The use of the bio-oil to operate diesel engines and to generate electricity has been
evaluated elsewhere, with promising results. The diesel engines offer high
efficiency (over 45%) in the power generation and can easily be adapted in
combined cycles for generation of heat and power (combined heat and power
process, CHP) [Szernick S., 2004].
Figure 42: Integration of charcoal production with the generation of electricity energy in combined
cycle
5.4 Bio-oil separation. Bio-refinery
The bio-refinery is a system integrating several processes of biomass conversion
having the necessary infrastructure to produce fuels, chemical products and
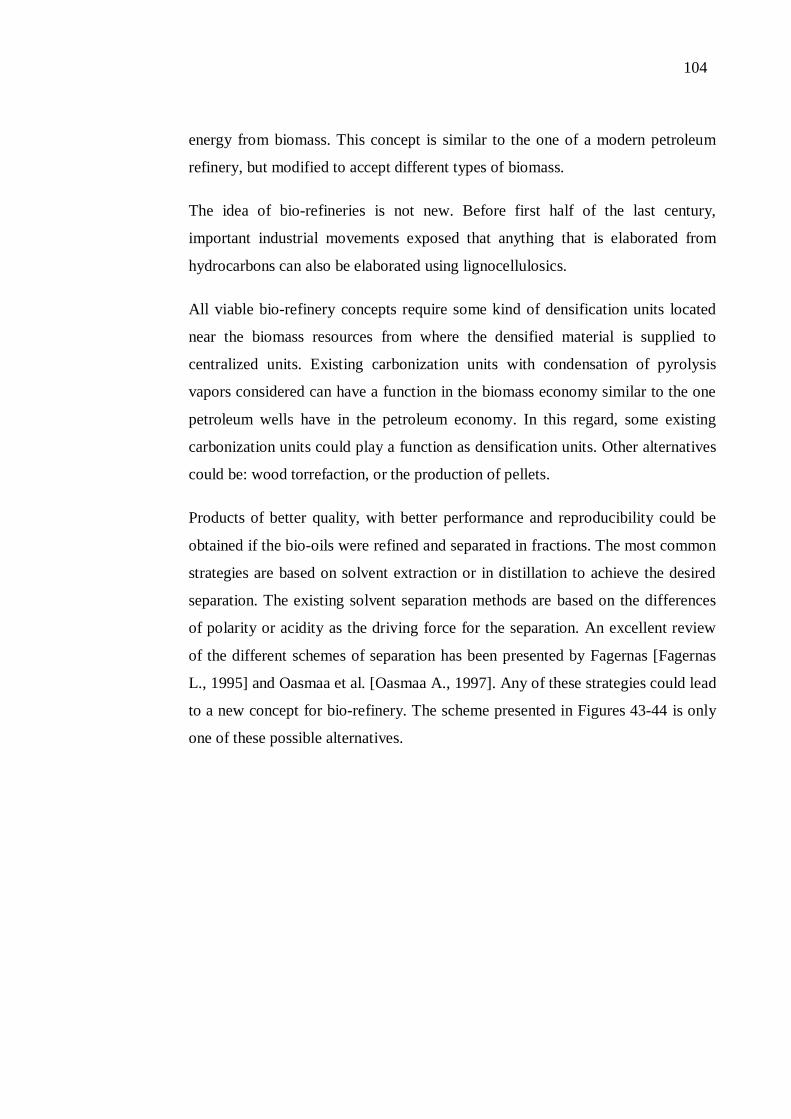
104
energy from biomass. This concept is similar to the one of a modern petroleum
refinery, but modified to accept different types of biomass.
The idea of bio-refineries is not new. Before first half of the last century,
important industrial movements exposed that anything that is elaborated from
hydrocarbons can also be elaborated using lignocellulosics.
All viable bio-refinery concepts require some kind of densification units located
near the biomass resources from where the densified material is supplied to
centralized units. Existing carbonization units with condensation of pyrolysis
vapors considered can have a function in the biomass economy similar to the one
petroleum wells have in the petroleum economy. In this regard, some existing
carbonization units could play a function as densification units. Other alternatives
could be: wood torrefaction, or the production of pellets.
Products of better quality, with better performance and reproducibility could be
obtained if the bio-oils were refined and separated in fractions. The most common
strategies are based on solvent extraction or in distillation to achieve the desired
separation. The existing solvent separation methods are based on the differences
of polarity or acidity as the driving force for the separation. An excellent review
of the different schemes of separation has been presented by Fagernas [Fagernas
L., 1995] and Oasmaa et al. [Oasmaa A., 1997]. Any of these strategies could lead
to a new concept for bio-refinery. The scheme presented in Figures 43-44 is only
one of these possible alternatives.
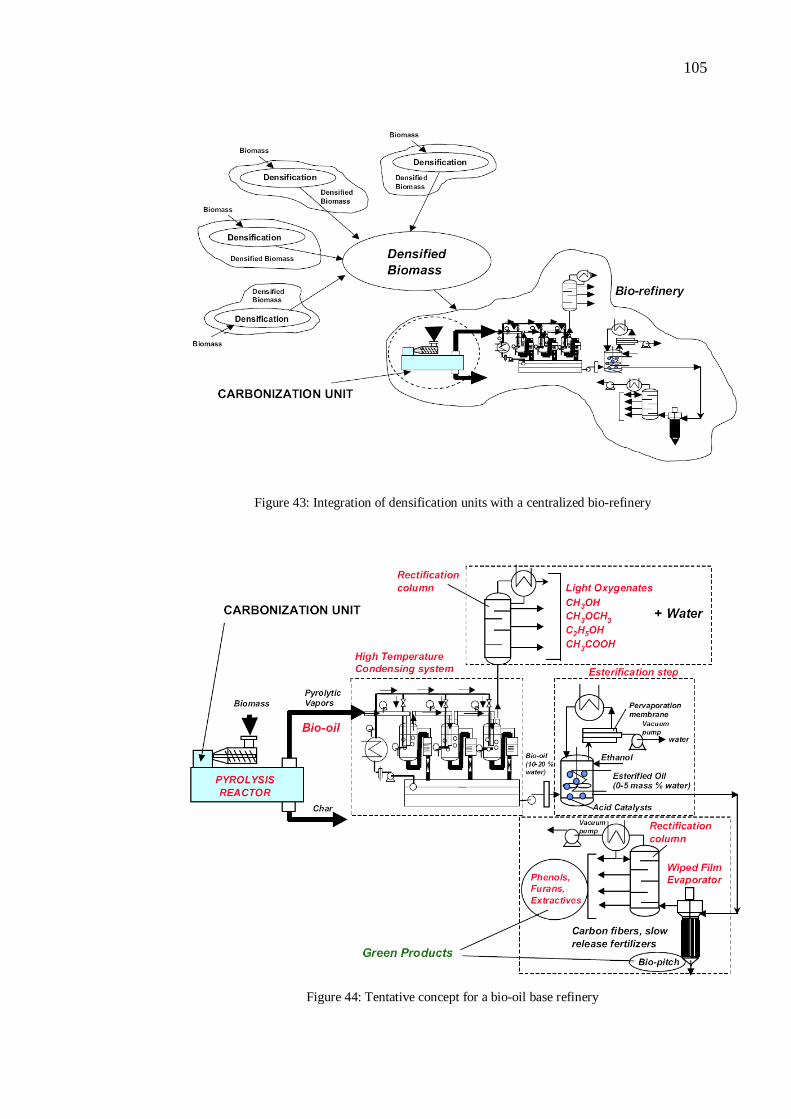
105
Figure 43: Integration of densification units with a centralized bio-refinery
Figure 44: Tentative concept for a bio-oil base refinery
106
6 CONCLUSIONS
The technology of charcoal production is clear. Different installations were
presented and described their operating principle. Various charcoal applications
were examined.
There was also studied torrefaction technology and possible schemes of torrefied
fuel production. This technology is new and not commercialized yet. Many
aspects such as the energy yield and general process yield, the potential benefits
are still not clear but production technologies and equipment are developing.
Existing technologies in real phases could be examined further.
One of the goals of this work was to consider the possibility to use the biocoal as
energy fuel. This possibility was evaluated and results, based on chemical and
physical properties of the biocoal, showed that biocoal could have potential to be
an energy fuel.
Power generation on the basis of biocoal can be realized in existing power stations
designed for fossil fuels (coal fired power plants). There are two main common
types of biocoal power generation technologies: co-combustion and gasification.
Co-combustion involves substituting biocoal for a portion of coal in an existing
power plant. It is generally considered the most economic near-term option for
introducing biocoal power generation. Because much of the existing power plant
equipment can be used without major modifications, co-firing is less expensive
than building a new biomass power plant. Compared to the coal it replaces,
biocoal reduces sulfur dioxide, nitrogen oxides and other air emissions. The cost
of generating electricity from biocoal is not estimated yet but it is clear that it
depends on the type of technology, the size of the power plant and the cost of the
biocoal supply.
The principle of biocoal gasification is the same like for coal and other types of
biomass. Biocoal is processed in an oxidizing environment (with oxygen, air,
steam, CO2 or often their mixture) where the biocoal breaks down to form a
combustible gas. This offers advantages over directly burning biocoal, as the
107
biogas can be cleaned and filtered to remove problematic chemical compounds.
The biogas can be used in more efficient power generation systems that combine
gas turbines and steam turbines to produce electricity. The efficiency of these
systems can reach 60%. It is expected that, in the near future, gasification systems
can be coupled with fuel cell systems that convert hydrogen gas to electricity or
heat using an electrochemical process with very little air emissions and water
vapour as the primary exhaust. When the costs of fuel cells and biomass gasifiers
come down, these systems could proliferate.
Economic analysis of charcoal production showed real prices in Russian, Brazilin
and Finnish markets. Because of the lack of information about torrefied fuel
production it should be marked that economic analysis of the biocoal (TOP pellet)
investment and production costs have approximate character.
Future aspects of the wood conversion were reviewed to understand potential of
wood for such industries like power generating industry, chemical industry.
It is thus recommended to test this integrated process in practice and also to
continue study related to torrefaction process economics. The profitability of
integration should also be examined in more detail. Especially the investment
costs of a forest biorefinery should be better defined based on the technology
studied in the literature review.
108
REFERENCES
Aleklett K. International workshop on oil depletion. In: Proceedings from ASPO.
Uppsala, Sweden: University of Uppsala; 2003.
Arnold M., Kohlin G., Persson R., Shepherd G. Fuel wood revisited: what has
changed in the last decade? CIFOR Occasional Paper No. 39. 2003.
Azar, C., 2005. Emerging scarcities-Bioenergy-food competition in a carbon
constrained world. In: Simpson, D., Toman, M., Ayres, R. (Eds.), Scarcity and
Growth Revisited. Natural Resources and the Environment in the New
Millennium. Resources for the Future Inc. John Hopkins University Press,
Baltimore, MD, pp. 98–120.
Berndes, G., Hoogwijk, M., van den Broek, R., 2003. The contribution of biomass
in the future global energy supply: a review of 17 studies. Biomass Bioenergy 25
(1), 1–28.
Bhattacharya, S.C., 1990. Carbonized and uncarbonized briquettes from residues,
In SHELL (ed.), Workshop On Biomass Thermal Processing Vol. I, London, pp.
1-9.
Bhattacharya SC, Hla SS, Pham H-L. A study on a multi-stage hybrid gasifier
engine system. Biomass Bioener 2001; 21:445–60.
BIOCARBO, available online at: www.biocarbo.com
Björheden R, Örlander G, Baudin A, Thörnquist T. Stormfällningen en katastrof
som hotar skogsna¨ ringen. DN-debatt. 05-01-18, 2005.
Carbona Technology (Finland), available online at www.forestprod.org
Christersson L. Using physiological knowledge for biomass production in
forestry. National and international aspects. In: Christersson, Verwijst, Amatya,
editors. Proceedings from a IUFRO conference in Brisbane: Wood production in
agroforestry and in short-rotation forestry systems-synergies for rural
109
development. Report no. 4, Department of Crop Production Ecology, Swedish,
University of Agricultural Sciences, Uppsala, Sweden, 2006. p. 5–20.
Christersson L. Records and observations. In: Christersson, Verwijst, Amatya,
editors. Proceedings from a IUFRO conference in Brisbane: Wood production in
agroforestry and in short-rotation forestry systems-synergies for rural
development. Report no. 4, Department of Crop Production Ecology, Swedish
University of Agricultural Sciences, Uppsala, Sweden, 2006. p. 79–81.
Commission of Oil Independency, Swedish Government, Regeringskansliet,
Stockholm, Sweden, 2006.
Dockered B. DN Debatt 2003-09-29, 2003.
Dubovy V.K., Main manager: Strategic development and planning, Saint
Petersburg Forestry Institute, oral and telephone interviews, February-April, 2010.
EBES AG – European Bio Energy Services. ACB – The Perfect Renewable
Substitute for Coal in Power Production.
ECOTEC, 1999. The impact of renewables on employment and economic growth.
EC Project initiated by EUFORES and coordinated by ECOTEC Research and
Consulting Ltd, ALTENER Project 4.1030/E/ 97-009.
Energy in Sweden. Facts and figures. Eskilstuna, Sweden: Swedish Board of
Energy; 2004.
Enander G. DN Debatt 2003-09-17, 2003.
Ericsson, K., Nilsson, L.J., 2006. Assessment of the potential biomass supply in
Europe using a resource-focused approach. Biomass Bioenergy 30 (1), 1–15.
European Commission. Green Paper, a European strategy for sustainable,
competitive and secure energy. COM (2006) 105 final.
European Commission (EC), 2005a . Biomass action Plan. COM(2005) 628,
SEC(2005) 1573, Brussels, Belgium.
110
European Forest Institute. EFI/WFSE forest products trade flow database
(www.efi.fi). 2003.
Esa Vakkilainen, Puun kaasutus hiililauhdelaitoksella (presentation),
Lappeenranta University of Thechnology, 2010.
Faaij A., Lewandowski I., 2005. Biomass production potentials in Central and
Eastern Europe under different scenarios. Final report of VIEWLS WP 3.
Available at www.viewls.org.
Fagernas L., Chemical and physical characterization of biomass-based pyrolysis
oils. Literature review. Espoo Technical Research Center of Finland. VTT-
Research Notes 1706, 1995, 113pp.
Felix F.F., Bioware Tecnologia – Centro de Tecnologia da UNICAMP, Rua
Bernardo Sayon, No. 100, sala 207 13083-899, Barao Geraldo, Campinas-SP,
Brazil; Carlos A.L., Grupo Combustiveis Alternativos (CGA), IFGW/DFA,
Universidade Estadual de Campinas (UNICAMP), Campinas-SP, Brazil; Saurez
J.A., Beaton P.A., Centro de Estudios de Eficiencia Energetica, Facultd de
Ingenieria Mecanica, Universidad de Oriente Santiago de Cuba, Cuba; Wood
briquette torrefaction, 2005a.
Felix F.F., Bioware Tecnologia – Centro de Tecnologia da UNICAMP, Rua
Bernardo Sayon, No. 100, sala 207 13083-899, Barao Geraldo, Campinas-SP,
Brazil; Luengo C.A., Grupo Combustiveis Alternativos (CGA), IFGW/DFA,
Universidade Estadual de Campinas (UNICAMP), Campinas-SP, Brazil; Rocha
J.D., Bioware Tecnologia and Nucleo Interdisciplinar de Planejamento Energetico
(UNICAMP), Campinas-SP, Brazil, 2005b.
Fernando Preto, “Pyrolysis, Char and Energy”, CanmetENERGY, Natural
Resources Canada, The Canadian Biochar Initiative, Inaugural Meeting December
12, 2008.
Food and Agriculture Organisation of the United Nations (FAO). www.fao.org.
2001, 2003, 2005.
111
Foster Wheeler (USA), available online at www.fwc.com
Garc a-Pe rez M. Fuel properties of vacuum pyrolysis oils derived from word
industry residues. PhD thesis. Universite Laval, 2005.
Gordon L.V., Skvorzov S. O., Lisov V.I., Technology and equipment of wood-
chemical production, Wood Industry, Moscow, 1988.
Henrich E, Raffdelt K, Stahl R, weirich F. Clean syngas bio-oil/char-slurries. In:
Bridgwater, Boocock, editors. Sciences in thermochemical and chemical biomass
conversion, 1565pp.
Hillring B. Incentives for co-firing in bio-fuelled industrial steam, heat and power
production. Renewable Energy-An International Journal 2002; 28:843-8.
IEA, World Energy Outlook 2006. IEA 2006. See also:
www.worldenergyoutlook.org/2006.asp.
Koverninskiy I.N., Komarov V.I., Tretyakov S.I., Bogdanovich N.I, Sokolov
O.M., Kutakova N.A., Selyanin L.I., Integrated chemical processing of wood,
Ministry of Education of Russian Federation, Archangelsk State Technical
University, Archangelsk, 2002.
KS Party OY, http://www.ks-party.boom.ru.
KS Party Oy, e-mail, 06.04.2010.
Lindevall B. Virkesberget blir en vulkan, Skogen, no 6/7, 1992.
Mark Jan Prins, Thermodynamic analysis of biomass gasification and torrefaction,
Technische Universiteit Eindhoven, 2005.
Mark J. Prins, Krzystof J. Ptasinski, Frans J.J.G. Janssen, Torrefaction of wood
Part 1, Part 2, Eindhoven University of Technology, Environmental Technology
Group, Department of Chemical Engineering and Chemistry, Netherlands, 2006.
Oasmaa A, Leppamaki E, Koponen P, Levender J, Tapola E. Physical
characterization of biomass-based pyrolysis liquids. Applicaion of standard fuel
112
oil analyses. Espoo Technical Research Center of Finland, VTT Publications, 306,
1997, 46pp.
Patrick C.A. Bergman, Jacob H.A. Kiel, Torrefaction for biomass upgrading. The
14 European Biomass Conference & Exhibition, Paris, France, 17-21 October
2005.
Regional study on wood energy today and tomorrow in Asia. Bangkok: Food and
Agriculture Organisation of the United Nations. Regional Development
Programme in Asia GCP/RAS/154/NET; 1997. Field Document No. 50.
R. Wagenfuhr, C. Scheiber, Wood Atlas (in German), VEB Fachbuchverlag,
Leipzig, 1974.
Radlein D. The production of chemicals from fast pyrolysis of bio-oils. In:
Bridgwater, editor. Fast pyrolysis of biomass: a handbook. CPL Press; 1999. p.
164–88.
Sanders JPM. Biorefinery, the bridge between agriculture end chemistry. In: First
international biorefinery workshop. Washington, DC, July 20–21, 2005, available
online at www.biorefineryworkshop.com/pdfs/Program_Book_Web-2.pdf.
Suárez, J.A., Luengo, C.A., Fonseca, F.F., Bezzon, G., and Beatón, P.A., 2000.
Thermochemical properties of Cuban biomass, Energy Sources, 22, pp. 851-867.
Skogsdata. Riksskogstaxeringen. Sweden: SLU, Umea° ; 2005.
SOU. Virkesbalanser. Statens offentliga utredningar, 1968. p. 9.
Spath P.L., Dayton D.C., Preliminary screening-technical and economic
assessment of synthesis gas to fuels and chemicals with emphasis on the potential
for biomass-derived syngas. National Renewable Energy Laboratory 2003,
available online at: www.osti.gov/bridge.
St.P SFA – Saint Petersburg State Forest Technical Academy (Technical
documentation of the project – Charcoal production plant, 2000), familiarization
with documentation February 2010.
113
Szernick S, Bridgwater AV. Overview of applications of biomass fast pyrolysis
oil. Energy Fuels 2004; 18:590–8.
Thuresson T. Tillva¨xto¨verskotty men Virkesbrist. Skogseko no. 2/2002.
Topell on torrefaction, Workshop IEA Task 32, New Biomass Co-firing
Concepts, Hamburg, June 30th 2009.
Van Loo S., Koppjan J, editors. Handbook biomass combustion and co-firing.
Enschede, The Netherlands: Twente University Press; 2002.
VMR. Skogsindusrins virkesfo¨ rbrukning samt produktion av skogsprodukter
2001-2005. Utkast, 2005.
Yuriev U.L., Charcoal (Hanbook), Ural Forestry University, Ekaterinburg, 2007.

114
APPENDIX
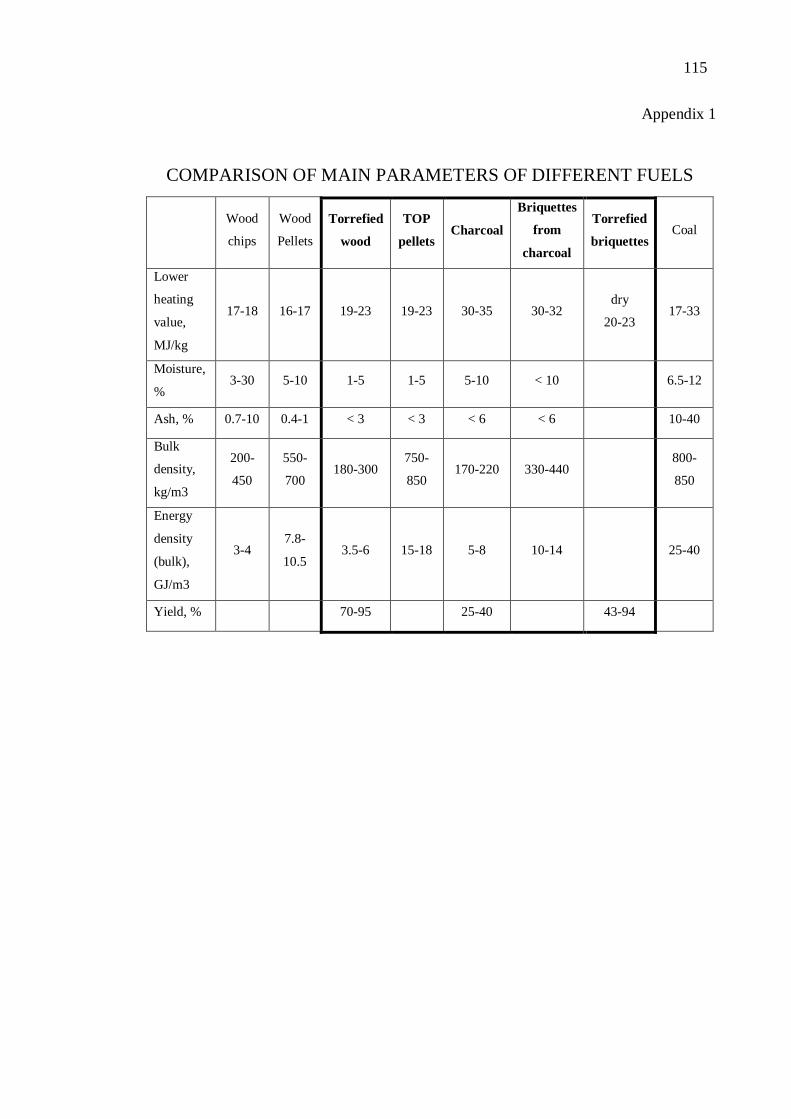
115
Appendix 1
COMPARISON OF MAIN PARAMETERS OF DIFFERENT FUELS
Wood
chips
Wood
Pellets
Torrefied
wood
TOP
pellets Charcoal
Briquettes
from
charcoal
Torrefied
briquettes Coal
Lower
heating
value,
MJ/kg
17-18 16-17 19-23 19-23 30-35 30-32 dry
20-23 17-33
Moisture,
% 3-30 5-10 1-5 1-5 5-10 < 10 6.5-12
Ash, % 0.7-10 0.4-1 < 3 < 3 < 6 < 6 10-40
Bulk
density,
kg/m3
200-
450
550-
700 180-300
750-
850 170-220 330-440
800-
850
Energy
density
(bulk),
GJ/m3
3-4 7.8-
10.5 3.5-6 15-18 5-8 10-14 25-40
Yield, % 70-95 25-40 43-94
116
Appendix 2
LIST OF COMPANIES OFFERING OR DEVELOPING
TECHNOLOGY FOR TORREFACTION AND BIOCARBON
PRODUCTION
1. Wyssmont
1470 Bergen Blvd.
Fort Lee, NJ 07024
Phone: 201-947-4600
Fax: 201-947-0324
E-mail: [email protected]
Website: http://www.wyssmont.com/home.php
http://www.wyssmont.com/lib/images/pdf/torrefaction-newsletter.pdf
2. Sea 2 Sky Corporation
2287 Slater Road
Ferndale, WA 98227
Phone: (877) sea-2sky
E-mail: [email protected]
Website:http://www.sea2skyenergy.com/index.php
3. Agri-Tech Producers, LLC
116 Wildewood Club Ct.
Columbia, S.C. 29223
Phone: (803)-462-0153
Fax: (803)-462-9676
Website: http://www.agri-techproducers.com/
4. Integro Earth Fuels, LLC
204 Charlotte Highway, Suite E
Asheville, NC 28803
E-mail: [email protected]
Website: http://www.integrofuels.com/
117
5. Earth Care Products, Inc.
P.O. Box 787
800 N. 21st Street
Independence, KS 67301
(620) 331-0090
(620) 331-0095 FAX
E-mail: [email protected]
www.ecpisystems.com
http://www.ecpisystems.com/wcms/index.php?Torrefaction
6. Genesis Industries
212 Yacht Club Way A-12
Redondo Beach, CA 90277
Phone: 310-399-9775
Fax: 310-697-3032
E-mail: [email protected]
Website: http://www.egenindustries.com/technology.php
7. NewEarth Renewable Energy Inc.
Phone: (206)-310-1205
Fax: (206)- 577-3874
E-mail: [email protected]
Website: http://www.newearth1.net/about-newearth.html
8. Terradyne Energy Inc.
3732 SW 30th Ave.
Hollywood, Fl, 33312, USA
Phone:506-863-7135
Website: http://www.terradyneenergy.com/
9. Biochar Systems, LLC
1125 Lancaster Avenue
Berwyn, PA 19312,
Phone: 877-326-1909

118
Website: http://www.biocharsystems.com/biochar/index.html
10. Biochar Engineering
701 Pine Ridge Rd #3
Golden, CO 80403
Phone 303-279-3776
Fax: 303-279-3734
Website: http://www.biocharengineering.com/technology/index.html
11. Carbon Char Group
Phone: 828-254-7418
E-Mail: [email protected]
Website: http://www.carbonchar.com/
12. Mantria Industries
555 City Avenue, Suite 430
Bala Cynwyd, PA 19004
Phone: 484-483-1010
Website: http://www.eternagreen.com/home
13. BioChar Products
PO Box 875
Halfway, OR 97834
Website: http://www.biocharproducts.com/
14. International Biochar Initiative
Main inquires: Thayer Tomlinson, Communications Director
Office Phone. (914)-693-0496(United States)
Mobile Phone. (202)-247-5251(United States)
E-mail: [email protected]
Website: http://www.biochar-international.org/
15. Vega Biofuels, Inc.
Phone: 800-481-0186
Fax: 866-421-1216

119
Website: http://vegabiofuels.com/
16. EcoTechnologies Group, LLC
1125 Lancaster Avenue
Berwyn, PA 19312
Phone: 877-ECO-1909
Fax: 610-993-9938
E-mail: [email protected]
Website: http://www.ecotechnologies.com/technologies.html
17. Terra Green Energy, LLC
100 Four Falls Corporate Center, Suite 215
W. Conchohocken, PA 19428-2960
United States
Phone: (610) 940-4420
Website: http://www.terragreenenergy.com/
18. R & A Energy Solutions, LLC
Website: http://randaenergysolutions.com/index.html