Embed Size (px)
Citation preview
"If Russia chooses to reach the level where tobacco tax
represents 70 percent of the retail price, up to 2.7 million
tobacco-related deaths among the Russian population
can be avoided. Furthermore, the government would
collect an additional RUB 153 billion (US$ 6 billion) in
excise tax revenue per year."
Economics of Tobacco Taxation in Russia
Samina Shariff, MPHEpidemiology and Surveillance Research,
American Cancer Society, Atlanta, Georgia
Hana Zarubova Ross, PhDEpidemiology and Surveillance Research,
American Cancer Society, Atlanta, Georgia
Anna Gilmore, PhDUniversity of Bath & European Centre on Health
of Societies in Transition, London School of
Hygiene and Tropical Medicine, London, UK
One of a series of reports on tobacco taxation funded by Bloomberg Philanthropies and theBill and Melinda Gates Foundation as part of the Bloomberg Initiative to Reduce Tobacco Use.
Ross-Russia-forPrint-Final_A.qxd:Ross-Russia-forPrint-Final.qxd 9/30/08 4:23 PM Page FC1
ISBN: 978-2-914365-45-1
International Union Against Tuberculosis and Lung Disease (The Union)68 boulevard Saint Michel, 75006 Paris - FRANCETel : +33-1 44.32.03.60, Fax : +33-1 43.29.90.87email: [email protected]; web: www.iuatld.org
Suggested citation: Ross HZ, Shariff S, Gilmore A. Economics of TobaccoTaxation in Russia. Paris: International Union Against Tuberculosis and LungDisease; 2008.
Ross-Russia-forPrint-Final_A.qxd:Ross-Russia-forPrint-Final.qxd 9/30/08 4:23 PM Page FC2
Economics of Tobacco Taxation in Russia
Executive Summary 1
I. Introduction 4
II. Data and Methods 7
III. Demand for Tobacco Products and Tobacco Tax Policy 9Tobacco Use Prevalence and Intensity, and Type of Tobacco Products Consumed 9Price and Affordability of Cigarettes, and Price Elasticity 13Expenditures on Tobacco Products and the Cost of Smoking 18Tobacco Tax Level and Tax Structure 20
IV. Supply of Tobacco Products and Industry Regulations 26Production, Import, and Export 26Structure of the Tobacco Market 29Tobacco Tax Collection Mechanism and Tax Revenue 32Regulations of the Tobacco Industry, Its Political Power, and Image 34
V. Tobacco Tax Policy Options and Their Impact on Cigarette Consumption and 37Tax Revenue
VI. Other Implications of Tobacco Tax Policy 40Smuggling and Product Substitution 40Employment and Poverty 40Economic Growth, Trade and Foreign Exchange 41
Discussion and Recommendations 44
Annexes 4 7Acknowledgements 5 0
Ross-Russia-forPrint-Final_A.qxd:Ross-Russia-forPrint-Final.qxd 9/30/08 4:23 PM Page FC3
BAT: British American Tobacco
CIS: Commonwealth of Independent States
EIU: Economist Intelligence Unit
EU: European Union
FCTC: Framework Convention on Tobacco Control
GDP: Gross domestic product
GYTS: Global Youth Tobacco Survey
HBSC: Health Behavior in School-aged Children survey
JTI: Japan Tobacco International
RLMS: Russian Longitudinal Monitoring Study
RYO cigarettes: Roll-your-own cigarettes
TTCs: Transnational tobacco companies
VAT: Value-added tax
WHO: World Health Organization
Acronyms and Abbreviations
Ross-Russia-forPrint-Final_A.qxd:Ross-Russia-forPrint-Final.qxd 9/30/08 4:23 PM Page FC4
Russia has about 44 million smokers and one of
the highest rates of male smoking prevalence in the
world. More than 60 percent of adult males consume
tobacco, primarily in the form of cigarettes. Female
smoking prevalence had traditionally been lower but
started to increase following the collapse of the former
Soviet Union. Between 1992 and 2004 alone, female
smoking rates more than doubled from 6.9 to 15
percent. Youth smoking prevalence is also alarmingly
high, with 47 percent of young adult males and 36
percent of young adult females smoking cigarettes. The
Russian population has very few former smokers (i.e.
people who have quit), an indication of
underdeveloped tobacco control measures.
Tobacco-related diseases are responsible for
between 330,000 and 400,000 premature deaths in
Russia each year and contribute substantially to the
country’s declining life expectancy and population
decrease. This report examines the potential of using
cigarette taxation as an effective tobacco control
measure to reverse these unfavorable trends, taking
into account Russian historical and socioeconomic
perspectives.
The Russian cigarette market has changed
dramatically since the entry of transnational tobacco
companies in the early 1990s. Transnational tobacco
companies now control more than 90 percent of the
market, with the largest share, 35 percent, owned by
Japan Tobacco International. Other large
Executive Summary
transnational tobacco companies are Philip Morris and
British American Tobacco. Virtually all (98.5 percent)
cigarettes on the market are domestically produced,
although they primarily use imported tobacco leaves.
Low import duties encourage the importation of raw
tobacco.
Russian smokers increasingly prefer filtered
cigarettes to the previously common non-filtered
cigarettes and papirosy, a local variant of non-filtered
cigarettes. They also can choose from an increasingly
wide range of cigarette brands and price points.
Cigarettes are available in high- (at least RUB 30 or
US$ 1.10 per pack), middle- (RUB 10–29 or
US$ 0.37–1.10 per pack), and low- (less than RUB 9 or
US$ 0.33 per pack) priced categories. Non-filtered
cigarettes are available for as little as RUB 4 (US$ 0.15)
per pack of 20.
Cigarettes in Russia are becoming cheaper and
more affordable over time compared to basic-needs
goods such as bread. This is the result of the current
weak tobacco tax policy that both keeps cigarette prices
low and is not designed to deal effectively with the
nation’s double-digit inflation. Between 2000 and
2007 alone, real cigarette prices fell by at least 40
percent. The affordability of cigarettes is further
enhanced by rising incomes in Russia, where real
Russia has about 44 million smokers and
one of the highest rates of male smoking
prevalence in the world.
Tobacco-related diseases are responsible
for between 330,000 and 400,000 premature
deaths in Russia each year and also
contribute substantially to the country’s
declining life expectancy and population
decrease.
Ross-Russia-forPrint-Final_A.qxd:Ross-Russia-forPrint-Final.qxd 9/30/08 4:23 PM Page 1
2 Economics of Tobacco Taxation in Russia
wages are increasing by 12 to 15 percent a year. In
2005, Russians spent RUB 83.4 billion (US$ 2.9
billion) or 0.4 percent of the gross domestic product
(GDP) on cigarettes, an amount that represents the
opportunity cost of smoking (i.e. money that could be
spent on other goods).
In addition to opportunity costs, other economic
losses are associated with smoking. The annual
productivity loss from smoking-related premature
mortality reaches at least US$ 24.7 billion, or more
than 3 percent of the GDP. Additional losses from
morbidity and health care expenditures related to
smoking are likely enormous, but their magnitude is
yet to be determined.
The system of cigarette taxation in Russia is
characterized by a differential treatment of filtered and
non-filtered cigarettes. In 2007, the specific excise tax
on filtered cigarettes was RUB 100 (US$ 3.53) per
1,000 cigarettes, while the ad valorem excise tax was
5 percent of the maximum retail price. For non-filtered
cigarettes, the excise tax was RUB 45 (US$ 1.60) per
1,000 cigarettes plus the ad valorem 5 percent tax of
the maximum retail price. The total tax (including the
value-added tax) represents about 33 and 43 percent of
the retail price for filtered and non-filtered cigarettes,
respectively, far below the 67 to 80 percent level
recommended by the World Bank to reduce tobacco
use. The low tax rates also result in relatively low
cigarette tax revenue and represent a missed
opportunity to begin recovering the economic costs
imposed by smoking and to address the demographic
crisis in Russia.
To analyze tobacco tax as a public policy tool in
Russia, we present several tax increase options in this
report. The first option reflects the current proposed
|
increase in the specific and ad valorem taxes by 20 and
10 percent respectively. Such a tax increase would
result in a total tax representing approximately
35 percent of the cigarette retail price, still far below
the level needed to substantially reduce cigarette use.
Increasing taxes to the level of 50, 64, and eventually
70 percent of the retail price is the most effective way
to curb the tobacco epidemic in Russia, with the
70 percent level yielding the maximum public health
and tax revenue gains. Under such a scenario, the total
tax per pack of medium-priced filtered cigarettes
would increase from the 2007 level of approximately
RUB 5.1 to RUB 24.3 (US$ 0.18 to US$ 0.84). If the tax
increase were passed entirely on to the consumer, the
retail price for this type of cigarette would increase by
approximately 123 percent.
The response to a price increase depends on the
price sensitivity of consumers. Only a few studies have
estimated the price elasticity of cigarette demand in
Russia, and they generally found relatively low price
and income elasticity among males, and slightly
greater price responsiveness among females. The low
level of price sensitivity may be the result of the very
low prices of cigarettes and the wide range of cigarette
prices, which allow smokers to adapt to the impact of a
tax increase by switching to cheaper brands. Rising
income, high social acceptability of smoking, and
limited public health efforts to curb smoking are other
factors contributing to low price elasticity.
Assuming the lower bounds of price elasticity of
cigarette demand range from –0.1 to –0.2, the
recommended tax level of 70 percent of the retail price
has the potential to avert up to 2.7 million tobacco-
related deaths. This could potentially save RUB 77
billion (US$ 3 billion) just by reducing the productivity
lost due to premature tobacco-related mortality. Apart
from saving lives and reducing the costs associated
with tobacco use, this optimal tax level also would
generate the maximum increase in government
revenue by increasing cigarette excise tax collection
Between 2000 and 2007 alone, real
cigarette prices fell by at least 40 percent.
Ross-Russia-forPrint-Final_A.qxd:Ross-Russia-forPrint-Final.qxd 9/30/08 4:23 PM Page 2
Hana Zarubova Ross, Samina Shariff, Anna Gilmore 3
more than 300 percent, contributing up to an
additional RUB 153 billion (US$ 6 billion) in annual
excise revenue. If only 2 percent of this additional
excise tax revenue were allocated to fund tobacco
control, Russia would have RUB 3 billion (US$ 120
million) per year to spend on promoting healthier
lifestyles and supporting tax collection administration,
among other measures. This level of spending on
tobacco control would help to counterbalance the
tobacco industry’s investments to promote smoking. In
2004 alone, the industry spent at least US$ 60 million
on cigarette advertising in Russia.
|
Given the potential impact of cigarette tax policy
to improve public health, reduce the costs associated
with smoking, and help address the impending
demographic crisis, the Russian government should
increase tobacco tax, adopt provisions to maintain the
tax level at 70 percent of the retail price benchmark
indexed to inflation, and earmark a portion of the tax
for public health and health care. Experience in both
low- and high-income countries confirms that
increasing the tobacco tax is among the most effective
and practical interventions to reduce tobacco use. Tax
increases in Russia, however, need to be accompanied
by other tobacco control measures, such as a
comprehensive ban on tobacco advertising and smoke-
free air laws, as part of an all-inclusive national
tobacco control strategy.
... the recommended tax level of
70 percent of retail price has the potential
to avert up to 2.7 million tobacco-related
deaths. This could potentially save RUB 77
billion (US$ 3 billion) just by reducing the
productivity loss due to premature
tobacco-related mortality.
... increasing the tobacco tax is among the
most effective and practical interventions
to reduce tobacco use.
Ross-Russia-forPrint-Final_A.qxd:Ross-Russia-forPrint-Final.qxd 9/30/08 4:23 PM Page 3
4 |
I. Introduction
The prevalence of smoking among Russian men is
among the highest in the world, with more than
60 percent of males aged 18 and older consuming
tobacco.1 In 2006, the per capita consumption was
2,207 cigarettes or approximately 110 packs per person
annually.2 By 2014, annual consumption is expected to
reach 2,500 cigarettes or 125 packs per person.2
Smoking and alcohol use are major causes of
premature mortality among men in Russia, and the
accumulated burden of tobacco-related disease in men
under 75 is the highest in the world.3 Estimates of the
number of tobacco-related deaths vary from 330,000
to 400,000 per year, or between 900 to 1,100 people
per day.4 A study of mortality from smoking estimated
that in 1990 about 30 percent of all deaths and
50 percent of cancer deaths in Russian men were
attributable to smoking.5 Males in the prime
productive ages of 35 to 54 have the highest death toll,
with about 40 percent of all deaths in this group
attributed to smoking.6 According to research
conducted in Russia, in the year 2000, tobacco was
responsible for 23 to 30 percent of all male and
4 to 5 percent of all female deaths, as well as more than
50 percent of the cardiovascular-related deaths among
males.4,6,7 No estimates of the impact of secondhand
smoke on public health in Russia exist, but evidence
from other countries suggests that the mortality
burden associated with passive smoking amounts to
about 15 percent of that from active smoking.8
Applying that statistic to Russia would increase the
Economics of Tobacco Taxation in Russia
total smoking-related death toll from 380,000 to
460,000 persons a year.
The limited historical data available on Russian
smoking prevalence and consumption suggest that
levels of smoking have been high among Russian men
for decades. Unlike patterns in the UK and the US,
where male smoking peaked in the 1960s and then
began to decline, male smoking prevalence in Russia
fluctuated within a range of about 50 to 60 percent
from 1975 to 1995, while female smoking prevalence
fluctuated within a range of 5 to 10 percent since 1975.
Since the early 1990s, smoking rates in both genders
have increased significantly. Male smoking rates
increased from 57.4 percent in 1992 to 62.6 percent in
2003,1 while female smoking rates increased from
6.9 percent in 1992 to 14.8 percent in 2003.1
The extent of the smoking epidemic in Russia also
can be documented through high rates of lung cancer
in men. In 2006, the incidence of lung cancer among
Russian men was estimated to be the fifth highest
among 39 European countries, exceeded only by
Belgium, Hungary, Poland, and Albania. The age-
adjusted lung cancer incidence for men that year was
92.7 per 100,000, and the age-adjusted lung cancer
mortality rate for men was 75.2 per 100,000. Lung
cancer rates are considerably lower for women,
reflecting the fact that females are at an earlier stage in
the smoking epidemic. In 2006, female incidence rates
were the eighth-lowest among European countries,
ahead of only Cyprus, Malta, Belarus, Latvia,
Lithuania, Macedonia and the Ukraine.9 The actual
age-adjusted incidence among Russian women that
The prevalence of smoking among
Russian men is among the highest in the
world, with more than 60 percent of males
aged 18 and older consuming tobacco.
Estimates of the number of tobacco-
related deaths vary from 330,000 to
400,000 per year, or between 900 to 1,100
people per day.
Ross-Russia-forPrint-Final_A.qxd:Ross-Russia-forPrint-Final.qxd 9/30/08 4:23 PM Page 4
Hana Zarubova Ross, Samina Shariff, Anna Gilmore 5|
year was estimated as 11.2 per 100,000, while age-
adjusted lung cancer mortality was estimated as 8.0
per 100,000.9
The high lung cancer mortality rates in men
reflect the high smoking rates, but unexpectedly,
mortality data show that death rates from lung cancer
in men peaked in the late 1980s and began to decline
in the early 1990s. This decline, however, is thought to
result from lower rates of smoking among those who
were teenagers between 1945 and 1953, carrying
forward the effect of a shortage of cigarettes after
World War II. The decline, therefore, is expected to
reverse in the near future.10,11 Age-standardized death
rates for lung cancer in Russian women have been low
and fairly stable over time, but if the upwards smoking
trend in women continues, lung cancer mortality will
inevitably increase.12
Tobacco use contributes significantly to declining
male life expectancy in Russia, which dropped from 64
years in 1989 to 59 years in 2007.13 If no action is taken
to improve the current state of public health, theWorld
Bank predicts that male life expectancy in Russia
eventually will fall to 53 years.14 By comparison, men in
Western Europe live, on average, up to 77 years.13 Local
evidence indicates that smoking shortens overall life
expectancy in the Russian population by 6.7 years for
men and by 5.3 years for women.15 In addition to
shortening life expectancy, smoking also causes
substantial ill health, thus reducing the quality of life
and productivity. Among smokers (male and female) in
Russia, it is estimated that tobacco-related diseases
shorten healthy years of life by 13.6 years.16*
With a low birth rate and high death rate, the
population in Russia has been shrinking since the early
1990s. The high death rate, especially among Russian
males, has been attributed to cardiovascular diseases,
alcoholism, and injuries.17 Between 1998 and 2007, the
Russian population declined by 4.4 percent,13 and it is
now falling by almost half a percent each year. By 2015,
the population is expected to reach 136 million,
representing a decrease of 5 million or 3.5 percent
from the 2007 population of 141 million.13
Demographic experts expect the decline to accelerate,
estimating that Russia’s population could fall below
100 million by 2050.18 This crisis is especially
important for the Russian economy because it
overwhelmingly involves men of working age and
contributes to a shortage of labor.19
The negative economic consequences of the
demographic crisis can be addressed by implementing
multiple public health measures, including evidence-
based tobacco control interventions. Studies in both
low- and high-income countries confirm that
increasing the tobacco tax is among the most effective
and practical interventions to reduce the harm caused
by tobacco use.20
* Only two other risk factors have more detrimental impact on life expectancy in Russia — alcohol consumption and high bloodpressure, shortening life by 15.4 and 16.9 healthy years, respectively. (World Health Organization. Global Program on Evidence forHealth Policy. Geneva: World Health Organization; 2002.)
Tobacco use contributes significantly to
declining male life expectancy in Russia,
which dropped from 64 years in 1989 to
59 years in 2007.
The negative economic consequences of
the demographic crisis can be addressed
by implementing multiple public health
measures, including evidence-based
tobacco control interventions.
Ross-Russia-forPrint-Final_A.qxd:Ross-Russia-forPrint-Final.qxd 9/30/08 4:24 PM Page 5
6 Economics of Tobacco Taxation in Russia|
Endnotes for Chapter I
1 Perlman F, Bobak M, Gilmore A, McKee M. Trends in the prevalence of smoking in Russia during the transition to a market economy.Tob Control. 2007;16:299-305.
2 World Cigarettes 1. The 2007 Survey. Volume 3 - Central & Eastern Europe. Suffolk, England: ERC Group Ltd; 2007.3 Ezzati T, Lopez A. Measuring the accumulated hazards of smoking: Global and regional estimates for 2000. Tob Control. 2003;12:79-85.4 Gerasimenko N, Zaridze D, Sakharova G, eds. Health and Tobacco: Facts and Figures. 2007.5 Peto R, Lopez A, Boreham J, Thun M. Mortality from Smoking in Developed Countries 1950-2000. 2nd ed. 2006. available from:
http://www.deathsfromsmoking.net/countries.html.6 Maslennikova GI, Martynchik SA, Shalnova SA, et al. Medical and socioeconomic losses caused by smoking in the male population of
Russia. Profilac Zabol Ukrep Zdor. 2004;3:5-9.7 Levshin, V. Smoking-cessation program motivates Russian physicians to assist their patients and themselves. 2005. Center for
Communications, Health and the Environment. [cited August 24, 2007]; available from:http://www.ceche.org/communications/russian-cancer-cen.html.
8 Gan Q, Smith K, Hammond S, Hu T. Disease burden from smoking and passive smoking in China. In: T-W. Hu, ed. Tobacco ControlPolicy Analysis in China: Economics and Health. Singapore, China: World Scientific Publishing Co.; 2007.
9 Ferlay J, Autier P, Boniol M, Heanue M, Colombet M, Boyle P. Estimates of the cancer incidence and mortality in Europe in 2006. AnnOncol. 2007;18:581-592.
10 World Bank. Dying too young: Addressing premature mortality and ill health due to non-communicable diseases and injuries in theRussian Federation, Europe, and central Asia region. In: Human Development Department, Russia Country Management Unit.Washington, DC: The World Bank; 2005.
11 Shkolnikov VM, Andreev EM, Leon DA, et al. Mortality reversal in Russia: The story so far. Hygeia Internationalis. 2004;4:29-80.12 Shkolnikov VM, McKee M, Leon DA, Chenet L. Why is the death rate from lung cancer falling in the Russian Federation? Eur J
Epidemiol. 1999;15:203-206.13 US Bureau of the Census. International Data Base. Washington, DC: US Bureau of the Census; 2007. [cited August 28, 2007]; available
from: http://www.census.gov/ipc/www/idb/tables.html.14 Life expectancy in Russia on the decline-World Bank. Johnson’s Russia List. 2007. [cited October 10, 2007]; available from:
http://www.cdi.org/russia/johnson/9315-4a.cfm.15 Gerasimenko N, Demin A. Tobacco Policy and Politics in Russia. Moscow, Russia: Public Health Association; 2001.16 World Health Organization. Global Program on Evidence for Health Policy. Geneva: World Health Organization; 2002.17 Eberstadt N. Russia, the sick man of Europe. Washington, DC: American Enterprise Institute for Public Policy Research; 2004. [cited
December 2007]. available from: http://www.aei.org/publications/pubID.21711,filter.all/pub_detail.asp.18 Kuznetsova L. In Russia, birthing for rubles. Associated Press. Aug. 16, 2007. available from:
http://www.network54.com/Forum/84302/thread/1187228840/1187228840/In+Russia%2C+birthing+for+rubles.19 DaVanzo J, Adamson D. Russia’s demographic “crisis”: How real is it? Center for Russian and Eurasian Studies. Labor and Population
Program. Santa Monica, CA: RAND Corporation; July 1997.20 Ross H, Chaloupka F. Economic policies for tobacco control in developing countries. Salud Publica de Mexico. 2006;48:113-120.
Ross-Russia-forPrint-Final_A.qxd:Ross-Russia-forPrint-Final.qxd 9/30/08 4:24 PM Page 6
Hana Zarubova Ross, Samina Shariff, Anna Gilmore 7|
II. Data and Methods
Data on tobacco consumption, production, and
sales in Russia come from various international and
local databases, including the World Health
Organization (WHO) SuRF 2,21 WHO Europe’s
Tobacco Control22 and European Health for All
databases,23 the American Cancer Society’s Tobacco
Control Country Profiles (TCCP),24,25 and the World
Bank Group’s Economics of Tobacco Control data.26
Data on Russia’s population, inflation rates, exchange
rates, and purchasing power parity were obtained from
the United States Census Bureau,27 the United Nations
Statistics Division,28 and the World Bank’s World
Development Indicators.29 Other information came
from published reports, such as ERC Statistics Intl
Plc,30 Euromonitor International,31 and the Economist
Intelligence Unit (EIU).32 Additionally, data were
sought through reviews of published literature,
Internet searches, and contact with national and
international experts.
In this report, smoking prevalence is measured as
the percent of current smokers (either daily or at least
once within the last 30 days) in the population, unless
indicated otherwise. Smoking prevalence data were
obtained from published literature. We relied mainly
on the analyses based on the Russian Longitudinal
Monitoring Study (RLMS).1 The RLMS is a nationally
representative household survey of persons aged
18 years and older and contains a section on tobacco
use. It has been conducted 14 times between 1992 and
2006. Each round contains data on more than 3,000
men and 4,000 women. For more detailed data on the
socioeconomic aspects of smoking behavior, we used
the Living Conditions, Lifestyles and Health survey
conducted in 2001.33 This was a cross-sectional survey
conducted in eight countries, including Russia, using
representative samples of the national adult
population 18 years of age or older. In Russia, 4,006
residents were interviewed for this survey.33
In addition, prevalence data were also obtained
from two national surveys conducted in July 1996 and
April 2004 by the Levada Institute in Moscow for the
New Russia Barometer program. These multi-stage
household surveys covered the Russian population
aged 18 years and older living in both urban and rural
areas and used face-to-face interviews from almost
1,600 households in each survey.34
The analysis of cigarette prices and affordability in
Russia is based on cigarette and bread prices from the
EIU Worldwide Cost of Living Survey,32 as well as from
local sources. The EIU survey is conducted semi-
annually to assess the prices of goods in more than 130
of the world’s major cities, in nearly 90 countries.35 If
more than one city in Russia was surveyed in any
particular year, an average price was calculated,
weighing each city equally. Prices were collected in
March and September from 2000 until 2003, in June
andDecember from 2004 until 2006, and in June 2007.
We use a simple average to obtain one data point for
each year for the period 2000 to 2006, and prices from
June 2007were used for 2007. The survey considers the
prices of two cigarette brands (Marlboro or the nearest
international equivalent, and a local brand) sold at three
types of outlets (high-volume supermarket, mid-priced
retail outlet, and low-priced retail outlet). Since our
study is concerned with the affordability of cigarettes,
foreign and local brands in the lowest-priced retail
outlets were selected for each year.
The interpretation of economic indicators
and their trends over time is extremely
difficult in Russia for several reasons. Since
the early 1990s, the country has
experienced social and economic turmoil
that accompanied the transition from a
planned economy to a market economy.
Ross-Russia-forPrint-Final_A.qxd:Ross-Russia-forPrint-Final.qxd 9/30/08 4:24 PM Page 7
8 Economics of Tobacco Taxation in Russia|
The Russian state statistical office Rosstat, the
Federal State Statistics Service that previously was
called Goskomstat, is the local source of cigarette
prices.36 Rosstat collects the average prices of domestic
cigarettes in selected cities of the Russian Federation,
based on information from local retailers, and calculates
the cigarette price index for the entire country. Prices
reported by Rosstat tend to be lower than those
reported by the EIU, a difference that may be explained
by variation in sampling techniques. According to EIU
representatives, the EIU, unlike Rosstat, generates data
that reflect the average prices encountered by expatriate
executives and their families in Russian cities. The EIU
data thus discount the purchasing habits of local
residents as well as amplify the effect of wealthier
people shopping in more expensive stores. However,
this difference does not affect the trend analysis using
the EIU prices since a consistent method of data
collection is applied over time.
The interpretation of economic indicators and
their trends over time is extremely difficult in Russia for
several reasons. Since the early 1990s, the country has
been going through social and economic turmoil that
accompanied the transition from a planned economy to
a market economy. This turmoil resulted in rapid
hyperinflation spikes between 1992 and 1995 and again
in 1998, introduction of a new currency in 1992 that was
devaluated in 1998, and a complete overhaul of the
system of gathering statistical data. To compensate for
this shortcoming, the data presented in this report were
drawn from multiple sources and compared to one
another in order to assure their accuracy and
completeness while identifying the most appropriate
source for each measure in question.
Endnotes for Chapter II
21 World Health Organization. SuRF 2 - Country Profiles. Geneva: The World Health Organization; 2005. [cited June 13, 2007]; availablefrom: http://www.who.int/ncd_surveillance/infobase/web/surf2/country_list.html.
22 World Health Organization. Tobacco Control Database. Geneva: The World Health Organization; 2006. [cited June 13, 2007];available from: http://data.euro.who.int/tobacco/.
23 World Health Organization. European Health for All Database. Geneva: The World Health Organization; 2007. [cited July 12, 2007];available from: http://data.euro.who.int/hfadb/.
24 Corrao M, Guindon G, Sharma N, Shokoohi D, eds. Tobacco Control Country Profiles. Atlanta, GA: American Cancer Society; 2000.25 Shafey O, Dolwick S, Guindon G, eds. Tobacco Control Country Profiles. 12th World Conference on Tobacco or Health. Atlanta, GA:
American Cancer Society; 2003.26 World Bank. Country Data. Economics of Tobacco Control. Washington, DC: World Bank; 2001. [cited July 9, 2007]; available from:
http://www1.worldbank.org/tobacco/database.asp.27 US Bureau of the Census. International Data Base. Washington, DC: US Bureau of the Census; 2007. [cited June 27, 2007]; available
from: http://www.census.gov/ipc/www/idb/.28 United Nations Statistics Division. Commodity Trade Statistics Database (COMTRADE). available from: http://www.comtrade.un.org.29 World Bank. World Development Indicators. Development Data and Statistics. 2007. available from:
http://web.worldbank.org/WBSITE/EXTERNAL/DATASTATISTICS/0,,contentMDK:20535285~menuPK:1192694~pagePK:64133150~piPK:64133175~theSitePK:239419,00.html
30 World Cigarettes 1. The 2007 Survey. Volume 3 - Central & Eastern Europe. Suffolk, England: ERC Group Ltd; 2007.31 Euromonitor International. Tobacco-Russia. 2007. [cited June 19, 2007]; available from: www.portal.euromonitor.com.32 Economist Intelligence Unit. Worldwide Cost of Living Survey. 2007. [cited August 1, 2007]; available from:
http://eiu.enumerate.com/asp/wcol_HelpWhatIsWCOL.asp.33 Gilmore A, Pomerleau J, Mckee M, et al. Prevalence of smoking in 8 countries of the former Soviet Union: Results from the living
conditions, lifestyles and health study. Am J Public Health. 2004;94:2177-2187.34 Bobak M, Gilmore A, McKee M, Rose R, Marmot M. Changes in smoking prevalence in Russia, 1996-2004. Tob Control. 2006;15:131-
135.35 Economist Intelligence Unit. Worldwide Cost of Living Survey: What is the EIU Worldwide Cost of Living Survey? How is the survey used?
2007. [cited August 1, 2007]; available from: http://eiu.enumerate.com/asp/wcol_HelpWhatIsWCOL.asp#howisthesurveyused.36 Rosstat. 2006. [cited July 31, 2007]; available from: http://www.gks.ru/wps/portal/english.
Ross-Russia-forPrint-Final_A.qxd:Ross-Russia-forPrint-Final.qxd 9/30/08 4:24 PM Page 8
Hana Zarubova Ross, Samina Shariff, Anna Gilmore 9|
III. Demand for Tobacco Productsand Tobacco Tax Policy
Tobacco Use Prevalence and Intensity, andType of Tobacco Products Consumed
In most countries, a smoking epidemic develops
in four stages. It starts in relatively small pockets of
male members of a population, and then gains
momentum by diffusing to other parts of the male
population. In the third stage, female smoking
prevalence increases, and eventually smoking
prevalence in both genders recedes in the fourth
stage.37,38 However, it appears that Russia’s tobacco
epidemic may have developed differently from the
standard model.1,33 Historical data on male smoking
and tobacco-related mortality rates suggest that
smoking among men has been at a high level for some
time and, contrary to the predictions of the four-stage
model just described, has failed to exhibit a post-peak
decline.33 Smoking prevalence among Russian men has
been greater than 50 percent since the late 1970s,
consistent with their high lung cancer mortality rates,5
and more than 60 percent in all surveys conducted
since the mid-1990s.1,33,34 Moreover, analysis of
longitudinal data from the RLMS shows a significant
increase in male smoking rates from 57.4 percent (56.0
to 58.8 percent)* in 1992 to 62.6 percent (61.1 to 64.1
percent)* in 2003.1
Smoking among women has risen later than
would be expected given the male rates and trends
observed in the West.33 Female smoking rates began to
increase only in the mid- to late 1990s after the entry of
transnational tobacco companies (TTCs). The RLMS
data indicate that female smoking prevalence has more
than doubled, from 6.9 percent in 1992 to 14.8 percent
in 2003 (Table 3.1). The increasing trend in female
smoking prevalence has also been suggested by
previous cross-sectional surveys showing significantly
higher rates of smoking in the youngest age groups as
compared to the oldest age groups of women,33 and by
the falling age of smoking initiation in successive birth
cohorts.1 The mean age of smoking initiation for
women in the 1920 to 1929 birth cohort was 28.6 years,
while for women in the 1970 to 1979 birth cohort it was
16.8 years. For men, the age at initiation has been
stable over time, between 15 and 18 years of age.1
Traditionally, female smoking prevalence in
urban areas, which tend to be more liberal and
influenced by Western culture, has been higher than in
rural areas, where social norms against female
smoking prevail and where tobacco promotions have
been less ubiquitous.1,33,34,39 Recently, however, this gap
has narrowed due to an increase in smoking in rural
areas. The RLMS from 1996 found that female
smoking in large cities was up to five times more
common than female smoking in rural areas.40
The Levada Institute survey, despite having a
relatively smaller sample size, supports a similar
conclusion. It estimated that in 1996, women in
Moscow smoked almost four times as much as women
in villages.34 By 2004, this ratio fell to only 1.5, and
smoking prevalence among women living in villages
increased from 8 percent in 1996 to 14 percent in
2004.34 In addition, the RLMS recorded a three-fold
increase in smoking prevalence among rural women
between 1992 and 2003.1
Some of the apparent increase in smoking
prevalence among women might be attributable to
changes in the social acceptability of female smoking
... smoking among men in Russia has been
at a high level for some time and, contrary
to the predictions of the four-stage model,
has failed to exhibit a post-peak decline.
* 95% confidence interval.
Ross-Russia-forPrint-Final_A.qxd:Ross-Russia-forPrint-Final.qxd 9/30/08 4:24 PM Page 9
10 Economics of Tobacco Taxation in Russia|
conducted by the Russian Cancer Research Center in
2002–2003 revealed that 66 percent of male doctors,
21 percent of female doctors, and 34 percent of nurses
in Russia are current or former smokers.7 Of the
doctors who smoked, only 38 percent were advising
their patients to quit, compared with 58 percent of
doctors who had never smoked. In addition, an
understanding of tobacco’s harmful health effects
seems to be limited given that less than 10 percent of
doctors demonstrated a familiarity with the harm
caused by tobacco use.7
Anecdotal evidence points to an extremely high
smoking prevalence among the Russian military.
Military service is still mandatory in Russia, and all
soldiers are given cigarettes for free as part of their
rations.
Youth smoking prevalence in Russia is the highest
among eastern European countries. The Health
and greater accuracy in the reporting of smoking data
about women, in contrast to the underreporting of
earlier years. For example, a 1992 survey in one district
of Russia suggested a smoking prevalence of 10 percent
among females between 25 and 64 years of age, but
cotinine analyses that objectively measure exposure to
inhaled cigarette smoke revealed a prevalence of 21
percent among this age group.41 Nevertheless, much of
the increase in female smoking rates is likely to be real.
Particularly alarming is the high smoking
prevalence among health care professionals. A survey
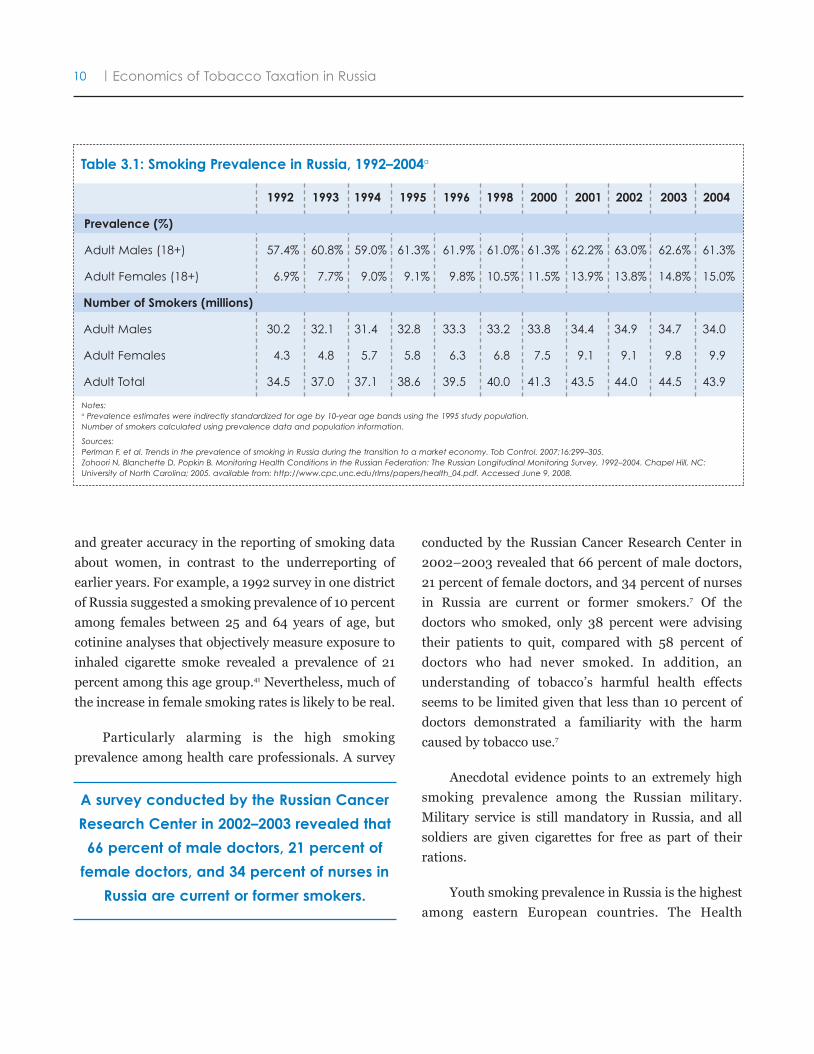
Table 3.1: Smoking Prevalence in Russia, 1992–2004a
Notes:a Prevalence estimates were indirectly standardized for age by 10-year age bands using the 1995 study population.Number of smokers calculated using prevalence data and population information.
Sources:Perlman F, et al. Trends in the prevalence of smoking in Russia during the transition to a market economy. Tob Control. 2007;16:299–305.Zohoori N, Blanchette D, Popkin B. Monitoring Health Conditions in the Russian Federation: The Russian Longitudinal Monitoring Survey, 1992–2004. Chapel Hill, NC:University of North Carolina; 2005. available from: http://www.cpc.unc.edu/rlms/papers/health_04.pdf. Accessed June 9, 2008.
1992 1993 1994 1995 1996 1998 2000 2001 2002 2003 2004
Prevalence (%)
Adult Males (18+) 57.4% 60.8% 59.0% 61.3% 61.9% 61.0% 61.3% 62.2% 63.0% 62.6% 61.3%
Adult Females (18+) 6.9% 7.7% 9.0% 9.1% 9.8% 10.5% 11.5% 13.9% 13.8% 14.8% 15.0%
Number of Smokers (millions)
Adult Males 30.2 32.1 31.4 32.8 33.3 33.2 33.8 34.4 34.9 34.7 34.0
Adult Females 4.3 4.8 5.7 5.8 6.3 6.8 7.5 9.1 9.1 9.8 9.9
Adult Total 34.5 37.0 37.1 38.6 39.5 40.0 41.3 43.5 44.0 44.5 43.9
A survey conducted by the Russian Cancer
Research Center in 2002–2003 revealed that
66 percent of male doctors, 21 percent of
female doctors, and 34 percent of nurses in
Russia are current or former smokers.
Ross-Russia-forPrint-Final_A.qxd:Ross-Russia-forPrint-Final.qxd 9/30/08 4:24 PM Page 10
Hana Zarubova Ross, Samina Shariff, Anna Gilmore 11|
Behavior in School-aged Children (HBSC) survey
conducted in 1997–1998 showed that 24 percent of
males and 22 percent of females 15 years of age in
Russia smoked.42 The Global Youth Tobacco Survey
(GYTS) conducted in Moscow in 1999 found that
37 percent of male and 28 percent of female high
school students (grades 7 through 10) smoked.43 The
2004 GYTS for Russia, all regions combined, showed
that 25.4 percent of males and 20.9 percent of females
in grades 7 through 9 smoked cigarettes.44 The most
recent 2006 data from the central European part of the
Russian Federation indicate that 47 percent of males
and 36 percent of females between 18 and 19 years of
age smoked.4
Among men, inequalities in smoking habits are
long established, with smoking more common among
those with lower levels of education than those with
higher ones. According to the 2006 data fromMoscow,
smoking prevalence was 64.7 percent among men with
low education and 48.5 percent among men with high
education.4 The same pattern has long been seen
throughout the country in national surveys of smoking
habits.39,45 Among women, the gap in smoking
prevalence by level of education is increasing over
time, and although the rise in smoking prevalence
between 1992 and 2003 was seen across all
educational groups, it was greatest among the least
educated.1 This trend results in growing inequalities in
smoking-related health and economic burden, with the
impact being disproportionately inflicted upon those
who can least afford it.
Per capita cigarette consumption in Russia is
quite high, particularly among male smokers.
According to the RLMS, the average daily consumption
among men from 1992 to 2004 was 16 cigarettes.10 In
2000, adult male and female smokers consumed an
average of 16.6 and 9.2 cigarettes per day,
respectively.46 Even though the average daily cigarette
consumption among women and teenagers is lower
than that of men, it is increasing: Between 1992 and
2004, daily consumption increased from 8.1 to 11
cigarettes per day for adult women and from 7.8 to 9.4
cigarettes per day for teens.10
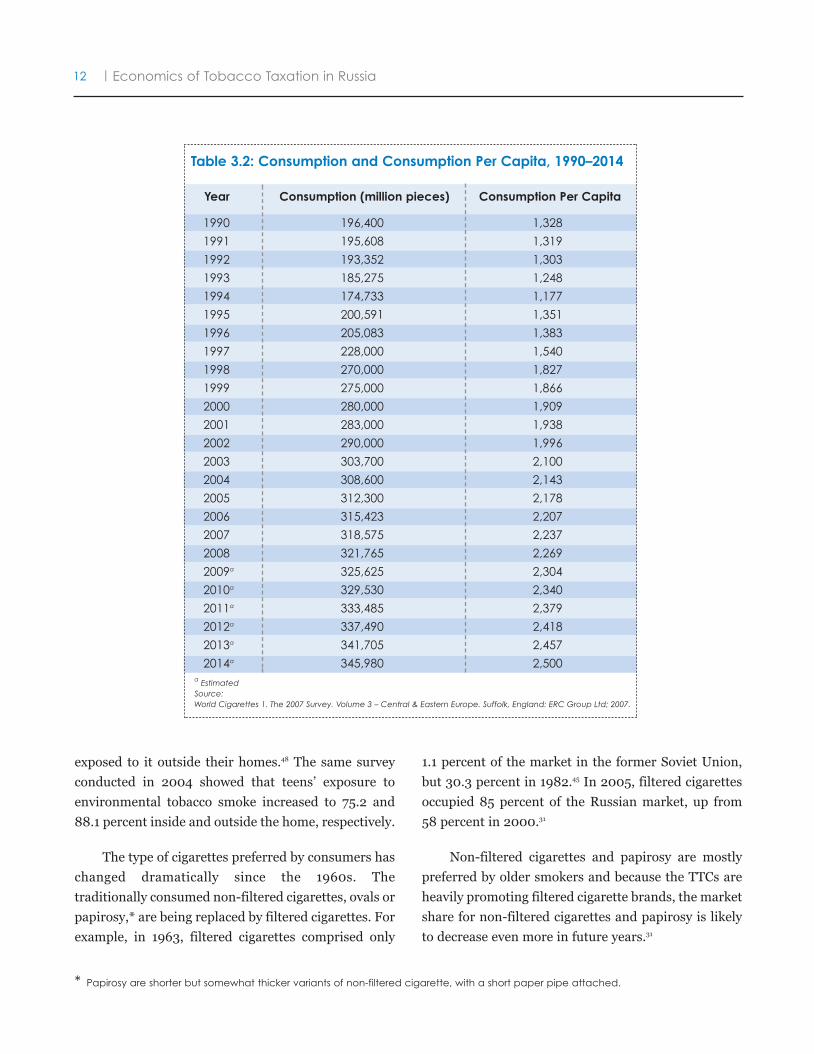
The increasing smoking prevalence and smoking
intensity are reflected in per capita consumption. Table
3.2 shows how both total consumption, which is based
on trade statistics and manufacturer estimates, and the
derived per capita consumption have increased in
Russia since the mid-1990s. In 2006, the per capita
consumption was 2,207 cigarettes or approximately
110 packs per person annually,2 a 66 percent increase
since 1990. By comparison, per capita cigarette
consumption in the United Kingdom in 2006 was 826
cigarettes or 41 packs per person annually.47 Market
analysts estimate that per capita consumption will
reach 2,500 cigarettes or 125 packs annually per
person by 2014.2
Given the high smoking prevalence, high per
capita cigarette consumption, and the widespread
social acceptability of smoking, one can expect in
Russia a high level of exposure to secondhand smoke.
The GYTS data for 1999 showed that 55.3 percent of
teens aged 13 to 15 were exposed to secondhand smoke
inside their homes, and 72.5 percent of teens were
The most recent 2006 data from the central
European part of the Russian Federation
indicate that 47 percent of males and
36 percent of females between 18 and 19
years of age smoked.
In 2006, the per capita consumption
was 2,207 cigarettes or approximately 110
packs per person annually, a 66 percent
increase since 1990.
Ross-Russia-forPrint-Final_A.qxd:Ross-Russia-forPrint-Final.qxd 9/30/08 4:24 PM Page 11
12 Economics of Tobacco Taxation in Russia|
Table 3.2: Consumption and Consumption Per Capita, 1990–2014
a EstimatedSource:World Cigarettes 1. The 2007 Survey. Volume 3 – Central & Eastern Europe. Suffolk, England: ERC Group Ltd; 2007.
Year Consumption (million pieces) Consumption Per Capita
1990 196,400 1,328
1991 195,608 1,319
1992 193,352 1,303
1993 185,275 1,248
1994 174,733 1,177
1995 200,591 1,351
1996 205,083 1,383
1997 228,000 1,540
1998 270,000 1,827
1999 275,000 1,866
2000 280,000 1,909
2001 283,000 1,938
2002 290,000 1,996
2003 303,700 2,100
2004 308,600 2,143
2005 312,300 2,178
2006 315,423 2,207
2007 318,575 2,237
2008 321,765 2,269
2009a 325,625 2,304
2010a 329,530 2,340
2011a 333,485 2,379
2012a 337,490 2,418
2013a 341,705 2,457
2014a 345,980 2,500
exposed to it outside their homes.48 The same survey
conducted in 2004 showed that teens’ exposure to
environmental tobacco smoke increased to 75.2 and
88.1 percent inside and outside the home, respectively.
The type of cigarettes preferred by consumers has
changed dramatically since the 1960s. The
traditionally consumed non-filtered cigarettes, ovals or
papirosy,* are being replaced by filtered cigarettes. For
example, in 1963, filtered cigarettes comprised only
1.1 percent of the market in the former Soviet Union,
but 30.3 percent in 1982.45 In 2005, filtered cigarettes
occupied 85 percent of the Russian market, up from
58 percent in 2000.31
Non-filtered cigarettes and papirosy are mostly
preferred by older smokers and because the TTCs are
heavily promoting filtered cigarette brands, the market
share for non-filtered cigarettes and papirosy is likely
to decrease even more in future years.31
* Papirosy are shorter but somewhat thicker variants of non-filtered cigarette, with a short paper pipe attached.
Ross-Russia-forPrint-Final_A.qxd:Ross-Russia-forPrint-Final.qxd 9/30/08 4:24 PM Page 12
Hana Zarubova Ross, Samina Shariff, Anna Gilmore 13|
wanted to quit, compared to more than 60 percent of
the smokers living in the neighboring North Karelia in
Finland, where several anti-smoking activities were
carried out in the 1980s.41 However, there were fewer
cessation attempts in Russia, where 62 percent of male
smokers and 56 percent of female smokers never
attempted to quit, compared to 35 percent of male
smokers and 34 percent of female smokers who never
attempted to quit in Finland.41 As a result, there is a
very small percentage of the population in Russia that
has quit smoking. The 1998 RLMS data report that
about 19 percent of men and 6 percent of women in the
adult population over 18 years of age are former
smokers.40 In the United Kingdom, by comparison, the
prevalence of ex-smokers among men in the year 2000
was about 30 percent.51
Price and Affordability of Cigarettes, and PriceElasticity
The Russian cigarette market is characterized by a
large range of cigarette prices where consumers can
choose among three main price categories: high (or
premium), middle (or mid-priced) and low (or
economy). In 2007, cigarettes that cost at least RUB 30
per pack (US$ 1.10) were classified as high-priced,
those that cost between RUB 10 and RUB 29 per pack
(US$ 0.37 to US$ 1.10) as mid-priced, while those that
cost RUB 9 (US$ 0.33) or less per pack were
considered low-priced cigarettes.31 According to the
Rosstat, average prices for filtered cigarettes in 2006
ranged from RUB 10 (US$ 0.37) to RUB 36 (US$ 1.33)
per pack, and the average price for non-filtered
cigarettes was RUB 3.89 (US$ 0.14) per pack.36
Cigarette prices throughout Russia vary by region
(Annex 1).52 A study based on the price modules of the
Premium cigarette brands and “low-tar”
cigarettes were the fastest-growing segments of the
Russian cigarette market between 2004 and 2005.31
The preference for these brands has increased even in
rural areas, which have experienced strong economic
growth accompanied by growing purchasing power.49
Slim cigarettes are popular among women but are now
also being marketed to men.31 The present-day rising
demand for “light,” “ultra-light,” and “super-slim”
cigarettes reflects the marketing strategies of the
international tobacco companies in Russia.50
In addition to cigarettes, other forms of tobacco
such as cigars, loose tobacco, water pipes, snus, and
chewing tobacco are gaining popularity.31 The most
affluent tobacco users regard these products as
indications of wealth and prosperity. The recent
appearance of special smoking clubs and saloons is
expected to contribute to a growing interest in pipes
and roll-your-own (RYO) cigarettes.31 RYO tobacco is
perceived as an alternative to manufactured cigarettes,
even though it occupies only a relatively small share of
the market (about 2 percent in 200031), partly the
result of tax treatment that makes smoking RYO
tobacco more expensive than buying manufactured
cigarettes.31
The prevalence of former smokers is often used as
an indication of successful tobacco control policy. This
dynamic is well-illustrated in a Russian and a
neighboring Finnish community with divergent
tobacco control policies. In 1992, more than 70 percent
of daily smokers in the Russian Republic of Karelia
Premium cigarette brands and “low-tar”
cigarettes were the fastest-growing
segments of the Russian cigarette market
between 2004 and 2005.
... there is a very small percentage of the
population in Russia that has quit smoking.
Ross-Russia-forPrint-Final_A.qxd:Ross-Russia-forPrint-Final.qxd 9/30/08 4:24 PM Page 13
14 Economics of Tobacco Taxation in Russia|
RLMS community surveys40 confirms regional
differences in cigarette prices, which have been
attributed to varying transportation costs, market
imperfections,53 and regional differences in income
levels.54 These differences are likely to diminish, as the
new 2007 tax law requires the maximum retail prices
to be printed on the cigarette packs.
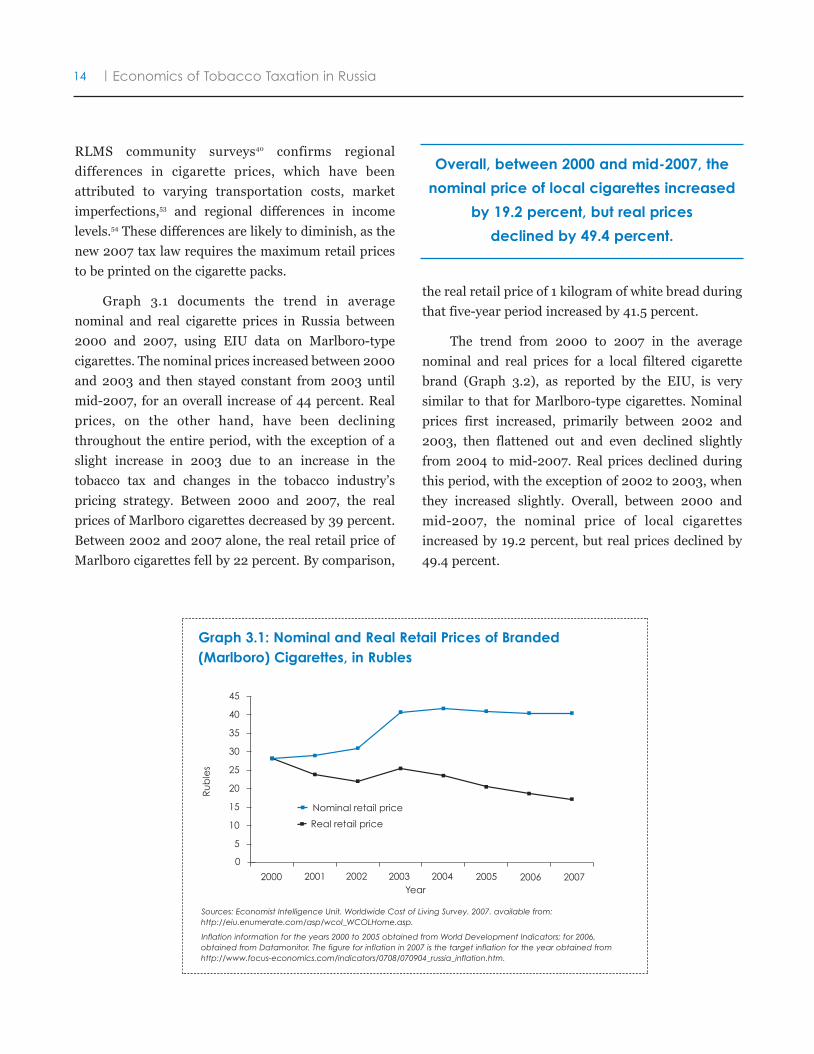
Graph 3.1 documents the trend in average
nominal and real cigarette prices in Russia between
2000 and 2007, using EIU data on Marlboro-type
cigarettes. The nominal prices increased between 2000
and 2003 and then stayed constant from 2003 until
mid-2007, for an overall increase of 44 percent. Real
prices, on the other hand, have been declining
throughout the entire period, with the exception of a
slight increase in 2003 due to an increase in the
tobacco tax and changes in the tobacco industry’s
pricing strategy. Between 2000 and 2007, the real
prices of Marlboro cigarettes decreased by 39 percent.
Between 2002 and 2007 alone, the real retail price of
Marlboro cigarettes fell by 22 percent. By comparison,
the real retail price of 1 kilogram of white bread during
that five-year period increased by 41.5 percent.
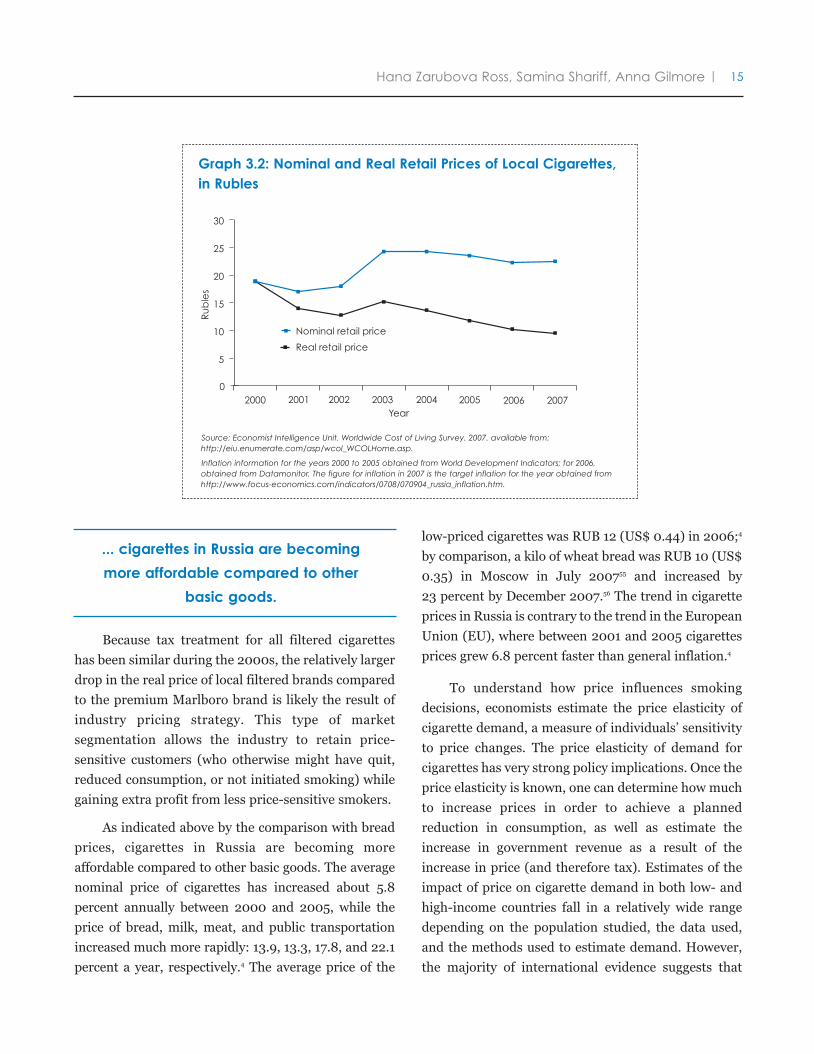
The trend from 2000 to 2007 in the average
nominal and real prices for a local filtered cigarette
brand (Graph 3.2), as reported by the EIU, is very
similar to that for Marlboro-type cigarettes. Nominal
prices first increased, primarily between 2002 and
2003, then flattened out and even declined slightly
from 2004 to mid-2007. Real prices declined during
this period, with the exception of 2002 to 2003, when
they increased slightly. Overall, between 2000 and
mid-2007, the nominal price of local cigarettes
increased by 19.2 percent, but real prices declined by
49.4 percent.
Overall, between 2000 and mid-2007, the
nominal price of local cigarettes increased
by 19.2 percent, but real prices
declined by 49.4 percent.
0
5
10
15
20
25
30
35
40
45
Nominal retail price
Real retail price
Ru
ble
s
2000 2001 2002 20042003 2005 2006 2007Year
Graph 3.1: Nominal and Real Retail Prices of Branded(Marlboro) Cigarettes, in Rubles
Sources: Economist Intelligence Unit. Worldwide Cost of Living Survey. 2007. available from:http://eiu.enumerate.com/asp/wcol_WCOLHome.asp.
Inflation information for the years 2000 to 2005 obtained from World Development Indicators; for 2006,obtained from Datamonitor. The figure for inflation in 2007 is the target inflation for the year obtained fromhttp://www.focus-economics.com/indicators/0708/070904_russia_inflation.htm.
Ross-Russia-forPrint-Final_A.qxd:Ross-Russia-forPrint-Final.qxd 9/30/08 4:24 PM Page 14
Hana Zarubova Ross, Samina Shariff, Anna Gilmore 15|
Because tax treatment for all filtered cigarettes
has been similar during the 2000s, the relatively larger
drop in the real price of local filtered brands compared
to the premium Marlboro brand is likely the result of
industry pricing strategy. This type of market
segmentation allows the industry to retain price-
sensitive customers (who otherwise might have quit,
reduced consumption, or not initiated smoking) while
gaining extra profit from less price-sensitive smokers.
As indicated above by the comparison with bread
prices, cigarettes in Russia are becoming more
affordable compared to other basic goods. The average
nominal price of cigarettes has increased about 5.8
percent annually between 2000 and 2005, while the
price of bread, milk, meat, and public transportation
increased much more rapidly: 13.9, 13.3, 17.8, and 22.1
percent a year, respectively.4 The average price of the
low-priced cigarettes was RUB 12 (US$ 0.44) in 2006;4
by comparison, a kilo of wheat bread was RUB 10 (US$
0.35) in Moscow in July 200755 and increased by
23 percent by December 2007.56 The trend in cigarette
prices in Russia is contrary to the trend in the European
Union (EU), where between 2001 and 2005 cigarettes
prices grew 6.8 percent faster than general inflation.4
To understand how price influences smoking
decisions, economists estimate the price elasticity of
cigarette demand, a measure of individuals’ sensitivity
to price changes. The price elasticity of demand for
cigarettes has very strong policy implications. Once the
price elasticity is known, one can determine how much
to increase prices in order to achieve a planned
reduction in consumption, as well as estimate the
increase in government revenue as a result of the
increase in price (and therefore tax). Estimates of the
impact of price on cigarette demand in both low- and
high-income countries fall in a relatively wide range
depending on the population studied, the data used,
and the methods used to estimate demand. However,
the majority of international evidence suggests that
... cigarettes in Russia are becoming
more affordable compared to other
basic goods.
0
5
10
15
20
25
30
Nominal retail price
Real retail price
Ru
ble
s
2000 2001 2002 20042003 2005 2006 2007Year
Graph 3.2: Nominal and Real Retail Prices of Local Cigarettes,in Rubles
Source: Economist Intelligence Unit. Worldwide Cost of Living Survey. 2007. available from:http://eiu.enumerate.com/asp/wcol_WCOLHome.asp.
Inflation information for the years 2000 to 2005 obtained from World Development Indicators; for 2006,obtained from Datamonitor. The figure for inflation in 2007 is the target inflation for the year obtained fromhttp://www.focus-economics.com/indicators/0708/070904_russia_inflation.htm.
Ross-Russia-forPrint-Final_A.qxd:Ross-Russia-forPrint-Final.qxd 9/30/08 4:24 PM Page 15
16 Economics of Tobacco Taxation in Russia|
respectively. This behavior was related to women’s
preference for more expensive cigarettes. The study
suggested that low price elasticity was also related to
cigarette price levels, as the price elasticity of
participation was higher in 1998 (–0.120 for males,
and –0.919 for females), when the real prices of
cigarettes reached 180 percent of 1996 prices.
In other analyses, price generally had a negative
effect on both smoking participation and smoking
intensity, but the magnitude of the impact was again
relatively small. Lance et al. (2004)53 used three waves
of RLMS data (1996, 1998, and 2000) to estimate the
demand for cigarettes among men. They controlled for
wealth (using the household wealth index based on
ownership of assets and dwelling characteristics), age,
education, household size, and community-level prices
(adjusted for inflation). In addition to pooled cross-
sectional data, separate models included regional and
community-level fixed effects. The study took
advantage of the real increase in cigarette prices
between 1996 and 1998, and their real decrease
between 1998 and 2000 as measured by the price for
the cheapest domestic cigarette brand collected by the
RLMS. In Lance’s models, the price elasticity of
smoking participation fell between –0.106 and
–0.050, and the price elasticity of cigarette
consumption ranged from –0.026 to 0. The total price
elasticity for the male sample was between –0.132 for
the pooled sample and –0.050 for the fixed-effect
models. Similar results were found using a cigarette
price measure based on household cigarette
expenditures and the quantity of cigarettes purchased.
Young people (aged 13 to 19) were found to be much
more price sensitive (exhibiting a total price elasticity
equal to –0.345) than middle-aged men (aged 25 to 54)
(with a total price elasticity equal to –0.072). The same
study found that the total price elasticity in Russia
increased with wealth and that the effect of wealth on
smoking participation was negative and significant. The
authors speculated that the relatively low level of price
responsiveness was related to the high level of addiction
a 10 percent increase in cigarette prices would result in
a 2.5 to 5 percent reduction in cigarette demand (a
price elasticity of –0.25 to –0.5).20
Very few studies of price and income elasticities of
tobacco demand in Russia exist. Those available in the
literature use micro-level survey data as opposed to
time series macro-level data. The use of macro-level
data suffers from inconsistencies arising from changes
in data collection methods after the collapse of the
Soviet Union. In addition, the Russian economy in
1998 underwent a major macro-level disruption,
including a currency overhaul. Furthermore, macro-
level data cannot explain the price responsiveness of
various demographic subgroups (e.g. female and
youth) and do not capture the impact of illicit trade.
The few extant micro-level analyses of Russian
data reported very little price responsiveness among
Russian males with respect to cigarette demand.
Oglobin and Brock40 used 1996 and 1998 waves of the
RLMS, including its community price modules, and
found that the decision to smoke among males was
hardly affected by variations in price. (Price elasticity
was –0.085, meaning that a 10-percent increase in
price would reduce consumption by 0.85 percent.)
Similarly, variation in income had little effect: Income
elasticity was –0.007, meaning that a 10-percent
increase in income would reduce consumption by 0.07
percent. Oglobin and Brock explained this finding by
Russian men’s tendency to smoke cheap, low-quality
cigarettes, spending only a small fraction of income to
finance their habit. Among women, price and income
elasticities of the probability of smoking were
estimated to be higher, –0.628 and +0.047,
... the relatively low level of price
responsiveness is related to the high level of
addiction among Russian male smokers and
the minimal public health effort in Russia to
decrease smoking.
Ross-Russia-forPrint-Final_A.qxd:Ross-Russia-forPrint-Final.qxd 9/30/08 4:24 PM Page 16
Hana Zarubova Ross, Samina Shariff, Anna Gilmore 17|
among Russian male smokers and the minimal public
health effort in Russia to decrease smoking. This
context, combined with the high level of social
acceptability of smoking, contributed to the relatively
low price elasticity of cigarette demand in Russia.
Macro-level data on product preferences support
the hypothesis that the magnitude of price sensitivity
in Russia is affected by the wide range of price choices.
As reported above, consumers can choose among three
main price categories: high, middle, and low. In early
1998, sales in these three price categories represented
20, 30, and 50 percent of total sales, respectively. The
macro-economic shock following the events of 1998
substantially changed consumers’ preferences
concerning these price categories. In 2000, 10 percent
of the market consisted of high-priced brands; 15
percent, middle-priced brands; and 75 percent, low-
priced brands. Once the country’s economic recovery
began in 2001, consumers responded by switching to
more expensive cigarettes. In 2002, high-, middle- and
low-priced cigarettes composed 23, 55, and 22 percent
of sales, respectively;30 by 2006, high-, middle-, and
low priced cigarettes represented 31, 49, and 20
percent of sales, respectively.4
The trend in preference shifting toward high-
priced cigarettes is expected to continue, owing to the
increasing purchasing power of the population since
1998,31 the relative decrease in cigarette prices,31 and
marketing efforts by tobacco companies.57 In 2006,
10.3 percent of cigarette sales were at prices higher
than those for Marlboro cigarettes, which belong to the
high-priced cigarette category. By mid-2007, Russia
had the highest penetration of premium brands in all
of Europe,50 suggesting the high affordability of
cigarettes in Russia. This trend is aligned with the
TTC’s interest: A British American Tobacco (BAT)
marketing presentation given in 2006, for example,
estimated that shifting 1 billion cigarettes from the
low- to the premium-price bracket would provide an
extra US$ 36.9 million in sales revenue.58
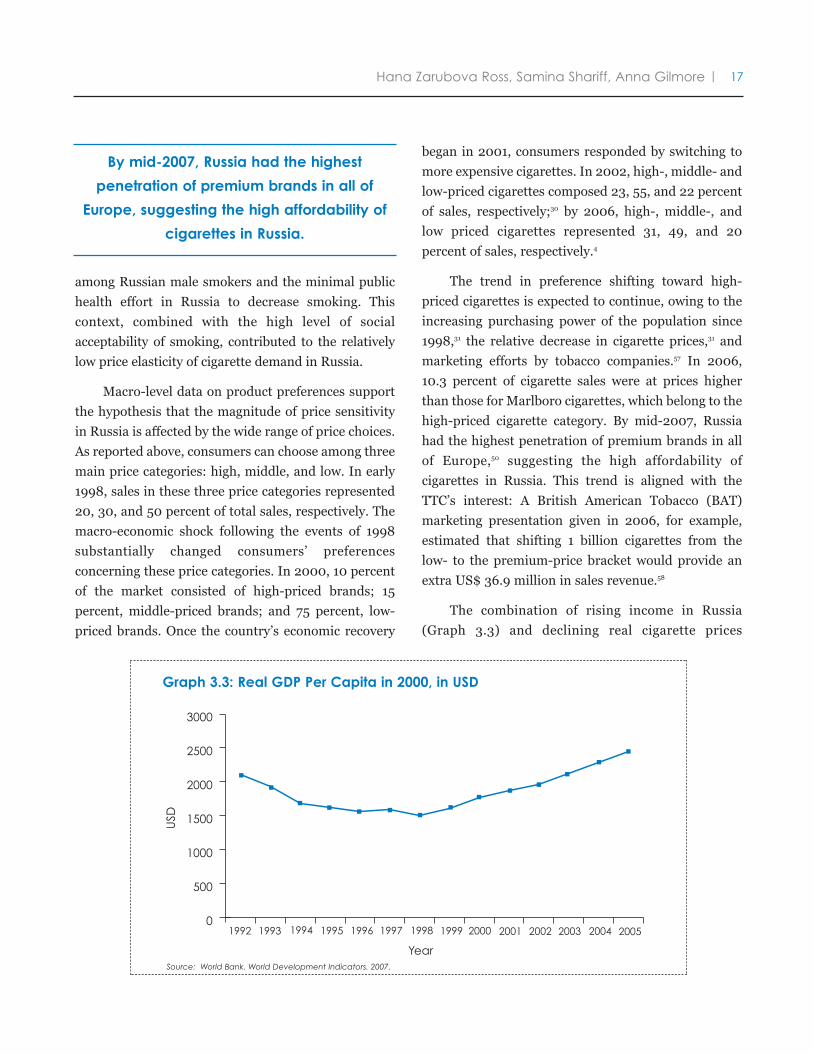
The combination of rising income in Russia
(Graph 3.3) and declining real cigarette prices
By mid-2007, Russia had the highest
penetration of premium brands in all of
Europe, suggesting the high affordability of
cigarettes in Russia.
Graph 3.3: Real GDP Per Capita in 2000, in USD
Source: World Bank. World Development Indicators. 2007.
2000 2001 2002 20042003 2005
Year
0
500
1000
1500
2000
2500
3000
1994 1995 1996 19981997 19991992 1993
USD
Ross-Russia-forPrint-Final_A.qxd:Ross-Russia-forPrint-Final.qxd 9/30/08 4:24 PM Page 17
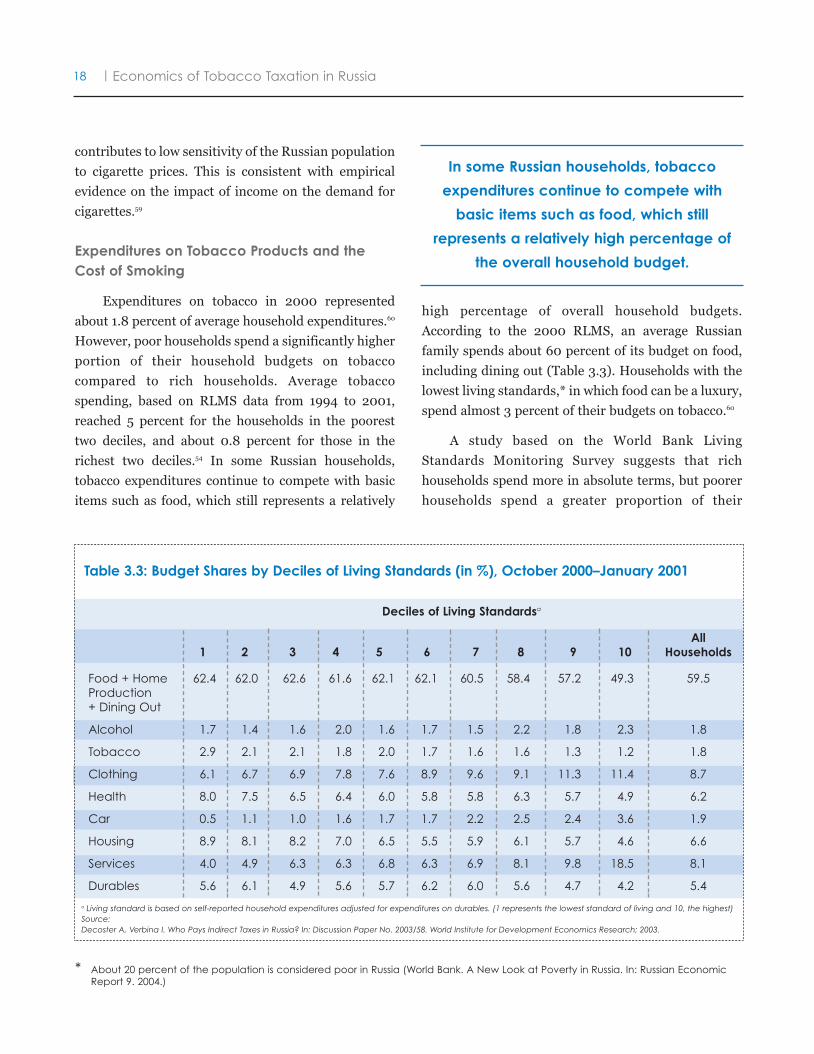
Table 3.3: Budget Shares by Deciles of Living Standards (in %), October 2000–January 2001
a Living standard is based on self-reported household expenditures adjusted for expenditures on durables. (1 represents the lowest standard of living and 10, the highest)Source:Decoster A, Verbina I. Who Pays Indirect Taxes in Russia? In: Discussion Paper No. 2003/58. World Institute for Development Economics Research; 2003.
Deciles of Living Standardsa
All1 2 3 4 5 6 7 8 9 10 Households
Food + Home 62.4 62.0 62.6 61.6 62.1 62.1 60.5 58.4 57.2 49.3 59.5Production+ Dining Out
Alcohol 1.7 1.4 1.6 2.0 1.6 1.7 1.5 2.2 1.8 2.3 1.8
Tobacco 2.9 2.1 2.1 1.8 2.0 1.7 1.6 1.6 1.3 1.2 1.8
Clothing 6.1 6.7 6.9 7.8 7.6 8.9 9.6 9.1 11.3 11.4 8.7
Health 8.0 7.5 6.5 6.4 6.0 5.8 5.8 6.3 5.7 4.9 6.2
Car 0.5 1.1 1.0 1.6 1.7 1.7 2.2 2.5 2.4 3.6 1.9
Housing 8.9 8.1 8.2 7.0 6.5 5.5 5.9 6.1 5.7 4.6 6.6
Services 4.0 4.9 6.3 6.3 6.8 6.3 6.9 8.1 9.8 18.5 8.1
Durables 5.6 6.1 4.9 5.6 5.7 6.2 6.0 5.6 4.7 4.2 5.4
18 Economics of Tobacco Taxation in Russia|
contributes to low sensitivity of the Russian population
to cigarette prices. This is consistent with empirical
evidence on the impact of income on the demand for
cigarettes.59
Expenditures on Tobacco Products and theCost of Smoking
Expenditures on tobacco in 2000 represented
about 1.8 percent of average household expenditures.60
However, poor households spend a significantly higher
portion of their household budgets on tobacco
compared to rich households. Average tobacco
spending, based on RLMS data from 1994 to 2001,
reached 5 percent for the households in the poorest
two deciles, and about 0.8 percent for those in the
richest two deciles.54 In some Russian households,
tobacco expenditures continue to compete with basic
items such as food, which still represents a relatively
high percentage of overall household budgets.
According to the 2000 RLMS, an average Russian
family spends about 60 percent of its budget on food,
including dining out (Table 3.3). Households with the
lowest living standards,* in which food can be a luxury,
spend almost 3 percent of their budgets on tobacco.60
A study based on the World Bank Living
Standards Monitoring Survey suggests that rich
households spend more in absolute terms, but poorer
households spend a greater proportion of their
* About 20 percent of the population is considered poor in Russia (World Bank. A New Look at Poverty in Russia. In: Russian EconomicReport 9. 2004.)
In some Russian households, tobacco
expenditures continue to compete with
basic items such as food, which still
represents a relatively high percentage of
the overall household budget.
Ross-Russia-forPrint-Final_A.qxd:Ross-Russia-forPrint-Final.qxd 9/30/08 4:24 PM Page 18
Hana Zarubova Ross, Samina Shariff, Anna Gilmore 19|
expenditures on tobacco.61 Further, the research found
that households that spend more on tobacco are likely
to also spend more on alcohol.61 At the same time, the
quality and price of tobacco products bought differs by
income,60 evidence that consumers in Russia are
sensitive to the prices of cigarettes.
With cigarette prices falling, the relative share of
tobacco expenditures in an average household budget
has declined over time. Rosstat reports that in the year
2000, tobacco expenditures represented 1.2 percent of
total household expenditures, but by 2005, this share
dropped to 0.8 percent.4 Corroborating data shows
that low-income families spent between 2 to 3 percent
of their budgets on tobacco products in 2000, as
opposed to the 1994 to 2001 average of 5 percent.60
The relative decline in the proportion of Russian
household budgets spent on tobacco can be attributed to
two trends: a drop in real cigarette prices and an increase
in income. The European Bank for Reconstruction and
Development estimates that wages in Russia are
increasing by 12 to 15 percent a year, in real terms.62
As a whole, Russians spent about RUB 83.4 billion
(US$ 2.9 billion),4 or 0.39 percent of their GDP, on
cigarettes in 2005. This amount represents the
opportunity cost of smoking, as these resources could
have been used for other products, services, or
investments.
In addition to the opportunity costs of cigarette
purchases, tobacco-related diseases represent a much
larger threat to household welfare due to loss of income
and out-of-pocket expenditures related to medical care.
The World Bank estimates that the treatment of
cardiovascular and respiratory diseases primarily
associated with tobacco consumption represent about
34 percent of all health care expenditures in Russia.4
Chronic illnesses overall contribute toward an annual
per capita loss of 5.6 percent of income, which
negatively affects household budgets.10
Estimates of the total costs of smoking in Russia
do not exist, but two studies have estimated
productivity losses resulting from tobacco-related
premature deaths. The first study calculated the
productivity loss in 1999 to be US$ 4.44 billion.63
Using a different methodology, the second study
estimated the smoking-attributable productivity loss
to be US$ 364 million in 2000.6
Our estimate, based on research on productive
time loss conducted in other countries, points to an
even higher loss due to premature mortality. Most
studies conclude that each cigarette expends
approximately 10 minutes of life.64,65 Because the
average smoker in Russia consumes about 15 cigarettes
per day,* he or she loses 10.4 percent of a year (38
days) for every year smoked. An individual in Russia
earned on average US$ 450 per month in 2006 (US$
5,400 per year),31 which means that smoking cost each
smoker about US$ 562 in lost income in that one year
alone. Multiplying the lost income by the total number
of smokers (43.9 million) shows that at least US$ 24.7
billion (3.22 percent of GDP in 2005) was lost
nationwide in 2006, due to mortality-related
productivity losses alone.
The estimate of the share of GDP lost due to
smoking, given above, is conservative because the
* Weighted average based on male and female smoking intensities of 16 and 11 cigarettes per day, respectively.
... at least US$ 24.7 billion was lost
nationwide in 2006 due to mortality-
related productivity losses alone.
The World Bank estimates that the treatment
of cardiovascular and respiratory diseases
primarily associated with tobacco
consumption represent about 34 percent of
all health care expenditures in Russia.
Ross-Russia-forPrint-Final_A.qxd:Ross-Russia-forPrint-Final.qxd 9/30/08 4:24 PM Page 19
20 Economics of Tobacco Taxation in Russia|
calculations do not include smoking-related health
care costs, the loss of productivity from smoking-
related morbidity, and the costs associated with
secondhand smoke. These costs in Russia are yet to be
estimated.
Tobacco Tax Level and Tax Structure
The system of cigarette taxation in Russia has
undergone several changes since 1991. It is
characterized by the differential treatment of filtered
and non-filtered cigarettes, and since 1997, by the
presence of excise stamps.66
Excise taxes were extremely low in the 1990s. In
1998, these taxes amounted to RUB 6 (US$ 0.21) for
1,000 non-filtered and RUB 12 (US$ 0.42) for 1,000
filtered cigarettes (Annex 2). Beginning in 1999,
nominal tax rates began to increase incrementally.
In July 2001, the Ministry of Finance decreed that
tobacco manufacturers were living in “tax heaven.”67
This political statement presaged cigarette excise tax
reform in 2003 that increased the fixed (or specific) tax,
introduced a new ad valorem tax, and led to the only
significant increase in real cigarette prices in the 2000s
(Annex 2 and Graph 3.1 and 3.2). The 2003 ad valorem
rate of 5 percent was based on the wholesale/ex-factory
price, while the specific tax was set at RUB 50
(US$ 1.77) and RUB 19 (US$ 0.67) for filtered and non-
filtered cigarettes, respectively. Nominal cigarette
excise taxes increased by as much as 230 percent for
high-priced premium cigarette brands and by 146
percent for mid-priced cigarette brands (based on
cigarette prices reported by EIU). However, this
increase translated into an excise tax increase of only
about RUB 1.8 to RUB 1.2 per pack (US$ 0.06 to US$
0.04), depending on the cigarette price category.
Tobacco companies used the occasion of a tax increase
to raise their prices in addition to passing the tax
increase onto the consumers, as illustrated by EIU data
documenting an increase in the nominal prices for high-
priced Marlboro cigarettes and mid-priced domestic
brands by RUB 7 (US$ 0.25) and RUB 6 (US$ 0.21),
respectively, from September 2002 to March 2003.
This increase suggests that even tobacco companies
think that consumers are willing to pay higher cigarette
prices. A tax increase would in effect transform the
potential extra profit for tobacco companies into
additional revenue for the government budget.
The excise tax has increased every year since the
2003 tax reform, but because the hikes have been
lower than the double-digit rate of inflation, cigarettes
have become relatively cheaper over time. The excise
tax system was again redesigned in 2006 (with the
changes effective January 1, 2007) to tackle the
problem of manufacturer and distributor pricing
practices that had led to tobacco tax evasion.68 These
practices involved the industry selling cigarettes to
distributors for a considerably reduced price and then
using this discounted price as the basis for calculating
the ad valorem tax liability.31 Once the tax was collected,
the distributors would price cigarettes high and share
with the industry the extra profit from the now-
increased margin. The new 2007 excise tax system is
designed to eliminate this loophole: The new tax is
A tax increase would in effect
transform the potential extra profit for
tobacco companies into additional
revenue for the government budget.
The excise tax has increased every year
since the 2003 tax reform, but because the
hikes have been lower than the double-digit
rate of inflation, cigarettes have become
relatively cheaper over time.
Ross-Russia-forPrint-Final_A.qxd:Ross-Russia-forPrint-Final.qxd 9/30/08 4:24 PM Page 20
Hana Zarubova Ross, Samina Shariff, Anna Gilmore 21|
based on the maximum retail (rather than wholesale)
price* and the minimum excise tax rate. Thus, the ad
valorem component of the excise tax now depends on
the retail price indicated on the cigarette pack and
published by the Ministry of Finance based on the
input from tobacco companies. The sale of cigarettes
without the maximum retail price printed on the pack
is forbidden as of January 1, 2008, for filtered
cigarettes, and as of July 1, 2008, for non-filtered
cigarettes. Manufacturers are allowed to change their
maximum retail price once a month.69 The 2007 excise
tax was increased to RUB 100 (US$ 3.53) per 1,000
filtered cigarettes plus 5 percent of the maximum retail
price, with the total excise tax per 1,000 cigarettes
prohibited from falling below RUB 115 (US$ 4.06). The
2007 rate for non-filtered cigarettes was also raised to
RUB 45 (US$ 1.6) per 1,000 cigarettes plus 5 percent of
the maximum retail price, with the total excise tax per
1,000 cigarettes not allowed to fall below RUB 60
(US$ 2.1). The new tax regime is expected to reduce the
previously exorbitant profit of distributors and
retailers.68
Despite the tax increase in 2007 and general price
inflation, the retail prices of cigarettes as listed by the
manufacturers went down by 10 to 15 percent
compared to prices at the end of 2006.69 For example,
the price of Marlboro cigarettes that cost RUB 35
(US$ 1.23) at the end of 2006 was reduced to RUB 30
(US$ 1.06). Kent cigarettes that used to cost almost
RUB 42 (US$ 1.48) in 2006 dropped to RUB 35
(US$ 1.23) in 2007.69 This price decrease was made
possible by reducing distributors’ margins, as the
bargaining power shifted from distributors to
manufacturers, and by the lower profit margins
accepted by tobacco companies as a strategy to keep
cigarettes affordable as well as reduce their tax
liabilities. The 2007 tax reform had the greatest
Box 3.1: Types of Tobacco Taxes
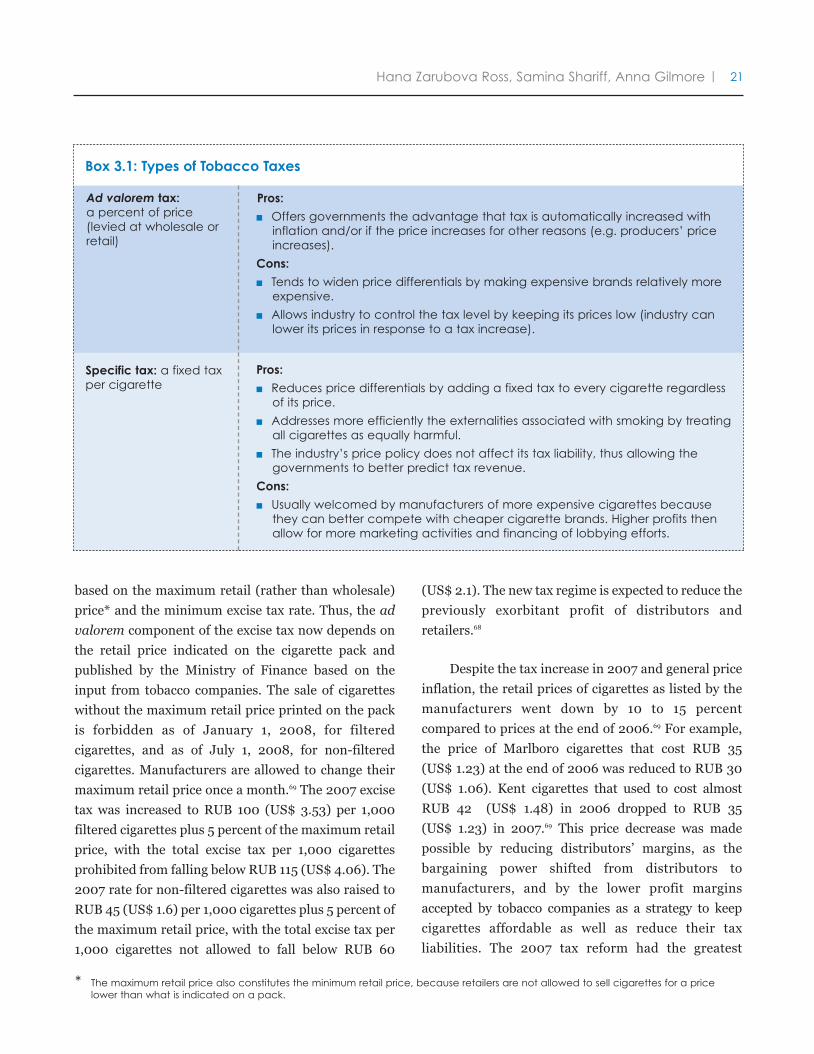
Pros:
� Offers governments the advantage that tax is automatically increased withinflation and/or if the price increases for other reasons (e.g. producers’ priceincreases).
Cons:
� Tends to widen price differentials by making expensive brands relatively moreexpensive.
� Allows industry to control the tax level by keeping its prices low (industry canlower its prices in response to a tax increase).
Pros:
� Reduces price differentials by adding a fixed tax to every cigarette regardlessof its price.
� Addresses more efficiently the externalities associated with smoking by treatingall cigarettes as equally harmful.
� The industry’s price policy does not affect its tax liability, thus allowing thegovernments to better predict tax revenue.
Cons:
� Usually welcomed by manufacturers of more expensive cigarettes becausethey can better compete with cheaper cigarette brands. Higher profits thenallow for more marketing activities and financing of lobbying efforts.
Ad valorem tax:a percent of price(levied at wholesale orretail)
Specific tax: a fixed taxper cigarette
* The maximum retail price also constitutes the minimum retail price, because retailers are not allowed to sell cigarettes for a pricelower than what is indicated on a pack.
Ross-Russia-forPrint-Final_A.qxd:Ross-Russia-forPrint-Final.qxd 9/30/08 4:24 PM Page 21
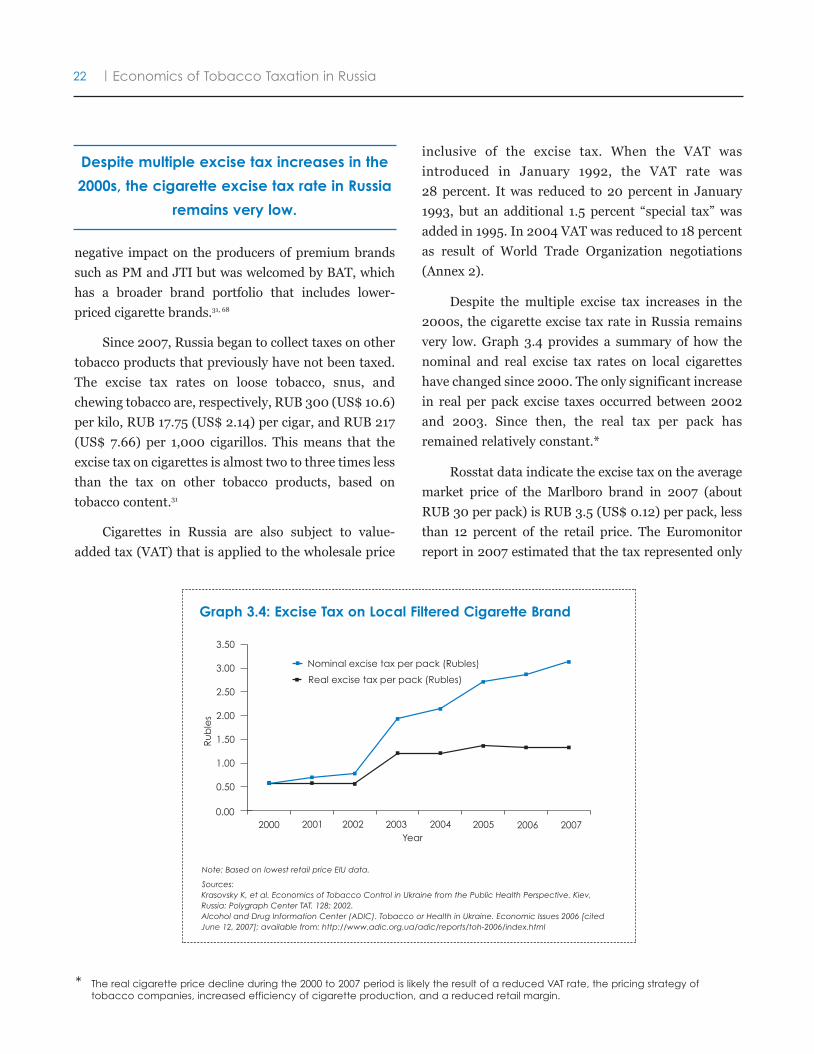
22 Economics of Tobacco Taxation in Russia|
negative impact on the producers of premium brands
such as PM and JTI but was welcomed by BAT, which
has a broader brand portfolio that includes lower-
priced cigarette brands.31, 68
Since 2007, Russia began to collect taxes on other
tobacco products that previously have not been taxed.
The excise tax rates on loose tobacco, snus, and
chewing tobacco are, respectively, RUB 300 (US$ 10.6)
per kilo, RUB 17.75 (US$ 2.14) per cigar, and RUB 217
(US$ 7.66) per 1,000 cigarillos. This means that the
excise tax on cigarettes is almost two to three times less
than the tax on other tobacco products, based on
tobacco content.31
Cigarettes in Russia are also subject to value-
added tax (VAT) that is applied to the wholesale price
inclusive of the excise tax. When the VAT was
introduced in January 1992, the VAT rate was
28 percent. It was reduced to 20 percent in January
1993, but an additional 1.5 percent “special tax” was
added in 1995. In 2004 VAT was reduced to 18 percent
as result of World Trade Organization negotiations
(Annex 2).
Despite the multiple excise tax increases in the
2000s, the cigarette excise tax rate in Russia remains
very low. Graph 3.4 provides a summary of how the
nominal and real excise tax rates on local cigarettes
have changed since 2000. The only significant increase
in real per pack excise taxes occurred between 2002
and 2003. Since then, the real tax per pack has
remained relatively constant.*
Rosstat data indicate the excise tax on the average
market price of the Marlboro brand in 2007 (about
RUB 30 per pack) is RUB 3.5 (US$ 0.12) per pack, less
than 12 percent of the retail price. The Euromonitor
report in 2007 estimated that the tax represented only
Despite multiple excise tax increases in the
2000s, the cigarette excise tax rate in Russia
remains very low.
0.00
0.50
1.00
1.50
2.00
2.50
3.00
3.50
Nominal excise tax per pack (Rubles)
Real excise tax per pack (Rubles)
Ru
ble
s
2000 2001 2002 20042003 2005 2006 2007Year
Graph 3.4: Excise Tax on Local Filtered Cigarette Brand
Note: Based on lowest retail price EIU data.
Sources:Krasovsky K, et al. Economics of Tobacco Control in Ukraine from the Public Health Perspective. Kiev,Russia: Polygraph Center TAT. 128; 2002.Alcohol and Drug Information Center (ADIC). Tobacco or Health in Ukraine. Economic Issues 2006 [citedJune 12, 2007]; available from: http://www.adic.org.ua/adic/reports/toh-2006/index.html
* The real cigarette price decline during the 2000 to 2007 period is likely the result of a reduced VAT rate, the pricing strategy oftobacco companies, increased efficiency of cigarette production, and a reduced retail margin.
Ross-Russia-forPrint-Final_A.qxd:Ross-Russia-forPrint-Final.qxd 9/30/08 4:24 PM Page 22
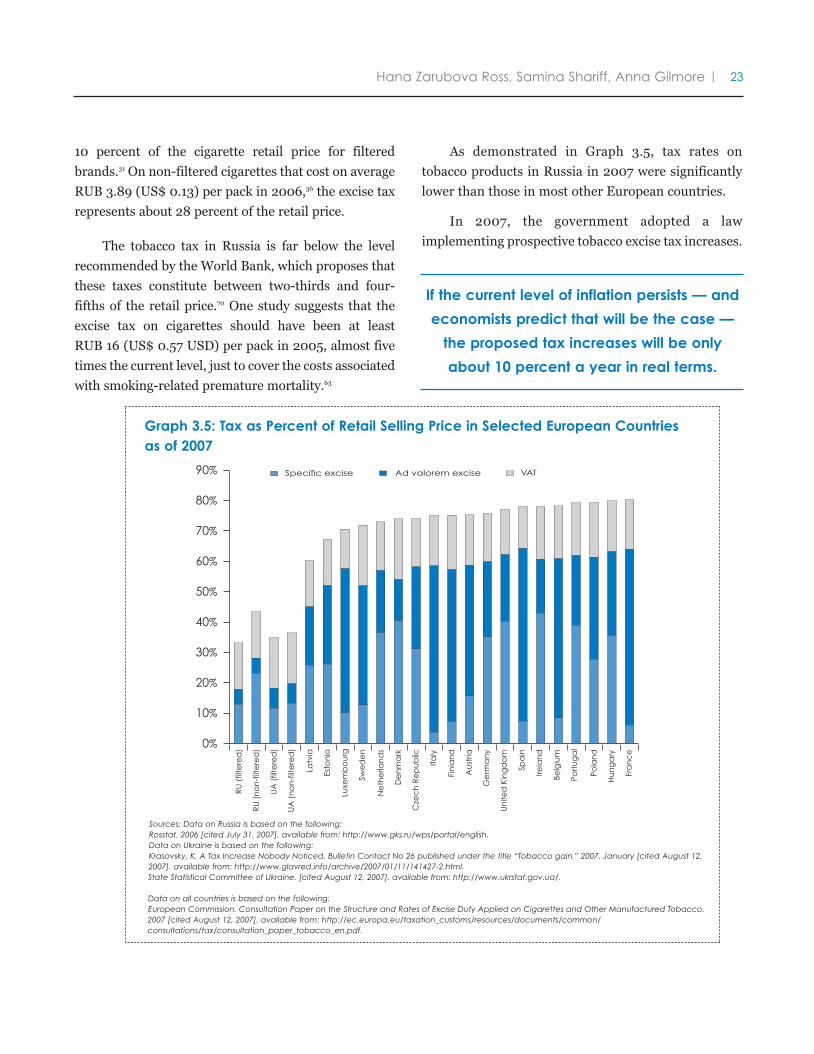
Specific excise Ad valorem excise VAT
0%
10%
20%
30%
40%
50%
60%
70%
80%
90%
RU
(filt
ere
d)
RU
(no
n-f
ilte
red
)
UA
(filt
ere
d)
UA
(no
n-f
ilte
red
)
Latv
ia
Esto
nia
Luxe
mb
ou
rg
Swe
de
n
Ne
the
rlan
ds
De
nm
ark
Cze
ch
Re
pu
blic
Italy
Fin
lan
d
Au
stria
Ge
rma
ny
Un
ited
Kin
gd
om
Spa
in
Irela
nd
Belg
ium
Port
ug
al
Pola
nd
Hu
ng
ary
Fra
nc
e
Graph 3.5: Tax as Percent of Retail Selling Price in Selected European Countriesas of 2007
Sources: Data on Russia is based on the following:Rosstat. 2006 [cited July 31, 2007]. available from: http://www.gks.ru/wps/portal/english.Data on Ukraine is based on the following:Krasovsky, K. A Tax Increase Nobody Noticed. Bulletin Contact No 26 published under the title “Tobacco gain.” 2007. January [cited August 12,2007]. available from: http://www.glavred.info/archive/2007/01/11/141427-2.html.State Statistical Committee of Ukraine. [cited August 12, 2007]. available from: http://www.ukrstat.gov.ua/.
Data on all countries is based on the following:European Commission. Consultation Paper on the Structure and Rates of Excise Duty Applied on Cigarettes and Other Manufactured Tobacco.2007 [cited August 12, 2007]. available from: http://ec.europa.eu/taxation_customs/resources/documents/common/consultations/tax/consultation_paper_tobacco_en.pdf.
Hana Zarubova Ross, Samina Shariff, Anna Gilmore 23|
If the current level of inflation persists — and
economists predict that will be the case —
the proposed tax increases will be only
about 10 percent a year in real terms.
10 percent of the cigarette retail price for filtered
brands.31 On non-filtered cigarettes that cost on average
RUB 3.89 (US$ 0.13) per pack in 2006,36 the excise tax
represents about 28 percent of the retail price.
The tobacco tax in Russia is far below the level
recommended by the World Bank, which proposes that
these taxes constitute between two-thirds and four-
fifths of the retail price.70 One study suggests that the
excise tax on cigarettes should have been at least
RUB 16 (US$ 0.57 USD) per pack in 2005, almost five
times the current level, just to cover the costs associated
with smoking-related premature mortality.63
As demonstrated in Graph 3.5, tax rates on
tobacco products in Russia in 2007 were significantly
lower than those in most other European countries.
In 2007, the government adopted a law
implementing prospective tobacco excise tax increases.
Ross-Russia-forPrint-Final_A.qxd:Ross-Russia-forPrint-Final.qxd 9/30/08 4:24 PM Page 23
24 Economics of Tobacco Taxation in Russia
The law raises the specific excise tax on filtered
cigarettes by an additional 20 percent a year from
2008 to 2010 (Annex 2), and on non-filtered cigarettes
by 20 percent in 2008, and by 28 percent in 2009 and
2010 (Annex 2).71 The law also calls for an annual
0.5 percentage point increase in the ad valorem
|
component of the excise tax.71 If the current level of
inflation persists — and economists predict that will be
the case — the proposed tax increases will be only
about 10 percent a year in real terms. Given the low
share of taxes in retail price, the impact of the tax hike
on cigarette prices is expected to be negligible.68, 72
Endnotes for Chapter III
37 Pampel F. Cigarette diffusion and sex differences in smoking. J Health Soc Behav. 2001;42:388-404.38 Lopez A, Collishaw N, Piha T. A descriptive model of the cigarette epidemic in developed countries. Tob Control. 1994;3:242-247.39 McKee M, Bobak M, Rose R, et al. Patterns of smoking in Russia. Tob Control. 1998;7:22-26.40 Ogloblin C, Brock G. Smoking in Russia: The "Marlboro Man" rides but without "Virginia Slims" for now. Comparative Economic Studies.
2003;45:87-103.41 Laatikainen T, Vartiainen E, Puska P. Comparing smoking and smoking cessation process in the Republic of Karelia, Russia and North
Karelia, Finland. J Epidemiol Community Health. 1999;53:528-534.42 World Health Organization. The European Tobacco Control Report. Geneva: The World Health Organization; 2007. [cited June 21,
2007]; available from: http://www.euro.who.int/document/e89842.pdf.43 Ross H. Russia (Moscow) 1999 Global Youth Tobacco Survey: economic aspects. In: Economics of Tobacco Control Paper No. 23,
Health, Nutrition and Population (HNP) Discussion Paper. World Bank's Human Development Network. Washington, DC: World HealthOrganization; 2004. available from: www.worldbank.org/hnppublications.
44 Centers for Disease Control and Prevention (CDC). Smoking & Tobacco Use: Global Youth Tobacco Survey (GYTS) Russian Federation-All Regions Combined Fact Sheet. Atlanta, GA: Centers for Disease Control and Prevention; 2007. [cited; available from:http://www.cdc.gov/tobacco/Global/GYTS/factsheets/euro/2004/russianfederation_factsheet.htm.
45 Gilmore A, McKee M. Exploring the impact of foreign direct investment on tobacco consumption in the former Soviet Union. TobControl. 2005;14:13-21.
46 Zohoori N. Monitoring Health Conditions in the Russian Federation. Chapel Hill, NC: University of North Carolina at Chapel Hill; 2001.47 ERC Statistics Intl Plc. United Kingdom. Suffolk, England: ERC Group Plc; 2005.48 The GTSS Collaborative Group. A cross country comparison of exposure to secondhand smoke among youth. Tob Control. 2006;15
(Suppl II):ii4-ii19.49 Parker J. CIS economic opportunities spur cigarette trade. Tobacco International. June 2007. available from:
http://www.tobaccointernational.com/0607/cis.htm.50 Gay G. Most dynamic. Tobacco Reporter. p. 34-36, October 2007.51 Peto R, Darby S, Deo H, Silcocks P, Whitley E, Doll R, et al. Smoking, smoking cessation, and lung cancer in the U.K. since 1950:
Combination of national statistics with two case-control studies. BMJ. 2000;321:323-329.52 Arzhenovskiy S. Price information for Russia from Rosstat 1995-2005. Personal communication with Dr. Ross. 2007.53 Lance P, Akin J, Dow W, Loh C. Is cigarette smoking in poorer nations highly sensitive to price? Evidence from Russia and China. J
Health Econ. 2004;23:173-189.54 Arzhenovsky S. Socioeconomic determinants of smoking in contemporary Russia. In: Working Paper Series. No 05/12. Moscow, Russia:
Economics Education and Research Consortium (EERC); 2005.55 Adelaja T. Bread price hike evokes hardship fears. The Moscow Times. July 31, 2007. available from:
http://www.moscowtimes.ru/article/852/49/195369.htm.56 Economist Intelligence Unit. Global Bread Prices in Local Currency and U.S. $. Worldwide Cost of Living Survey. [cited February 7, 2007];
available from: http://eiu.enumerate.com/asp/wcol_WCOLHome.asp.57 Gilmore A, Collin C. World leader or also-ran, paragon or pariah? The future of BAT. Paper presented at: Fourth European Conference
on Tobacco or Health; October 2007; Basel, Switzerland.58 DeMinckwitz C. British American Tobacco marketing: Strategy and brands. Paper presented at: UBS Tobacco Conference; December
2006; [cited January 3, 2008]; available from:http://www.britishamericantobacco.com/OneWeb/sites/uk__3mnfen.nsf/vwPagesWebLive/7837D83ED42E29F3C1257067003C59C3?opendocument&DTC=&SID.
59 Chaloupka FJ, Warner KE, eds. The economics of smoking. In: Newhouse JP, Cuyler A, eds. Handbook of Health Economics. 1st ed.Amsterdam, The Netherlands: Elsevier Science; 2000:1539-1627.
Ross-Russia-forPrint-Final_A.qxd:Ross-Russia-forPrint-Final.qxd 9/30/08 4:24 PM Page 24
Hana Zarubova Ross, Samina Shariff, Anna Gilmore 25|
60 Decoster A, Verbina I. Who pays indirect taxes in Russia? In: Discussion Paper No. 2003/58. World Institute for Development EconomicsResearch UNU/WIDER. Helsinki, Finland: United Nations University/WIDER; August 2003.
61 Djibuti M, Gotsadze G, Mataradze G, Zoidze A. Influence of household demographic and socio-economic factors on householdexpenditure on tobacco in six new independent states. BMC Public Health. 2007;7:222.
62 Dempsey J. Sick man of Russia? The average citizen. International Herald Tribune. September 7, 2007.63 Plavinski S, Plavinskaja S. Smoking and years of productive life lost: Does tobacco industry bring a net economic profit? Paper
presented at: The Leipzig Lipid-Meeting; 2005; Leipzig, Germany. Unpublished study.64 Shaw M, Mitchell R, Dorling D. Time for a smoke? One cigarette reduces your life by 11 minutes. BMJ. 2000;320:53.65 Centre for Addiction and Mental Health (CAMH). About tobacco. [cited December 13, 2007]; available from:
http://www.camh.net/About_Addiction_Mental_Health/Drug_and_Addiction_Information/about_tobacco.html.66 Demin AK. Tobacco control policy making in Russia and the role of civil society. Paper presented at: Making Health Research
Relevant to National Health Care Policies: The Case of Tobacco Control. Global Forum On Health Research; 2001; Geneva,Switzerland. available from: http://www.crdi.ca/uploads/user-S/11195580731GFHR_AD.pdf.
67 Dobrov D. Food industry 1991-2000. Kommersant, Russia's Daily Online. Sept. 25, 2001. available from:http://www.kommersant.com/tree.asp?rubric=3&node=32&doc_id=283991.
68 Ovchinnikov R, Butrin D, Zhenkova A. Finance ministry raises tax on cigarettes. Kommersant, Russia's Daily Online. Mar. 15, 2006.available from: http://www.kommersant.com/p657534/r_1/Finance_Ministry_Raises_Tax_on_Cigarettes/.
69 Russian cigarette prices to fall. Tobacco International. Jan./Feb. 2007. [cited July 18, 2007]; available from:http://www.tobaccointernational.com/0107/manufacturer.htm.
70 World Bank. Curbing the Epidemic: Governments and the Economics of Tobacco Control. Development in Practice. Washington DC:World Bank; 1999.
71 Russian Newspaper. Federal Issue No. 4368. May 19, 2007 [cited January 29, 2008]; available from: http://www.rg.ru/2007/05/19/nk-izmenenia-dok.html.
72 Bill to change article 193, section 2, of the Tax Law. 2007 [cited 8/24/07]; available from:http://taxpravo.ru/legislation/projects/bill1/article29411.
Ross-Russia-forPrint-Final_A.qxd:Ross-Russia-forPrint-Final.qxd 9/30/08 4:24 PM Page 25
26 Economics of Tobacco Taxation in Russia|
360.8 billion sticks in 2002 to 399.7 billion sticks in
2005.31 According to the Association of Cigarette
Manufacturers in Russia, Tabakprom, the market
stood at about 375 to 385 billion pieces in 2006,50 a
figure close to the Euromonitor data. On the other
hand, Datamonitor estimated a 7.7 percent decrease in
the legal sale of cigarettes from 393.7 billion sticks in
2002 to 363.4 billion sticks in 2005.76 According to this
source, the market is expected to fall to 312 billion
sticks by the end of 2010.76 The Euromonitor report
also predicts a market decline, but only to 366 billion
sticks by 2010.31 The predicted decline is most likely
driven by the shrinking population but could be offset
by rising smoking prevalence.31
The late 1990s boom in cigarette production
capacity driven by foreign direct investment led to a
cigarette oversupply by the early 2000s.67 The
overproduction crisis was particularly detrimental to
the local tobacco companies who could not compete
with the rich multinationals. Many domestic cigarette
producers and distributors were forced to declare
bankruptcy,67 which contributed to the consolidation of
the Russian cigarette market.
The overproduction was partly absorbed by
exports. Although exports remain a small fraction of
total production, the Russian trade deficit in
manufactured cigarettes in the 1990s (a net import of
74.8 billion pieces in 1998; see Annex 3) was turned
into a trade surplus in the 2000s (Graph 4.1).
According to Tabakprom, the volume of cigarette
exports grew from 924 million pieces in 2000 to 12.4
billion pieces in 2006,77 approximately 3 percent of the
total production. Russian cigarette exports were
expected to reach 20 billion pieces in 2007.49
The primary target of exported cigarettes is other
Commonwealth of Independent States (CIS), which
have free trade arrangements with the Russian
Federation.78 Russian cigarettes in CIS are replacing
imports previously originating in the EU and the US.
IV. Supply of Tobacco Productsand Industry Regulations
Production, Import, and Export
Russia is the world’s third-largest market for
tobacco products, after China and the United States73,
and has represented an attractive investment
opportunity for TTCs.74 The economic turmoil
accompanying the collapse of the Soviet Union in the
early 1990s resulted in a shortage of many products,
including cigarettes, which accelerated the opening of
the Russian market to foreign investors. The TTCs were
among the first to invest in the former Soviet
republics.75
The Russian tobacco state monopoly was
dissolved in 1992.45 At that time, local cigarette
production was low, but the international tobacco
companies were quick to supply the Russian market
with imported cigarettes; soon imports accounted for
45 percent of total cigarette sales in Russia. The high
level of imports was only temporary, as joint ventures
between the local companies and foreign investors soon
filled the gap in the cigarette market. Production tripled
from 141.1 billion pieces in 199566 to 414 billion pieces in
2006 (Table 4.1)50. By 2005, imports represented only
1.5 percent of the cigarettes consumed.2,49
Estimates of the current level of legal cigarette
sales (production – export + import) in Russia vary.
Euromonitor reports an increase in legal sales from
Russia is the world’s third-largest market
for tobacco products, after China and the
United States, and has represented an
attractive investment opportunity for
transnational tobacco companies.
Ross-Russia-forPrint-Final_A.qxd:Ross-Russia-forPrint-Final.qxd 9/30/08 4:24 PM Page 26
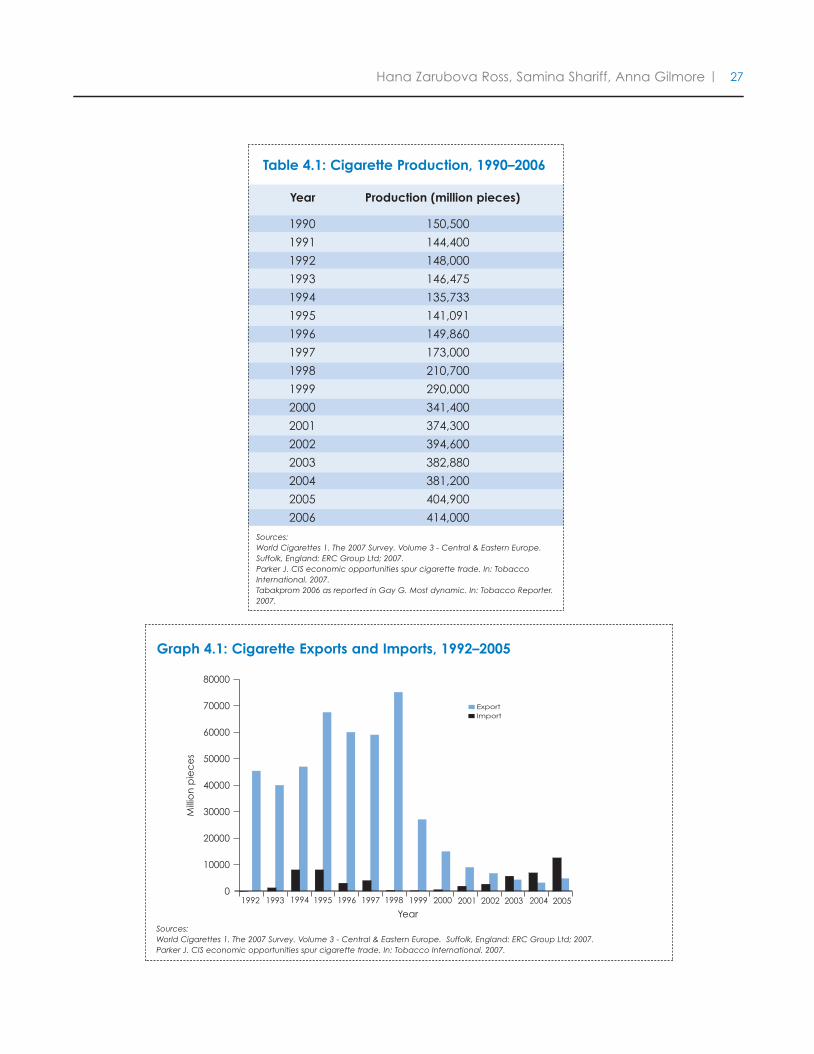
Table 4.1: Cigarette Production, 1990–2006
Sources:World Cigarettes 1. The 2007 Survey. Volume 3 - Central & Eastern Europe.Suffolk, England: ERC Group Ltd; 2007.Parker J. CIS economic opportunities spur cigarette trade. In: TobaccoInternational. 2007.Tabakprom 2006 as reported in Gay G. Most dynamic. In: Tobacco Reporter.2007.
Year Production (million pieces)
1990 150,500
1991 144,400
1992 148,000
1993 146,475
1994 135,733
1995 141,091
1996 149,860
1997 173,000
1998 210,700
1999 290,000
2000 341,400
2001 374,300
2002 394,600
2003 382,880
2004 381,200
2005 404,900
2006 414,000
Hana Zarubova Ross, Samina Shariff, Anna Gilmore 27|
Graph 4.1: Cigarette Exports and Imports, 1992–2005
Sources:World Cigarettes 1. The 2007 Survey. Volume 3 - Central & Eastern Europe. Suffolk, England: ERC Group Ltd; 2007.Parker J. CIS economic opportunities spur cigarette trade. In: Tobacco International. 2007.
Export
0
10000
20000
30000
40000
50000
60000
70000
80000
Import
Mill
ion
pie
ce
s
2000 2001 2002 20042003 2005
Year
1994 1995 1996 19981997 19991992 1993
Ross-Russia-forPrint-Final_A.qxd:Ross-Russia-forPrint-Final.qxd 9/30/08 4:24 PM Page 27
28 Economics of Tobacco Taxation in Russia|
5 percent, one of the lowest in the world.78 As a result,
Russia is running a trade deficit in tobacco leaf, with
imports of 295,000 metric tons and exports of only
4,300 metric tons in 2006.78* Raw tobacco is imported
mostly from Brazil, China, India, and the US.
As in most former Soviet republics, the Russian
cigarette market is characterized by a certain degree of
smuggling and illegal production. However, one report
suggests that the quantity of illegal cigarette export has
declined from 55 billion pieces in 2000 to 20 billion
pieces in 2005 (which represents about 5 percent of
legal sales).4 Our own estimates based on the
comparison of macro- and micro-level data do not
support this finding. Table 4.2 contrasts the estimates
of cigarette demand as reported in surveys with the
estimate of cigarette sales based on production and
trade statistics. In estimating the total demand of
cigarettes in Russia, we assumed that a male smoker
consumes on average 16 cigarettes per day and that
female cigarette consumption increased from 8 to 11
per day in 2000, the middle of the period under
consideration. The last column shows the difference
between consumption as reported by the population
and the estimates of cigarettes that officially entered
the market. The results for mid-1990 show a gap
between cigarettes sold legally and estimated cigarette
consumption, which would have been filled by
imported illegal cigarettes. The situation reversed by
early 2000s, when cigarettes entering the market
officially exceed the level of consumption estimated by
surveys, with illegal exports abroad most likely
accounting for the difference.
Despite the limitation of this research method
(e.g. people generally underestimate their cigarette
consumption, and some cigarettes are destroyed
before they can be consumed), our results support the
findings of a market research company that estimated
6 percent of the domestic sales consisted of smuggled
In addition to importing a relatively small
percentage of cigarettes sold in the market, Russia
imports all other tobacco products such as chewing
tobacco, snus, snuff, cigars, and pipe tobacco. The
import of these previously rare tobacco products has
experienced an upward trend, particularly since early
2000. For example, the import of snus increased from
72 kg in 2000 to 22,395 kg in 200577 as companies
started to promote the use of snus in Russia.79 The
trend toward importing other tobacco products is
likely to change when the TTCs begin to produce these
goods locally.
In contrast with cigarette production, tobacco leaf
production remains relatively small, reaching 2,500
metric tons in 2006, which is less than 1 percent of the
raw tobacco demand in Russia.78 The production of raw
tobacco declined steadily from the mid-1980s until the
mid-1990s. This decline was caused by a number of
factors including droughts, the demise of Soviet
subsidies to agricultural production, and a 1980s health
campaign by then-President Mikhail Gorbachev that
discouraged production.80 Gorbachev’s campaign,
although focused largely on reducing alcohol
consumption, also sought to reduce cigarette
consumption by reducing the supply of leaf tobacco and
manufactured cigarettes.45 The decrease in domestic
leaf production has been replaced by imported raw
tobacco, which has been increasing steadily since
1990.45 Imports are encouraged by an import duty of
* The amount of export exceeds the level of raw tobacco production, likely a result of raw tobacco re-export.
The decrease in domestic leaf production
has been replaced by imported raw
tobacco, which has been increasing
steadily since 1990. Imports are
encouraged by an import duty of 5
percent, one of the lowest in the world.
Ross-Russia-forPrint-Final_A.qxd:Ross-Russia-forPrint-Final.qxd 9/30/08 4:24 PM Page 28
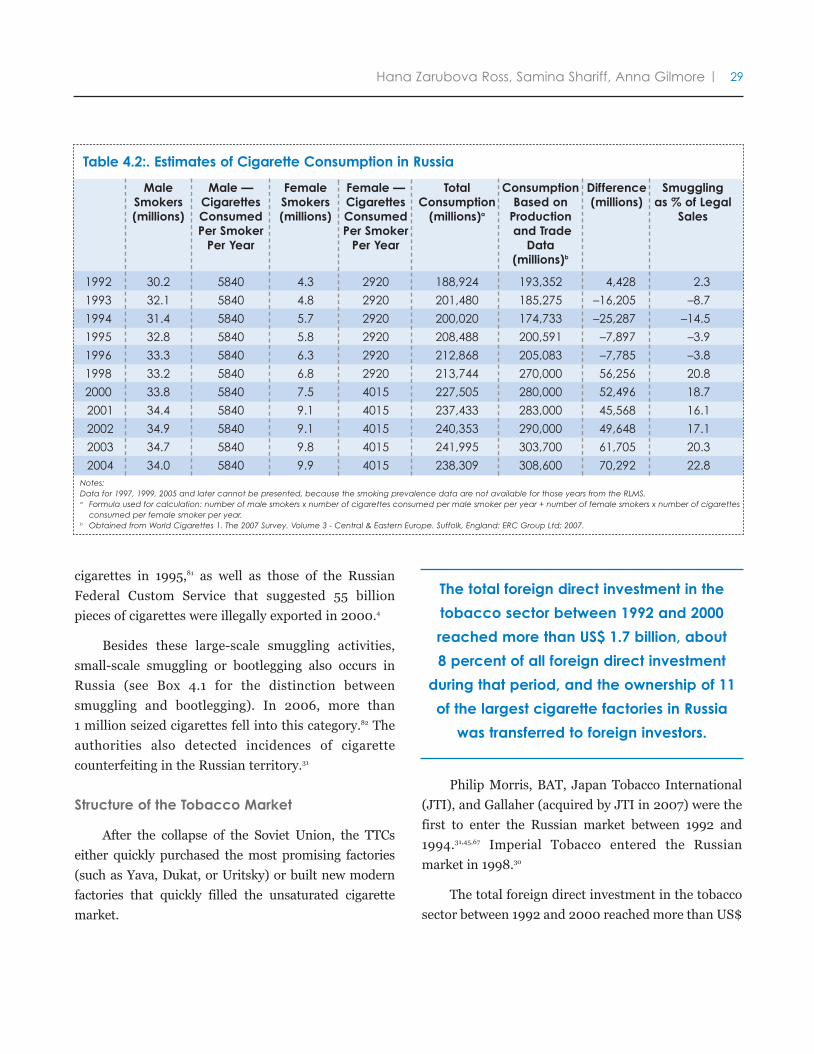
Hana Zarubova Ross, Samina Shariff, Anna Gilmore 29|
Table 4.2:. Estimates of Cigarette Consumption in Russia
Notes:Data for 1997, 1999, 2005 and later cannot be presented, because the smoking prevalence data are not available for those years from the RLMS.a Formula used for calculation: number of male smokers x number of cigarettes consumed per male smoker per year + number of female smokers x number of cigarettes
consumed per female smoker per year.b Obtained from World Cigarettes 1. The 2007 Survey. Volume 3 - Central & Eastern Europe. Suffolk, England: ERC Group Ltd; 2007.
Male Male — Female Female — Total Consumption Difference SmugglingSmokers Cigarettes Smokers Cigarettes Consumption Based on (millions) as % of Legal(millions) Consumed (millions) Consumed (millions)a Production Sales
Per Smoker Per Smoker and TradePer Year Per Year Data
(millions)b
1992 30.2 5840 4.3 2920 188,924 193,352 4,428 2.3
1993 32.1 5840 4.8 2920 201,480 185,275 –16,205 –8.7
1994 31.4 5840 5.7 2920 200,020 174,733 –25,287 –14.5
1995 32.8 5840 5.8 2920 208,488 200,591 –7,897 –3.9
1996 33.3 5840 6.3 2920 212,868 205,083 –7,785 –3.8
1998 33.2 5840 6.8 2920 213,744 270,000 56,256 20.8
2000 33.8 5840 7.5 4015 227,505 280,000 52,496 18.7
2001 34.4 5840 9.1 4015 237,433 283,000 45,568 16.1
2002 34.9 5840 9.1 4015 240,353 290,000 49,648 17.1
2003 34.7 5840 9.8 4015 241,995 303,700 61,705 20.3
2004 34.0 5840 9.9 4015 238,309 308,600 70,292 22.8
cigarettes in 1995,81 as well as those of the Russian
Federal Custom Service that suggested 55 billion
pieces of cigarettes were illegally exported in 2000.4
Besides these large-scale smuggling activities,
small-scale smuggling or bootlegging also occurs in
Russia (see Box 4.1 for the distinction between
smuggling and bootlegging). In 2006, more than
1 million seized cigarettes fell into this category.82 The
authorities also detected incidences of cigarette
counterfeiting in the Russian territory.31
Structure of the Tobacco Market
After the collapse of the Soviet Union, the TTCs
either quickly purchased the most promising factories
(such as Yava, Dukat, or Uritsky) or built new modern
factories that quickly filled the unsaturated cigarette
market.
Philip Morris, BAT, Japan Tobacco International
(JTI), and Gallaher (acquired by JTI in 2007) were the
first to enter the Russian market between 1992 and
1994.31,45,67 Imperial Tobacco entered the Russian
market in 1998.30
The total foreign direct investment in the tobacco
sector between 1992 and 2000 reached more than US$
The total foreign direct investment in the
tobacco sector between 1992 and 2000
reached more than US$ 1.7 billion, about
8 percent of all foreign direct investment
during that period, and the ownership of 11
of the largest cigarette factories in Russia
was transferred to foreign investors.
Ross-Russia-forPrint-Final_A.qxd:Ross-Russia-forPrint-Final.qxd 9/30/08 4:24 PM Page 29
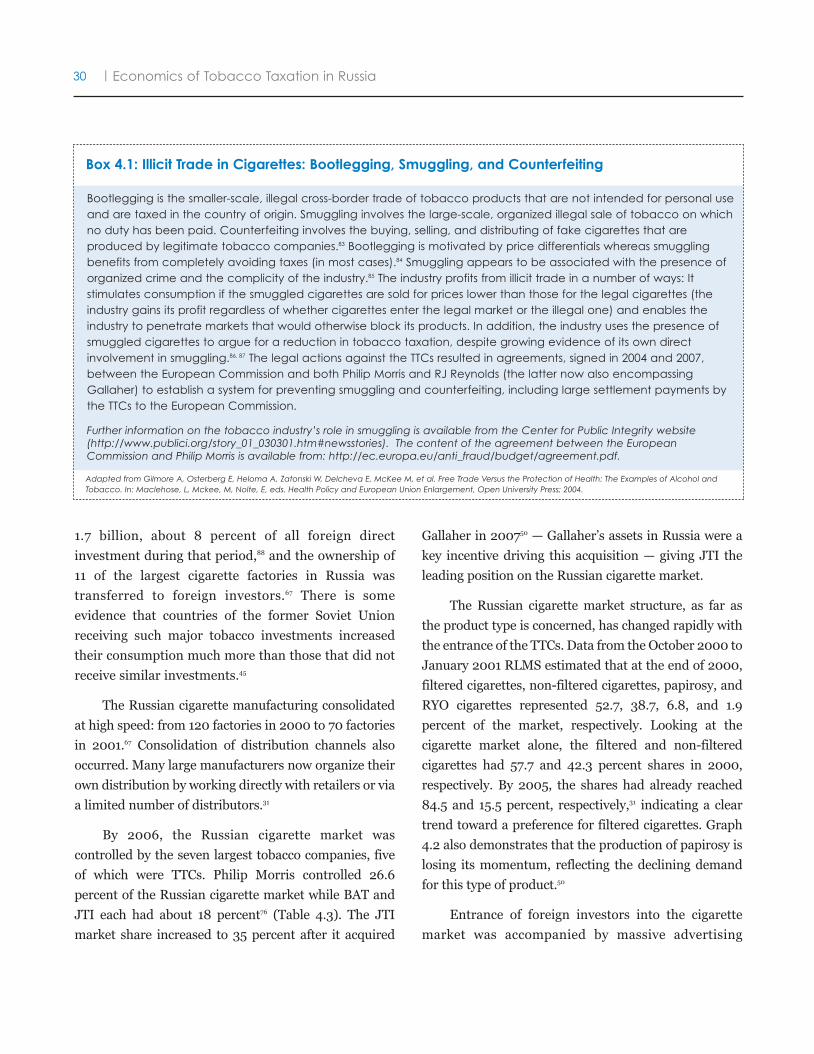
30 Economics of Tobacco Taxation in Russia|
1.7 billion, about 8 percent of all foreign direct
investment during that period,88 and the ownership of
11 of the largest cigarette factories in Russia was
transferred to foreign investors.67 There is some
evidence that countries of the former Soviet Union
receiving such major tobacco investments increased
their consumption much more than those that did not
receive similar investments.45
The Russian cigarette manufacturing consolidated
at high speed: from 120 factories in 2000 to 70 factories
in 2001.67 Consolidation of distribution channels also
occurred. Many large manufacturers now organize their
own distribution by working directly with retailers or via
a limited number of distributors.31
By 2006, the Russian cigarette market was
controlled by the seven largest tobacco companies, five
of which were TTCs. Philip Morris controlled 26.6
percent of the Russian cigarette market while BAT and
JTI each had about 18 percent76 (Table 4.3). The JTI
market share increased to 35 percent after it acquired
Gallaher in 200750 — Gallaher’s assets in Russia were a
key incentive driving this acquisition — giving JTI the
leading position on the Russian cigarette market.
The Russian cigarette market structure, as far as
the product type is concerned, has changed rapidly with
the entrance of the TTCs. Data from the October 2000 to
January 2001 RLMS estimated that at the end of 2000,
filtered cigarettes, non-filtered cigarettes, papirosy, and
RYO cigarettes represented 52.7, 38.7, 6.8, and 1.9
percent of the market, respectively. Looking at the
cigarette market alone, the filtered and non-filtered
cigarettes had 57.7 and 42.3 percent shares in 2000,
respectively. By 2005, the shares had already reached
84.5 and 15.5 percent, respectively,31 indicating a clear
trend toward a preference for filtered cigarettes. Graph
4.2 also demonstrates that the production of papirosy is
losing its momentum, reflecting the declining demand
for this type of product.50
Entrance of foreign investors into the cigarette
market was accompanied by massive advertising
Box 4.1: Illicit Trade in Cigarettes: Bootlegging, Smuggling, and Counterfeiting
Bootlegging is the smaller-scale, illegal cross-border trade of tobacco products that are not intended for personal useand are taxed in the country of origin. Smuggling involves the large-scale, organized illegal sale of tobacco on whichno duty has been paid. Counterfeiting involves the buying, selling, and distributing of fake cigarettes that areproduced by legitimate tobacco companies.83 Bootlegging is motivated by price differentials whereas smugglingbenefits from completely avoiding taxes (in most cases).84 Smuggling appears to be associated with the presence oforganized crime and the complicity of the industry.85 The industry profits from illicit trade in a number of ways: Itstimulates consumption if the smuggled cigarettes are sold for prices lower than those for the legal cigarettes (theindustry gains its profit regardless of whether cigarettes enter the legal market or the illegal one) and enables theindustry to penetrate markets that would otherwise block its products. In addition, the industry uses the presence ofsmuggled cigarettes to argue for a reduction in tobacco taxation, despite growing evidence of its own directinvolvement in smuggling.86, 87 The legal actions against the TTCs resulted in agreements, signed in 2004 and 2007,between the European Commission and both Philip Morris and RJ Reynolds (the latter now also encompassingGallaher) to establish a system for preventing smuggling and counterfeiting, including large settlement payments bythe TTCs to the European Commission.
Further information on the tobacco industry’s role in smuggling is available from the Center for Public Integrity website(http://www.publici.org/story_01_030301.htm#newsstories). The content of the agreement between the EuropeanCommission and Philip Morris is available from: http://ec.europa.eu/anti_fraud/budget/agreement.pdf.
Adapted from Gilmore A, Osterberg E, Heloma A, Zatonski W, Delcheva E, McKee M, et al. Free Trade Versus the Protection of Health: The Examples of Alcohol andTobacco. In: Maclehose, L, Mckee, M, Nolte, E, eds. Health Policy and European Union Enlargement, Open University Press; 2004.
Ross-Russia-forPrint-Final_A.qxd:Ross-Russia-forPrint-Final.qxd 9/30/08 4:24 PM Page 30
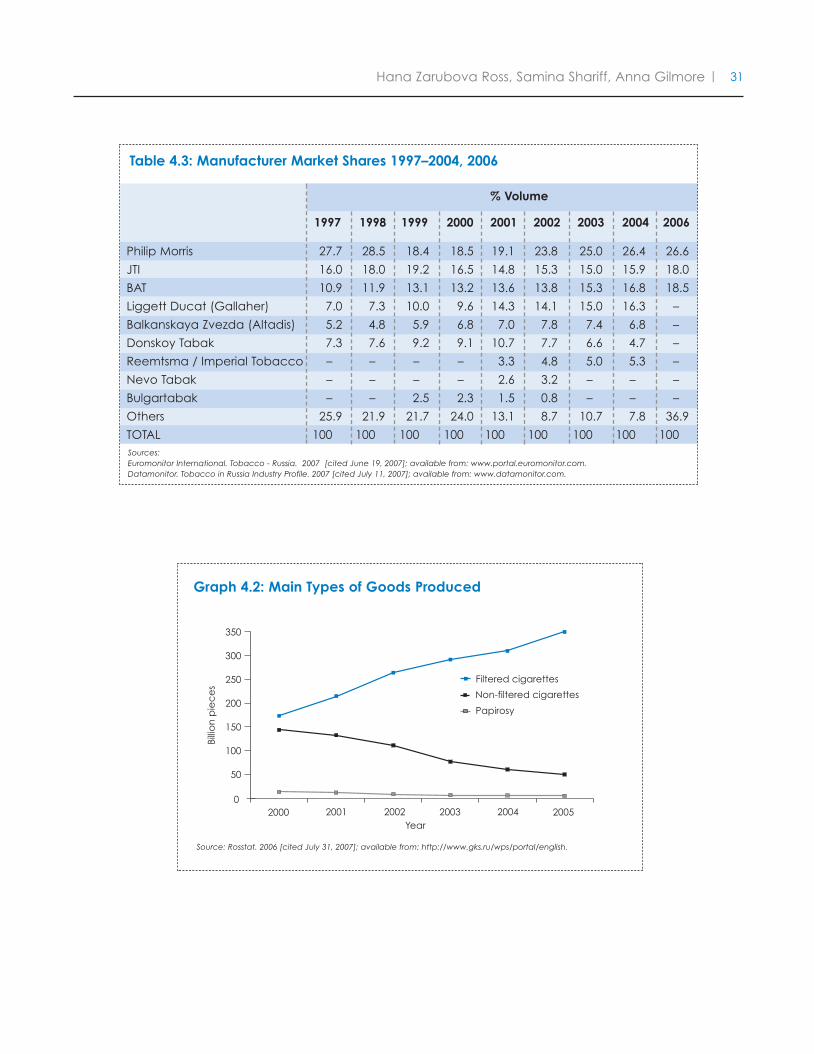
Hana Zarubova Ross, Samina Shariff, Anna Gilmore 31|
Graph 4.2: Main Types of Goods Produced
Source: Rosstat. 2006 [cited July 31, 2007]; available from: http://www.gks.ru/wps/portal/english.
Table 4.3: Manufacturer Market Shares 1997–2004, 2006
Sources:Euromonitor International. Tobacco - Russia. 2007 [cited June 19, 2007]; available from: www.portal.euromonitor.com.Datamonitor. Tobacco in Russia Industry Profile. 2007 [cited July 11, 2007]; available from: www.datamonitor.com.
% Volume
1997 1998 1999 2000 2001 2002 2003 2004 2006
Philip Morris 27.7 28.5 18.4 18.5 19.1 23.8 25.0 26.4 26.6
JTI 16.0 18.0 19.2 16.5 14.8 15.3 15.0 15.9 18.0
BAT 10.9 11.9 13.1 13.2 13.6 13.8 15.3 16.8 18.5
Liggett Ducat (Gallaher) 7.0 7.3 10.0 9.6 14.3 14.1 15.0 16.3 –
Balkanskaya Zvezda (Altadis) 5.2 4.8 5.9 6.8 7.0 7.8 7.4 6.8 –
Donskoy Tabak 7.3 7.6 9.2 9.1 10.7 7.7 6.6 4.7 –
Reemtsma / Imperial Tobacco – – – – 3.3 4.8 5.0 5.3 –
Nevo Tabak – – – – 2.6 3.2 – – –
Bulgartabak – – 2.5 2.3 1.5 0.8 – – –
Others 25.9 21.9 21.7 24.0 13.1 8.7 10.7 7.8 36.9
TOTAL 100 100 100 100 100 100 100 100 100
0
50
100
150
200
250
300
350
Filtered cigarettes
Billi
on
pie
ce
s
2000 2001 2002 20042003 2005Year
Non-filtered cigarettes
Papirosy
Ross-Russia-forPrint-Final_A.qxd:Ross-Russia-forPrint-Final.qxd 9/30/08 4:24 PM Page 31
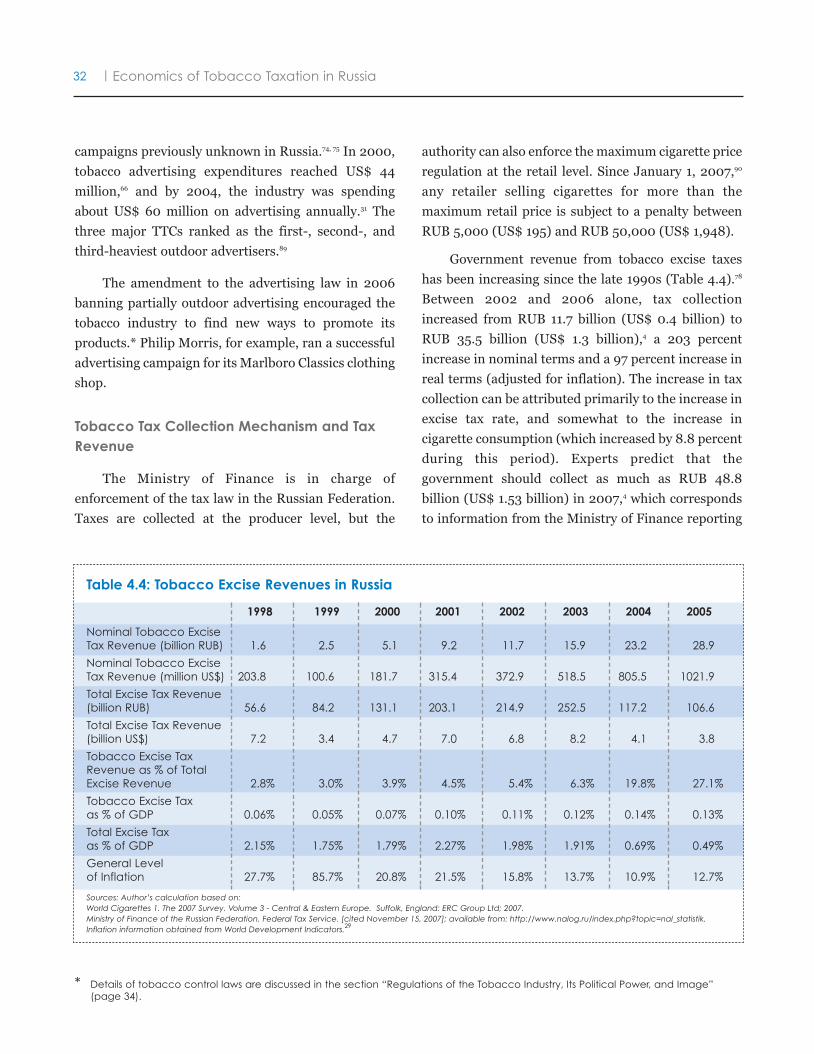
32 Economics of Tobacco Taxation in Russia|
authority can also enforce the maximum cigarette price
regulation at the retail level. Since January 1, 2007,90
any retailer selling cigarettes for more than the
maximum retail price is subject to a penalty between
RUB 5,000 (US$ 195) and RUB 50,000 (US$ 1,948).
Government revenue from tobacco excise taxes
has been increasing since the late 1990s (Table 4.4).78
Between 2002 and 2006 alone, tax collection
increased from RUB 11.7 billion (US$ 0.4 billion) to
RUB 35.5 billion (US$ 1.3 billion),4 a 203 percent
increase in nominal terms and a 97 percent increase in
real terms (adjusted for inflation). The increase in tax
collection can be attributed primarily to the increase in
excise tax rate, and somewhat to the increase in
cigarette consumption (which increased by 8.8 percent
during this period). Experts predict that the
government should collect as much as RUB 48.8
billion (US$ 1.53 billion) in 2007,4 which corresponds
to information from the Ministry of Finance reporting
campaigns previously unknown in Russia.74, 75 In 2000,
tobacco advertising expenditures reached US$ 44
million,66 and by 2004, the industry was spending
about US$ 60 million on advertising annually.31 The
three major TTCs ranked as the first-, second-, and
third-heaviest outdoor advertisers.89
The amendment to the advertising law in 2006
banning partially outdoor advertising encouraged the
tobacco industry to find new ways to promote its
products.* Philip Morris, for example, ran a successful
advertising campaign for its Marlboro Classics clothing
shop.
Tobacco Tax Collection Mechanism and TaxRevenue
The Ministry of Finance is in charge of
enforcement of the tax law in the Russian Federation.
Taxes are collected at the producer level, but the
Table 4.4: Tobacco Excise Revenues in Russia
Sources: Author’s calculation based on:World Cigarettes 1. The 2007 Survey. Volume 3 - Central & Eastern Europe. Suffolk, England: ERC Group Ltd; 2007.Ministry of Finance of the Russian Federation. Federal Tax Service. [cited November 15, 2007]; available from: http://www.nalog.ru/index.php?topic=nal_statistik.Inflation information obtained from World Development Indicators.29
1998 1999 2000 2001 2002 2003 2004 2005
Nominal Tobacco ExciseTax Revenue (billion RUB) 1.6 2.5 5.1 9.2 11.7 15.9 23.2 28.9
Nominal Tobacco ExciseTax Revenue (million US$) 203.8 100.6 181.7 315.4 372.9 518.5 805.5 1021.9
Total Excise Tax Revenue(billion RUB) 56.6 84.2 131.1 203.1 214.9 252.5 117.2 106.6
Total Excise Tax Revenue(billion US$) 7.2 3.4 4.7 7.0 6.8 8.2 4.1 3.8
Tobacco Excise TaxRevenue as % of TotalExcise Revenue 2.8% 3.0% 3.9% 4.5% 5.4% 6.3% 19.8% 27.1%
Tobacco Excise Taxas % of GDP 0.06% 0.05% 0.07% 0.10% 0.11% 0.12% 0.14% 0.13%
Total Excise Taxas % of GDP 2.15% 1.75% 1.79% 2.27% 1.98% 1.91% 0.69% 0.49%
General Levelof Inflation 27.7% 85.7% 20.8% 21.5% 15.8% 13.7% 10.9% 12.7%
* Details of tobacco control laws are discussed in the section “Regulations of the Tobacco Industry, Its Political Power, and Image”(page 34).
Ross-Russia-forPrint-Final_A.qxd:Ross-Russia-forPrint-Final.qxd 9/30/08 4:24 PM Page 32
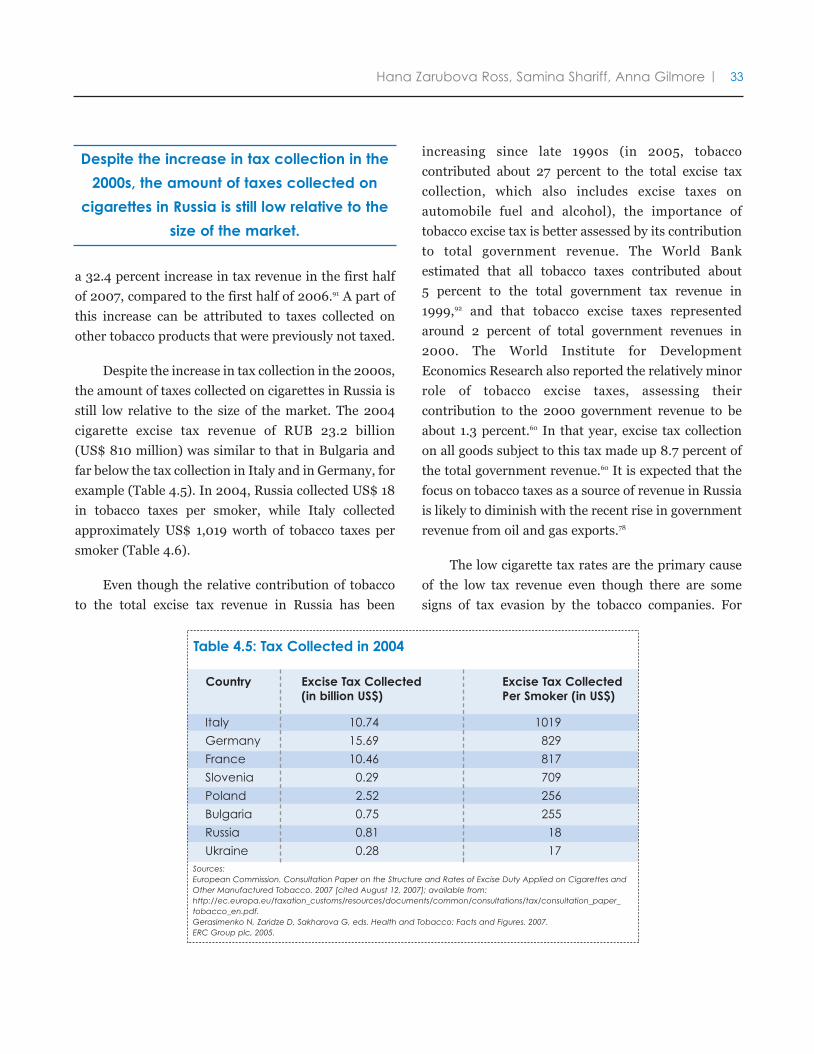
Hana Zarubova Ross, Samina Shariff, Anna Gilmore 33|
a 32.4 percent increase in tax revenue in the first half
of 2007, compared to the first half of 2006.91 A part of
this increase can be attributed to taxes collected on
other tobacco products that were previously not taxed.
Despite the increase in tax collection in the 2000s,
the amount of taxes collected on cigarettes in Russia is
still low relative to the size of the market. The 2004
cigarette excise tax revenue of RUB 23.2 billion
(US$ 810 million) was similar to that in Bulgaria and
far below the tax collection in Italy and in Germany, for
example (Table 4.5). In 2004, Russia collected US$ 18
in tobacco taxes per smoker, while Italy collected
approximately US$ 1,019 worth of tobacco taxes per
smoker (Table 4.6).
Even though the relative contribution of tobacco
to the total excise tax revenue in Russia has been
increasing since late 1990s (in 2005, tobacco
contributed about 27 percent to the total excise tax
collection, which also includes excise taxes on
automobile fuel and alcohol), the importance of
tobacco excise tax is better assessed by its contribution
to total government revenue. The World Bank
estimated that all tobacco taxes contributed about
5 percent to the total government tax revenue in
1999,92 and that tobacco excise taxes represented
around 2 percent of total government revenues in
2000. The World Institute for Development
Economics Research also reported the relatively minor
role of tobacco excise taxes, assessing their
contribution to the 2000 government revenue to be
about 1.3 percent.60 In that year, excise tax collection
on all goods subject to this tax made up 8.7 percent of
the total government revenue.60 It is expected that the
focus on tobacco taxes as a source of revenue in Russia
is likely to diminish with the recent rise in government
revenue from oil and gas exports.78
The low cigarette tax rates are the primary cause
of the low tax revenue even though there are some
signs of tax evasion by the tobacco companies. For
Despite the increase in tax collection in the
2000s, the amount of taxes collected on
cigarettes in Russia is still low relative to the
size of the market.
Table 4.5: Tax Collected in 2004
Sources:European Commission. Consultation Paper on the Structure and Rates of Excise Duty Applied on Cigarettes andOther Manufactured Tobacco. 2007 [cited August 12, 2007]; available from:http://ec.europa.eu/taxation_customs/resources/documents/common/consultations/tax/consultation_paper_tobacco_en.pdf.Gerasimenko N, Zaridze D, Sakharova G, eds. Health and Tobacco: Facts and Figures. 2007.ERC Group plc, 2005.
Country Excise Tax Collected Excise Tax Collected(in billion US$) Per Smoker (in US$)
Italy 10.74 1019
Germany 15.69 829
France 10.46 817
Slovenia 0.29 709
Poland 2.52 256
Bulgaria 0.75 255
Russia 0.81 18
Ukraine 0.28 17
Ross-Russia-forPrint-Final_A.qxd:Ross-Russia-forPrint-Final.qxd 9/30/08 4:24 PM Page 33
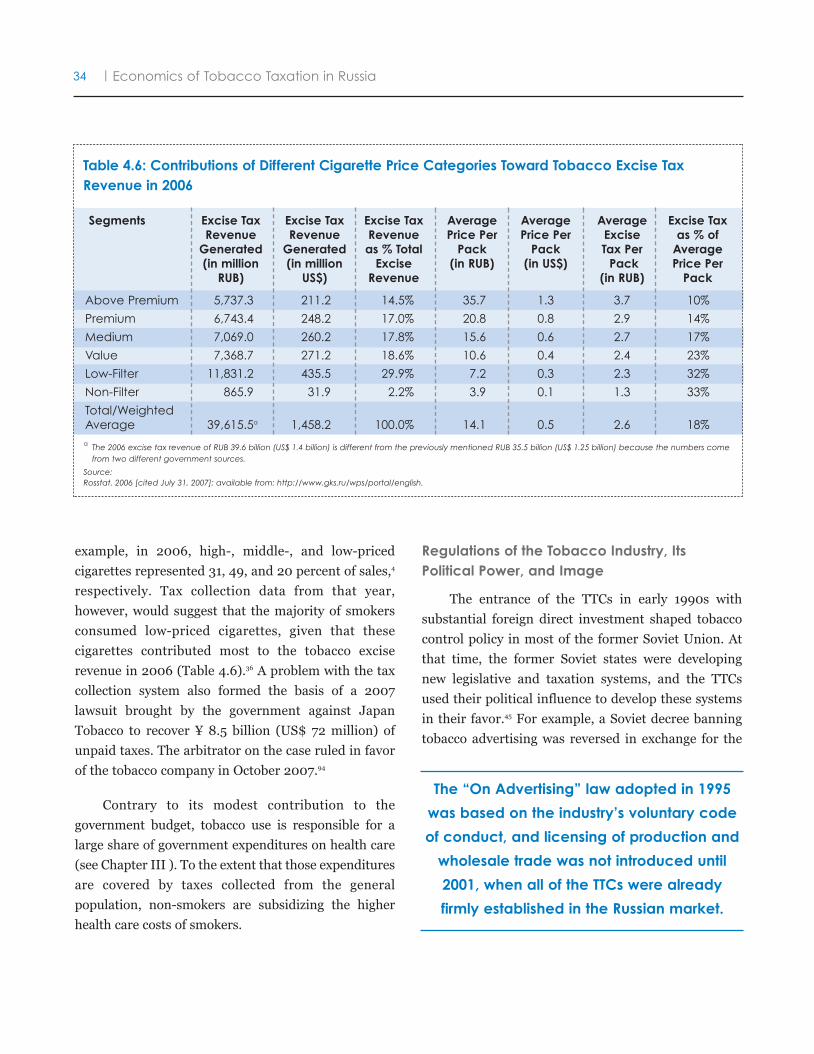
34 Economics of Tobacco Taxation in Russia|
The “On Advertising” law adopted in 1995
was based on the industry’s voluntary code
of conduct, and licensing of production and
wholesale trade was not introduced until
2001, when all of the TTCs were already
firmly established in the Russian market.
Table 4.6: Contributions of Different Cigarette Price Categories Toward Tobacco Excise TaxRevenue in 2006
a The 2006 excise tax revenue of RUB 39.6 billion (US$ 1.4 billion) is different from the previously mentioned RUB 35.5 billion (US$ 1.25 billion) because the numbers comefrom two different government sources.
Source:Rosstat. 2006 [cited July 31, 2007]; available from: http://www.gks.ru/wps/portal/english.
Segments Excise Tax Excise Tax Excise Tax Average Average Average Excise TaxRevenue Revenue Revenue Price Per Price Per Excise as % ofGenerated Generated as % Total Pack Pack Tax Per Average(in million (in million Excise (in RUB) (in US$) Pack Price PerRUB) US$) Revenue (in RUB) Pack
Above Premium 5,737.3 211.2 14.5% 35.7 1.3 3.7 10%
Premium 6,743.4 248.2 17.0% 20.8 0.8 2.9 14%
Medium 7,069.0 260.2 17.8% 15.6 0.6 2.7 17%
Value 7,368.7 271.2 18.6% 10.6 0.4 2.4 23%
Low-Filter 11,831.2 435.5 29.9% 7.2 0.3 2.3 32%
Non-Filter 865.9 31.9 2.2% 3.9 0.1 1.3 33%
Total/WeightedAverage 39,615.5a 1,458.2 100.0% 14.1 0.5 2.6 18%
example, in 2006, high-, middle-, and low-pricedcigarettes represented 31, 49, and 20 percent of sales,4
respectively. Tax collection data from that year,however, would suggest that the majority of smokersconsumed low-priced cigarettes, given that thesecigarettes contributed most to the tobacco exciserevenue in 2006 (Table 4.6).36 A problem with the taxcollection system also formed the basis of a 2007lawsuit brought by the government against JapanTobacco to recover ¥ 8.5 billion (US$ 72 million) ofunpaid taxes. The arbitrator on the case ruled in favorof the tobacco company in October 2007.94
Contrary to its modest contribution to thegovernment budget, tobacco use is responsible for alarge share of government expenditures on health care(see Chapter III ). To the extent that those expendituresare covered by taxes collected from the generalpopulation, non-smokers are subsidizing the higherhealth care costs of smokers.
Regulations of the Tobacco Industry, ItsPolitical Power, and Image
The entrance of the TTCs in early 1990s withsubstantial foreign direct investment shaped tobaccocontrol policy in most of the former Soviet Union. Atthat time, the former Soviet states were developingnew legislative and taxation systems, and the TTCsused their political influence to develop these systemsin their favor.45 For example, a Soviet decree banningtobacco advertising was reversed in exchange for the
Ross-Russia-forPrint-Final_B.qxd:Ross-Russia-forPrint-Final.qxd 10/1/08 12:02 PM Page 34
Hana Zarubova Ross, Samina Shariff, Anna Gilmore 35|
penalties for non-compliance with smoking bans in
places where smoking is prohibited: Fines for smoking
in public areas other than restaurants and institutional
settings can be as much as one month of the offender’s
minimum wage; in restaurants, the penalty ranges
from 25 to 50 times an individual’s monthly minimum
wage; for smoking within an institution, the fine
ranges from 800 to 1,000 times an individual’s
minimum wage.4 However, this law is rarely enforced,
and there is no federal funding for implementing and
enforcing such measures.66
Tobacco companies are lobbying policymakers
and influencing public opinion via corporate social
responsibility programs. Many TTCs have initiated
public relations campaigns focusing on adolescent
smoking — the so-called “youth smoking prevention”
campaigns. Evidence shows that these campaigns are
at best ineffective, or at worst may encourage youth
smoking. In further efforts to defray criticism, the
tobacco industry also made donations, established a
new non-governmental organization purportedly to
address the issue of youth smoking, organized
conferences on youth smoking prevention,66 and
supported the arts and competitions, among other
initiatives. 31,77
Overall, the industry is very optimistic about the
prospects of the Russian cigarette market. In October
2007, an industry magazine predicted, “The value of
cigarette sales in Russia will continue to expand. The
impressive performance in Russia continues with
strong volume and profit increases.”50 The annual
reports of BAT also comment frequently on the
Russian success story.1
The [2002] law also limited smoking in
some public places, but these restrictions
have been widely ignored.
import of 34 billion cigarettes in the early 1990s to help
overcome cigarette shortages.34 The “On Advertising”
law adopted in 1995 was based on the industry’s
voluntary code of conduct,66 and licensing of
production and wholesale trade was not introduced
until 2001, when all of the TTCs were already firmly
established in the Russian market.66
The weak “On Advertising” law has been amended
every year since 2004 and now prohibits tobacco
advertising on the radio, television, in cinemas, in print
media, in public transportation, and on billboards.4,77
However, the tobacco industry can still find loopholes
in this law (e.g. branded shops like the Marlboro
Classics clothing stores are allowed) and characterize
the marketing opportunities in Russia as favorable.50
The federal “On Restriction of Tobacco Smoking”
law that became effective January 2002 was also
shaped by the tobacco companies’ lobbying efforts.
This law required minimal health warnings,4 banned
the sale of cigarettes in packs of less than 20,
eliminated the sale of cigarettes from vending
machines, and prohibited sale of tobacco products to
people younger than 18 years old. The law also limited
smoking in some public places, but these restrictions
have been widely ignored.95
The enforcement of tobacco control legislation in
Russia is weak. The 2002 law outlines financial
Endnotes for Chapter IV
73 Mackay J, Eriksen M, Shafey O. The Tobacco Atlas. 2nd ed. Atlanta, GA: American Cancer Society; 2006.74 Gilmore A, McKee M. Moving east: How the transnational tobacco industry gained entry to the emerging markets of the former Soviet
Union-Part I: Establishing cigarette imports. Tob Control. 2004;13:143-150.75 Gilmore A, McKee M. Tobacco and transition: An overview of industry investments, impact and influence in the former Soviet Union.
Tob Control. 2004;13:136-142.
Ross-Russia-forPrint-Final_A.qxd:Ross-Russia-forPrint-Final.qxd 9/30/08 4:24 PM Page 35
36 Economics of Tobacco Taxation in Russia|
76 Datamonitor. Tobacco in Russia Industry Profile 2007 [cited July 11, 2007]; available from: www.datamonitor.com.77 Demin A. Main strategies and activities of transnational tobacco companies and their allies in Russia. Unpublished document based
on tobacco industry documents in the Gilford Depository and the Archive of British American Tobacco (BAT). available from:http://bat.library.ucsf.edu/guide.html.
78 Parker J. Dynamic changes underway in the Russian cigarette market. Tobacco International. 2007:39-43.79 East is next. Swedish Match Inside. May 2, 2003 [cited January 10, 2007].80 Gilmore A, McKee M. Exploring the impact of foreign direct investment on tobacco consumption in the former Soviet Union. Tob
Control. 2005;14:13-21.81 Market Tracking International Ltd. World Tobacco File. Emerging markets in Central and Eastern Europe 1997. Great Britain: Argus
Business Media Ltd; 1997.82 World Customs Organization, Customs and Tobacco Report 2006. 2006.83 Havocscope Global Black Market Indexes. 2008. [cited June 3, 2008]; available from:
http://www.havocscope.com/Counterfeit/cigarettes.htm.84 Joossens L, Raw M. Cigarette smuggling in Europe: Who really benefits? Tob Control. 1998;7:66-71.85 Joossens L. Smuggling and Cross-border Shopping of Tobacco Products in the European Union: A Report for the Health Education
Authority, London. London, England: Health Education Authority; 1999. available from:http://www.nice.org.uk:80/niceMedia/documents/smuggling.pdf.
86 Campbell D, Maguire K. Clarke company faces new smuggling claims. Guardian. Aug. 22, 2001. available from:http://www.guardian.co.uk/politics/2001/aug/22/conservatives.britishamericantobaccobusiness.
87 The International Consortium of Investigative Journalists. Tobacco Companies Linked to Criminal Organizations in Lucrative CigaretteSmuggling. The Center for Public Integrity. Mar. 3, 2001. [cited August 16, 2003]; available from:http://www.publicintegrity.org/report.aspx?aid=351.
88 Gilmore A. Tobacco and Transition: Understanding the Impact of Transition on Tobacco Use and Control in the Former Soviet Union.Thesis submitted to the London School of Hygiene and Tropical Medicine, London, England. 2005. available from:http://repositories.cdlib.org/tc/reports/SovietUnion/.
89 Zenith Media. Central and Eastern Europe Market and Mediafact. London, England: Zenith Optimedia; 2000.90 Ararat M. Taxation issues in Russia. 2007. Personal communication with Dr. Ross.91 Comparative Analysis of Tobacco Price and Tax Policies in the Russian Federation and EU. Moscow, Russia: National Institute of
Pulmonology (in Russian); 2007.92 World Bank. Smoking and Tobacco Control: Economic Issues. All Russian National Forum on Health or Tobacco. Moscow, Russia; May
28, 2007.93 World Bank and International Monetary Fund. Smoking and Tobacco Control: Economic Issues. All Russian National Forum on Health or
Tobacco. Moscow, Russia; May 28, 2007.94 DJ Report. Japan Tobacco Russia unit wins tax evasion case. Prime-Tass English Language Business Newswire. November 7, 2007.95 Danishevski K, McKee M. Campaigners fear that Russia’s new tobacco law won't work. BMJ. 2002;324:382.
Ross-Russia-forPrint-Final_A.qxd:Ross-Russia-forPrint-Final.qxd 9/30/08 4:24 PM Page 36
Hana Zarubova Ross, Samina Shariff, Anna Gilmore 37|
V. Tobacco Tax Policy Optionsand Their Impact on CigaretteConsumption and Tax Revenue
As discussed above, the level of tobacco taxation in
Russia is extremely low. Excise tax on medium-priced
filtered cigarettes in 2006was between 12 and 18 percent
of the retail price. Total tax including VAT amounted to
about 33 percent of the retail price. These levels are far
below the World Bank recommendations that cigarette
taxes constitute between two-thirds and four-fifths of the
retail price to discourage their consumption. The EU tax
law requires that cigarette taxes constitute at least 70
percent of the retail price (including VAT), and that the
excise tax alone be at least 64 Euro (or RUB 2,242) per
1,000 cigarettes.96
In order to reach the tax level that would discourage
tobacco use, the Russian government should consider a
sizable increase of cigarette excise taxes. Presented below
are four possible variants of a tax increase that preserve
the current tax structure; each of which is characterized
by a mixture of specific and ad valorem taxes (see Table
5.1 for a summary of tax increase alternatives). The first
option, based on the prospective tobacco excise law
adopted in 2007, is to raise the specific and ad valorem
taxes by 20 and 10 percent, respectively. In this case the
total tax (including the VAT) will comprise
approximately 35 percent of the retail price. The other
options are to increase the total tax (including the VAT)
such that it comprises 50, 64, and 70 percent of the retail
price, respectively, based on the range recommended by
the World Bank and reflecting the proposed tax level
discussed during the drafting of the federal law “On
Restriction of Tobacco Smoking” in 2001. The original
version of the law proposed an 80 percent excise tax on
Russian-sold cigarettes.77 Although the proposed base for
such a tax (wholesale or retail price) is not clear, it would
have been a step towards the EU standards.
To predict changes in consumption and revenues,
we examine the results using two levels of price elasticity
of cigarette demand: –0.1, when a 10 percent increase in
cigarette prices would result in a 1 percent decrease in
cigarette demand; and –0.2, when a 10 percent increase
in cigarette prices would result in a 2 percent decrease in
cigarette demand. These elasticities fall into the lower
range of the price sensitivity estimates20 and correspond
to the price responsiveness observed in Russia.*
Our calculation is based on medium-priced filtered
cigarettes, which hold the largest share of sales volume4
and cost on average RUB 15.55 per pack in 2006.36
Assuming that the retail price remained unchanged in
2007,� the total tax (including the VAT) on this type of
product is RUB 5.15 per pack, or 33 percent of retail
price. The impact of such tax increases is reported in
Table 5.1.
The tax increase based on the prospective tobacco
excise law could avert up to 80,000 deaths (about
0.4 percent of the expected tobacco-related mortality in
this cohort) and generate about RUB 5.3 billion
(US$ 209.3 million) in additional excise revenues.
However, the number of smokers would be reduced only
marginally.
If Russia chooses to reach the global public health
standard where tobacco tax represents 70 percent of
the retail price, up to 2.7 million tobacco-related
deaths among the Russian population could be
avoided. This would reduce tobacco-related mortality
by up to 12 percent, with an even potentially greater
* We assume that price elasticity is the same for males and females, and across age groups.� This assumption is based on the cigarette price trend between 2006 and 2007 (a slight decline in nominal prices) and the expected 10
percent inflation rate in 2007.
If Russia chooses to reach the global public
health standard where tobacco tax
represented 70 percent of the retail price, up
to 2.7 million tobacco-related deaths among
the Russian population could be avoided.
Ross-Russia-forPrint-Final_A.qxd:Ross-Russia-forPrint-Final.qxd 9/30/08 4:24 PM Page 37
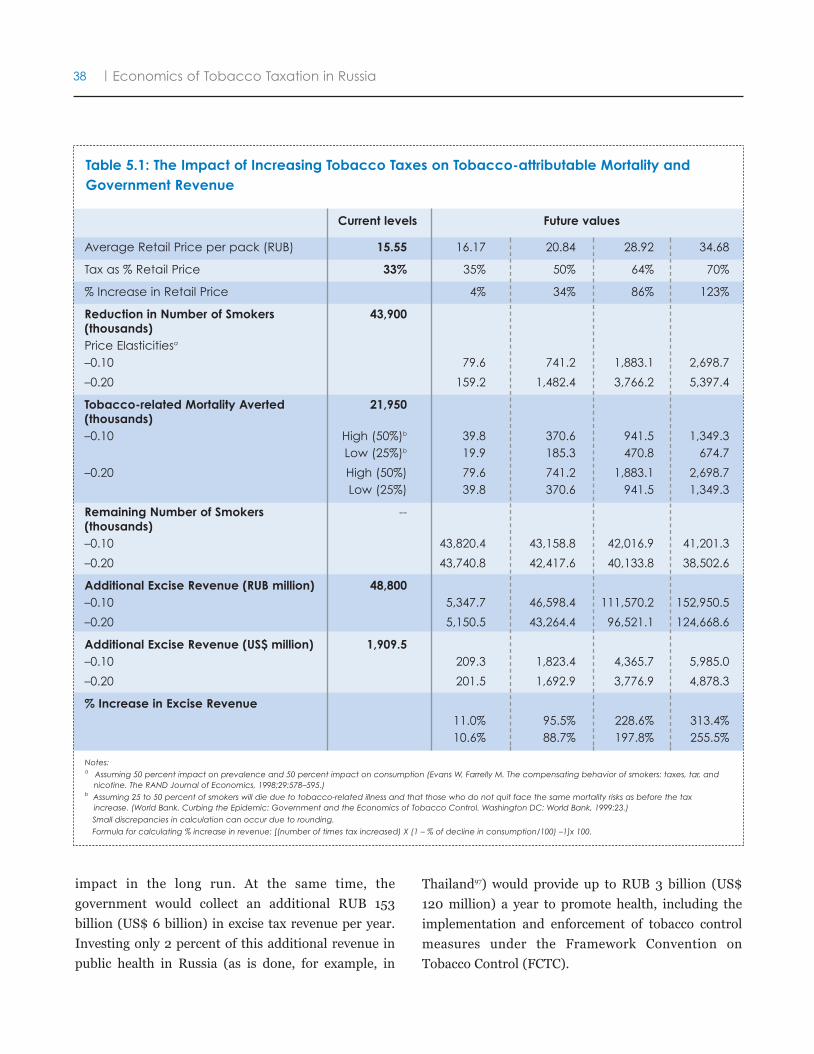
38 Economics of Tobacco Taxation in Russia|
Table 5.1: The Impact of Increasing Tobacco Taxes on Tobacco-attributable Mortality andGovernment Revenue
Notes:a Assuming 50 percent impact on prevalence and 50 percent impact on consumption (Evans W, Farrelly M. The compensating behavior of smokers: taxes, tar, and
nicotine. The RAND Journal of Economics, 1998;29:578–595.)b Assuming 25 to 50 percent of smokers will die due to tobacco-related illness and that those who do not quit face the same mortality risks as before the tax
increase. (World Bank. Curbing the Epidemic: Government and the Economics of Tobacco Control. Washington DC: World Bank, 1999:23.)
Small discrepancies in calculation can occur due to rounding.
Formula for calculating % increase in revenue: [(number of times tax increased) X (1 – % of decline in consumption/100) –1]x 100.
Current levels Future values
Average Retail Price per pack (RUB) 15.55 16.17 20.84 28.92 34.68
Tax as % Retail Price 33% 35% 50% 64% 70%
% Increase in Retail Price 4% 34% 86% 123%
Reduction in Number of Smokers 43,900(thousands)Price Elasticitiesa
–0.10 79.6 741.2 1,883.1 2,698.7
–0.20 159.2 1,482.4 3,766.2 5,397.4
Tobacco-related Mortality Averted 21,950(thousands)–0.10 High (50%)b 39.8 370.6 941.5 1,349.3
Low (25%)b 19.9 185.3 470.8 674.7
–0.20 High (50%) 79.6 741.2 1,883.1 2,698.7Low (25%) 39.8 370.6 941.5 1,349.3
Remaining Number of Smokers --(thousands)–0.10 43,820.4 43,158.8 42,016.9 41,201.3
–0.20 43,740.8 42,417.6 40,133.8 38,502.6
Additional Excise Revenue (RUB million) 48,800–0.10 5,347.7 46,598.4 111,570.2 152,950.5
–0.20 5,150.5 43,264.4 96,521.1 124,668.6
Additional Excise Revenue (US$ million) 1,909.5–0.10 209.3 1,823.4 4,365.7 5,985.0
–0.20 201.5 1,692.9 3,776.9 4,878.3
% Increase in Excise Revenue11.0% 95.5% 228.6% 313.4%10.6% 88.7% 197.8% 255.5%
impact in the long run. At the same time, the
government would collect an additional RUB 153
billion (US$ 6 billion) in excise tax revenue per year.
Investing only 2 percent of this additional revenue in
public health in Russia (as is done, for example, in
Thailand97) would provide up to RUB 3 billion (US$
120 million) a year to promote health, including the
implementation and enforcement of tobacco control
measures under the Framework Convention on
Tobacco Control (FCTC).
Ross-Russia-forPrint-Final_A.qxd:Ross-Russia-forPrint-Final.qxd 9/30/08 4:24 PM Page 38
Hana Zarubova Ross, Samina Shariff, Anna Gilmore 39|
Our calculations demonstrate that bringing the
cigarette tax level to 70 percent of the retail price provides
not only the greatest public health benefits, but also
generates the maximum tax revenue. Various studies
have shown that large real tax increases are both practical
and beneficial for the public health and state budget. For
example, between 1994 and 1999, South Africa, a country
with a sizable low-income population, raised its tobacco
excise taxes by 149 percent in real terms and doubled its
tobacco tax revenues from South African Rand (ZAR)
1,162 million to ZAR 2,332 million.98 During that period,
real cigarette prices increased by 81 percent and tobacco
consumption declined by 21 percent.99 Another example
of a successful use of tobacco tax policy comes from the
city of New York, where the excise tax on tobacco was
raised fromUS$ 0.08 to US$ 1.50 in 2002.100 Despite the
availability of cheaper cigarettes from low-tax regions
outside the city,101 the adult smoking prevalence declined
from 21.6 percent in 2002 to 17.5 percent in 2006,102 an
unprecedented 19 percent decrease in smoking rate in
just four years. During the same period, the female
smoking rate fell from 20 to 16 percent,103 and the youth
smoking rate fell from 17.6 in 2001 to 8.5 percent in
2007.102 This example illustrates that sizable tax increases
will achieve reduction in smoking prevalence even when
cheaper illicit cigarettes are available.
Our estimates suggest that raising the cigarette
tax level in Russia to that of many European countries
as recommended by the World Bank would not only
improve public health in Russia and reduce smoking-
related mortality but also yield substantial tax revenue
gains. To maximize the benefit of the proposed tax
policy, part of this newly generated revenue could be
invested in tobacco cessation services provided to
smokers wanting to quit and in the implementation of
comprehensive tobacco control measures. Such
investments would bring additional health and
economic benefits to the Russian people.
Endnotes for Chapter V
96 European Commission. Consultation Paper on the Structure and Rates of Excise Duty Applied on Cigarettes and Other ManufacturedTobacco. European Commission, Directorate-General, Taxation and Customs Union Tax Policy. Brussels, Belgium: EuropeanCommission; 2007. [cited August 12, 2007]; available from:http://ec.europa.eu/taxation_customs/resources/documents/common/consultations/tax/consultation_paper_tobacco_en.pdf.
97 World Health Organization. Tobacco and Poverty, A Vicious Circle. Geneva: World Health Organization; 2004. [cited March 28, 2008];available from: http://www.who.int/tobacco/communications/events/wntd/2004/en/wntd2004_brochure_en.pdf.
98 van Walbeek C. The tobacco epidemic can be reversed: Tobacco control in South Africa during the 1990s. In: The Economics ofTobacco Control in South Africa. Cape Town, South Africa: Applied Fiscal Research Center, University of Cape Town's School ofEconomics; 2002. available from: http://www.idrc.ca/uploads/user-S/11199733621SA-finalreport.pdf.
99 Saloojee Y. Bridging the policy gap in South Africa. Paper presented at: Global Forum for Health Research; Oct. 9-12, 2001; Geneva,Switzerland. available from: http://archive.idrc.ca/ritc/GFHR_YS.pdf.
100 Shelley D, Cantrell J, Moon-Howard J, Ramjohn D, VanDevanter N. The $5 man: The underground economic response to a largecigarette tax increase in New York City [published online ahead of print June 28 2007]. Am J Public Health. 2007;97:1483-1488.
101 Beiseitov E, ed. Higher cigarette tax has led to more tax revenue, more tax evasion. New York City Independent Budget Office. Oct.19, 2007. [cited January 24, 2008]; available from: http://www.ibo.nyc.ny.us/newsfax/insidethebudget152.pdf.
102 Maher J. Tobacco foes push increased tax on cigarettes. The Gazette. available from: http://www.alanys.org/atf/cf/%7B3ADABC12-D6E0-407C-9464-9209C6DB0D0E%7D/Art-Jan%2011,%202008-Daily%20Gazette.pdf.
103 The New York City Department of Health and Mental Hygiene. Health Commissioner Condemns Tobacco Giant R.J. Reynolds for NewEffort to Target Young Women [press release]. Mar. 19, 2007. [cited January 17, 2008]; available from:http://www.nyc.gov/html/doh/html/pr2007/pr017-07.shtml.
Our calculations demonstrate that bringing
the cigarette tax level to 70 percent of the
retail price provides not only the greatest
public health benefits, but also generates the
maximum tax revenue.
Ross-Russia-forPrint-Final_A.qxd:Ross-Russia-forPrint-Final.qxd 9/30/08 4:24 PM Page 39
40 Economics of Tobacco Taxation in Russia|
VI. Other Implications of TobaccoTax Policy
Smuggling and Product Substitution
The tobacco industry often raises the specter of an
increase in smuggling activity in response to proposed
tax increases. However, studies have demonstrated
that factors other than high prices contribute to high
levels of smuggling.84
Even though an increase in cigarette taxes could
create incentives for the illegal importation of
cigarettes to Russia, only a limited number of countries
could be potential sources of these cigarettes because
even after the proposed tax increase, the majority of
European countries would still have higher cigarette
prices than Russia.
Although higher tobacco taxes could in theory also
motivate cigarette producers to avoid paying taxes, the
income generated by the tax increase could be used to
improve corporate audit and tax law enforcement. The
tobacco industry should be required to use tax stamps,
which simplifies the tax audit and usually leads to
better compliance with tax law. Moreover, effective
tracer and tracker systems now exist that could be used
to control illegal production and distribution. Brazil has
implemented such a system, and it is similar to that
required under new legislation concerning surrogate
alcohols in Russia.104,105
Substitution among cigarettes in different price
categories may occur as the result of a higher excise
tax. Such substitution would reduce the impact of
higher taxes on smoking prevalence and consumption.
However, if the excise tax increase is driven by the
increase in the specific component of the excise tax, the
price differences among the various brands will get
smaller, reducing the incentive for brand substitution.
In addition, a tax increase above the level of inflation
will reduce the affordability of all cigarette brands, and
individuals currently consuming low-priced cigarettes
will have very few choices for substitution. Equalizing
the excise tax for filtered and non-filtered cigarettes
can further reduce brand substitution. In contrast, a
heavy reliance on ad valorem excises may encourage
price-cutting, including price wars on the part of the
tobacco industry, as the government will bear part of
any price decrease through lower ad valorem excise
and VAT collections.
Employment and Poverty
The tobacco industry is not a significant employer
in Russia. In 2005, tobacco manufacturing
employment represented less than 0.2 percent of total
industry employment in the Russian Federation.106
Reduced consumption from the proposed higher
cigarette taxes will not affect the level of this sector of
employment, which has been declining in the 2000s
owing to automation of the manufacturing process.
Despite the growing cigarette output, the number of
employees in the manufacturing sector declined from
21,420 in 2001 to 19,075 in 2005.107
Employment in tobacco farming in Russia is also
negligible; raw tobacco production is limited.
Estimates of the number of tobacco farmers in Russia
do not exist, but the approximate level of employment
in this sector can be derived based on the amount of
raw tobacco production. This calculation suggests the
presence of about 1,570 full-time jobs in Russian
tobacco farming, or about 0.002 percent of the 2005
total labor force.29 Hence, tobacco farming does not
contribute significantly to employment in Russia, and
... if the excise tax increase is driven by the
increase in the specific component of the
excise tax, the price differences between
the various brands will get smaller, reducing
the incentive for brand substitution.
Ross-Russia-forPrint-Final_A.qxd:Ross-Russia-forPrint-Final.qxd 9/30/08 4:24 PM Page 40
Hana Zarubova Ross, Samina Shariff, Anna Gilmore 41|
any reduction in cigarette production will have an
insignificant impact on unemployment. In addition,
Russian tax policy does not intend to protect the small
number of tobacco farmers from global competition, a
fact made clear by the tax policy’s lack of quotas on the
importation of tobacco leaves and low duties on such
imports (5 percent of the declared value).78
The increasing relative wealth among the Russian
population suggests that only substantial increases in
taxes on cigarettes can reduce their affordability and
thereby encourage quitting and lower rates of smoking
initiation. Between 1999 and 2002, Russia succeeded
in reducing poverty from 41.5 to 19.6 percent,108 the
equivalent of 32 million people escaping poverty
during the three-year period. Pensions are expected to
rise by 37 percent in 2007,109 and wages are increasing
annually by 12 to 15 percent in real terms, the result of
the current shortage of labor.62
Low-income adults and youth with low disposable
incomes will be most affected by tax increases and
ultimately benefit most by decreased initiation,
increased cessation, and lower consumption.110, 111 Those
who quit as a result of the proposed tax increase can
save about RUB 4,257 (US$ 167) per year based on the
average number of packs consumed per year before the
tax increase and the average price of medium-priced
filtered cigarettes in 2007. On the macro level, the
reduction in the opportunity costs of smoking among
those who quit or do not initiate will depend on the
magnitude of the tax increase (Annex 4). A tax increase
envisioned by the current tax law will result in
lowering the opportunity costs by as much as RUB 678
million (US$ 26.5 million). A tax increase to
70 percent of retail price can reduce the opportunity
costs by as much as RUB 23 billion (US$ 899 million),
or 0.12 percent of the 2005 GDP. Given the higher
price responsiveness of lower-income groups, these
savings, along with the reduced economic burden
associated with lower smoking-related health care
costs, will be enjoyed mostly by the poor. Higher
cigarette taxes therefore will confer an added benefit of
reducing economic disparities.
Economic Growth, Trade, and ForeignExchange
The Russian economy is expected to grow by at
least 7.3 percent in 2007,112 a level of growth that will be
unsustainable in future years due to an increasing
shortage of labor.62 The European Bank for
Reconstruction and Development estimates that the
labor force peaked in 2007 at 90 million, and that by
2020 there will be 15 million fewer workers in the
economy as a result of the declining Russian
population.62
Tobacco control can be a part of the long-term
solution to the shortage of labor. Several studies have
shown that reducing smoking prevalence would
substantially increase life expectancy in Russia. A non-
smoking male in the most productive earning years
(40 to 59 years old) in Russia can be expected to live
10.5 years longer than a male of the same age who
smokes 15 cigarettes per day. Similarly, the life
expectancy of a woman 30 to 69 years old smoking six
cigarettes per day would increase by six years if she
were a non-smoker.113 Higher life expectancy would
In 2005, tobacco manufacturing
employment represented less than
0.2 percent of total industry employment in
the Russian Federation.
Russia loses at least US$ 24.7 billion
nationwide annually as a result of lost
productivity resulting from premature
smoking-related mortality.
Ross-Russia-forPrint-Final_A.qxd:Ross-Russia-forPrint-Final.qxd 9/30/08 4:24 PM Page 41
42 Economics of Tobacco Taxation in Russia|
augment the number of productive years per person
and increase the labor supply.
A study by the World Bank calculated that
reducing cardiovascular disease in Russia by
20 percent would add five years to male life
expectancy,10 which in 2007 was just above 59 years.114
Since tobacco use is responsible for about 25 percent of
the deaths caused by cardiovascular diseases, the study
concluded that smoking is the “single most preventable
cause of disease and death in Russia.”113
In addition to reducing cigarette consumption —
thereby saving lives and reducing medical care costs —
and generating more government revenue, higher
cigarette taxes would also benefit the economy by
increasing overall productivity, as documented by
numerous studies.115, 116 Russia loses at least US$ 24.7
billion nationwide annually as a result of lost
productivity resulting from premature smoking-
related mortality. Higher cigarette taxes will mitigate
this loss of productivity, with the extent of the saving
dependent upon the magnitude of tax increase
implemented. Whereas tax increases legislated under
the current law will avert productivity losses of about
RUB 2 billion (US$ 90 million), a tax increase to 70
percent of the retail price can potentially avert annual
productivity losses amounting to at least RUB 77
billion (US$ 3 billion) (Annex 4).
Even though the tobacco trade represents only a
small percentage of Russian foreign trade, a sizable
tobacco tax increase would nevertheless improve the
Russian trade balance and current account by reducing
the demand for raw tobacco that is primarily imported to
Russia. Because the majority of Russian-sold cigarettes
are produced domestically, reducing consumption will
not impact the cigarette trade balance unless lower
domestic demand motivates cigarette export.
Endnotes for Chapter VI
104 Levintova M. Russian alcohol policy in the making. Alcohol. 2007;42:500-505.105 Framework Convention Alliance for Tobacco Control. FCTC COP-1 Briefing Paper #3: FCA Briefing paper setting out why COP-1 should
prioritize starting a process to develop a protocol to combat the illegal tobacco trade. 2005. available from:http://fctc.org/docs/documents/fca-2006-cop-illicit-trade-cop1-briefing-en.pdf.
106 United Nations Industrial Development Organization (UNIDO). Russian Federation: Employment, Wages, and Related Indicators byIndustry, at Current Prices, Selected Years. [cited August 19, 2007]; available from:http://www.unido.org/data/country/stats/StaTableE.cfm?ShowAll=Yes&c=RUS.
107 United Nations Industrial Development Organization (UNIDO). Russian Federation: Employment, Wages, and Related Indicators byIndustry, at Current Prices, Selected Years. [cited August 19, 2007]; available from:http://www.unido.org/data/country/stats/StaTableE.cfm?ShowAll=Yes&c=RUS
108 World Bank. Russian Federation: Reducing Poverty through Growth and Social Policy Reform. World Bank Report No. 28923-RU. Feb. 8,2005. Poverty Reduction and Economic Management Unit, Europe and Central Asia. Washington, DC: World Bank; 2005. availablefrom: http://194.84.38.65/mdb/upload/PAR_020805_eng.pdf.
109 Reuters. Russia finance officials warn of high inflation. International Herald Tribune. October 19, 2007.110 Chaloupka F, Wechsler H. Price, tobacco control policies, and smoking among young adults. J Health Econ. 1997;16:359-373.111 Samet J, Yoon S. Women and the Tobacco Epidemic. Challenges for the 21st Century. Geneva, Switzerland: World Health
Organization; 2001. available from: http://www.who.int./tobacco/media/en/WomenMonograph.pdf.
A tax increase to 70 percent of the retail
price can potentially avert annual
productivity losses amounting to at least RUB
77 billion (US$ 3 billion).
Ross-Russia-forPrint-Final_A.qxd:Ross-Russia-forPrint-Final.qxd 9/30/08 4:24 PM Page 42
Hana Zarubova Ross, Samina Shariff, Anna Gilmore 43|
112 Russian Central Bank. Public announcement, Aug. 2, 2007. St. Petersburg Times.113 Shalnova S. Cardiovascular risk factors and life expectancy in Russia (results based on the national representative sample). In:
Gerasimenko, N, Zaridze, D, Sakharova, G, eds. Health and Tobacco: Facts and Figures. 2007.114 US Bureau of the Census. Annual Estimates of the Population by Sex and Five-Year Age Groups for the United States: April 1, 2000 to
July 1, 2003. NC-EST2003-01 Washington, DC: US Bureau of the Census; June 14, 2004. [cited June 24, 2004)]; available from:http://www.census.gov/popest/national/asrh/NC-EST2003/NC-EST2003-01.xls+%22NC-EST2003-01%22+%2B+%22Census%22&hl=en&ct=clnk&cd=1&gl=us&lr=lang_en|lang_es&client=safari.
115 Hu T-W, Mao Z. Effects of cigarette tax on cigarette consumption and the Chinese economy. Tob Control. 2002;11:105-108. availablefrom: http://network.idrc.ca/waterdemand/ev-124534-201-1-DO_TOPIC.html.
116 Ye C-Y, Lee J-M, Chen S-H. Economic gains and health benefits from a new cigarette tax scheme in Taiwan: A simulation using theCGE model. BMC Public Health. 2006;6:62. available from: http://www.biomedcentral.com/1471-2458/6/62.
Ross-Russia-forPrint-Final_A.qxd:Ross-Russia-forPrint-Final.qxd 9/30/08 4:24 PM Page 43
44 | Economics of Tobacco Taxation in Russia
Discussion and Recommendations
Extremely high male smoking rates and rapidly
increasing female smoking rates will exacerbate
Russia’s demographic crisis and inflict economic harm
unless appropriate tobacco control policies are
promptly implemented. The importation of pro-
smoking Western culture to Russia without concurrent
Western-like tobacco control measures may prove
injurious to the Russian economy and a health care
system without the capacity to adequately address
smoking-attributable diseases.
Evidence-based tobacco control policies can curb
the Russian tobacco epidemic. This study focuses on
the most effective of these policies: tobacco taxes. Only
a substantial increase in cigarette excise taxes — to at
least 70 percent of retail price level — and their
automatic adjustment for inflation would produce a
significant reduction in tobacco use. Gradual annual
tax increases as envisioned by the current tax law will
have only a minimal impact on smoking prevalence,
particularly when augmented by increasing incomes
and the general level of inflation.
Equalization of the excise tax rates on filtered and
non-filtered cigarettes would further reduce cigarette
consumption by limiting the motivation for
substitution as a way to avoid a tax increase.
Equalization also would make cigarettes less
affordable for those with less disposable income
(young people and low-income groups). From an
economic perspective, the excise tax is intended to
correct for externalities; that is, costs imposed on
others without requisite compensation. In the case of
tobacco use, this cost is primarily associated with
secondhand smoking. There is no reason to believe
that non-filtered cigarettes generate less secondhand
smoke. There is also no evidence that non-filtered
cigarettes are less damaging to health than filtered
cigarettes. Thus, the adoption of a tax policy equalizing
rates for those two types would address the
externalities associated with smoking based on the
premise that all cigarettes, independent of type, are
harmful to the same degree. Tax rate equalization
should also be applied to other tobacco products to
prevent potential substitution of cigarettes.
The effectiveness of excise tax as a public health
measure would be enhanced by strengthening tax
administration and enforcing obligatory tax stamps on
cigarette packages. Despite being mandatory, tax
stamps are present on only some cigarette packs sold
in Russia. Enforcement authorities may consider
making it an offense for a retailer or wholesaler to
possess tobacco products that do not bear authentic
stamps, requiring stamps that are difficult to duplicate,
and imposing strong penalties or criminal sanctions
for producing or possessing counterfeit stamps.117
Licensing of retailers should also be considered
because doing so would allow license revocation to
become an additional enforcement tool for the
authorities. The presence of tax stamps can also help
combat smuggling by confirming the payment of excise
tax and by ensuring that goods for which the tax has
been paid in one jurisdiction do not get shipped to
another.117
The government could consider giving local
authorities an option to levy additional regional excise
tax. The notion of decentralizing taxes is not new in
Russia. For a brief period of time, Moscow and
St. Petersburg charged local sales tax, which was
Extremely high male smoking rates and
rapidly increasing female smoking rates will
exacerbate Russia’s demographic crisis and
inflict economic harm unless appropriate
tobacco control policies are promptly
implemented.
Ross-Russia-forPrint-Final_A.qxd:Ross-Russia-forPrint-Final.qxd 9/30/08 4:24 PM Page 44
Hana Zarubova Ross, Samina Shariff, Anna Gilmore 45|
abolished on January 1, 2004. As recently as July
2007, the Federal Tax Service proposed transferring
control of the production and retail sale of alcohol to
regional authorities.90
Many Russian policymakers believe that the issue
of tobacco taxes is extremely politically sensitive. They
point to the time in the early 1990s when the shortage
of cigarettes resulted in increased prices and
consequently the threat of public riots. However, the
economic situation in Russia in the early 1990s was
very different from that of the present day. With the
highly active TTCs present in Russia, the cigarette
shortages of the 1990s have been replaced by cigarette
over-production. Moreover, the Russian economy is
now growing at a fast pace, and income levels are on
the rise. The probability of civil protest against higher
tobacco taxes, which would play out in the context of
much faster-rising bread prices, is minimal. This
probability can be reduced further if a tax increase is
accompanied by a media campaign explaining the
rationale for the increase and announcing a program
funded by a portion of the tax revenue, (e.g. 2 percent
of tax revenues earmarked for programs to help
smokers quit). This campaign should stress the
harmful effects of smoking with respect to
cardiovascular diseases and the hazards of secondhand
smoke, particularly for women and children, given that
this knowledge is very limited among the population.39
Higher tobacco taxes would exacerbate
inflationary pressures that Russia has been struggling
to control since 1991. The 2007 inflation rate has
already exceeded its 8 percent target rate and reached
12 percent mark by year-end.118 To eliminate this
potential hurdle for tobacco tax increases, and to help
the government reach its goal of cutting inflation to 6
percent by 2010,109 cigarettes should be taken out of the
basket of goods used to calculate a consumer price
index.*
Somemarket analysts speculate that when foreign
capital controls more than 90 percent of the cigarette
market, the Russian government will no longer be
compelled to protect national cigarette producers and
therefore will be more willing to raise tobacco taxes to
achieve parity with EU countries.31 This level of foreign
capital control is certainly within reach, if it has not
already been achieved.
Government attention to tobacco control would
help to ease the burden placed on health care that,
despite rapid economic growth, suffers from a lack of
funding. Allotting a portion of tobacco taxes for public
health activities and improving health care is a viable
option that could be integrated into the Public Health
Project that was declared a national priority by
President Putin in 2005. The Project is of vital
importance for Russia and is aligned with the
president’s economic development goals. The
relatively progressive Ministry of Economic
Development and Trade may be a potential ally in
getting the earmark taxes on the government agenda.
Recommendations
� Increase cigarette-specific excise taxes far beyond
the level proposed by the current tax law, to at
least 70 percent of retail price level.
� Ensure for an automatic inflation adjustment for
the specific component of the cigarette excise tax.
� Equalize the excise tax rates on filtered and non-
filtered cigarettes.
� Equalize the excise tax rates on other tobacco
products.
� Earmark a portion of tobacco taxes for public
health activities and improving health care.
� Introduce additional regional excise taxes to
account for regional income differences and to
help finance regional health priorities.
* The consumer basket is the base for calculating the Consumer Price Index (CPI), which is a measure of the level of inflation. CPImeasures how much the price of a basket of consumer goods has changed over a given time period.
Ross-Russia-forPrint-Final_A.qxd:Ross-Russia-forPrint-Final.qxd 9/30/08 4:24 PM Page 45
46
� Take cigarettes out of the consumer basket of
goods for calculating inflation.
� Strengthen tax administration and tax law
enforcement.
|
� License tobacco retailers.
� Adopt other tobacco control measures called for by
the FCTC.
Economics of Tobacco Taxation in Russia
Endnotes for Discussions and Recommendations
117 Yurekli A. Design and Administer Tobacco Taxes [unpublished report]. World Bank Economics of Tobacco Toolkit. Washington, DC:World Bank; 2001. [cited December 15, 2007]; available from: http://www1.worldbank.org/tobacco/pdf/Taxes.pdf.
118 CIA World Fact Book, https://www.cia.gov/library/publications/the-world-factbook/geos/rs.html.
Ross-Russia-forPrint-Final_A.qxd:Ross-Russia-forPrint-Final.qxd 9/30/08 4:24 PM Page 46
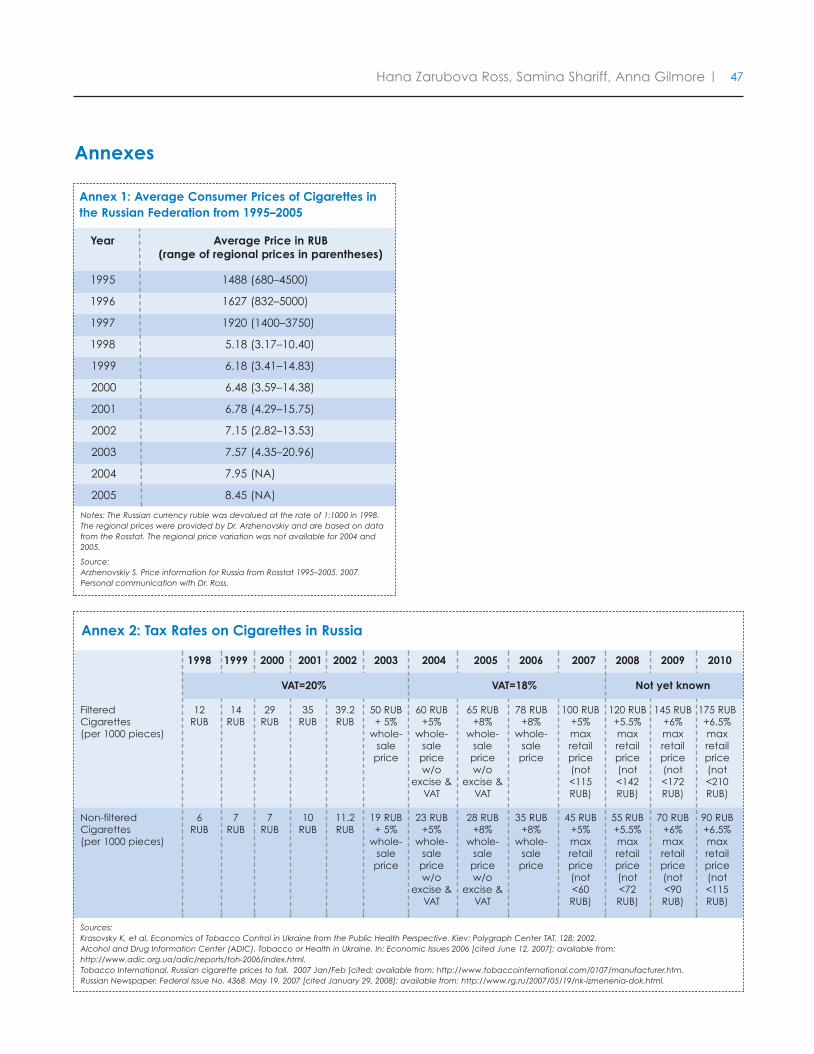
Hana Zarubova Ross, Samina Shariff, Anna Gilmore 47|
Annexes
Annex 1: Average Consumer Prices of Cigarettes inthe Russian Federation from 1995–2005
Notes: The Russian currency ruble was devalued at the rate of 1:1000 in 1998.The regional prices were provided by Dr. Arzhenovskiy and are based on datafrom the Rosstat. The regional price variation was not available for 2004 and2005.
Source:Arzhenovskiy S. Price information for Russia from Rosstat 1995–2005. 2007.Personal communication with Dr. Ross.
Year Average Price in RUB(range of regional prices in parentheses)
1995 1488 (680–4500)
1996 1627 (832–5000)
1997 1920 (1400–3750)
1998 5.18 (3.17–10.40)
1999 6.18 (3.41–14.83)
2000 6.48 (3.59–14.38)
2001 6.78 (4.29–15.75)
2002 7.15 (2.82–13.53)
2003 7.57 (4.35–20.96)
2004 7.95 (NA)
2005 8.45 (NA)
Annex 2: Tax Rates on Cigarettes in Russia
Sources:Krasovsky K, et al. Economics of Tobacco Control in Ukraine from the Public Health Perspective. Kiev: Polygraph Center TAT. 128; 2002.Alcohol and Drug Information Center (ADIC). Tobacco or Health in Ukraine. In: Economic Issues 2006 [cited June 12, 2007]; available from:http://www.adic.org.ua/adic/reports/toh-2006/index.html.Tobacco International. Russian cigarette prices to fall. 2007 Jan/Feb [cited; available from: http://www.tobaccointernational.com/0107/manufacturer.htm.Russian Newspaper. Federal Issue No. 4368. May 19, 2007 [cited January 29, 2008]; available from: http://www.rg.ru/2007/05/19/nk-izmenenia-dok.html.
1998 1999 2000 2001 2002 2003 2004 2005 2006 2007 2008 2009 2010
VAT=20% VAT=18% Not yet known
Filtered 12 14 29 35 39.2 50 RUB 60 RUB 65 RUB 78 RUB 100 RUB 120 RUB 145 RUB 175 RUBCigarettes RUB RUB RUB RUB RUB + 5% +5% +8% +8% +5% +5.5% +6% +6.5%(per 1000 pieces) whole- whole- whole- whole- max max max max
sale sale sale sale retail retail retail retailprice price price price price price price price
w/o w/o (not (not (not (notexcise & excise & <115 <142 <172 <210VAT VAT RUB) RUB) RUB) RUB)
Non-filtered 6 7 7 10 11.2 19 RUB 23 RUB 28 RUB 35 RUB 45 RUB 55 RUB 70 RUB 90 RUBCigarettes RUB RUB RUB RUB RUB + 5% +5% +8% +8% +5% +5.5% +6% +6.5%(per 1000 pieces) whole- whole- whole- whole- max max max max
sale sale sale sale retail retail retail retailprice price price price price price price price
w/o w/o (not (not (not (notexcise & excise & <60 <72 <90 <115VAT VAT RUB) RUB) RUB) RUB)
Ross-Russia-forPrint-Final_A.qxd:Ross-Russia-forPrint-Final.qxd 9/30/08 4:24 PM Page 47
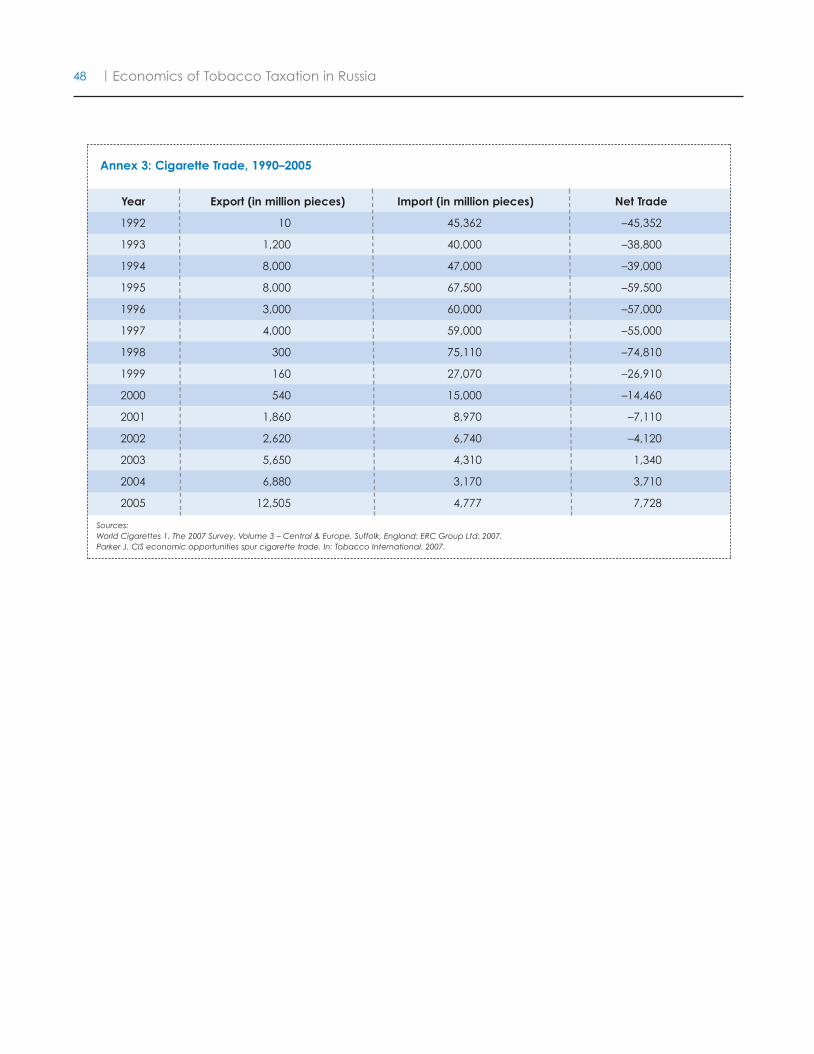
48 | Economics of Tobacco Taxation in Russia
Annex 3: Cigarette Trade, 1990–2005
Sources:World Cigarettes 1. The 2007 Survey. Volume 3 – Central & Europe. Suffolk, England: ERC Group Ltd; 2007.Parker J. CIS economic opportunities spur cigarette trade. In: Tobacco International. 2007.
Year Export (in million pieces) Import (in million pieces) Net Trade
1992 10 45,362 –45,352
1993 1,200 40,000 –38,800
1994 8,000 47,000 –39,000
1995 8,000 67,500 –59,500
1996 3,000 60,000 –57,000
1997 4,000 59,000 –55,000
1998 300 75,110 –74,810
1999 160 27,070 –26,910
2000 540 15,000 –14,460
2001 1,860 8,970 –7,110
2002 2,620 6,740 –4,120
2003 5,650 4,310 1,340
2004 6,880 3,170 3,710
2005 12,505 4,777 7,728
Ross-Russia-forPrint-Final_A.qxd:Ross-Russia-forPrint-Final.qxd 9/30/08 4:24 PM Page 48
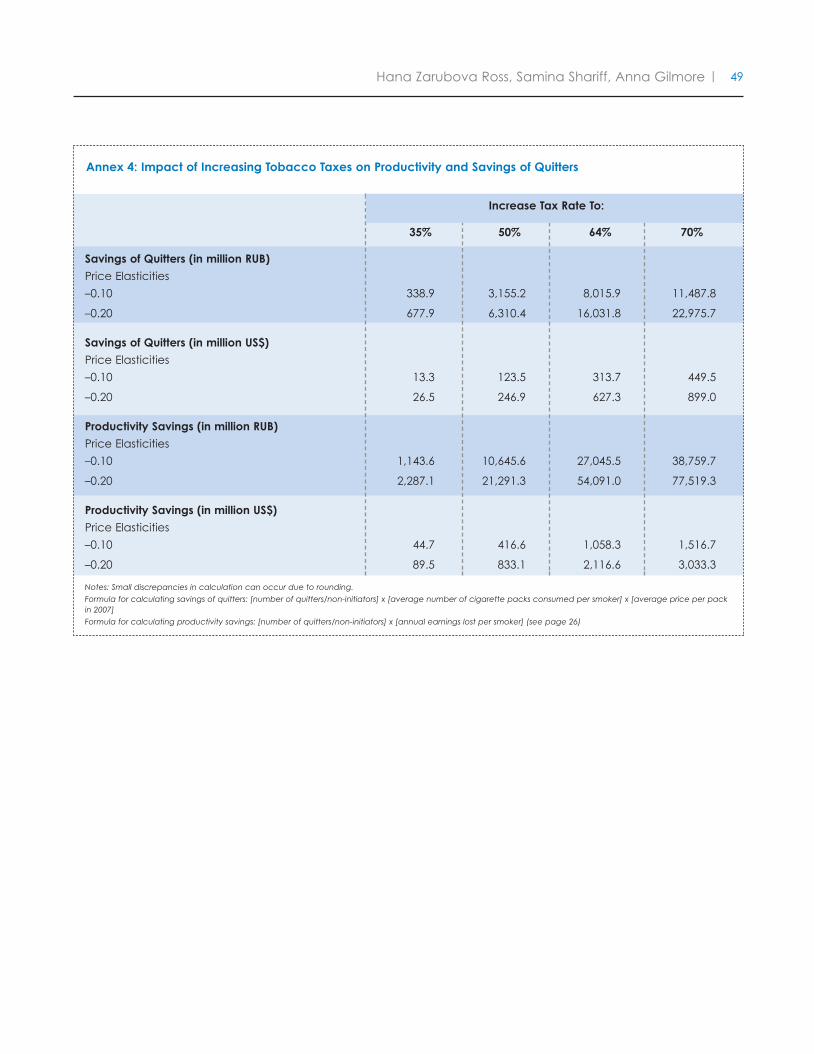
Hana Zarubova Ross, Samina Shariff, Anna Gilmore 49|
Annex 4: Impact of Increasing Tobacco Taxes on Productivity and Savings of Quitters
Notes: Small discrepancies in calculation can occur due to rounding.
Formula for calculating savings of quitters: [number of quitters/non-initiators] x [average number of cigarette packs consumed per smoker] x [average price per packin 2007]
Formula for calculating productivity savings: [number of quitters/non-initiators] x [annual earnings lost per smoker] (see page 26)
Increase Tax Rate To:
35% 50% 64% 70%
Savings of Quitters (in million RUB)
Price Elasticities
–0.10 338.9 3,155.2 8,015.9 11,487.8
–0.20 677.9 6,310.4 16,031.8 22,975.7
Savings of Quitters (in million US$)
Price Elasticities
–0.10 13.3 123.5 313.7 449.5
–0.20 26.5 246.9 627.3 899.0
Productivity Savings (in million RUB)
Price Elasticities
–0.10 1,143.6 10,645.6 27,045.5 38,759.7
–0.20 2,287.1 21,291.3 54,091.0 77,519.3
Productivity Savings (in million US$)
Price Elasticities
–0.10 44.7 416.6 1,058.3 1,516.7
–0.20 89.5 833.1 2,116.6 3,033.3
Ross-Russia-forPrint-Final_A.qxd:Ross-Russia-forPrint-Final.qxd 9/30/08 4:24 PM Page 49

50 | Economics of Tobacco Taxation in Russia
Acknowledgements
We would like to thank Marya Levintova, Galina Sakharova, Sviatoslav L. Plavinski, Ararat Mkrtchyan, and ElizabethWard for their comments, and Elizabeth Connor for her editing assistance.
Ross-Russia-forPrint-Final_A.qxd:Ross-Russia-forPrint-Final.qxd 9/30/08 4:24 PM Page 50

Ross-Russia-forPrint-Final_A.qxd:Ross-Russia-forPrint-Final.qxd 9/30/08 4:24 PM Page BC1

October 2008
ISBN: 978-2-914365-45-1
Ross-Russia-forPrint-Final_A.qxd:Ross-Russia-forPrint-Final.qxd 9/30/08 4:24 PM Page BC2