Embed Size (px)
Citation preview

E C O N O M I C S : T H E S T U DY O F O P P O RT U N I T Y C O S T
CHAPTER 1

DEFINITION OF ECONOMICS
According to Guell:• Economics: the study of the allocation and use of
scarce resources to satisfy unlimited human wants
• Opportunity Cost• The forgone alternative of the choice madeOr• What you would have done had you not done what you
did.

OPPORTUNITY COSTS
• Point of both of these is that if you want to get more of one thing you typically have to give up something of another
We see these things all the time:1. In order to buy food I need to give up money2. In order to get money I have to give up some free
time and work more3. If I want to eat more potato chips I have to spend
less on bananas4. I spend time in school today to make money in
the future

The opportunity cost can be different over time
When you study you give up time when you could be doing something else.
The opportunity cost of your time probably is different:• On a Monday Evening• On a Saturday Night• During the Super Bowl• On thanksgiving• On the day you get married

PRODUCTION POSSIBILITIES FRONTIER
• We are going to start with a simple model to learn how economists formalize these things
• This is called a production possibilities frontier
• Just a fancy way of describing the the way in which we are limited in what we can get
PRODUCTION POSSIBILITIES FRONTIER
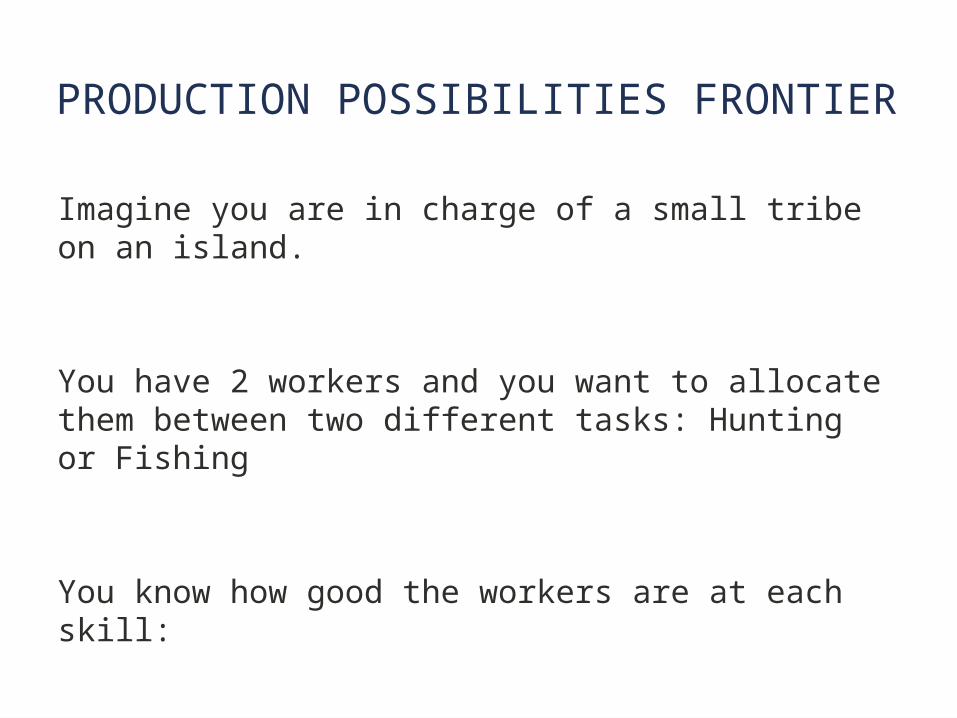
Imagine you are in charge of a small tribe on an island.
You have 2 workers and you want to allocate them between two different tasks: Hunting or Fishing
You know how good the workers are at each skill:

WORKERS
Workers Fish Deer
Bill 40 2
Sally 20 4
How do you assign them?There are 4 different possibilities that would lead to the following outcomes:
Fisherman Fish Deer
None 0 6
Bill 40 4
Sally 20 2
Both 60 0

FISH AND DEER
Deer
0 10 20 30 40 50 60 700
1
2
3
4
5
6
7
Fish
Inefficient

NOW SUPPOSE WE ADD A FEW MORE PEOPLE
Name Fish Deer
Donna 50 1
Bill 40 2
Jane 30 3
Sally 20 4
Carl 10 5
This gives us quite a few more options
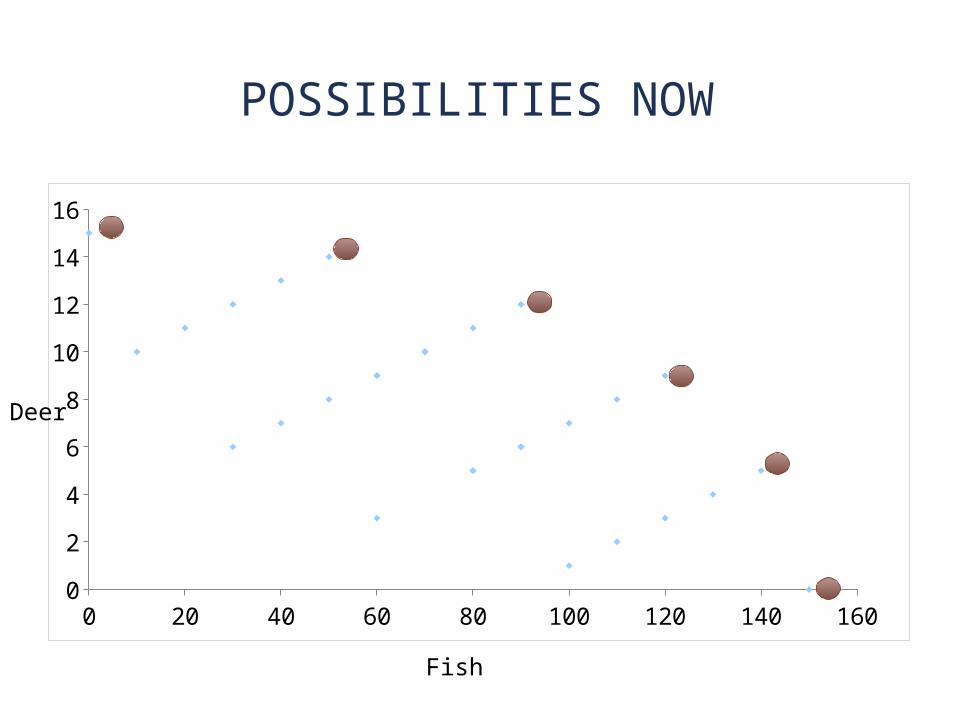
POSSIBILITIES NOW
0 20 40 60 80 100 120 140 1600
2
4
6
8
10
12
14
16
Fish
Deer

WITH A LOT OF PEOPLE
Now it is going to look something like this:
Fish
Deer
Not Attainable
Attainable (but not efficient)
We are going to end up somewhere on the red line
Attainable (and efficient)

WHAT WILL I CHOOSE?
I know that I will be somewhere on the red lineBut where?
It depends how much I like venison as opposed to seafood
There is a tradeoff between fish and deer:The more deer I get the fewer fish I can get
Economics is fundamentally about making these kinds of tradeoffs
INCREASING OPPORTUNITY COSTS
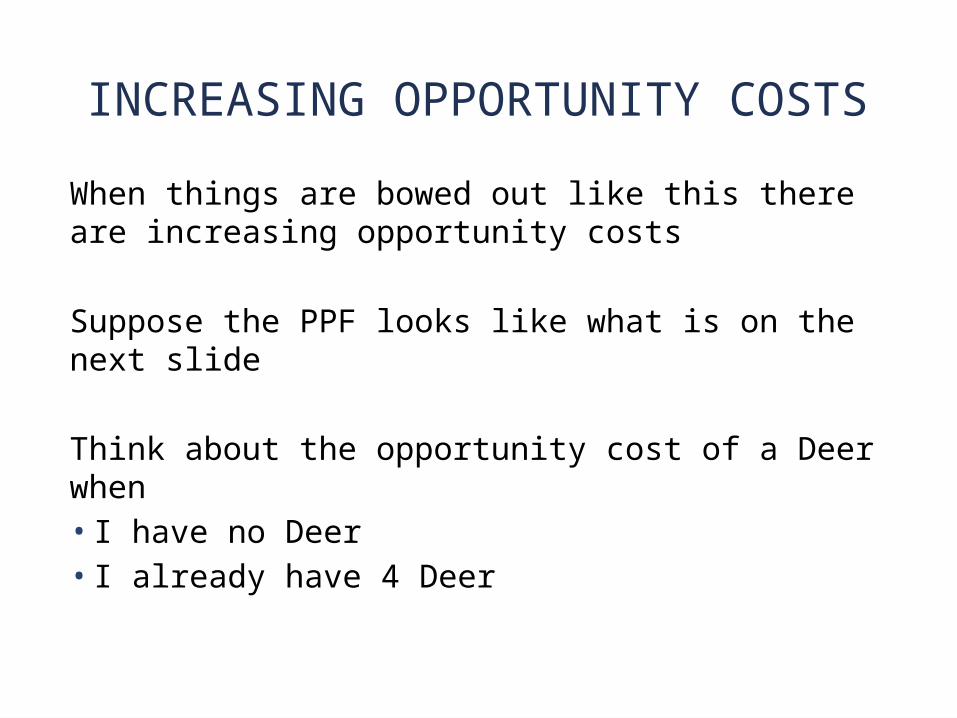
When things are bowed out like this there are increasing opportunity costs
Suppose the PPF looks like what is on the next slide
Think about the opportunity cost of a Deer when• I have no Deer• I already have 4 Deer

0 2 4 6 8 10 12 14 160
1
2
3
4
5
6
Deer
Fish
If I have no Deer, the opportunity cost of a deer is
1 fish
If I already have 4 Deer, the opportunity cost of another is
5 fish
Increasing Opportunity Cost

HOMOGENEOUS WORKERS
Now suppose all workers are the same
Worker Fish Deer
Henry 20 2
Phil 20 2
Anne 20 2
Rachel 20 2
Barney 20 2

PPF WITH WORKERS SAME
0 20 40 60 80 100 1200
2
4
6
8
10
12
Fish
Deer
Here the opportunity cost is constant
The opportunity cost of 2 more deer is
20 fish regardless of how many deer I already have

BUDGET CONSTRAINT
This is also very similar to another really important concept: the budget constraint• Suppose you have $100 to spend on Deer and
Fish• The price of a fish is $1.00• The price of a deer is $10.00
• This will look exactly the same

THE BIG PICTURE
Circular Flow Model: A model that shows the interactions of all economic actors
• Markets are where the interactions take place (rectangles)
• Actors are the entities interacting (ovals)

MARKETS IN A CIRCULAR FLOW DIAGRAM
• Market: Any mechanism by which buyers and sellers negotiate an exchange• Factor Market: A mechanism by
which buyers and sellers of labor and financial capital negotiate an exchange.• Goods and Services Market: A
mechanism by which buyers and sellers of goods and services negotiate an exchange.• Foreign Exchange Market: A
mechanism by which buyers and sellers of the currencies of various countries negotiate an exchange.

ACTORS IN A CIRCULAR FLOW DIAGRAM
• Households
• Firms
• Government


THINKING ECONOMICALLY: MARGINAL ANALYSIS
•Optimization Assumption: an assumption that suggests that the person in question is trying to maximize some objective
•We usually assume people are maximizing utility or happiness
• Firms maximize profits

MARGINAL COSTS AND BENEFITS
• Marginal Benefit: the increase in the benefit that results from an action• Marginal Cost: the increase in the cost that
results from an actionGenerally we do things until the marginal cost=marginal benefit• If the marginal cost of fish I give up is greater
than the marginal benefit I get from more deer, then I have too many deer• If the marginal cost of fish is less than the
marginal benefit then I want more deer

POSITIVE AND NORMATIVE ANALYSIS
• Positive Analysis: a form of analysis that seeks to understand the way things are and why they are that way
• Normative Analysis: a form of analysis that seeks to understand the ways things should be

ECONOMIC INCENTIVES
• Incentive: something that influences the decisions we make
Examples:1. Hourly wage influences how many hours you work2. My grade scale influences how hard you study3. Price of gas influences how much gas you buy4. Taxes on pineapples influence how many
pineapples you eat5. Paying teachers based on students test scores
influences how they teach

UNINTENDED CONSEQUENCES
Thinking about policy the most important thing economics has to offer is that policies often affect incentives and these incentives can have unintended consequencesExamples:• Taxes• Teacher Cheating• Welfare(and other social programs)• Insurance• Safety Regulations

CORRELATION AND CAUSATION
If I was still teaching econometrics I would make a really big deal of this
Often what we learn in economics depends on data and how we think about data is important
Causation just means that one thing causes another

Correlation means that they are related in the data (tend to move together)
Things that are positively correlated:• Height/Weight• Wife’s Education/Husband’s education• GDP/Food Consumption
Things that are negatively correlated:• Unemployment/GDP Growth• Family Income/Family Size
Things that are not correlated have no relationship• Temperature here/weight of Vice President• Result of first die/result of second die

• Just because two things are correlated does not
mean that one causes the other
• Possibilities:• A causes B• A causes B and B causes A at the same time• Z causes both A and B
• These are not mutually exclusive• This is not a minor problem-it makes empirical
work in economics very difficult• As we will see in this course theory is not enough-
we need to combine models with evidence to really say anything strong about policy