Embed Size (px)
Citation preview
Economics
This is the complete set of notes for all 5 units: Fundamentals, Personal Finance, Microeconomics, Macroeconomics, and International Economics
***Class Copy- Please return at the end of the semester***
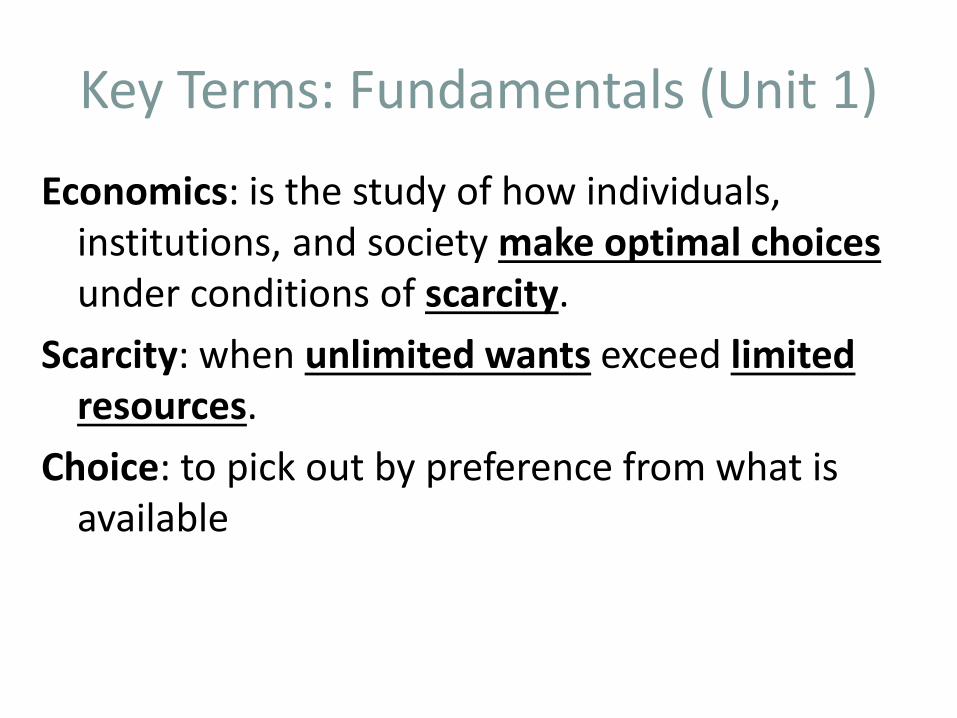
Key Terms: Fundamentals (Unit 1)
Economics: is the study of how individuals, institutions, and society make optimal choices under conditions of scarcity.
Scarcity: when unlimited wants exceed limited resources.
Choice: to pick out by preference from what is available
Key Terms
Wants: may be things people must have to live (shelter, food, or clothing) or simply goods and services one desires and would obtain if he/she could.
Needs: shelter, food, and clothing Resources: are those things which humans can
put to productive use( factors of production).
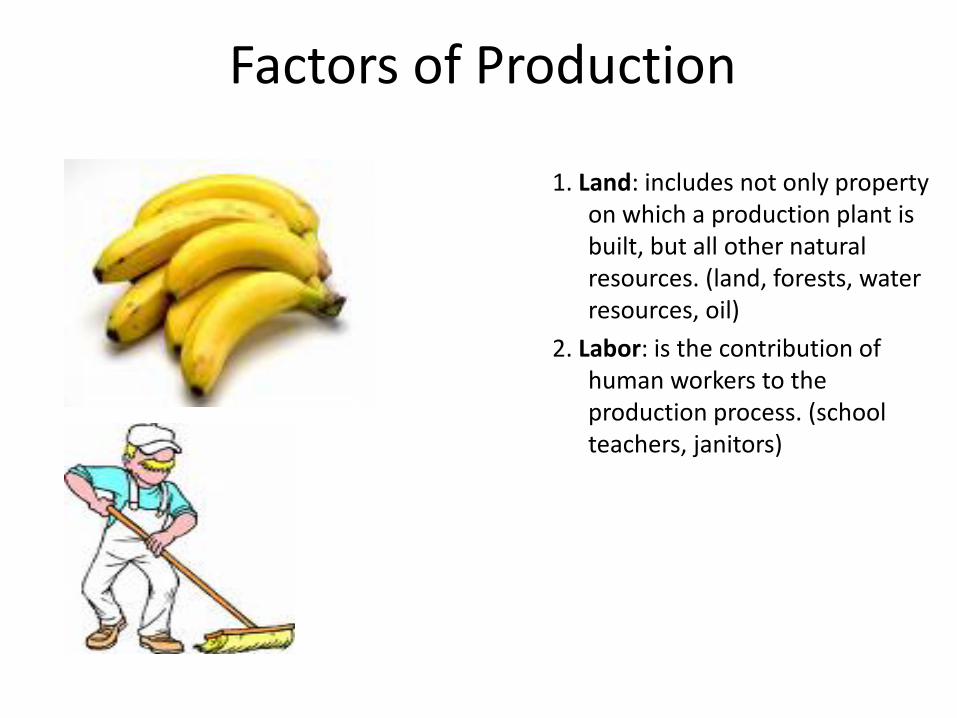
Factors of Production
1. Land: includes not only property on which a production plant is built, but all other natural resources. (land, forests, water resources, oil)
2. Labor: is the contribution of human workers to the production process. (school teachers, janitors)
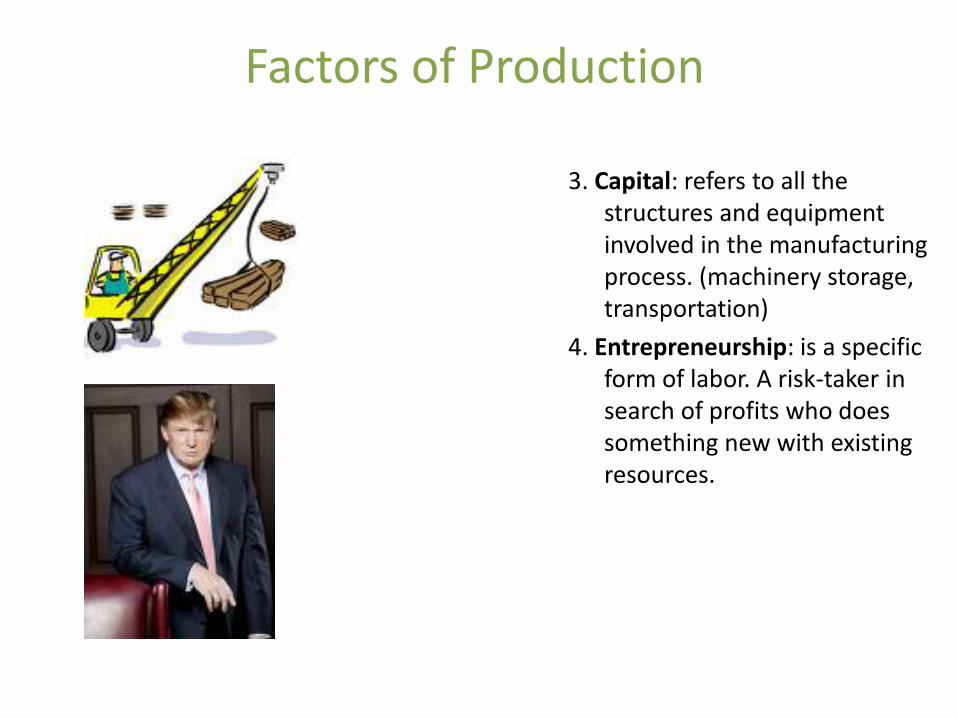
Factors of Production
3. Capital: refers to all the structures and equipment involved in the manufacturing process. (machinery storage, transportation)
4. Entrepreneurship: is a specific form of labor. A risk-taker in search of profits who does something new with existing resources.
How the Factors of Production Earn Money
WIRP 1. Wages (for labor) 2. Interest (for capital) 3. Rent (for land) 4. Profit (entrepreneurs)
Strategies for Allocating Scarce Resources
Role of Price 1. Prices serve a vital role in the free market economy 2. Prices help move land, labor, and capital into the
hands of Producers, and finished goods into the hands of buyers.
3. Prices create efficient resources allocation for producers and a language that both consumers and producers can us.
Strategies for Allocating Scarce Resources
Prices provide a language for buyers and seller
1. Price as an incentive: prices communicate to both buyers sellers whether goods or services are scarce or easily available. Prices can encourage or discourage production.
2. Signals: a high price is a green light to tell producers to make more. A low price is a red light telling producers to make less.
3. Flexibility: in many markets, prices are much more flexible than production levels. They can be easily increased or decreased to solve problems of excess supply or excess demand.
Strategies for Allocating Scarce Resources
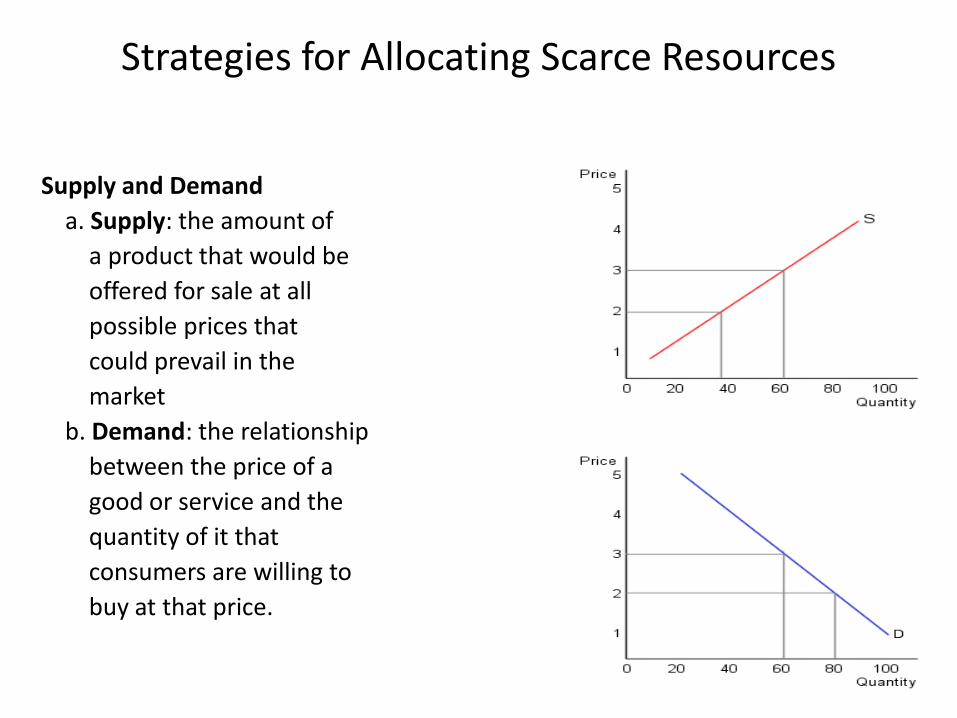
Supply and Demand a. Supply: the amount of a product that would be offered for sale at all possible prices that could prevail in the market b. Demand: the relationship between the price of a good or service and the quantity of it that consumers are willing to buy at that price.
Strategies for Allocating Scarce Resources
Government Regulation 1. Price ceiling: means that the price of a certain good
or service is not allowed to rise above a certain level. 2. Price floor: means that a certain good or service is
not allowed to drop below a certain price 3. Rationing: only allows citizens to purchase so much of
a scarce good to make sure there is enough
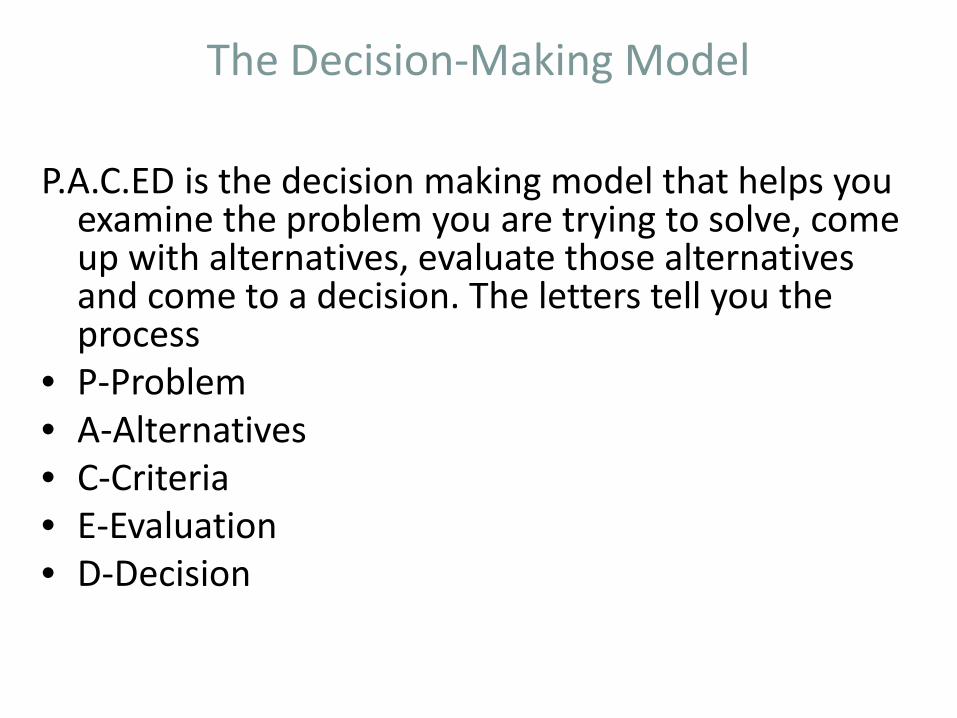
The Decision-Making Model
P.A.C.ED is the decision making model that helps you examine the problem you are trying to solve, come up with alternatives, evaluate those alternatives and come to a decision. The letters tell you the process
• P-Problem • A-Alternatives • C-Criteria • E-Evaluation • D-Decision
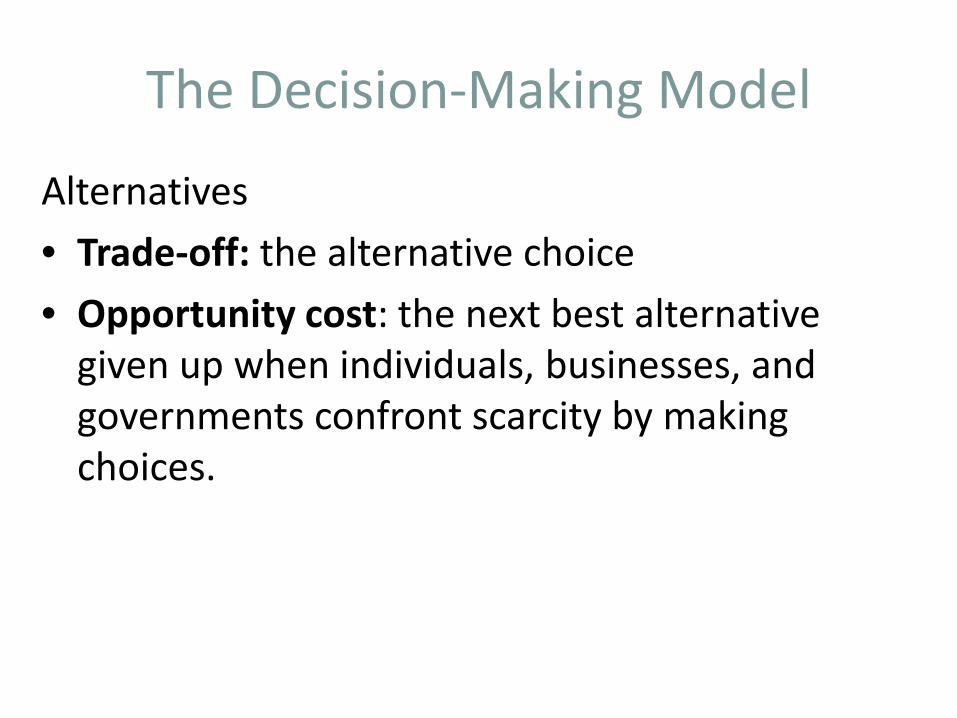
The Decision-Making Model
Alternatives • Trade-off: the alternative choice • Opportunity cost: the next best alternative
given up when individuals, businesses, and governments confront scarcity by making choices.
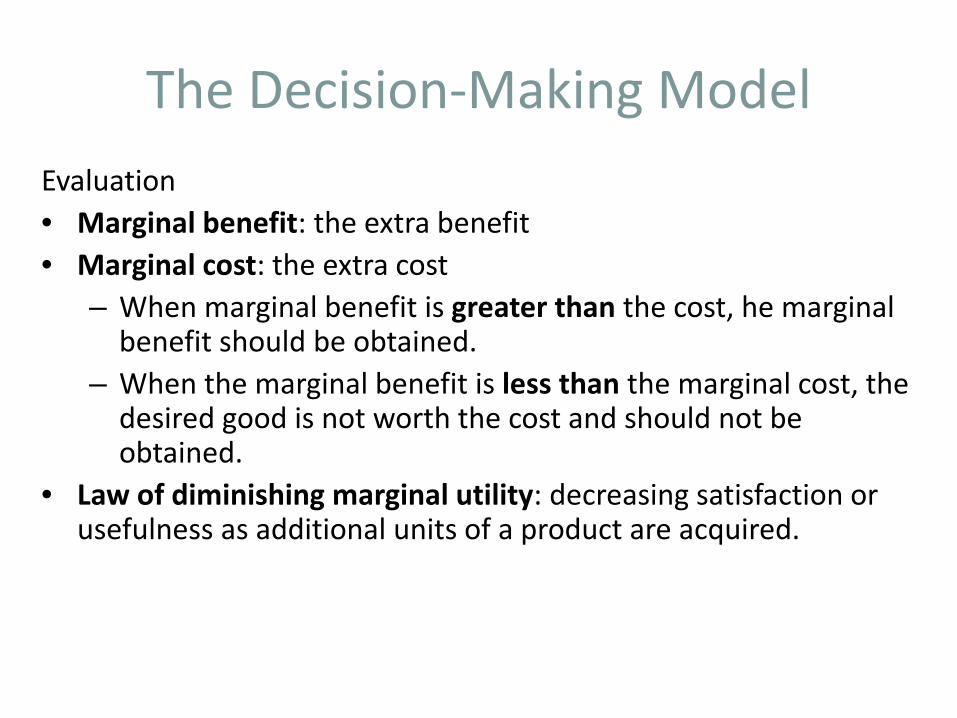
The Decision-Making Model Evaluation • Marginal benefit: the extra benefit • Marginal cost: the extra cost
– When marginal benefit is greater than the cost, he marginal benefit should be obtained.
– When the marginal benefit is less than the marginal cost, the desired good is not worth the cost and should not be obtained.
• Law of diminishing marginal utility: decreasing satisfaction or usefulness as additional units of a product are acquired.
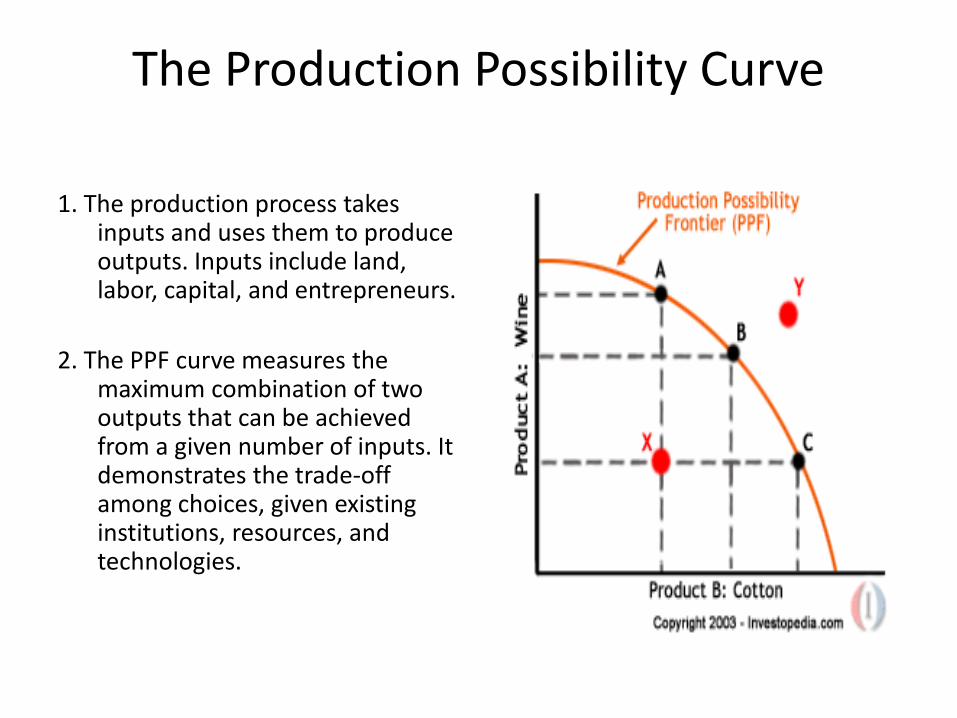
The Production Possibility Curve
1. The production process takes inputs and uses them to produce outputs. Inputs include land, labor, capital, and entrepreneurs.
2. The PPF curve measures the
maximum combination of two outputs that can be achieved from a given number of inputs. It demonstrates the trade-off among choices, given existing institutions, resources, and technologies.
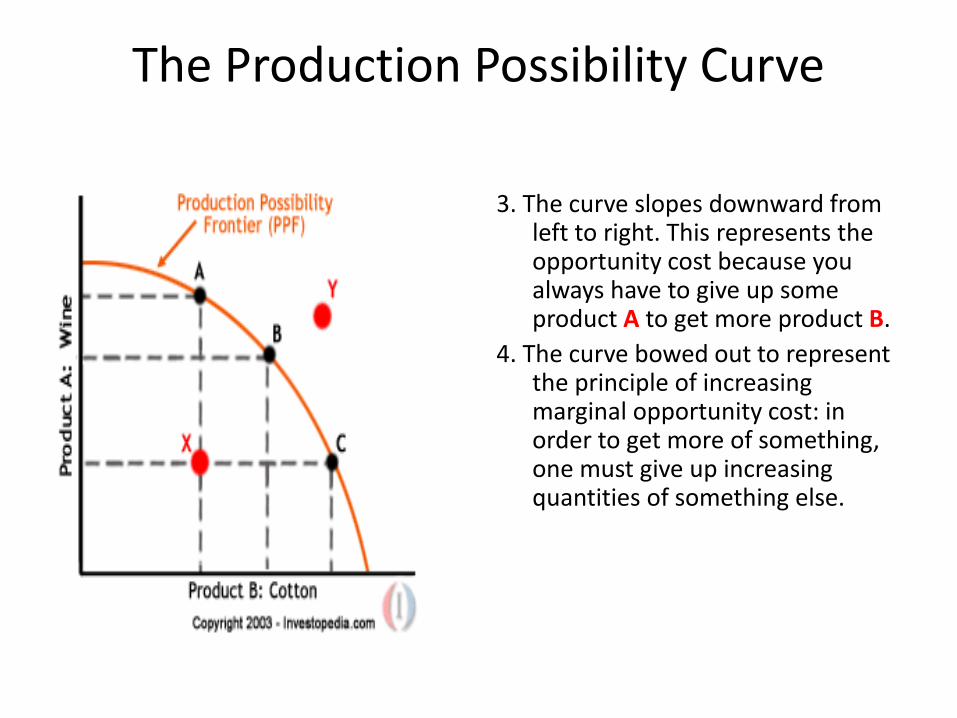
The Production Possibility Curve
3. The curve slopes downward from left to right. This represents the opportunity cost because you always have to give up some product A to get more product B.
4. The curve bowed out to represent the principle of increasing marginal opportunity cost: in order to get more of something, one must give up increasing quantities of something else.
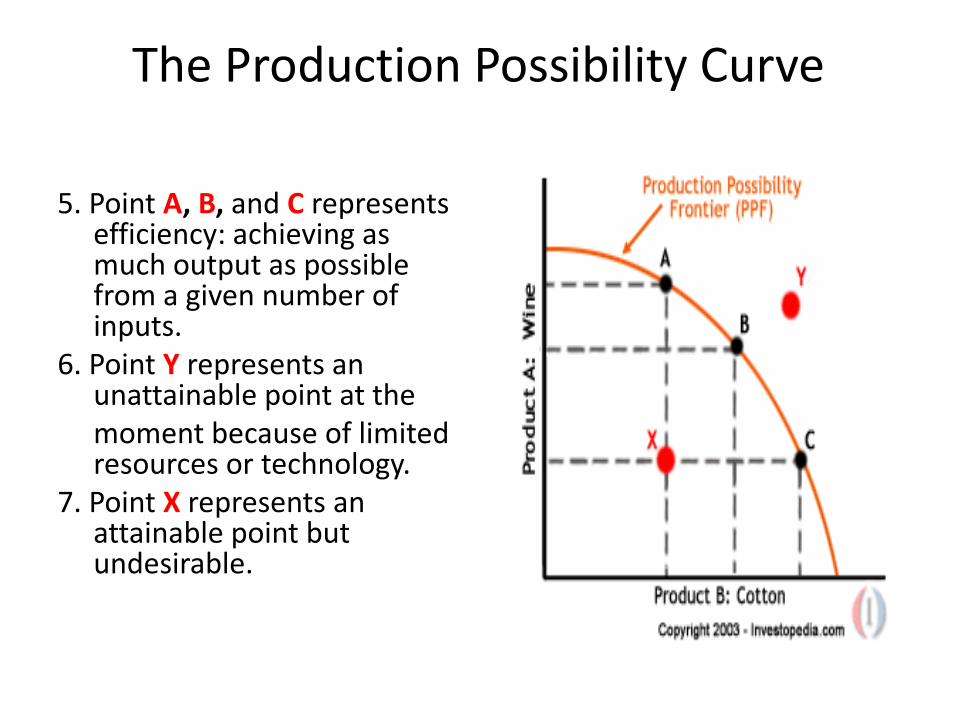
The Production Possibility Curve
5. Point A, B, and C represents efficiency: achieving as much output as possible from a given number of inputs.
6. Point Y represents an unattainable point at the
moment because of limited resources or technology.
7. Point X represents an attainable point but undesirable.
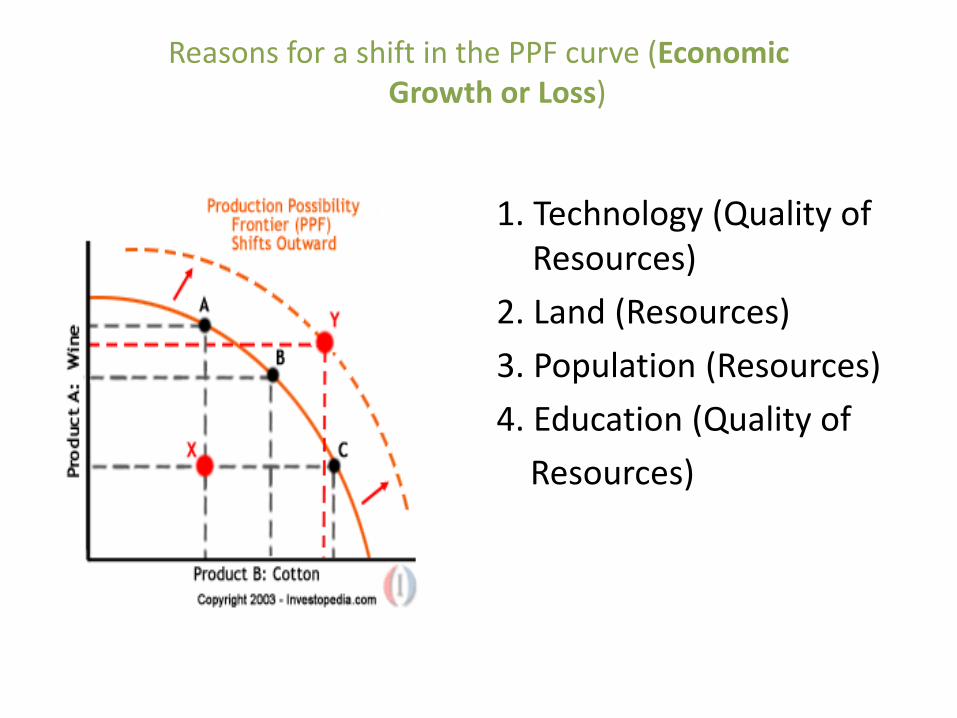
Reasons for a shift in the PPF curve (Economic Growth or Loss)
1. Technology (Quality of Resources)
2. Land (Resources) 3. Population (Resources) 4. Education (Quality of Resources)
Key Concepts
1. Profit: the money made after producers have paid for all of their costs.
2. Productivity: the measure of the amount of output produced by a given amount of inputs in a specific period of time.
Key Concepts
3. Specialization: allows individuals, firms, regions, or nations to concentrate on a single activity or area of expertise. Example: peaches in Georgia, grapes in California
4. Division of labor: breaking productive tasks into smaller and more specialized acts.
Example: the assembly line
Key Concepts
5. Voluntary exchange: is when individuals and businesses freely choose to exchange goods, services, and resource for something else of value.
4 Types of Economies
Traditional Economy 1. Economic activity stems from the rituals, habits or
customs. 2. Strengths:
– Everyone knows their role. There is little uncertainty about WHAT to produce, HOW to produce. All is based on customs and traditions.
3. Weaknesses: – New ideas are discouraged. There is little variety of
goods, services, and ideas about producing them. The tendency away from progress leads to lower standards of living in traditional systems.
4Types of Economies Command economy 1. The central authority or government, makes most of the economic
decisions. 2. Strengths:
– Changes can be made quickly and efficiently, because the government has control of all resources and makes all decisions about WHAT, HOW and FOR WHOM to produce goods and services.
3. Weaknesses: – This system provides few incentives for workers to give their best effort-
workers have no say in what is produced and how it is produced (their jobs) and may have not interest in quality of their products. (PEOPLE DON’T ENJOY BEING TOLD WHAT TO DO ALL THE TIME….)
– The government must have many workers to carry out it’s work---to many people making decisions can slow the process and increase costs of production.
4 Types of Economies
1. Weaknesses Continued: o The wants and needs of the citizens sometimes go
unheeded as the government makes decisions for all (THERE IS LITTLE VARIETY OF GOODS AND SERVICES)
o This system is relatively inflexible and cannot react quickly to daily problems that arise in production.
o New ideas rarely find their way into the economy. Entrepreneurship is squelched.
4 Types of Economies
Market Economy 1. Define 2. Strengths:
– This system can adjust to change gradually. – Government interference is low, giving consumers
freedom to choose what they want to buy and producers freedom to choose what and how to produced goods.
4 Types of Economies
2. Strengths Continued:
– Decentralized decision making gives more people a voice in the way the economy runs.
– The variety of goods and services provided in a market economy is high, so consumers satisfaction is higher than in systems where there is little variety.
4 Types of Economies
3. Weaknesses : – People who cannot work-because they are too old
or young, to sick, or otherwise physically unable to do work– are at a disadvantage, because this system rewards productive resources and does not protect non-productive resources. Without some government involvement, these people suffer.
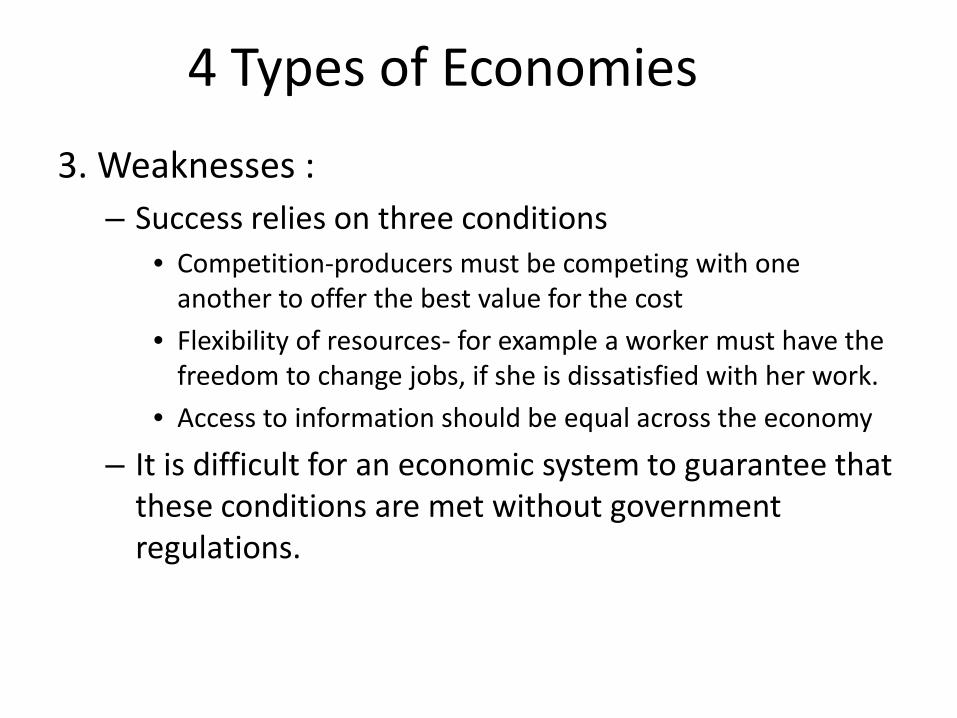
4 Types of Economies 3. Weaknesses :
– Success relies on three conditions • Competition-producers must be competing with one
another to offer the best value for the cost • Flexibility of resources- for example a worker must have the
freedom to change jobs, if she is dissatisfied with her work. • Access to information should be equal across the economy
– It is difficult for an economic system to guarantee that these conditions are met without government regulations.
4 Types of Economies
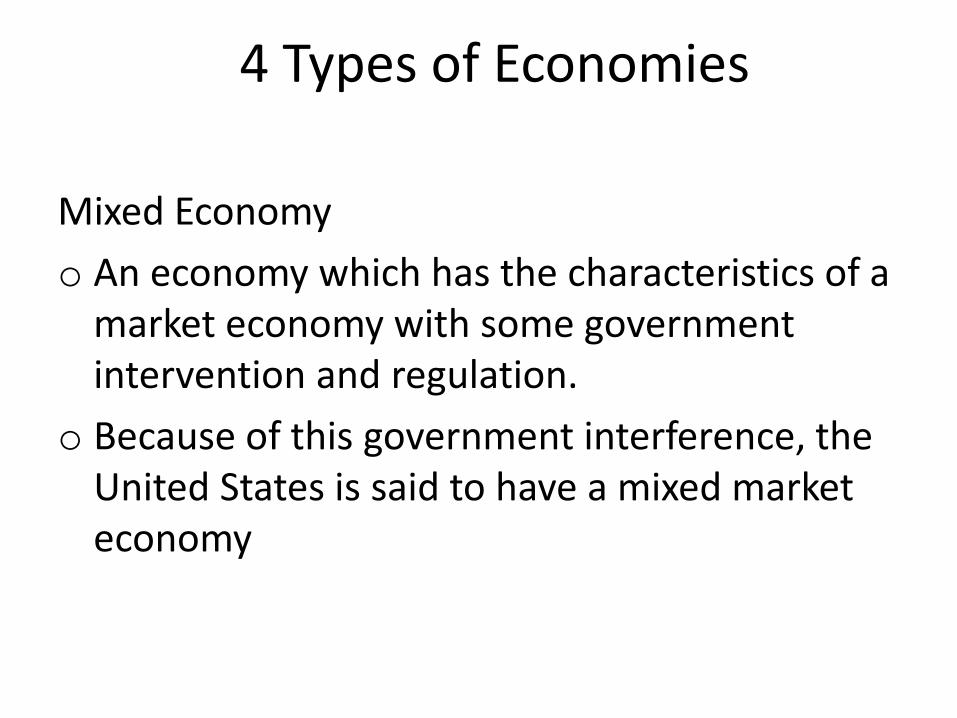
Mixed Economy o An economy which has the characteristics of a
market economy with some government intervention and regulation.
o Because of this government interference, the United States is said to have a mixed market economy
4 Types of Economies
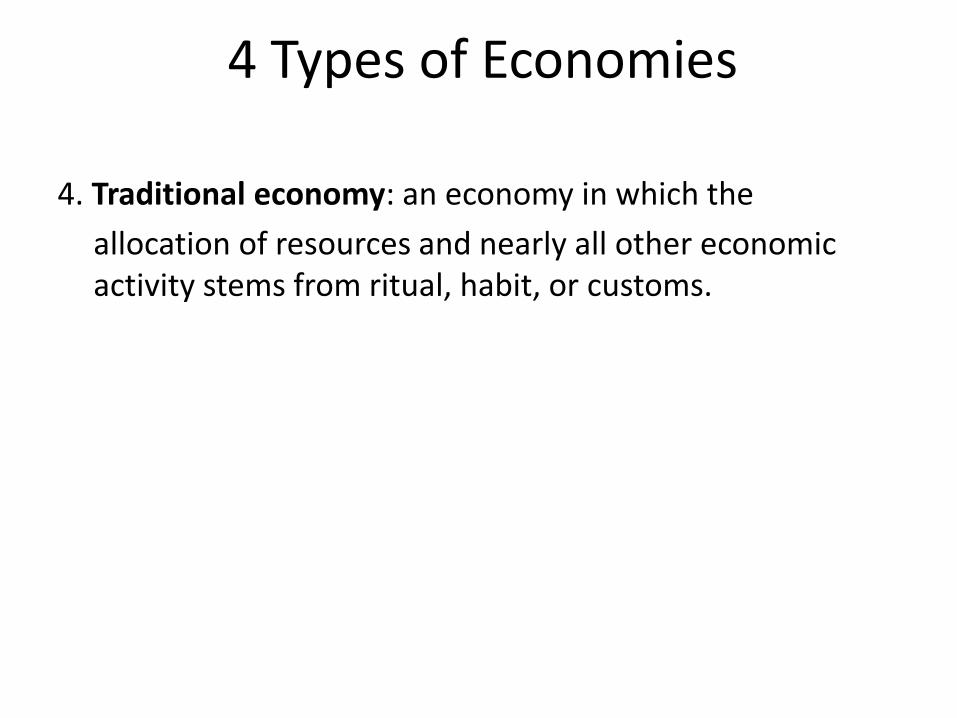
4. Traditional economy: an economy in which the allocation of resources and nearly all other economic
activity stems from ritual, habit, or customs.
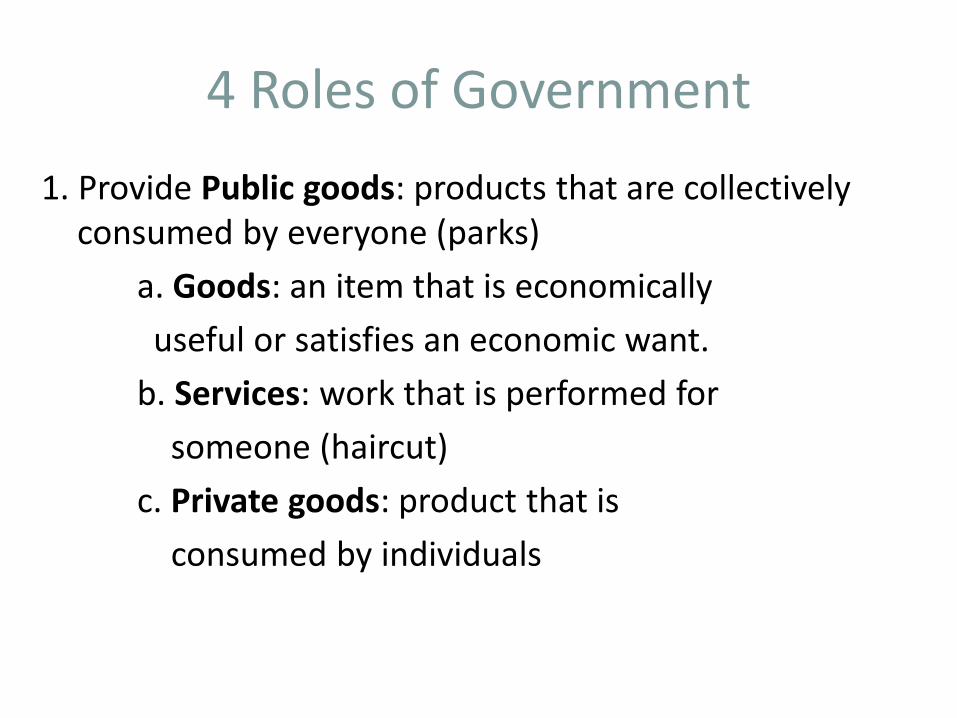
4 Roles of Government 1. Provide Public goods: products that are collectively
consumed by everyone (parks) a. Goods: an item that is economically useful or satisfies an economic want. b. Services: work that is performed for someone (haircut) c. Private goods: product that is consumed by individuals
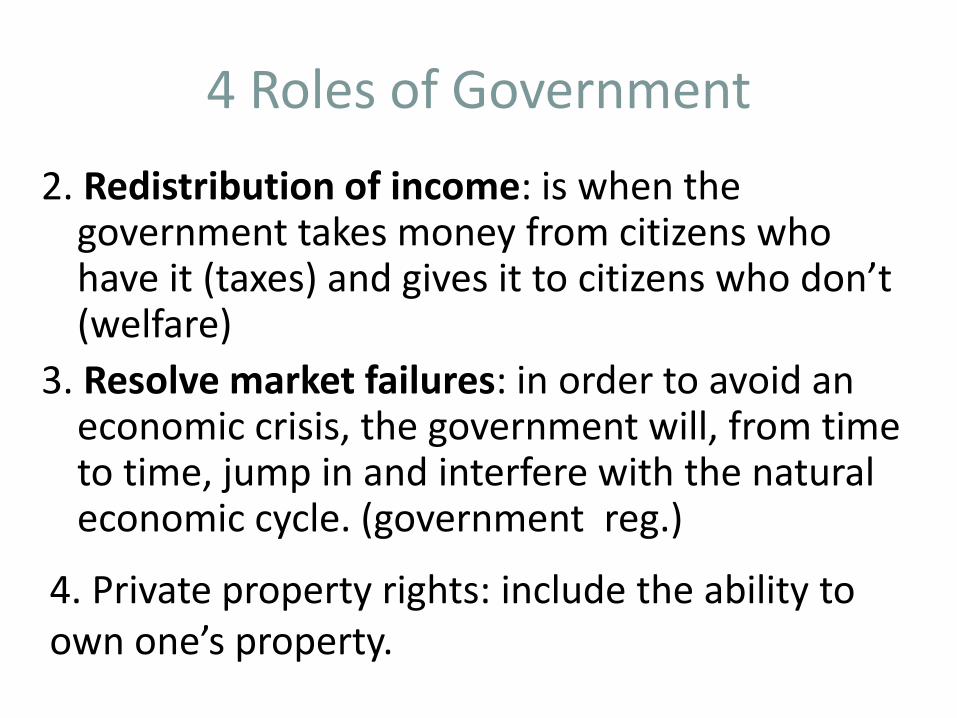
4 Roles of Government 2. Redistribution of income: is when the
government takes money from citizens who have it (taxes) and gives it to citizens who don’t (welfare)
3. Resolve market failures: in order to avoid an economic crisis, the government will, from time to time, jump in and interfere with the natural economic cycle. (government reg.)
4. Private property rights: include the ability to own one’s property.
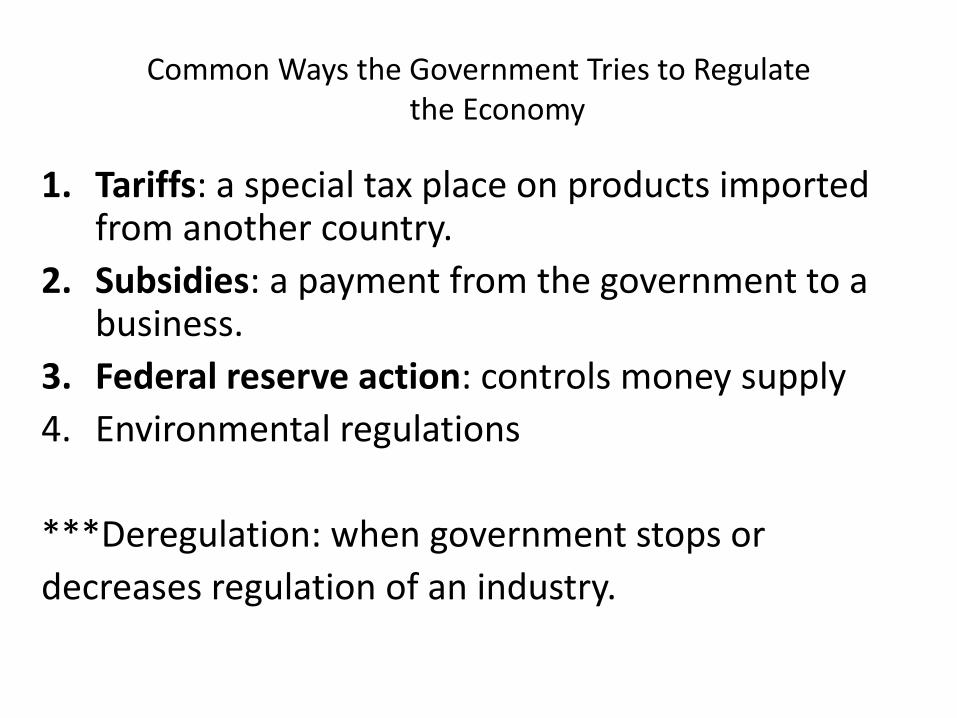
Common Ways the Government Tries to Regulate the Economy
1. Tariffs: a special tax place on products imported from another country.
2. Subsidies: a payment from the government to a business.
3. Federal reserve action: controls money supply 4. Environmental regulations
***Deregulation: when government stops or decreases regulation of an industry.
33
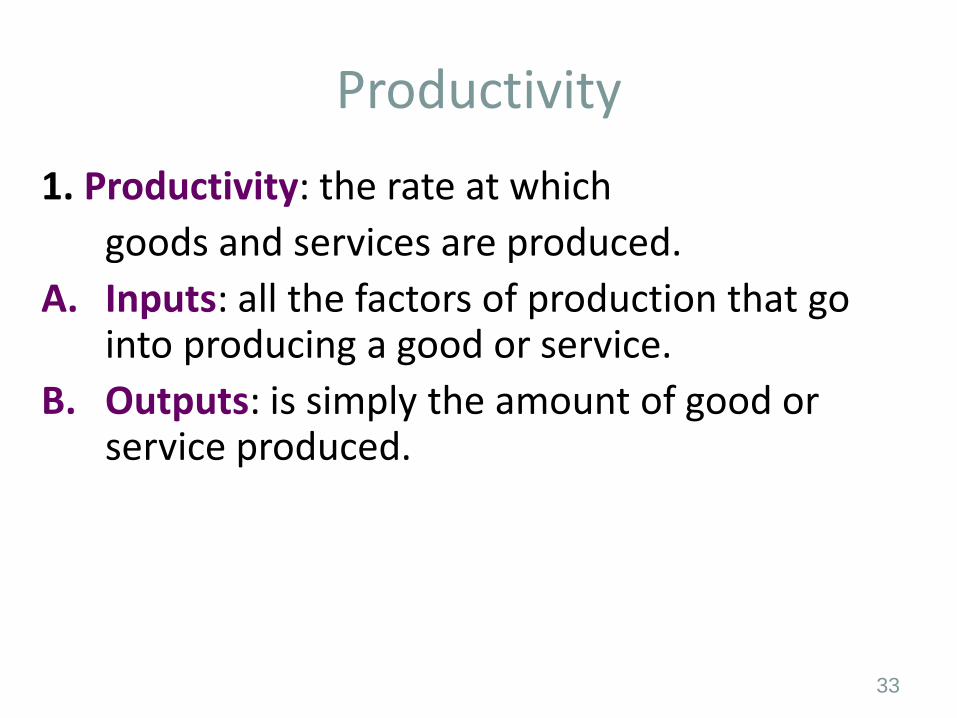
Productivity 1. Productivity: the rate at which goods and services are produced. A. Inputs: all the factors of production that go
into producing a good or service. B. Outputs: is simply the amount of good or
service produced.
34
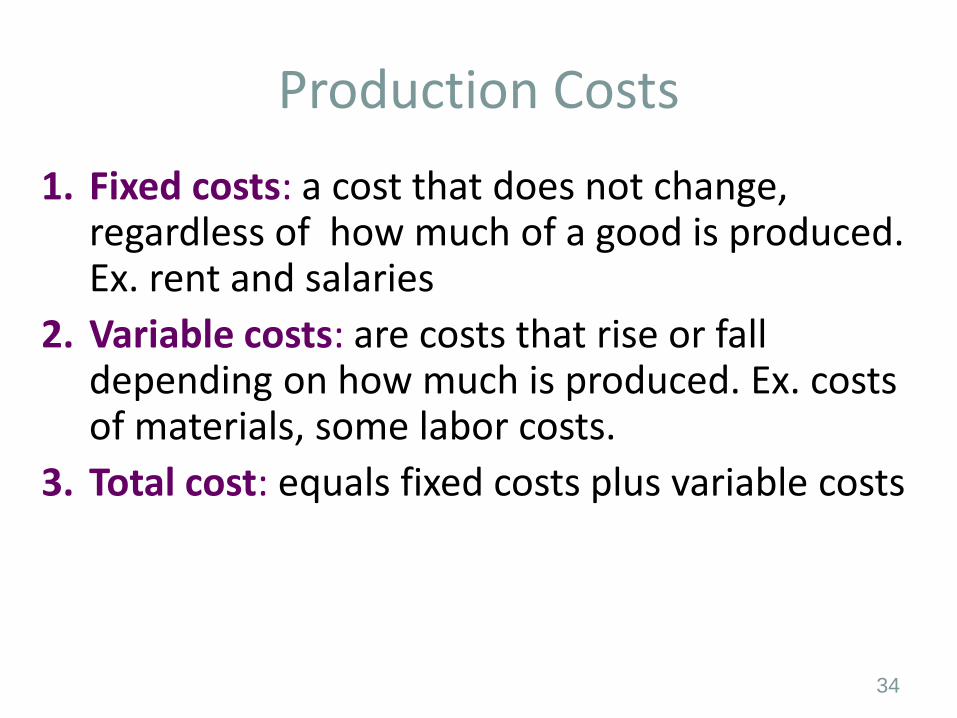
Production Costs 1. Fixed costs: a cost that does not change,
regardless of how much of a good is produced. Ex. rent and salaries
2. Variable costs: are costs that rise or fall depending on how much is produced. Ex. costs of materials, some labor costs.
3. Total cost: equals fixed costs plus variable costs
35
Investment
• Investment: using resources that could bring immediate benefits for the purpose of gaining greater benefits at a later time
36
Impact on Investment 1. Interest: money paid to an investor in exchange for the use of their
money. 2. Capital investment: an investment in capital goods and human
capital. a. Capital goods (Physical Capital): are those products used to
make other goods or provide services. Example: an investment in technology, cell-phone will help society as a whole. b. Human capital: an investment in people. Example: college 3. Standard of living: quality of life based on ownership of necessities
and luxuries that make life easier.
Personal Finance (Unit 2)
Incentive: reward that a person is likely to receive if he or she behaves in a certain manner. A. Positive incentive: positive reward B. Negative incentive: negative reward
Banks, Credit Unions, and Savings and Loans
1. Commercial banks: financial institutions that receive deposits of money, extend credit, and provide loans.
a. Interest charged: interest the bank charges them to borrow money. b. Interest earned: interest the bank pays them for the use of their money. 2. Credit unions: are cooperative associations that serve only their
members. They offer checking and savings accounts, as well as grant loans.
3. Savings and loan associations: are saving institutions designed to aid home building.
Risk and Return
1. Return: refers to the eventual payoff of the investment. 2. Risk: refers to the chance that an investment might actually end up losing money rather than making money.
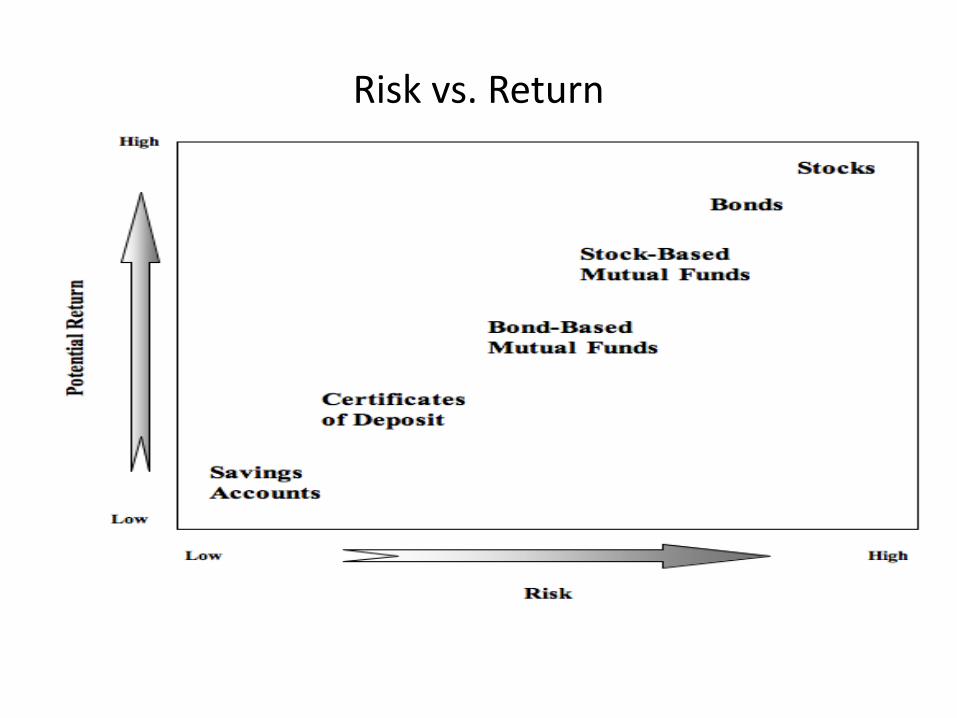
Risk vs. Return
Savings and Investment Options
1.Stocks: are shares in a company that an individual/organization purchases giving that person/entity part ownership. 2.Bonds: loans to either a company or the government. 3.Mutual funds: pool money from a number of investors to buy a range of stocks.
Workers Earnings
1. Workers earnings: how much employers pay workers for their labor. 2. Potential earnings: how much money one is likely to make in the labor market due to their skills, training, and education.
3 Types of Taxes
1. Progressive tax: a tax that imposes a higher percentage of taxation on persons with high incomes than on those with low incomes. (Federal Income Tax) 2. Regressive tax: a tax that imposes a higher percentage rate of taxation on low incomes than on high incomes. (sales tax) 3. Proportional tax: a tax that imposes the same percentage of taxation on everyone, regardless of income. (F.I.C.A. Social Security and Medicare)
Credit and Interest
1. Credit: is an agreement under which a buyer receives goods or services at the present time in exchange for a promise to pay for them at a future time. 2. Interest: is the amount of money that a lender charges a borrower in exchange for the use of their money.
Interest
1. Credit cards: when you use a credit card you are borrowing the credit card issuers money as a loan that you will pay back with interest. 2. Debit cards: when you use a debit card you are using your own money, so you pay no interest.
Simple and Compound Interest
1. Simple interest: is a rate that is applied only to the value of the principal. (simple interest grows slowly)
2. Principal: is the amount of money that has been borrowed.
3. Compound interest: is interest applied to both the principal and the interest. (you pay interest on interest) (compound interest grows fast)
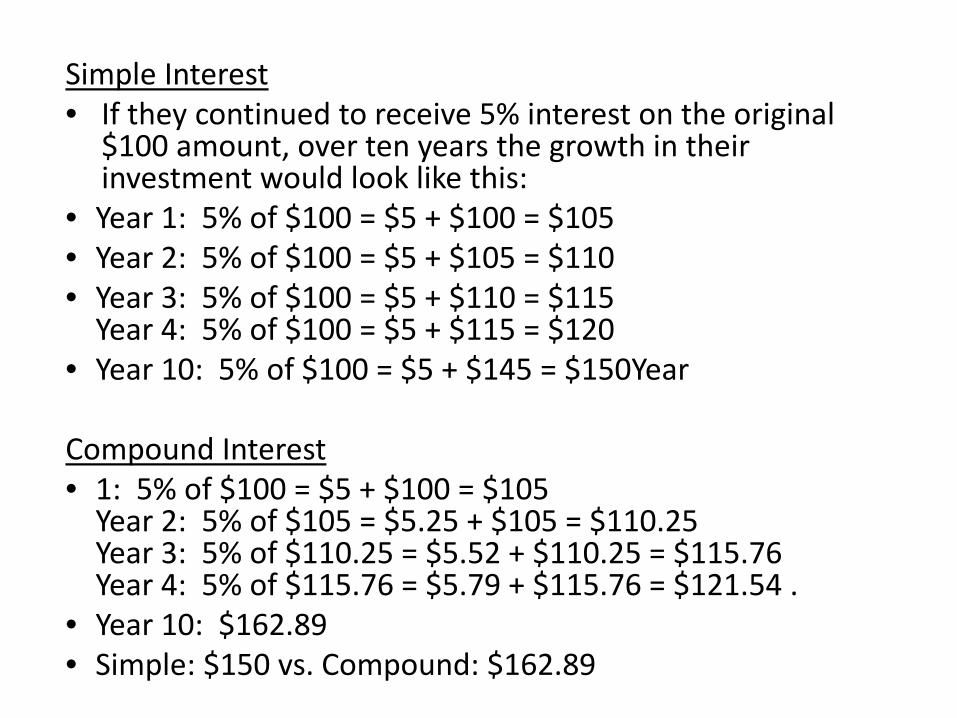
Simple Interest • If they continued to receive 5% interest on the original
$100 amount, over ten years the growth in their investment would look like this:
• Year 1: 5% of $100 = $5 + $100 = $105 • Year 2: 5% of $100 = $5 + $105 = $110 • Year 3: 5% of $100 = $5 + $110 = $115
Year 4: 5% of $100 = $5 + $115 = $120 • Year 10: 5% of $100 = $5 + $145 = $150Year
Compound Interest • 1: 5% of $100 = $5 + $100 = $105
Year 2: 5% of $105 = $5.25 + $105 = $110.25 Year 3: 5% of $110.25 = $5.52 + $110.25 = $115.76 Year 4: 5% of $115.76 = $5.79 + $115.76 = $121.54 .
• Year 10: $162.89 • Simple: $150 vs. Compound: $162.89
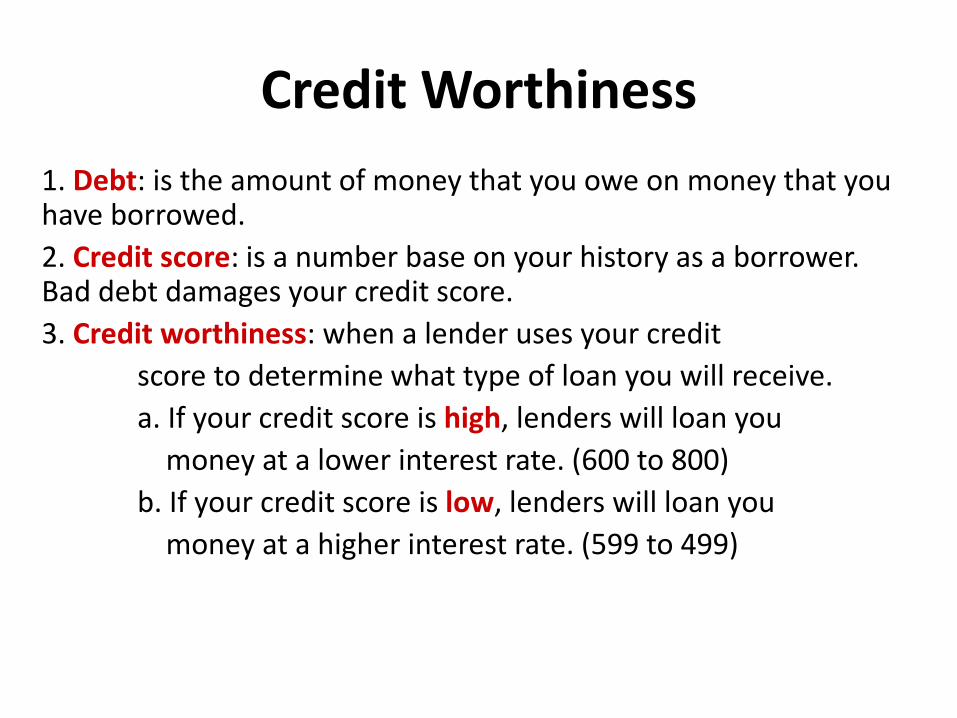
Credit Worthiness 1. Debt: is the amount of money that you owe on money that you have borrowed. 2. Credit score: is a number base on your history as a borrower. Bad debt damages your credit score. 3. Credit worthiness: when a lender uses your credit score to determine what type of loan you will receive. a. If your credit score is high, lenders will loan you money at a lower interest rate. (600 to 800) b. If your credit score is low, lenders will loan you money at a higher interest rate. (599 to 499)
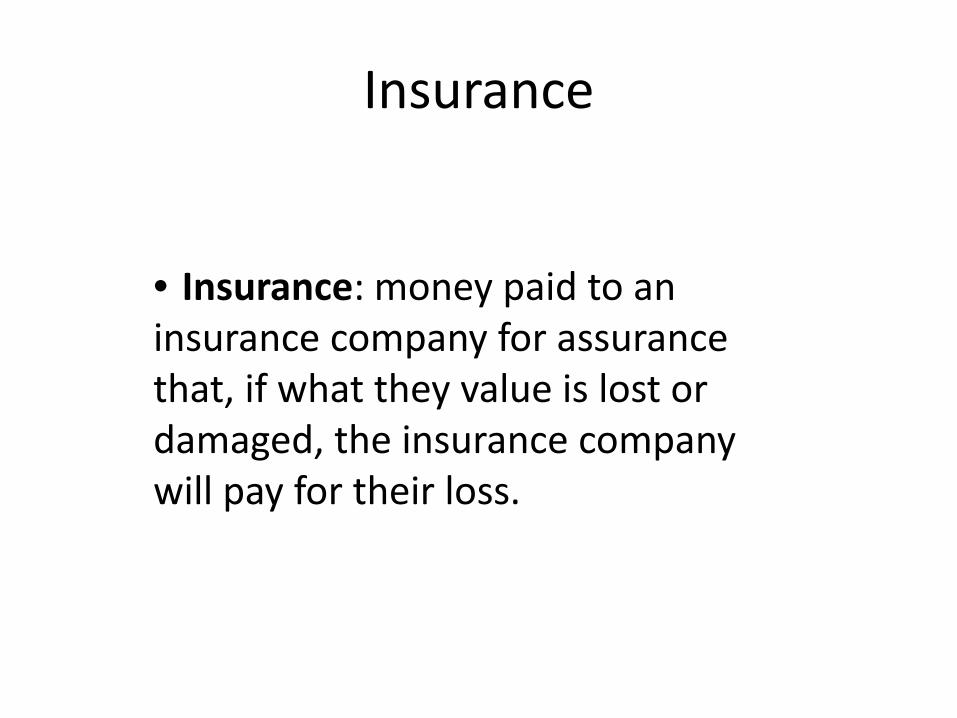
Insurance
• Insurance: money paid to an insurance company for assurance that, if what they value is lost or damaged, the insurance company will pay for their loss.

5 Types of Insurance
1. Health/medical insurance: is meant to cover health and medical expenses. 2. Disability insurance: provides a policy-holder with income in the event that they become disabled and unable to work. 3. Liability insurance: pays if your are held financially liable (responsible) for an accident.
5 Types of Insurance
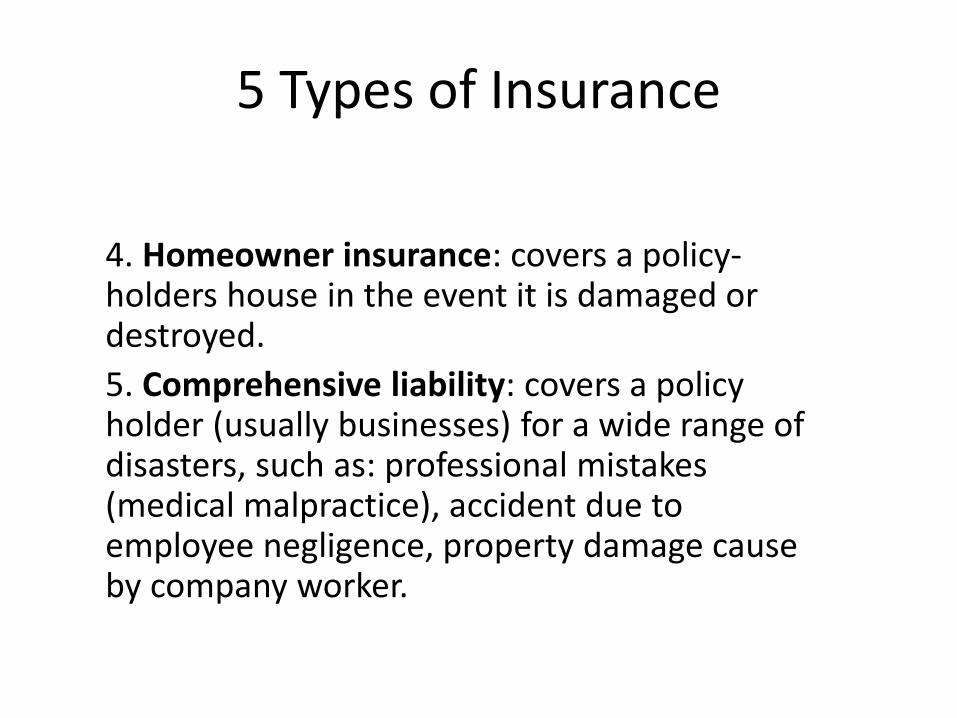
4. Homeowner insurance: covers a policy-holders house in the event it is damaged or destroyed. 5. Comprehensive liability: covers a policy holder (usually businesses) for a wide range of disasters, such as: professional mistakes (medical malpractice), accident due to employee negligence, property damage cause by company worker.
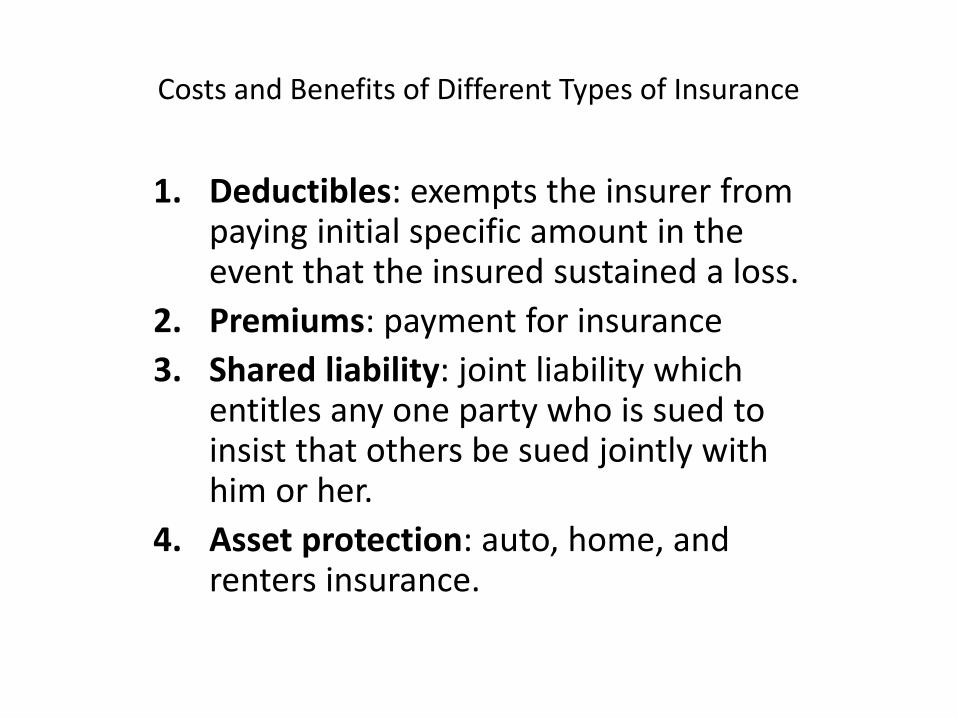
Costs and Benefits of Different Types of Insurance
1. Deductibles: exempts the insurer from paying initial specific amount in the event that the insured sustained a loss.
2. Premiums: payment for insurance 3. Shared liability: joint liability which
entitles any one party who is sued to insist that others be sued jointly with him or her.
4. Asset protection: auto, home, and renters insurance.
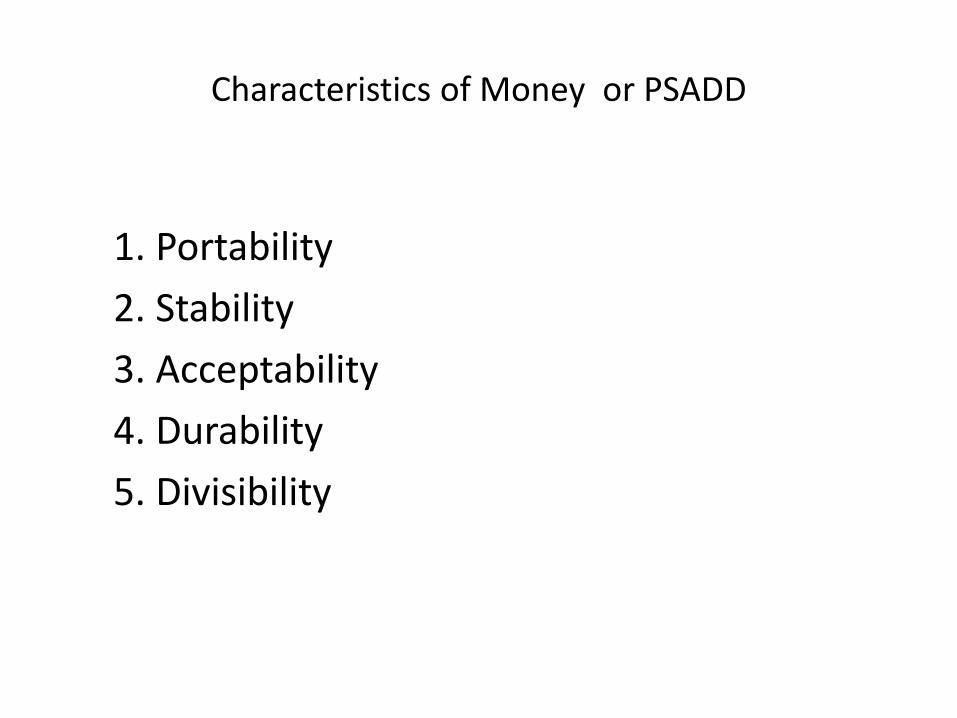
Characteristics of Money or PSADD
1. Portability 2. Stability 3. Acceptability 4. Durability 5. Divisibility
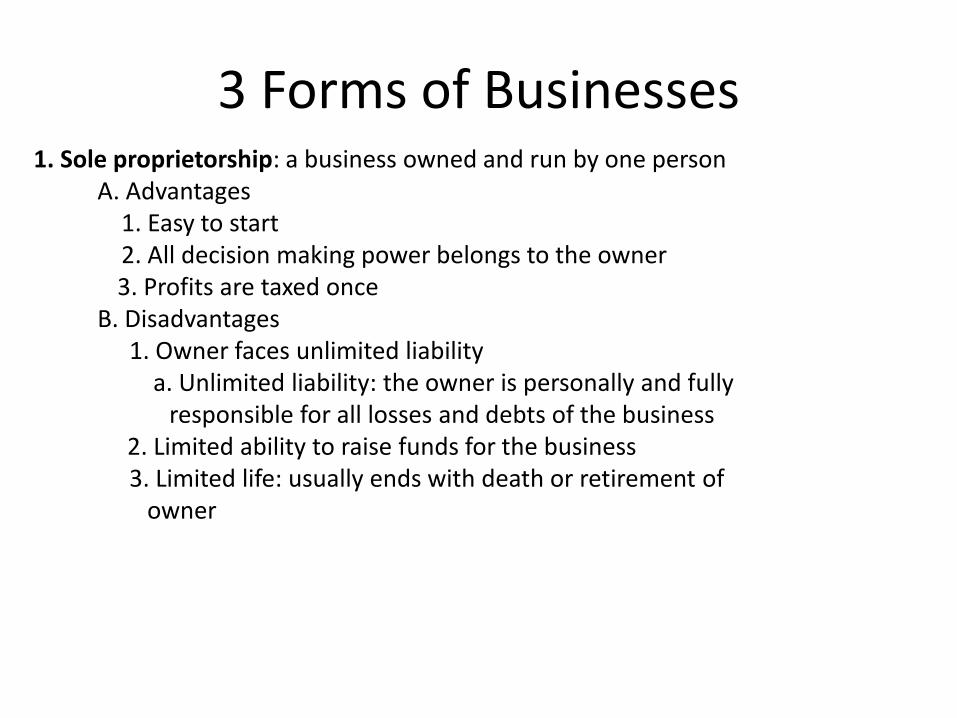
3 Forms of Businesses 1. Sole proprietorship: a business owned and run by one person A. Advantages 1. Easy to start 2. All decision making power belongs to the owner 3. Profits are taxed once B. Disadvantages 1. Owner faces unlimited liability a. Unlimited liability: the owner is personally and fully responsible for all losses and debts of the business 2. Limited ability to raise funds for the business 3. Limited life: usually ends with death or retirement of owner
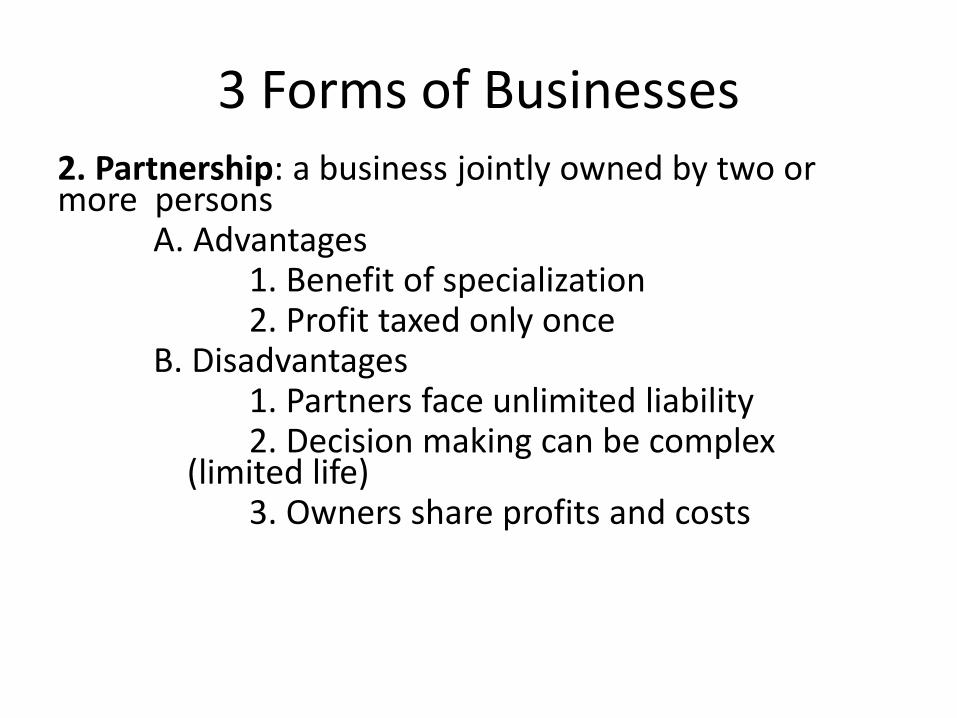
3 Forms of Businesses 2. Partnership: a business jointly owned by two or more persons A. Advantages 1. Benefit of specialization 2. Profit taxed only once B. Disadvantages 1. Partners face unlimited liability 2. Decision making can be complex (limited life) 3. Owners share profits and costs
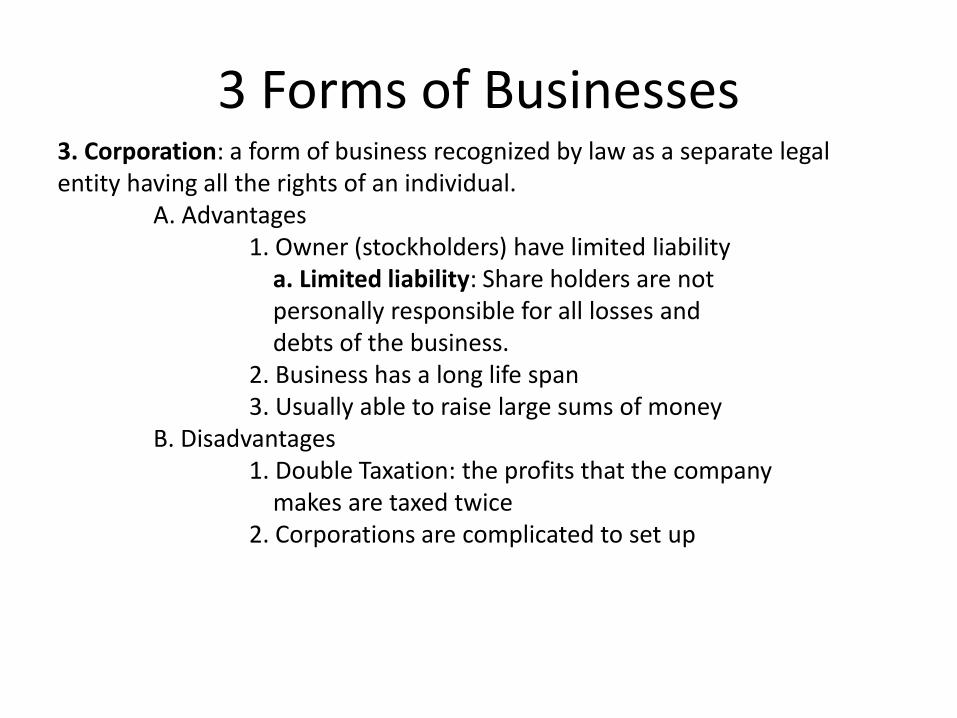
3 Forms of Businesses 3. Corporation: a form of business recognized by law as a separate legal entity having all the rights of an individual. A. Advantages 1. Owner (stockholders) have limited liability a. Limited liability: Share holders are not personally responsible for all losses and debts of the business. 2. Business has a long life span 3. Usually able to raise large sums of money B. Disadvantages 1. Double Taxation: the profits that the company makes are taxed twice 2. Corporations are complicated to set up
Microeconomics: the study of how economic actors (individuals and businesses) make decisions and are impacted by the allocation (distribution) of resources.
Microeconomics (Unit 3)
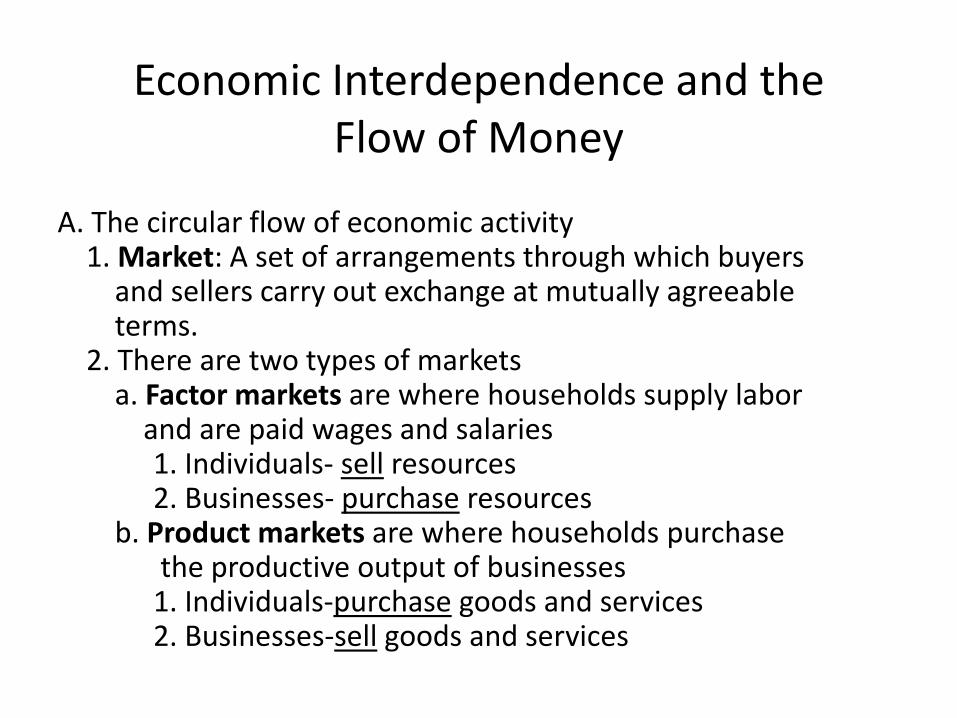
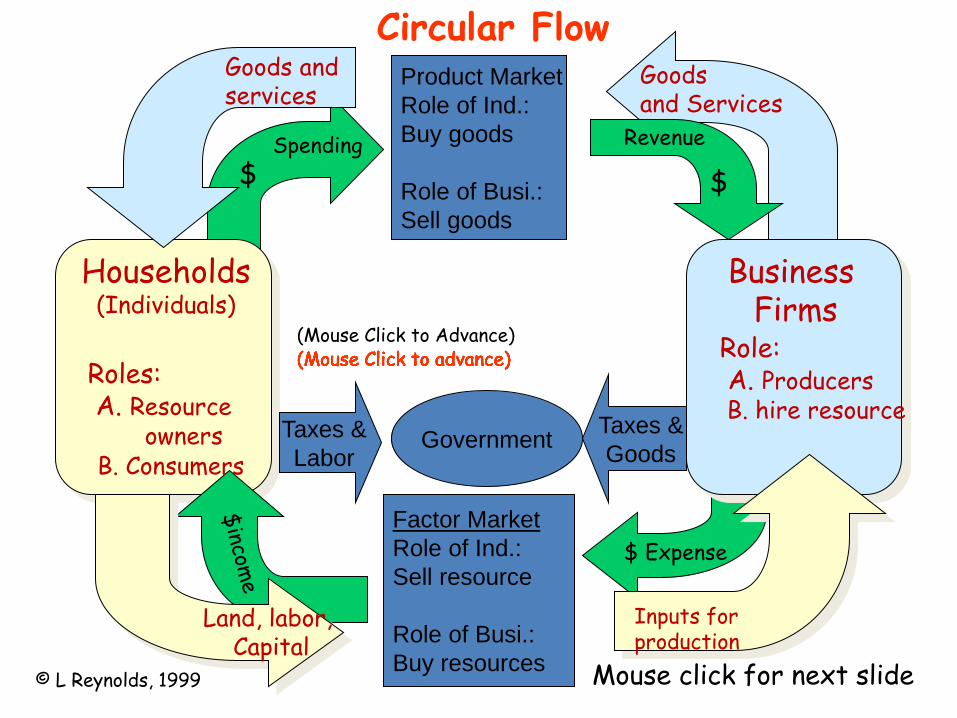
A. The circular flow of economic activity 1. Market: A set of arrangements through which buyers and sellers carry out exchange at mutually agreeable terms. 2. There are two types of markets a. Factor markets are where households supply labor and are paid wages and salaries 1. Individuals- sell resources 2. Businesses- purchase resources b. Product markets are where households purchase the productive output of businesses 1. Individuals-purchase goods and services 2. Businesses-sell goods and services
Economic Interdependence and the Flow of Money
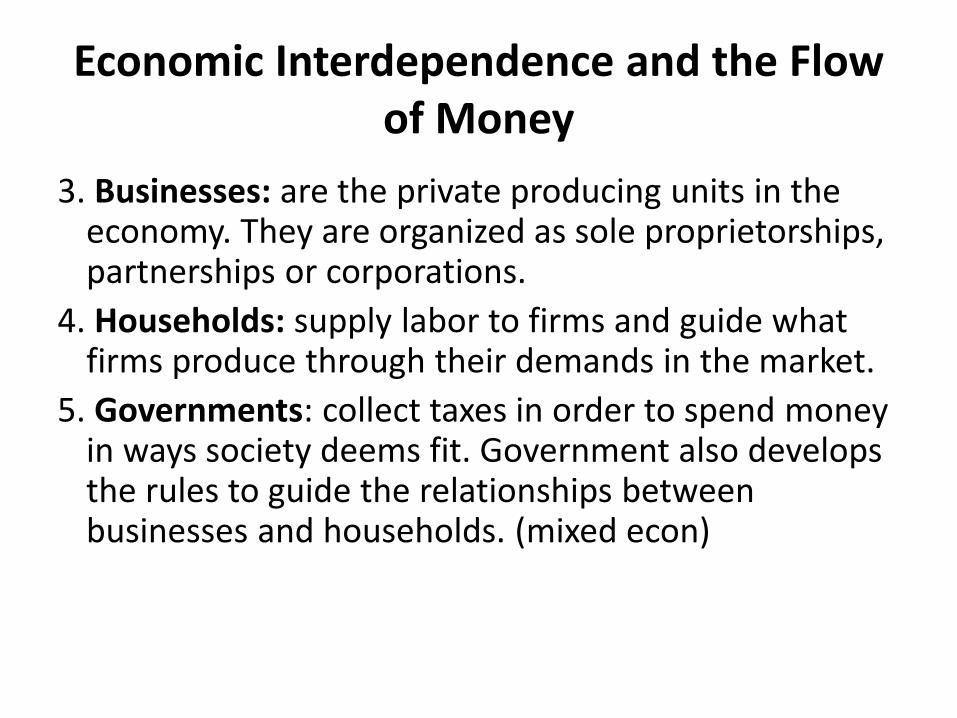
3. Businesses: are the private producing units in the economy. They are organized as sole proprietorships, partnerships or corporations.
4. Households: supply labor to firms and guide what firms produce through their demands in the market.
5. Governments: collect taxes in order to spend money in ways society deems fit. Government also develops the rules to guide the relationships between businesses and households. (mixed econ)
Economic Interdependence and the Flow of Money
6. Economic interdependence: reliance on one another to provide the goods and services that people consume.
7. The circular flow chart: the graphic representation of the free-enterprise economy.
Economic Interdependence and the Flow of Money
Spending $
Goods and Services
Households (Individuals)
$ Expense
Roles: A. Resource owners B. Consumers
Business Firms
Role: A. Producers B. hire resource
Land, labor, Capital
Inputs for production
(Mouse Click to advance) (Mouse Click to advance) (Mouse Click to advance) (Mouse Click to Advance)
Circular Flow
(Mouse Click to advance) (Mouse Click to advance)
Goods and services
(Mouse Click to advance)
Revenue
$
(Mouse Click to advance)
Mouse click for next slide © L Reynolds, 1999
Factor Market Role of Ind.: Sell resource Role of Busi.: Buy resources
Product Market Role of Ind.: Buy goods Role of Busi.: Sell goods
Government Taxes & Labor
Taxes & Goods
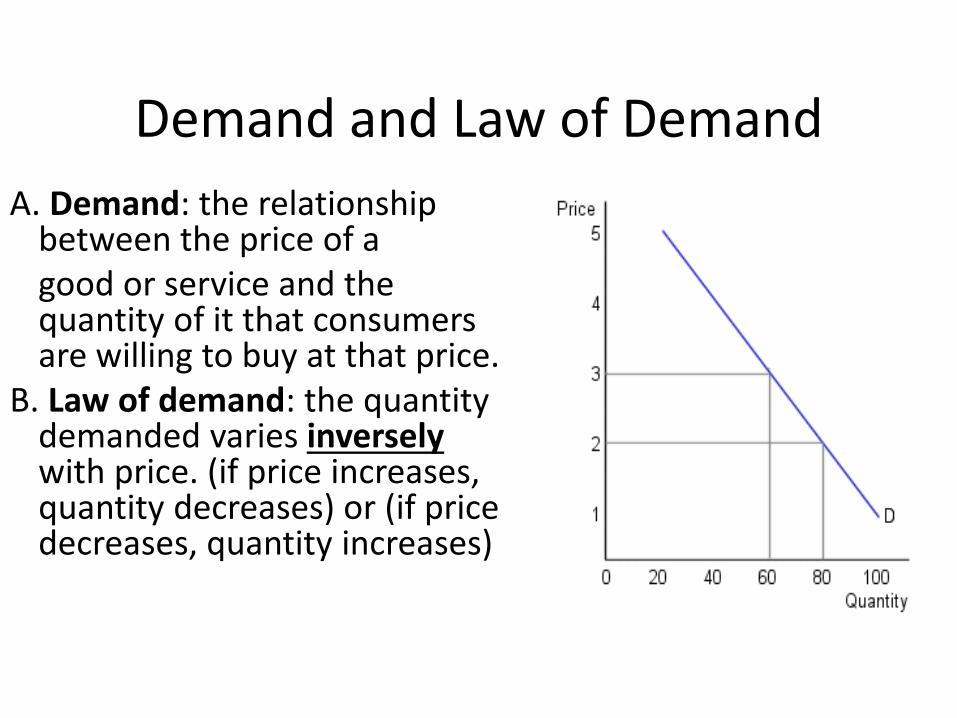
Demand and Law of Demand A. Demand: the relationship
between the price of a good or service and the
quantity of it that consumers are willing to buy at that price.
B. Law of demand: the quantity demanded varies inversely with price. (if price increases, quantity decreases) or (if price decreases, quantity increases)
Demand Schedule and Curve
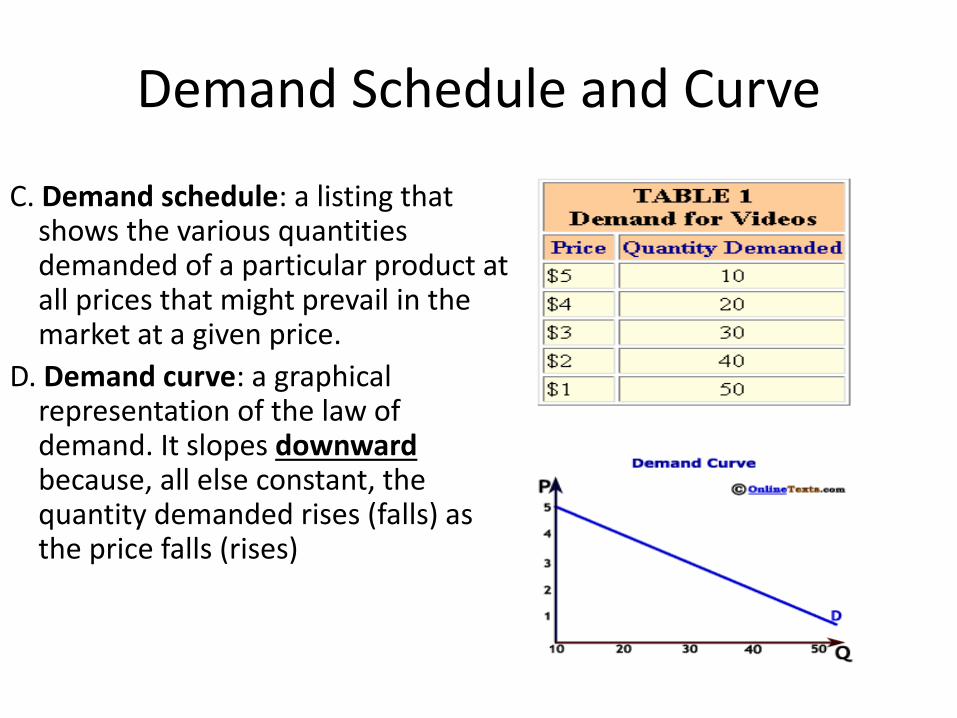
C. Demand schedule: a listing that shows the various quantities demanded of a particular product at all prices that might prevail in the market at a given price.
D. Demand curve: a graphical representation of the law of demand. It slopes downward because, all else constant, the quantity demanded rises (falls) as the price falls (rises)
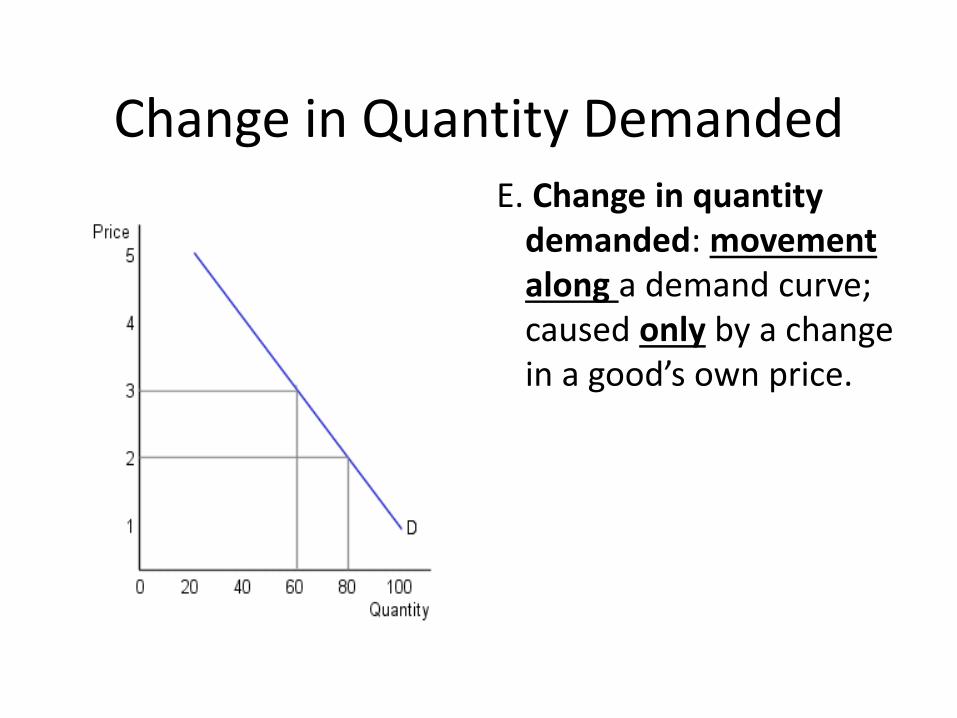
Change in Quantity Demanded E. Change in quantity
demanded: movement along a demand curve; caused only by a change in a good’s own price.

Change in Demand
Change in demand: a shift in the entire demand curve, either right or left, caused by a change in non-price determinants of demand.
Changes in Non-Price Determinants of Demand
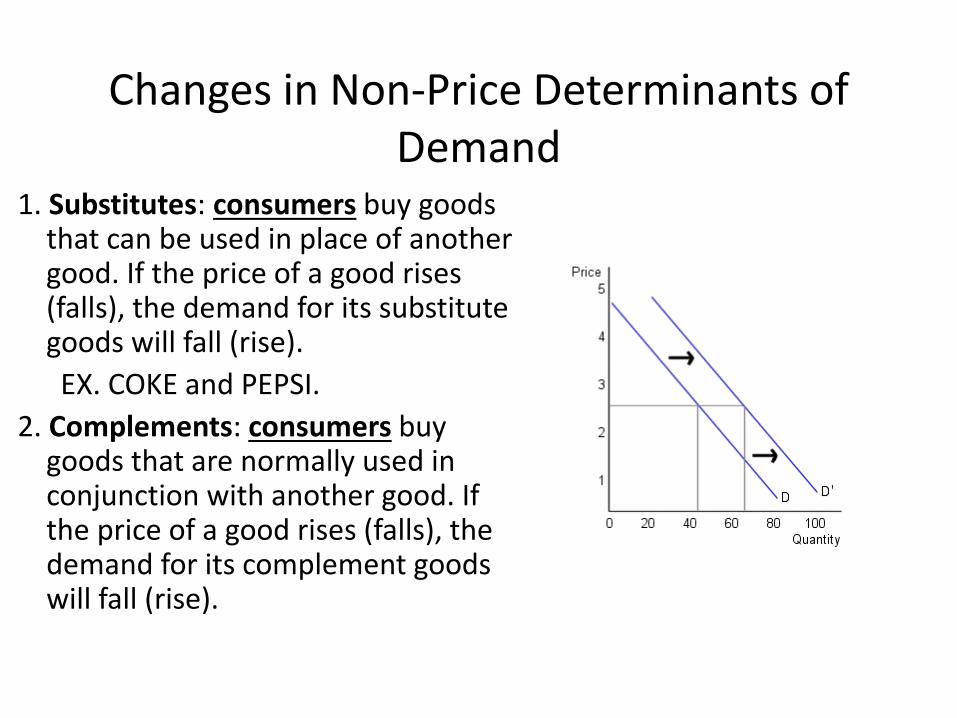
1. Substitutes: consumers buy goods that can be used in place of another good. If the price of a good rises (falls), the demand for its substitute goods will fall (rise).
EX. COKE and PEPSI. 2. Complements: consumers buy
goods that are normally used in conjunction with another good. If the price of a good rises (falls), the demand for its complement goods will fall (rise).
Changes in Non-Price Determinants of Demand
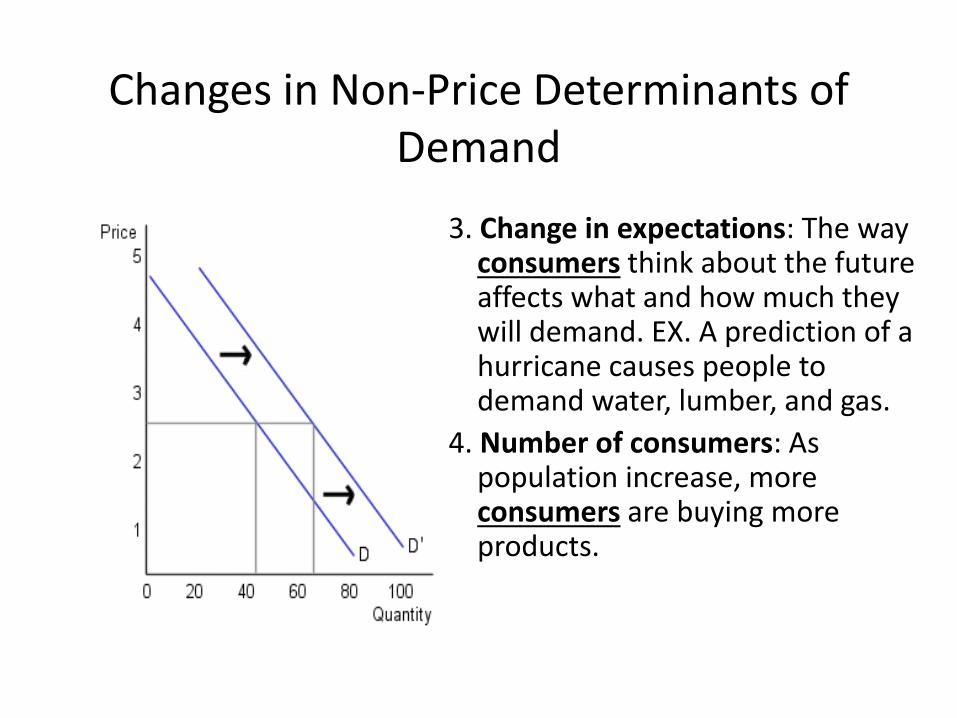
3. Change in expectations: The way consumers think about the future affects what and how much they will demand. EX. A prediction of a hurricane causes people to demand water, lumber, and gas.
4. Number of consumers: As population increase, more consumers are buying more products.
Supply and Law of Supply
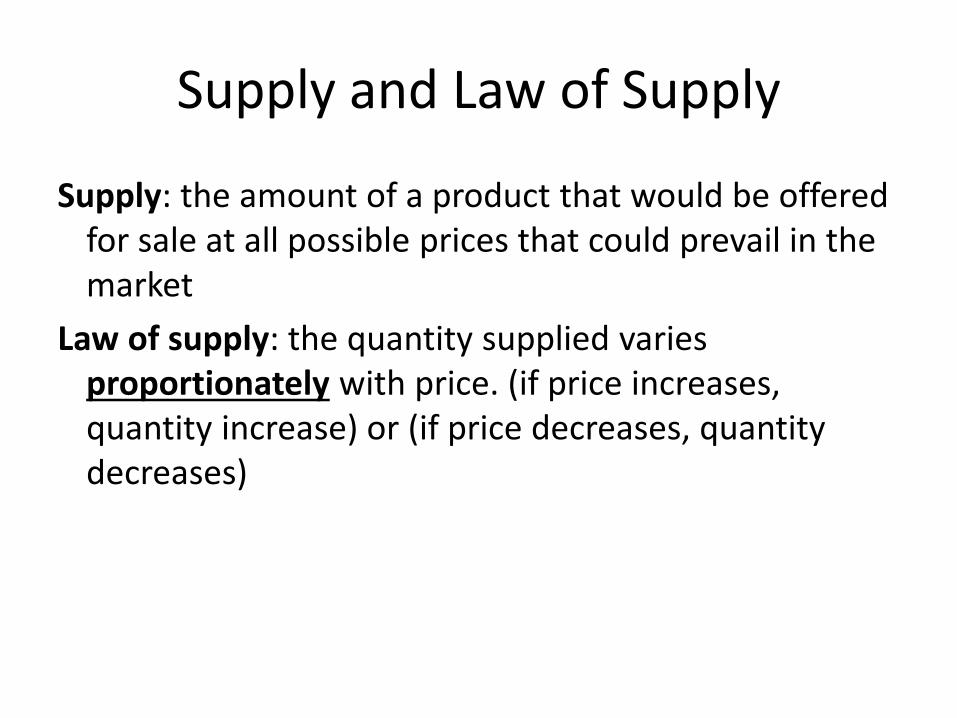
Supply: the amount of a product that would be offered for sale at all possible prices that could prevail in the market
Law of supply: the quantity supplied varies proportionately with price. (if price increases, quantity increase) or (if price decreases, quantity decreases)
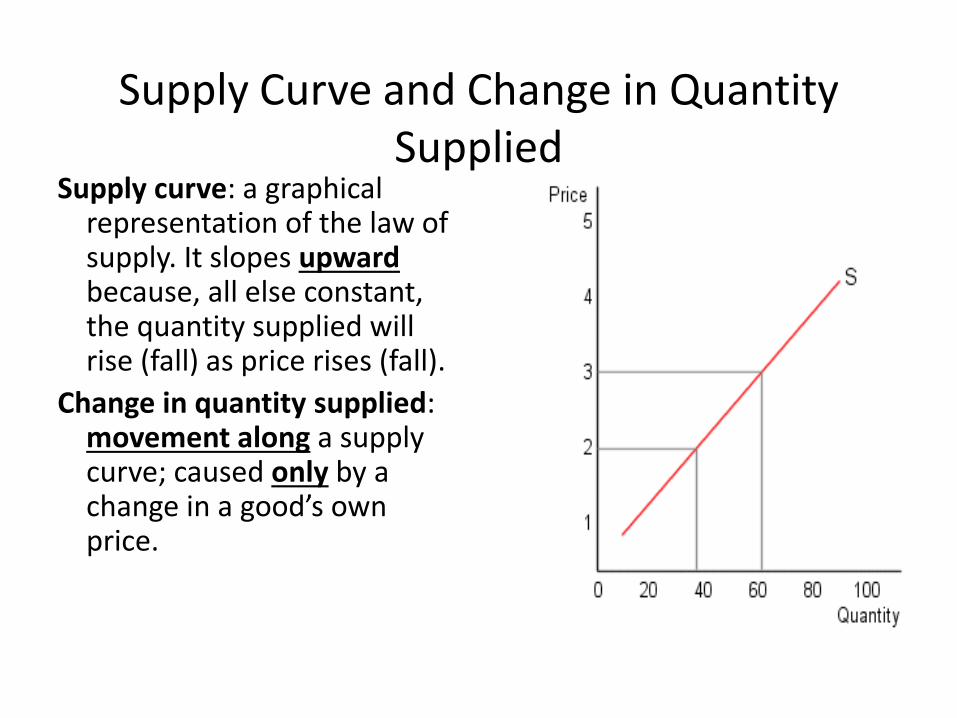
Supply Curve and Change in Quantity Supplied
Supply curve: a graphical representation of the law of supply. It slopes upward because, all else constant, the quantity supplied will rise (fall) as price rises (fall).
Change in quantity supplied: movement along a supply curve; caused only by a change in a good’s own price.
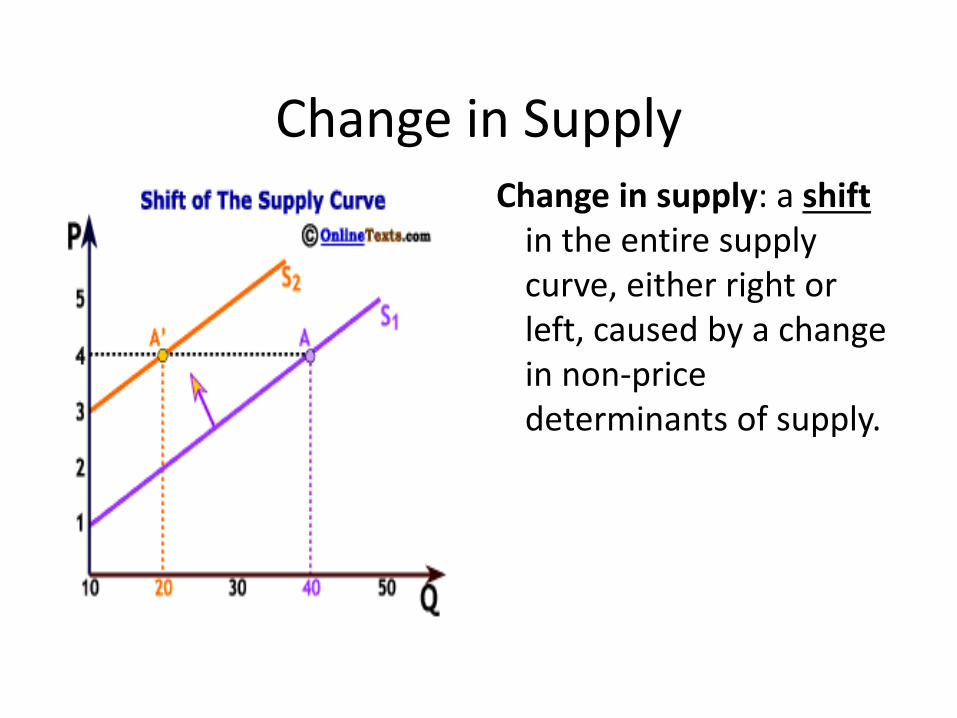
Change in Supply Change in supply: a shift
in the entire supply curve, either right or left, caused by a change in non-price determinants of supply.
Change in Non-Price Determinants of Supply
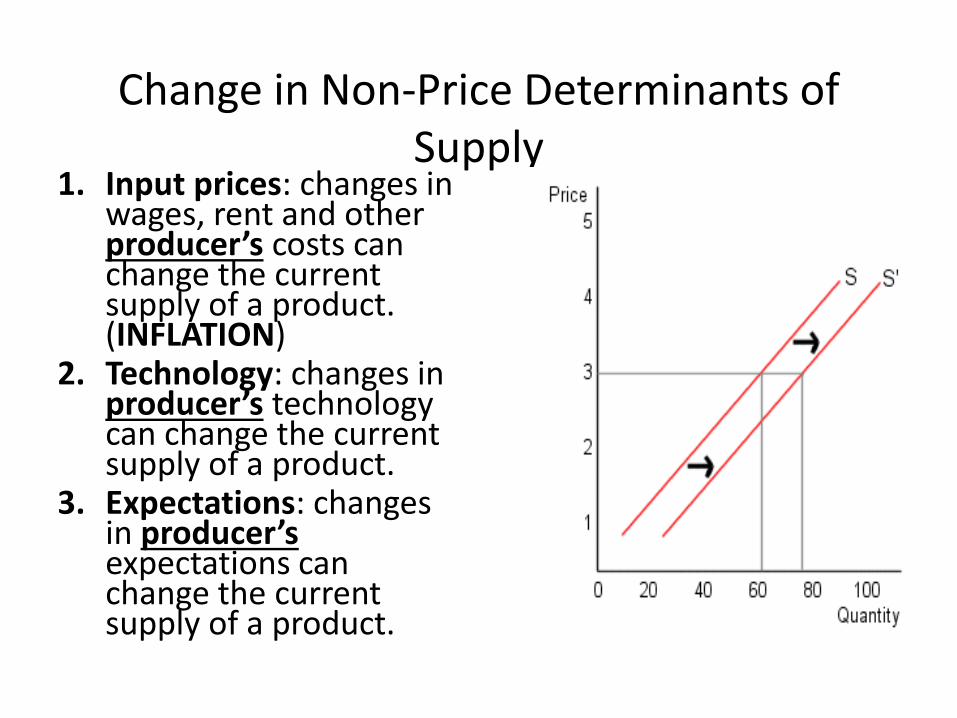
1. Input prices: changes in wages, rent and other producer’s costs can change the current supply of a product. (INFLATION)
2. Technology: changes in producer’s technology can change the current supply of a product.
3. Expectations: changes in producer’s expectations can change the current supply of a product.
Change in Non-Price Determinants of Supply
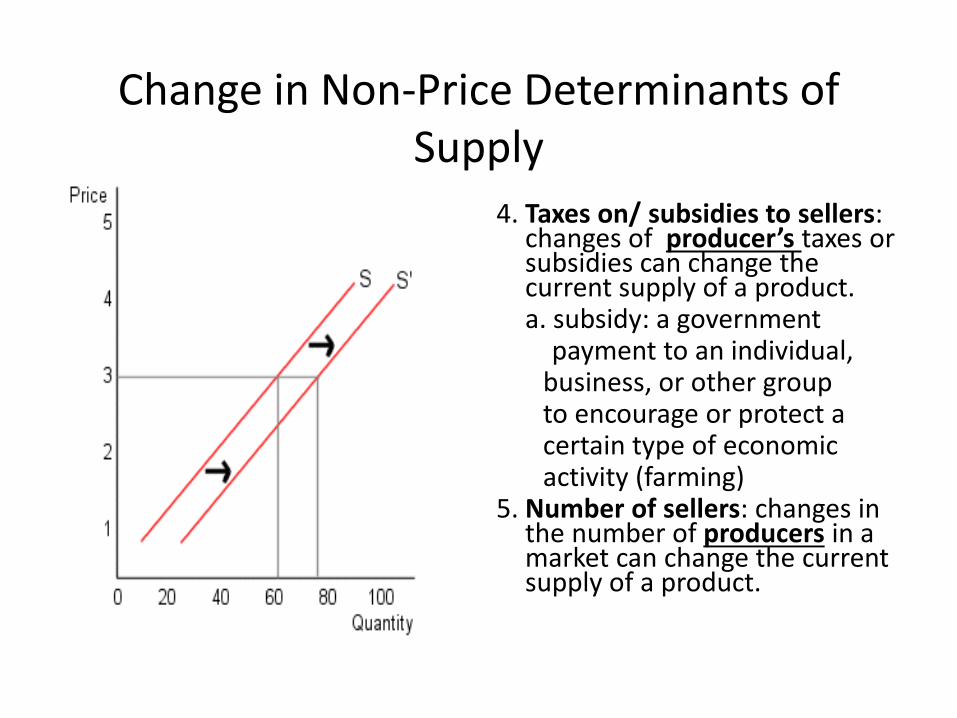
4. Taxes on/ subsidies to sellers: changes of producer’s taxes or subsidies can change the current supply of a product.
a. subsidy: a government payment to an individual, business, or other group to encourage or protect a certain type of economic activity (farming) 5. Number of sellers: changes in
the number of producers in a market can change the current supply of a product.
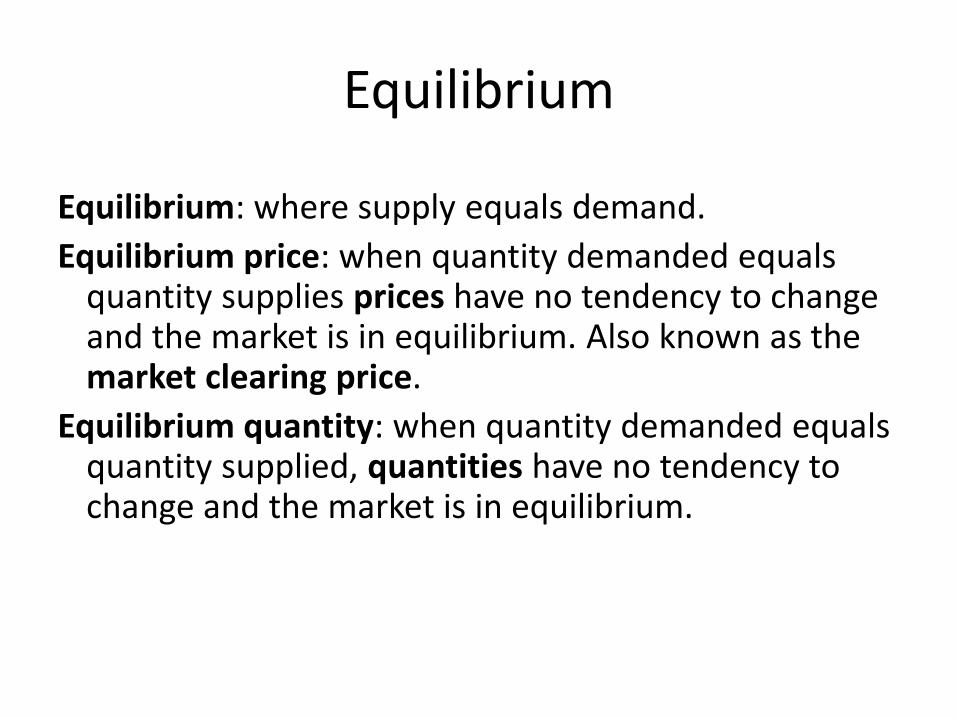
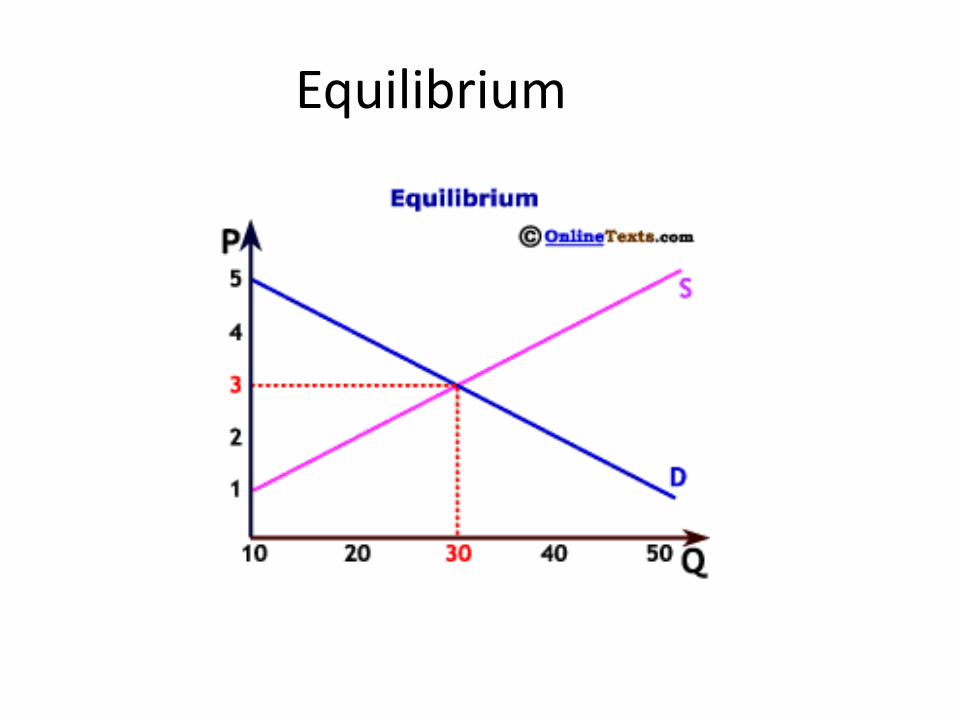
Equilibrium
Equilibrium: where supply equals demand. Equilibrium price: when quantity demanded equals
quantity supplies prices have no tendency to change and the market is in equilibrium. Also known as the market clearing price.
Equilibrium quantity: when quantity demanded equals quantity supplied, quantities have no tendency to change and the market is in equilibrium.
Equilibrium
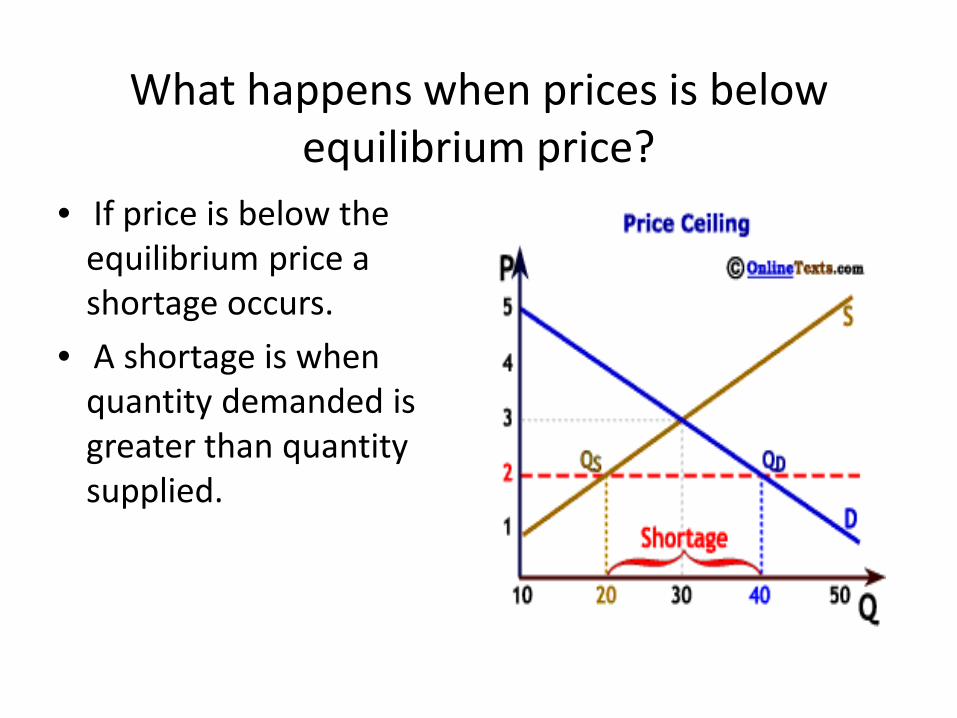
What happens when prices is below equilibrium price?
• If price is below the equilibrium price a shortage occurs.
• A shortage is when quantity demanded is greater than quantity supplied.
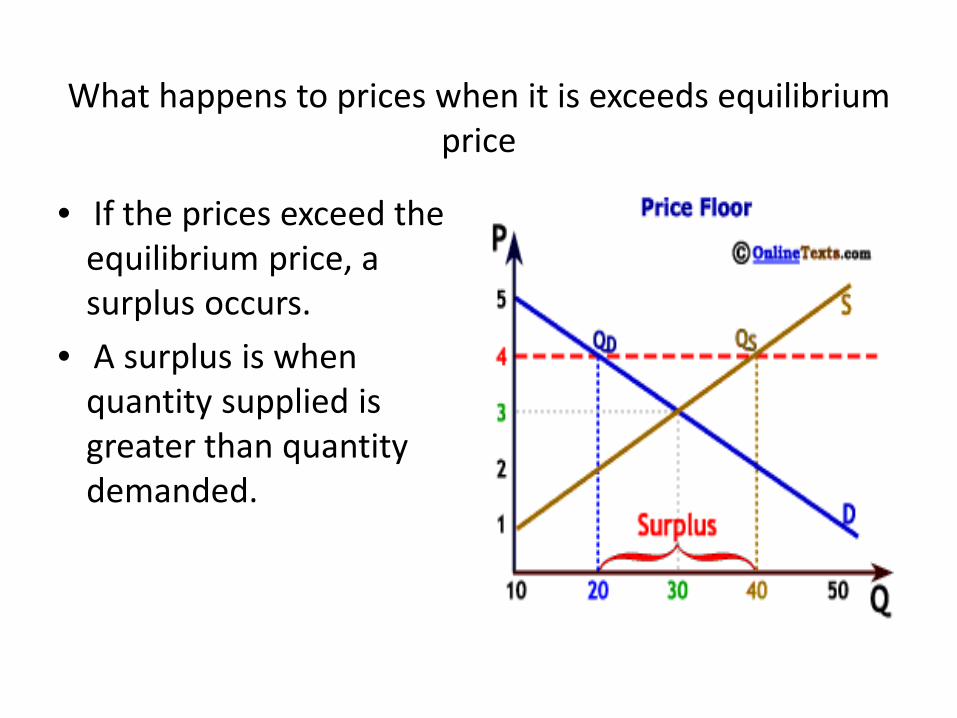
What happens to prices when it is exceeds equilibrium price
• If the prices exceed the equilibrium price, a surplus occurs.
• A surplus is when quantity supplied is greater than quantity demanded.
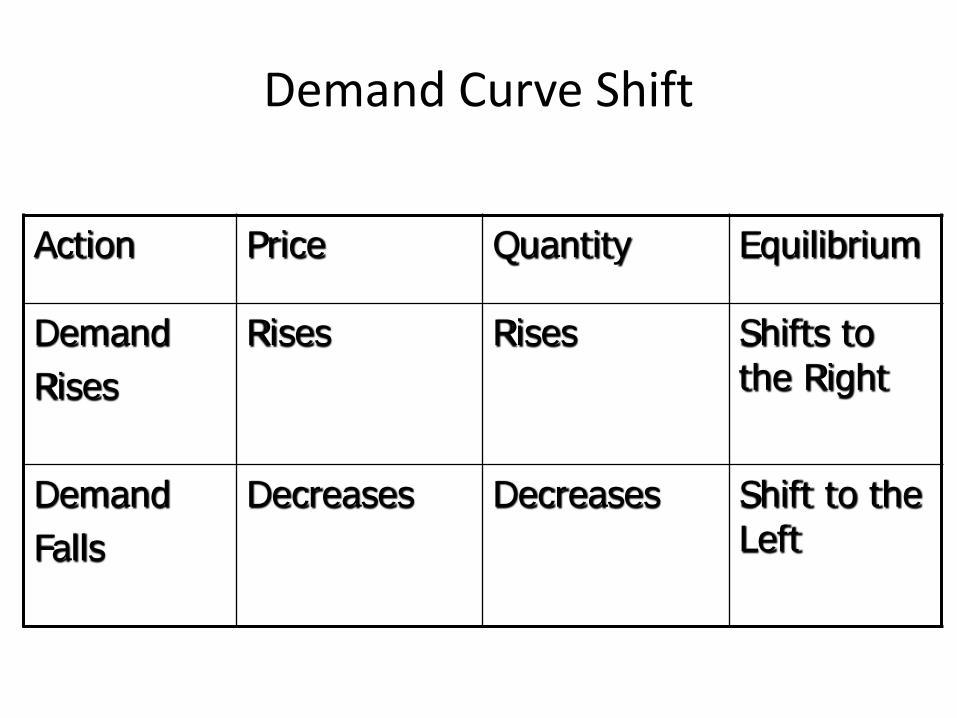
Demand Curve Shift
Action Price Quantity Equilibrium
Demand Rises
Rises
Rises
Shifts to the Right
Demand Falls
Decreases
Decreases
Shift to the Left
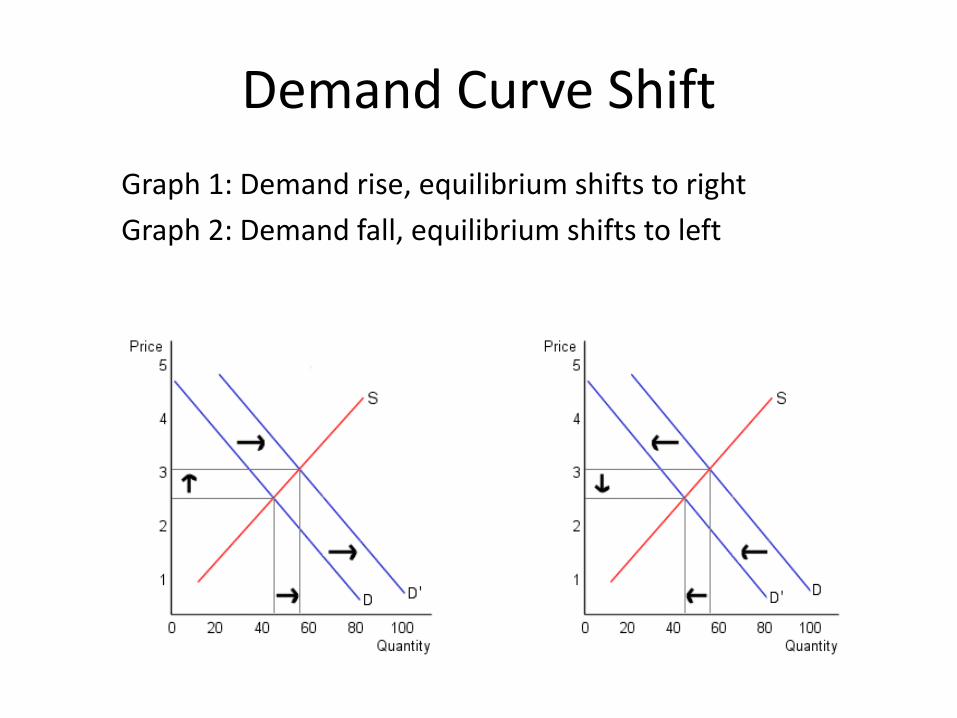
Demand Curve Shift Graph 1: Demand rise, equilibrium shifts to right Graph 2: Demand fall, equilibrium shifts to left
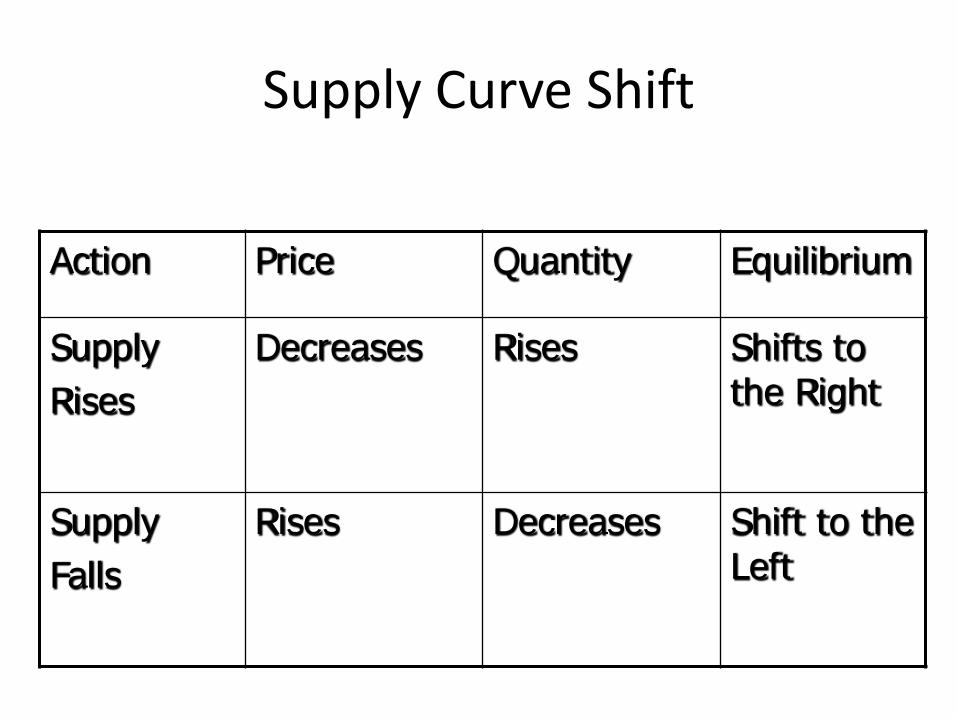
Supply Curve Shift
Action Price Quantity Equilibrium
Supply Rises
Decreases Rises
Shifts to the Right
Supply Falls
Rises
Decreases
Shift to the Left
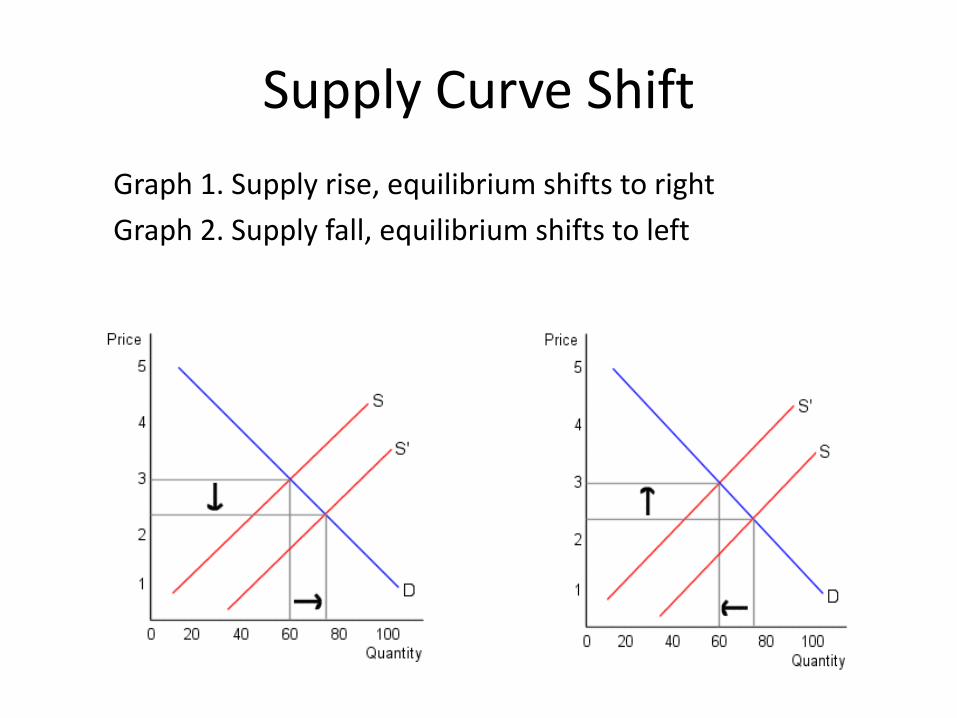
Supply Curve Shift Graph 1. Supply rise, equilibrium shifts to right Graph 2. Supply fall, equilibrium shifts to left
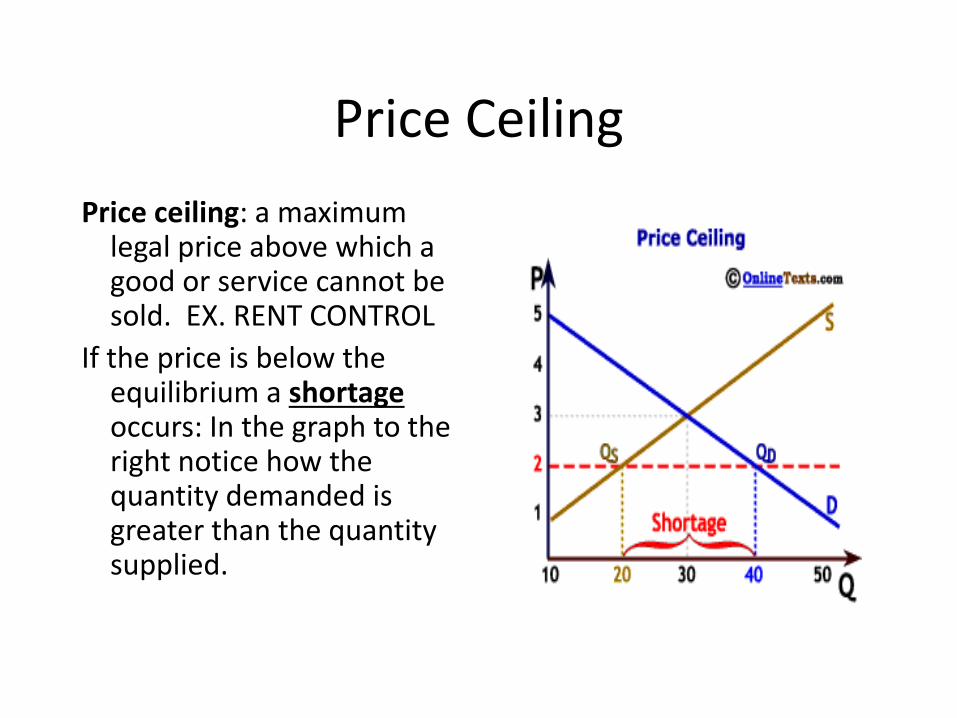
Price Ceiling Price ceiling: a maximum
legal price above which a good or service cannot be sold. EX. RENT CONTROL
If the price is below the equilibrium a shortage occurs: In the graph to the right notice how the quantity demanded is greater than the quantity supplied.
Price Floor
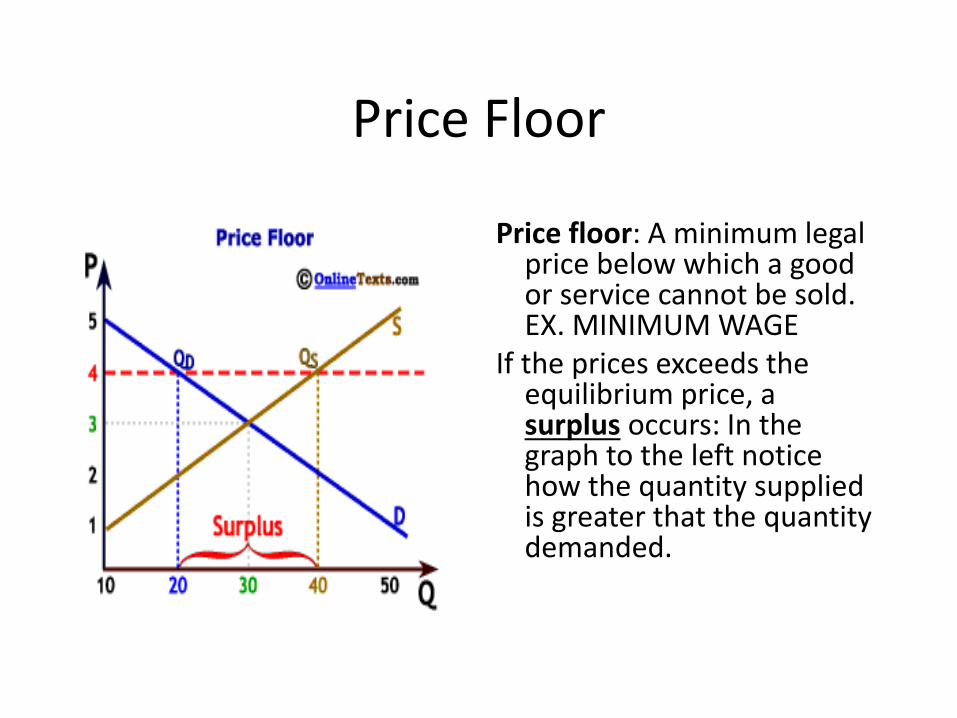
Price floor: A minimum legal price below which a good or service cannot be sold. EX. MINIMUM WAGE
If the prices exceeds the equilibrium price, a surplus occurs: In the graph to the left notice how the quantity supplied is greater that the quantity demanded.
Elasticity
Elasticity: measures the sensitivity between two economic variables.
Measuring elasticity is important because it allows individuals, firms and society to estimate the impacts that economic decisions will have.
Elasticity and Demand
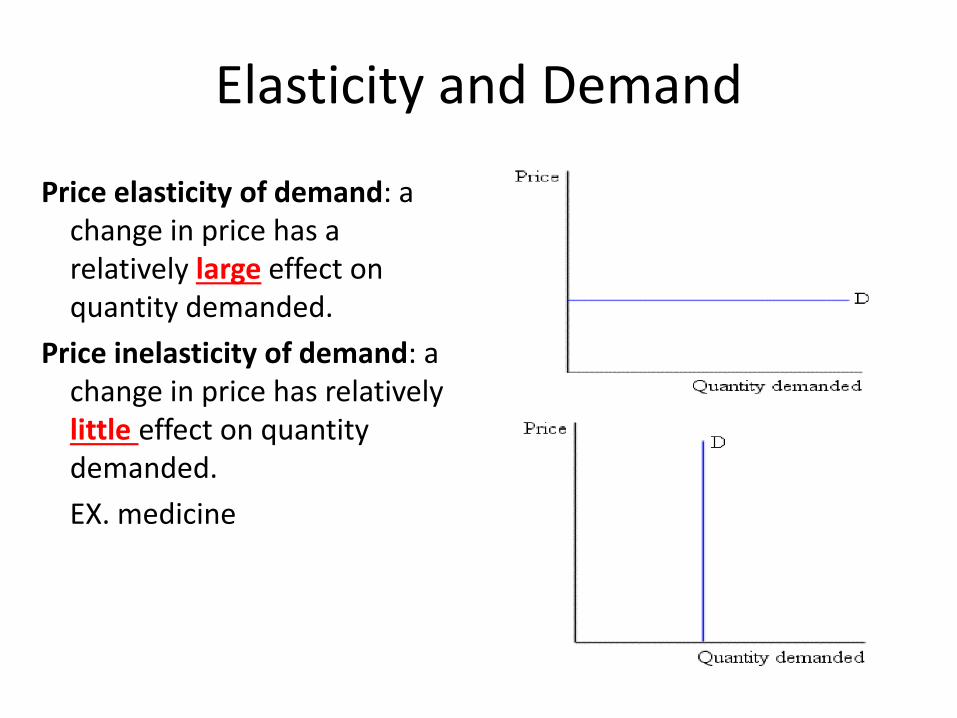
Price elasticity of demand: a change in price has a relatively large effect on quantity demanded.
Price inelasticity of demand: a change in price has relatively little effect on quantity demanded.
EX. medicine
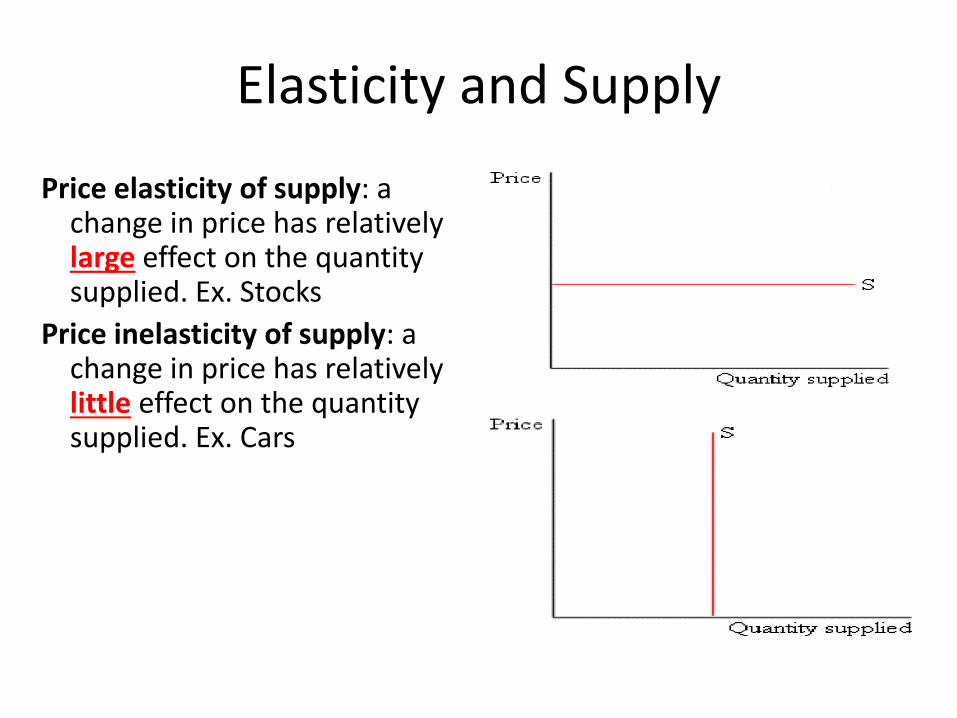
Elasticity and Supply
Price elasticity of supply: a change in price has relatively large effect on the quantity supplied. Ex. Stocks
Price inelasticity of supply: a change in price has relatively little effect on the quantity supplied. Ex. Cars
• Perfect Competition • Monopolistic Competition • Oligopoly • Monopoly • Barriers to Enter the Market • Control Over Price
Key Concepts
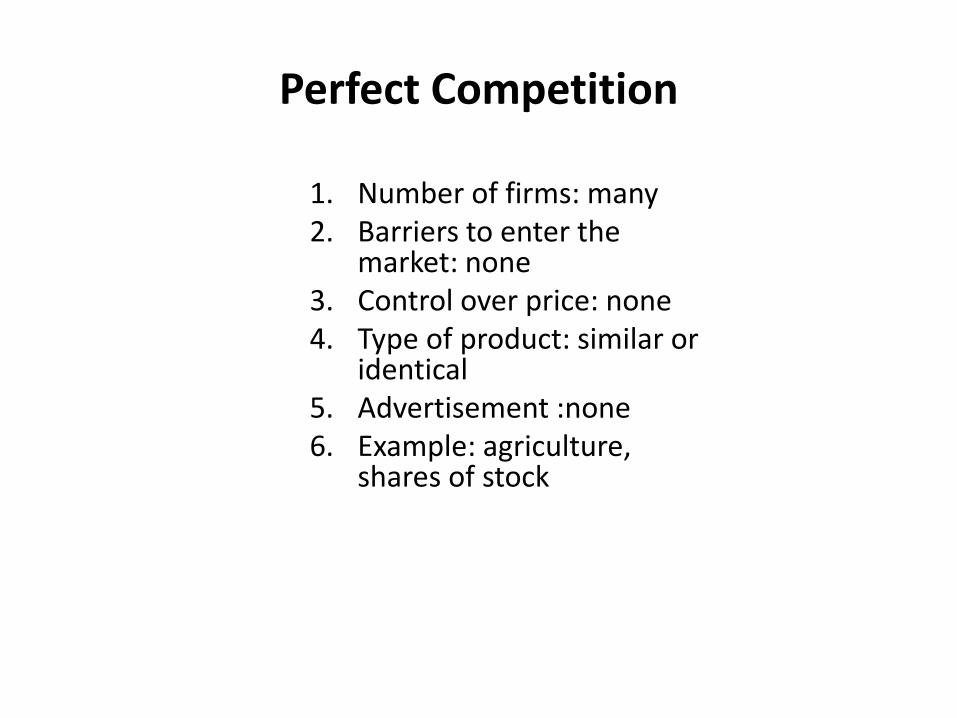
Perfect Competition
1. Number of firms: many 2. Barriers to enter the
market: none 3. Control over price: none 4. Type of product: similar or
identical 5. Advertisement :none 6. Example: agriculture,
shares of stock
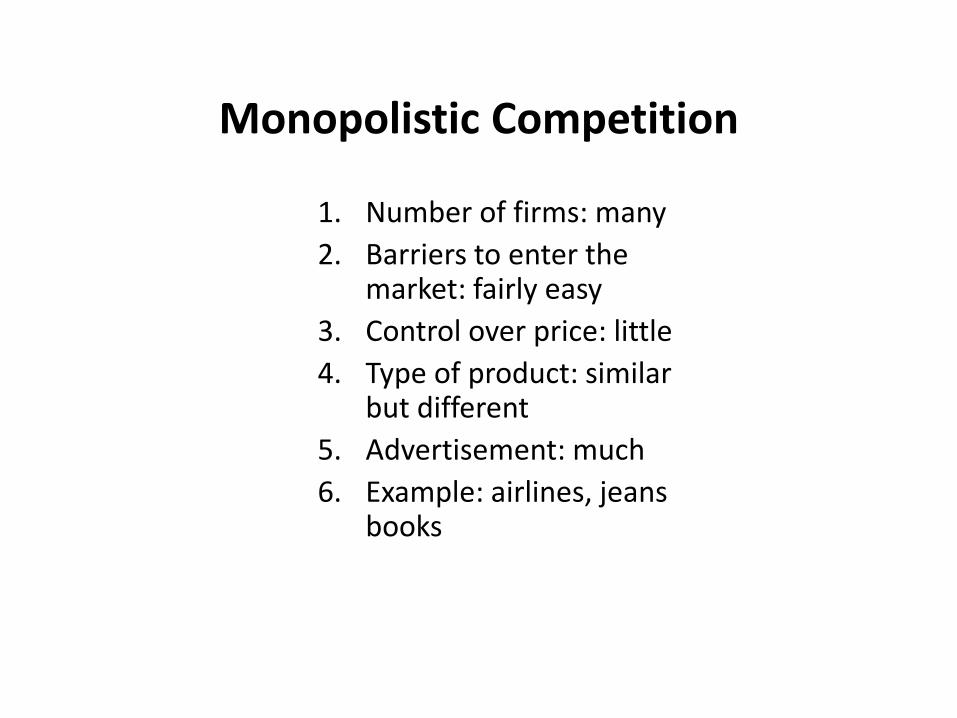
Monopolistic Competition
1. Number of firms: many 2. Barriers to enter the
market: fairly easy 3. Control over price: little 4. Type of product: similar
but different 5. Advertisement: much 6. Example: airlines, jeans
books
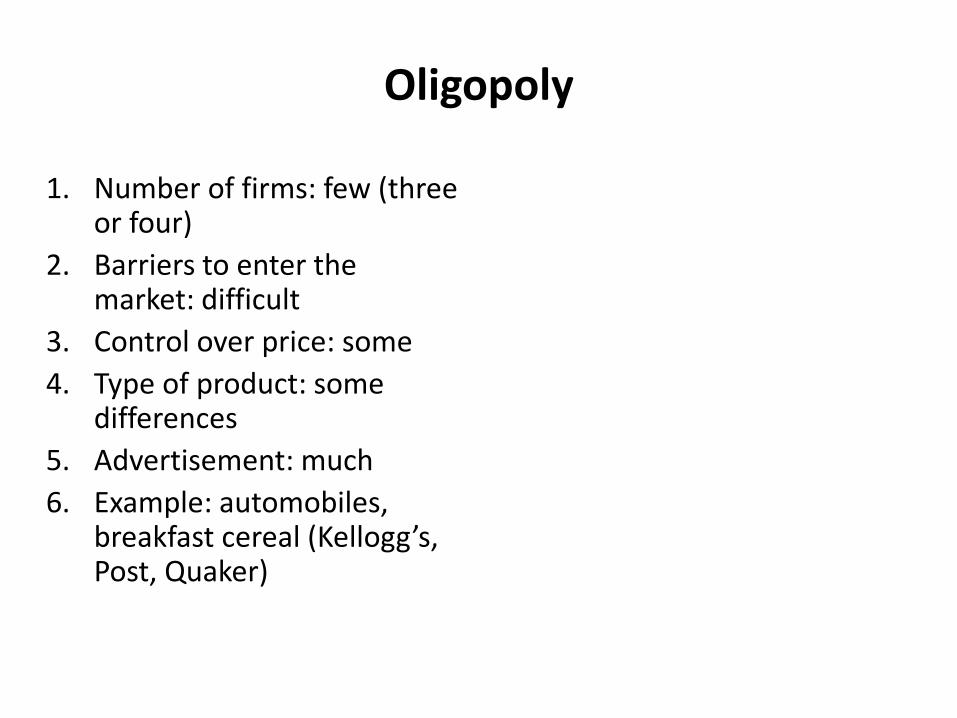
Oligopoly
1. Number of firms: few (three
or four) 2. Barriers to enter the
market: difficult 3. Control over price: some 4. Type of product: some
differences 5. Advertisement: much 6. Example: automobiles,
breakfast cereal (Kellogg’s, Post, Quaker)
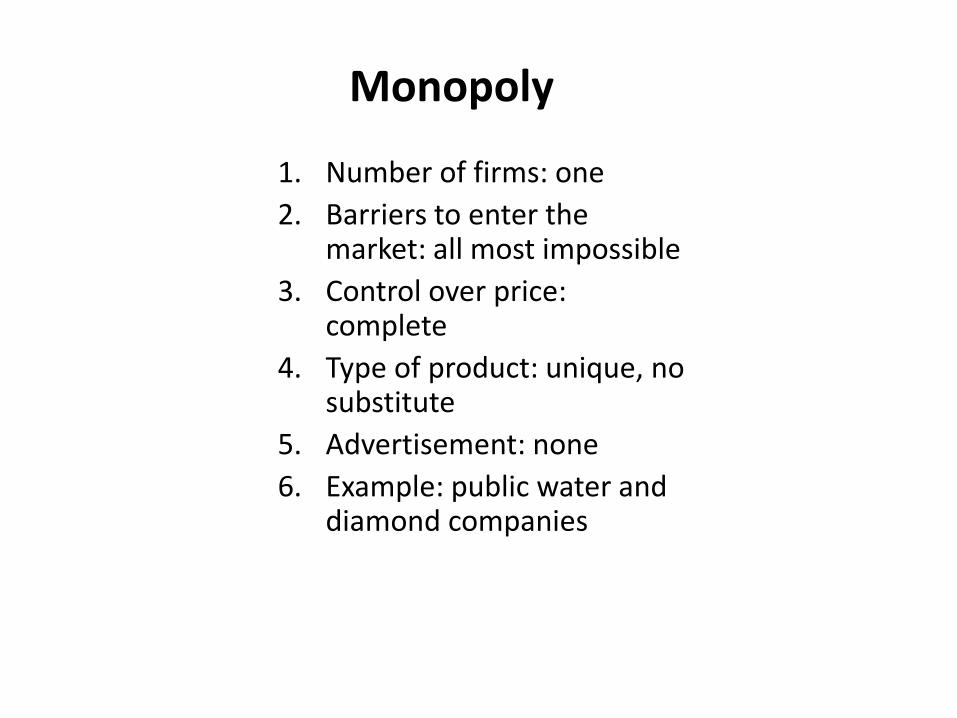
Monopoly
1. Number of firms: one 2. Barriers to enter the
market: all most impossible 3. Control over price:
complete 4. Type of product: unique, no
substitute 5. Advertisement: none 6. Example: public water and
diamond companies
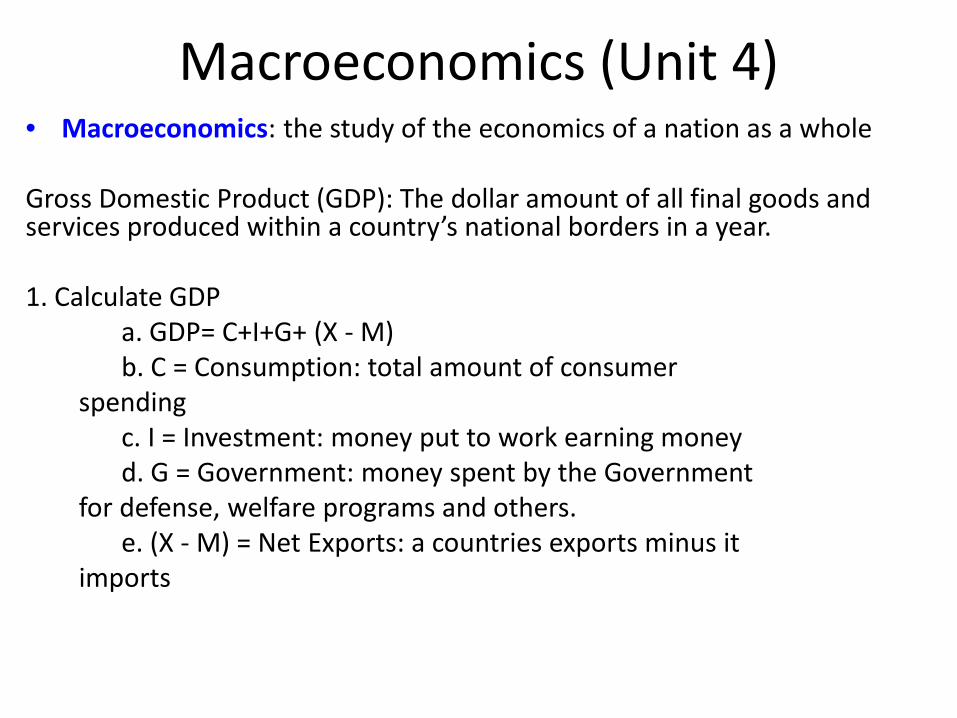
Macroeconomics (Unit 4) • Macroeconomics: the study of the economics of a nation as a whole Gross Domestic Product (GDP): The dollar amount of all final goods and services produced within a country’s national borders in a year. 1. Calculate GDP a. GDP= C+I+G+ (X - M) b. C = Consumption: total amount of consumer spending c. I = Investment: money put to work earning money d. G = Government: money spent by the Government for defense, welfare programs and others. e. (X - M) = Net Exports: a countries exports minus it imports
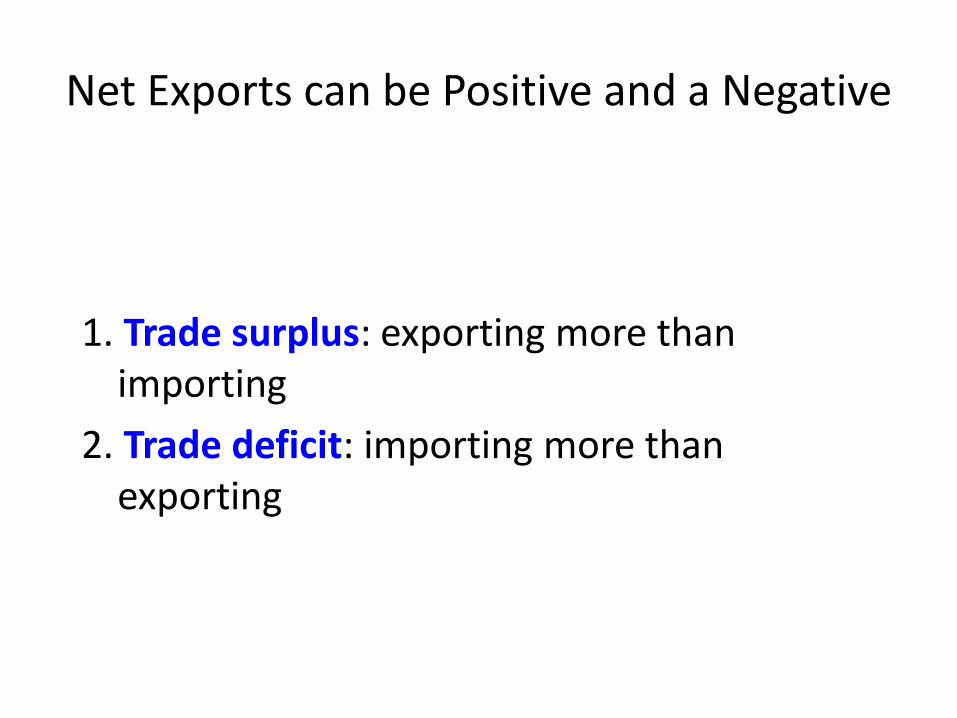
Net Exports can be Positive and a Negative
1. Trade surplus: exporting more than importing
2. Trade deficit: importing more than exporting
GDP per Capita
1. GDP per Capita: dollar amount of GDP produced on a per-person basis.
2. GDP per Capita measures the standard of living of the people in a country.
3. Standard of living: is the rough estimate of the quality of life that people in a country are able to afford.
Consumer Price Index
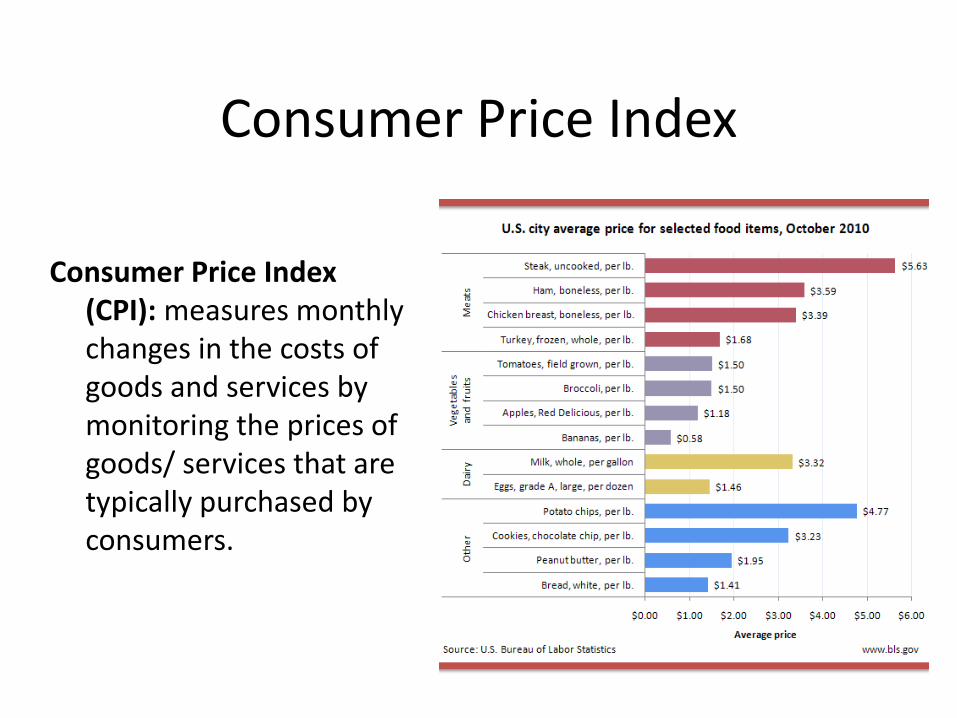
Consumer Price Index (CPI): measures monthly changes in the costs of goods and services by monitoring the prices of goods/ services that are typically purchased by consumers.
Using the Consumer Price Index
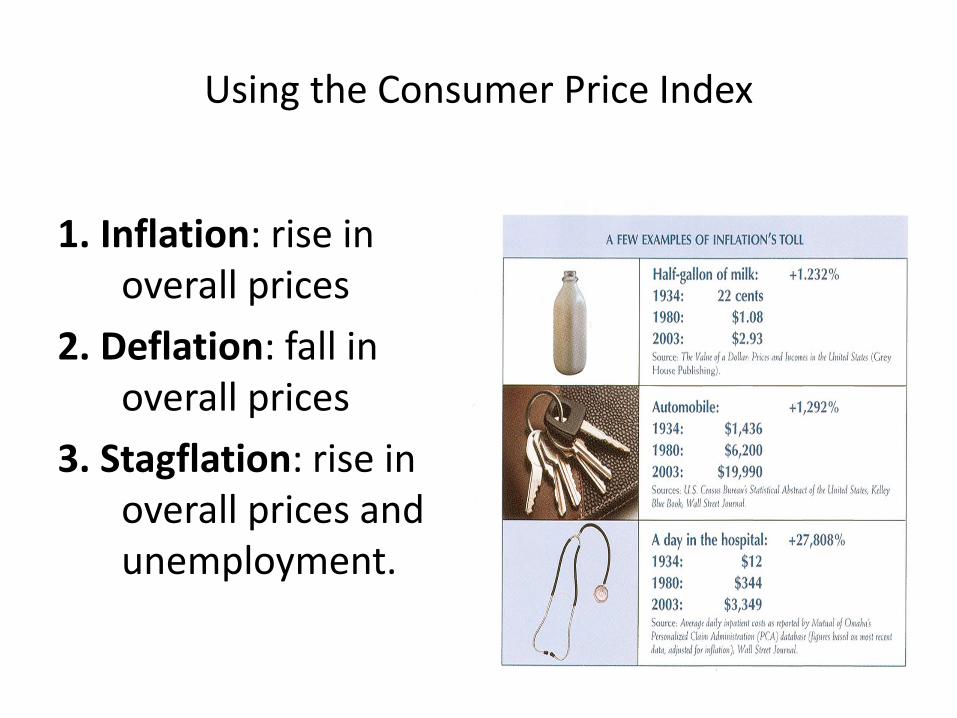
1. Inflation: rise in overall prices
2. Deflation: fall in overall prices
3. Stagflation: rise in overall prices and unemployment.
Calculating Inflation Rate
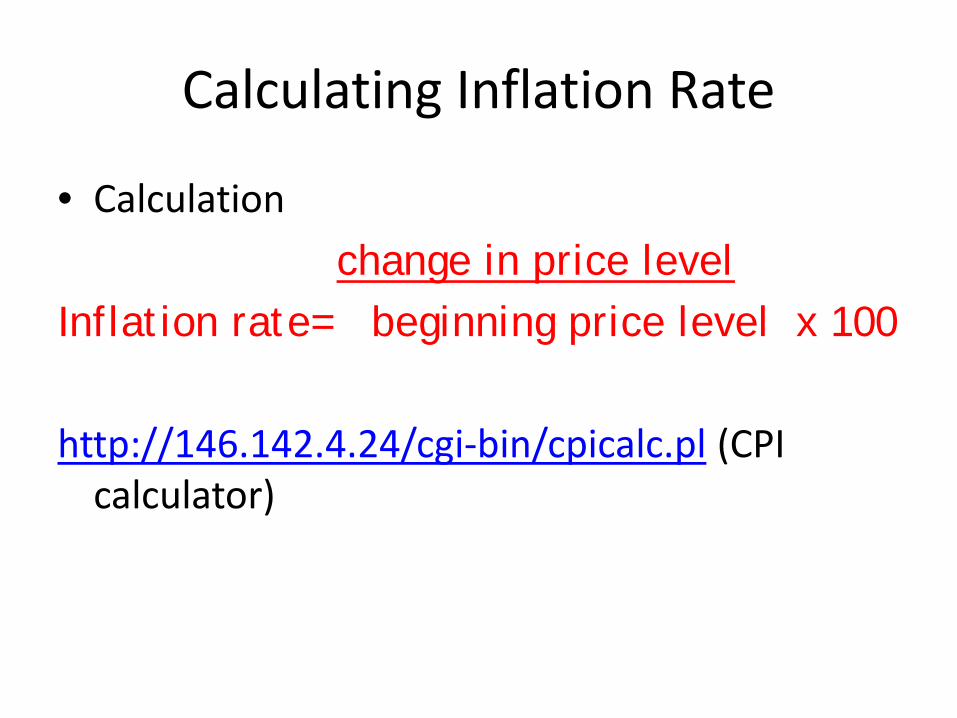
• Calculation change in price level Inflation rate= beginning price level x 100 http://146.142.4.24/cgi-bin/cpicalc.pl (CPI
calculator)
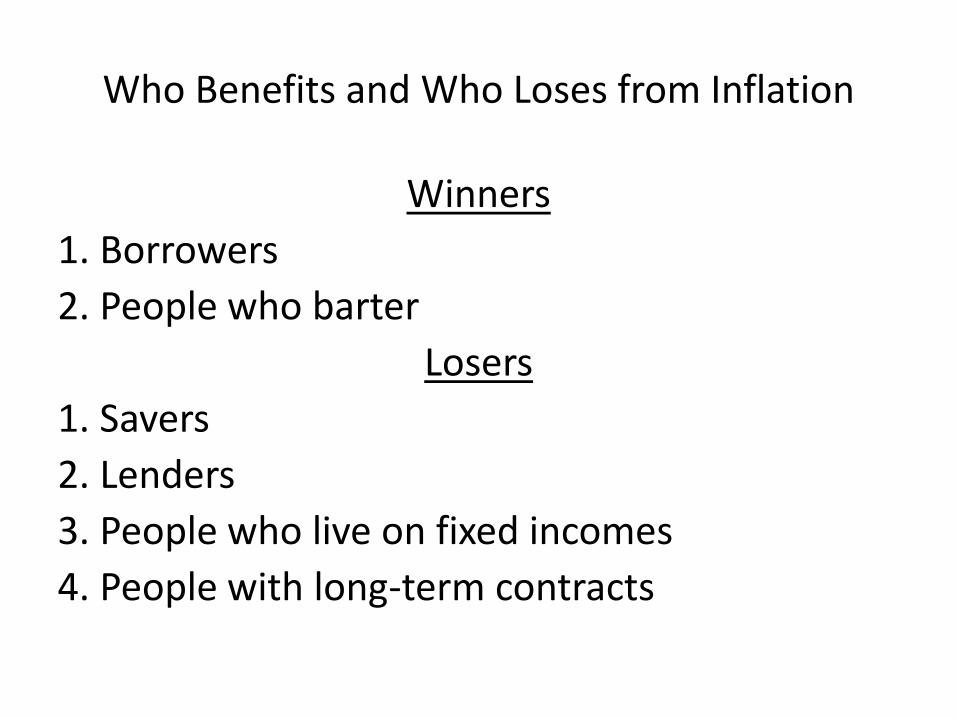
Who Benefits and Who Loses from Inflation
Winners 1. Borrowers 2. People who barter
Losers 1. Savers 2. Lenders 3. People who live on fixed incomes 4. People with long-term contracts
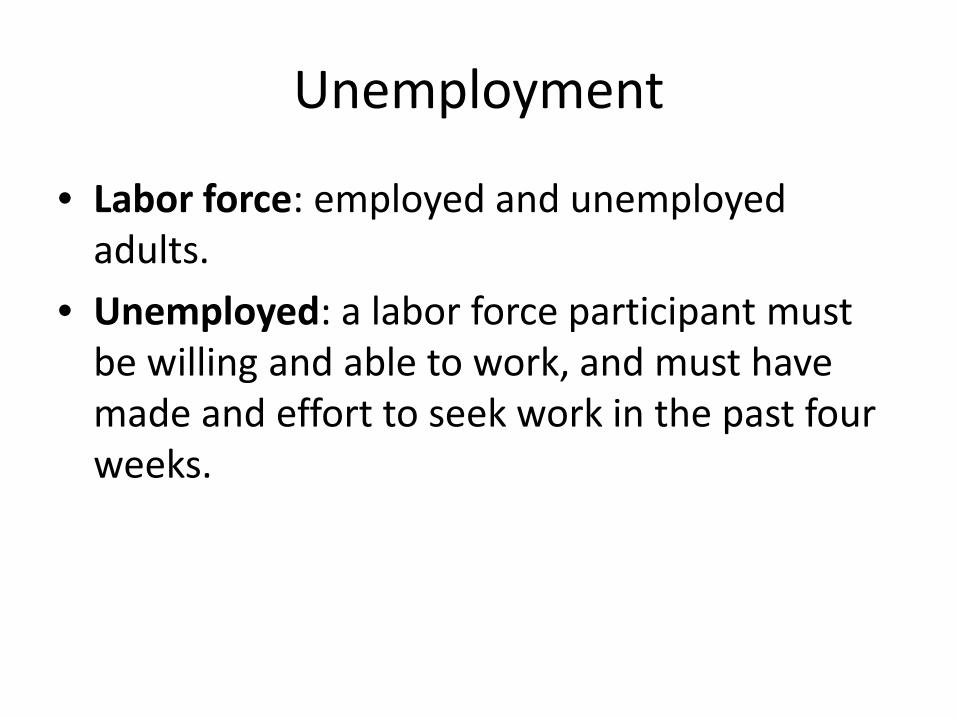
Unemployment
• Labor force: employed and unemployed adults.
• Unemployed: a labor force participant must be willing and able to work, and must have made and effort to seek work in the past four weeks.
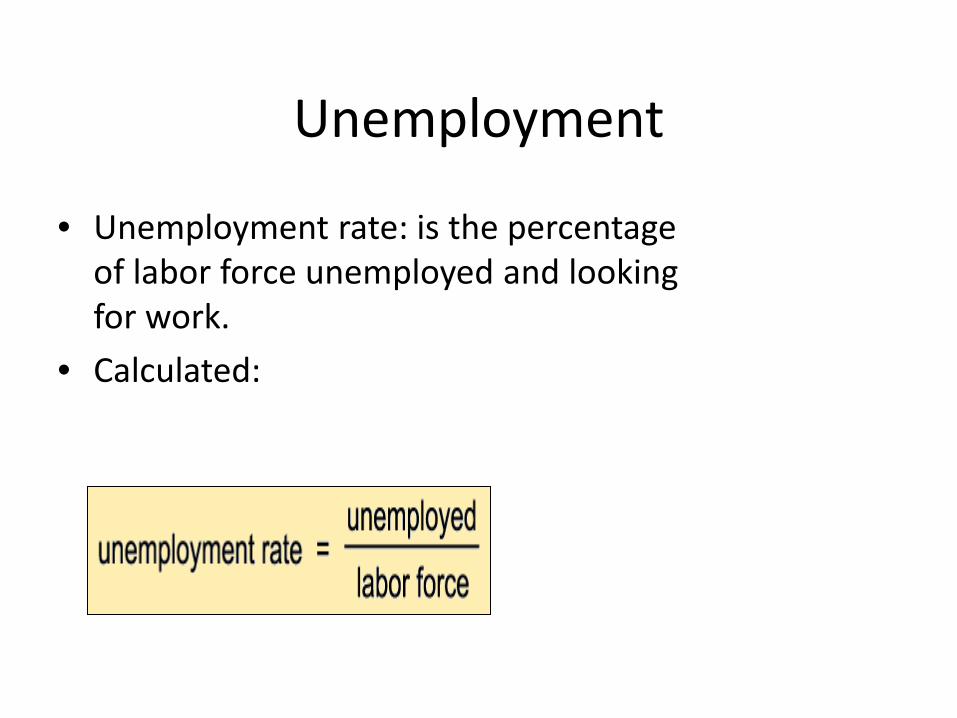
Unemployment
• Unemployment rate: is the percentage of labor force unemployed and looking for work.
• Calculated:
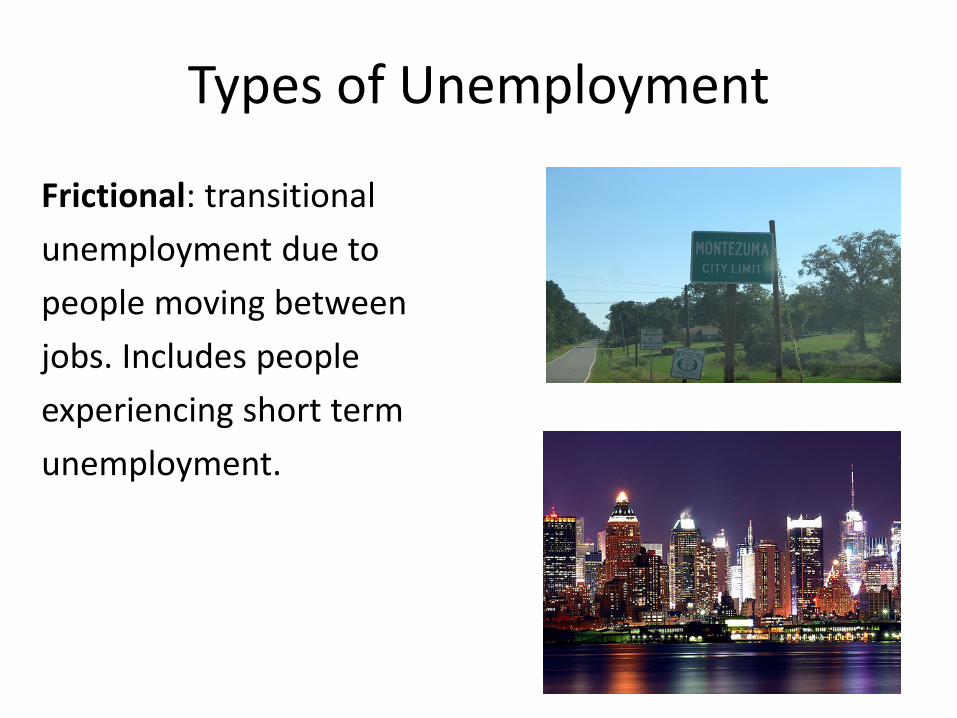
Types of Unemployment
Frictional: transitional unemployment due to people moving between jobs. Includes people experiencing short term unemployment.
Types of Unemployment Structural: the result of a skills mismatch, usually poorly educated people find themselves structurally unemployed.
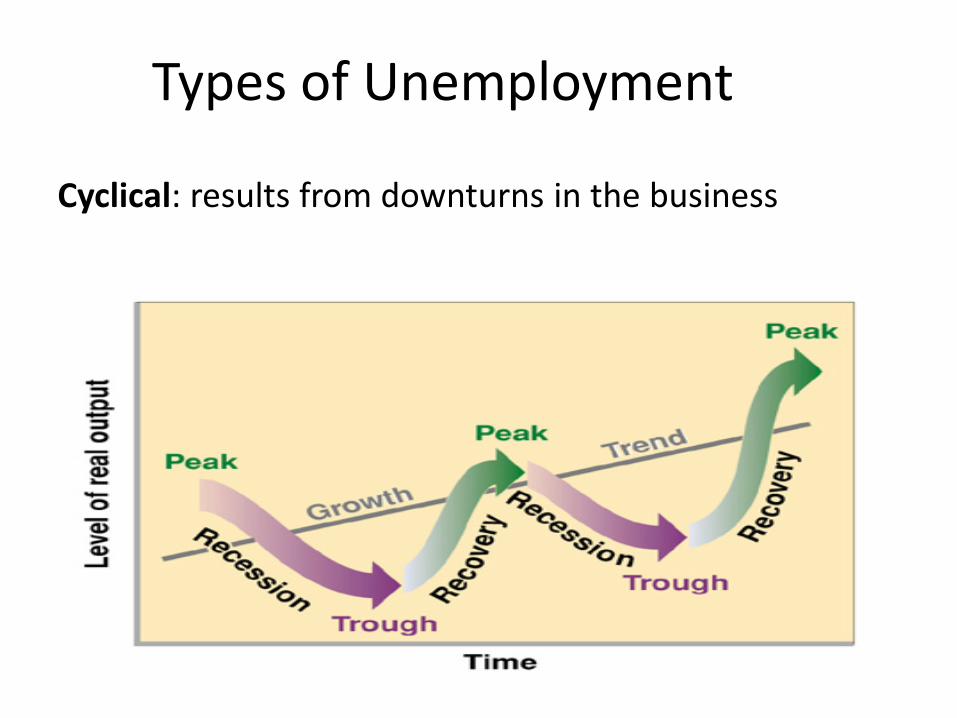
Types of Unemployment
Cyclical: results from downturns in the business
Types of Unemployment
Seasonal: regular seasonal changes in employment
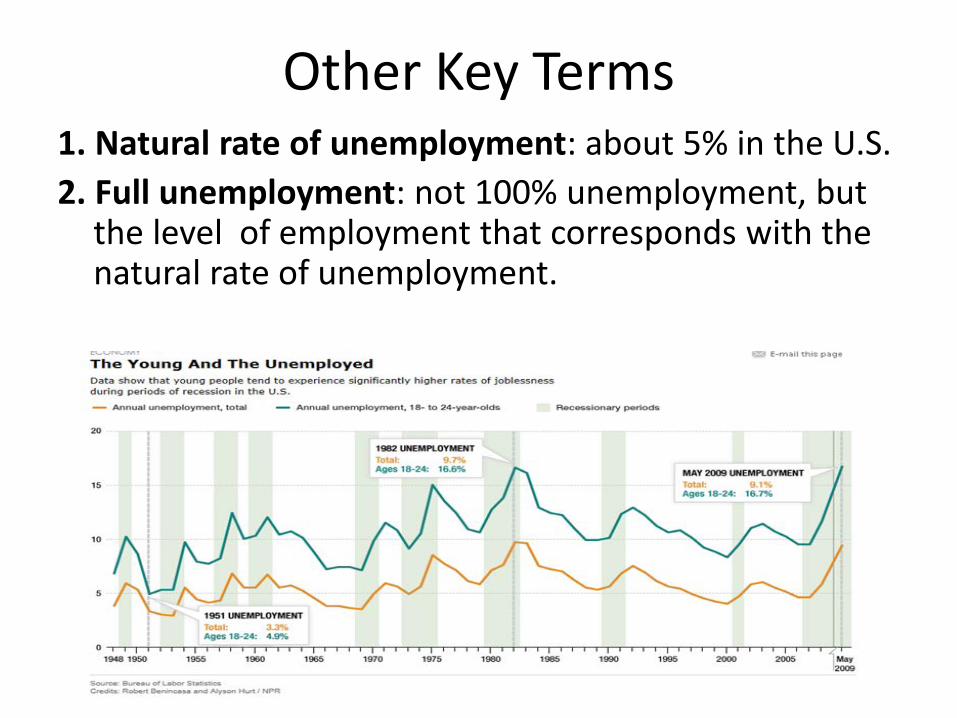
Other Key Terms 1. Natural rate of unemployment: about 5% in the U.S. 2. Full unemployment: not 100% unemployment, but
the level of employment that corresponds with the natural rate of unemployment.
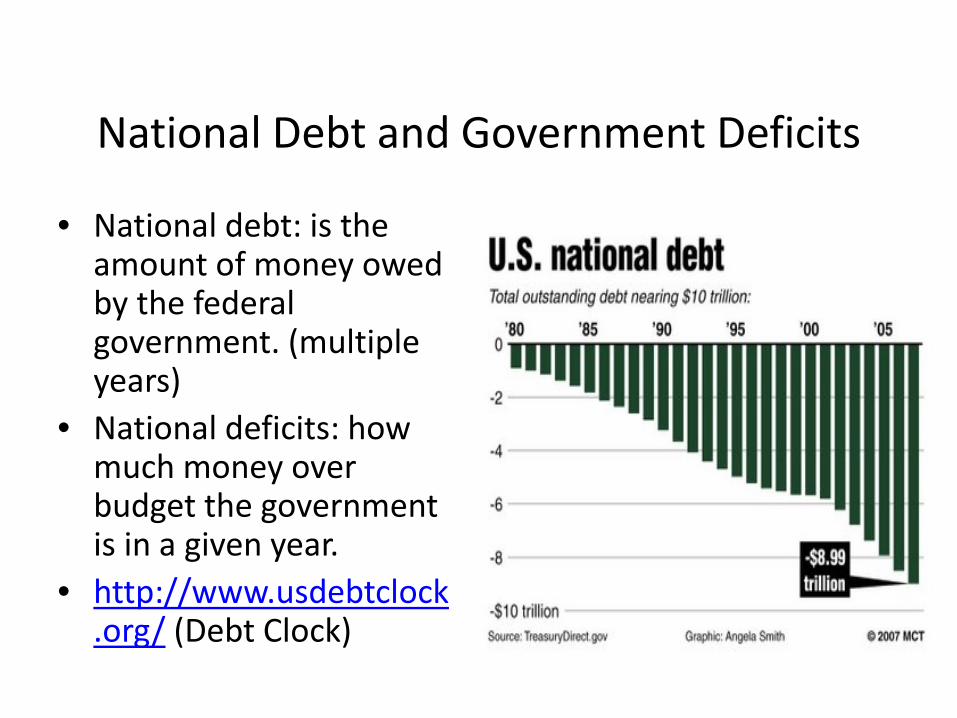
National Debt and Government Deficits
• National debt: is the amount of money owed by the federal government. (multiple years)
• National deficits: how much money over budget the government is in a given year.
• http://www.usdebtclock.org/ (Debt Clock)
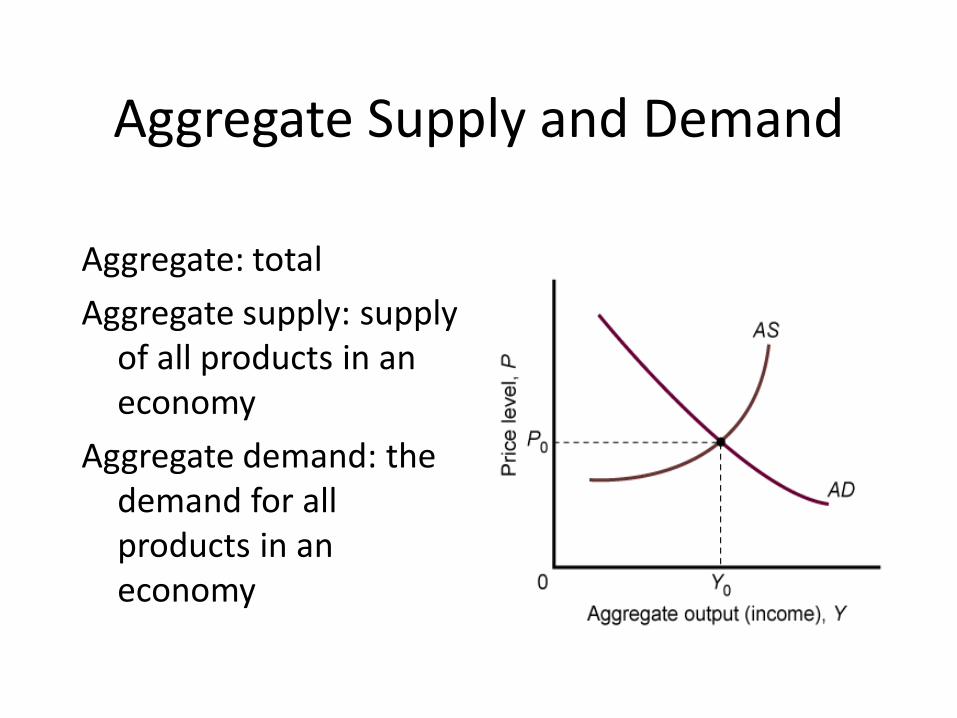
Aggregate Supply and Demand
Aggregate: total Aggregate supply: supply
of all products in an economy
Aggregate demand: the demand for all products in an economy
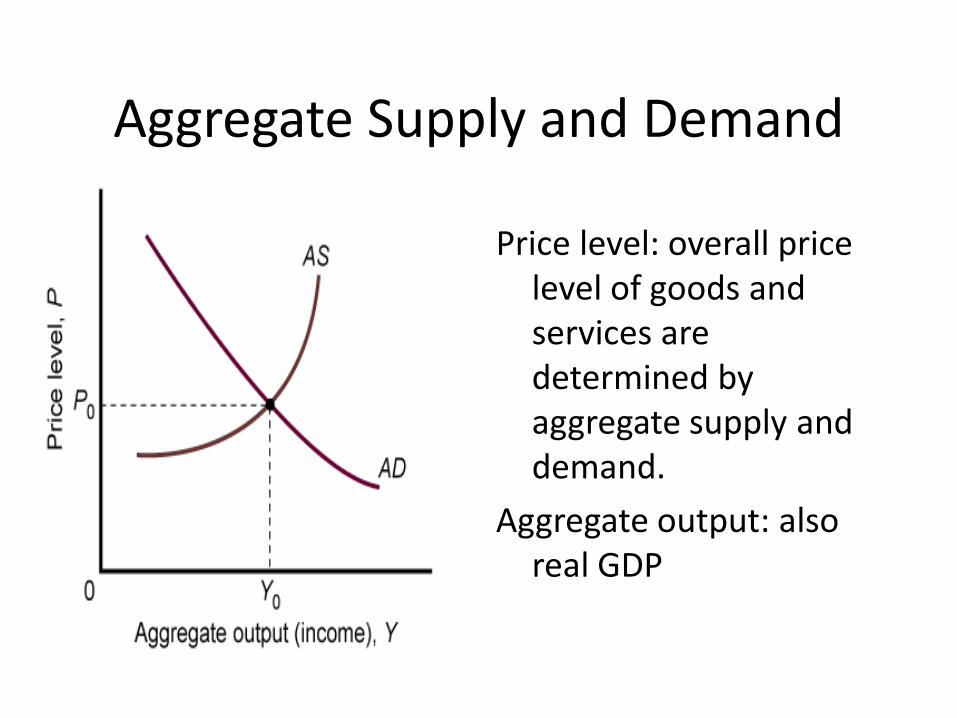
Aggregate Supply and Demand
Price level: overall price level of goods and services are determined by aggregate supply and demand.
Aggregate output: also real GDP
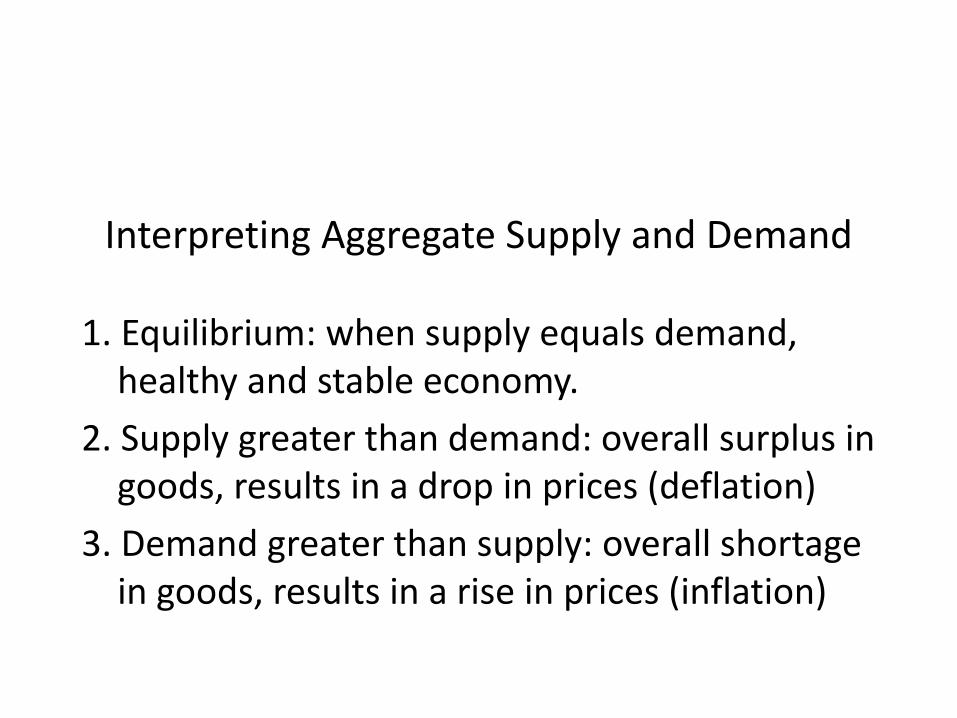
Interpreting Aggregate Supply and Demand
1. Equilibrium: when supply equals demand, healthy and stable economy.
2. Supply greater than demand: overall surplus in goods, results in a drop in prices (deflation)
3. Demand greater than supply: overall shortage in goods, results in a rise in prices (inflation)
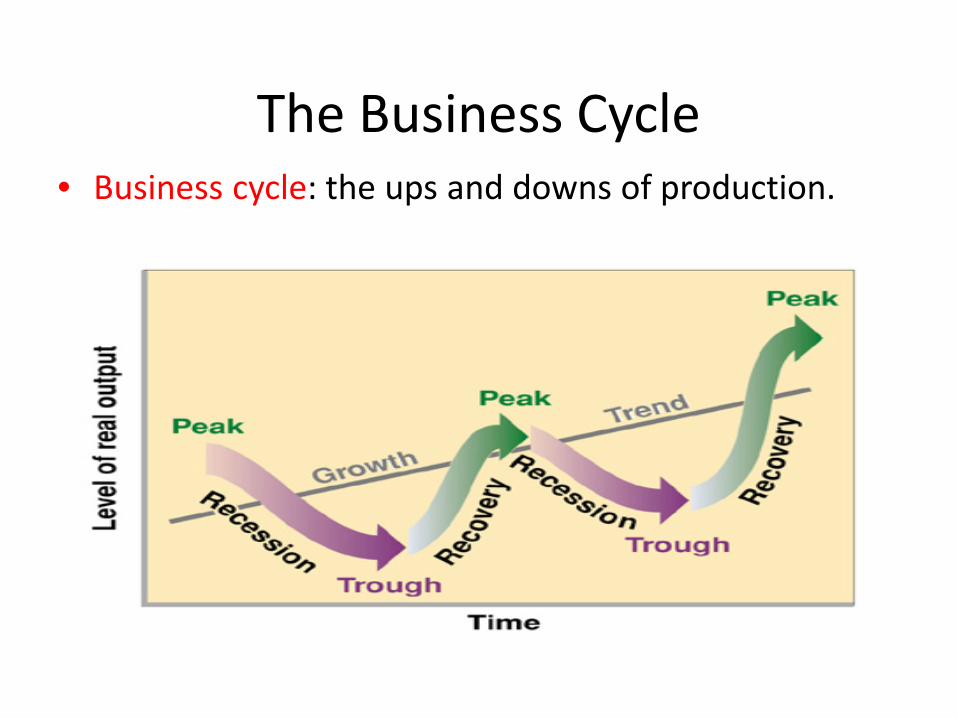
The Business Cycle • Business cycle: the ups and downs of production.
Stages of the Business Cycle Stages of the Business Cycle 1. Peak: highest point before a recession 2. Recession: a decline that lasts at least 6 months 3. Trough: the lowest point at the end of a recession and before and recovery 4. Recovery: the period between the end of a recession and the next
peak Other Key Terms 1. Depression: an extremely bad recession, and trough 2. Boom: an extremely fast expansion, and peak
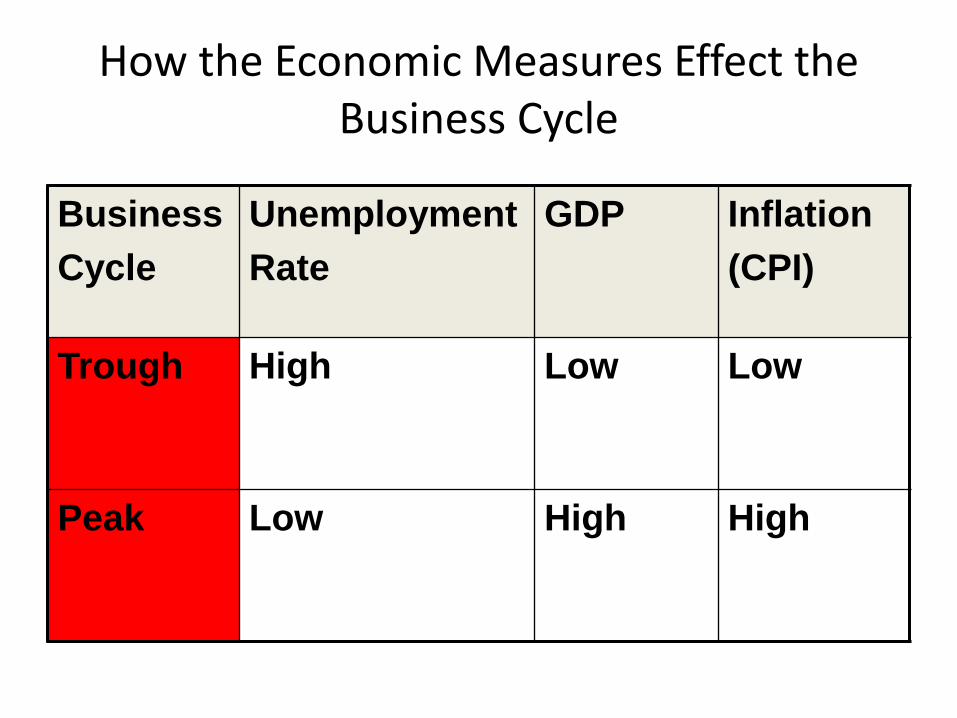
How the Economic Measures Effect the Business Cycle
Business Cycle
Unemployment Rate
GDP Inflation (CPI)
Trough High Low Low
Peak Low High High
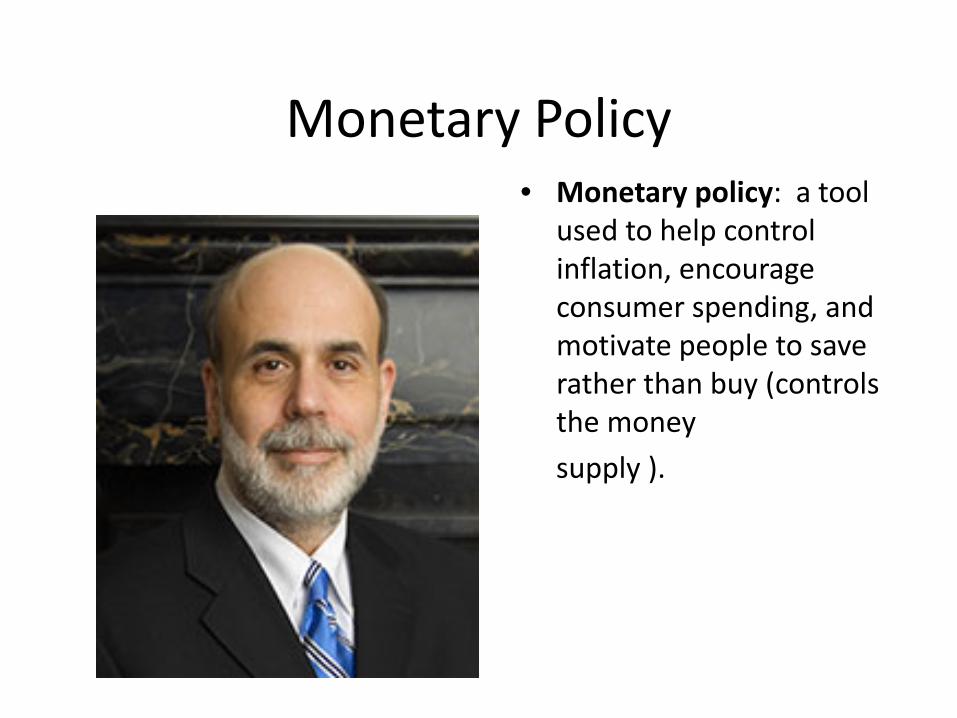
Monetary Policy • Monetary policy: a tool
used to help control inflation, encourage consumer spending, and motivate people to save rather than buy (controls the money
supply ).
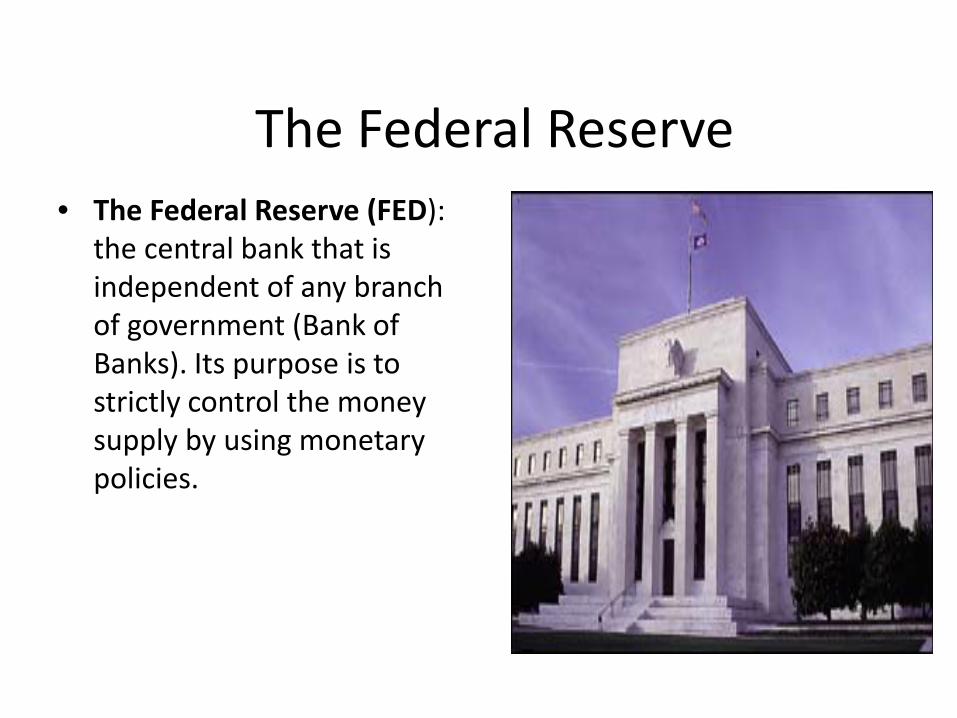
The Federal Reserve • The Federal Reserve (FED):
the central bank that is independent of any branch of government (Bank of Banks). Its purpose is to strictly control the money supply by using monetary policies.
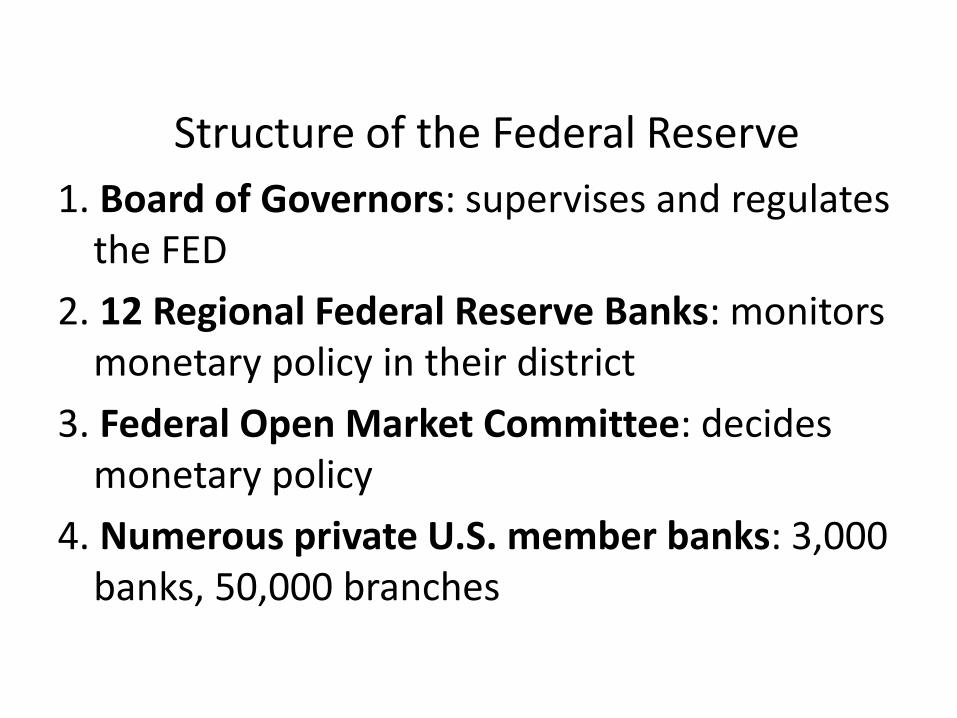
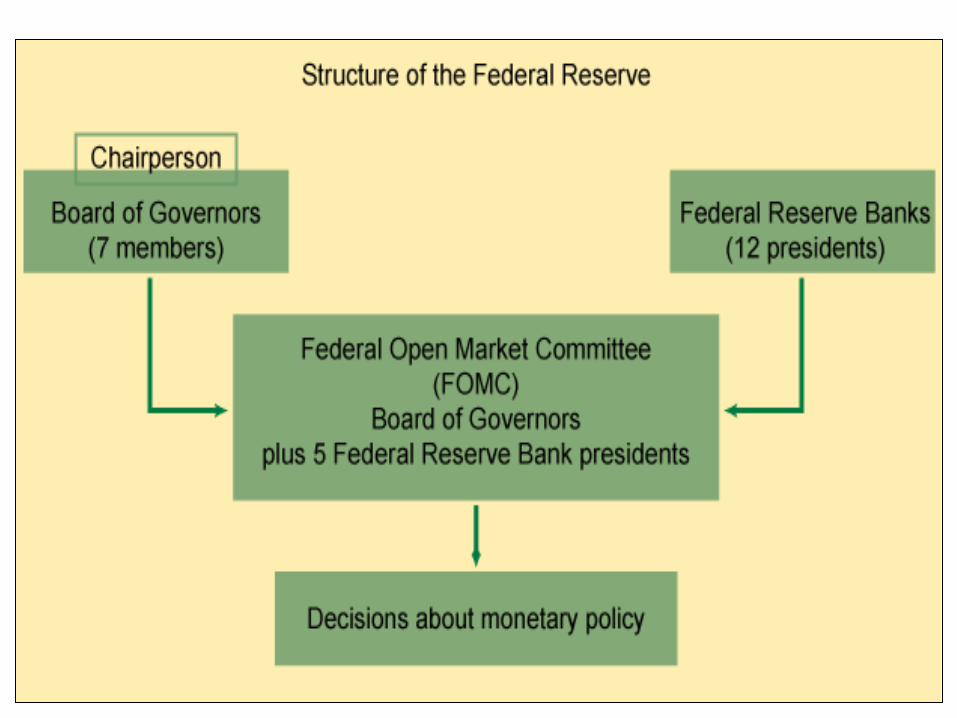
Structure of the Federal Reserve 1. Board of Governors: supervises and regulates
the FED 2. 12 Regional Federal Reserve Banks: monitors
monetary policy in their district 3. Federal Open Market Committee: decides
monetary policy 4. Numerous private U.S. member banks: 3,000
banks, 50,000 branches
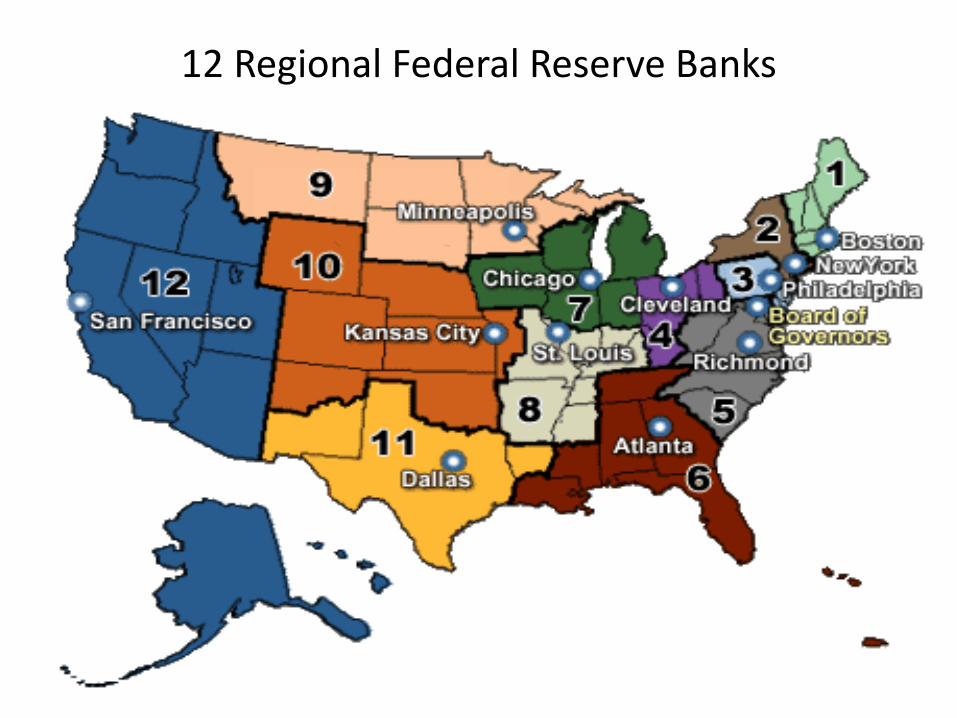
12 Regional Federal Reserve Banks
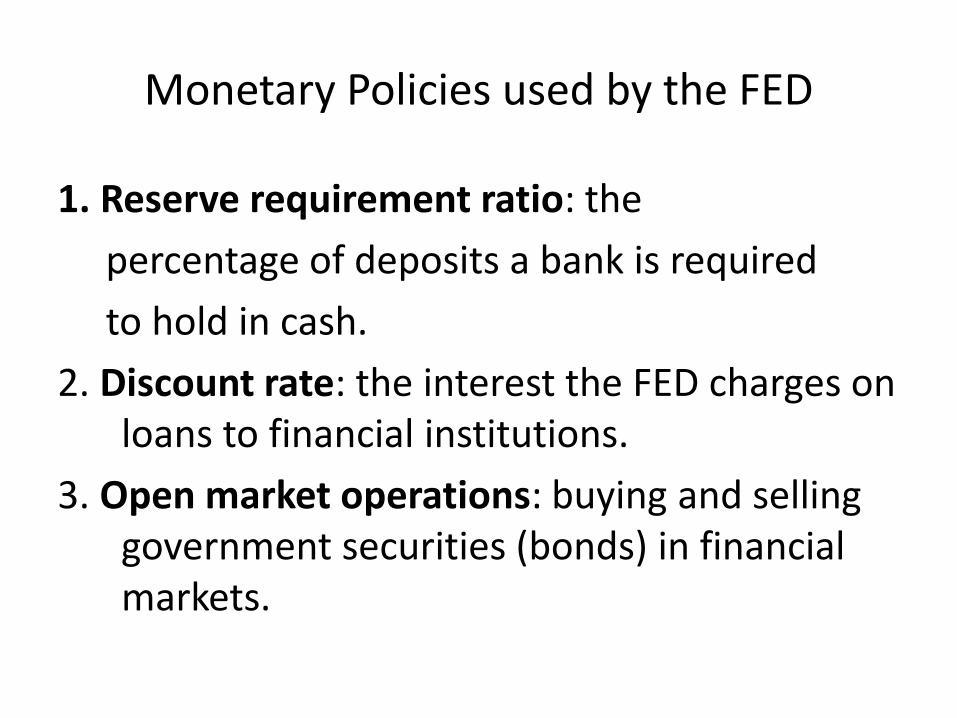
Monetary Policies used by the FED
1. Reserve requirement ratio: the percentage of deposits a bank is required to hold in cash. 2. Discount rate: the interest the FED charges on
loans to financial institutions. 3. Open market operations: buying and selling
government securities (bonds) in financial markets.
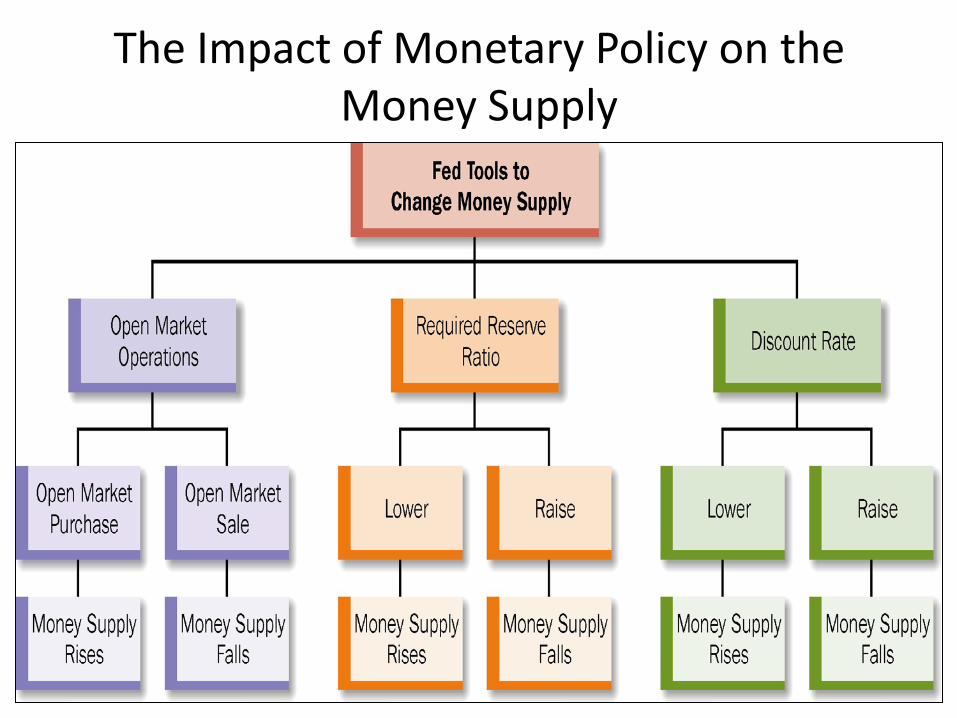
The Impact of Monetary Policy on the Money Supply
Fiscal Policy
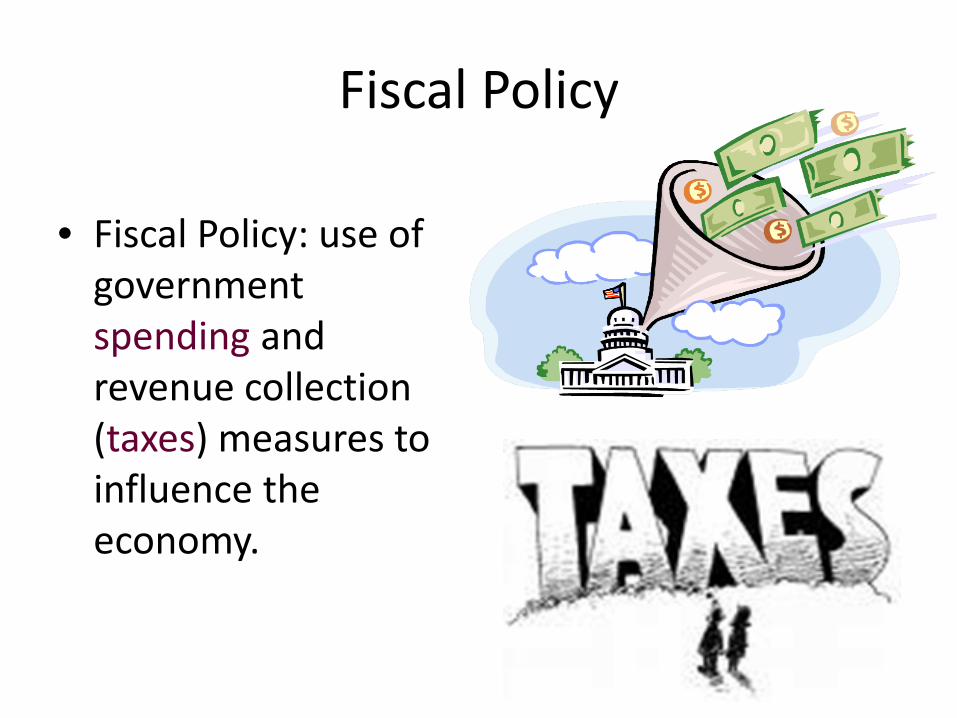
• Fiscal Policy: use of government spending and revenue collection (taxes) measures to influence the economy.
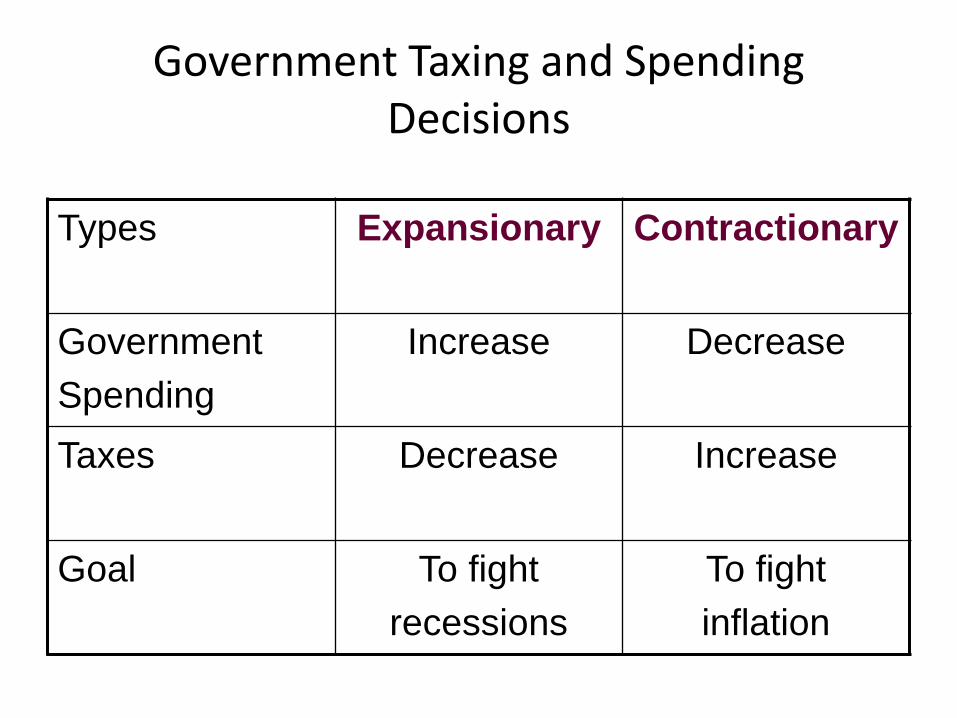
Types Expansionary Contractionary
Government Spending
Increase Decrease
Taxes Decrease Increase
Goal To fight recessions
To fight inflation
Government Taxing and Spending Decisions
International Economics: the study of how economies in different countries and regions of the world interact and affect one another.
International Economics (Unit 5)
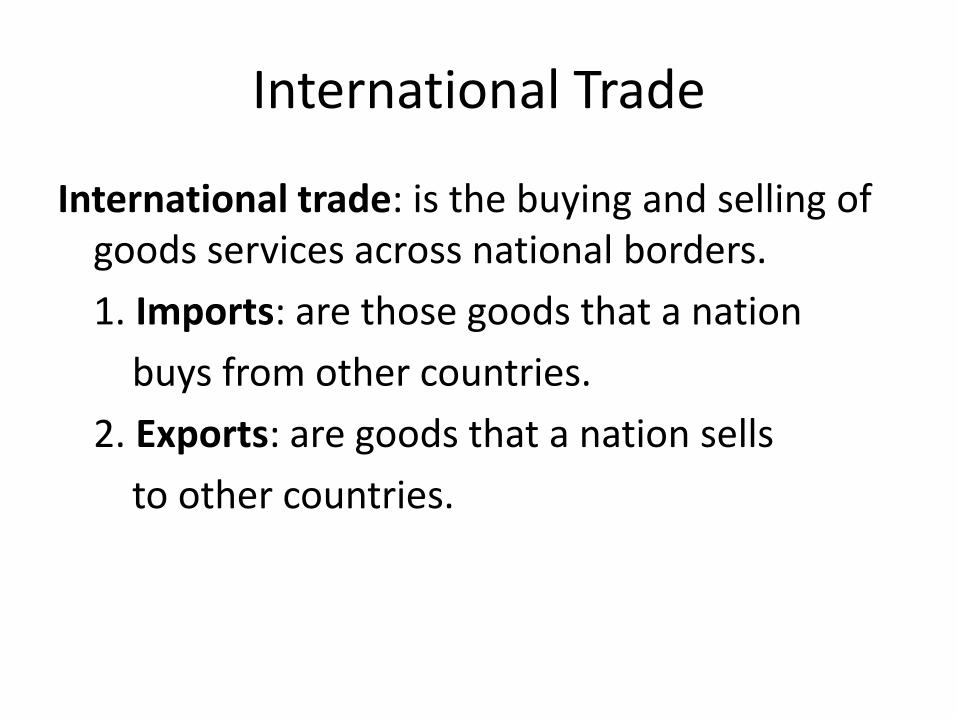
International trade: is the buying and selling of goods services across national borders.
1. Imports: are those goods that a nation buys from other countries. 2. Exports: are goods that a nation sells to other countries.
International Trade
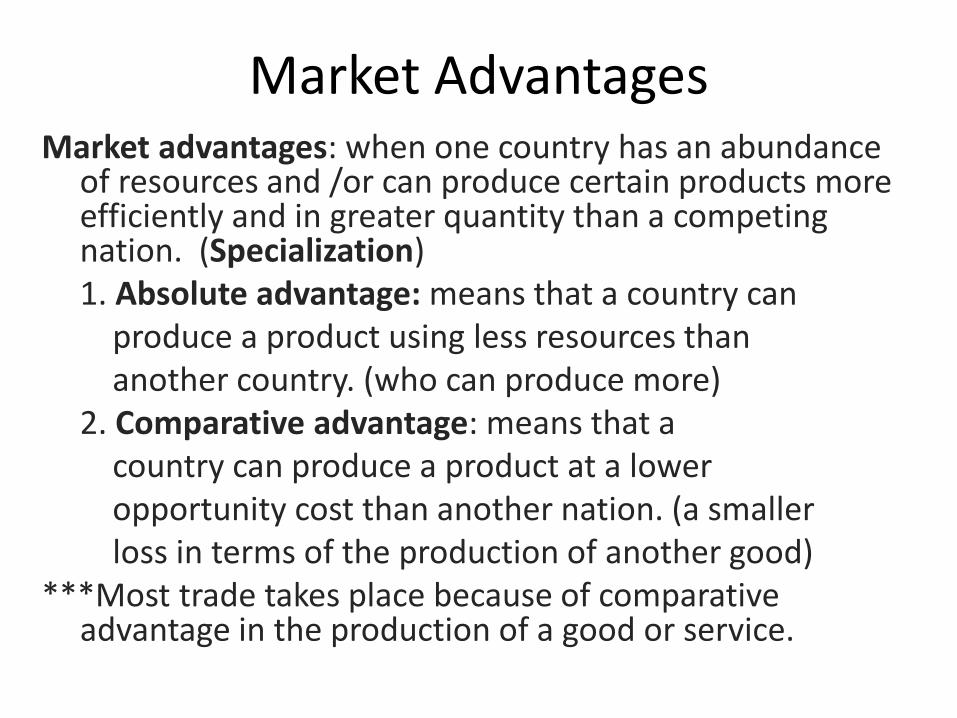
Market advantages: when one country has an abundance of resources and /or can produce certain products more efficiently and in greater quantity than a competing nation. (Specialization)
1. Absolute advantage: means that a country can produce a product using less resources than another country. (who can produce more) 2. Comparative advantage: means that a country can produce a product at a lower opportunity cost than another nation. (a smaller loss in terms of the production of another good) ***Most trade takes place because of comparative
advantage in the production of a good or service.
Market Advantages
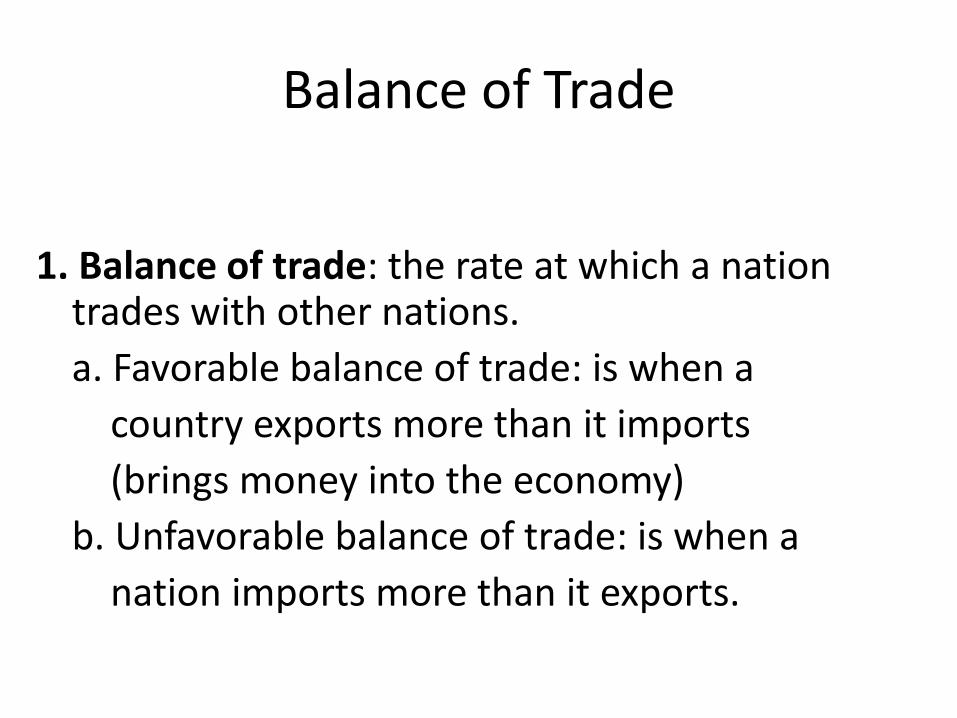
1. Balance of trade: the rate at which a nation trades with other nations.
a. Favorable balance of trade: is when a country exports more than it imports (brings money into the economy) b. Unfavorable balance of trade: is when a nation imports more than it exports.
Balance of Trade
• 2. Balance of payments: is the value of all the money coming into the country thanks to exports minus all of the money going out of the country as it pays for imports.
Balance of Payments
5 Trade Restrictions and Barriers Free Trade: international trade without government
restrictions. 5 Trade restrictions and barriers 1. Quotas: a limit placed on the quantities of a product that can be imported. 2. Tariffs: a tax placed on imports to increase their price in the domestic market. 3. Embargoes: when a country, or multiple countries, impose economic sanctions against a nation by refusing to trade with them. 4. Standards: specific guidelines on goods coming into a country. 5. Subsidies: a government payment to businesses.
Reasons for Trade Barriers
Free-traders oppose Protectionist (Cost of trade barriers)
Protectionism favor trade barriers that protect domestic industries. (Benefit of trade barriers)
a. National defense b. Protecting domestic jobs c. Keeping the money at home d. Promoting infant companies e. Retaliation from other countries
International Organizations and Agreements
1. North American Free Trade Agreement (NAFTA): a trade agreement that lowered trade barriers between America, Canada, and Mexico
2. World Trade Union (WTO): international agency that establishes rules for international trade and helps resolve disputes between member nations.
3. European Union (EU): is a political and economic union of twenty-seven member states, located in Europe.
International Organizations and Agreements
4. United Nations (UN): is an international organization whose stated aims are to facilitate cooperation in international law, international security, economic development, social progress, and human rights. (192 member states)
5. Association of Southeast Asian Nations (ASEAN): is a geo-political and economic organization of 10 countries located in Southeast Asia. ( Indonesia, Thailand, Vietnam, Malaysia, Singapore, Philippines)
Determining Exchange Rates
Exchange rates: is the price of one country’s currency in terms of another country’s currency.
Determining exchange rates 1. Fixed exchange rate: an established price for a foreign currency that is tied to a stable currency of a developed country. 2. Floating (flexible) exchange rate: the forces of supply and demand establish the value of one country’s currency in terms of another country’s currency.
Change in the exchange rates 1. Currency appreciation: is the gain of value of a country’s currency with respect to one or more foreign reference currencies. a. Benefits consumers, but can hurt producers. b. Devaluation: lowering a nation’s currency value on purpose.
Change in the Exchange Rates
Change in the Exchange Rates
2. Currency depreciation: is the loss of value of a country’s currency with respect to one or more foreign reference currencies.
a. Benefits producers, but can hurt consumers.
Factors Affecting Exchange Rates 4 Factors affecting exchange rates
1. Interest rates: if, the interest rates in a country A’s are high relative to other countries, the
demand for country A’s dollars will increase. Foreign investors will want to Invest in country A’s securities in order to collect the high interest. 2. Productivity: is the amount of goods that a
nation is producing. As a nation’s productivity increases relative to the rest of the world, so does the demand for its currency
Factors Affecting Exchange Rates 3. Consumer tastes: if consumers begin to prefer
nation A’s goods more than good from other nations, then demand for that nations currency will rise.
4. Economic stability: the more stable an economy is the more foreign investors demand its currency.
Purchasing Power
1. Purchasing power: is the actual amount of goods and services that can be bought with a given unit of money.
2. Purchasing power parity: is when the same product sells for the same amount of currency in different countries.