Embed Size (px)
Citation preview
Economics of Soil Health: Existing Research
Richard L. FarnsworthEconomics of Soil Health Conference
Washington DC – September 21-22, 2015
http://www.nrcs.usda.gov/wps/portal/nrcs/detail/ok/soils/health/?cid=stelprdb1260243
Qualifying Statement
“Thoughts and opinions presented today are those of the author and do not
represent those of USDA or the Natural Resources Conservation Service.”
2
Outline
Objectives
Definition of Soil Health
Indicator/Index Research and Results
Economics of Soil Health
Conclusions
3
Objectives
Find economic articles that establish a causal relationship or strong association between healthier soil ecosystems and ◦ Crop yields,
◦ Crop yield variability,
◦ Profitability,
◦ Variability of profitability.
Summarize results.4
Definition of Soil Health (NRCS) “… the continued capacity of soil to
function as a vital living ecosystem that sustains plants, animals, and humans” (NRCS, 2014).
Text supporting the definition:◦ Almost always includes discussions about improving
a soil’s physical, biological and chemical properties.
◦ Refers to on-farm benefits and off-farm benefits (ecosystem services).
◦ “Managing soil ….should be an integral part of ag. decision making.”
5
Model and First Set of Queries
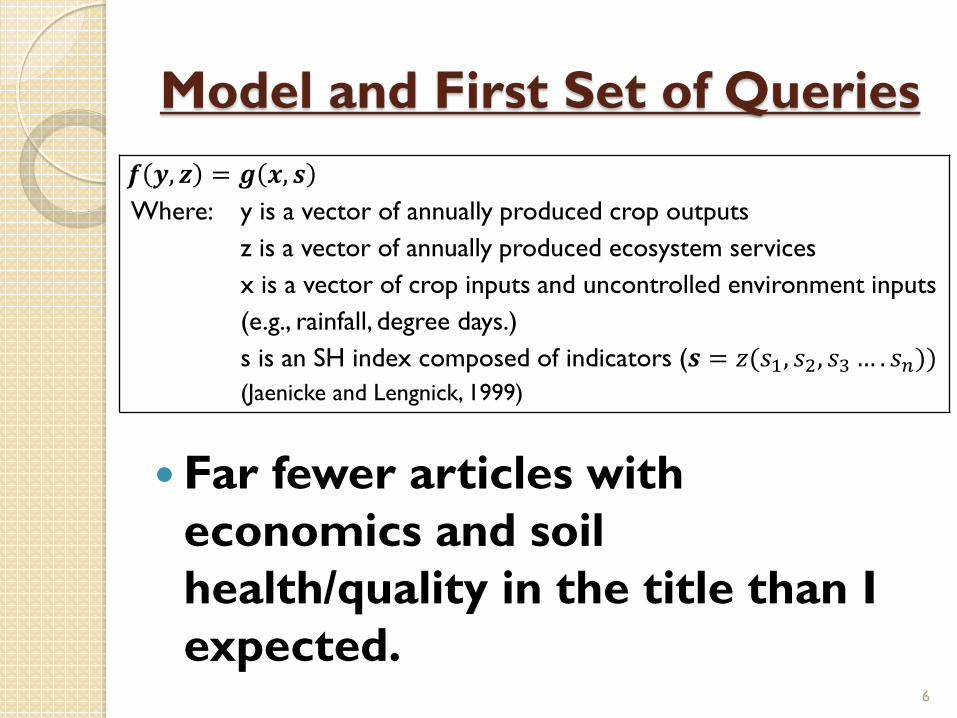
Far fewer articles with economics and soil health/quality in the title than I expected.
𝒇𝒇 𝒚𝒚, 𝒛𝒛 = 𝒈𝒈 𝒙𝒙, 𝒔𝒔Where: y is a vector of annually produced crop outputs
z is a vector of annually produced ecosystem servicesx is a vector of crop inputs and uncontrolled environment inputs (e.g., rainfall, degree days.)s is an SH index composed of indicators (𝒔𝒔 = 𝑧𝑧(𝑠𝑠1, 𝑠𝑠2, 𝑠𝑠3 … . 𝑠𝑠𝑛𝑛))(Jaenicke and Lengnick, 1999)
6
Indicator/Index Research
Large number of studies
Identifying possible indicators/index,
Describing measurement methodologies, and
Comparing changes in indicator/index values between a base and alternatives (e.g., tillage systems, cover crops).
Shifted gears – Redirected my effort to the soil science literature.
7
Indicator/Index Research (cont.)
Identification of many useable indicators and a few indices.
Development of soil health management guidelines and supporting outreachmaterials (e.g., NRCS Indicators, Cornell Soil Health Report).
Positives
8
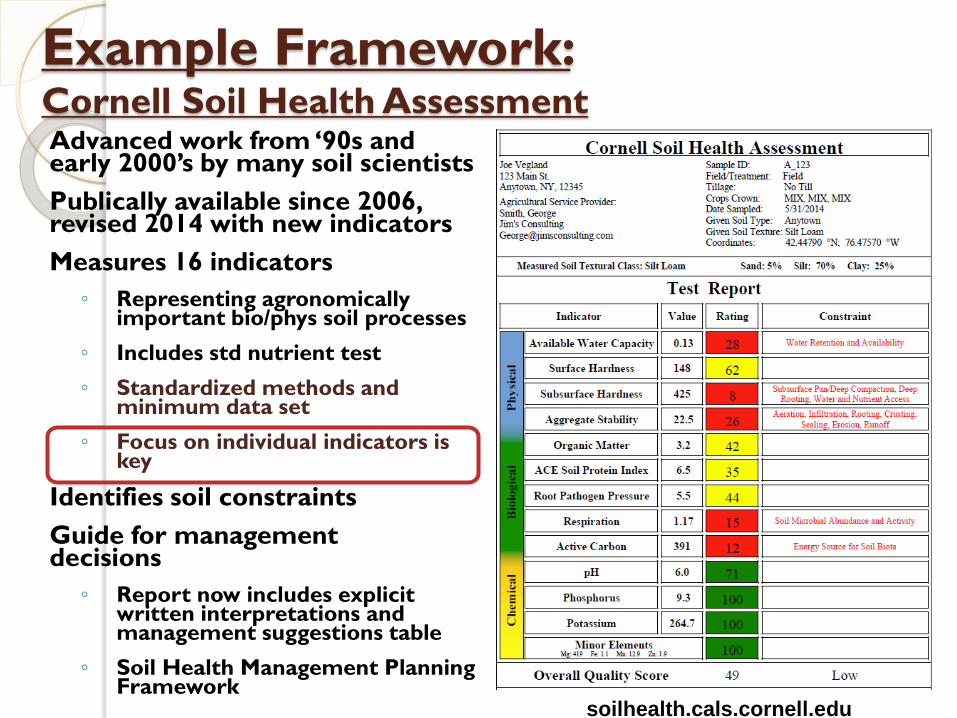
Example Framework: Cornell Soil Health AssessmentAdvanced work from ‘90s and early 2000’s by many soil scientists Publically available since 2006, revised 2014 with new indicators Measures 16 indicators ◦ Representing agronomically
important bio/phys soil processes◦ Includes std nutrient test◦ Standardized methods and
minimum data set◦ Focus on individual indicators is
key
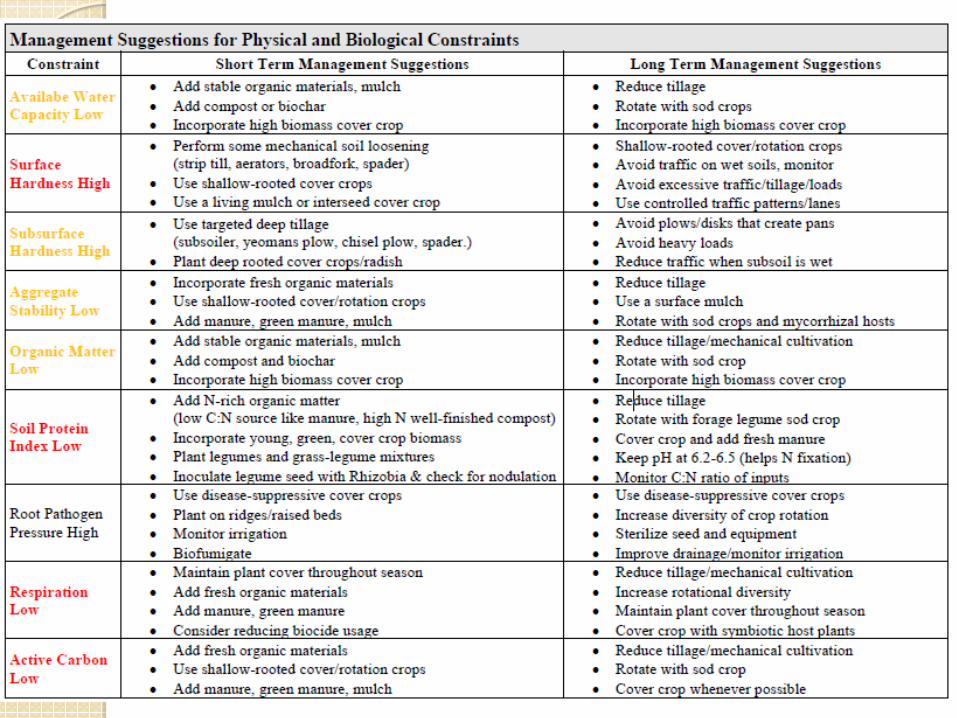
Identifies soil constraints Guide for management decisions◦ Report now includes explicit
written interpretations and management suggestions table
◦ Soil Health Management Planning Framework
soilhealth.cals.cornell.edu
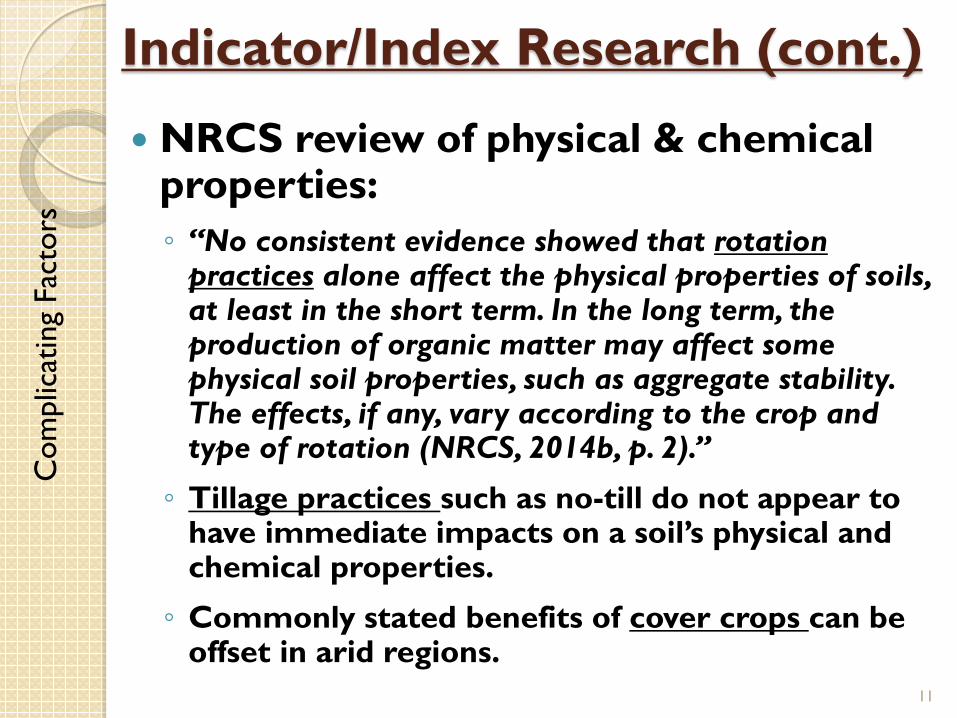
Indicator/Index Research (cont.)
NRCS review of physical & chemical properties:◦ “No consistent evidence showed that rotation
practices alone affect the physical properties of soils, at least in the short term. In the long term, the production of organic matter may affect some physical soil properties, such as aggregate stability. The effects, if any, vary according to the crop and type of rotation (NRCS, 2014b, p. 2).”
◦ Tillage practices such as no-till do not appear to have immediate impacts on a soil’s physical and chemical properties.
◦ Commonly stated benefits of cover crops can be offset in arid regions.
Com
plic
atin
g Fa
ctor
s
11
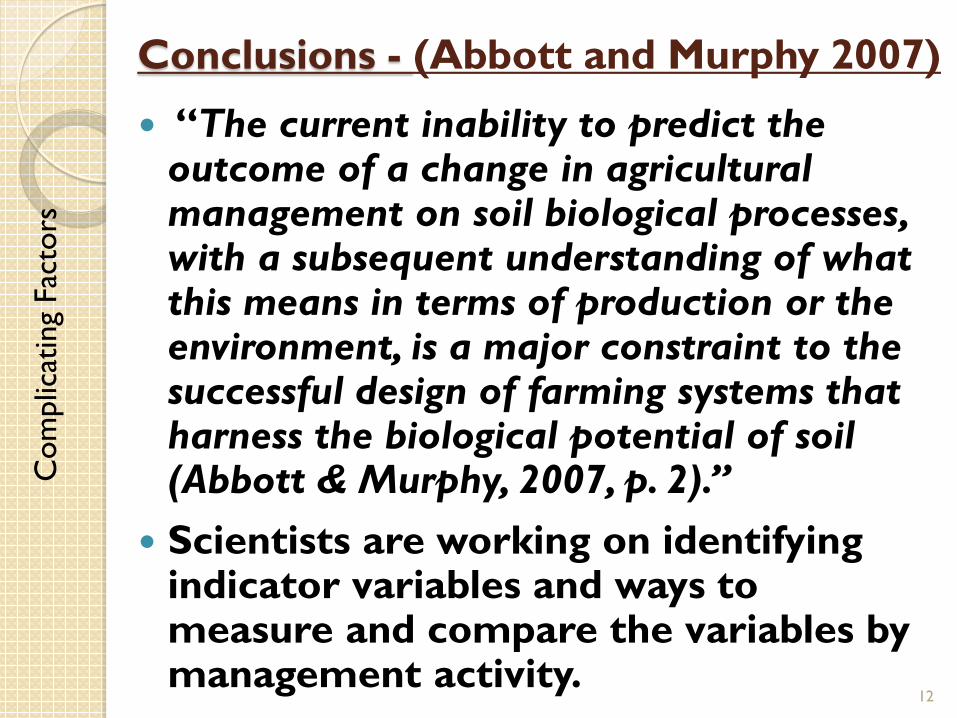
Conclusions - (Abbott and Murphy 2007)
“The current inability to predict the outcome of a change in agricultural management on soil biological processes, with a subsequent understanding of what this means in terms of production or the environment, is a major constraint to the successful design of farming systems that harness the biological potential of soil (Abbott & Murphy, 2007, p. 2).”
Scientists are working on identifying indicator variables and ways to measure and compare the variables by management activity.
Com
plic
atin
g Fa
ctor
s
12
SH Indices – Results Bastida et al. (2008): A universal, useful soil health formula has yet to be identified for the following reasons: Different methodologies with different
standardizations. Soil heterogeneity. Soil and climate and vegetation interactions. Different understandings of the soil
functions being investigated and applicable variables.
Com
plic
atin
g Fa
ctor
s
13
Economics of Soil Health (SH) Even with mixed results, what economically
related examples are in the literature?
Most of the work is plot and practice-based (tillage systems and cover crops).
Research groupings:
◦ Yields/profits (partial budgets) and some SH indicators compared.
◦ Yields/profits compared and SH benefits assumed, or
◦ Yields/profits compared, additional economic(?) analyses employed, and SH benefits assumed.
14
Yields/Profits and Soil IndicatorsTwo Example Articles: Karlen, D. L., Kovar, J. L., Cambardella, C. A.,
& Colvin, T. S. (2013). Thirty-year tillage effects on crop yield and soil fertility indicators. Soil & Tillage Research, 130, 24-41.
Karlen, D. L., Cambardella, C. A., Kovar, J. L., & Colvin, T. S. (2013). Soil quality response to long-term tillage and crop rotation practices. Soil & Tillage Research, 133, 54-64. Ex
ampl
e: Y
ield
s/Pr
ofits
and
Soi
l Ind
icat
ors
15
30-Year Tillage-Fertility Study
ISU – Boone County Univ. farm.Experimental design with
replications.Corn/soybean and cont. corn. 5 tillage systems: moldboard, chisel,
disk, ridge-till, and no-till. 13 soil indicators. Yields.Net returns (crop budgets).
Exam
ple:
Yie
lds/
Prof
its a
nd S
oil I
ndic
ator
s
16
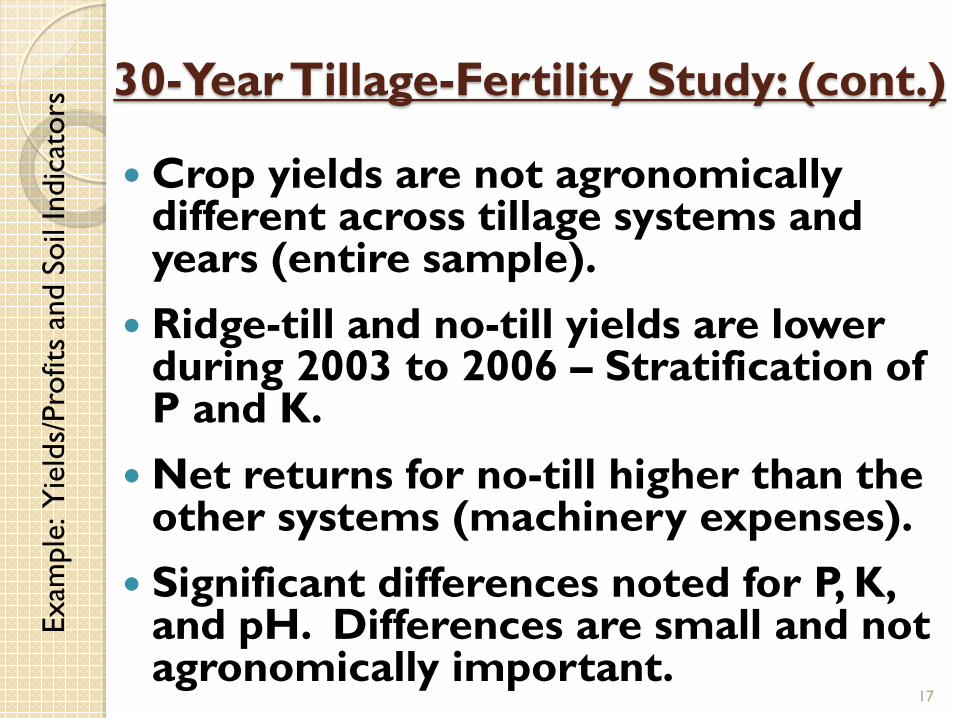
30-Year Tillage-Fertility Study: (cont.)
Crop yields are not agronomicallydifferent across tillage systems and years (entire sample).
Ridge-till and no-till yields are lower during 2003 to 2006 – Stratification of P and K.
Net returns for no-till higher than the other systems (machinery expenses).
Significant differences noted for P, K, and pH. Differences are small and not agronomically important.
Exam
ple:
Yie
lds/
Prof
its a
nd S
oil I
ndic
ator
s
17
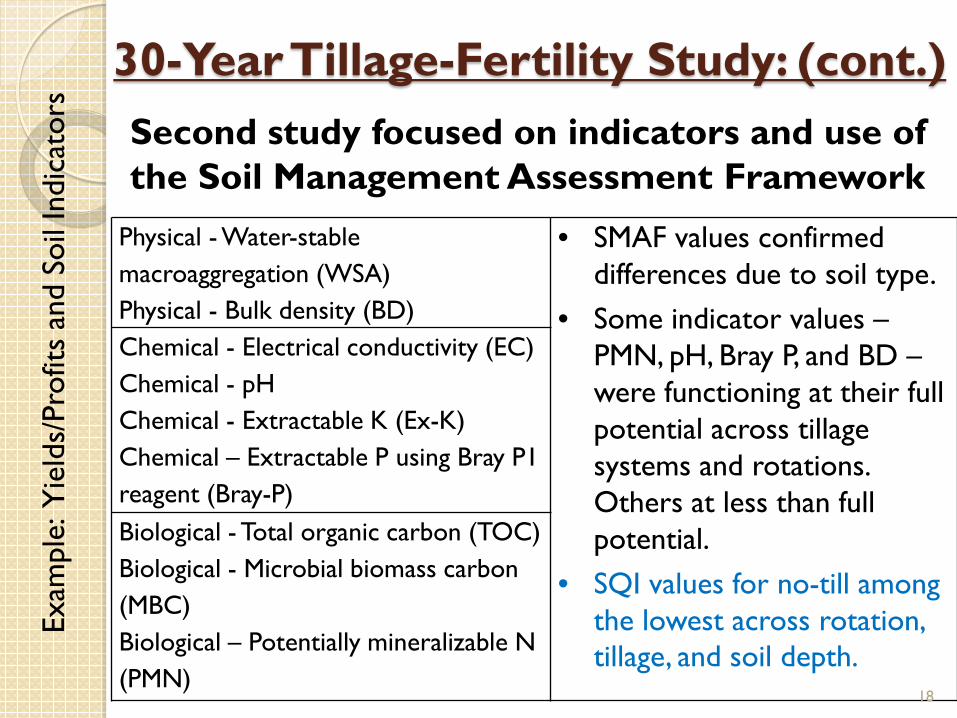
30-Year Tillage-Fertility Study: (cont.)Second study focused on indicators and use of the Soil Management Assessment Framework
Physical - Water-stable macroaggregation (WSA) Physical - Bulk density (BD)
• SMAF values confirmed differences due to soil type.
• Some indicator values –PMN, pH, Bray P, and BD –were functioning at their full potential across tillage systems and rotations. Others at less than full potential.
• SQI values for no-till among the lowest across rotation, tillage, and soil depth.
Chemical - Electrical conductivity (EC)Chemical - pHChemical - Extractable K (Ex-K)Chemical – Extractable P using Bray P1 reagent (Bray-P)Biological - Total organic carbon (TOC)Biological - Microbial biomass carbon (MBC)Biological – Potentially mineralizable N (PMN)
Exam
ple:
Yie
lds/
Prof
its a
nd S
oil I
ndic
ator
s
18
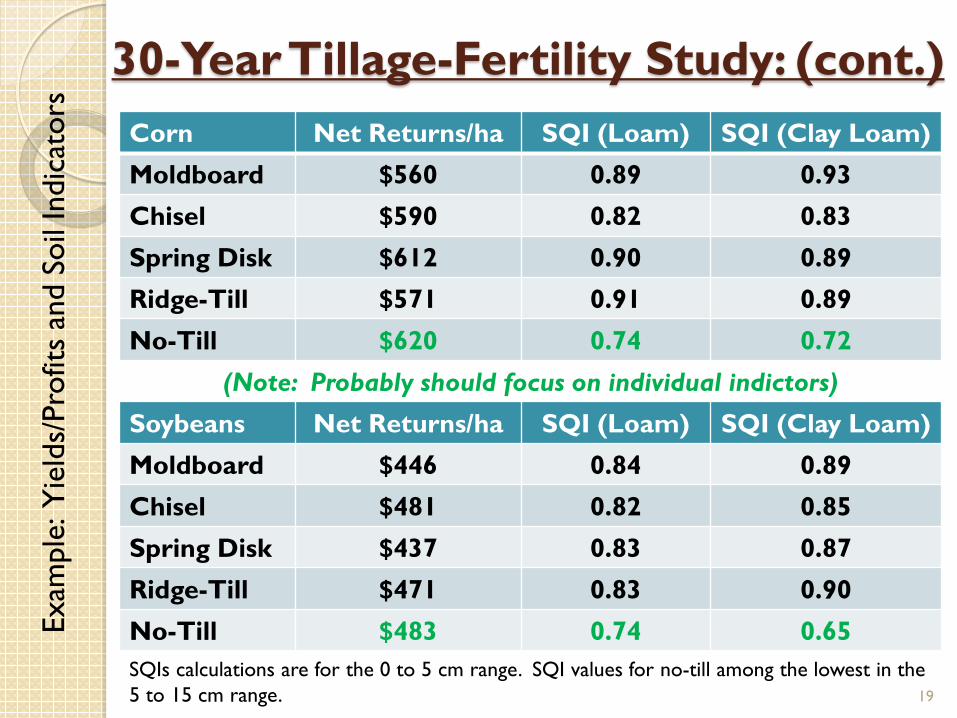
30-Year Tillage-Fertility Study: (cont.)Corn Net Returns/ha SQI (Loam) SQI (Clay Loam)Moldboard $560 0.89 0.93Chisel $590 0.82 0.83Spring Disk $612 0.90 0.89Ridge-Till $571 0.91 0.89No-Till $620 0.74 0.72
(Note: Probably should focus on individual indictors)
Soybeans Net Returns/ha SQI (Loam) SQI (Clay Loam)Moldboard $446 0.84 0.89Chisel $481 0.82 0.85Spring Disk $437 0.83 0.87Ridge-Till $471 0.83 0.90No-Till $483 0.74 0.65SQIs calculations are for the 0 to 5 cm range. SQI values for no-till among the lowest in the 5 to 15 cm range.
Exam
ple:
Yie
lds/
Prof
its a
nd S
oil I
ndic
ator
s
19
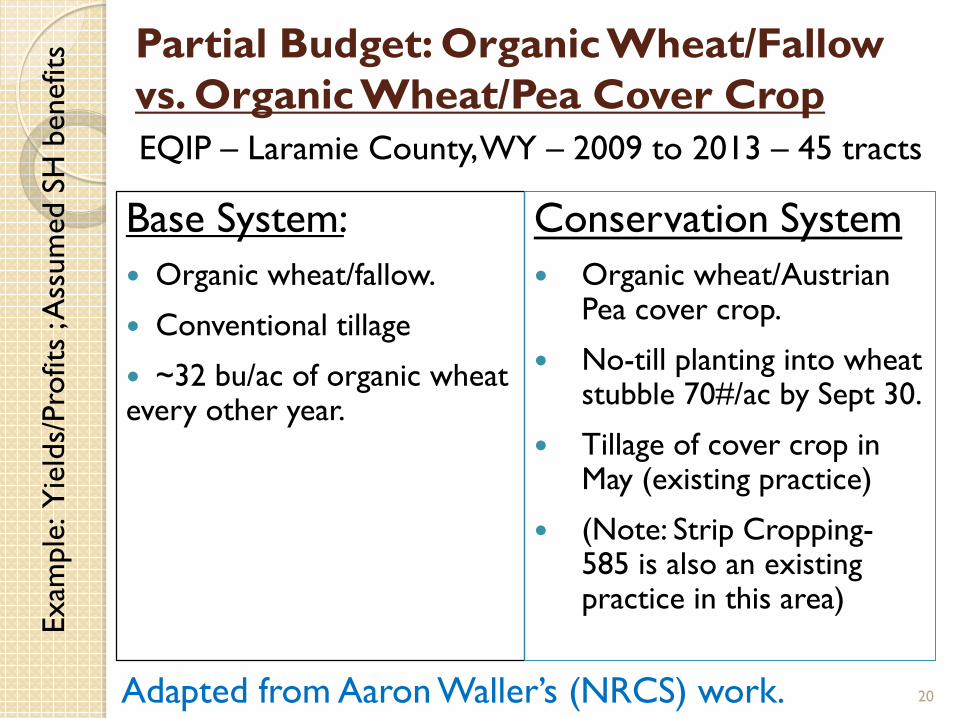
Partial Budget: Organic Wheat/Fallow vs. Organic Wheat/Pea Cover Crop
Base System: Organic wheat/fallow.
Conventional tillage
~32 bu/ac of organic wheat every other year.
Conservation System Organic wheat/Austrian
Pea cover crop.
No-till planting into wheat stubble 70#/ac by Sept 30.
Tillage of cover crop in May (existing practice)
(Note: Strip Cropping-585 is also an existing practice in this area)
Adapted from Aaron Waller’s (NRCS) work.
EQIP – Laramie County, WY – 2009 to 2013 – 45 tracts
Exam
ple:
Yie
lds/
Prof
its ; A
ssum
ed S
H b
enef
its
20

Partial Budget: Organic Wheat/Fallow vs. Organic Wheat/Pea Cover Crop (cont.)Increased Revenue• Organic wheat yield increase• 6 bu/ac * $14.18/bu = $88.80/acOther
• Increased soil cover during high wind period
• Less risk of low protein dockage in organic wheat
• Less risk of low yield in drought years
• Carryover nitrogen in subsequent years
• EQIP Payment for Cover Crop (organic)=$61.40
Increased Cost• 70#/ac peas + inoculant * $0.55/lb
= $38.50/ac• No-till drill = $15.31/ac• Spring cultivation = $0 (existing
practice)
Total Increased Cost = $53.81/acOther• Potential negative: fallow soil
moisture impact if peas are allowed to mature past May.
Net Benefits without EQIP payment = $34.99
Exam
ple:
Yie
lds/
Prof
its ; A
ssum
ed S
H b
enef
its
21
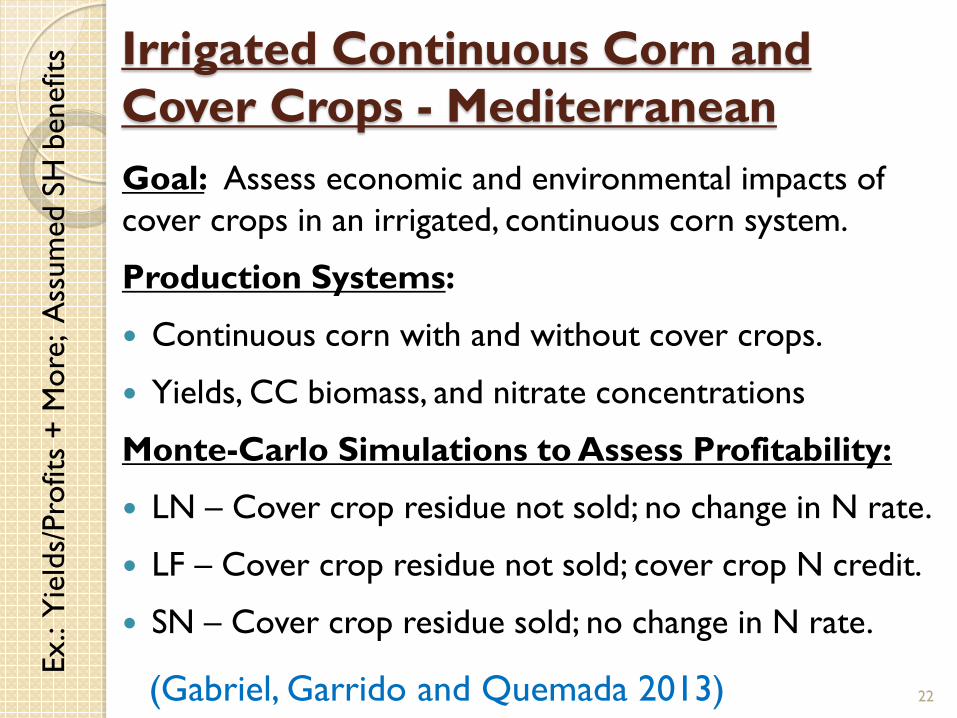
Irrigated Continuous Corn and Cover Crops - MediterraneanGoal: Assess economic and environmental impacts of cover crops in an irrigated, continuous corn system.
Production Systems:
Continuous corn with and without cover crops.
Yields, CC biomass, and nitrate concentrations
Monte-Carlo Simulations to Assess Profitability:
LN – Cover crop residue not sold; no change in N rate.
LF – Cover crop residue not sold; cover crop N credit.
SN – Cover crop residue sold; no change in N rate.
(Gabriel, Garrido and Quemada 2013)
Ex.:
Yie
lds/
Prof
its +
Mor
e; A
ssum
ed S
H b
enef
its
22
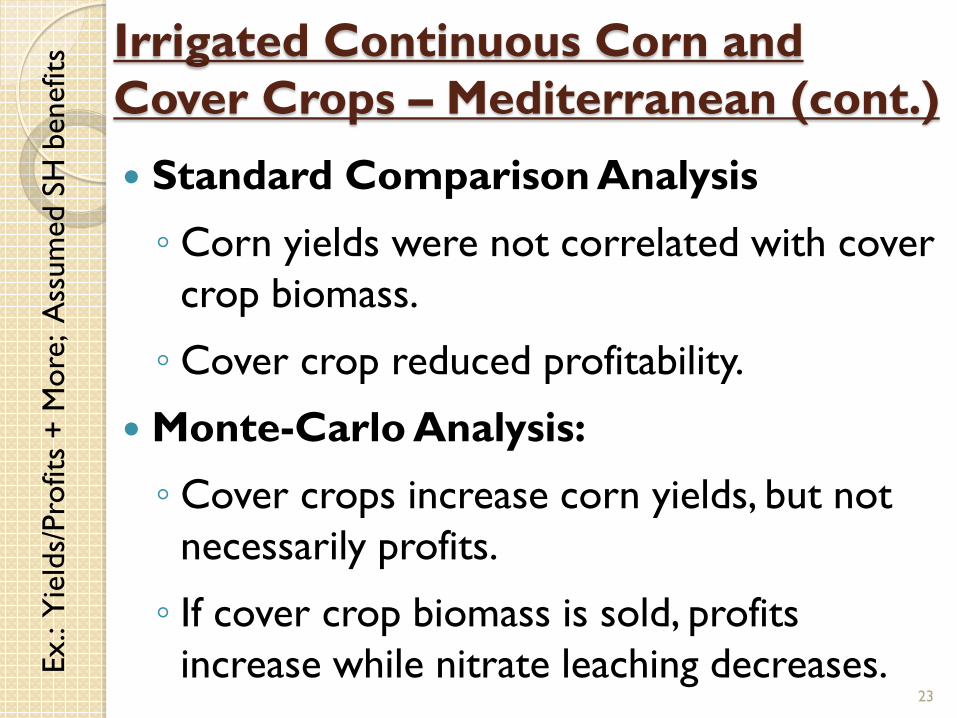
Irrigated Continuous Corn and Cover Crops – Mediterranean (cont.)
Standard Comparison Analysis
◦ Corn yields were not correlated with cover crop biomass.
◦ Cover crop reduced profitability.
Monte-Carlo Analysis:
◦ Cover crops increase corn yields, but not necessarily profits.
◦ If cover crop biomass is sold, profits increase while nitrate leaching decreases. Ex
.: Y
ield
s/Pr
ofits
+ M
ore;
Ass
umed
SH
ben
efits
23
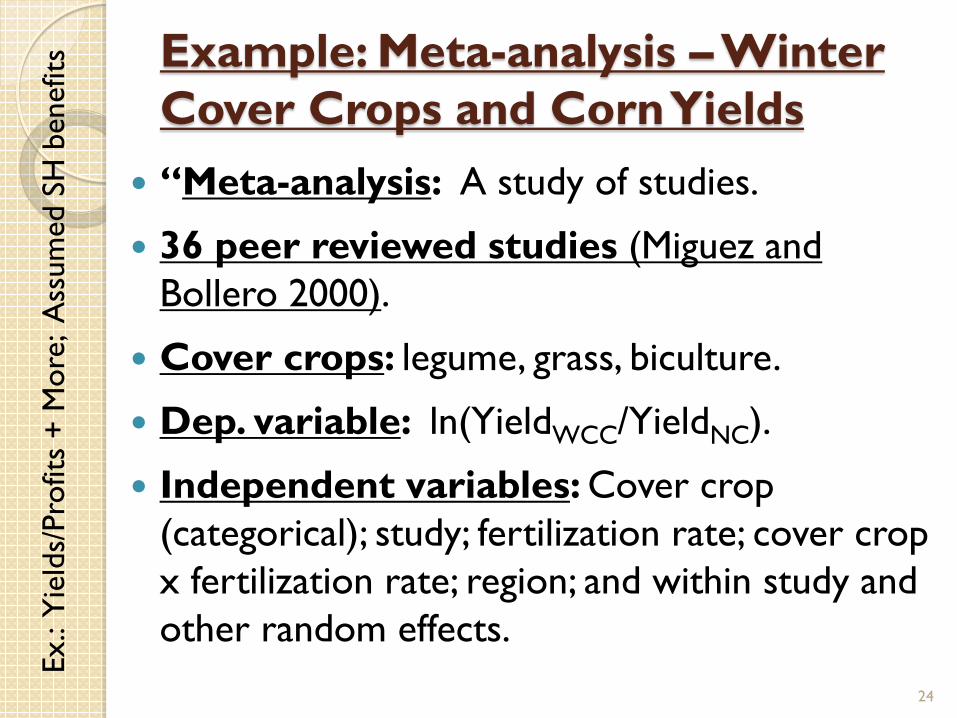
Example: Meta-analysis – Winter Cover Crops and Corn Yields
“Meta-analysis: A study of studies.
36 peer reviewed studies (Miguez and Bollero 2000).
Cover crops: legume, grass, biculture.
Dep. variable: ln(YieldWCC/YieldNC).
Independent variables: Cover crop (categorical); study; fertilization rate; cover crop x fertilization rate; region; and within study and other random effects.
Ex.:
Yie
lds/
Prof
its +
Mor
e; A
ssum
ed S
H b
enef
its
24
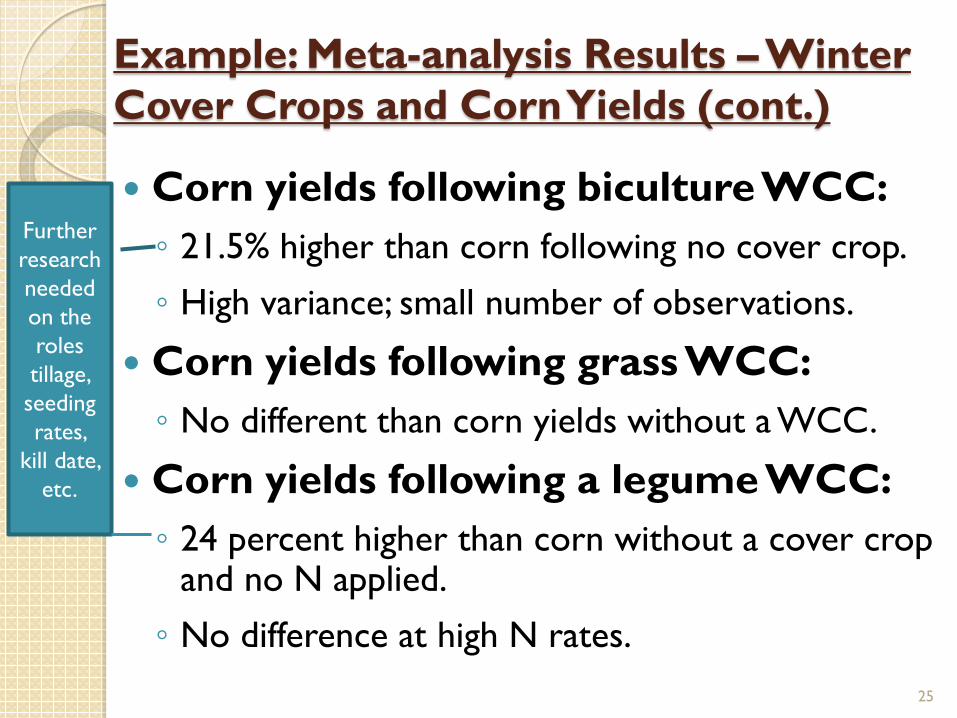
Example: Meta-analysis Results – Winter Cover Crops and Corn Yields (cont.)
Corn yields following bicultureWCC:◦ 21.5% higher than corn following no cover crop.
◦ High variance; small number of observations.
Corn yields following grass WCC:◦ No different than corn yields without a WCC.
Corn yields following a legume WCC:◦ 24 percent higher than corn without a cover crop
and no N applied.
◦ No difference at high N rates.
Further research needed on the roles tillage, seeding rates,
kill date, etc.
25
Conclusions to Date
Soil health is an intuitive, appealing concept.
Indicator/index and economic research results are mixed.
This workshop is a step forward.
More interdisciplinary research and education are needed to solve this problem.
26
Thanks!The U.S. Department of Agriculture (USDA) prohibits discrimination against its customers, employees, and applicants for employment on the bases of race, color, national origin, age, disability, sex, gender identity, religion, reprisal, and where applicable, political beliefs, marital status, familial or parental status, sexual orientation, or all or part of an individual's income is derived from any public assistance program, or protected genetic information in employment or in any program or activity conducted or funded by the Department. (Not all prohibited bases will apply to all programs and/or employment activities.)
Contact Information:Richard [email protected] 504-2009 27


![Farm decisions under dynamic meteorology and the curse of ... · (e.g.Rivington et al.[2007]). Agricultural economics, irrigation engineering, hydrology, meteorology, soil sciences,](https://img.pdfslide.us/doc/110x75/5fbea9ef8f19652dd361d1d9/farm-decisions-under-dynamic-meteorology-and-the-curse-of-egrivington-et.jpg)