Embed Size (px)
Citation preview

ECONOMICS
MEASURING HARD POWER: CHINA’S ECONOMIC GROWTH AND MILITARY CAPACITY
by
Peter E. Robertson Business School
University of Western Australia
and
Adrian Sin Business School
University of Western Australia
DISCUSSION PAPER 13.32

Measuring Hard Power: China’s Economic Growthand Military Capacity
Peter E. Robertson ∗
The University of Western Australia
Adrian SinThe University of Western Australia
22 September 2013
Abstract
China’s rapid economic development has facilitated a dramatic increase in itsmilitary capacity and international security presence. But there is considerabledisagreement over how large its economy and military capacity is. Underlyingthe debate is the fact that market and PPP exchange rate comparisons give verydifferent pictures of China’s relative economic size, and neither is the appropriateprice deflator with which to compare relative military capacities. We address thisissue by deriving a relative military cost (RMC) exchange rate for China whichconverts RMB to US dollar expenditures in terms of real military services. Thisshows that both market and PPP exchange rate comparisons of China’s real GDPunderstate its relative military capacity. Nevertheless we also show that the realexpansion of China’s military capacity over the last decade has been much smallerthan its GDP growth, due to the rapidly growing wage costs faced by China’smilitary.
Keywords: China; Foreign Policy National Security; Index Numbers; Inter-national Comparisons.
JEL: P16; H56; O57; C43; F52
∗Corresponding Author; P. Robertson, Economics, School of Business, University of Western Aus-tralia, Perth. Email: [email protected]. We are grateful to Robert Hill and seminar partici-pants at U.W.A. for comments on this paper.
DISCUSSION PAPER 13.32

Executive Summary
• China’s economic growth has allowed a commensurate expansion in its military
capacity and international security presence.
• Nevertheless, recent studies by The Rand Corporation and the U.S. Department of
Defense, stress that we lack appropriate price indices needed to compare military
capacities across countries.
• This paper describes a new method for making international comparisons of real
potential military spending.
• We find that conventional exchange rate comparisons of China’s real GDP, or mil-
itary spending, understate China’s military capacity compared to the USA.
• However we also show that the real expansion of China’s military capacity over the
last decade has been much smaller than its GDP growth.
• As an example we find that China’s military spending relative to the USA has
grown by only 32% over the last decade compared to the conventional estimate of
131% based on market exchange rates.
• The principle reasons for these results is the low cost of labor and China, and the
rapid growth of wages which have driven up personnel costs.
2

1 Introduction
China’s rapid economic growth has lifted hundreds of millions of people from absolute
poverty and dramatically raised the living standards of many more.1 But its growth
has also caused a great deal of interest in its impact on the world economy, for example
in terms of in terms of its relative GDP, and its world shares of trade, investment and
savings (Deaton and Heston 2010, Subramanian 2011, The Economist 2011, Feenstra et
al 2013).
Likewise there has been a growing awareness of the enormous implications for inter-
national relations and security.2 (Legro 2007, Fravel 2005, 2008a, 2008b, Layne 2009,
Thompson 2010, Shambaugh 2013). Of interest is how China will use its economic and
military strengths to resolve territorial disputes in the South and East China Seas, the
North Korean problem and its claims over Taiwan (U.S. Department of Defense 2011,
White 2012, Wortzel 2013).3 Even in the absence of any territorial disputes, China’s
greatly expanded military capacity enhances its political bargaining power and requires
reassessment of national strategies security and diplomatic strategies (Dobbins 2011,
White 2012).
Current assessments of China’s military capacity, however, range from disquieting analy-
ses, such as Kaplan (2005, 2010) and Mearsheimer (2006) to relatively restrained views,
such as Thompson (2010), Etzioni (2011) and Shambaugh (2013). Underlying these
different views is a fundamental uncertainty that results from the difficulty of making
international comparisons of real GDP. Specifically, estimates of China’s real GDP in
terms of $US vary enormously depending on whether Purchasing Power Parity (PPP) or
market exchange rates are used and the different methods for deflating nominal spending
into real output or capacity (Feenstra et al 2013, Robertson 2013).
Consequently there is an acute interest in obtaining comparable measurements of China’s
economic size and the implications for its military capacity (Crane et al 2005, U.S. De-
partment of Defense 2011). In particular numerous studies, for example by The Rand
1Chen and Ravallion (2010) report that the number of people in China living below the $1.25 perday poverty line fell by 600 million since 1980.
2Johnston (2013) finds a seven fold increase in newspaper, other media and academic articles on“Chinese assertiveness” since 2008. For examples of the popular discussion and issues see The Economistspecifically: 2 December 2010; 9 June 2012 and; April 7, 2012.
3According to the US Department of Defense (2011), China has land boundary disputes with Indiaand maritime disputes with Japan as well as disputes over the South China Sea (Vietnam, Malaysia, thePhilippines, Brunei, Taiwan). China argues that the development of maritime capabilities is intendedto build capacity for international peacekeeping, humanitarian assistance, disaster relief, and protectionof sea lanes.
3

Corporation, The Brookings Institution and the U.S. Department of Defense, have ex-
pressed dissatisfaction with both PPP and market exchange rate comparisons for the
purpose of evaluating real military capacity across countries (Crane et al 2005, O’Hanlon
2009, U.S. Department of Defense 2007, 2011).
The most appropriate way to compare real military capacity across countries is to deflate
each country’s actual, or potential, military spending by the price of real military services
in each country. Unfortunately military price indices do not exist for most countries.
The aim of this paper, therefore, is to develop a simple method for computing a relative
military price index, that deflates nominal spending into units of real military services,
using readily accessible data. The ratio of two countries’ military price indices then
gives an exchange rate that provides an index of relative real military capacity across
countries. We use this military exchange rate to compare the level and growth of China’s
real military capacity relative to the USA.4
We obtain two key results. First we find that the value of the RMB, in terms of its ability
to purchase real military services, is greater than both its market exchange rate value
and its PPP value. This suggests that conventional estimates of GDP understate China’s
real military capacity, but also that PPP exchange rate comparisons are much closer to
the actual value than market exchange rate comparisons. This is mainly because of the
very low cost of labor in China relative to the USA.
Second we find that the expansion of China’s military capacity over the last decade is
much lower than standard measures of military spending growth relative to the USA.
The reason for this is that personnel costs have risen dramatically due to rising wages
in China since 2000. This raises military unit costs relative to aggregate economy-wide
price indices that are currently used in the economic literature and in defence statistical
abstracts, thus leading to lower real expansion in military capacity.
2 The Measurement of Real Military Capacity
Tellis et al (2000) define “national power” as the capacity of a country to pursue strategic
goals through purposeful action. This makes a clear link between international politics
and the economy (Morgenthau 1948, Mearsheimer 2001). Specifically, the credibility of
any territorial claims or demands upon foreign nations depends on a country’s economic
4In contrast to the literature on military spending, the focus is not on the accuracy of militaryspending data, or on its effects, but on the appropriate way to compare spending levels across countries.
4

capacity to sustain military operations.5
Though military capacity depends on current military spending levels, ultimately a coun-
try’s ability to sustain spending on military services depends on its economic wealth.
For example, according to Smith (2009), US and UK spending levels exceeded 40% of
GDP during WWII. But, as also noted by Smith (2009) and Shambaugh (2013), the
Soviet Union’s defence spending budget in the 1970s of 20% of GDP was regarded as
being unsustainable and ultimately contributed to the Soviet Union’s collapse. Across
all countries, military budgets in 2012 averaged 1.9% of GDP and only 4 countries had
a military budget that exceeded 5% of GDP (SIPRI 2012).
Hence a country’s military capacity is constrained by its economic resources and the
ability to expand a country’s military capacity over the longer term depends mainly on
its economic growth. Relative GDP is therefore an appropriate and parsimonious starting
point for thinking about countries’ relative military capacities. This essentially allows us
to compare countries as if they spent a similar proportion of their income of defense.6 For
completeness, however, we consider comparisons of both real current military spending
levels across China and the USA, as well as real GDP. In either case the key question is
how to compare these spending levels in different currencies in terms of what they imply
for each country’s relative real military capacity.
2.1 International Comparisons of Real Military Capacity
In order to measure how different values of GDP across countries result in different
potential military capacities, we need an exchange rate to convert units of spending
in local currency into a common currency. Standard international comparisons of real
output across countries are based on either market exchange rates or PPP exchange rates,
such as those produced by the ICP project of the World Bank. The well documented
problem with using market exchange rates for this purpose is that many goods and
services have different relative prices within a country, with non-traded goods being
relatively less expensive in poorer countries. This means, for example, that a dollar,
converted to RMB at market exchange rates and spent in China, can typically purchase
more goods and services than the same dollar spent in the USA. The PPP exchange rate
5There is a debate in the literature on what other factors should be considered for determining acountry’s political influence. With respect to China’s rise see Subramanian (2011), Beckley (2012),Shifrinson et al (2012) and Shambaugh (2013).
6Data on military spending is notoriously of poor quality and China’s official data are widely regardedto be understated (Brzoska 1995, Ball 1984, Department of Defense 2005, ISSS 2006, O’Hanlon 2009,Smith 2009).
5

thus aims to measure the cost of a given bundle of goods in different countries so as to
compare living standards across countries.7
If we wish to infer country’s miliary capacity based on the size of its economy, however,
standard PPP indices also pose a problem insofar as they reflect the relative price of
an average basket of goods produced in the economy and this average price index may
differ substantially from the price of military services. Thus Crane et al (2005) argue
that, while military services have large personnel costs, a substantial share of military
equipment purchased by developing-country militaries is imported or incorporates com-
ponents that are manufactured from materials and parts sold at world market prices,
such as electronics, diesel engines, or aircraft frames. Thus they suggest that, for some
purposes, GDP measured at market exchange rates may give a more realistic picture of
changes in military capacity (Crane et al 2005, pp.16-17).
Similarly, the two principle military statistical abstracts, The Military Balance published
by The International Institute for Strategic Studies (IISS), and the Stockholm Interna-
tional Peace Research Institute’s (SIPRI) Yearbook report relative military spending and
relative GDP in terms of $US converted at market exchange rates and also at PPP ex-
change rates. IISS (2012) notes that market exchange rates are likely to understate the
true level of economic resources allocated towards defence since food material and hous-
ing costs will be lower in China, but remain noncommittal in recommending a preferred
price index.8 Thus they often report a weighted average of PPP and market exchange
rates when discussing China’s real military capacity relative to the USA.
The extent of the differences between these measures can be seen in Figure 1 which shows
the ratio of Chinese to USA GDP evaluated at both market exchange rates and at PPP
exchange rates taken from the Penn World Table (Heston et al 2012). The Penn World
Table has two PPP measures which reflect alternative measures of China’s growth. “PPP
China Version 1” reflects official data while “PPP China Version 2” is an adjusted series
7There are different types of PPP exchange rates. See for example Hill and Hill (2009) and Diewert(2010) for general discussions and Deaton and Heston (2010), Feenstra et al (2013) with respect toChina.
8They note that “no specific PPP rate exists for the military sector” and urge caution when inter-preting their economic data since “there is no definitive guide as to which elements of military spendingshould be calculated using the PPP rates available” (IISS 2012, pp.215-216). This issue has receivedvery little attention in the economics literature despite being discussed widely at a superficial level inthe international security literature. The United Nations (1986) used relatively detailed price data tocalculate military PPP indices for eight countries and Heston and Aten (1993) estimated real militaryexpenditures across countries for 1985, using cross country regressions to extrapolate data from ICPbenchmark countries. Crane et al (2005) look explicitly at the issue of China’s growth and attemptsto adjust China’s PPP to take account of traded and non-traded goods in a way that reflects militaryshares.
6

based on the work of Maddison and Wu (2008).9 It can be seen that, using PPP exchange
rates, China’s GDP is approximately 80% of the USA, whereas using market exchange
rates it is approximately 40% of USA GDP.
We can similarly compare the shares of each country’s GDP dedicated to military spend-
ing. Though China’s GDP has grown much faster than the USA, as shown in Figure 2, its
share of spending on military has declined – particularly through the early 1980s when
its economy was growing rapidly. By comparison USA spending also declined during
the 1980s but increased again after 2000. Figure 3 therefore shows the relative levels of
military spending in $US, using PPP and market exchange rates. Again it can be seen
that the different measures of relative GDP imply very different levels of relative military
spending in China, from 17% to 35% of USA level.
2.2 Relative Growth in Military Capacity
Alternatively, rather than attempting to compare the level of military capacity, we could
restrict attention to the growth in real military capacity or spending relative to a base
year. This requires only a rice index, as opposed to knowing the actual price level. Figure
4 thus shows the ratio of Chinese to USA real military spending indexed to 1 in 2000
using three different measures. The first index is simply the ratio of Chinese to USA
real GDP in local currency units. The second two indices are the same data as presented
in Figure 3, the relative GDP measured in US dollars converted at market and PPP
exchange rates.
Again, however, it can be seen that there is a large difference in the three estimates
of China’s relative military capacity. The local currency and PPP measures suggest an
expansion of 65% to 80%. These differ substantially for the expansion measured in US
dollars at market exchange rates which indicate a 2.3-fold (or 130%) increase in China’s
real military capacity, caused by the appreciation of the RMB against the dollar.
These large differences – for example from a 65% to a 130% increase – arise from the
different price deflators associated with each measure of real GDP growth and the sig-
nificant difference in the growth of China’s military expenditure when evaluated in US
dollar terms or local currency units. Thus we have seen that standard price indices and
exchange rates imply quite different measures of both the level and growth of China’s
military capacity.
9The results presented below, which focus on the period 2000-2010, are not affected in any significantway by this choice.
7

3 A Relative Military Cost Exchange Rate
It is difficult to deflate nominal military spending into a real quantity since the output
price of military services is not observed. Nevertheless, in principle, we can compare
input prices and construct an appropriate input price index. As discussed by Crane et
al (2005), the inputs used in producing defence services include a mix of traded and
non-traded goods as well as personnel services. For example, inputs range from clothing,
paper and electronics to aircraft frames, missiles and ships. Likewise personnel services
include soldiers, cooks, and administrators. Thus we can proceed by using price data for
these inputs, or aggregates prices for different types of inputs. Comparing the resulting
total input price across countries would then give an exchange rate that converts units
of nominal spending in one country into those of a reference country, such as US dollars.
To consider this we begin with the standard military budget conventions which divide
military spending into Military Personnel, Operations and Maintenance, and Procure-
ment of Equipment (Brzoska 1995). In the USA these three categories currently account
for around 80% of the total budget.10
To develop a military price index based on this budget information, consider the economic
decision of a defence sector that allocates its budget across the three broad expenditure
types to provide military services, Mi. The sector takes prices as given and chooses an
optimal input bundle to minimize costs taking prices and the total budget as given. We
assume that the technology for combining Personnel, ni, Operations xi and Equipment,
zi, is given by the function f(ni, xi, zi) which exhibits constant returns to scale and
diminishing returns to each input. The cost minimization problem is
min Ci = pn,ini + px,ixi + pz,izi | Mi ≤ f(ni, xi, zi) (1)
where pn,i is the input price for an effective (constant quality) unit of Personnel services,
ni, or the wage rate per effective unit of labor, px,i is the price per effective unit of
operations, xi and pz,i is the price per effective unit of equipment zi. The minimum cost
function is then
Ci = ci(pn,i, px,i, pz,i)Mi (2)
The cost function is linear in output, Mi, which follows from the assumption of constant
returns to scale. Hence the unit cost function ci(pn,i, px,i, pz,i) ≡ c(pi) is independent of
scale.
10The remaining items are research, development and testing and military construction (O’Hanlon2009).
8

The aim is to compare real output indices, Mi = Ci/ci(pi), across countries. Thus
suppose we consider a country, i, to a reference country k. Then letting mi,k ≡ M i /Mk
be the true quantity index of country i ’s output relative to country k, from (2) we have
mi,k = (Ci/Ck) /ei,k (3)
where
ei,k ≡ci(pi)
ck(pk)(4)
is a true relative cost index, which we can interpret as a true price index.11 It is also an
exchange rate since it is equal to the ratio of the cost of purchasing one unit of M in i
relative to k. Thus ei,k is a true relative military cost (RMC) exchange rate that tells
us what it would cost to purchase country i ’s defence bundle at the reference country
prices, k, and hence would be the appropriate rate for comparing military spending across
countries.
It may be useful to think of some extreme examples. First suppose defence spending
consisted only of purchased goods, such as an automated missile defence shield system,
with no personnel and that is imported. Then ei,k would simply be the ratio of prices of
the goods in each country measured in local currency units, i.e. a pure monetary exchange
rate. Alternatively suppose defence expenditure consisted only of labor (soldiers) and
all labor was of equivalent skills. Then ei,k would be an index of relative wage rates
measured in local currency units and equation (3) would simply be expenditure in each
country divided by this relative wage ratio. Hence mi,k would simply be the ratio of the
number of soldiers in each country.
More generally, (3) will describe the quantity of a bundle of military services comprising
of Personnel, Operations and Equipment and (4) will be a function that expresses the
number of units of one currency required to purchase the same bundle of services in units
of the other country’s currency, where the ratio depends on wage and military prices in
each country.12 Thus when comparing military spending or GDP across countries using
RMC exchange rate, the resulting ratio is, conceptually, a comparison of the bundle of
defence or military capabilities, where the bundle in each region may differ but reflects
the optimal bundle given the relative prices in each country.
11It is also referred to as a Konus, price index.12Naturally more factor inputs can be included if there is sufficient data.
9

4 Implementation
One way to operationalize (3) would be to simply assume a particular form of the cost
function. For illustrative purposes suppose that (3) is an iso-elastic function given by
Ci = Ai pθn,i p
γx,i p
1−θ−γz,i Mi, (5)
where Ai is the inverse efficiency index that captures quality changes in inputs or im-
provements in efficiency. By Shephard’s Lemma, θ = dCi/dpn,i(pn,i/Ci) = n pn,i/Ci is the
budget share of personnel in total costs and likewise γ = x px,i/Ci and 1−θ−γ = z pz,i/Ci.
Letting a ≡ Ak /Ai then from (3) we have
ei,k ≡ a (pn,i/pn,k)θ(px,i/px,k)
γ(pz,i/pz,k)1−θ−γ (6)
Equation (6) is a Divisia index of three sets of relative prices each weighted by the relevant
share of costs in the military budget.
To quantify (6) we would require data on the Personnel, Operations and Equipment
shares of military spending and the various nominal price ratios measured in units of local
currency. We can simplify the problem by appealing to the fact that a large amount of
military equipment is tradable, or is produced using components that are tradable (Crane
et al 2005). Hence arbitrage, or the law-of-one price, implies that the ratio of equipment
prices is given by
pz,i = ri,k pz,k (7)
where ri,k is the bilateral monetary exchange rate between country i and k, in units of
k ’s currency per unit of i ’s currency.
Next we consider Operations, which is the part of the defence budget that largely consists
of transport, storage, services and other inputs such as fuels. This includes a mix of traded
and non traded goods. To determine the relative cost of operations, px,i/px,k, we simply
use the PPP rate.13
The remaining terms are the relative prices of personnel (pn,i/pn,k) and the relative effi-
ciency term a. To consider these first note that in (3) and (4) and the following expres-
sions, there is an implicit assumption that all inputs are the same quality. Hence the
relative price of personnel should reflect the relative prices of identical workers. Never-
13For comparing changes over time we could also use the GDP deflator, though this gives very similarresults since the change in the PPP exchange rate is very similar to the change in the official GDPdeflator.
10

theless across two countries such as China and the USA there are likely to be significant
differences in labor quality due to differences in human capital.14
To allow for this we require both a measure of actual personnel costs and also the average
skill level or human capital embodied in that personnel. We therefore begin by obtaining
actual wage data pn,i, which reflects the opportunity cost of military personnel.15 Then,
given a human capital level or effective labor index in country i of hi, we can derive the
wage per effective unit of labor as pn,i = pn,i/hi. In this way we can construct a nominal
wage ratio per effective unit of labor of wi,k ≡ pn,i/pn,k = (pn,i/pn,k)(hk/hi).
Adjusting for differences in labor quality therefore captures an important difference in
productivity across countries. In principle any additional productivity differences should
be captured by the term a. This would mostly reflect governance and institutional
structures within the military sector. In what follows we simply assume that the efficiency
level of military services in each country is similar across countries, so that a=1. Hence
after the appropriate adjustment for differences in labor quality described above, we
assume there are no other significant differences in the efficiency of the organization
itself. Moreover, for comparing the growth in military capacity, we only require the
weaker assumption that a is constant over time.16
With these considerations (6) becomes
ei,k = wθi,k (px,i/px,k)
γ r1−θ−γi,k (8)
4.1 Index Numbers
The Konus price index derived in (6) and (8) is a Divisia index of relative prices in
each country and assumes common budget shares across countries. However it makes
assumptions about the functional form of the cost function which is unknown in prac-
14It may be tempting to think of this quality difference as also reflecting the additional equipmentthat a US soldier might have, however this is actually reflected in the expenditure and price indices ofequipment not personnel. More generally, many of the differences that we associate with “technology”in colloquial language usage, should not be confused with differences in productivity. For example thehigher “technological sophistication” of US military equipment is implicitly captured in (5) through itsexpenditure on equipment relative to personnel.
15This is important since even if military personnel are subsidized or conscripted, the burden on theeconomy, and hence its capacity to sustain military spending, is determined by the forgone productivecapacity.
16An additional concern might be that the quality of intermediate inputs is not measured properly.This is known to be a problem with the measurement of sectoral TFP growth in sectors using IT (Bailyand Gordon 1988, Jorgenson and Stiroh 1999). In our case however we are only concerned with relativeinput quality change across countries, which will reduce any bias from input quality change.
11

tice. Moreover the assumption that the input shares are the same across countries is
contradicted by the evidence. This can be seen from Table 1, which shows Chinese and
USA military budget shares for Personnel, Operations and Equipment taken from China
Defense White Papers and USA government accounts.17
It can be seen that the shares are quite stable and also relatively similar across countries
and time. China’s personnel share has been consistently around 35% and the USA’s
personnel share has fallen only slightly since 1980 from 30% to 25%. China’s share
has also been relatively stable over this period. Nevertheless, although these shares are
similar in China and the USA they are clearly not identical as assumed in (6).
Index number theory suggests several ways to deal with both these problems of unknown
cost functions and different factor shares. First we may use a Tornqvist price index,
which is defined as
eTi,k = a w(θi+θj)/2i,k (pi/pk)
(γi+γj)/2 r(1−θi−γi+1−θi−γj)/2i,k (9)
and the Tornqvist quantity index is mTi,k = (Ci/Ck)/e
Ti,k. It can be seen that this index
is very similar to (8) but uses the average of each country’s budget shares.
An alterative widely used index is the the Fisher “ideal” index, which is a geometric
average of the Laspeyres and Paasche indices. Specifically suppose we define the value of
i ’s purchases of military inputs, evaluated at k ’s prices, as a Laspeyres quantity index,
mLi,k. Likewise k ’s outputs valued at i ’s prices is then a Paasche quantity index of relative
military outputs mPi,k. If ePi,k and eLi,k are the associated Paasche and Laspeyres price
indices, the Fisher ideal index of the exchange rate is
eFi,k = a (ePi,k eLi,k)
12 (10)
and the Fisher quantity index is mFi,k = (Ci/Ck)/e
Fi,k.
Thus we can compare the relative growth of real military capacity in each country by
deflating the ratio of nominal spending in two countries, i relative to k , in local currency
units, using either of the exchange rate indices (9) or (10). Both are different approxi-
mations to the relative costs of military spending in each country. In particular both the
17Data for the USA is taken from http://www.whitehouse.gov/omb/budget/Historicals/ from Table5.1. “Personal” and “Equipment” shares are calculated from the Military Personnel and Procurementheadings respectively, and total expenditure is calculated from row 051, Subtotal, Department of Defense-Military. “Operations” is the residual category. For China, the data are taken from various issues ofChina Defence White Papers, China’s National Defense in 2000, 2002, 2004, 2006, 2008, 2010, publishedby Peoples’ Republic of China, and available from http://merln.ndu.edu/whitepapers.html.
12

Tornqvist and Fisher indices are “superlative”, meaning that they are exact cost indices
for particular functional forms of the cost function. The Tornqvist is exact for a translog
production function and is equivalent to the Konus or Divisia index in (8) if the factor
shares are constant. The Fisher is exact for a quadratic function and, in the absence
of technological change, is nested between the Laspeyres and Paasche indices. Moreover
both of these may also be regarded as second order approximations to some true cost
function (Diewert 1978, Allen and Diewert 1981, Hill 2006).18
4.2 Data on Relative costs
Aside from the budget shares the necessary data consist of the relative wage per unit of
effective labor, the index of domestic prices and the exchange rate.
To compute relative wages per unit of equivalent labor we take average wages in manufac-
turing from the USA and China and divide this by an index of human capital attainment
in each country. We follow previous studies such as Klenow and Rodriguez-Clare (1997)
and Bosworth and Collins (2008) who adopt the Mincerian relationship between the ef-
fective units of labor (human capital index) h, and years of schooling, s, given by h = eϕ s,
where ϕ is estimated to be approximately 0.15, based on Mincerian returns-to-schooling
literature. The years of schooling, s, is taken from Barro and Lee (2010). By this mea-
sure a Chinese manufacturing worker was equivalent in skills to 0.43 of a USA worker in
2000, and this rises to 0.47 by 2010. As discussed above this human capital adjustment
is important since better educated labor will reduce military training costs. Moreover
there has been relatively rapid growth in the average years of schooling in China, so that
this is a potential source of real military expansion for China.
The relative price data are shown in Figure 5 and Table 2. The main feature of the data
is the steep rise in the wage per effective worker in China relative to the USA. These
rising wage costs are key to the results presented below and are readily understood as a
result of general equilibrium adjustments in the Chinese economy.
This type of price effect reflects a general equilibrium effect sometimes referred to as
“Baumol’s-cost” disease.19 The growth of wages represents rising labor productivity in
18Hill (2006) shows that quadratic-mean-of-order-r superlative indices with high values of r, are sen-sitive to extreme values and may give very different values. The Fisher index is the mean-of-order-2(r = 2) superlative index and the Tornqvist is the r = 0 superlative index. Though there are an infinitenumber of superlative indices the Fisher and Tornqvist are the most widely used and Hill (2006) showsthat the Fisher and Tornqvist indices have additional axiomatic properties that make them preferable.
19It is also very similar to the “Dutch Disease” (Corden and Neary 1982). For the market sectorthese relative price effects cause an economic restructuring with some sectors expanding and others
13

the manufacturing sector which results in rising wages across the whole economy.20 In
particular, a unified wage adjustment policy for all personnel of Chinese government and
State enterprises has resulted in rising wages faced by the military sector along with
increases in social security and medical benefits (Peoples’ Republic of China 2004, IISS
2006).
Looking at the other price indices in Figure 5 it can be seen that Chinese prices, as
measured by the PPP index, have risen slightly relative to the USA since 2000 and the
RMB has appreciated relative to the dollar –which indicated by a fall in the relative
price level in Figure 5 reflecting the lower cost of foreign imports. Like rising wage costs
these changes also reflect general equilibrium effects of China’s growth. The boom in the
tradable goods sector, through rising productivity or falling trade costs or deregulation
as a result of WTO accession, causes not only rising wages but also a real exchange rate
appreciation, by increasing domestic prices. Thus the growth in China’s manufacturing
productivity has costs and benefits for the defence sector. The costs may be mitigated
to the extent that the defence sector can substitute personnel for imported technology
which has become cheaper due to the appreciation of the RMB.
Finally the pattern between the nominal and real exchange rates also reflects the Balasa-
Samuelson effect which says that the gap between the nominal exchange rate level and
the PPP exchange rate level will close over time as prices in China converge on USA
relative prices. The appreciating nominal exchange rate and rising Chinese price level
relative to the USA represents a convergence of these two rates since the level of the
nominal exchange rate is historically above the PPP exchange rate.
Thus the pattern in these price trends reflects the general equilibrium adjustments of
China’s rapid growth. Nevertheless, as we shall see, the implications for the Defence
sector are profound and the impact of these rising personnel costs has not been subjected
to any analytical critique in the economics literature.
contracting through Rybczyinski effects. If the government fixes the military budget, then faced withrising personnel costs it may also contract. Alternatively however the government could potentiallyincrease spending to maintain a similar supply of real military services.
20The wage data here are manufacturing wages and it might be argued that military salaries may nothave risen as fast as manufacturing wages. However, even if military salaries had not risen, manufacturingwages represent the opportunity cost of military personnel and hence also the relevant social cost on theeconomy.
14

5 Results
5.1 Relative Military Cost (RMC ) Price Indices
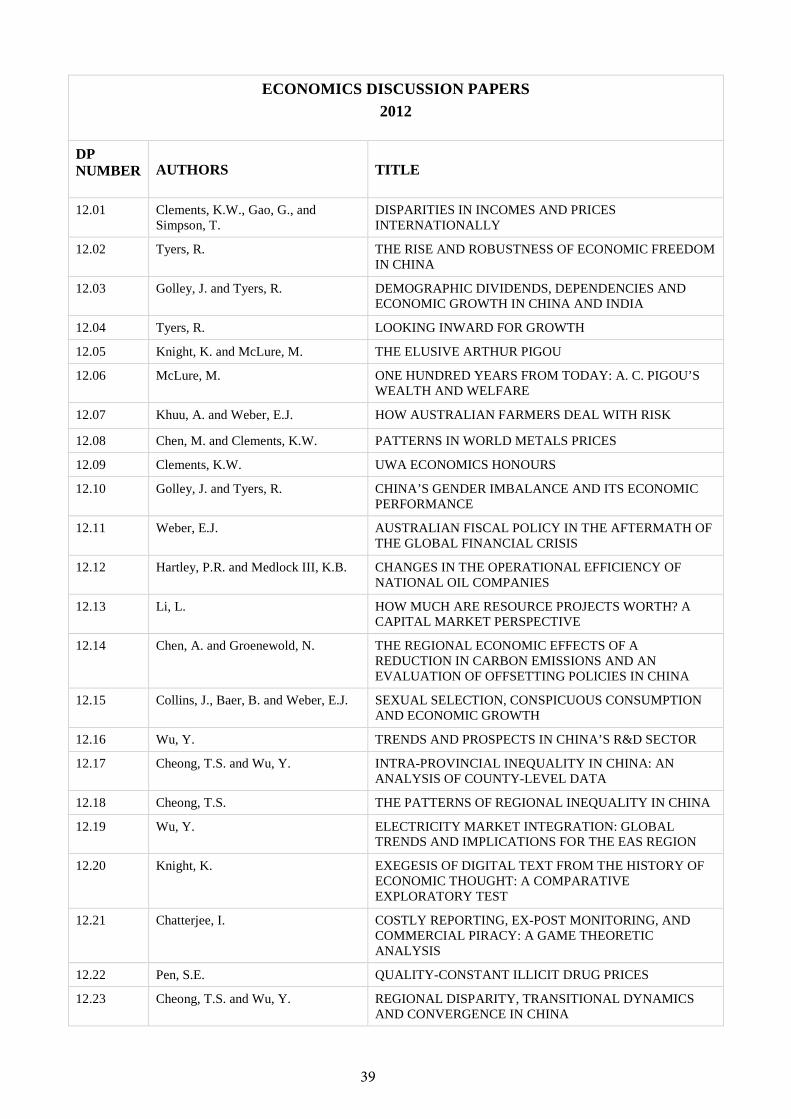
We may now consider the implied RMC exchange rates eTi,k and eFi,k , which are computed
from the exchange rate and wage data. The results are given in Table 3 and summarized
in Figures 6 and 7. Figure 6 also reports the values of the RMC Tornqvist Fisher exchange
rates , eTi,k and eFi,k along with the market and PPP exchange rates for reference. Figure
7 reports the same data indexed to 1 in 2000 in order to compare the growth rate of each
exchange rate.
In terms of levels, it can immediately be seen from Figure 6 that both the RMC exchange
rates are smaller than the PPP exchange rate. The results thus challenge the received
wisdom that an exchange rate based on relative military costs would lie in between
the PPP and markets exchange rates. Intuitively this says that, compared to an average
basket of all produced goods, military goods are relatively inexpensive in China compared
to the USA. As discussed above this reflects the fact that wages in China are very low,
even after we make quality adjustments allowing for differences in human capital.
As we have seen, China’s relative wage ratio grew quickly since 2000, which means that
the RMC exchange rates, eTi,k and eFi,k also grow more quickly than the market and PPP
exchange rates, as shown in Figure 7. It can be seen that using the PPP rate as an
index of military costs would imply that costs relative to the USA have increased by
10%. Using the market exchange rate implies that costs in China have fallen 20%, due
to the appreciation of the RMB. But Figure 6 shows that the RMC exchange rates both
rise considerably more, with eTi,k increasing by 30% since 2000 and eFi,k increasing by 50%
since 2000.
Thus the RMC exchange rates are low because wages per efficiency unit are low in China
and the military has a relatively large personnel share. Moreover because of the sharp
increase in relative wages, the RMC exchange rates show Chinese-to-USA military costs
rising much faster than the conventional exchange rates that are used in the literature.
6 Real Military Output
The preceding results suggest that conventional exchange rates understate the increase in
these relative costs that are facing the Chinese military. The implications for comparisons
15

of real military output are given in Table 3 which reports the value of mFi,k = (Ci/Ck)/e
Fi,k
andmi,k = (Ci/Ck)/eTk,i where Ci and Ck are the shares of military spending multiplied by
nominal GDP in local currency, from the Penn World Table. The results are summarized
in Panels (i) and (ii) of Figure 8 which show both the levels and growth of real military
spending in China relative to the USA. It can be seen from panel (i) that if Chinese
military spending is converted to $US using our RMC index, the Chinese level is about
27-32% of the USA level in 2000 using the Tornqvist and Fisher indices, and increased
respectively to 39% and 42% by 2010. These values are a little larger in magnitude to
the relative size obtained using PPP exchange rates (20-33%) and much larger than the
level obtained using market exchange rates (8-18%).
Thus, though the existing literature conjectures that a RMC exchange rate would lie
between the PPP and market exchange rates, our results suggest that both the PPP and
market exchange rates understate the actual relative military capacity. The larger value
reflects the very low cost of labor in China and the relative labor intensity of defence
services. Taking into account the uncertainty in this measure arising from standard data
quality issues as well as the assumption regarding equivalent efficiency levels in each
region, the results should be treated with an appropriate degree of caution.21 Nevertheless
they strongly suggest that the true relative military capacity of China relative to the USA
is a ratio that is much closer to standard PPP comparisons of military spending than
market exchange rate comparisons.
This is important since it takes into account both composition of the military including
its high labor share as well as the issue raise by Crane et al (2005) that much equipment
can be imported. The results show, however, that the low wage costs tend to dominate.
Specifically, given the low wage cost (per efficiency unit) in China, it makes economic
sense for China to adopt a labor intensive method of producing military services.
Arguably of greater interest is how much China’s actual capacity has expanded over recent
years, since this goes to the core issue of how much the military and political balance has
changed recently. As was shown in Figure 4, estimates of China’s real military expansion
relative to the USA range widely from 65% to 135%. Panel (ii) of Figure 8 reports the
growth of China’s real military spending relative to the USA using the RMC exchange
rate. Compared to the conventional view of 65% to 135%, the increase is only 43% using
the Tornqvist cost function index, and 32% using the Fisher index. Thus the growth in
China’s military output relative to the USA, using RMC price indices, is much smaller
than the conventional measures.
21Hence the relative levels, mi,k = (Ci/Ck) /eTk,i in Figure 8 should be viewed as an upper limit on
the size of China’s real military capacity, relative to the USA.
16

This smaller real expansion is due to the rapid increase in the RMC exchange rate shown
in Figure 7, which, as discussed above, is due to the increase in wage costs in China after
2000. In essence, China’s military, in the face of rising wages, has had to spend more to
maintain the same level of personnel salaries. With personnel costs occupying 20–30% of
the total budget this reflects a large increase in overall military or defence sector costs.
Again this is important since it shows that, despite the rapidly appreciating exchange
rate in recent years, China’s military costs have escalated with the benefits of the rising
exchange rate being dominated by the higher personnel costs.
7 Real Potential Military Capacity
The preceding results refer only to military spending. As discussed above focusing only
on actual spending understates the shifts in the relative potential capacity of each coun-
try. In particular, China spends a much smaller fraction of its GDP on the military than
the USA currently does and this could easily be expanded. Moreover there is consider-
able uncertainty over the actual versus official size of military budgets (O’Hanlon 2009,
Smith 2009). Hence, as discussed above, rather than focusing just on actual current
military spending, we also consider potential spending since this also important in terms
of determining a country’s influence in international political affairs.
To evaluate relative potential capacity, panels (iii) and (iv) of Figure 8 report the relative
GDP of China and the USA evaluated using the RMC exchange rates. This effectively
gives the relative military capacity of each country assuming that both countries spend
the same fraction of GDP on military services. Thus we evaluate Tornqvist and Fisher
indices of relative GDP in terms of real military output, denoted respectively yTi,k and yFi,k,
where yTi,k ≡ (Yi/Yk)/eTi,k and yFi,k ≡ (Yi/Yk)/e
Fi,k and Yi is the nominal GDP of country i
in local currency units. We can compare the relative growth of real military capacity in
each country by deflating the ratio of nominal spending in two countries, i relative to k,
in local currency units, using RMC exchange rates eTi,k and eFi,k.
It can be seen that the GDP of China measured in units of military output in 2010 is
between 90%-96% of the USA using the Tornqvist and Fisher indices. Again this is larger
than the relative size suggested by standard PPP comparisons of GDP of approximately
75% and reflects the low quality adjusted labor costs in China. Likewise however it
again reinforces the key result that the relative military size is much closer to the ratios
suggested by PPP exchange rate comparisons than market exchange rate comparisons.
17
In terms of growth rates, however, panel (iv) of Figure 8 shows that the growth of
China’s military capacity has been much slower than suggested by standard measures.
Specifically the Fisher RMC index suggests that China’s real potential military output,
given a constant fraction of spending from GDP, has expanded by 92% relative to the
USA – which is much slower than the 235% increase obtained using market exchange
rates and the 140% increase obtained using PPP exchange rates.
The key insight in terms of growth rates, therefore, is again that China’s military costs
have been growing faster than suggested by conventional price indices due to rising per-
sonnel costs, despite the rising exchange rate. Consequently its real military capacity –
either based on current spending or potential spending – is growing more slowly than the
existing literature suggests. This slower growth is due to the impact of China’s rising
wages on military costs. As discussed above, this is an instance of the more general
phenomenon of “Baumol’s costs disease” which applies to sectors that tend to use labor
intensively particularly if labor is not substitutable for capital or equipment.22
7.1 Technological Change and Modernization
In the preceding analysis we have assumed that the rate of technological progress in
both China and USA military sectors is constant. Superficially this might appear to
be contradicted by what has been widely described as China’s “military modernization”
as described, for example, by the U.S. Department of Defense (2011), IISS (2012), or
Shambaugh (2013).
Explanations for this process of modernization typically focus on the the USA’s success
in the two Iraq wars, which demonstrated the superiority of new technologies against
large forces. Thus according to Thompson (2010) and White (2012), the first Gulf War
showed how a large army, in terms of personnel, could be overcome by technological
advantage, which led China to respond with a policy of modernization. Shambaugh
(2013) also points to China’s experiences of large losses in the 1979 Sino-Vietnamese War,
the 1995/1996 Taiwan Strait missile crisis where the USA demonstrated its capacity to
project its military presence, the USA demonstration of stealth technologies in Serbia in
1999 and use of arial drones in Afghanistan and Iraq since 2001. According to Shambaugh
(2013) part of this process of modernization has been cutting the size of ground forces
over the decade 1995-2005 and also significantly invested in new naval and air-force
capabilities. Thus, for example, the U.S. Department of Defense (2011), p.43, state that
22Note that by construction the ratios of the various military spending indices are the same as theratios of the real GDP measures. For example it must be the case that mT
i,k/mFi,k = yTi,k/y
Fi,k.
18

while in 2000 less than 5% of China’s Air and naval forces were considered “modern”, by
2010 between 20-40% were considered “modern”.23
This “military modernization” is widely interpreted as a sign of a more ambitious or
aggressive military stance by China. Nevertheless the preceding analysis suggests that
what appears as modernization also may be interpreted as a purely economic response.
Specifically the cost minimization decision, described in 1, suggests that the rising wage
and salary costs faced by China’s defence sector would result in a substitution towards
equipment and away from personnel. Thus, notwithstanding the political analysis, the
preceding analysis points to an economic motivation for China’s so-called military mod-
ernization. It can be seen as, at least in part, an economic response to China’s growth
and rising productivity in manufacturing.
8 Conclusion
How big is China? Many analysts have asked this question and economists have provided
conventional answers based on different criteria, such as welfare or the ability to affect
world supply and demand using exchange rates and different PPP price indices. Some-
times, perhaps most often, the question is asked for political purposes – to assess China’s
new political standing in international affairs, or for strategic reasons to assess its capac-
ity to project political influence in the region based on credible military capacity. Despite
the extensive political and economic discussion of this issue, there is widespread dissat-
isfaction in the military and strategic literature on existing international comparisons of
GDP or military spending for this purpose.
In this paper we have attempted to fill this gap by developing a real military cost (RMC)
price index and exchange rate for the purpose of international comparisons of real GDP
and military spending. We apply index number theory to develop RMC exchange rate
measures that can be readily calculated using publicly available data on wage rates,
conventional exchange rate measures and military budget shares.
We then apply these exchange rates to assess the level and growth in China’s real military
capacity relative to the USA. We find that in military terms, China is very large relative
23The U.S. Department of Defense (2011) gives the example of the ability of a submarine to launcha cruise missile as an example of “modern”. According to Crane et al (2005) China’s strategy for im-proving the technological capabilities of its defence industries has three main elements: modernizationof technology; civil-military integration, for example by reforming defence procurement with compet-itive bidding for contracts; and to exploit advanced foreign technology through imports of weapons,equipment, and military technologies.
19
to the USA. Specifically it is above the level implied both by market and PPP exchange
rates, and much closer in size to the larger PPP based estimates.
Nevertheless we also show that the growth in China’s real military capacity over the
last decade is much smaller than conventional estimates. For example, using the Fisher
index we find that China’s real military spending has only grown by 32% compared to
conventional measures of 131%. Likewise growth in potential military capacity measured
by nominal GDP deflated by our RMC exchange rates, suggests a growth rate of 92% over
a decade, which is lower than conventional market exchange rate comparisons (235%) and
also lower than standard PPP comparisons (140%).
The difference between our measures and the existing conventional measures is that the
RMC gives an appropriate weight to the relatively high component of personnel costs in
military budgets. Because of rapidly rising wages, a larger fraction of China’s expenditure
on military or defence spending is taken up with personnel costs. The result is an example
of “Baumol’s cost disease” afflicting the Chinese military as a consequence of its rapid
growth in manufacturing.
The results therefore point to a relatively circumspect re-interpretation of China’s rising
economic and military strength. The existing literature emphasizes that China’s eco-
nomic growth allows it to expand its military with no additional burden on government
budgets. We have shown, however, that this trend is tempered substantially by rising
personnel costs due to rising wages in China. Hence, even though China’s military ca-
pacity is shown to be large, due to its ability to draw on a large supply of labor at
relatively low cost, the growth in its capacity over the last decade appears to have been
smaller than conventional studies suggest. In particular the benefits of an appreciating
exchange rate on the costs of military imports has been more than offset by rising per-
sonnel costs. Likewise China’s observed “modernization” can be seen as an economic
response to substitute toward equipment and away from personnel in the face of these
rising wage costs.
20

Appendix 1: Deriving The Fisher Index
The Fisher “Ideal” index is a well known analytical concept but for completeness we
briefly discuss the construction of the index using price and share data from military
budgets. The Fisher price index is a geometric average of the Laspeyres and Paasche price
indices and likewise the Fisher quantity index is the geometric average of the Laspeyres
and Paasche price indices.
Thus suppose we think of country k as a base or reference country, we can define the
value of i ’s purchases of military inputs, evaluated at k ’s prices, as a Laspeyres quantity
index, mLi,k . Likewise k ’s outputs valued at i ’s prices is then a Paasche quantity index of
relative military outputs mPi,k.
These are given by
mLi,k =
∑pkqi∑pkqk
=Ci
Ck
1
ePi,k
mPi,k =
∑piqi∑piqk
=Ci
Ck
1
eLk,i
where ePi,k and eLi,k are the Paasche and Laspeyres price indices given by
ePi,k ≡ (θi /wi,k + (1− θi )/ri,k)−1
eLi,k ≡ θk wi,k + (1− θk )ri,k
Thus the Paasche and Laspeyres price indices, ePi,k and eLi,k are exchange rates that convert
units of RMB into US dollars. As noted in the text the Fisher ideal index of the RMC
exchange rate is simply
eFi,k = a (ePi,k eLi,k)
12
where the technology or efficiency parameter a that allows for differences in technology
across countries, assuming that technology change is Solow neutral with resect to all
factor and intermediate inputs.24 The Fisher quantity index is
mFi,k = (Ci/Ck)/e
Fi,k
24Diewert (1983) gives a more general result on the impact of technological change on the Fisher priceindex.
21

Appendix 2: Labor Compensation Data
In the results in the main text we uses official Chinese and US manufacturing wage data
to represent the relative opportunity costs of military personnel. An alternative is the la-
bor compensation data which is reported by the Bureau of Labor Statistics. Though their
data does not include China, the Bureau of Labor Statistics (BLS) have commissioned
studies to look at China separately (Banister, and Cook, 2011, Banister 2013). The asso-
ciated data are available from the BLS’s China page, http://www.bls.gov/fls/china.htm.
The data from both sources is given in Table A1 along with the RMC exchange rates
calculated using the manufacturing compensation data, as opposed to manufacturing
wages.
Banister, and Cook (2011) and Banister (2013) report that compensation costs in China
were approximately $1.74 per worker in 2009 which is 5% of the USA wage rate. By
comparison the manufacturing wage data used in the main text in the same year was
$US3924 per year, or 6.8 percent of the US wage. Thus USA labor costs appear somewhat
higher relative to China when various forms of social insurance and employee benefits
are included. To that end the use of wage data may overstate the costs of labor in China
relative to the USA.
Because of this, by using the BLS compensation data we obtain RMC exchange rates that
are smaller than those reports in the main text, reflecting the even lower relative cost of
labor in China. Consequently the estimates of China’s military capacity are larger. For
example in terms of GDP, the BLS data give Fisher Tornqvist quantity indexes of 100%
and 111% respectively which is slightly larger than the values of 90 and 96% reported in
Figure 8. With respect to growth rates however, the BLS compensation data are very
similar, with almost identical growth rates.
Hence using the BLS labor compensation data confirms our find that the RMC exchange
rate produces measures of China’s military capacity that are larger than the estimates
implied of relative GDP or military spending using either market or PPP exchange rates,
and does not alter the significantly the conclusions regarding the slower growth of China’s
military capacity relative to conventional estimates based on PPP or market exchange
rates.
22

9 References
Allen, Robert C., W. Erwin Diewert (1981). “Direct versus Implicit Superlative Index
Number Formulae”, The Review of Economics and Statistics, 63, 3, pp.430-435.
Baily, Martin Neil, Robert J. Gordon, William D. Nordhaus, David Romer (1988). “The
Productivity Slowdown, Measurement Issues, and the Explosion of Computer Power”,
Brookings Papers on Economic Activity, 1988, 2, pp.347-431.
Ball, N. (1984). “Measuring Third World Security expenditure: A Research Note”,World
Development, 12, 2, pp.157-164.
Barro Robert, J., and Jong-Wha Lee (2010). “A New Data Set of Educational Attainment
in the World, 1950-2010”, NBER Working Paper, 15902.
Banister, J., and Cook, G. (2011). Chinas employment and compensation costs in man-
ufacturing through 2008. Monthly Labor Review, 134(3), 39-52.
Banister, Judith (2013) “Chinas manufacturing employment and hourly labor compen-
sation, 2002-2009”, Bureau Of Labor Statistics
Beckley, Michael (2012). “China’s Century? Why America’s Edge Will Endure”, Inter-
national Security, 36, 3, pp.41-78.
Bosworth, Barry and Susan M. Collins (2008). “Accounting for Growth: comparing
China and India”, Journal of Economic Perspectives, 22, 1, pp.44-66.
Brzoska, Michael (1995). “World military expenditures” in Hartley, Keith and Todd
Sandler (eds) Handbook of defense economics, 1, pp.45-67.
Bureau of Labor Statistics. (2012) International Comparison of Hourly Compensation
Costs in manufacturing, 2012 www.bls.gov/ilc/ichccaesuppall.xls
Corden, W. M., and J. P.Neary. (1982). “Booming sector and de-industrialisation in a
small open economy”, The Economic Journal, 92, 368, pp.825-848.
Chan, Steve (2012) Looking for Balance: China, the United States and Power Balancing
in East Asia Stanford University Press, Stanford, California
Chen, S. and Ravallion, M. (2010). The developing world is poorer than we thought,
but no less successful in the fight against poverty. The Quarterly Journal of Economics
125,4, 1577-1625.
Crane, Keith, Roger Cliff, Evan Medeiros, James Mulvenon and William Overholt (2005).
23

“Modernizing China’s Military, Opportunities and Constraints”, Rand Corporation, Santa
Monica, California.
Deaton, Angus and Alan Heston (2010). “Understanding PPPs and PPP-based National
Accounts”, American Economic Journal: Macroeconomics, 2, 4, pp.1-35.
Diewert, W. E. (1978). “Superlative Index Numbers and Consistency in Aggregation”,
Econometrica, 46, 4, pp.883-900.
Diewert, W. E. (1983) “The Theory of the Output Price Index and the Measurement of
Real Output Change”, in Diewert, W.E. and Montmarquette ”Price Level Measurement”,
Statistics Canada, Ottawa.
Diewert, W. Erwin (2010), “Methods of Aggregation above the Basic Heading Level:
Linking the Regions,” Chapter 8 in Rao D. S. and F. Vogel (eds.), Measuring the Size
of the World Economy: A Framework, Methodology and Results from the International
Comparison Program (ICP), World Bank, Washington, D.C..
Dobbins, James, David C. Gompert, David A. Shlapak and Andrew Scobell (2011).
“Confict with China Prospects, Consequences, and Strategies for Deterrence”, Rand
Corporation, Santa Monica, California.
Etzioni, A. (2011). “China: Making an adversary”, International Politics, 48, 6, pp.647-
666.
Feenstra, Robert C., Hong Ma, J. Peter Neary, and D.S. Prasada Rao (2013). “Who
Shrunk China? Puzzles in the Measurement of Real GDP”, The Economic Journal,
online: 4 APR 2013, DOI: 10.1111/ecoj.12021.
Fravel, M. T. (2005). Regime Insecurity and International Cooperation: Explaining
China’s Compromises in Territorial Disputes. International Security 30, 2, 46-83.
Fravel, M. Taylor (2008a). “Power Shifts and Escalation Explaining Chinas Use of Force
in Territorial Disputes International Security, 32, 3, pp. 44-83
Fravel, M. Taylor (2008b). “China’s search for military power”, Washington Quarterly,
31, 3, pp.125-141.
Heston, Alan and Bettina Aten (1993) “Real World Military Expenditures” in Jurgen
Brauer and Manas Chatterji (eds) Economic Issues of Disarmament: Contributions from
Peace Economics and Peace Science, New York University Press.
Heston, Alan, Robert Summers and Bettina Aten (2012). Penn World Table Version 7.1,
24
Center for International Comparisons of Production, Income and Prices at the University
of Pennsylvania.
Hill, Robert J. and T. Peter Hill (2009), “Recent Developments in the International
Comparison of Prices and Real Output”, Macroeconomic Dynamics 13 (supplement no.
2), 194-217.
Hill, R. J. (2006). “Superlative index numbers: not all of them are super”, Journal of
Econometrics, 130, 1, pp.25-43.
International Institute for Strategic Studies (2006). The Military Balance 2006, Interna-
tional Institute for Strategic Studies, London.
International Institute for Strategic Studies (2012). The Military Balance 2012, Interna-
tional Institute for Strategic Studies, London.
Jorgenson, Dale W. and Kevin J. Stiroh (1999). “Information Technology and Growth”,
American Economic Review, 89, 2, pp.109-115.
Johnston, A. I. (2013). “How New and Assertive Is China’s New Assertiveness?” Inter-
national Security, 37, 4, 7-48.
Kaplan, R. (2005). “How we would fight China”, The Atlantic, 295, 5, pp.49-64.
Kaplan, R.D. (2010). “While U.S. is distracted, China develops sea power”, The Wash-
ington Post, 26 September.
Klenow, P., and A. Rodriguez-Clare (1997). “The neoclassical revival in growth eco-
nomics: Has it gone too far?”, NBER Macroeconomics Annual, 12, pp.73-103.
Layne, C. (2009). “The waning of US hegemony-myth or reality? A review essay”,
International Security, 34,1, pp.147-172.
Legro, Jeffrey W. (2007). “What China will want: the future intentions of a rising power”
Perspectives on Politics, 5, 3, pp.515-534.
Maddison, A., and H. X. Wu (2008). “Measuring China’s Economic Performance”, World
Economics, 9, 2, pp.13-44.
Mearsheimer, J. J. (2001). The tragedy of great power politics. WW Norton and Com-
pany, New York.
Mearsheimer, J. J. (2006). “China’s unpeaceful rise”, Current History, 105, 690, pp.160-
162.
25

Morgenthau, Hans (1948). Politics Among Nations: The Struggle for Power and Peace,
Alfred A. Knopf, New York.
O’Hanlon, Michael (2009). The Science of War, Princeton University Press, N.J.
Peoples’ Republic of China (2004). “China’s National Defence in 2004”, Information
Office of the State Council.
Peoples’ Republic of China (2008). “China’s National Defence in 2008”, Information
Office of the State Council.
Robertson, Peter E. (2013). “The Global Impact of China’s Growth” in Fan, Shenggen,
Ravi Kanbur, Shang-Jin Wei and Xiaobo Zhang (eds) The Oxford Companion to the
Economics of China (forthcoming).
Shifrinson, Joshua R. Itzkowitz, and Michael Beckley (2012). “Debating China’s Rise
and US Decline”, International Security 37 , 3, pp.172-181.
Smith, Ron (2009). Military Economics: The Interaction of Power and Money, Palgrave
MacMillan, Hampshire, UK.
Stockholm International Peace Research Institute (SIPRI) (2012). SIPRI Yearbook 2012:
Armaments, Disarmament and International Security, Oxford University Press.
Shambaugh, David (2013) China Goes Global: The Partial Power Oxford University
Press, N.Y.
Subramanian, Arvind (2011). “The Inevitable Superpower: Why China’s Rise Is a Sure
Thing”, Foreign Affairs, 90, 5, pp.66-78.
Tellis, Ashley J., Janice Bially, Christopher Layne, and Melissa McPherson (2000). Mea-
suring National Power in the Postindustrial Age, RAND Corporation, Santa Monica,
California.
The Economist (2010). “The fourth modernisation”, Dec 2, 397, 8711, pp.7.
The Economist (2011). “Economics Focus: How To Get A Date”, December 31, 401,
8765, pp.57.
The Economist (2012a). “Military Strategy: The China Syndrome”, June 9, 403, 8788,
pp.34.
The Economist (2012b). “China’s military rise: The dragon’s new teeth. A rare look
inside the world’s biggest military expansion”, April 7, 403, 8779, pp.27.
26

Thompson, Drew (2010). “Think Again: China’s Military, it’s not time to panic. Yet.”
Foreign Policy, March-April, 178, pp.86.
United Nations (1986). Reduction of Military Budgets: Constriction of military price in-
dices and Purchasing Power Parities for Comparison of Military Expenditures, A/40/421,
United Nations, New York.
U.S. Department of Defense (2005). The Military Power of the People’s Republic of
China, Office of the Secretary of Defense, Annual Report to Congress.
U.S. Department of Defense (2007). The Military Power of the People’s Republic of
China, Office of the Secretary of Defense, Annual Report to Congress.
U.S. Department of Defense (2011). Military and Security Developments Involving the
People’s Republic of China, Office of the Secretary of Defense, Annual Report to Congress.
White, H. (2012). “The China Choice: Why America Should Share Power”, Black Inc,
Collingwood, Victoria, Australia.
Wortzel, Larry M. (2013) The Dragon Extends its Reach: Chinese Military Power goes
Global Potomac Books, Washington D.C.
27

Figure 1: China and USA Relative GDP Using Market and PPP Exchange Rates
Source Summers, Heston and Atin (2013)
Figure 2: China and USA Shares of Military Spending in GDP
Sources: SIPRI Year Book (2012) , China Statistical Yearbook, http://www.stats.gov.cn/english/statisticaldata/yearlydata, Whitehouse Office of Management and Budget (http://www.whitehouse.gov/omb/budget/Historicals/) and authors calculations.
0
10
20
30
40
50
60
70
80
90
1980 1985 1990 1995 2000 2005 2010
Market ExchangeRates
PPP Exchange Rates(China v.1)
PPP Exchange Rates(China v.2)
0
1
2
3
4
5
6
7
8
9
10
1980 1985 1990 1995 2000 2005 2010
China
USA
28
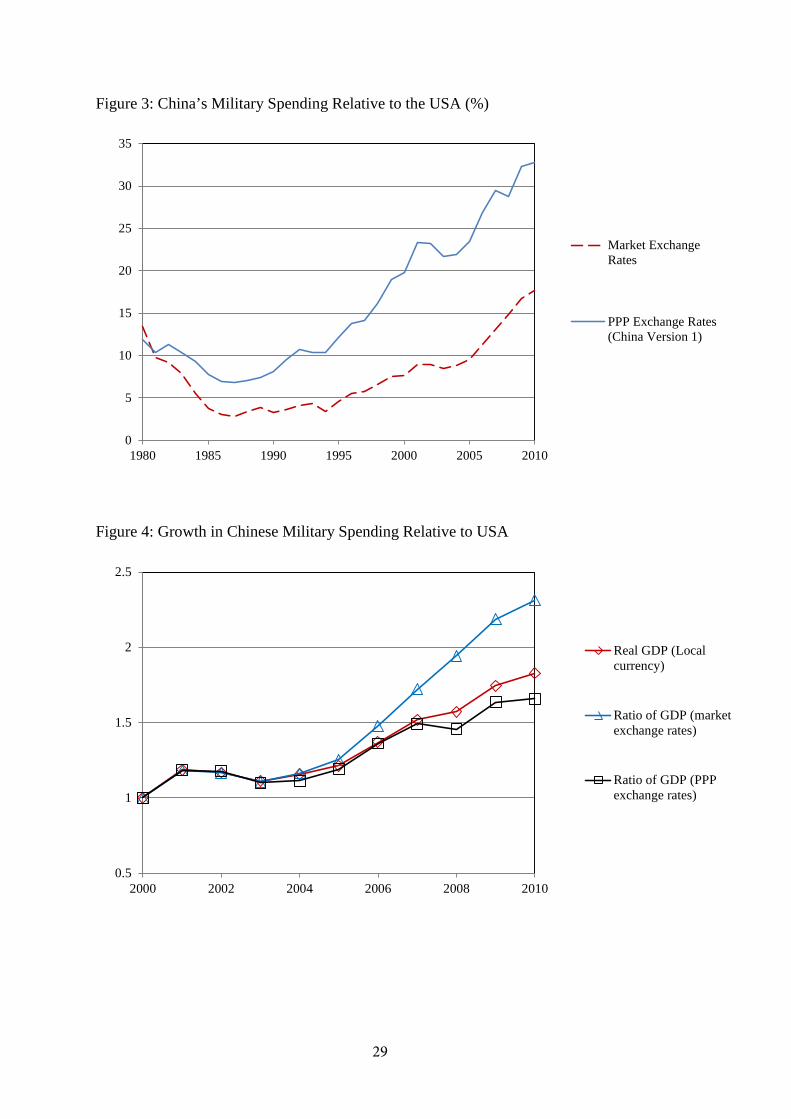
Figure 3: China’s Military Spending Relative to the USA (%)
Figure 4: Growth in Chinese Military Spending Relative to USA
0
5
10
15
20
25
30
35
1980 1985 1990 1995 2000 2005 2010
Market ExchangeRates
PPP Exchange Rates(China Version 1)
0.5
1
1.5
2
2.5
2000 2002 2004 2006 2008 2010
Real GDP (Localcurrency)
Ratio of GDP (marketexchange rates)
Ratio of GDP (PPPexchange rates)
29
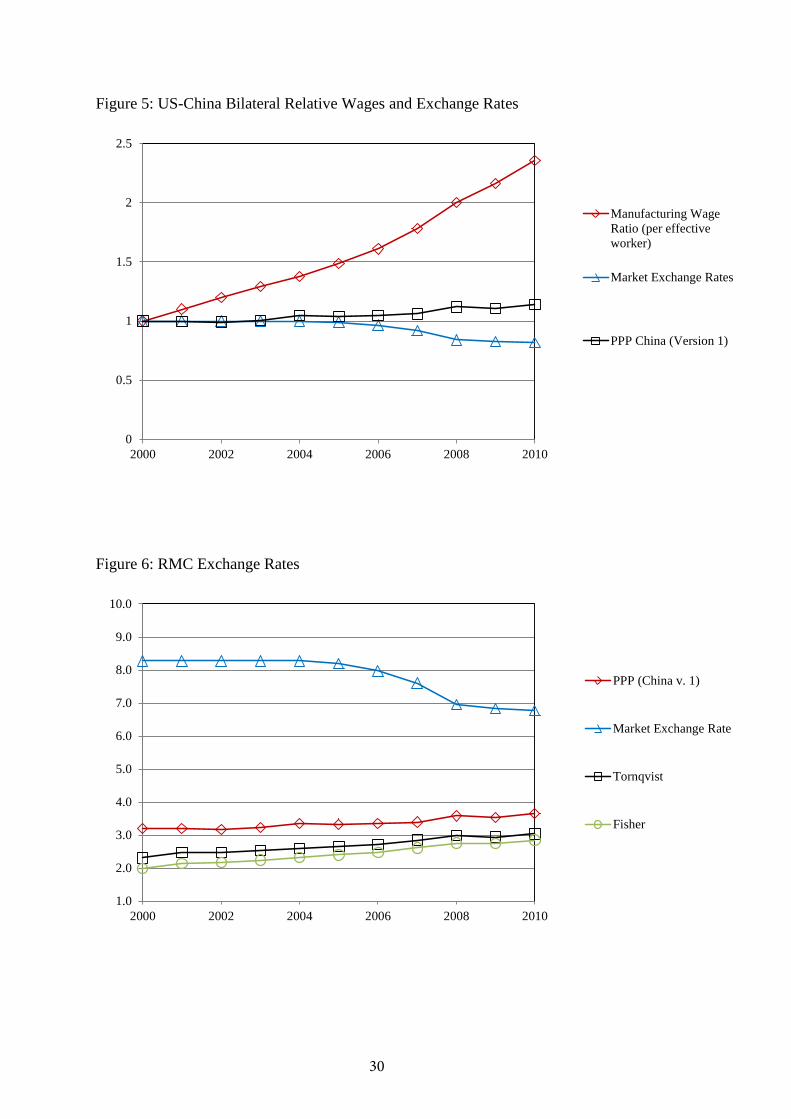
Figure 5: US-China Bilateral Relative Wages and Exchange Rates
Figure 6: RMC Exchange Rates
0
0.5
1
1.5
2
2.5
2000 2002 2004 2006 2008 2010
Manufacturing WageRatio (per effectiveworker)
Market Exchange Rates
PPP China (Version 1)
1.0
2.0
3.0
4.0
5.0
6.0
7.0
8.0
9.0
10.0
2000 2002 2004 2006 2008 2010
PPP (China v. 1)
Market Exchange Rate
Tornqvist
Fisher
30

Figure 7: RMC Exchange Rate Index (2000=1)
0.6
0.8
1.0
1.2
1.4
1.6
2000 2002 2004 2006 2008 2010
PPP (China v. 1)
Market Exchange Rate
Tornqvist
Fisher
31

Figure 8: Real Military Capacity - China relative to the USA
(i) Chinese Real Military Spending Relative to USA (%)
(ii) Growth in Relative Military Spending 2000-2010 (%)
(iii) Chinese GDP Relative to USA Using RMC Exchange rates (%)
(iv) Growth in Relative GDP 2000-2010 using RMC Exchange rates (%)
0 50 100 150
MarketER
PPP
RMCTornqvist
RMCFisher
2000
2010
0 50 100 150 200 250
MarketER
PPP
RMCTornqvist
RMCFisher
0 50 100 150
MarketER
PPP
RMCTornqvist
RMCFisher
2000
2010
0 100 200 300
MarketER
PPP
RMCTornqvist
RMCFisher
32

Table 1: Military Budget Shares for China and the USA
Year USA Personnel
Share USA Operations
Share USA Equipment
Share China Personnel
Share China Operations
Share China Equipment
Share
2000 0.254 0.556 0.189 0.334 0.345 0.321 2001 0.241 0.562 0.196 0.320 0.337 0.343 2002 0.252 0.566 0.182 0.319 0.343 0.338 2003 0.249 0.571 0.179 0.325 0.336 0.339 2004 0.247 0.577 0.176 0.332 0.336 0.332 2005 0.251 0.550 0.200 0.338 0.336 0.326 2006 0.241 0.561 0.198 0.338 0.338 0.324 2007 0.219 0.560 0.222 0.338 0.340 0.322 2008 0.206 0.549 0.245 0.339 0.339 0.322 2009 0.224 0.573 0.203 0.340 0.337 0.322 2010 0.226 0.579 0.195 0.340 0.337 0.322
Sources: USA data from http://www.whitehouse.gov/omb/budget/Historicals/ Table 1.2 and excludes the category “Atomic Energy Defense Activities”. For China the data are taken from various issues of the China Defence White papers, China’s National Defence from http://merln.ndu.edu/whitepapers.html
33

Table 2: Relative Price Data for China and the USA
Year Market Exchange Rate (RMB/Dollar)
PPP Exchange Rate (RMB/Dollar)
China Manufacturing Wage and Salaries per Full-Time Employee
USA Manufacturing Wage and Salaries per Full-Time Employee
Effective Workers (China/USA)
Manu. Wage Ratio per Effective Worker
(RMB/Dollar)
2000 8.28 3.20 8750 43933 0.43 0.46 2001 8.28 3.19 9774 44216 0.44 0.51 2002 8.28 3.17 11001 45382 0.44 0.55 2003 8.28 3.22 12496 47393 0.44 0.60 2004 8.28 3.34 14033 49423 0.45 0.64 2005 8.19 3.33 15757 50909 0.45 0.69 2006 7.97 3.35 17966 53152 0.46 0.74 2007 7.61 3.39 20884 55273 0.46 0.82 2008 6.95 3.58 24192 56375 0.46 0.92 2009 6.83 3.53 26810 57383 0.47 1.00 2010 6.77 3.65 30916 59987 0.47 1.09
Sources: Chinese Statistical Yearbook http://www.stats.gov.cn/english/statisticaldata/yearlydata/, various years; BEA national Income and Product Accounts http://www.bea.gov//national/nipaweb/DownSS2.asp; Heston et al (2012), Barro and Lee (2010) and authors calculations.
34

Table 3: Results
Year RMC Törnqvist (RMB/Dollar)
RMC Fisher (RMB/Dollar)
Nominal GDP Ratio
(RMB/Dollar)
RMC GDP Ratio (Tornqvist)
RMC GDP Ratio (Fisher)
Ratio MX RMC MX Ratio (Törnqvist)
RMC MX Ratio (Fisher)
2000 2.31 1.99 1.00 0.43 0.50 0.63 0.27 0.32 2001 2.46 2.13 1.07 0.43 0.50 0.70 0.27 0.35 2002 2.47 2.17 1.14 0.46 0.52 0.65 0.30 0.34 2003 2.53 2.24 1.23 0.49 0.55 0.57 0.30 0.31 2004 2.60 2.31 1.36 0.52 0.59 0.54 0.28 0.32 2005 2.65 2.40 1.49 0.56 0.62 0.53 0.28 0.33 2006 2.72 2.47 1.67 0.62 0.68 0.54 0.30 0.36 2007 2.85 2.61 1.90 0.67 0.73 0.53 0.33 0.38 2008 2.99 2.76 2.21 0.74 0.80 0.47 0.35 0.37 2009 2.94 2.74 2.49 0.85 0.91 0.46 0.34 0.42 2010 3.04 2.85 2.73 0.90 0.96 0.44 0.39 0.42 35

Table A1: Urban and Rural Chinese Labour Costs Relative to the USA using BLS Compensation Data
Year
Average Chinese Labour Compensation ($US per hour)
US Average Compensation Hourly Costs ($US per hour)
Average China Compensation as a percentage of USA Labour
Costs
Fisher RMC Exchange Rate based of BLS
Data
Fisher RMC Exchange Rate based of BLS
Data
2002 0.60 27.36 2.19 1.92 2.27 2003 0.68 28.57 2.38 1.98 2.33 2004 0.74 29.31 2.52 2.03 2.38 2005 0.83 30.14 2.75 2.10 2.42 2006 0.95 30.48 3.12 2.17 2.48 2007 1.21 32.07 3.77 2.33 2.64 2008 1.59 32.78 4.85 2.50 2.80 2009 1.74 34.19 5.09 1.92 2.27
Source: Banister and Cook (2011), Banister (2013) and authors’ calculations
36

Editor, UWA Economics Discussion Papers: Ernst Juerg Weber Business School – Economics University of Western Australia 35 Sterling Hwy Crawley WA 6009 Australia
Email: [email protected]
The Economics Discussion Papers are available at: 1980 – 2002: http://ecompapers.biz.uwa.edu.au/paper/PDF%20of%20Discussion%20Papers/ Since 2001: http://ideas.repec.org/s/uwa/wpaper1.html Since 2004: http://www.business.uwa.edu.au/school/disciplines/economics
ECONOMICS DISCUSSION PAPERS 2011
DP NUMBER AUTHORS TITLE
11.01 Robertson, P.E. DEEP IMPACT: CHINA AND THE WORLD ECONOMY
11.02 Kang, C. and Lee, S.H. BEING KNOWLEDGEABLE OR SOCIABLE? DIFFERENCES IN RELATIVE IMPORTANCE OF COGNITIVE AND NON-COGNITIVE SKILLS
11.03 Turkington, D. DIFFERENT CONCEPTS OF MATRIX CALCULUS
11.04 Golley, J. and Tyers, R. CONTRASTING GIANTS: DEMOGRAPHIC CHANGE AND ECONOMIC PERFORMANCE IN CHINA AND INDIA
11.05 Collins, J., Baer, B. and Weber, E.J. ECONOMIC GROWTH AND EVOLUTION: PARENTAL PREFERENCE FOR QUALITY AND QUANTITY OF OFFSPRING
11.06 Turkington, D. ON THE DIFFERENTIATION OF THE LOG LIKELIHOOD FUNCTION USING MATRIX CALCULUS
11.07 Groenewold, N. and Paterson, J.E.H. STOCK PRICES AND EXCHANGE RATES IN AUSTRALIA: ARE COMMODITY PRICES THE MISSING LINK?
11.08 Chen, A. and Groenewold, N. REDUCING REGIONAL DISPARITIES IN CHINA: IS INVESTMENT ALLOCATION POLICY EFFECTIVE?
11.09 Williams, A., Birch, E. and Hancock, P. THE IMPACT OF ON-LINE LECTURE RECORDINGS ON STUDENT PERFORMANCE
11.10 Pawley, J. and Weber, E.J. INVESTMENT AND TECHNICAL PROGRESS IN THE G7 COUNTRIES AND AUSTRALIA
11.11 Tyers, R. AN ELEMENTAL MACROECONOMIC MODEL FOR APPLIED ANALYSIS AT UNDERGRADUATE LEVEL
11.12 Clements, K.W. and Gao, G. QUALITY, QUANTITY, SPENDING AND PRICES
11.13 Tyers, R. and Zhang, Y. JAPAN’S ECONOMIC RECOVERY: INSIGHTS FROM MULTI-REGION DYNAMICS
37

11.14 McLure, M. A. C. PIGOU’S REJECTION OF PARETO’S LAW
11.15 Kristoffersen, I. THE SUBJECTIVE WELLBEING SCALE: HOW REASONABLE IS THE CARDINALITY ASSUMPTION?
11.16 Clements, K.W., Izan, H.Y. and Lan, Y. VOLATILITY AND STOCK PRICE INDEXES
11.17 Parkinson, M. SHANN MEMORIAL LECTURE 2011: SUSTAINABLE WELLBEING – AN ECONOMIC FUTURE FOR AUSTRALIA
11.18 Chen, A. and Groenewold, N. THE NATIONAL AND REGIONAL EFFECTS OF FISCAL DECENTRALISATION IN CHINA
11.19 Tyers, R. and Corbett, J. JAPAN’S ECONOMIC SLOWDOWN AND ITS GLOBAL IMPLICATIONS: A REVIEW OF THE ECONOMIC MODELLING
11.20 Wu, Y. GAS MARKET INTEGRATION: GLOBAL TRENDS AND IMPLICATIONS FOR THE EAS REGION
11.21 Fu, D., Wu, Y. and Tang, Y. DOES INNOVATION MATTER FOR CHINESE HIGH-TECH EXPORTS? A FIRM-LEVEL ANALYSIS
11.22 Fu, D. and Wu, Y. EXPORT WAGE PREMIUM IN CHINA’S MANUFACTURING SECTOR: A FIRM LEVEL ANALYSIS
11.23 Li, B. and Zhang, J. SUBSIDIES IN AN ECONOMY WITH ENDOGENOUS CYCLES OVER NEOCLASSICAL INVESTMENT AND NEO-SCHUMPETERIAN INNOVATION REGIMES
11.24 Krey, B., Widmer, P.K. and Zweifel, P. EFFICIENT PROVISION OF ELECTRICITY FOR THE UNITED STATES AND SWITZERLAND
11.25 Wu, Y. ENERGY INTENSITY AND ITS DETERMINANTS IN CHINA’S REGIONAL ECONOMIES
38
ECONOMICS DISCUSSION PAPERS 2012
DP NUMBER AUTHORS TITLE
12.01 Clements, K.W., Gao, G., and Simpson, T.
DISPARITIES IN INCOMES AND PRICES INTERNATIONALLY
12.02 Tyers, R. THE RISE AND ROBUSTNESS OF ECONOMIC FREEDOM IN CHINA
12.03 Golley, J. and Tyers, R. DEMOGRAPHIC DIVIDENDS, DEPENDENCIES AND ECONOMIC GROWTH IN CHINA AND INDIA
12.04 Tyers, R. LOOKING INWARD FOR GROWTH
12.05 Knight, K. and McLure, M. THE ELUSIVE ARTHUR PIGOU
12.06 McLure, M. ONE HUNDRED YEARS FROM TODAY: A. C. PIGOU’S WEALTH AND WELFARE
12.07 Khuu, A. and Weber, E.J. HOW AUSTRALIAN FARMERS DEAL WITH RISK
12.08 Chen, M. and Clements, K.W. PATTERNS IN WORLD METALS PRICES
12.09 Clements, K.W. UWA ECONOMICS HONOURS
12.10 Golley, J. and Tyers, R. CHINA’S GENDER IMBALANCE AND ITS ECONOMIC PERFORMANCE
12.11 Weber, E.J. AUSTRALIAN FISCAL POLICY IN THE AFTERMATH OF THE GLOBAL FINANCIAL CRISIS
12.12 Hartley, P.R. and Medlock III, K.B. CHANGES IN THE OPERATIONAL EFFICIENCY OF NATIONAL OIL COMPANIES
12.13 Li, L. HOW MUCH ARE RESOURCE PROJECTS WORTH? A CAPITAL MARKET PERSPECTIVE
12.14 Chen, A. and Groenewold, N. THE REGIONAL ECONOMIC EFFECTS OF A REDUCTION IN CARBON EMISSIONS AND AN EVALUATION OF OFFSETTING POLICIES IN CHINA
12.15 Collins, J., Baer, B. and Weber, E.J. SEXUAL SELECTION, CONSPICUOUS CONSUMPTION AND ECONOMIC GROWTH
12.16 Wu, Y. TRENDS AND PROSPECTS IN CHINA’S R&D SECTOR
12.17 Cheong, T.S. and Wu, Y. INTRA-PROVINCIAL INEQUALITY IN CHINA: AN ANALYSIS OF COUNTY-LEVEL DATA
12.18 Cheong, T.S. THE PATTERNS OF REGIONAL INEQUALITY IN CHINA
12.19 Wu, Y. ELECTRICITY MARKET INTEGRATION: GLOBAL TRENDS AND IMPLICATIONS FOR THE EAS REGION
12.20 Knight, K. EXEGESIS OF DIGITAL TEXT FROM THE HISTORY OF ECONOMIC THOUGHT: A COMPARATIVE EXPLORATORY TEST
12.21 Chatterjee, I. COSTLY REPORTING, EX-POST MONITORING, AND COMMERCIAL PIRACY: A GAME THEORETIC ANALYSIS
12.22 Pen, S.E. QUALITY-CONSTANT ILLICIT DRUG PRICES
12.23 Cheong, T.S. and Wu, Y. REGIONAL DISPARITY, TRANSITIONAL DYNAMICS AND CONVERGENCE IN CHINA
39

12.24 Ezzati, P. FINANCIAL MARKETS INTEGRATION OF IRAN WITHIN THE MIDDLE EAST AND WITH THE REST OF THE WORLD
12.25 Kwan, F., Wu, Y. and Zhuo, S. RE-EXAMINATION OF THE SURPLUS AGRICULTURAL LABOUR IN CHINA
12.26 Wu, Y. R&D BEHAVIOUR IN CHINESE FIRMS
12.27 Tang, S.H.K. and Yung, L.C.W. MAIDS OR MENTORS? THE EFFECTS OF LIVE-IN FOREIGN DOMESTIC WORKERS ON SCHOOL CHILDREN’S EDUCATIONAL ACHIEVEMENT IN HONG KONG
12.28 Groenewold, N. AUSTRALIA AND THE GFC: SAVED BY ASTUTE FISCAL POLICY?
ECONOMICS DISCUSSION PAPERS 2013
DP NUMBER AUTHORS TITLE
13.01 Chen, M., Clements, K.W. and Gao, G.
THREE FACTS ABOUT WORLD METAL PRICES
13.02 Collins, J. and Richards, O. EVOLUTION, FERTILITY AND THE AGEING POPULATION
13.03 Clements, K., Genberg, H., Harberger, A., Lothian, J., Mundell, R., Sonnenschein, H. and Tolley, G.
LARRY SJAASTAD, 1934-2012
13.04 Robitaille, M.C. and Chatterjee, I. MOTHERS-IN-LAW AND SON PREFERENCE IN INDIA
13.05 Clements, K.W. and Izan, I.H.Y. REPORT ON THE 25TH PHD CONFERENCE IN ECONOMICS AND BUSINESS
13.06 Walker, A. and Tyers, R. QUANTIFYING AUSTRALIA’S “THREE SPEED” BOOM
13.07 Yu, F. and Wu, Y. PATENT EXAMINATION AND DISGUISED PROTECTION
13.08 Yu, F. and Wu, Y. PATENT CITATIONS AND KNOWLEDGE SPILLOVERS: AN ANALYSIS OF CHINESE PATENTS REGISTER IN THE US
13.09 Chatterjee, I. and Saha, B. BARGAINING DELEGATION IN MONOPOLY
13.10 Cheong, T.S. and Wu, Y. GLOBALIZATION AND REGIONAL INEQUALITY IN CHINA
13.11 Cheong, T.S. and Wu, Y. INEQUALITY AND CRIME RATES IN CHINA
13.12 Robertson, P.E. and Ye, L. ON THE EXISTENCE OF A MIDDLE INCOME TRAP
13.13 Robertson, P.E. THE GLOBAL IMPACT OF CHINA’S GROWTH
13.14 Hanaki, N., Jacquemet, N., Luchini, S., and Zylbersztejn, A.
BOUNDED RATIONALITY AND STRATEGIC UNCERTAINTY IN A SIMPLE DOMINANCE SOLVABLE GAME
13.15 Okatch, Z., Siddique, A. and Rammohan, A.
DETERMINANTS OF INCOME INEQUALITY IN BOTSWANA
13.16 Clements, K.W. and Gao, G. A MULTI-MARKET APPROACH TO MEASURING THE CYCLE
40

13.17 Chatterjee, I. and Ray, R. THE ROLE OF INSTITUTIONS IN THE INCIDENCE OF CRIME AND CORRUPTION
13.18 Fu, D. and Wu, Y. EXPORT SURVIVAL PATTERN AND DETERMINANTS OF CHINESE MANUFACTURING FIRMS
13.19 Shi, X., Wu, Y. and Zhao, D. KNOWLEDGE INTENSIVE BUSINESS SERVICES AND THEIR IMPACT ON INNOVATION IN CHINA
13.20 Tyers, R., Zhang, Y. and Cheong, T.S.
CHINA’S SAVING AND GLOBAL ECONOMIC PERFORMANCE
13.21 Collins, J., Baer, B. and Weber, E.J. POPULATION, TECHNOLOGICAL PROGRESS AND THE EVOLUTION OF INNOVATIVE POTENTIAL
13.22 Hartley, P.R. THE FUTURE OF LONG-TERM LNG CONTRACTS
13.23 Tyers, R. A SIMPLE MODEL TO STUDY GLOBAL MACROECONOMIC INTERDEPENDENCE
13.24 McLure, M. REFLECTIONS ON THE QUANTITY THEORY: PIGOU IN 1917 AND PARETO IN 1920-21
13.25 Chen, A. and Groenewold, N. REGIONAL EFFECTS OF AN EMISSION-REDUCTION POLICY IN CHINA: TAXES, SUBSIDIES AND THE METHOD OF FINANCING
13.26 Siddique, M.A.B. TRADE RELATIONS BETWEEN AUSTRALIA AND THAILAND: 1990 TO 2011
13.27 Li, B. and Zhang, J. GOVERNMENT DEBT IN AN INTERGENERATIONAL MODEL OF ECONOMIC GROWTH, ENDOGENOUS FERTILITY, AND ELASTIC LABOR WITH AN APPLICATION TO JAPAN
13.28 Robitaille, M. and Chatterjee, I. SEX-SELECTIVE ABORTIONS AND INFANT MORTALITY IN INDIA: THE ROLE OF PARENTS’ STATED SON PREFERENCE
13.29 Ezzati, P. ANALYSIS OF VOLATILITY SPILLOVER EFFECTS: TWO-STAGE PROCEDURE BASED ON A MODIFIED GARCH-M
13.30 Robertson, P. E. DOES A FREE MARKET ECONOMY MAKE AUSTRALIA MORE OR LESS SECURE IN A GLOBALISED WORLD?
13.31 Das, S., Ghate, C. and Robertson, P. E.
REMOTENESS AND UNBALANCED GROWTH: UNDERSTANDING DIVERGENCE ACROSS INDIAN DISTRICTS
13.32 Robertson, P.E. and Sin, A. MEASURING HARD POWER: CHINA’S ECONOMIC GROWTH AND MILITARY CAPACITY
41


![Ultra-precise characterization of LCLS hard X-ray focusing ... · generation slope measuring profilers like the Nanometer Optical Component Measuring Machine (NOM) [5,6,7,8] or the](https://img.pdfslide.us/doc/110x75/5f732c766018cf0af81f745e/ultra-precise-characterization-of-lcls-hard-x-ray-focusing-generation-slope.jpg)