Embed Size (px)
Citation preview
POLICY EXCHANGE
#ECONOMICSMANIFESTO
ECONOMICS MANIFESTO
JONATHAN DUPONT

2 – Economics Manifesto
After a decade in which real wages have fallen and unemployment soared, it is no surprise that many people have lost faith in the ability of markets to deliver for them. In the short term, Britain faces challenges: our productivity is stagnant, our savings too low and the deficit too high. Nevertheless the long term outlook for our economy remains bright. The combination of markets and technology is the most powerful engine we know of to increase prosperity, reduce poverty and create a better world. In this manifesto, we look at where our economy has been, where it is going – and how the Government can ensure the power of markets benefits everyone.”
“

Chapter Title – 3
THE NEXT GOVERNMENT SHOULD AIM TO...
Create the most innovative and competitive economy in the world
Build a capital-owning democracy
Deliver a value for money government

4 – Economics Manifesto
Policy Exchange wants to see a high growth,
enterprise led economy in the UK with freer
markets driving growth and opportunity.
Where individuals, families and communities
are encouraged to take responsibility and are
able to flourish. We are optimistic about the
country’s future and the power of freedom
and responsibility to improve people’s lives.
For more information about our work visit:
www.policyexchange.org.uk/economics-and-
social-policy or contact one of the team:
Steve Hughes, Head of Unit: steve.hughes@
policyexchange.org.uk/@sc_hughes
Jonathan Dupont, Research Fellow: jonathan.
[email protected]/@jondupont
Damian Hind, Research Fellow: damian.hind@
policyexchange.org.uk/@Damian_AH
ACKNOWLEDGEMENTS
Policy Exchange would like to thank the wide
range of individuals, businesses and other
organisations that have shared their ideas,
perspectives and insights during the course
of our work over the last five years.
We would especially like to express our
gratitude to those inside and outside Policy
Exchange whose ideas have been incorpo-
rated into this report – and in particular the PX
alumni of Ruth Porter, Guy Miscampbell, Ed
Holmes, Matt Tinsley, Matt Oakley, Sean Worth,
James Barty, Alex Morton and Tim Leunig.
Any errors or omissions remain our own.
ABOUT THE ECONOMICS AND SOCIAL POLICY UNIT

CONTENTS
Contents – 5
Summary of Recommendations 6
Creating the Most Innovative and Competitive
Economy in the World 6
Building a Capital-Owning Democracy 8
Delivering a Value for Money Government 10
Introduction 12
Where We’ve Been 12
Markets Work 14
Where the Economy is Going 15
Growth that Benefits Everybody 19
Growth 21
“Give the losers leave to speak” 21
The End of Invention? 22
Competition 24
The 99%? 28
Recommendations: Creating the Most Innovative 30
and Competitive Economy in the World
Savings 35
Rise of the Robots 35
It’s Complicated 37
Bricks and Mortar 38
Recommendations: Creating a Capital-Owning Democracy 40
Government 44
A Disagreeable Task 44
Too Far, Too Fast? 45
Half Way There 48
Why We Reform 52
Recommendations: Delivering Value for Money Government 53
Further Reading 57
Endnotes 58

6 – Economics Manifesto
Over the last few years, Britain’s economy has prioritised keeping people in work over increasing wages. As the economy reduces unemployment, focus will switch back to how we can ensure more rapid growth.
In order to keep improving living standards
and cut the cost of living, Britain needs higher
productivity, more disruptive innovation and
greater levels of competition.
z Introduce a new generation of
government sponsored prizes for basic
research and innovation. In the past,
prizes have sparked John Harrison’s
chronometer, Charles Lindbergh’s
flight across the Atlantic, and a new,
accelerating private space industry. The
Government should massively expand the
current Longitude Prize programme, and
catalyse a new generation of prizes to
tackle our biggest challenges in energy,
environment, health and education.
z Regulatory policy should aim at enabling
permissionless innovation, rather
than trying to satisfy an unachievable
precautionary principle. The biggest
dangers to our health, safety and
environment do not come from making
progress too quickly on self-driving cars,
GM crops, new drugs or new energy
supplies, but rather, progressing too
slowly. Regulation is needed, but it
should be aimed at actual harms not
unlikely worst case scenarios.
z Introduce a Presumption against
Interference in the planning system with
residents acting as quality control, rather
than officials. Change of Use restrictions
should be limited to clear externalities,
and local plans should be drastically
stripped back – no density targets, or
CREATING THE MOST INNOVATIVE AND COMPETITIVE ECONOMY IN THE WORLD
top down regulation of minutiae like car
spaces, bike standards or the number
of hotel rooms. If less than half of the
people in the immediate vicinity object,
planning permission should automatically
be granted subject to appropriate
compensation.
z Introduce a new supply side agenda
to tackle monopoly rents, increase
competition and cut the cost of living.
Network Rail, for example, could be
broken into eight regional companies
to increase competition and efficiency,
while the franchising process should be
reformed to start from ‘zero subsidy’
bids rather than tightly defined
specifications. Rather than pick winners,
the Government should bring forward
auctions for mature renewable energy
sources, and refocus resources on setting
consistent carbon prices and supporting
early stage sources. We should commit
to building 300,000 houses a year,
driving down rental costs, increasing
housing supply and creating thousands
of jobs in the construction sector.
z Britain should aim to build on London’s
success as a world hub for trade,
finance and talent, offering the most
competitive business taxes in the G20.
Building on the successful model of
corporation tax, the Government should
give businesses greater certainty by
publishing a five year tax roadmap at the
beginning of the Parliament. The next
Government should commit to accepting
the recommendations of the Davies
review. Outside London, the Government
should encourage new hubs through
devolving further political, borrowing
and economic powers, and increasing
road and rail investment to create a new
‘Northern Hub’.
Creating the Most Innovative and Competitive Economy in the World – 7

8 – Economics Manifesto
In the long run, ownership of assets is as important as wages in generating inequality, but the distribution of savings is currently even less equal than income.
We need to create a capital owning democ-
racy, to ensure saving isn’t only the province of
the rich. Everyone should share in the benefits
as the economy grows.
z Introduce a Bonus ISA to give people
more flexibility to build up their tax-free
savings pots during the course of
a lifetime. People who experience a
one-off financial windfall such as an
inheritance, house sale or redundancy
payment would benefit from being able
to make a deposit into their tax-free
account within a single year that is
greater than the annual tax-free savings
allowance (currently set at £15,000).
People would be given the power to
roll over any unused portions of their
existing ISA allowances into their Bonus
ISA account.
z Introduce a new generation of private
sector Premium Bonds. Originally
introduced by Harold Macmillan,
Premium Bonds remain one of Britain’s
most popular savings products, while
other examples of prize-liked savings
accounts have been shown to increase
total savings by 12%. They are especially
effective among those with already
low levels of income and savings. The
Government should encourage a new
generation of Premium Bonds, allowing
private organisations to experiment with
different behavioural nudges, lottery-like
mechanisms and different combinations
of prizes and interest rates.
z Allow taxpayers to buy a no risk stake in
RBS and Lloyds. Anyone who has an NI
number and is on the electoral register
should be given the opportunity to apply
for shares at no initial cost, only paying
BUILDING A CAPITAL-OWNING DEMOCRACY
at the time of sale. The Government
would retain the option of recalling the
shares in the highly unlikely event that
they never rise above a floor price,
but the new shareholders would receive
any upside.
z End the opt-out for auto-enrolment in
private sector pensions and gradually
increase the contribution rate to 12%.
Under the current 8% rate, a worker
earning £27,000 over 40 years would
only save around 55% of what they need
to generate the target replacement
income. Increasing the rate to 12% and
making it compulsory would match
Australia’s highly successful pension
scheme, while ensuring that even the
lowest paid are saving for the future.
z Create a new system of personal
‘MyFund’ welfare accounts funded out
of National Insurance payments.
Individuals should be able to add up to
an extra £100 a week to their personal
‘MyFund’ account, which would fund the
first three months of unemployment. In
addition, the fund could be drawn on
throughout the working life to support
career transition and retraining; any
remaining balance would be added to
the pension on retirement.
Building a Capital-Owning Democracy – 9

10 – Economics Manifesto
Fiscal consolidation remains only half-finished: our debt is too high and long term forecasts for the public finances unsustainable. However, taxes are already the largest bill most households pay, and raising them higher would threaten living standards.
On the other hand, there remains considerable
scope to increase the efficiency of govern-
ment – allowing us to both, pay down debt
and pass on the benefits as higher incomes
for the low-paid.
z After the deficit has been closed,
introduce a new fiscal mandate
targeting a zero structural deficit and
the pay down of the debt-to-GDP ratio
over the economic cycle. Following the
Swiss debt brake model, in the event of
predictions proving overly optimistic,
any unforeseen deficits would have to
be repaid in five years. In the event of
a budget breach 30 days prior to the
beginning of a fiscal year, automatic
freezes should be triggered to tax
thresholds, public pay and welfare.
z Improve the quality and access to data
on comparative costs, public sector
performance and official forecasts.
The Government should commission the
rapid production of simple league tables
on local public sector performance, with
the results included in the new annual
tax statement. The OBR should be given
a new duty of reviewing and updating
policy costings. New government
sponsored prediction markets should
be set up for growth, inflation,
unemployment and tax revenues.
DELIVERING A VALUE FOR MONEY GOVERNMENT

z Cap the total public sector pay bill, but
give public sector employers greater
autonomy to link pay to performance
and local labour market conditions. As in
Sweden, public sector employers should
be allowed to choose the level at which
negotiations take place. In some public
industries, negotiations can take place
between the employee and employer,
while for others remaining at the level of
the workforce.
z Introduce a long term ambition to ensure
every full time worker earn a Living
Income. A mandatory Living Wage would
give the UK near the highest minimum
wage in the OECD, and the majority
of the benefits would go back to the
Treasury rather than to the workers in
higher living standards.1 By contrast, the
difference between the current minimum
wage and the Living Wage is largely
accounted for by taxes on work such as
income tax, employer’s and employee’s
National Insurance Contributions. By
2025, it would be feasible to align the
income tax and national insurance
thresholds, which together with targeted
increases in Universal Credit could ensure
every full time worker took home at least
a Living Income.
Delivering a Value for Money Government – 11
12 – Economics Manifesto
The financial crisis revealed Britain’s underlying weaknesses as well as its strengths: an overdependence on finance and debt, but also a flexible labour market that kept people in work.
Where We’ve Been
Britain has not had an easy decade. As home
to the world’s leading financial centre, Britain
was at the forefront of the damage inflicted by
the financial crisis, punching a 16% hole in the
economy2 and a 14% undershoot in tax.3 While
real public spending increased 59% between
1997 and 2010,4 productivity in public services
flatlined, showing no overall improvement.5
The combination of the two left Britain with
a 10% deficit-to-GDP ratio in 2009–10 the
largest in its post war history,6 second only
to the US out of the G7.7
At the same time, a crunch in global
commodity prices saw world food prices more
than double between 2000 and 2013, and
energy prices rise by 256%.8 As employers
struggled to deal with the growing cost of an
ageing population and unsustainable pension
plans, workers saw more of their salary
diverted out of their pay packet to make up
for the shortfall. The net result was that real
median employee earnings actually fell 1.9%
between 2003 and 2013.9
But then Britain has seen recessions before –
and aspirations to end boom and bust aside,
likely will do so again. While the downturn
has lasted far longer than most, the British
economy is projected to recover the fastest
out of the G7 in 2015.10
The fundamentals of the British economy
remain strong. The UK enjoys one of the
INTRODUCTION

world’s two most important cities,11 two of the
world’s top five universities,12 and a geography
and historic heritage second to none. Decades
of reform from political parties on both the left
and right – increasing competition and helping
people back into work – have left Britain with
one of the most robust and flexible economies
in the world. By maintaining its own currency
and persuading bond markets that it was
serious about deficit reduction, Britain has
kept its destiny in its own hands.
Despite the severity of the recession, Britain’s
flexible labour market adapted to ensure that
the pain was spread out equally. In the past,
less severe recessions have led to hundreds
of thousands being thrown out of work:
unemployment peaked at 8.5% in October
2011, compared to 10.7% in January 1993 and
Introduction – 13
GROWTH UNEMPLOYMENT DEFICIT
REDUCTION
Percentage
Change in
Real GDP
per capita
Rank Percentage
point fall
Rank Percentage
point fall in
structural
deficit
Rank
Canada 5.7 3rd 1.1 5th 1.9 7th
France 1.7 6th –0.8 6th 3.2 4th
Germany 8.8 1st 1.8 3rd 3.0 5th
Italy –4.8 7th –3.6 7th 3.5 3rd
Japan 5.4 4th 1.3 4th 2.3 6th
UK 4.9 5th 2.1 2nd 4.8 2nd
US 8.1 2nd 3.7 1st 5.8 1st
FIGURE 1
Unemployment rate since the financial crisis (Eurostat)
TABLE 1
The report card: The UK economy from 2010–2015 (IMF WEO)13
0
2
4
6
8
10
12
%
14
Euro area (18 countries) United Kingdom
2008 2009 2010 2011 2012 2013 2014

14 – Economics Manifesto
11.9% in March 1984.14 The alternative to slow
growth in wages would have been fast growth
in unemployment; in France, average wages
increased 1% in real terms between 2011 and
2013 compared to a 0.7% fall in the UK15 – but
the cost has been an unemployment rate that
has stubbornly trended up to 10% and beyond.
Meanwhile in Britain the continual falls in the
unemployment rate are overtaking everyone’s
expectations. At 5.9%, the UK unemploy-
ment rate is now nearly half the Euro average
(11.5%), or a quarter the rate of the countries
struggling most from high debt and unre-
formed labour markets, such as Spain (24%)
or Greece (25.7%).16
Markets Work
Since the birth of the Industrial Revolution,
markets and technology have delivered
at least a sixteenfold improvement in the
standard of living.
If you zoom out to look at the medium term,
Britain is doing even better. In 1980, the UK
had the lowest GDP per capita of the G7 – a
legacy of its post war stagnation. Between
1980 and 2007, the UK enjoyed the second
fastest average growth in the G7. While other
countries fell further behind America, the UK
leapfrogged them, ending up third behind
the US and Canada.17 Much of this came from
genuine innovation and efficiency improve-
ments – since 1990, average Total Factor
Productivity growth, the technical measure
of this, has been second only to Germany.18
This was not just the result of an unleashed
financial sector, riding on an unsustainable
bubble of debt and credit: growth and innova-
tion were broadly spread. Between 1998 and
2008, labour productivity grew by an average
4.4% in the financial and insurance sectors,
but grew faster still in chemicals and phar-
maceuticals (5.7%) and the information and
communication sectors (6.4%).19 The last thirty
years have seen Britain develop the world’s
largest computer processor designer; continue
its pre-eminence in aeronautics, oil and cars;
France Germany Italy UK Canada Japan
1946 1956 1966 1976 1986 1996 2006
30
40
50
60
70
80
90
100
0
10
20
FIGURE 2
The post war UK economy (GDP per capita, US = 100, Maddison Project Database)

Introduction – 15
become a leading cultural centre with London
regularly crowned fashion capital; Pinewood
and Soho giving Hollywood a run for their
money;20 and, video game developers in
Leeds and Edinburgh reaching £1 billion in
revenue faster than any other entertainment
product ever.21
Markets and technology are still working
together to create a better world. This is the
same recipe, unleashed first in Britain at the
advent of the Industrial Revolution, that has
delivered at minimum, a factor of sixteen
improvement in the average standard of
living.22 It was markets, not government, that
has allowed households over the last sixty
years to reduce the amount of the average
household budget that goes on food by 71%,
clothing by 54%, and fuel by 27%.23
In the short term, markets reward entrepre-
neurs that create and distribute new products
that consumers want. But in the long run,
ideas are the ultimate shared resource,
impossible to fully protect. Inevitably, new
competitors emerge, bidding down profits
and ensuring that the benefits are passed onto
the many. Unlike some of the dire predictions
from the economists of the day, wealth did
not coalesce with the rich capitalists after
the Industrial Revolution, leaving the workers
on starvation wages. Since 1830, the real size
of the economy has increased by a factor
of around thirty;24 the population tripled
and average earnings increased by a factor
of ten.25 Everyone has shared in the wider
benefits of growth, from clean drinking water,
indoor heating, abundant entertainment,
doubled life expectancy (40 years to 80),26
and an average working week half as long
(60 hours to 30).27
Where the Economy is Going
Technology and trade will continue to revo-
lutionise the world. As long as we remain
friendly to businesses and workers, both
domestic and foreign, Britain is well placed
to prosper.
This process is still continuing. Ten years ago,
we did not have iPhones, Kindles, contactless
payment, Bitcoin, the Tesla Model S, induced
pluripotent stem cells, Google Maps, Twitter
or YouTube. Despite its hardships, measured
broadly, the last ten years was easily the
greatest decade in human history. Between
2002 and 2011, the number of absolute poor
in the world fell on net by 620 million, over a
third. (Between 1981 and 1993, it fell by just
19 million.)28 In the UK, the last decade or so
has seen life expectancy at birth increase by
another two to three years,29 recorded crime
It was markets, not government, that has allowed households over the last sixty years to reduce the amount of the average household budget that goes on food by 71%
16 – Economics Manifesto
in England and Wales has fallen by over a
third30 and the number of days when air pollu-
tion is moderate or higher, halved.31 For each
of the successive three years that the ONS
have so far been reporting data, Britons have
reported being more satisfied with their lives
and finding them more worthwhile, while the
average day is happier and less anxious.32
Neither is this process likely to stop in the
future. In the coming decades, technology
looks set to drive our cars, personalise our
medicine, and democratise access to the
world’s best teachers or doctors. While it is
destroying old jobs, it has also created new
roles, often better paid and more interesting.
By taking over the routine parts of a job,
it allows workers to be more autonomous,
creative and social. Already, new technologies
are making it easier for internet entrepreneurs
to start new businesses from their bedrooms;
to match the supply and demand for spare
car rides, bedrooms, errands or tools in the
Sharing Economy; to learn new skills from
Udacity or Lynda. Despite many fashionable
current fears, Britain is likely to continue to
grow. Even if technology was to completely
stagnate, we know that Britain could improve
its productivity by about a quarter – the
current difference with the US.
But technology is not the only thing changing
the world.
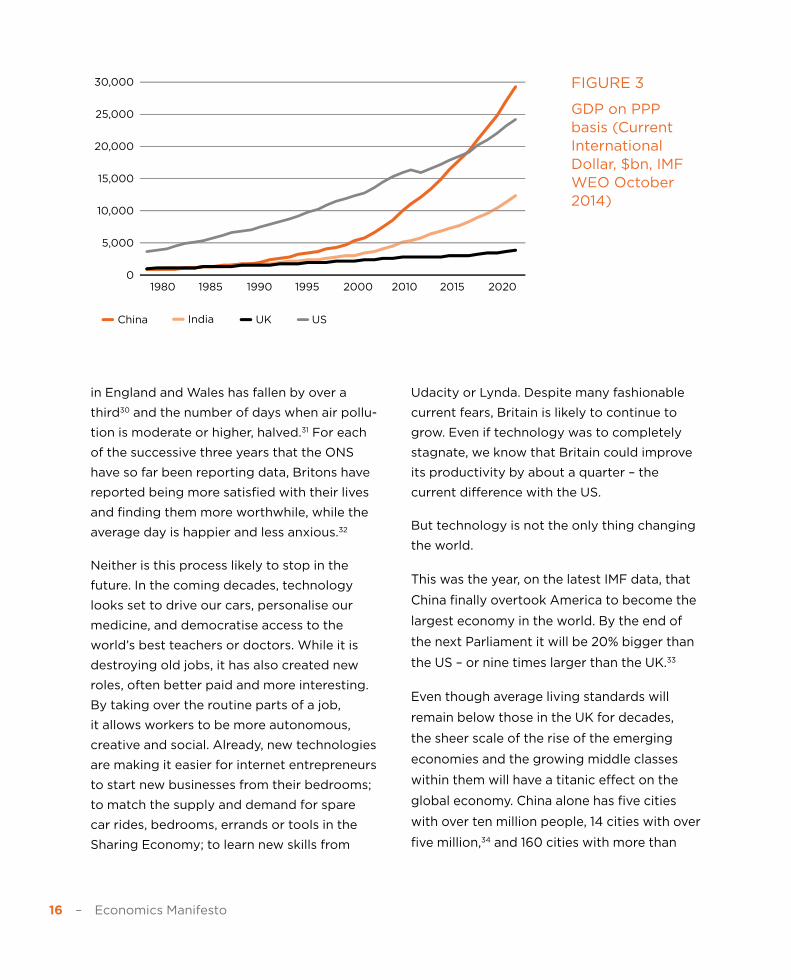
This was the year, on the latest IMF data, that
China finally overtook America to become the
largest economy in the world. By the end of
the next Parliament it will be 20% bigger than
the US – or nine times larger than the UK.33
Even though average living standards will
remain below those in the UK for decades,
the sheer scale of the rise of the emerging
economies and the growing middle classes
within them will have a titanic effect on the
global economy. China alone has five cities
with over ten million people, 14 cities with over
five million,34 and 160 cities with more than
FIGURE 3
GDP on PPP basis (Current International Dollar, $bn, IMF WEO October 2014)
China India UK US
1980 1985 1990 1995 2000 2010 2015 2020
10,000
15,000
20,000
25,000
30,000
0
5,000
0.0 0.5 1.0 1.5 2.0 2.5 3.0 3.5 4.0 4.5 5.0
UK
Scotland
Wales
South West
South East
London
East of England
West Midlands
East Midlands
Yorkshire and The Humber
North West
North East
Introduction – 17
one million.35 Chinese consumers are already
starting to have an impact, with Hollywood
blockbusters shooting extra bonus scenes
for them and 114 million Chinese tourists
expected to travel abroad this year.36 One
recent estimate suggested that tourism from
China would be worth £1bn a year to the UK
economy by 2017 – approximately double
its current value.37 In the past, globalisation
has increased the pressure for companies
to outsource or replace their workers with
machines. In the future, it is likely to create
a boom in demand for British products from
the emerging global middle class. It is a good
time to be an exporter of high-end Scottish
whisky, luxury Land Rovers or viewing rights
to Premier League football.
By increasing the size of the market, the rise
of the emerging economies is creating a more
competitive world – but it is far from the only
factor. The digital revolution, more integrated
financial markets and cheaper logistics are
all continuing the (at least) two hundred
year trend towards the death of distance.
Companies are often as exposed to competi-
tion from a rival in a bedroom in Palo Alto or
Bangalore as the next town along. Increased
trade has increased consumer choice, driven
up productivity in Britain and created a more
equal world.
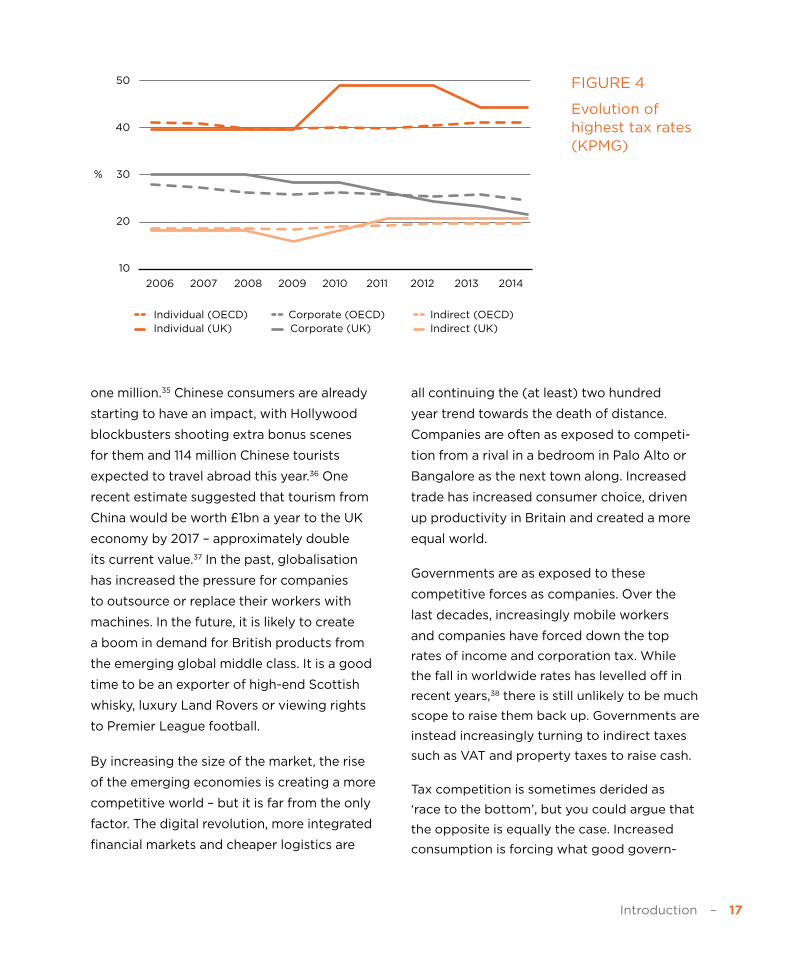
Governments are as exposed to these
competitive forces as companies. Over the
last decades, increasingly mobile workers
and companies have forced down the top
rates of income and corporation tax. While
the fall in worldwide rates has levelled off in
recent years,38 there is still unlikely to be much
scope to raise them back up. Governments are
instead increasingly turning to indirect taxes
such as VAT and property taxes to raise cash.
Tax competition is sometimes derided as
‘race to the bottom’, but you could argue that
the opposite is equally the case. Increased
consumption is forcing what good govern-
0
2
4
6
8
10
12
14
United Kingdom
2008 2009 2010 2011 2012 2013 2014 20
30
40
50
10
2006 2007 2008 2009 2010 2011 2012 2013 2014
Individual (OECD) Individual (UK)
Indirect (OECD) Indirect (UK)
Corporate (OECD) Corporate (UK)
%
0.0 0.5 1.0 1.5 2.0 2.5 3.0 3.5 4.0 4.5 5.0
UK
Scotland
Wales
South West
South East
London
East of England
West Midlands
East Midlands
Yorkshire and The Humber
North West
North East
FIGURE 4
Evolution of highest tax rates (KPMG)
18 – Economics Manifesto
ments should be doing anyway: decreasing
the tax on work, business and investment,
and if necessary making up the difference
with higher taxes on consumption. Just as
in business, lower prices aren’t everything,
neither are lower taxes – California, for
example, has among the least competitive
taxes in the US39 – but if you want to charge
more, you have to make sure that you’re worth
it. If you want to have higher taxes, you have
to have other reasons why your economy is
more attractive than its competitors.
There is no reason why Britain cannot take
advantage of this future and thrive. To repeat
a familiar list, it still has advantages most
other countries would kill for: historical global
links, and a convenient geography, between
the US and Asia; a highly skilled, creative and
flexible workforce; a disproportionate share of
the world’s best universities, scientists, artists
and entrepreneurs; a young, cosmopolitan
and growing population; its own currency,
low taxes and low corruption in government;
and a reputation as the world’s leading global
city for finance or culture. Britain has always
thrived best as a trading crossroads for the
world; Hollywood may be shooting extra
scenes for the audiences in Beijing, but it
is Leicester Square where they put on their
world premiere.
On the other hand, we shouldn’t get too
complacent. While we remain near the top of
the league tables, most independent indices
of economic competiveness show stagnation,
if not deterioration over the last decade: the
Heritage Foundation’s Index of Economic
Freedom has the UK down from 77.7 to 74.9
between 2004 and 2014, the Fraser Institute’s
Level of Economic Freedom has the UK down
from 8.1 to 7.81 between 2002 and 2012,
and the World Economic Forum’s Global
Competitiveness Index has fallen from 5.6 in
2006–7 to 5.4 in 2013–14.40
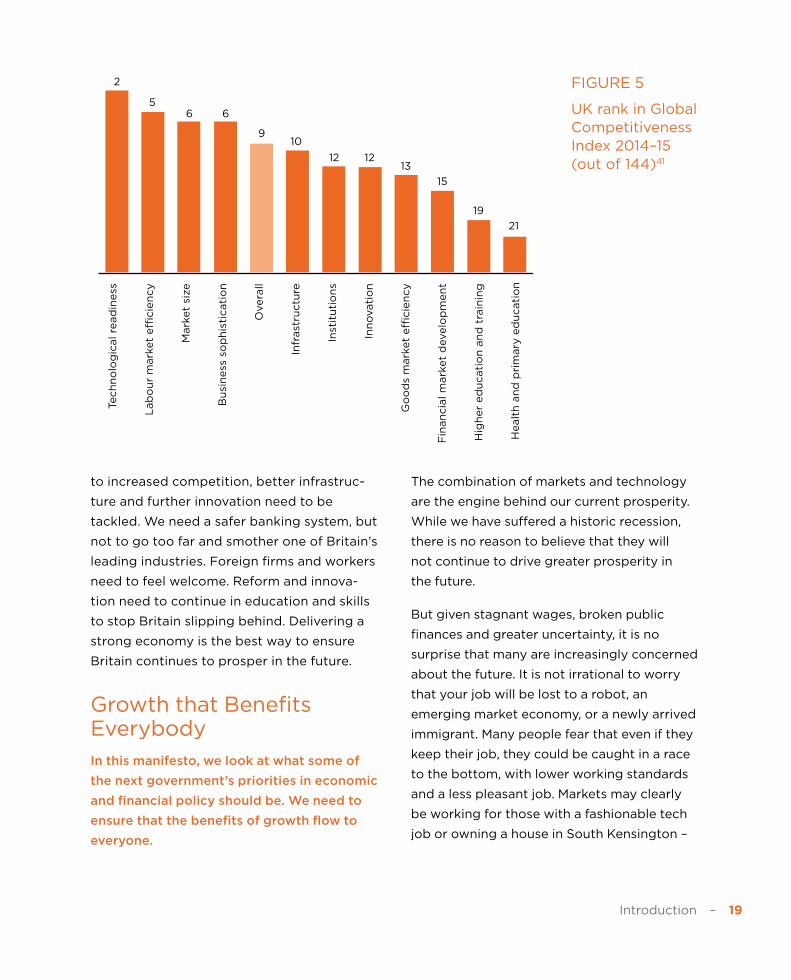
In particular, the most recent Global
Competiveness Index gives a fair picture of
the British economy’s strengths and weak-
nesses. The UK is good with technology – it
has the 2nd highest level of ICT uptake in the
world and enjoys sophisticated businesses
and a flexible labour market. It has good, if
not great, infrastructure and goods markets,
and lags a little in providing access to finance
and the quality of parts of its education
system.
In short, to take full advantage of the oppor-
tunities in front of Britain, future govern-
ments need to continue the hard work of
gradual reform. Britain’s tax system remains
inconsistent and overly focussed on business.
The regulatory, planning and financial barriers
Introduction – 19
to increased competition, better infrastruc-
ture and further innovation need to be
tackled. We need a safer banking system, but
not to go too far and smother one of Britain’s
leading industries. Foreign firms and workers
need to feel welcome. Reform and innova-
tion need to continue in education and skills
to stop Britain slipping behind. Delivering a
strong economy is the best way to ensure
Britain continues to prosper in the future.
Growth that Benefits Everybody
In this manifesto, we look at what some of
the next government’s priorities in economic
and financial policy should be. We need to
ensure that the benefits of growth flow to
everyone.
The combination of markets and technology
are the engine behind our current prosperity.
While we have suffered a historic recession,
there is no reason to believe that they will
not continue to drive greater prosperity in
the future.
But given stagnant wages, broken public
finances and greater uncertainty, it is no
surprise that many are increasingly concerned
about the future. It is not irrational to worry
that your job will be lost to a robot, an
emerging market economy, or a newly arrived
immigrant. Many people fear that even if they
keep their job, they could be caught in a race
to the bottom, with lower working standards
and a less pleasant job. Markets may clearly
be working for those with a fashionable tech
job or owning a house in South Kensington –
2
56 6
910
12 1213
15
19
21
Go
od
s m
ark
et
eff
icie
ncy
Tech
no
log
ical re
ad
iness
Lab
ou
r m
ark
et
eff
icie
ncy
Mark
et
size
Bu
sin
ess
so
ph
isti
cati
on
Overa
ll
Infr
ast
ructu
re
Inst
itu
tio
ns
Inn
ovati
on
Fin
an
cia
l m
ark
et
develo
pm
en
t
Hig
her
ed
ucati
on
an
d t
rain
ing
Healt
h a
nd
pri
mary
ed
ucati
on
FIGURE 5
UK rank in Global Competitiveness Index 2014–15 (out of 144)41
20 – Economics Manifesto
but the benefits can be a lot more hidden
for those who have lost their job in Britain’s
manufacturing heartlands or seen their
income fall behind their friends who moved
to London.
The last five years of economic policy were
largely dominated by the aftermath of the
financial crisis. Any party in power would have
had to focus their energy on major spending
cuts and reformed financial regulation. The
Eurozone crisis delayed the eventual recovery
that now seems relatively embedded, while
the priority for policy had to be to reduce
unemployment.
The next five years should see the focus shift
towards preparing for the future. Technology,
globalisation and longer life spans will create
a better world – but policymakers need to
ensure that growth does benefit everybody,
delivering inclusive growth for all.
In this manifesto, we look at the three big
areas that will determine our economic future:
z Growth. While markets have
revolutionised large sections of our
economy, delivering innovation and
cheaper prices, too many other areas
are protected behind regulation from
effective competition. Many of the
biggest items on household budgets
have remained stagnant and expensive
including energy, transport and housing.
How do we take advantage of Britain’s
unique opportunities and introduce
a supply side agenda to support
innovation, competition and trade?
z Savings. Markets benefit not just
workers, but savers and entrepreneurs
too. Unfortunately savings are even
more tightly concentrated than income
in Britain, and a large proportion of
them are being funnelled into ever
rising housing prices and asset bubbles.
How can we create a capital-owning
democracy, ensuring that the benefits
of growth are widely spread?
z Government. While markets and
technology have revolutionised the
private economy, they remain poorly
utilised in government. In too many areas
of the public sector, we do not know
what we are getting for our money – and
given that tax is the largest household bill
for nearly everyone, that matters greatly
for the standard of living. Considerable
work is required to balance the budget,
but even when that is achieved, how
do we ensure it stays that way?
Technology, globalisation and longer life spans will create a better world – but policymakers need to ensure that growth does benefit everybody, delivering inclusive growth for all

Growth – 21
In order to keep improving living standards and cut the cost of living, Britain needs higher productivity, more disruptive innovation and greater levels of competition.
“Give the losers leave to speak”
For over a hundred years, the watermen
of the Thames had enjoyed the exclusive
right granted to them by Henry VIII to ferry
London passengers up and down the capi-
tal’s main artery.42 Far from an easy job, new
recruits were expected to undertake a seven
year apprenticeship, learning the customs
and currents of the Thames.43 Fares were
standardised to protect the public, and the
watermen were expected to pay a quarterly
fare to support their guild.
But by the beginning of the seventeenth
century, the watermen were facing a new
competitive threat to their ability to ‘ply for
hire’: the arrival of the Hackney horse and
carriage. As one waterman complained in a
pamphlet entitled The World Run on Wheels,
“they have undone my poor trade whereof I am a member: and though I look for no reformation yet I expect the benefit of an old proverb, ‘Give the losers leave to speak.’”44
Trying to maintain their popularity, by 1635
the watermen had persuaded King Charles I
to ban “any hired coach be used or suffered in
London.”45 But the new technology proved too
popular with Charles’ subjects, and by 1637
he’d been forced to allow “a small competent
number.”
Over the next two hundred years, this cap was
gradually expanded, although fares remained
fixed by an Act of Parliament. For eighteen
years between 1833 and 1851, the total number
of licences issued was uncapped – but then
in 1851, believing that “too many of London’s
GROWTH

22 – Economics Manifesto
Cabbies did not have a good enough topo-
graphical knowledge of this great city”,46 new
licencing standards were introduced. The
Knowledge was born.
Progress does not always depend on techno-
logical innovation. The arrival of the Hackney
cab was less about any improvement in
carriage design, and more about a few nobles
wanting to make extra cash from hiring out
the spare carriage they had lying around.
Today, we’d call it an example of the Sharing
Economy: disruptive start-ups undercutting
an old monopoly.
In the long run, growth is the best way to
raise living standards for everyone. But in the
short and medium term, most innovations,
even those coming solely from new business
models, create losers. Often those losers seek
to use a political process – either in govern-
ment or simply within the bureaucracy of
a large organisation – to halt change. The
easiest way to do this is often to ban your
competition.
But Britain cannot afford to stand still. Our
productivity per hour remains around 20%
below the G7 average.47 Some of our leading
industries like the North Sea Oil or the finan-
cial sector appear to be in a relative long
term decline, while too many of our cities are
dependent upon the public sector to prop
them up. We desperately need sustainable
breakthroughs in renewable energy, cheaper
healthcare and low carbon transport. While
globalisation can serve as an enormous
opportunity for British exporters, our current
trade links with many emerging economies
are weak.
How do we catalyse faster growth while
ensuring the benefits go to everybody?
The End of Invention?
While not sufficient on its own, a thriving
culture of science and technology is still
necessary to drive higher productivity growth.
For all the recent fashionable talk of stagna-
tion in the wider economy, advances in basic
science keep adding up. Over the last ten
years, the cost of sequencing a genome fell
by a factor of 4,000,48 while installed capacity
of solar photovoltaic capacity is up near forty
times over.49 3D printing and UAV drones have
become widespread, while ubiquitous access
to personal computers, mobile broadband and
GPS tracking have become old hat. In the last
year, scientists have demonstrated, among
other things, the reversal of ageing,50 direct
electronic brain-to-brain communication,51 and
a dishwashing robot.52 We are a very long way
from the end of invention.

Growth – 23
British science and engineering are at the
forefront of many of these advances. A
recent study for BIS concluded that the UK
had overtaken the US to become number one
amongst comparable countries in terms of
‘field-weighted citation impact’, a measure
of research quality, while remaining also the
most productive nation per amount spent on
R&D. After the US and China, the UK has the
third highest share of world research articles,
around 6.4%.53 The current Government has
identified eight key technologies in which
it believes Britain could develop world
leading industries: big data and energy
efficient computing; satellites and commer-
cial applications of space; robotics; life
sciences; regenerative medicine; agri-science;
advanced materials and nano-technology;
energy and its storage.54
Industrial strategy means different things to
different people. Almost nobody, however,
disagrees that there is a role for government
in subsiding basic research and science;
supporting research, investment, entrepre-
neurship and start-ups through targeted
tax breaks and streamlined regulation;
and providing platforms to bring together
academia and business to discuss future
trends and roadmaps.
While the state of British science and inno-
vation is healthy, it is not perfect. Academia’s
choice of research subjects remains largely
autonomous. Under the Haldane Principle,
politicians do not interfere with the allocation
of funding, leaving the decision over what to
research to researchers themselves. However,
political autonomy should not be an excuse
for a lack of accountability. Too much of
publically funded research fails basic repli-
cation, with widespread evidence of confir-
mation bias in data selection and analysis
(“p-hacking”).55 Individual journals have little
incentive to double-check attention catching,
exciting results. Equally, while the Government
is unlikely to do very well at picking winners,
it could certainly do more to encourage the
winners it wants through the wider spread
and use of prizes.
Britain has still not fully addressed its
weakness in transitioning from the lab to
the market. There remains a ‘valley of death’
between science and eventual commercial
application – the combined costs of capital
and regulation make it much easier to start a
web app or a marketing agency than build a
new gadget. Britain lacks the strength of the
American or Israeli Venture Capital industry,
or the lenient bankruptcy law and tolerance
of failure that has helped fuel Silicon Valley.
After the US and China, the UK has the third highest share of world research articles, around 6.4%

24 – Economics Manifesto
The good news is that new technology is
helping to close the difference: it has never
been easier to raise your seed capital through
Kickstarter, use a 3D printer for your initial
prototype and then outsource manufac-
turing through Alibaba. Nevertheless, the
Government could arguably do more to
help take new products to market.
For all the power of technology, it cannot
automatically change the world on its own.
For one thing, it is often blocked through a
combination of public mistrust of the new and
overzealous application of the precautionary
principle: think bitcoin, GM foods, e-cigarettes
or hydraulic fracking. Out-of-date regulation is
used by incumbents as a barrier to block new
competition. Equally importantly, technology
needs to be paired with a market need, and
continually refined to overcome implemen-
tation obstacles. In the entrepreneur cliché:
good ideas are useless without execution.
To truly fulfil technology’s potential, you need
something else.
Competition
Competition is the most powerful tool we
know to increase productivity, reduce the
cost of living and tackle inequality. Too
much of Britain’s economy remains overly
protected behind government created
barriers. The good news is that technology
also offers the opportunity to spread compe-
tition to other sectors.
The record of twentieth century Industrial
Policy was, to put it mildly, far from an unqual-
ified success. 1930s government encourage-
ment for companies to merge into cartels led
to inefficient firms, poor management and
low productivity in the post war years. The
more concentrated the industry, the more it
was likely to be behind its American rivals,
where competition policy remained stronger.56
According to one survey, “industrial subsi-
dies were an almost unmitigated failure”.
Post-war ‘national champions’ became
international jokes (British Leyland), never
achieved commercial success (Concorde) or
saw efficiency fall by a third (the expansion of
the machine tools company Alfred Herbert).
Perhaps unsurprisingly, the main effect of
creating new monopolies was to increase
profits and raise prices for their customers.57
Where the old style industrial policy went
wrong was not just that it tried to predict the
future – but that it underestimated the impor-
tance of competition.
Competition matters for two big reasons.
The first is innovation. While there are some
things you can test in a lab, there are many

Growth – 25
more that you can only work out with trial and
error, rapid feedback and the incentives that
markets bring. Academic experts can tell you
the date of the next eclipse or the trajectory of
a rocket, but they are far worse at predicting
the success of a product, consumer demand or
even the potential uses of a new technology.
Worse still, confirmation bias and simple
pride make it very hard for top-down hierar-
chies to change course after their underlying
assumptions have been challenged. There is a
reason that large, old monopolies keep getting
disrupted by smaller, nimbler start-ups – the
average life of a company on the S&P 500 has
fallen by 70% in the last fifty years58 – and this
is not down to their lack of capital, long term
plans or generous R&D budgets.
Competition keeps companies honest,
encourages everyone to work hard and ruth-
lessly eliminates those who can’t keep up.
Abandoning the post-war cartels increased
labour productivity by 20% in the subsequent
decade.59 It is estimated that 90% of the effi-
ciency improvements in UK manufacturing
between 1980 and 1992 came about from
inefficient plants shutting down, which in
turn was significantly influenced by external
competition.60
But the second reason competition matters is
just as important as the first: equality.
Competition, or the potential for it, is the force
that ensures that the benefits of economic
growth are widely spread. The threat of new
entrants ensures that profits get bid down.
No entrepreneur captures all, or for that
matter, most of the value created by their
innovation – one estimate put the proportion
captured by innovators at 2.2%.61
Equally, competition ensures that everyone’s
wages rise. The technology and skills needed
to be a barber have not changed significantly
in hundreds of years, which is one reason why
the average barber or hairdresser earns 41%
of the median wage.62 But equally, the poten-
tial for barbers to go find some other line of
work ensures their wages keep going up. 41%
of today’s median wage still works out to be
nearly four times the median wage of two
hundred years ago.63
Arguably both the most important and
successful supply side reform in the post war
era came from the expansion of competition
that began worldwide in the 1970s. Airline
deregulation in America saw prices fall 20%,
and opened the door for new, low cost oper-
ators.64 Privatisation and the introduction of
competition in energy and gas saw produc-
tivity rates spike, and helped electricity bills fall
25% in real terms between 1990 and 2004.65
Competition, or the potential for it, is the force that ensures that the benefits of economic growth are widely spread

26 – Economics Manifesto
While most economists now accept that the
increase in product market competition was
a key factor behind Britain’s resurgence in
the 1980s and 1990s,66 it is less commonly
recognised that competition is still the
most powerful tool by which to increase
productivity. A major reason the UK is often
measured as having worse management than
the US is a long tail of inefficient companies.67
More effective competitive competition would
drive these resources somewhere they could
be better used.
If you look at the average household expen-
diture, their largest categories of spending
are in tax, food, housing, energy and trans-
port. These are all also areas where prices
are largely under the control of government,
rather than market competition. Excluding
tax, these areas make up around 34% of the
average household expenditure – or just under
half for the poorest decile.68 There are often
good reasons why governments impose regu-
lation, even if it has the downside of limiting
competition. However, new technology also
has the potential to sidestep many of these
old trade-offs: opening up the potential for
new entrants, defeating old barriers to entry
and providing replacements for inevitably
clunky regulation. Crypto currencies, Apple
Pay and Kickstarter are more likely to revolu-
tionise the financial sector than more nuanced
capital requirements. Peer-to-peer online
reviews, persistent GPS and constant commu-
nication do more to ensure online quality and
Bottom 10% All
12%
14%
16%
18%
8%
10%
4%
6%
0
2%
Fo
od
& n
on
-alc
oh
olic
dri
nks
Alc
oh
olic
dri
nk, to
bacco
& n
arc
oti
cs
Clo
thin
g &
fo
otw
ear
Rest
au
ran
ts &
Ho
tels
Ren
t &
mo
rtg
ag
e
En
erg
y, w
ate
r an
d h
ou
sin
g m
ain
.
Ho
use
ho
ld g
oo
ds
& s
erv
ices
Healt
h
Tra
nsp
ort
Co
mm
un
icati
on
Recre
ati
on
& c
ult
ure
Ed
ucati
on
Oth
er
0.0 0.5 1.0 1.5 2.0 2.5 3.0 3.5 4.0 4.5 5.0
UK
Scotland
Wales
South West
South East
London
East of England
West Midlands
East Midlands
Yorkshire and The Humber
North West
North East
FIGURE 6
Household expenditure (ONS)

Growth – 27
safety than regulatory standards. The rise of
new technologies look set to increase compe-
tition and lower prices in finance, transport,
logistics, health and more.
Perhaps the biggest overall systematic
barrier to improved competition and produc-
tivity comes from our overly restrictive
planning system. Planning makes it harder
for new firms to enter a market and for infra-
structure to expand rapidly to enable supply
and for workers to go where the jobs are.
Most obviously, it prevents the UK from fully
capitalising on the success of Europe’s most
successful conglomeration in the South East.
Just as important, however, is that it has
almost certainly slowed growth in cities like
Manchester through shortages in houses and
office stock. The cost of regulation on office
developments is equal to 250% of develop-
ment costs in Birmingham, let alone London
(400% to 800%), compared to only 0–50%
in New York.69 One study found that since the
1980s, planning policies have restricted effi-
ciency improvements in the retail sector
by 25%.70
Competition doesn’t have to be solely
domestic. Often the most important compe-
tition comes through freer trade. The inter-
national sharing of ideas, businesses, capital,
customers and workers has made us all richer.
Much of the strength of economic hubs comes
not from the inherent brilliance of the natives,
but from acting as a crossroads and lodestar
for the best and brightest from across the world.
While there has been progress in recent years,
the UK’s export market currently remains
largely reliant on Europe – a significant reason
why Britain got dragged into the fallout
from the Euro crisis. The emerging markets
present a huge opportunity for British firms
in the future, with their collective growth
FIGURE 7
Share of British exports (UK Trade Info, RTS)
30%
40%
50%
60%
70%
80%
90%
100%
0
10%
20%
199
6
199
8
20
00
20
02
20
04
20
06
20
08
20
10
20
12
European Community
Asia and Oceania
Eastern Europe Latin America and Caribbean
Middle East and N Africa
North America
Sub-Saharan Africa
Western Europe exc EC Low Value Trade

28 – Economics Manifesto
expected to outstrip that of the advanced
economies.71 In the first three quarters of
2014, 52% of British exports have gone to the
European Community, compared to 15% for
North America, or 1% for India. Over the last
five years, the share of exports to China has
roughly doubled from 2% in 2008 to 3.9%
in 2013.72
The 99%?
Ensuring everyone feels they have a stake
in the future is the best way to prevent new
barriers to innovation from being created.
If one group has done particularly well over
the last few decades, it has been superstars.
Together, technology and trade have made
it easier than ever before to leverage your
talents to a global audience. There has never
been a better time to be a hedge fund analyst,
Premiership footballer or entrepreneurial CEO.
Since 1981, on economist Thomas Piketty’s
data, the top 1% has increased their share of
income share by eight percentage points, with
half of that going to the top 0.1%.73
In fact, while the gains might not be quite as
spectacular, anyone with high skills rewarded
by the market has done pretty well. The share
of the rest of the top 10% of incomes has
increased by 2.5%.74 Despite the proportion
of graduates in the population more than
doubling since 1992,75 male possessors of
undergraduate degrees are still expected to
earn a 28% lifetime earnings premium over
those with only A-Levels, while the female
premium is 53%.76 Unemployment rates for
graduates are half than for those without a
degree.77 Jobs have become not just better
paid, but often more pleasant with more
flexibility and greater autonomy.
However, for those without the right skills,
economic change has not been all unqual-
ified good news. ‘Routine’ jobs, whether in
clerical work or in industry, have increasingly
become automated or outsourced. While
FIGURE 8
Income share % (Piketty)
30%
40%
50%
60%
70%
80%
90%
100%
0
10%
20%
190
8
1918
1928
193
8
194
8
195
8
196
8
1978
198
8
199
8
20
08
Bottom 90%Top DecileTop 1%Top 0.1%

Growth – 29
there is still an abundance of low skill jobs
– say, bar staff, checkout operators or shelf
stackers – between 1979 and 2007 the number
of boring and drilling machine setters fell
94%, face-trained coal miners fell 93% and
grinding machine setters and operators fell
86%.78 Employment in manufacturing has
been in decline since 1999, and is expected to
continue to shrink by 1% a year until 2022.79
That is not to say that the sector itself has
been in decline. Manufacturing productivity
has grown on average by 2.8% per year since
1948, but it is the labour markets of many
regions, from former industrial hubs to old
seaside towns, that have yet to adjust to the
structural transformations in the economy.80
All that said, the idea of ‘stagnation’ can be
overstated. There is no long term decoupling
between productivity improvements in the
economy and average wages.81 The top has
benefitted most from the last few decades in
terms of income, but the difference in growth
between the top and bottom quintile is less
than the overall improvement enjoyed by
everyone. While many of the old “middle jobs”
Bottom 2nd 3rd 4th Top AllHouseholds
86%
107% 107%115%
154%
124%
FIGURE 9
Increase in real household disposable income between 1977 and 2012–13 (ONS)
FIGURE 10
Recent changes in real household disposable income (ONS)
7%
3%
2% 2% 2%
-2%-1%
-4% -4%
-5% -5%
7%
Bottom 2nd 3rd 4th Top All
Between 2002–3 and 2012–13 Between 2007–8 and 2012–13
30 – Economics Manifesto
have disappeared, they have equally been
replaced by new jobs. Even if their old occu-
pation disappears, the vast majority of people
succeed in finding new work. You do not have
to be a superstar to enjoy the best of today’s
technology (smartphone possession is already
90% for 18–24 year olds),82 entertainment,
medicine or education.
The most important reasons for recent wage
stagnation are not long term structural flaws
in the market economy, but instead short
term blows: the impact of the financial crisis,
the world commodity crunch and the transi-
tion to sustainable pensions. In other words,
growth and improving productivity remain
the best way to improve the living standards
of the many.
However, the coming decades will put even
greater pressure on our economy and welfare
system to enable career transition for adult
workers. One study estimated that 47% of US
jobs were at high risk of being “automated
relatively soon, perhaps over the next decade
or two”.83
If we don’t find ways of making everyone feel
they have a stake in the future, we will end up
with modern equivalents to the watermen –
seeking to use politics to block new competi-
tion, and preserving the old careers they have
become accustomed to.
Recommendations: Creating the Most Innovative and Competitive Economy in the World
In the words of Paul Krugman, productivity
isn’t everything, but in the long run it is
almost everything.
In the long run, the official economic forecasts
from the OBR assume that our labour produc-
tivity will grow by 2.2% per hour – its historical
average between 1971 and 2008.84 The pause
in productivity growth that we have seen since
the financial crisis in 2008 will come to an end,
and our economy will continue its upward
progress. The optimistic gloss on this view is
that even a once in a half century recession
is unlikely to have permanently damaged our
ability to improve. Growing by 2.2% a year is
equivalent to doubling in just over thirty years.
The more pessimistic view is that politicians
have little influence on productivity, either
good or bad – but this interpretation is hard to
believe. Almost every day we see the markets
react as some initiative of a politician, or
central bank alter the long term prospects of
the economy. While remaining cautious and
humble in our forecasts, we shouldn’t simply
accept 2.2% as a number impossible ever to
better or improve. Raising this number is ulti-
Growth – 31
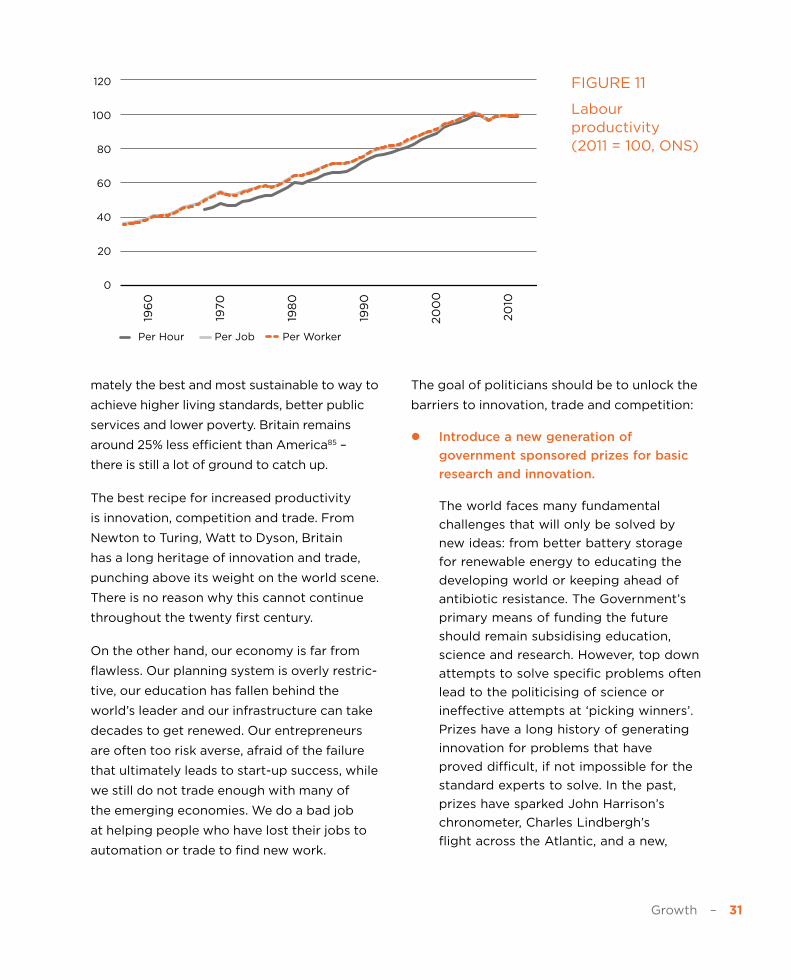
mately the best and most sustainable to way to
achieve higher living standards, better public
services and lower poverty. Britain remains
around 25% less efficient than America85 –
there is still a lot of ground to catch up.
The best recipe for increased productivity
is innovation, competition and trade. From
Newton to Turing, Watt to Dyson, Britain
has a long heritage of innovation and trade,
punching above its weight on the world scene.
There is no reason why this cannot continue
throughout the twenty first century.
On the other hand, our economy is far from
flawless. Our planning system is overly restric-
tive, our education has fallen behind the
world’s leader and our infrastructure can take
decades to get renewed. Our entrepreneurs
are often too risk averse, afraid of the failure
that ultimately leads to start-up success, while
we still do not trade enough with many of
the emerging economies. We do a bad job
at helping people who have lost their jobs to
automation or trade to find new work.
The goal of politicians should be to unlock the
barriers to innovation, trade and competition:
z Introduce a new generation of
government sponsored prizes for basic
research and innovation.
The world faces many fundamental
challenges that will only be solved by
new ideas: from better battery storage
for renewable energy to educating the
developing world or keeping ahead of
antibiotic resistance. The Government’s
primary means of funding the future
should remain subsidising education,
science and research. However, top down
attempts to solve specific problems often
lead to the politicising of science or
ineffective attempts at ‘picking winners’.
Prizes have a long history of generating
innovation for problems that have
proved difficult, if not impossible for the
standard experts to solve. In the past,
prizes have sparked John Harrison’s
chronometer, Charles Lindbergh’s
flight across the Atlantic, and a new,
FIGURE 11
Labour productivity (2011 = 100, ONS)
20
40
60
80
120
100
0
196
0
1970
198
0
199
0
20
00
20
10
Per Hour Per Job Per Worker

32 – Economics Manifesto
accelerating private space industry.
Instead of the top down process of
grants, prizes are open, allowing a
solution to come from any and often
unexpected directions. The Government
should massively expand the current
Longitude Prize programme, and
catalyse a new generation of prizes to
tackle our biggest challenges in energy,
the environment, health and education.
z Regulatory policy should aim at enabling
permissionless innovation, rather
than trying to satisfy an unachievable
precautionary principle.
New technologies create new dangers.
There is always a place for well-targeted
regulation to increase consumer
confidence, clarify standards and make
fraud harder. However, the “precautionary
principle” can all too often become an
excuse for protecting incumbents, overly
extreme risk aversion or sometimes just
plain luddism. All too often, worst case
scenarios get used as an excuse to
block the entrance of new competitors,
or create a bureaucratic chilling on a
new innovation.
While preserving high standards
of safety, we should aim to enable
permissionless innovation, creating
contained areas where innovators can
experiment. The biggest danger to our
health, safety and the environment
comes from too slow rather than too
fast progress on GM crops, new drugs,
or new energy supplies. Self-driving cars
will almost certainly create new types
of accidents – but they will also save
thousands of lives.
z Introduce a Presumption against
Interference in the planning system, with
residents rather than officials acting as
quality control.
Property is not a perfect free market:
the decision to build a new housing
estate or open a 24 hour club can affect
others’ quality of life too. However, our
seventy year strategy of trying to resolve
these trade-offs through top down
planning has not only failed, it has had
much wider knock-on effects on our
economy. Our restrictive planning system
has led to smaller and more expensive
houses, higher living costs, and a less
dynamic economy.
Instead of trying to plan an inevitably
unknowable future, we should rely on
local residents rather than bureaucrats
to act as the quality control. We should
introduce a Presumption Against
Interference that people are free to do
as they will with their property except
where clear justification or requirement
for intervention exists. Change of Use
The biggest danger to our health, safety and the environment comes from too slow rather than too fast progress on GM crops, new drugs, or new energy supplies

Growth – 33
restrictions should be limited to clear
externalities, and local plans should be
drastically stripped back: no density
targets, or top down regulation of
minutiae like car spaces, bike standards
or the number of hotel rooms. If less
than half of the people in the immediate
vicinity (numerically or in terms of floor
space) object, planning permission
should automatically be granted subject
to appropriate compensation.
z Introduce a new supply side agenda
to tackle monopoly rents, increase
competition and cut the cost of living.
In the long run, by driving innovation,
greater supply and higher efficiency
markets drive down prices and
bring about a lower cost of living for
consumers. The 2000s saw a temporary
reverse of this long term pattern, as the
world as whole experienced a boom in
commodity prices. The good news is that
in many areas this is already going into
reverse, with oil prices having more than
halved over the last year and the savings
starting to feed through to household bills.
Nevertheless, while markets often get
unfairly blamed for things that are
beyond their control, we could still do
more to ensure greater competition
and lower costs for consumers. Too
many areas of the UK economy
remain dominated by cosy oligopolies
and restricted supply. Network Rail,
for example, could be broken into
eight regional companies to increase
competition and efficiency, and the
rail franchising process should be
reformed to start from ‘zero subsidy’
bids rather than tightly defined
specifications. Rather than pick winners,
the Government should bring forward
auctions for mature renewable energy
sources, and refocus resources on setting
consistent carbon prices and supporting
early stage sources. We should commit
to building 300,000 houses a year,
driving down rental costs, increasing
supply and creating thousands of jobs in
the construction sector.
z Britain should aim to build on London’s
success as a world hub for trade,
finance and talent, offering the most
competitive business taxes in the G20.
The expansion of global capitalism in
the last thirty years has seen a historic
reduction in poverty, but it has also
created a more competitive world. Britain
cannot afford to drive away high-end
firms or talent with high tax rates, or to
keep our trade narrowly dependent on
the old Eurozone. The good news is that
Britain is also uniquely positioned to
benefit from the rise of the new global
middle class. Just as London has become

34 – Economics Manifesto
the world city, Britain can make better
use of its unique talents, geography and
heritage to become one of the most
open and richest countries in the world.
Building on the successful model of
corporation tax, the Government should
give businesses greater certainty by
publishing a five-year tax roadmap at
the beginning of the Parliament, aiming
to offer the most competitive regime
in the whole G20. In order to maintain
world links, the next Government
should commit to accepting the
recommendations of the Davies review
of aviation capacity, and begin exploring
options now for further expansion.
Outside London, the Government
should encourage new hubs through
devolving further political, borrowing
and economic powers, and increasing
road and rail investment to create a new
‘Northern Hub’.

Savings – 35
In the long run, ownership of assets is as important as wages in generating inequality. We need to create a capital-owning democracy, and make sure saving isn’t only the province of the rich.
Rise of the Robots
It was a “very important book”,86 “a publishing
sensation”,87 “lightning-in-a-bottle”,88 a
“magnificent, sweeping meditation”,89 a “tour
de force”,90 a “watershed”,91 a “triumph”.92
Thomas Piketty’s Capital in the Twenty-First Century was inarguably the economic publi-
cation sensation of 2014. At its heart was an
argument that capitalism itself contained a
central contradiction: “the entrepreneur inev-
itably tends to become a rentier, more and
more dominant over those who own nothing
but their labour. Once constituted, capital
reproduces itself faster than output increases.
The past devours the future.” In other words,
those with wealth and savings would see it
increase faster than they could spend it – we
were heading towards a new gilded age in
which inheritance beat out entrepreneurship.
Many complaints were made about the book.
The central model seemed to ignore many of
what we already knew about the relationship
between capital and labour income, while the
choice and interpretation of data was at best
questionable. Technology and globalisation
have so far proven to be much more important
causes of inequality than capital, while even in
Piketty’s worst case scenario, a growing share
of growth going to capital owners could only
be sustained by higher wages for workers. If
you looked at Piketty’s own data for Britain,
the story of the twentieth century looked
nothing like the aristocratic age. Returns to
land had continued to fall, while returns to
housing massively increased.
SAVINGS
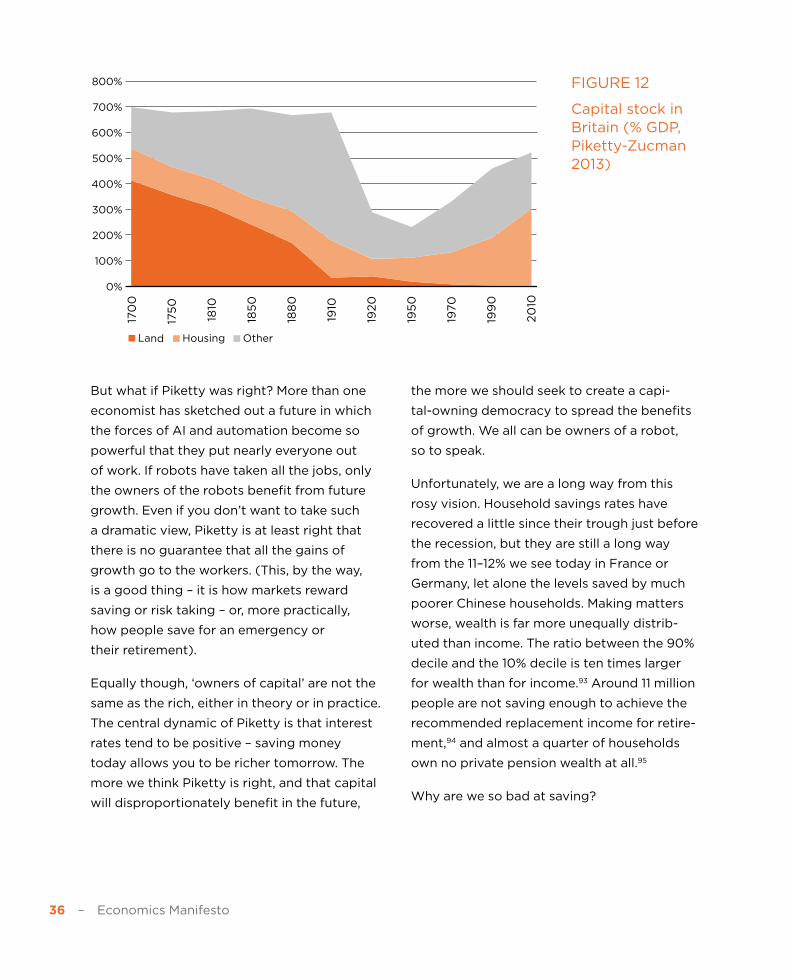
36 – Economics Manifesto
But what if Piketty was right? More than one
economist has sketched out a future in which
the forces of AI and automation become so
powerful that they put nearly everyone out
of work. If robots have taken all the jobs, only
the owners of the robots benefit from future
growth. Even if you don’t want to take such
a dramatic view, Piketty is at least right that
there is no guarantee that all the gains of
growth go to the workers. (This, by the way,
is a good thing – it is how markets reward
saving or risk taking – or, more practically,
how people save for an emergency or
their retirement).
Equally though, ‘owners of capital’ are not the
same as the rich, either in theory or in practice.
The central dynamic of Piketty is that interest
rates tend to be positive – saving money
today allows you to be richer tomorrow. The
more we think Piketty is right, and that capital
will disproportionately benefit in the future,
the more we should seek to create a capi-
tal-owning democracy to spread the benefits
of growth. We all can be owners of a robot,
so to speak.
Unfortunately, we are a long way from this
rosy vision. Household savings rates have
recovered a little since their trough just before
the recession, but they are still a long way
from the 11–12% we see today in France or
Germany, let alone the levels saved by much
poorer Chinese households. Making matters
worse, wealth is far more unequally distrib-
uted than income. The ratio between the 90%
decile and the 10% decile is ten times larger
for wealth than for income.93 Around 11 million
people are not saving enough to achieve the
recommended replacement income for retire-
ment,94 and almost a quarter of households
own no private pension wealth at all.95
Why are we so bad at saving?
300%
400%
500%
600%
800%
700%
200%
100%
0%
Land OtherHousing
170
0
175
0
1810
185
0
188
0
1910
1920
195
0
1970
199
0
20
10
FIGURE 12
Capital stock in Britain (% GDP, Piketty-Zucman 2013)

Savings – 37
It’s Complicated
There are many reasons why Britons save
so little, including short termism, our welfare
system, global imbalances and our broken
housing market.
It is not difficult to think of possible explana-
tions, but much harder to judge their relative
weight.
The ageing population has made generous
pension schemes unaffordable, with Defined
Benefit schemes now a distinct minority in the
private sector.96 A liberalised financial system
has made it ever easier to borrow. Over the
very long term, the tax system has continu-
ally punished income and savings, while the
welfare system encouraged an expectation
that the state will look after us in our old age.
Human instincts aggressively discount the
future, calibrated to an age of much lower life
expectancy, while equally there also seem to
be long lasting cultural differences in attitudes
to saving and thrift. As we grow wealthier, the
attraction of saving for yet more wealth natu-
rally shrinks – the triple lock, after all, guaran-
tees that a pensioner with no savings will still
always see their earnings grow with whichever
is higher: inflation, earnings or 2.5%.
Whatever the long term reasons for low
saving, the problem grew distinctly worse in
both Britain and the US at around the turn of
the millennium.
Ironically, the chief cause of low savings
rates in parts of the West were high savings
rates abroad. The increase in savings in Asia
after the 1997 Asian Financial Crisis led to, in
Bernanke’s phrase, a “global savings glut”,
driving down interest rates worldwide. If
this extra funding had gone into productive
investments like roads or railways, this would
have not mattered much. Instead, much of it
was funnelled by the financial system into flat
screen TVs and a housing bubble.
0
2
4
6
8
10
12
14
-6
-4
-2
2000 2002 2004 2006 2008 2010 2012
Canada France Germany Italy Japan UK US
FIGURE 13
Net household savings (% of household disposable income, OECD)
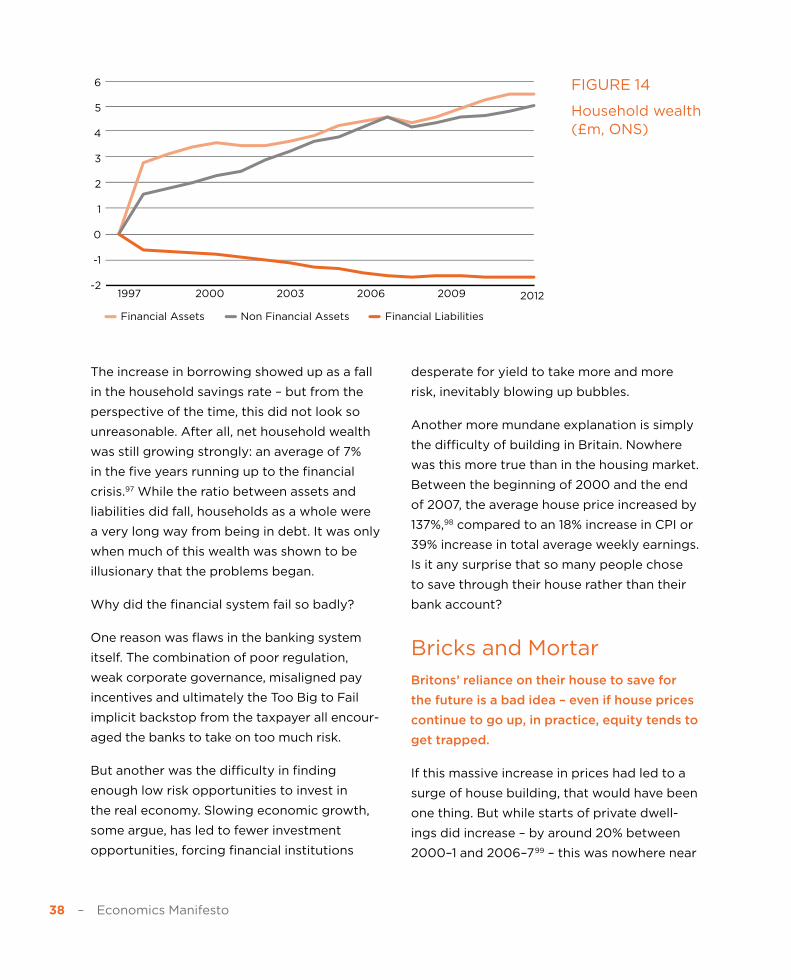
38 – Economics Manifesto
The increase in borrowing showed up as a fall
in the household savings rate – but from the
perspective of the time, this did not look so
unreasonable. After all, net household wealth
was still growing strongly: an average of 7%
in the five years running up to the financial
crisis.97 While the ratio between assets and
liabilities did fall, households as a whole were
a very long way from being in debt. It was only
when much of this wealth was shown to be
illusionary that the problems began.
Why did the financial system fail so badly?
One reason was flaws in the banking system
itself. The combination of poor regulation,
weak corporate governance, misaligned pay
incentives and ultimately the Too Big to Fail
implicit backstop from the taxpayer all encour-
aged the banks to take on too much risk.
But another was the difficulty in finding
enough low risk opportunities to invest in
the real economy. Slowing economic growth,
some argue, has led to fewer investment
opportunities, forcing financial institutions
desperate for yield to take more and more
risk, inevitably blowing up bubbles.
Another more mundane explanation is simply
the difficulty of building in Britain. Nowhere
was this more true than in the housing market.
Between the beginning of 2000 and the end
of 2007, the average house price increased by
137%,98 compared to an 18% increase in CPI or
39% increase in total average weekly earnings.
Is it any surprise that so many people chose
to save through their house rather than their
bank account?
Bricks and Mortar
Britons’ reliance on their house to save for
the future is a bad idea – even if house prices
continue to go up, in practice, equity tends to
get trapped.
If this massive increase in prices had led to a
surge of house building, that would have been
one thing. But while starts of private dwell-
ings did increase – by around 20% between
2000–1 and 2006–799 – this was nowhere near
0
1
2
3
4
5
6
-2
-1
1997 2000 2003 2006 2009 2012
Financial Assets Non Financial Assets Financial Liabilities
FIGURE 14
Household wealth (£m, ONS)

Savings – 39
enough to tackle escalating prices. Extended
back over the last fifty years, house prices
have increased by a factor of around 100,100
compared to a sixty-fold increase in earnings101
and 25-fold increase in inflation.102
Besides making it harder for first time
buyers and leading to low quality housing
for everyone else, this is massively unfair,
randomly redistributing income from poor
to rich and from young to old.
In theory, your house can act as your primary
savings vehicle. A mortgage has the virtue of
being the ultimate nudge, forcing you to put
some money aside every month. Over the last
thirty years, the proportional increases in the
average house price have been roughly equiv-
alent to the increase in the FTSE 100.
In practice, using your house as your main
savings vehicle is incredibly illiquid, undiver-
sified and with absolutely no guarantee that
overall prices will continue to go up. Investing
in an Index Fund gives you a share of the
overall economy’s future growth and pros-
perity. Investing in housing is a bet against
planning reform ever gaining traction.
Even worse, given stigma, social habits and
inadequate financial vehicles, housing today
is often a one way hole for savings. Net
property wealth is the largest component
of overall household wealth for the bottom
80% of households, and significantly larger
than private pensions for the bottom 70%.103
In theory, using this capital could make a
significant difference to pensioner incomes,
but at present equity release remains a niche
product, used by under 2% of households.104
The ultimate cause of house price hyperinfla-
tion is a lack of housing supply, which in turn is
the result of restrictive planning law. However,
the costs of bad planning law to the British
economy and saving go far beyond housing.
When you look at intangible investments
in things like research, training, design or
branding, Britain is actually a world leader.105
It is only when it comes to building physical
things that require land and the complex
weighing up of wider and local interests that
FIGURE 15
Comparative returns of stocks and houses
0
1,000
2,000
3,000
4,000
5,000
6,000
7,000
8,000
1983 1988 1993 1998 2003 2008 2013
FTSE 100 Natwest House Price Index
2,000
4,000
6,000
8,000
10,000
12,000
0
FT
SE
Natw
est
Ho
use
Pri
ce In
dex

40 – Economics Manifesto
Britain falls behind. Between 2000 and 2009,
Britain opened only 46 new miles of motorway
compared to 850 in France.106 The last full-
length runway was built in the South East
in 1946,107 while Heathrow is already full and
Gatwick is the busiest single runway airport
in the world.108 Failure to replace old energy
supply has the predicted margins of capacity
over demand potentially falling to just 2% next
year, significantly raising the chance of indus-
trial users being asked to cut down on their
power usage.109
Recommendations: Creating a Capital-Owning Democracy
We need many different types of savings for
retirement, insurance and wealth. A one-size-
fits-all policy will not be enough.
For the last thirty-five years, interest rates
across the world have fallen. Much of this is
the result of the decline in inflation from the
high of the 1970s, but even after you strip this
away, there has been a definite decline in real
interest rates since at least the turn of the
millennium. Long-term bond yields suggest
that markets barely, if at all, expect interest
rates to make a return to previous levels for
decades to come. Economists such as Larry
Summers or Paul Krugman argue that we may
have entered an era of ‘secular stagnation’
with permanently low interest rates.
Why has this been happening?
There are many possible suspects, from
changing demographics in the western world
to a lower risk premium as investors grow
used to a world of low inflation. Some worry
that growth itself is slowing, or that a lack
of investment opportunities in the western
world gives nowhere for savings to go without
inflating a financial bubble.
On the other hand, it is also possible that
what we have seen is a short-term phenom-
enon – one more relic of the one-two punch
of the world commodities crunch followed
by the financial crisis. As the world economy
and demand recover, interest rates could
start rising again. Sustained negative real
interest rates create many implausible predic-
tions which are hard to swallow in a world of
positive growth. The decline in real interest
rates began roughly at the same point as
China massively expanded its own savings in
2000 in the wake of the earlier Asian financial
crisis, but at some point China is likely to have
to rebalance its own economy away from
saving and investment and towards greater
consumption.
Whatever happens to our future economy,
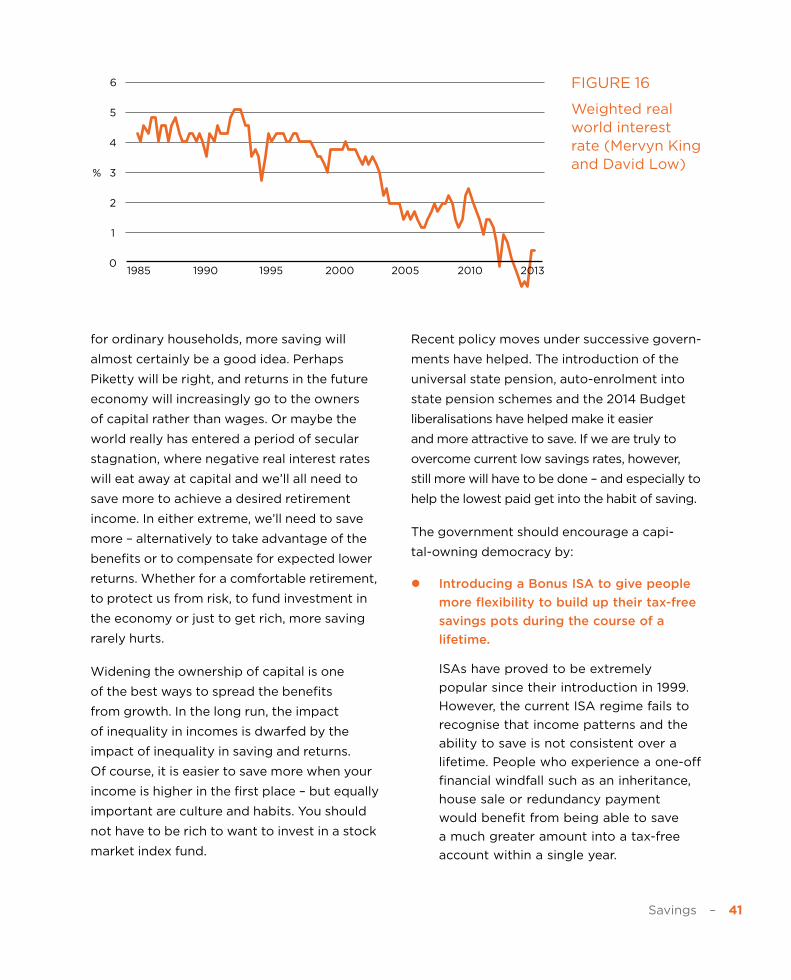
Savings – 41
for ordinary households, more saving will
almost certainly be a good idea. Perhaps
Piketty will be right, and returns in the future
economy will increasingly go to the owners
of capital rather than wages. Or maybe the
world really has entered a period of secular
stagnation, where negative real interest rates
will eat away at capital and we’ll all need to
save more to achieve a desired retirement
income. In either extreme, we’ll need to save
more – alternatively to take advantage of the
benefits or to compensate for expected lower
returns. Whether for a comfortable retirement,
to protect us from risk, to fund investment in
the economy or just to get rich, more saving
rarely hurts.
Widening the ownership of capital is one
of the best ways to spread the benefits
from growth. In the long run, the impact
of inequality in incomes is dwarfed by the
impact of inequality in saving and returns.
Of course, it is easier to save more when your
income is higher in the first place – but equally
important are culture and habits. You should
not have to be rich to want to invest in a stock
market index fund.
Recent policy moves under successive govern-
ments have helped. The introduction of the
universal state pension, auto-enrolment into
state pension schemes and the 2014 Budget
liberalisations have helped make it easier
and more attractive to save. If we are truly to
overcome current low savings rates, however,
still more will have to be done – and especially to
help the lowest paid get into the habit of saving.
The government should encourage a capi-
tal-owning democracy by:
z Introducing a Bonus ISA to give people
more flexibility to build up their tax-free
savings pots during the course of a
lifetime.
ISAs have proved to be extremely
popular since their introduction in 1999.
However, the current ISA regime fails to
recognise that income patterns and the
ability to save is not consistent over a
lifetime. People who experience a one-off
financial windfall such as an inheritance,
house sale or redundancy payment
would benefit from being able to save
a much greater amount into a tax-free
account within a single year.
FIGURE 16
Weighted real world interest rate (Mervyn King and David Low)
0
1
2
3
4
5
6
%
1985 1990 1995 2000 2005 2010 2013

42 – Economics Manifesto
The Bonus ISA would be offered to
anybody who is unable to use their
full annual tax-free savings allowance
(currently set at £15,000). People would
be given the power to roll over any
unused portions of their existing ISA
allowances into their Bonus ISA account.
There would be a cap – initially £10,000
– on the total amount that customers
could roll over into their Bonus ISA,
allowing the Exchequer to control the
cost of introducing the new scheme.
z Introducing a new generation of private
sector Premium Bonds.
In the long run, higher savings are one of
the best ways to share out the benefits
of growth – but today savings and wealth
are even more unequally distributed than
income. Behavioural nudges that rely on
defaults and opt outs appear to be less
powerful for low income households,
and few at the bottom are close to using
their full ISA allowance. Prize Linked
Savings accounts offer the chance to
randomly win a set cash prize alongside,
or in some cases instead of, a fixed
interest rate. These have been shown
repeatedly to increase the rate of saving
– in one study, for example, total savings
went up by 12% – including among those
with low levels of income, and already
have an extensive track record in Britain.
Originally introduced by Harold
Macmillan, Premium Bonds remain
Britain’s most popular savings product.
The Government should encourage a new
generation of Premium Bonds, allowing
private organisations to experiment with
different behavioural nudges, lottery-like
mechanisms and trade-offs between set
interest rates and prizes.
z Allow taxpayers to buy a no risk stake in
RBS and Lloyds.
Six years after the financial crisis, the
government still owns substantial hold-
ings of RBS and Lloyds. Understandably,
the Government wants to maximise its
return from selling the banks back into
fully private ownership, but the longer the
banks remain in public hands, the greater
the danger of political interference.
Re-privatising the banks offers a once in
a generation chance to spread ownership
and better align the interests of the public
with the financial system. Anyone who
has an NI number and is on the electoral
register should be given the opportu-
nity to apply for shares at no initial cost,
but only to pay at the time of sale. The
Government would retain the option of
recalling the shares in the highly unlikely
event that they don’t exceed the floor
price after ten years, but the new share-
holders would enjoy any upside.
Re-privatising the banks offers a once in a generation chance to spread ownership and better align the interests of the public with the financial system
Savings – 43
z End the opt-out for auto-enrolment in
private sector pensions and gradually
increase the contribution rate to 12%.
Once fully phased in in October 2018,
nearly every full-time employee will
be automatically enrolled in an 8%
occupational pension unless they
explicitly choose to opt out. So far,
automatic enrolment has been a
significant success, with around 5
million workers enrolled and just 10%
choosing to opt out. However even when
the system is fully in place, it will not
guarantee that workers save an adequate
amount for their retirement. Under the current 8% rate, a worker
earning £27,000 in a forty-year career
would only save around 55% of what
they need to generate the DWP’s
recommended target replacement
income. In order to achieve this level,
the contribution level would need to be
gradually raised to at least 12%. However,
raising the rate this high runs the risk
of increasing the level of opt-out, and
so there is a good case for making
saving compulsory, as under the highly
successful Australian model.
z Create a new system of personal
‘MyFund’ welfare accounts funded out
of National Insurance payments.
Contributory Jobseekers Allowance
should be replaced by a new system of
individual accounts, with a 2% reduction in
the main National Insurance rate to offset
the impact on workers. This would allow
individuals to build up a specific ‘pot’
which belongs to them and represents
their contribution into the system. Individuals could add up to an extra
£100 a week to their personal ‘MyFund’
account, which would fund the first three
months of unemployment. In addition,
the fund could be drawn on through the
working life to support career transition
and retraining, while any remaining
balance would be added to the pension
on retirement.
44 – Economics Manifesto
A Disagreeable Task
Taxes are the largest bill most households
pay. Passing on the benefits of stable public
finances and higher government productivity
is the best way to tackle low pay.
On the 10th of September 1931 Philip
Snowden stood to give his first Budget as
the Chancellor of the Exchequer for the new
National Government coalition: “I rise to
discharge,” he said, in his opening words, “one
of the most disagreeable tasks that has ever
fallen to my lot”.110 It was a Budget that was
to go down in history.
The world depression had seen unemploy-
ment double over the last two years to a
near terrifying 15%,111 while financial markets
continued to put pressure on Sterling. Earlier
that year, an independent committee had
suggested that austerity measures worth
around £120 million were needed to bring
the budget back to balance – and the latest
budget forecasts suggested the deficit could
now exceed £170 million. Snowden did not
shirk from the task: income taxes were raised
by the modern equivalent of 2.5p, while public
sector pay and unemployment benefits were
immediately cut by 10%.112
In the interpretation that was to go down
in popular history, the 1931 budget was a
colossal mistake. The insistence of the 1930s
governments on balanced budgets prolonged
the recession, stoking up unemployment
and taking demand out of the economy. It
was too far, too fast. The day was only saved
with the arrival of John Maynard Keynes and
Roosevelt’s New Deal. The simple lesson:
never try to reduce the deficit in a recession.
As Keynes warned in the budget’s wake, “its
direct effect on employment must be disas-
trous. It is safe to predict that it will increase
the volume of unemployment by more than
the 10 per cent by which the dole is to
be cut”.113
But the actual reality is much more compli-
cated than that. It is perhaps true that
Snowden did not need to return the budget
to balance so quickly, and could have spread
out the pain differently – but the actual
knock on effects on the wider economy were
minimal. What mattered for recovering from
the Great Depression was not the degree of
GOVERNMENT

Government – 45
austerity pursued by the Government, but the
speed that it came off the Gold Standard. The
intense argument over fiscal policy was largely
a distraction.
Keynes was wrong. Unemployment did
not increase 10%. It actually went up half a
percentage point in a year – compared to over
three the year before – and then from 1932
dropped like a stone. Britain’s coming off the
Gold Standard, the devaluation of Sterling
and cuts to interest rates were what made
the difference.
Over the last seven years, we have once again
seen an argument about how best to close the
hole emerging in the public finances after a
major financial crisis. If anything, the scale of
the challenge faced by Britain was far bigger
than Snowden: his £170 mn deficit was still
only equal to 4% of the day’s GDP, compared
to today’s 10%. While Snowden led the road
to a surplus in two years, Britain today will be
lucky to do the same in ten. Two years after
the 1931 budget, growth in the UK roared back
to over 3%, and then 6% the year after. Two
years after the start of consolidation today,
growth was just 0.7%.
Was this time truly different? Did we finally
go too far, too fast?
Too Far, Too Fast?
The balance of the evidence suggests that
the Eurozone crisis and world inflation
were far more important causes of the 2012
slowdown than fiscal consolidation. We
should continue to rely on monetary policy
to manage demand.
Away from all the sound and fury of the polit-
ical debate, the real question at the heart
of the debate over the speed of spending
cuts came down to how much you believed
monetary policy could limit any economic
fallout from cutting the deficit. Some, such as
was implicit in Ed Balls’ position, believed that
we were in a ‘liquidity trap’, with the Bank of
England no longer able to steer the macroeco-
FIGURE 17
Unemployment in the 1930s (Bank of England)
5
10
-5
-10
15
20
0
1928 1929 1930 1931 1932 1933 1934 1935 1936 1937 1938 1939
Unemployment Rate (%) Deficit (%GDP)
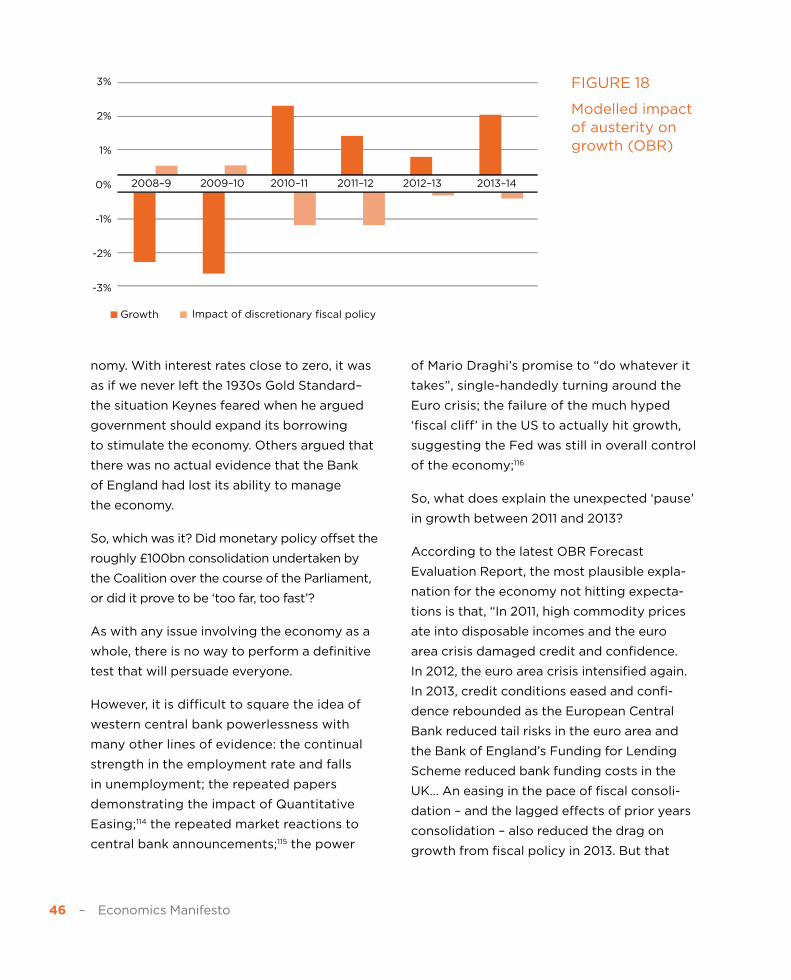
46 – Economics Manifesto
nomy. With interest rates close to zero, it was
as if we never left the 1930s Gold Standard–
the situation Keynes feared when he argued
government should expand its borrowing
to stimulate the economy. Others argued that
there was no actual evidence that the Bank
of England had lost its ability to manage
the economy.
So, which was it? Did monetary policy offset the
roughly £100bn consolidation undertaken by
the Coalition over the course of the Parliament,
or did it prove to be ‘too far, too fast’?
As with any issue involving the economy as a
whole, there is no way to perform a definitive
test that will persuade everyone.
However, it is difficult to square the idea of
western central bank powerlessness with
many other lines of evidence: the continual
strength in the employment rate and falls
in unemployment; the repeated papers
demonstrating the impact of Quantitative
Easing;114 the repeated market reactions to
central bank announcements;115 the power
of Mario Draghi’s promise to “do whatever it
takes”, single-handedly turning around the
Euro crisis; the failure of the much hyped
‘fiscal cliff’ in the US to actually hit growth,
suggesting the Fed was still in overall control
of the economy;116
So, what does explain the unexpected ‘pause’
in growth between 2011 and 2013?
According to the latest OBR Forecast
Evaluation Report, the most plausible expla-
nation for the economy not hitting expecta-
tions is that, “In 2011, high commodity prices
ate into disposable incomes and the euro
area crisis damaged credit and confidence.
In 2012, the euro area crisis intensified again.
In 2013, credit conditions eased and confi-
dence rebounded as the European Central
Bank reduced tail risks in the euro area and
the Bank of England’s Funding for Lending
Scheme reduced bank funding costs in the
UK… An easing in the pace of fiscal consoli-
dation – and the lagged effects of prior years
consolidation – also reduced the drag on
growth from fiscal policy in 2013. But that
2008–9 2009–10 2010–11 2011–12 2012–13 2013–14
Growth Impact of discretionary fiscal policy
0%
1%
-2%
-3%
2%
3%
-1%
FIGURE 18
Modelled impact of austerity on growth (OBR)

Government – 47
looks to have secondary importance relative
to confidence and credit channels.”117
If you use the OBR’s assumed multipliers
for fiscal policy (the impact of a change in
Government spending on the level of GDP),
the implied effect on growth in 2012–13 is just
0.1 percentage points. It is of course possible
that that the OBR is wrong in its estimate of
the multipliers. Widespread disagreement
exists amongst economists about their scale,
timing and even existence, which decades of
empirical research have been unable to solve.
Nevertheless, as the OBR notes, if multipliers
were much larger than they assumed, it is
strange that growth in 2010–11 was not disap-
pointing – when in reality, it exceeded their
expectations. With enough assumptions, it
is possible to make the Keynesian narrative
work (that the size of the fiscal consolidation
acted as a big drag on economic growth), but
it is not the obvious story that jumps out of
the data.
As the OBR state, the Euro explanation does
a much better job than fiscal consolidation
in explaining the timing of the differing
paths of the US and UK. The most significant
divergence for the two came in 2012, where
US growth was 2.3% and UK 0.7%. If you
compare their plans from the perspective of
late 2010, the US actually had significantly
more consolidation pencilled in than the
UK.118 The UK has not significantly altered its
discretionary fiscal consolidation plans since
this point – subsequent Budgets and Autumn
Statements have been largely fiscally neutral
over this time period.
In short, the balance of evidence suggests
that at least on this matter, the pre-crisis
consensus was right: we can leave the job of
managing demand and the business cycle to
the central bank and monetary policy. Within
reasonable limits, we don’t have to worry that
cutting the deficit too fast will hurt the wider
growth of the economy. Governments are free
to focus solely on the classical questions of
public finance: how much should they spend,
and how should they pay for it?
FIGURE 19
Planned UK and US consolidation compared (change in Cyclically Adjusted Primary Balance as % potential GDP, IMF Fiscal Monitor, November 2010)
1.5
2
2.5
3
0.5
0
1
UK US
1.5
2
2.5
3
0.5
0
1
UK US
2011 2012 2013
%
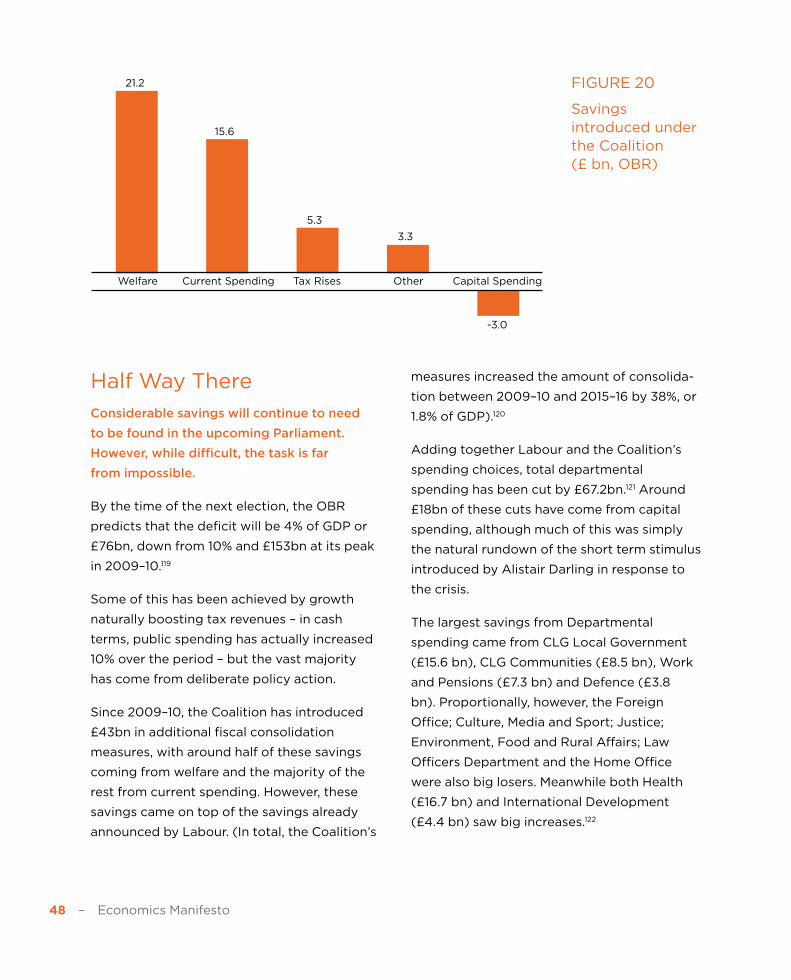
48 – Economics Manifesto
Half Way There
Considerable savings will continue to need
to be found in the upcoming Parliament.
However, while difficult, the task is far
from impossible.
By the time of the next election, the OBR
predicts that the deficit will be 4% of GDP or
£76bn, down from 10% and £153bn at its peak
in 2009–10.119
Some of this has been achieved by growth
naturally boosting tax revenues – in cash
terms, public spending has actually increased
10% over the period – but the vast majority
has come from deliberate policy action.
Since 2009–10, the Coalition has introduced
£43bn in additional fiscal consolidation
measures, with around half of these savings
coming from welfare and the majority of the
rest from current spending. However, these
savings came on top of the savings already
announced by Labour. (In total, the Coalition’s
measures increased the amount of consolida-
tion between 2009–10 and 2015–16 by 38%, or
1.8% of GDP).120
Adding together Labour and the Coalition’s
spending choices, total departmental
spending has been cut by £67.2bn.121 Around
£18bn of these cuts have come from capital
spending, although much of this was simply
the natural rundown of the short term stimulus
introduced by Alistair Darling in response to
the crisis.
The largest savings from Departmental
spending came from CLG Local Government
(£15.6 bn), CLG Communities (£8.5 bn), Work
and Pensions (£7.3 bn) and Defence (£3.8
bn). Proportionally, however, the Foreign
Office; Culture, Media and Sport; Justice;
Environment, Food and Rural Affairs; Law
Officers Department and the Home Office
were also big losers. Meanwhile both Health
(£16.7 bn) and International Development
(£4.4 bn) saw big increases.122
FIGURE 20
Savings introduced under the Coalition (£ bn, OBR)
1.5
2
2.5
3
0.5
0
1
UK US
Welfare Current Spending Tax Rises Other Capital Spending
21.2
15.6
5.3
3.3
-3.0

Government – 49
In the welfare budget, the biggest changes
have come from changing the way benefits
are indexed to inflation. The five biggest
savings over the Parliament have been:
switching from RPI to CPI indexation for
benefits, tax credits and public services
pensions (£4.5 bn); removing child benefit
from higher rate taxpayers (£2.7 bn); reducing
time limits for some Employment and Support
Allowance claimants (£1.6 bn); capping
working age benefits and tax credits to 1% for
three years from 2013–14 (£1.4 bn); reforming
the Disability Living Allowance reform
gateway (£1.1 bn).123
Another way to look at these changes is
through the net effect on the public sector
workforce. Over the last five years, the public
sector has shed around 430,000 workers,
or around two thirds of the workers it has
gained since 1999. On the other hand, there
has been little to no sign of the closing of the
gap between public and private sector annual
median earnings.124
FIGURE 21
% change to department budgets between 2010–11 and 2015–16 (PESA)
48
20
15
9
2
1
1
0
0
-3
-8
-10
-12
-12
-18
-22
-25
-28
-29
-47
-53
-53
-55
International Development
Energy and Climate Change
NHS (Health)
Inflation
Transport
Scotland
Education
Work and Pensions
CLG local government
CLG communities
Foreign and Commonwealth Office
Culture, Media and Sport
Justice
Environment, Food and Rural Affairs
Law Officers' departments
Home Office
Chancellor's departments
Defence
Business, Innovation and Skills
Small and independent bodies
Cabinet Office
Northern Ireland
Wales

50 – Economics Manifesto
Whoever wins the next election, the hard
choices will continue. The structural deficit
remains uncomfortably high (3.6% of GDP
in 2015–16), while at around 80% of GDP,
public debt is higher than is probably optimal
in the long term.125 All three parties have
committed to start paying down debt in the
next Parliament, implying that without signif-
icant tax rises there will be little room for the
continual real increases in spending the public
sector has become used to.
However, the scale of the choices is signifi-
cantly different for the Conservatives, Labour
and the Liberal Democrats. In order to achieve
a current surplus by 2019–20, Labour needs to
find in the order of just £5bn in savings from
either spending cuts or tax rises, while the
Liberal Democrats need around £7.5bn.
By contrast, the Conservatives have
committed to achieving an absolute surplus,
and on top of this £7.2bn in tax cuts by
2019–20. This requires them to find around an
additional £33bn in savings.126
This is challenging, but not impossible. The
Conservatives have already pledged to find
around £12 bn in further savings from welfare,
while in this Parliament, the Cabinet Office’s
Efficiency and Reform Group managed to find
£25 bn in efficiency savings out of just the
third of public spending under central control.
However, balancing the budget is only the
beginning. Balancing the budget in one year is
not very helpful if subsequent recessions send
it straight back into the red.
Nobody believes any more that we have
succeeded in abolishing boom and bust.
As the failures of the public sector finance
forecasts from 2008 and 2010 demonstrated
vividly, we are not very good at predicting
the future. This is not a new disease. Official
forecasts have persistently optimistically
predicted that the budget deficit will start to
fall in a few years, ignoring the fact that it has
persistently disappointed in the years before-
hand. One recent study found that UK official
forecasts for the deficit are positively biased
FIGURE 22
Public and private sector employment (ONS, excluding effects of major reclassifications)
4,800
4,600
5,000
5,200
5,400
5,600
5,800
20,000
21,000
22,000
23,000
24,000
25,000
26,000
99 00 01 02 03 04 05 06 07 08 09 10 11 12 13 14
Private sector Public sector
0.0 0.5 1.0 1.5 2.0 2.5 3.0 3.5 4.0 4.5
UK
Scotland
Wales
South West
South East
London
East of England
West Midlands
East Midlands
Yorkshire and The Humber
North West
North East
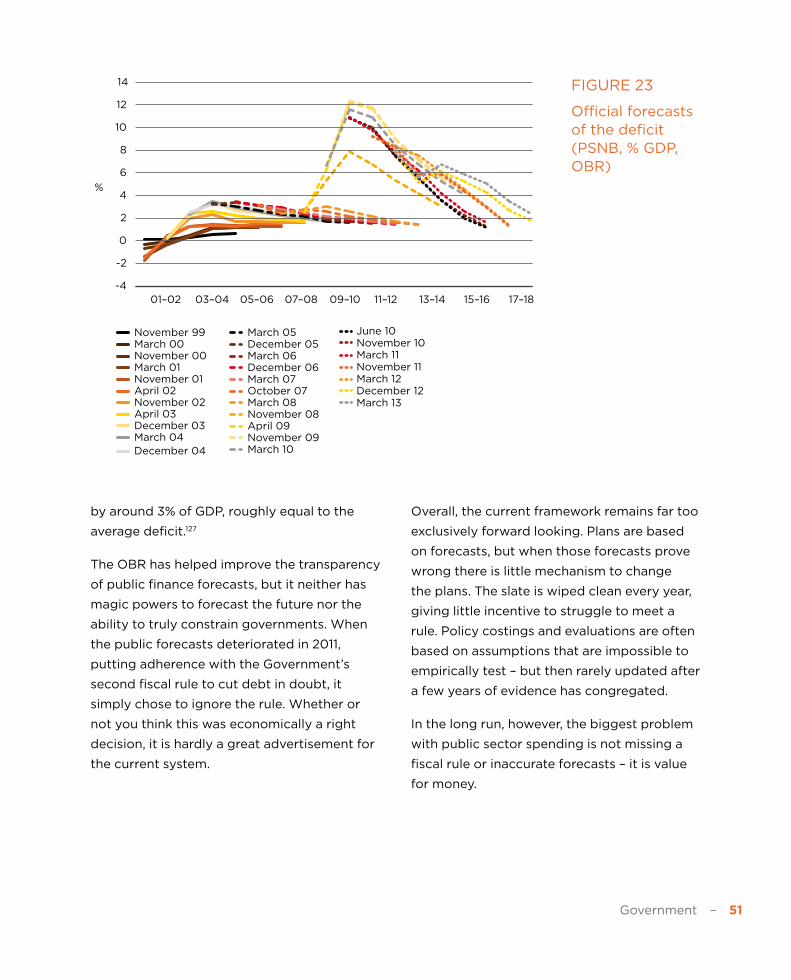
Government – 51
by around 3% of GDP, roughly equal to the
average deficit.127
The OBR has helped improve the transparency
of public finance forecasts, but it neither has
magic powers to forecast the future nor the
ability to truly constrain governments. When
the public forecasts deteriorated in 2011,
putting adherence with the Government’s
second fiscal rule to cut debt in doubt, it
simply chose to ignore the rule. Whether or
not you think this was economically a right
decision, it is hardly a great advertisement for
the current system.
Overall, the current framework remains far too
exclusively forward looking. Plans are based
on forecasts, but when those forecasts prove
wrong there is little mechanism to change
the plans. The slate is wiped clean every year,
giving little incentive to struggle to meet a
rule. Policy costings and evaluations are often
based on assumptions that are impossible to
empirically test – but then rarely updated after
a few years of evidence has congregated.
In the long run, however, the biggest problem
with public sector spending is not missing a
fiscal rule or inaccurate forecasts – it is value
for money.
8
10
4
2
12
14
6
-2
-4
0
01-02 03-04 05-06 07-08 09-10 11-12 13-14 15-16 17-18
November 99 March 00 November 00 March 01 November 01 April 02 November 02 April 03 December 03 March 04 December 04
March 05 December 05 March 06 December 06 March 07 October 07 March 08 November 08 April 09 November 09 March 10
June 10 November 10 March 11 November 11 March 12 December 12March 13
%
8
10
4
2
12
14
6
-2
-4
0
01–02 03–04 05–06 07–08 09–10 11–12 13–14 15–16 17–18
November 99 March 00 November 00 March 01 November 01 April 02 November 02 April 03 December 03 March 04 December 04
March 05 December 05 March 06 December 06 March 07 October 07 March 08 November 08 April 09 November 09 March 10
June 10 November 10 March 11 November 11 March 12 December 12March 13
%
FIGURE 23
Official forecasts of the deficit (PSNB, % GDP, OBR)

52 – Economics Manifesto
Why We Reform
The fiscal consolidation programme has
revealed many efficiencies that Departments
didn’t know they could find. Even once the
budget is balanced, we can’t go back to the
old way of continual spending increases
alongside little accountability.
The public sector is the largest bill for almost
all households. For the average household,
even after you’ve included payments from
benefits, paying taxes makes up 34% of their
gross income, while for the bottom decile it is
near half, or 47%.128 Delivering a smaller state
isn’t just some libertarian mantra – it is about
freeing up money to reduce the cost of living,
either through tax cuts or higher benefits.
Instead of stagnating, imagine as a thought
experiment, if between 1997 and 2010
Department Spending had matched the
productivity improvements that were seen in
the market sector of the economy of 31%,129
that would have seen total departmental
spending (DEL) lower by around £120 bn
in 2010, enough to roughly alternatively:
z Close the structural deficit (£122 bn).130
z Abolish PAYE income tax (£130 bn)
or NICs (£98 bn) or VAT (£99.6 bn).131
z Triple the level of benefits paid to
children and working age people
(£49.7 bn).132
There are many reasons why, in practice, it is
hard for the public sector to match private
sector productivity. However equally, there is
no reason why public sector productivity needs
to be zero. Even when the deficit is closed, the
public services cannot go back to a lazy model
where new money is added with little transpar-
ency or guarantee of improvement.
In order to create innovation in the state,
we need the same combination that has
delivered prosperity in the private sector:
markets and technology. The good news is
that new and upcoming technologies offer
many opportunities to fundamentally reshape
the way public services are delivered. This
is already happening. The movement of
many of the transactions between citizens
and government from face to face or paper
to online is expected to save £1.7 bn a year
from 2016.133 Hospitals and residential homes
in Airedale are using video chat to keep in
contact with patients – whether they are
at home, in a hospital or in residential care,
at the press of a red button they can be
talking to a consultant or nurse. The new
Government Digital Service – GDS – has
replaced the failed top-down “waterfall”
method of commissioning IT projects with
all its attendant cost and schedule overruns
with a more agile approach. Rather than try
to guess the unknowable ahead of time, itera-
tive design allows us to evolve the policy and

Government – 53
IT systems as our knowledge comes better
into focus. Replacing the old model of big IT
and big fixed contracts is expected to save
£4 bn a year by 2019–20.134
In the future, new technologies will make
it easier to scale up the expertise of star
lecturers or doctors; passively monitor and
check billions of data points for correlations;
offer intense personalisation and instant
feedback. In a world of MOOCs, flipped
classrooms, personalised genetics, tricorders,
PatientsLikeMe and so on, our public services
are unlikely to look the same in fifty years.
Reform of public services is a process, not
a goal. It does not just save money, but
offers better services. The 2011 Open Public
Services White Paper set out the principles
that citizens should be given as much indi-
vidual choice and control as possible, with
public services themselves open to a range
of competing providers. In education, the
Academies programme has been massively
expanded, and Free Schools introduced,
while the 2012 Health and Social Care Act
devolved funding to clinical commissioning
groups, and allowed patients to choose from
‘any qualified provider’.
The next stage of this process should be to
improve transparency over the performance
of public services, while legally guaranteeing
rights to choice and ‘purchaser-provider’ splits
wherever practical.
The most pressing area of reform, however, is
public sector pay. Even after you control for
higher levels of education, public sector pay
remains 5% higher than that in the private
sector – or 17% if you include pensions.135 On
its own, this is unfair and expensive, but it also
masks deeper problems with national pay
bargaining. One-size-fits-all systems make it
harder to link pay and performance; overly
politicise sensitive decisions, and offers little
differentiation for differing living costs across
the country.
Recommendations: Delivering Value For Money Government
Reform of the public sector is the only way to
deliver sustainable public finances – and gives
us the power to keep increasing the standard
of living of low paid workers.
Imagine a not unrealistic scenario, in which
improvements to the annual productivity and
efficiency of the health sector remains at its
average between 1979 and 2010: just 1% a
year. According to the OBR, if you project this
scenario forward fifty years with no changes
to tax policy, our deficit would spike to 16% of
In a world of MOOCs, flipped classrooms, personalised genetics, tricorders, PatientsLikeMe and so on, our public services are unlikely to look the same in fifty years

54 – Economics Manifesto
GDP and the debt a colossal 205%.136 In reality,
the government would have to raise taxes
much earlier than this to prevent the build-up
of debt – but while this would prevent the
interest bill from climbing so high, we would
still need to find a way to pay for the predicted
10–11% of GDP increase in the cost of health,
long-term care and pensions.
Stagnating productivity is a bigger longer
term threat to the health of the NHS than
short term austerity or even an ageing popu-
lation. Some health care experts argue that
even the OBR’s forecasts do not provide
enough money for the NHS and that it would
be ‘affordable’ in future decades to spend 20%
of GDP on health and social care. This is equiv-
alent to more than doubling the amount of
income tax currently paid.137 Trying to raise taxes
this high is a recipe for decades long stagnation
in living standards and slow growth.
There is no long run alternative to reform to
ensure the quality and sustainability of public
services. Higher spending can at best ease
the transition or fill a small proportion of the
shortfall. We are going to have to get better
at doing more for less.
Moreover, there are other reasons why we
need to err on the side of austerity. Given
uncertainty about the future and its current
high levels, we need to pay debt down more
aggressively than was the norm before the
crisis. A more efficient state gives us the room
to ensure that everybody benefits from growth
and allows us to offer more generous benefits
and keep cutting taxes for the low paid.
We should aim to deliver value for money
government by:
z After the deficit has been closed,
introduce a new fiscal mandate targeting
a zero structural deficit and the pay
down of the debt-to-GDP ratio over the
economic cycle.
At around 80% of GDP, public sector net
debt remains too high for comfort for
long term fiscal sustainability. High levels
of debt reduce the room for manoeuvre
in future crises, risk slowing growth
and raise costs for future generations.
Unfortunately, past fiscal rules have
proved ineffective at constraining
governments or forcing them to pay
down debt in the good years. By trying
to maintain flexibility for governments
to actively manage the business cycle,
they have proved vulnerable to overly
optimistic forecasts and political
procrastination.
We should leave the job of supporting
demand in the economy to monetary
Stagnating productivity is a bigger longer term threat to the health of the NHS than short term austerity or even an ageing population
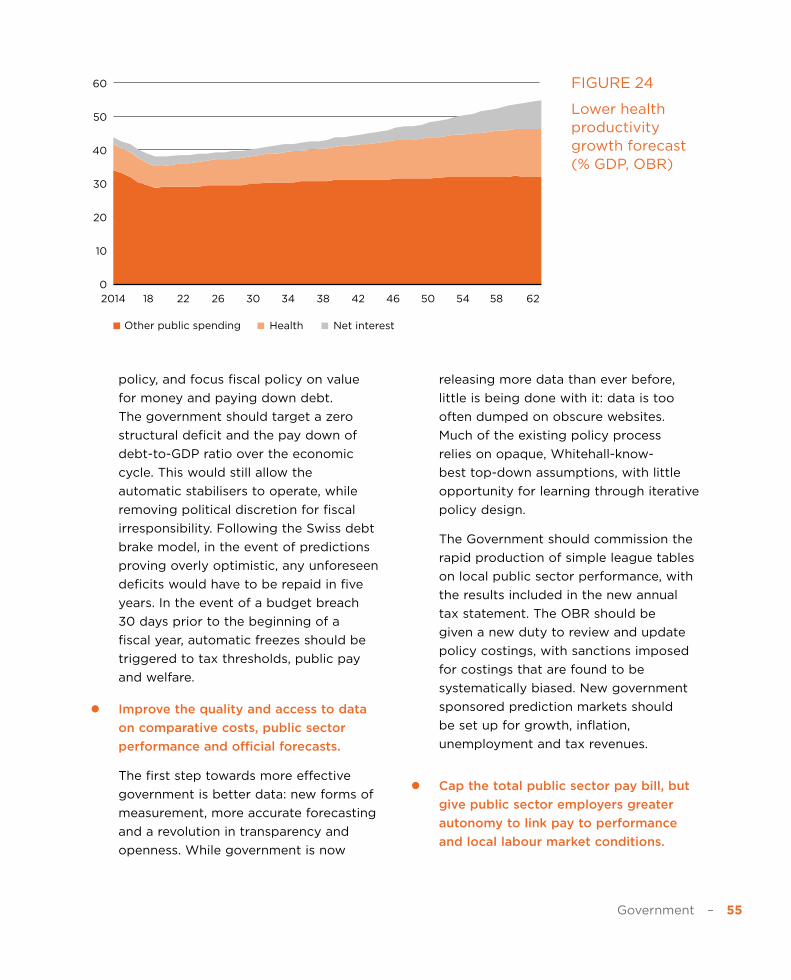
Government – 55
policy, and focus fiscal policy on value
for money and paying down debt.
The government should target a zero
structural deficit and the pay down of
debt-to-GDP ratio over the economic
cycle. This would still allow the
automatic stabilisers to operate, while
removing political discretion for fiscal
irresponsibility. Following the Swiss debt
brake model, in the event of predictions
proving overly optimistic, any unforeseen
deficits would have to be repaid in five
years. In the event of a budget breach
30 days prior to the beginning of a
fiscal year, automatic freezes should be
triggered to tax thresholds, public pay
and welfare.
z Improve the quality and access to data
on comparative costs, public sector
performance and official forecasts.
The first step towards more effective
government is better data: new forms of
measurement, more accurate forecasting
and a revolution in transparency and
openness. While government is now
releasing more data than ever before,
little is being done with it: data is too
often dumped on obscure websites.
Much of the existing policy process
relies on opaque, Whitehall-know-
best top-down assumptions, with little
opportunity for learning through iterative
policy design.
The Government should commission the
rapid production of simple league tables
on local public sector performance, with
the results included in the new annual
tax statement. The OBR should be
given a new duty to review and update
policy costings, with sanctions imposed
for costings that are found to be
systematically biased. New government
sponsored prediction markets should
be set up for growth, inflation,
unemployment and tax revenues.
z Cap the total public sector pay bill, but
give public sector employers greater
autonomy to link pay to performance
and local labour market conditions.
0
10
20
30
40
50
60
2014 18 22 26 30 34 38 42 46 50 54 58 62
Other public spending Health Net interest
0.0 0.5 1.0 1.5 2.0 2.5 3.0 3.5 4.0 4.5 5.0
UK
Scotland
Wales
South West
South East
London
East of England
West Midlands
East Midlands
Yorkshire and The Humber
North West
North East
FIGURE 24
Lower health productivity growth forecast (% GDP, OBR)

56 – Economics Manifesto
Even after controlling for the higher
levels of skills in its workforce,
public sector compensation remains
significantly more generous than in the
private sector. Much of the public sector
workforce has its pay set in a highly
political, centralised process of national
pay bargaining. The combination of the
public sector pay premium and national
pay bargaining creates a system that
is expensive, unfair, and often makes
recruiting and retaining the best staff
more difficult.
Instead, we should move towards a
system where control over pay is more
closely linked to performance and
local living costs. As in Sweden, public
sector employers should be allowed to
choose the level at which negotiations
take place. In some public industries,
negotiations can take place between the
employee and employer, while for others
remaining at the level of the workforce
will be most appropriate.
z Introduce a long term ambition to
ensure every full time worker earn
a Living Income.
In the long run, greater efficiency will
create not just a more sustainable state,
but offer money to spend on tax cuts or
more generous benefits. Increasing the
minimum wage to the level of the living
wage would pose an unacceptable risk
of higher unemployment or other
negative side effects. A mandatory Living
Wage would give the UK near the highest
minimum wage in the OECD, and the
majority of the benefits would go back to
the Treasury rather than to the workers in
higher living standards. However, as the
Adam Smith Institute has long argued, the
difference between the minimum wage
and the higher Living Wage is largely
accounted for by Income Tax, employer’s
and employee’s National Insurance.
The current Coalition government has
already raised the Personal Allowance
from £6,475 to £10,500, while both the
Conservatives and Liberal Democrats
have committed to raising it further
to £12,500 by the end of the next
Parliament. However, this would still leave
low paid workers paying the other taxes
on employment from a much lower level
than Income Tax.
After balancing the budget, the
government should continue to grow
public spending slower than growth
of the economy as a whole. By around
2025 it would be feasible to align the
thresholds for Income Tax and National
Insurance, which along with targeted
increases in Universal Credit could ensure
that everybody in full time work earns at
least a Living Income.
Further Reading – 57
Growth z Looking to the Future of Growth,
Matthew Oakley, November 2011
z Eight Great Technologies, David Willets,
January 2013
z What To Do About Trains In Britain, Tim
Leunig, September 2010
z Bigger and Quieter: The right answer for
aviation, Tim Leunig, October 2012
z Cities for Growth: Solutions to our
planning problems, Alex Morton,
November 2011
z Taxing Jobs: Practical policies for a pay
recovery, Matthew Tinsley & Ruth Porter,
March 2014
Saving z Making Contributions Count: Reforms to
create a social security system for the
21st Century, Steve Hughes, October 2014
z Bonus ISAs, Steve Hughes, January 2015
z Help to Save: Defusing the pensions time
bomb, James Barty, 2014
z Taxing Issues? Reducing housing demand
or increasing housing supply, Alex
Morton, November 2013
z The Central Contradiction of Capitalism?,
February 2015
Government z Money for Nothing: Rules to secure
the UK’s fiscal solvency, Ed Holmes,
November 2013
z Local Pay, Local Growth: Reforming pay
setting in the public sector, Ed Holmes
and Matthew Oakley, September 2012
z Mind the Gap: The size and costs of
pay differentials between the public
and private sectors in the UK, Matthew
Oakley, September 2012
z Better Public Services: A roadmap for
revolution, Sean Worth, April 2013
z No Worker Left Behind: How can we
improve pay and work for the low paid?,
Jonathan Dupont, February 2015
FURTHER READING
58 – Economics Manifesto
1. IPPR, Beyond the Bottom Line, January 2013
2. Author calculation of the difference between outturn real GDP in 2013 and real GDP following the 1992–2007 trend
3. Author calculation from OBR, Crisis and Consolidation in the public finances, September 2014
4. OBR, Public finances databank, OBR, December 2014
5. ONS, Public Sector Productivity Estimates: Total Public Sector, 2010, April 2013
6. OBR, Public finances databank, OBR, December 2014
7. IMF, World Economic Outlook, October 2014
8. IMF, World Economic Outlook, October 2014
9. Author calculation from ONS, Patterns of Pay, February 2014 and CPI (D7BT)
10. OECD, Economic Outlook, November 2014
11. Most rankings still place New York above London in influence and power, although some such as the Global Power City Index have London as #1.
12. According to the Times Higher Education World University Rankings 2014–15. The only two major rankings give the UK three out of the top five (QS World University Rankings 2014–15) and one of the top five (Academic Ranking of World Universities 2014).
13. Author calculations from IMF, World Economic Outlook, October 2014: % change in real GDP per capital; percentage point fall in unemployment rate; percentage point fall in government struc-tural balance (all numbers based on IMF predic-tions for 2015)
14. ONS, Unemployment rate 16+ SA, MGSX
15. OECD, Average annual wages, 2013 constant prices and NCU
16. Eurostat, Unemployment rate
17. The financial crisis saw us slip back behind Germany, although international forecasts like the IMF expect us to rapidly close most of the gap over the next five years. The rankings also look slightly different if you adjust on a PPP basis, although the
overall story of the UK growing faster still holds up.
18. The Conference Board, Total factor productivity growth, Total Economy Database,January 2014
19. ONS, Labour Productivity, Q2 2014
20. John Hiscock, “London is stealing a win over Hollywood”, The Telegraph, 11 June 2013, http://www.telegraph.co.uk/culture/film/film-blog/10111040/London-is-stealing-a-win-over-Hollywood.html
21. Matthew Sparkes, “Grand Theft Auto V beats James Bond in sales charts”, The Telegraph, 2 Jan 2014, http://www.telegraph.co.uk/technology/video-games/10547374/Grand-Theft-Auto-V-beats-James-Bond-in-sales-charts.html
22. Deidre N. McCloskey, Bourgeois Dignity: Why Economics Can’t Explain the Modern World, 2010
23. Author calculation from ONS, RPI Weights,
24. Lawrence H. Officer and Samuel H. Williamson, What was the U.K. GDP Then?, Measuring Worth, 2014
25. Gregory Clark, What Were the British Earnings and Prices Then? (New Series), MeasuringWorth, 2014
26. Gapminder, Life expectancy at birth, 2014
27. Bank of England Three Centuries of Data, 2010
28. World Bank, PovcalNet: the on-line tool for poverty measurement developed by the Development Research Group of the World Bank, http://iresearch.worldbank.org/PovcalNet/index.htm?1
29. ONS, National Life Tables 1980–82 to 2011–13, September 2014
30. ONS, Trends in police recorded crime and CSEW, 1981 to 2013/14, July 2014
31. Department for Environment, Food & Rural Affairs, Number of days when air pollution is moderate or higher in the UK, 2010 to 2013, April 2014
32. ONS, Personal Well-being in the UK, 2013/14, September 2014
33. IMF, World Economic Outlook, October 2014
34. China Highlights, An Introduction to China’s LARGEST CIities, http://www.chinahighlights.com/travelguide/top-large-cities.htm
ENDNOTES
Endnotes – 59
35. Matt Schiavenza, A Surprising Map of the World Shows Just How Big China’s Population Is, The Atlantic, August 2013, http://www.theatlantic.com/china/archive/2013/08/a-surprising-map-of-the-world-shows-just-how-big-chinas-popula-tion-is/278691/
36. Aaron Stanley, US woos Chines tourists with social media, fried dough fritters and a quiz, Financial Times, December 2014, http://blogs.ft.com/beyond-brics/2014/12/02/us-woos-chinese- tourists-with-social-media-fried-dough-fritters-and-a-quiz/
37. Sean Martin, Chinese Tourists to Pump £1bn into UK Economy by 2017, International Business Times, July 2014, http://www.ibtimes.co.uk/chinese-tourists-pump-1bn-into-uk-econo-my-by-2017–1456648
38. KPMG, Corporate and Indirect Tax Rate Survey, 2014
39. Scott Drenkard, Joseph Henchman, 2015 State Business Tax Climate Index, Tax Foundation
40. The first number is out of a maximum 100, the second a maximum 10, and the third a maximum 7.
41. We have excluded the Macroeconomic environ-ment ranking in which the UK does very badly (107th) on the basis that this is only a short term factor.
42. Graeme Ewens, Making Waves, The Guardian, July 2013
43. Robert John Cottrell, Licensed River Thames Watermen & Lightermen, 2002
44. Henry Charles Moore, Omnibuses and Cabs: their origin and history, 1902
45. Anne Jolis, London’s War of the Roads, The Wall Street Journal, June 2013
46. Black Taxi Cab Tours, The London Cab Trade – A History, http://www.blacktaxicabtours.com/the-london-cab-trade-a-history/
47. ONS, International Comparisons of Productivity, 2013 – First Estimates, October 2014
48. National Human Genome Research Institute, DNA Sequencing Costs, http://www.genome.gov/sequencingcosts/
49. BP, Statistical Review of World Energy 2014, August 2014
50. Ian Sample, Infusions of young blood may reverse effects of ageing, studies suggest, The Guardian, May 2014
51. AFP, Brain-to-brain ‘telepathic’ communication achieved for first time, The Telegraph, September 2014
52. Michael Eyre, ‘Boris’ the robot can load up dish-washer, September 2014
53. Elsevier, International Comparative Performance of the UK Research Base – 2013, BIS, December 2013
54. David Willetts MP, Eight great technologies, January 2013, https://www.gov.uk/government/speeches/eight-great-technologies
55. John P. A. Ioannidis, Why Most Published Research Findings Are False; 2005; Perspectives on Psychological Science, Special Section on Replicability in Psychological Science: A Crisis of Confidence?, November 2012; The Control Group if out of Control, Scott Alexander, April 18 2014, http://slatestarcodex.com/2014/04/28/the-control-group-is-out-of-control/
56. Barry Eichengreen, The British Economy Between the Wars, April 2002
57. Stephen Broadberry & Tim Leunig, The impact of Government policies on UK manufacturing since 1945, Future of Manufacturing Project, Government Office for Science, October 2013
58. Antonio Regalado, Technology Is Wiping Out Companies Faster than Ever, Technology Review, September 2013
59. Stephen Broadberry & Tim Leunig, The impact of Government policies on UK manufacturing since 1945, Future of Manufacturing Project, Government Office for Science, October 2013
60. R. Disney, J. Haskel and Y. Haden, Restructuring and Productivity in UK Manufacturing, 2000
61. William D. Nordhaus, Schumpeterian Profits in the American Economy: Theory and Measurement, 2004
62. Author calculation from ONS, Annual Survey of Hours and Earnings, 2014 Provisional Results, November 2014
60 – Economics Manifesto
63. Author calculation from ONS, Annual Survey of Hours and Earnings, 2014 Provisional Results, November 2014; Gregory Clark, What Were the British Earnings and Prices Then? (New Series), MeasuringWorth, 2014
64. The Economist, Open skies and flights of fancy, October 2003
65. Ryan Bourne and Kristian Niemietz, Smoking Out Red Herrings: The cost of living debate, September 2014
66. LSE Growth Commission, Investing for Prosperity: Skills, Infrastructure and Innovation, 2013
67. Bloom et al., The New Empirical Economics of Management, Centre for Economic Performance, April 2014
68. Author calculation from ONS, Family Spending, 2014 Edition
69. Paul C. Cheshire and Christian A. L. Hilber, Office Space Supply Restrictions in Britain: The Political Economy of Market Revenge, 2008
70. Paul Cheshire, Christian A. L. Hilber, Ioannis Kaplanis, Evaluating the Effects of Planning Policies on the Retail Sector: Or do Town Centre First Policies Deliver the Goods?, 2011
71. Include and endnote that says, IMF World Economic Outlook Update, January 2015
72. HM Revenues & Customs, UK Trade Info
73. Thomas Piketty, Capital in the Twenty-First Century, 2014
74. Thomas Piketty, Capital in the Twenty-First Century, 2014
75. ONS, Graduates in the UK Labour Market, 2013
76. Ian Walker, The Impact of University Degrees on the Lifecycle of Earnings: Some Further Analysis, BIS, August 2013
77. BIS, Graduate Labour Market Statistics, July-September Q3 2014
78. Steve McIntosh, Hollowing out and the future of the labour market, BIS, October 2013
79. UKCES, Working Futures 2012–2022, March 2014
80. ONS, The Changing Shape of UK Manufacturing
81. João Paulo Pessoa and John Van Reenen, Decoupling of Wage Growth and Productivity Growth? Myth and Reality, Centre for Economic Performance, October 2013
82. Google, Our Mobile Planet, Google, 2013
83. Carl Benedikt Frey and Michael A. Osborne, The Future of Employment: How Susceptible are Jobs to Computerisation, 2013
84. OBR, Fiscal sustainability report, Jul 2014
85. The Conference Board, Total Economy Database, January 2014
86. Stephanie Flanders, “Capital in the Twenty-first Century by Thomas Piketty – review”, The Guardian, 17 July 2014
87. Mervyn King, “Capital in the Twenty-First Century by Thomas Piketty, review”, The Telegraph, 10 May 2014
88. Jonah Goldberg, “Mr. Piketty’s Big Book of Marxism”, Commentary Magazine, 1 July 2014
89. Jonah Goldberg, “Mr. Piketty’s Big Book of Marxism”, Commentary Magazine, 1 July 2014
90. Lawrence H. Summers, “The Inequality Puzzle”, Democracy Journal, Issue 33, Summer 2014
91. Branko Millanovic, The return of “patrimonial capi-talism”: review of Thomas Piketty’s Capital in the 21s century, October 2013
92. Steven Pearlstein, “’Capital in the Twenty-first Century’ by Thomas Piketty”, The Washington Post, March 28 2014
93. ONS, Wealth and Assets Survey 2010–12, July 2014
94. James Barty, Help to Save: Defusing the pensions time bomb, Policy Exchange, 2014
95. ONS, Wealth and Assets Survey 2010–12, May 2014
96. ONS, Defined Contribution (DC) pension savings, 26 June 2014
97. Author calculation from ONS, Household and NPISH Total Net Worth, CGRC
98. Author calculation from Natwest House Price Index
99. DCLG, Table 208 House building permanent dwellings started, by tenure and country, December 2014

Endnotes – 61
100. Author calculation from Natwest House Price Index
101. Gregory Clark, “What Were the British Earnings and Prices Then? (New Series)” MeasuringWorth, 2015
102. ONS, Composite Price Index, CDK0
103. ONS, Wealth in Great Britain Wave 3 2010–2012 Release, May 2014
104. ONS, Wealth in Great Britain Wave 3 2010–2012 Release, May 2014
105. Jonathan Haskel and Stian Westlake, “Long to the Intangibles”, The Economist, February 20 2014, http://www.economist.com/blogs/freeex-change/2014/02/investment?fsrc=scn%2Ftw_ec%2Flook_to_the_intangibles
106. Department for Transport, Action for Roads: A network for the 21st century, July 2013
107. Natalie Thomas, “The UK hasn’t had a new runway in 60 years – that could soon change”, The Telegraph, 7th December 2013
108. http://nats.aero/blog/2013/09/how-gatwick-broke-its-own-world-record/
109. Ofgem, Electricity Capacity Assessment Report, 2014
110. Hansard HC Deb 10 September 1931 vol 256 cc297–8
111. Bank of England, Three Centuries of Data,2010
112. George Trefgarne, Metroboom: Lessons from Britain’s recovery in the 1930s, Centre for Policy Studies, 2012
113. John Maynard Keynes, The Economy Bill, September 1931
114. The Bank of England’s May 2014 Inflation Report, for example, argued that QE boosted real GDP by 2.5%.
115. Scott Sumner, “Three widely held theories discred-ited in 5 minutes”, TheMoneyIlusion, 31 October 2014, http://www.themoneyillusion.com/?p=27884
116. Scott Sumner, Keynesian confirmation bias, EconLog, January 30, 2014, http://econlog.econlib.org/archives/2014/01/keynesian_confi.html
117. OBR, Forecast evaluation report, October 2014
118. IMF, Fiscal Monitor, November 2010
119. OBR, Public finances databank, December 2014
120. These numbers are from Jon Riley & Robert, Crisis and Consolidation in the public finances, OBR, September 2014. They don’t include policies announced at the December 2014 Autumn Statement, which had relatively minor impact on the short term finacnes.
121. Author calculation against a 2009/10 baseline, grown by inflation, using HM Treasury, Public Expenditure Statistical Analyses 2014, July 2014
122. HM Treasury, Public Expenditure Statistical Analyses 2014, July 2014
123. OBR, Policy measures database, April 2014
124. ONS, Patterns of Pay, 1997 – 2013 ASHE Results, 2014
125. OBR, Public finances databank, December 2014
126. Rowena Crawford, Carl Emmerson, Soumaya Keynes, Gemma Tetlow, Fiscal aims and austerity: the parties’ plans compared, IFS, December 2014
127. Jeffrey A. Frankel, Over-optimism in forecasts by official budget agencies and its implications, 2011
128. ONS, The Effects of Taxes and Benefits on Household Income, 2012/13, June 2014
129. Increase in ONS, Total Market Sector GVA
130. OBR, Public finances databank, December 2014
131. OBR, Economic and financial outlook, March 2012
132. DWP, Benefit expenditure and caseload tables, 2014
133. Rt Hon Francis Maude MP, Sprint 14: speech by Francis Maude, 29 January 2014, https://www.gov.uk/government/speeches/sprint-14-speech-by-francis-maude
134. Matt Ridley, “To avoid bif IT catastrophes, follow Darwin”, The Times, December 15 2014
135. Jonathan Cribb, Carl Emmerson and Luke Sibieta, “Public private pay differential broadly back to pre-crisis levels; pensions remain a big difference between sectors”, IFS, 9th October 2014
136. OBR, Fiscal sustainability report, Jul 2014
137. Author calculation from HM Treasury, Public Expenditure Statistical Analyses 2014, July 2014

Chapter Title – 63Chapter Title – 63
Jonathan Dupont joined Policy Exchange
in April 2014 as a Research Fellow in the
Economics & Social Policy Unit. Prior to
joining, he has worked as a parliamentary
researcher, an independent economic
researcher and an analyst for the There is
Nothing British about the BNP campaign.
He has co-written multiple books on public
policy, and a paper on fiscal rules – Binding
the Hands of Government – for the Institute
of Economic Affairs. Jonathan read
Philosophy, Politics and Economics at the
University of Oxford.
ABOUT THE AUTHOR

64 – Economics Manifesto
policyexchange.org.uk
#ECONOMICSMANIFESTO
Policy Exchange is the UK’s leading think
tank. We are an educational charity whose
mission is to develop and promote new policy
ideas that will deliver better public services,
a stronger society and a more dynamic
economy. Registered Charity no: 1096300.
Policy Exchange is committed to an evidence-
based approach to policy development. We
work in partnership with academics and
other experts and commission major studies
involving thorough empirical research of
alternative policy outcomes. We believe that
the policy experience of other countries offers
important lessons for government in the UK.
We also believe that government has much to
learn from business and the voluntary sector.