Embed Size (px)
Citation preview
8/12/2019 Economics - Long Answer
http://slidepdf.com/reader/full/economics-long-answer 1/34
Long Answers
1. Firms maximize profit where marginal cost equals marginal revenue (MC =MR).Using a diagram explain why this is the case.
In economics, profit maximization is the (short run) process by which a firm determines the
price and output level that returns the greatest profit. There are several approaches to this
problem. The total revenue–total cost method relies on the fact that profit equals revenue
minus cost, and the marginal revenue–marginal cost method is based on the fact that total
profit in a perfectly competitive market reaches its maximum point where marginal revenue
equals marginal cost.
Basic definitions
Any costs incurred by a firm may be classed into two groups: fixed costs and variable costs.
Fixed costs are incurred by the business at any level of output, including zero output. Thesemay include equipment maintenance, rent, wages, and general upkeep. Variable costs
change with the level of output, increasing as more product is generated. Materials
consumed during production often have the largest impact on this category. Fixed cost and
variable cost, combined, equal to total cost
Revenue is the amount of money that a company receives from its normal business
activities, usually from the sale of goods and services (as opposed to monies from security
sales such as equity shares or debt issuances).
Marginal cost and revenue, depending on whether the calculus approach is taken or not, are
defined as either the change in cost or revenue as each additional unit is produced, or the
derivative of cost or revenue with respect to quantity output. It may also be defined as the
addition to total cost or revenue as output increase by a single unit. For instance, taking the
first definition, if it costs a firm 400 USD to produce 5 units and 480 USD to produce 6, the
marginal cost of the sixth unit is approximately 80 dollars, although this is more accurately
stated as the marginal cost of the 5.5th unit due to linear interpolation. Calculus is capable
of providing more accurate answers if regression equations can be provided.
Total revenue - total cost method
8/12/2019 Economics - Long Answer
http://slidepdf.com/reader/full/economics-long-answer 2/34
Profit Maximization - The Totals Approach
To obtain the profit maximising output quantity, we start by recognizing that profit is equal
to total revenue (TR) minus total cost (TC). Given a table of costs and revenues at each
quantity, we can either compute equations or plot the data directly on a graph. Finding the
profit-maximizing output is as simple as finding the output at which profit reaches its
maximum. That is represented by output Q in the diagram.
There are two graphical ways of determining that Q is optimal. First, the profit curve is at its
maximum at this point (A). Secondly, at the point (B) the tangent on the total cost curve
(TC) is parallel to the total revenue curve (TR), meaning that the surplus of revenue net of
costs (B,C) is at its greatest. Because total revenue minus total costs is equal to profit, the
line segment C,B is equal in length to the line segment A,Q.
Computing the price at which to sell the product requires knowledge of the firm's demandcurve. The price at which quantity demanded equals profit-maximizing output is the
optimum price to sell the product.
Marginal revenue-marginal cost method
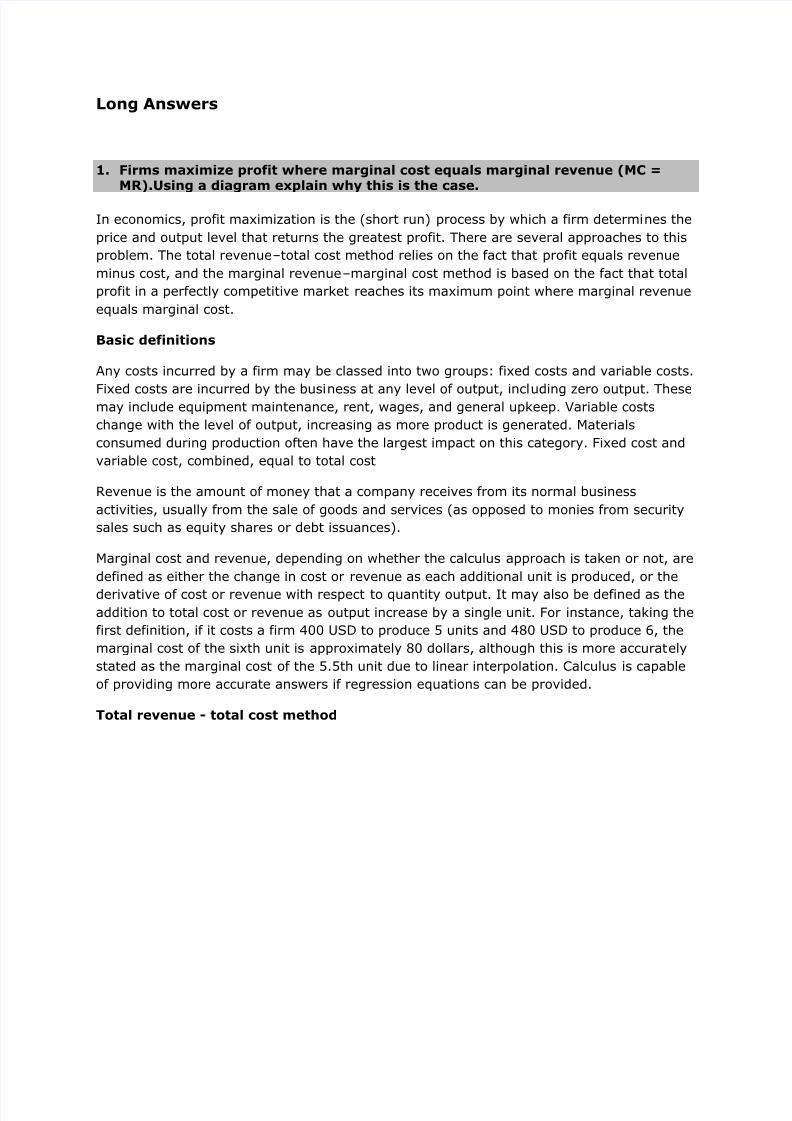
Profit maximization using the marginal approach
8/12/2019 Economics - Long Answer
http://slidepdf.com/reader/full/economics-long-answer 3/34
An alternative argument says that for each unit sold, marginal profit (Mπ) equals marginal
revenue (MR) minus marginal cost (MC). Then, if marginal revenue is greater than marginal
cost, marginal profit is positive, and if marginal revenue is less than marginal cost, marginal
profit is negative. When marginal revenue equals marginal cost, marginal profit is zero.[1]
Since total profit increases when marginal profit is positive and total profit decreases when
marginal profit is negative, it must reach a maximum where marginal profit is zero - orwhere marginal cost equals marginal revenue. If there are two points where this occurs,
maximum profit is achieved where the producer has collected positive profit up until the
intersection of MR and MC (where zero profit is collected), but would not continue to after,
as opposed to vice versa, which represents a profit minimum.[1] In calculus terms, the
correct intersection of MC and MR will occur when:[1]
The intersection of MR and MC is shown in the next diagram as point A. If the industry is
perfectly competitive (as is assumed in the diagram), the firm faces a demand curve (D)
that is identical to its Marginal revenue curve (MR), and this is a horizontal line at a pricedetermined by industry supply and demand. Average total costs are represented by curve
ATC. Total economic profit are represented by area P,A,B,C. The optimum quantity (Q) is
the same as the optimum quantity (Q) in the first diagram.
2. What is Cartel?
A cartel is defined as a group of firms that gets together to make output and price
decisions. The conditions that give rise to an oligopolistic market are also conducive to the
formation of a cartel; in particular, cartels tend to arise in markets where there are few
firms and each firm has a significant share of the market. In the U.S., cartels are illegal;
however, internationally, there are no restrictions on cartel formation. The organization ofpetroleum-exporting countries (OPEC) is perhaps the best-known example of an
international cartel; OPEC members meet regularly to decide how much oil each member of
the cartel will be allowed to produce.
Why are most cartel doomed to failure in the long run if they use their cartel
power?
Analysis demonstrates that a cartel is an inherently unstable form of operation. If the joint
pooling of assets in a common cause proves in the long run to be profitable for each of the
individual members of the cartel, then they will act formally to merge into one large firm.
The cartel then disappears in the merger. On the other hand, if the joint action proves
unprofitable for one or more members, the dissatisfied firm or firms will break away from
the cartel, and, as we shall see, any such independent action almost always destroys the
cartel. The cartel form, therefore, is bound to be highly evanescent and unstable.
If joint action is the most efficient and profitable course for each member, a merger will
soon take place. The very fact that each member firm retains its potential independence in
the cartel means that a breakup could take place at any time. The cartel will have to assign
production totals and quotas to each of the member firms. This is likely to lead first to a

8/12/2019 Economics - Long Answer
http://slidepdf.com/reader/full/economics-long-answer 4/34
good deal of bickering among the firms over the assignment of quotas, with each member
attempting to gain a larger share of the assignment. Whatever basis quotas are assigned on
will necessarily be arbitrary and will always be subject to challenge by one or more
members. In a merger, or in the formation of one corporation, the stockholders, by majority
vote, form a decision-making organization. In the case of a cartel, however, disputes arise
among independent owning entities.
Particularly likely to be restive under the imposed joint action will be the more efficient
producers, who will be eager to expand their business rather than be fettered by shackles
and quotas to provide shelter for their less efficient competitors. Clearly, the more efficient
firms will be the ones to break up the cartel. This will be increasingly true as time goes on
and conditions change from the time the cartel was first formed. The quotas, the jealously
made agreements that formerly seemed plausible to all, now become intolerable
restrictions for the more efficient firms, and the cartel soon breaks up; for once one firm
breaks away, expands output and cuts prices, the others must follow.
If the cartel does not break up from within, it is even more likely to do so from without. To
the extent that it has earned unusual monopoly profits, outside firms and outside producers
will enter the same field of production. Outsiders, in short, rush in to take advantage of the
higher profits. But once one strong competitor arises to challenge it, the cartel is doomed.
For as the firms in the cartel are bound by production quotas, they must watch new
competitors expand and take away sales from them at an accelerating rate. As a result, the
cartel must break up under the pressure of the newcomers‘ competition.
Or
In oligopoly, the firms compete with one another rather than collude. Colluding or collusion
means jointly deciding the total output for the industry and the market price, and
formulating an allocation rule as to who will produce how much. If the firms do collude,collectively they behave like a monopoly or a cartel. A cartel essentially raises the price of
the product by restricting output. Under the cartel, the total (monopoly) profits are higher
than the sum of the profits in oligopoly competition (irrespective of the form of oligopoly
competition). The quota system dictating who produces how much is devised such that
every member (firm) of the cartel is better off (that is, enjoys higher profit), compared to
oligopoly competition. Yet the firms do not collude or form cartels on regular basis as
colluding or forming a business cartel is illegal in many countries because of its anti-
competitive (high-price) effects, which hurt the consumers. However, for products that are
primarily exported by a country, there is no such concern because higher prices would hit
the consumers in the foreign countries, not the domestic consumers. This is why, over time,
many cartels have come up typically in international markets. OPEC is, of course, the bestexample. But cartels have been formed in many products including steel and vitamin.
However, there is an inherent problem with any cartel, even if it may be legal —a member of
a cartel has an incentive to ‗cheat‘ and secretly break the already agreed upon cartel rules.
This can be understood by using fowling figure. The MC curve denotes the marginal cost
curve of a cartel member. Suppose the cartel has fixed the price of the product at p r, which
is presumably higher than the price that would prevail under oligopoly competition. Such a
8/12/2019 Economics - Long Answer
http://slidepdf.com/reader/full/economics-long-answer 5/34
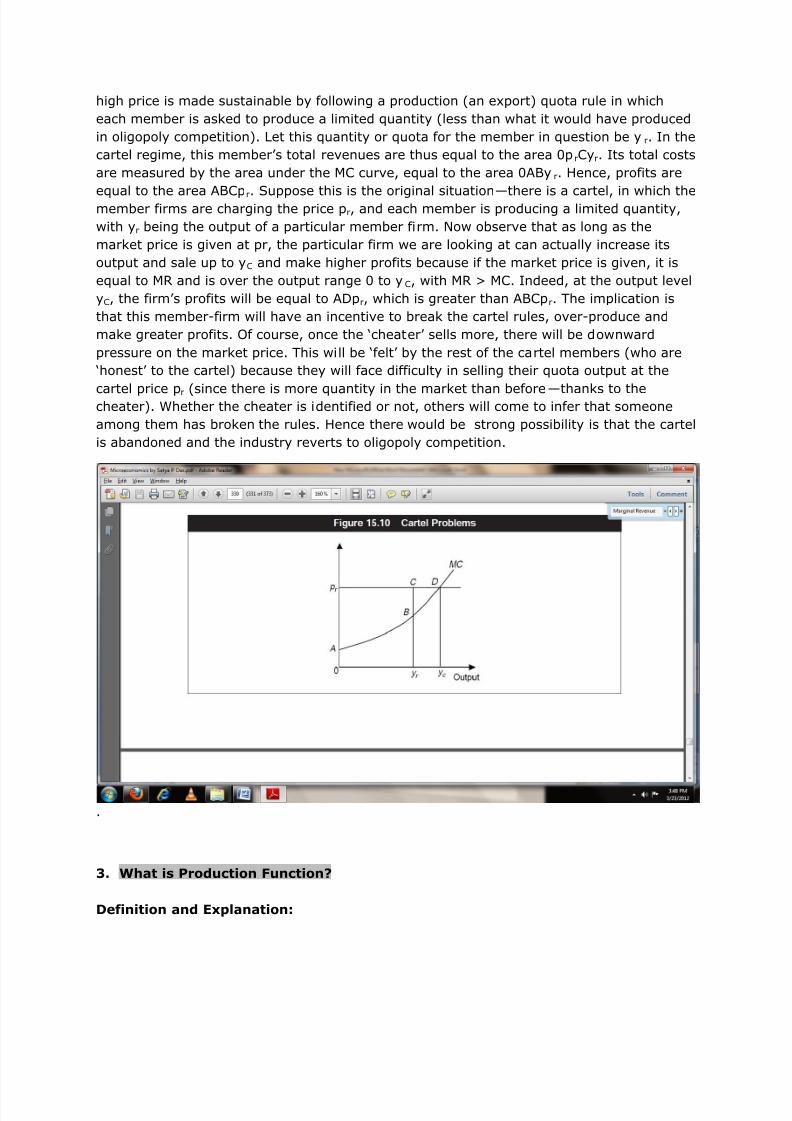
high price is made sustainable by following a production (an export) quota rule in which
each member is asked to produce a limited quantity (less than what it would have produced
in oligopoly competition). Let this quantity or quota for the member in question be y r. In the
cartel regime, this member‘s total revenues are thus equal to the area 0p rCyr. Its total costs
are measured by the area under the MC curve, equal to the area 0ABy r. Hence, profits are
equal to the area ABCpr. Suppose this is the original situation—there is a cartel, in which themember firms are charging the price pr, and each member is producing a limited quantity,
with yr being the output of a particular member firm. Now observe that as long as the
market price is given at pr, the particular firm we are looking at can actually increase its
output and sale up to yC and make higher profits because if the market price is given, it is
equal to MR and is over the output range 0 to yC, with MR > MC. Indeed, at the output level
yC, the firm‘s profits will be equal to ADpr, which is greater than ABCpr. The implication is
that this member-firm will have an incentive to break the cartel rules, over-produce and
make greater profits. Of course, once the ‗cheater‘ sells more, there will be downward
pressure on the market price. This will be ‗felt‘ by the rest of the cartel members (who are
‗honest‘ to the cartel) because they will face difficulty in selling their quota output at the
cartel price pr (since there is more quantity in the market than before—thanks to thecheater). Whether the cheater is identified or not, others will come to infer that someone
among them has broken the rules. Hence there would be strong possibility is that the cartel
is abandoned and the industry reverts to oligopoly competition.
.
3. What is Production Function?
Definition and Explanation:
8/12/2019 Economics - Long Answer
http://slidepdf.com/reader/full/economics-long-answer 6/34
Production of goods requires resources or inputs. These inputs are called factors of
production named as land, labor, capital and organization. A rational producer is always
interested that he should get the maximum output from the set of resources or inputs
available to him. He would like to combine these inputs in a technical efficient manner so
that he obtains maximum desired output of goods. The relationship between the inputs and
the resulting output is described as production function.
A production function shows the relationship between the amounts of factors used and the
amount of output generated per period of time.
Formula:
It can be expressed in algebraic form as under:
X = f (a1, a2 ,........, an)
This equation tells us the quantity of the product X which can be produced by the given
quantities of inputs (lands labor, capital) that are used in the process of production. Here it
may be noted that production function shows only the maximum amount of output which
can be produced from given inputs. It is because production function includes only efficient
production process.
The analysis of production function is generally carried with reference to time period which
is called short period and long period. In the short run, production function is explained with
one variable factor and other factors of productions are held constant. We have called this
production function as the Law of Variable Proportions or the Law of Diminishing returns.
In the long run, production function is explained by assuming all the factors of production as
variable. There are no fixed inputs in the long run. Here the production function is called the
Law of Returns according to the scale of production.
As it is difficult to handle more than two variables in graph, we therefore, explain the Law of
Returns according to scale of production by assuming only two inputs i.e., capital and labor
and study how output responds to their use.
Managerial use of production function?
In microeconomics, a production function asserts that the maximum output of a
technologically-determined production process is a mathematical production of input factors
of production. Considering the set of all technically feasible combinations of output and
inputs, only the combinations encompassing a maximum output for a specified set of inputs
would constitute the production function. Alternatively, a production function can be definedas the specification of the minimum input requirements needed to produce designated
quantities of output, given available technology. It is usually presumed that unique
production functions can be constructed for every production technology.
By assuming that the maximum output technologically possible from a given set of inputs is
achieved, economists using a production function in analysis are abstracting away from the
engineering and managerial problems inherently associated with a particular production
8/12/2019 Economics - Long Answer
http://slidepdf.com/reader/full/economics-long-answer 7/34
process. The engineering and managerial problems of technical efficiency are assumed to be
solved, so that analysis can focus on the problems of allocative efficiency. The firm is
assumed to be making allocative choices concerning how much of each input factor to use,
given the price of the factor and the technological determinants represented by the
production function. A decision frame, in which one or more inputs are held constant, may
be used; for example, capital may be assumed to be fixed or constant in the short run, andonly labour variable, while in the long run, both capital and labour factors are variable, but
the production function itself remains fixed, while in the very long run, the firm may face
even a choice of technologies, represented by various, possible production functions.
The relationship of output to inputs is non-monetary, that is, a production function relates
physical inputs to physical outputs, and prices and costs are not considered. But, the
production function is not a full model of the production process: it deliberately abstracts
away from essential and inherent aspects of physical production processes, including error,
entropy or waste. Moreover, production functions do not ordinarily model the business
processes, either, ignoring the role of management, of sunk cost investments and the
relation of fixed overhead to variable costs.
The primary purpose of the production function is to address allocative efficiency in the use
of factor inputs in production and the resulting distribution of income to those factors. Under
certain assumptions, the production function can be used to derive a marginal product for
each factor, which implies an ideal division of the income generated from output into an
income due to each input factor of production.
4. Opportunity cost principle
Opportunity costs are cash outflows prevented by taking one course of action instead of
another. They include returns, which the entrepreneur could have earned in alternative use
of his services and capital.
The concept of opportunity cost occupies a very important place in modern economic
analysis. The opportunity costs or alternative costs are the return from the second best use
of the firm‘s resources which the firm forgoes in order to avail itself of the return from the
best use of the resources. To take an example, a farmer who is producing wheat can also
produce potatoes with the same factors. Therefore, the opportunity cost of a quintal of
wheat is the amount of the output of potatoes given up. Thus we find that opportunity cost
of anything is the next best alternative that could be produced instead by the same factors
or by an equivalent group of factors, costing the same amount of money. Two points must
be noted in this definition. Firstly, the opportunity cost of anything is only the next best
alternative foregone. Secondly, in the above definition is the addition of the qualification orby an equivalent group of factors costing the same amount of money.
The alternative or opportunity cost of a good can be given a money value. In order to
produce a good the producer has to employ various factors of production and have to pay
them sufficient prices to get their services. These factors have alternative uses.
The factor must be paid at least the price they are able to obtain in the alternative uses.
Suppose a businessman can buy either a washing machine or a press machine with his

8/12/2019 Economics - Long Answer
http://slidepdf.com/reader/full/economics-long-answer 8/34
limited resources and suppose that he can earn annually Rs. 40,000 and 60,000
respectively from the two alternatives. A rational businessman will certainly buy a press
machine that gives him a higher return. But, in the process of earning Rs. 60,000 he has
foregone the opportunity to earn Rs. 40,000 annually from the washing machine. Thus, Rs.
40,000 is his opportunity cost or alternative cost. The difference between
actual and opportunity costs is called economic rent or economic rent or economic profit.For example, economic profit from press machine in the above case is Rs.60,000 –Rs. 4000
= Rs. 20,000. So long as economic profit is above zero, it is rational to invest resources in
press machine.
5. Distinguish between “Movement along the Demand Curve” and “Shift of theDemand Curve”.
OR
What are the factors which can cause a “Shift in the Demand Curve” OR
Movement Vs Shifts of Demand Curve:
Changes in demand for a commodity can be shown through the demand curve in two ways:
(1) Movement Along the Demand Curve and (2) Shifts of the Demand Curve.
(1) Movement Along the Demand Curve:
Demand is a multivariable function. If income and other determinants of demand such astastes of the consumers, changes in prices of related goods, income distribution, etc.,remain constant and there is a change only in price of the commodity, then we move alongthe same demand curve.
In this case, the demand curve remains unchanged. When, as a result of change in price,the quantity demanded increases or decreases, it is technically called extension andcontraction in demand.
The demand curve, which represents various price quantity has a negative slope. Wheneverthere is a change in the quantity demanded of a good due to change, in its price, there is a
movement from one point price quantity combination to another on the
same demand curve. Such a movement from one point price quantity combination toanother along the same demand curve is shown in figure.
Diagram/Figure:
8/12/2019 Economics - Long Answer
http://slidepdf.com/reader/full/economics-long-answer 9/34
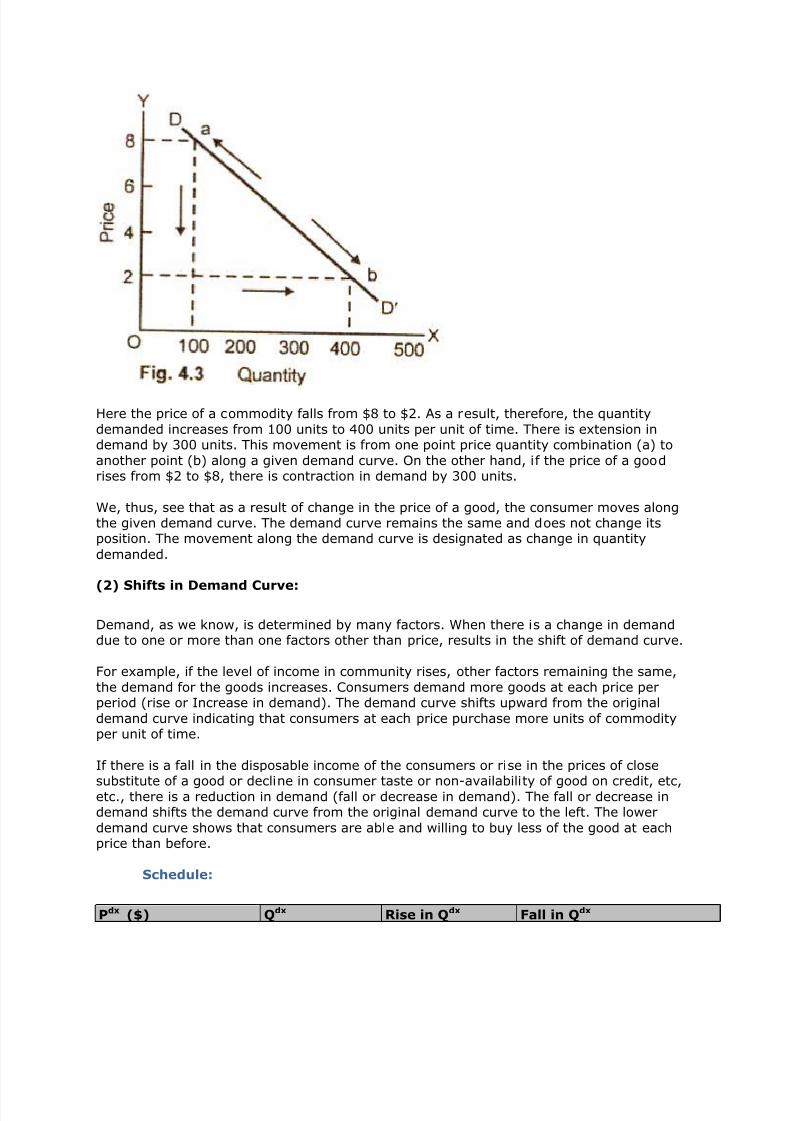
Here the price of a commodity falls from $8 to $2. As a result, therefore, the quantity
demanded increases from 100 units to 400 units per unit of time. There is extension indemand by 300 units. This movement is from one point price quantity combination (a) to
another point (b) along a given demand curve. On the other hand, if the price of a goodrises from $2 to $8, there is contraction in demand by 300 units.
We, thus, see that as a result of change in the price of a good, the consumer moves alongthe given demand curve. The demand curve remains the same and does not change itsposition. The movement along the demand curve is designated as change in quantity
demanded.
(2) Shifts in Demand Curve:
Demand, as we know, is determined by many factors. When there is a change in demanddue to one or more than one factors other than price, results in the shift of demand curve.
For example, if the level of income in community rises, other factors remaining the same,
the demand for the goods increases. Consumers demand more goods at each price perperiod (rise or Increase in demand). The demand curve shifts upward from the original
demand curve indicating that consumers at each price purchase more units of commodityper unit of time.
If there is a fall in the disposable income of the consumers or rise in the prices of close
substitute of a good or decline in consumer taste or non-availability of good on credit, etc,etc., there is a reduction in demand (fall or decrease in demand). The fall or decrease indemand shifts the demand curve from the original demand curve to the left. The lower
demand curve shows that consumers are able and willing to buy less of the good at eachprice than before.
Schedule:
Pdx ($) Qdx Rise in Qdx Fall in Qdx

8/12/2019 Economics - Long Answer
http://slidepdf.com/reader/full/economics-long-answer 10/34
12 100 300 50
6 250 500 200
4 500 600 300
Diagram/Figure:
In this figure, the original demand curve is DD/.
At a price of $12 per unit, consumers purchase 100 units. When price falls to$4 per unit, thequantity demanded increases to 500 units per unit of time. Let us assume now that level of
income increases in a community. Now consumers demand 300 units of the commodity atprice of $12 per unit and 600 at price of $4 per unit.
As a result, there is an upward shift of the demand curve DD2. In case the community
income falls, there is then decrease in demand at price of $12 per unit. The quantity
demanded of a good falls to 50 units. It is 300 units at price of $4 unit per period of time.There is a downward shift of the demand to the left of the original demand curve.
Summing Up:
(i) Extension in demand is due to reduction in price.
(ii) Increase in demand occurs due to changes in factors other than price.
(iii) Contraction in demand is the result of a rise in the price commodity.
(iv) A decrease in demand follows a change in factors other than price.

8/12/2019 Economics - Long Answer
http://slidepdf.com/reader/full/economics-long-answer 11/34
(v) Changes in demand both increase and decrease are represent shifts in the demand
curve.
(vi) Changes in the quantity demanded are represented by move along the same demandcurve.
6. What are the factors which can cause a “Shift in the Demand Curve”
Demand shifters
Changes in disposable income
Changes in tastes and preferences - tastes and preferences are assumed to be fixedin the short-run. This assumption of fixed preferences is a necessary condition for
aggregation of individual demand curves to derive market demand.
Changes in expectations.
Changes in the prices of related goods (substitutes and complements)
Population size and composition
Changes that decrease demand
Some circumstances which can cause the demand curve to shift in include:
decrease in price of a substitute
increase in price of a complement
decrease in income if good is normal good
increase in income if good is inferior good
Factors affecting market demand
Market or aggregate demand is the summation of individual demand curves. In addition tothe factors which can affect individual demand there are three factors that can affect market
demand (cause the market demand curve to shift):
a change in the number of consumers,
a change in the distribution of tastes among consumers,
a change in the distribution of income among consumers with different tastes.
7. J.M Keynes (British Economist)
- What was the solution suggested by John Maynard Keynes to deal with
the Great Depression of 1929?
- What are the ideas of Keynes which can be utilized to tackle the Global
Recession of 2008-2009?
- In what region of Short Run Aggregate supply curve will Keynes
Prescription work?
- What is the prescription of J.M Keynes for smoothening business cycle?
Ans. Keynesian economics is an economic theory named after John Maynard Keynes, a
British economist who lived from 1883 to 1946. He is most well-known for his simple
explanation for the cause of the Great Depression. His economic theory was based
on a circular flow of money, which refers to the idea that when spending increases in
an economy, earnings also increase, which can lead to even more spending and
8/12/2019 Economics - Long Answer
http://slidepdf.com/reader/full/economics-long-answer 12/34
earnings. Keynes' ideas spawned numerous interventionist economic policies during
the Great Depression.
In Keynes' theory, one person's spending goes towards another person's earnings,
and when that person spends his or her earnings, he or she is, in effect, supporting
another person's earnings. This cycle continues on and helps support a normal,functioning economy. When the Great Depression hit, people's natural reaction was
to hoard their money. Under Keynes' theory, this stopped the circular flow of money,
keeping the economy at a standstill.
Keynes' solution to this poor economic state was to "prime the pump." He argued
that the government should step in to increase spending, either by increasing the
money supply or by actually buying things itself. During the Great Depression,
however, this was not a popular solution. It is said, however, that the massive
defence spending that United States president Franklin Delano Roosevelt initiated
helped revive the U.S. economy.
Keynesian economics advocates for the public sector to step in to assist the economy
generally, which is a significant departure from popular economic thought that
preceded it — laissez-faire capitalism. Laissez-faire capitalism supported the
exclusion of the public sector in the market. The belief was that an unfettered
market would achieve balance on its own.
Keynesian economics warns against the practice of too much saving and not enough
consumption, or spending, in an economy. It also supports considerable
redistribution of wealth, when needed. Keynesian economics further concludes that
there is a pragmatic reason for the massive redistribution of wealth: if the poorer
segments of society are given sums of money, they will likely spend it, rather than
save it, thus promoting economic growth. Another central idea of Keynesianeconomics is that trends in the macroeconomic level can disproportionately influence
consumer behaviour at the micro-level.
The neoclassical synthesis Keynesian approach explained unemployment in terms of
wage rigidity, but did not relate the analysis to optimizing micro foundations. The
new Keynesian approach tries to develop Keynesian economics to address this
problem. An early branch of this approach merely introduced fixed prices and wages
into the standard micro-founded general equilibrium model, examining disequilibrium
situations in which actual transactions occurred at the ―short‖ side of the market and
the effects of such deviations from market clearing in one market spilled over into
other markets. Another branch of the approach responded directly to the monetarist
and rational expectations approaches, introducing wage price stickiness (such as
staggered or sticky wage adjustment) into models with rational expectations to show
that it is complete wage flexibility, rather than the assumption about expectations,
that produced the policy ineffectiveness result. A final, and most popular new
Keynesian branch, provided optimizing micro foundations to wage, price, and interest
rate rigidity. Efficiency wages (which prevent the wage from falling when
unemployment exists because of its adverse effect on labour efficiency) and wage
8/12/2019 Economics - Long Answer
http://slidepdf.com/reader/full/economics-long-answer 13/34
bargaining, imperfect competition and the ―menu‖ costs of price changes, and
asymmetric information in credit markets have been used to explain these rigidities.
Some models, such as those that distinguish the role of insiders and outsiders in the
wage determination process, imply that aggregate demand changes can have long-
term effects on output due to what are called hysteresis effects. While some new
Keynesian models imply involuntary unemployment in equilibrium, others do not, butimply only that aggregate demand policies can have effects on output.
In the wake of the financial crisis of 2007–2010 the free market consensus began to
attract negative comment even by mainstream opinion formers from the economic
right, leading to a reassessment or even reversal of normative judgments on anumber of topics. The Keynesian view receiving most attention has been fiscalstimulus. In late 2008 and 2009 fiscal stimulus packages were widely launched
across the world, with packages in G20 countries averaging at about 2% of GDP,
with a ratio of public spending to tax cuts of about 2:1. The stimulus in Europe wasnotably smaller than for other large G20 countries. Other areas where opinion hasshifted back towards a Keynesian perspective include:
Global trade imbalances. Keynes placed great importance on avoiding large tradedeficits or surpluses, but following the Keynesian displacement an influential view in
the West was that governments need not be concerned about them. From late 2008imbalances are once again widely seen as an area for government concern. In
October 2010 the US suggested a possible plan to address global imbalances, with
targets to limit current account surpluses similar to those proposed by Keynes atBretton Woods.
Capital Controls. Keynes strongly favoured the use of controls to restrain
international capital movement, especially short term speculative flows. During 2009
and 2010 capital controls have once again came to be seen as an acceptable part ofa governments macroeconomic policy toolkit, though institutions like the IMF still
caution against overuse. In contrast to stimulus policies, the return to favour of
capital controls still had momentum as of late 2011.
Scepticism concerning the role of maths in academic economics and in economic decision
making. While the resurgence has seen no general reversal of opinion on the utility ofcomplex math, there have been numerous calls for a broadening of economics to make
further use of disciplines other than maths. In the practical spheres of banking and finance,
there have been warnings against over reliance on mathematical models, which have beenheld up as one of the contributing causes of the 2008–2009 crises.
8. Profit Maximization
OR
Explain what is meant by the term profit maximization in economic theory and
how it can be achieved. Explain why Profit gets maximized at the point whereMR0=MC?
Related Questions:

8/12/2019 Economics - Long Answer
http://slidepdf.com/reader/full/economics-long-answer 14/34
- Write brief note on alternative objectives of forms, besides the objective
of profit maximization.
- „Besides profit Maximization business firms have other goals like sales
maximization, growth maximization, manager‟s utility maximization etc‟.
Discuss.
- “In normal & formal economic theory we can often assume profitmaximization. In reality, the firms do not maximize profit , in fact they
cannot”
- What are the alternatives to the hypothesis of profit maximization? How
far would it be correct to prefer satisficing as an alternative to profit
maximization?
Ans. Profit maximization is the (short run) process by which a firm determines the price
and output level that returns the greatest profit. There are several approaches to this
problem. The total revenue–total cost method relies on the fact that profit equals
revenue minus cost, and the marginal revenue–marginal cost method is based on
the fact that total profit in a perfectly competitive market reaches its maximum point
where marginal revenue equals marginal cost.
Let the firm think of producing one more unit than what it has been doing so far. If it
finds that the increase in costs to produce the extra unit is less than the increase dueto the extra unit, it will produce one more unit becomes its revenue increases morethan its costs by doing so and its profits increase. After increasing the output by one
unit, the firm may consider producing another extra unit. If it finds that the increase
in revenue due to second additional unit is more than the increase in costs due tothat second additional unit, the firm will decide to produce the second extra unit
because its profit increases. It will go on increasing its output so long as the latestunit adds to profit because the marginal revenue from the extra unit is higher the
marginal cost of the extra unit. When will it stop further increasing output by one
more unit. It will stop, if it finds that the latest extra unit adds to costs as much as itadds to revenue. Thus it stops increasing output at that level of output where itsmarginal cost equals its marginal revenue.
Again, if the firm finds that the mc>mr, it knows that the latest extra unit of outputhas added more to the total costs than it has added to the revenue. By reducing the
output by one unit, the firm saves more costs than it loses in revenue. Thus its
profits increase by reducing one unit from the output. Even at the lower output level,
the firm will again check whether by reducing output by one more unit again thetotal costs reduces by an amount more than the loss in revenue due to reduction offurther one unit of output. Thus so long as mc>mr, it pays if the firm goes on
reducing output. When will the firm stop? It will stop at that level of output at which
the reduction in costs on the latest unit of output is just equal to the reduction in therevenue on the latest output. This again means he stops where mr= mc.

8/12/2019 Economics - Long Answer
http://slidepdf.com/reader/full/economics-long-answer 15/34
The underlying assumption is that the marginal costs increases as output isincreased and further increased.
Profit is maximized where marginal profit is zero. Any increase or decrease in outputfrom this peak level will cause marginal profit to be equal to zero. Marginal profit is
zero, when marginal revenue equal marginal costs.
marginal cost is the change in total costs due to a small (one unit) change in output
level., while marginal revenue is the change in total revenue due to a small (oneunit) change in output.
Alternatives to profit maximization theories
The standard neo-classical assumption is that a business seeks to maximise profitsfrom producing and selling an output in a market. However there are other
objectives firms might decide to pursue and this has implications for price, output
and economic welfare. A second point is that it is difficult for firms to identify theirprofit maximizing output, as they cannot accurately calculate marginal revenue and
marginal costs.
Traditional economic theory assumes there is a single goal. Behavioural economistsargue differently Any corporation is an organization with various groups
- Employees
- Managers
- Shareholders
- Customers
Each of these groups is likely to have different objectives or goals. The dominant
group at any moment in time can give greater emphasis to their own objectives - forexample the main price and output decisions may be taken at local level bymanagers - with shareholders taking only a distant view of the company's
performance and strategy.
Satisfying
Maximizing behavior may be replaced by satisfying - I.e. setting minimum acceptable
levels of achievement. The domestic and international Equity and Bond markets mayplay an important role in monitoring the performance of managers in a company -
when companies are under-performing set against the performance of otherbusinesses in a market, there may be downward pressure on the share price, raising
the threat of a contested takeover bid by a rival firm. A firm may be under pressureto reduce prices to consumers if it has made large profits and may choose to do thisin order to stop an investigation by the Competition Commission or to improve its
image with customers.
Alternatively, the firm may reward workers with higher wages in order to stopindustrial action.

8/12/2019 Economics - Long Answer
http://slidepdf.com/reader/full/economics-long-answer 16/34
Sales Revenue Maximization
This objective was initially developed by the work of Baumol (1959). Baumol'sresearch focused on the behaviour of manager-controlled businesses - where the
day-to-day decisions taken by managers are divorced from the shareholders (theowners of the business). Baumol argued that annual salaries and other perks might
be more closely correlated with total sales revenue rather than bottom line profits.An alternative view was put forward by Williamson (1963), who built a model based
on the concept of managerial satisfaction (utility). This can be enhanced by successin raising sales revenue.
Total revenue is maximised when marginal revenue = zero. The shareholders of a
business may introduce a constraint on the price and output decisions of managers -this is known as constrained sales revenue maximization. They may introduce a
minimum profit constraint designed to underpin the market valuation of their sharesand maintain a dividend (a share of the company's profits).
Limit Pricing
Firms may adopt predatory pricing policies by lowering prices to a level that would
force any new firms entering the industry to operate at a loss. This would allow firms
to sustain a monopoly position in a market.
9. Write brief note on degrees of Price discrimination
OR
Price Discrimination - Short Note
Ans. Price discrimination is the practice of one retailer, wholesaler, or manufacturer
charging different prices for the same items to different customer. This is a widespread
practice that does not necessarily imply negative discrimination.
Price discrimination, as it is now understood, is separated into degrees. First, second and
third degree price discrimination exist and apply to different pricing methods used by
companies. Much depends on the understanding of the market in segments, and also the
consumer‘s ability to pay a higher or lower price, called elasticity of demand . A person who
might pay more for an item is thought to have a low elasticity of demand. Another person
who will not pay as much has a high elasticity of demand.
First-degree price discrimination occurs when identical goods are sold at different prices to
each individual consumer. Obviously, the seller is not always going to be able to identify
who is willing to pay more for certain items, but when he or she can, his profit increases.
You can see this type of price discrimination in the sale of both new and used cars. People
will pay different prices for cars with identical features, and the salesperson must attempt to

8/12/2019 Economics - Long Answer
http://slidepdf.com/reader/full/economics-long-answer 17/34
gauge the maximum price at which the car can be sold. This type of price discrimination
often includes a bargaining aspect, where the consumer attempts to negotiate a lower price.
Second-degree price discrimination refers to companies charging lower prices for higher
quantities. In companies where a client orders in bulk and is able to purchase a high
number of the same items at once, the client may get a discounted rate. This rate would notapply to a client who only orders a few items at a time. In retail stores, second-degree price
discrimination often exists. A reduced price may be offered if you buy two t-shirts instead of
just one. This form helps to get rid of merchandise and generate more revenue for a
company.
Third degree price discrimination is based on understanding the market, and occurs withgreat frequency.
Group of People: This type takes many different forms, but in all cases attempts to derive
the most sales from each segmented ―group‖ of consumers. For example, senior citizens are
considered a group, and are often offered discounts at movie theatres, for transportation, inrestaurants, and even in retail stores where seniors may have a ―senior day‖ each week thatallows them to take a discount on merchandise. ―Students‖ are another segmented group
that may be offered lower prices. Both seniors and students have a higher elasticity of
demand and can generally afford to pay less than the average worker.
Geography: In this case a supplier charges for instance a different price in differentcountries. The price difference is only partially driven by different local costs. The main
driver is the willingness and ability of the local population to pay for the product.
Market segmentation may also evaluate the socio-economic aspects of an area when
considering elasticity of demand. It‘s not uncommon to see retail grocery stores offer
differing prices in an area where the retailer knows he can get more money for a product.
Alternately, where only one chain store exists in a certain location, retail grocery stores
might offer higher prices because people have no alternative place to shop.
Another form of third degree price discrimination is temporary discounts for airfares that are
meant to increase business. These discounts could be seasonal, and designed to promote
the company. Those in urban areas may pay more for flights or hotel rooms than those in
rural areas.
10. Oligopoly
Explain the relevant economic models of oligopoly, which explain thefollowing 2 oligopoly market conditions:
a) Emergence of price war and war for market share
b) Price being sticky for some products in oligopoly market
- Game theory and its application in oligopoly market.
- Why is the behavior of firms in oligopoly difficult to predict?

8/12/2019 Economics - Long Answer
http://slidepdf.com/reader/full/economics-long-answer 18/34
- Explain the nature and characteristics of oligopoly market structure.
Give at least an example of oligopoly existing in any one industry in
India
- How is the price and output decision taken by a firm operating in an
industry, which has a few large producers/sellers? (Oligopoly)
Ans: An oligopoly is a market dominated by a few producers, each of which has control
over the market. It is an industry where there is a high level of marketconcentration. However, oligopoly is best defined by the conduct (orbehaviour) of firms within a market rather than its market structure. Normally
an oligopoly exists when the top five firms in the market account for more than 60%of total market demand/sales.
The three most important characteristics of oligopoly are: (1) an industry dominatedby a small number of large firms, (2) firms sell either identical or differentiatedproducts, and (3) the industry has significant barriers to entry.
Small Number of Large Firms
The most important characteristic of oligopoly is an industry dominated by a small
number of large firms, each of which is relatively large compared to the overall size
of the market. This characteristics gives each of the relatively large firms substantialmarket control. While each firm does not have as much market control as monopoly,
it definitely has more than a monopolistically competitive firm.
The total number of firms in an oligopolistic industry is not the key consideration. Aoligopoly firm actually can have a large number of firms, approaching that of any
monopolistically competitive industry. However, the distinguishing feature is that afew of the firms are relatively large compared to the overall market. A given industry
with a thousand firms, for example, is considered oligopolistic if the top five firms
produce half of the industry's total output.
Identical or Differentiate Products
Some oligopolistic industries produce identical products, like perfect competition in
this regard, while others produce differentiated products, more like monopolisticcompetition. In actuality it points out that oligopolistic industries come in twovarieties.
Identical Product Oligopoly: This type of oligopoly tends to process raw materials
or produce intermediate goods that are used as inputs by other industries.Notable examples are petroleum, steel, and aluminum.
Differentiate Product Oligopoly: This type of oligopoly tends to focus on goods
sold for personal consumption. The key is that people have different wants and
needs and thus enjoy variety. A few examples of differentiated oligopolisticindustries include automobiles, household detergents, and computers.
Barriers to Entry
Firms in an oligopolistic industry attain and retain market control through barriers to entry.
The most noted entry barriers are: (1) exclusive resource ownership, (2) patents andcopyrights, (3) other government restrictions, and (4) high start-up cost.
8/12/2019 Economics - Long Answer
http://slidepdf.com/reader/full/economics-long-answer 19/34
Barriers to entry are the key characteristic that separates oligopoly from monopolisticcompetition on the continuum of market structures. With few if any barriers to entry, firms
can enter a monopolistically competitive industry when existing firms receive economicprofit. This diminishes the market control of any given firm. However, with substantial entrybarriers found in oligopoly, firms cannot enter the industry as easily and thus existing firmsmaintain greater market control.
Oligopoly theory makes heavy use of game theory to model the behaviour of oligopolies:Stackelberg's duopoly. In this model the firms move sequentially .
Cournot's duopoly. In this model the firms simultaneously choose quantities
Bertrand's oligopoly. In this model the firms simultaneously choose prices
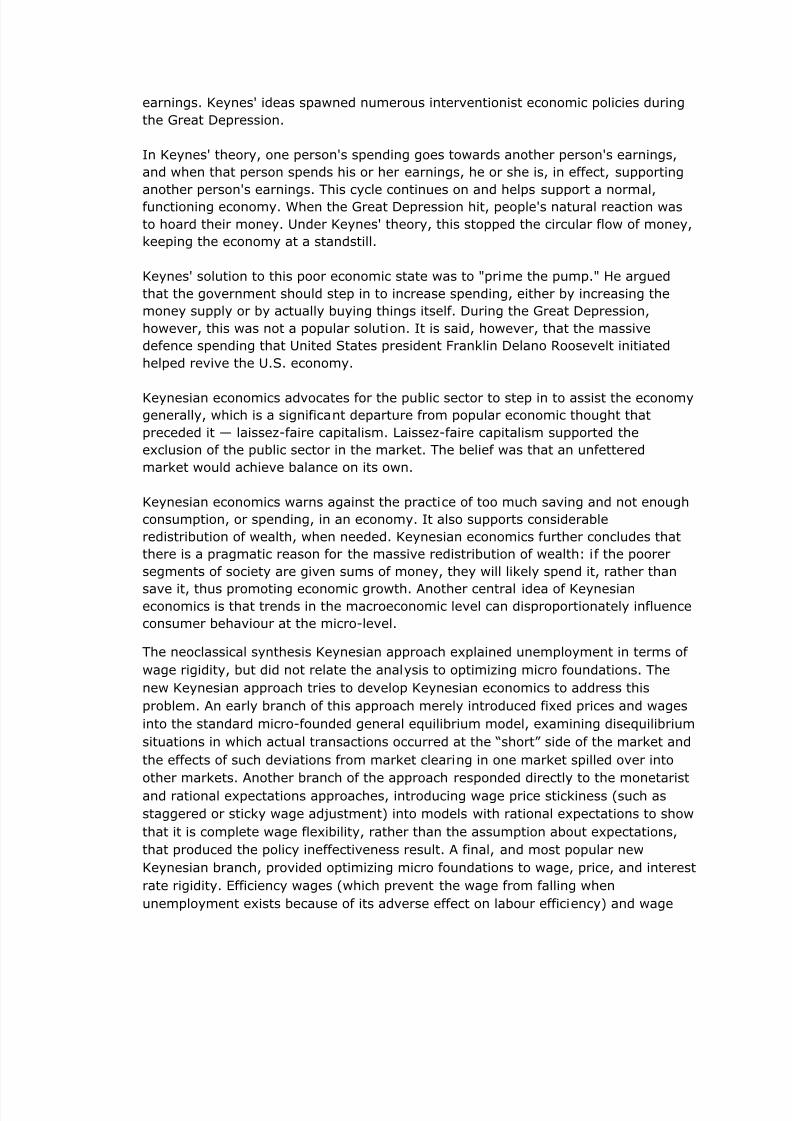
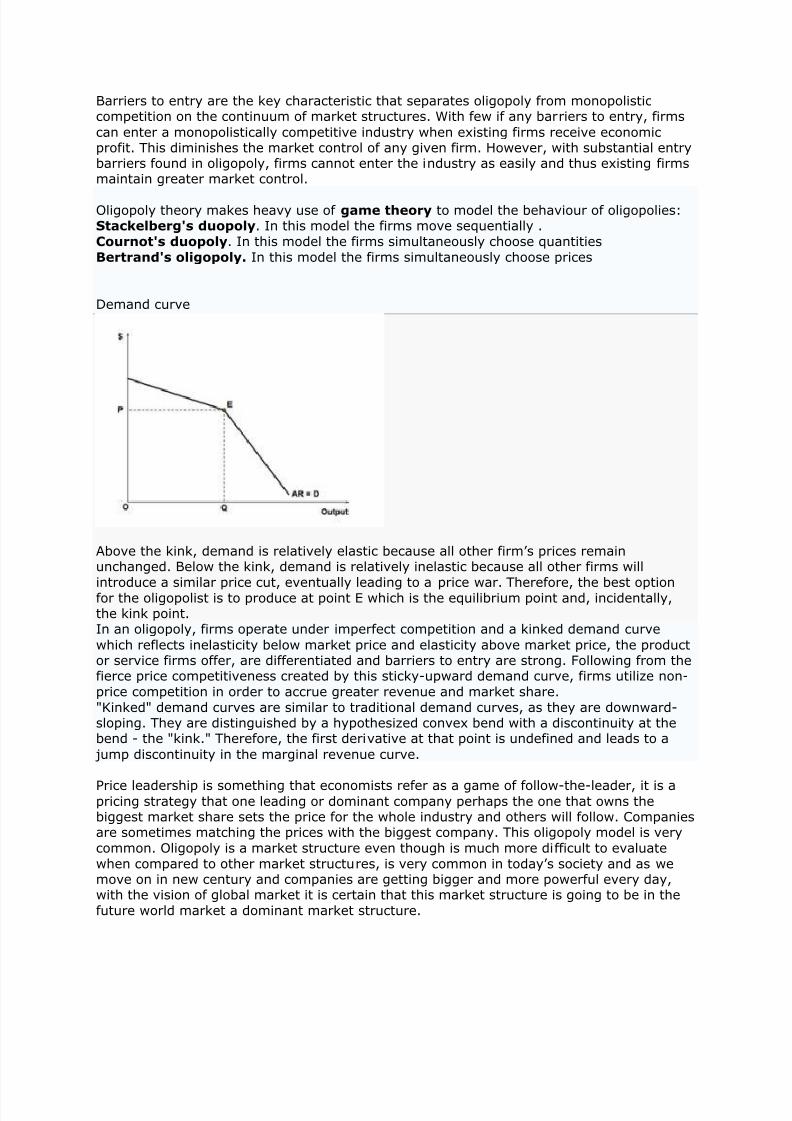
Demand curve
Above the kink, demand is relatively elastic because all other firm‘s prices remainunchanged. Below the kink, demand is relatively inelastic because all other firms will
introduce a similar price cut, eventually leading to a price war. Therefore, the best optionfor the oligopolist is to produce at point E which is the equilibrium point and, incidentally,the kink point.In an oligopoly, firms operate under imperfect competition and a kinked demand curve
which reflects inelasticity below market price and elasticity above market price, the productor service firms offer, are differentiated and barriers to entry are strong. Following from thefierce price competitiveness created by this sticky-upward demand curve, firms utilize non-
price competition in order to accrue greater revenue and market share.
"Kinked" demand curves are similar to traditional demand curves, as they are downward-sloping. They are distinguished by a hypothesized convex bend with a discontinuity at thebend - the "kink." Therefore, the first derivative at that point is undefined and leads to a
jump discontinuity in the marginal revenue curve.
Price leadership is something that economists refer as a game of follow-the-leader, it is apricing strategy that one leading or dominant company perhaps the one that owns thebiggest market share sets the price for the whole industry and others will follow. Companiesare sometimes matching the prices with the biggest company. This oligopoly model is very
common. Oligopoly is a market structure even though is much more difficult to evaluate
when compared to other market structures, is very common in today‘s society and as wemove on in new century and companies are getting bigger and more powerful every day,with the vision of global market it is certain that this market structure is going to be in the
future world market a dominant market structure.

8/12/2019 Economics - Long Answer
http://slidepdf.com/reader/full/economics-long-answer 20/34
11. Business Cycle
In simple terms, Business Cycle can be defined as the recurring and fluctuating levels ofeconomic activity that an economy experiences over a long period of time. The
term business cycle (or economic cycle) refers to economy-wide fluctuations in
production or economic activity over several months or years. These fluctuations occur
around a long-term growth trend. Business cycles are usually measured by considering the
growth rate of real gross domestic product. Despite being termed cycles, these fluctuations
in economic activity do not follow a mechanical or predictable periodic pattern.
The National Bureau of Economic Research (NBER), founded in New York in 1920, pioneered
research into understanding the repetitive sequences that underlie business cycles.
In general, a business cycle describes changes in the demand-side of the economy asmeasured by GDP, where:
GDP = C + I + G + NX
Over time, GDP does not remain constant and will change for many reasons, economic and
non-economic. Economic reasons include changes in government policies such as taxes and
interest rates. The non-economic reasons are too many to even consider listing, but include
factors such as war, drought, natural and man-made disasters
A business cycle is not a regular, predictable, or repeating phenomenon like the swing of
the pendulum of a clock. Its timing is random and, to a large degrees, unpredictable. A
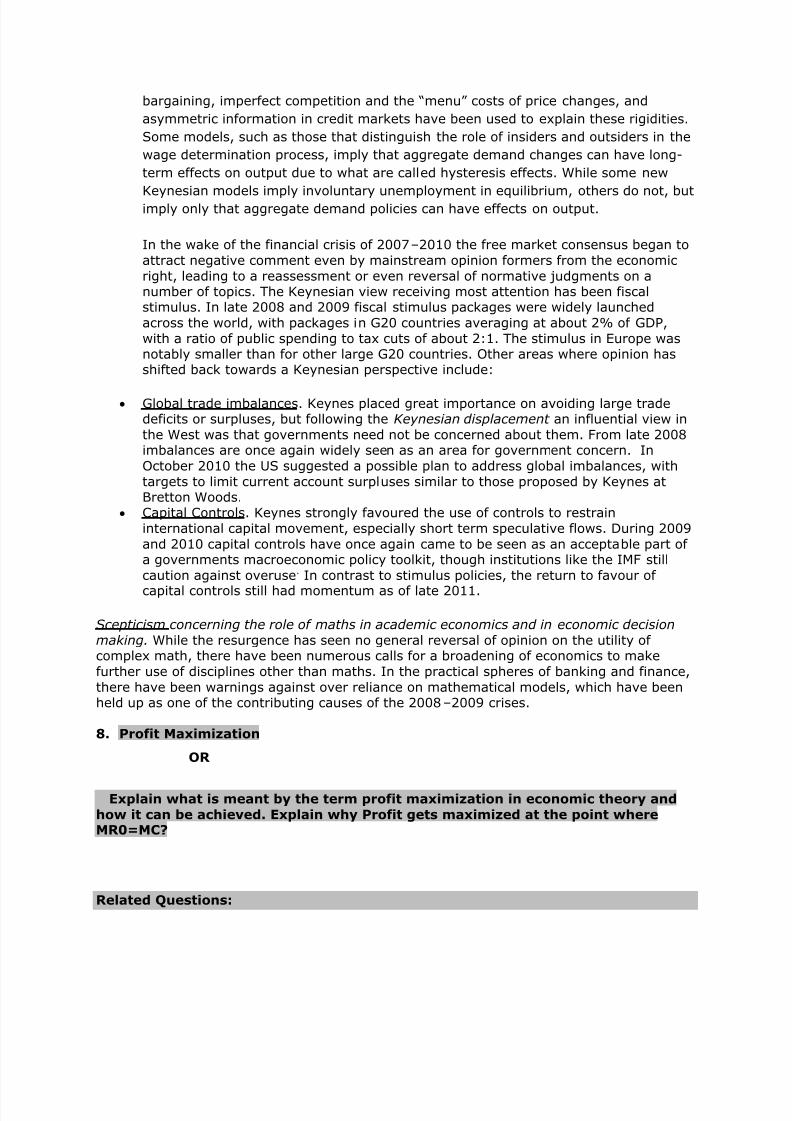
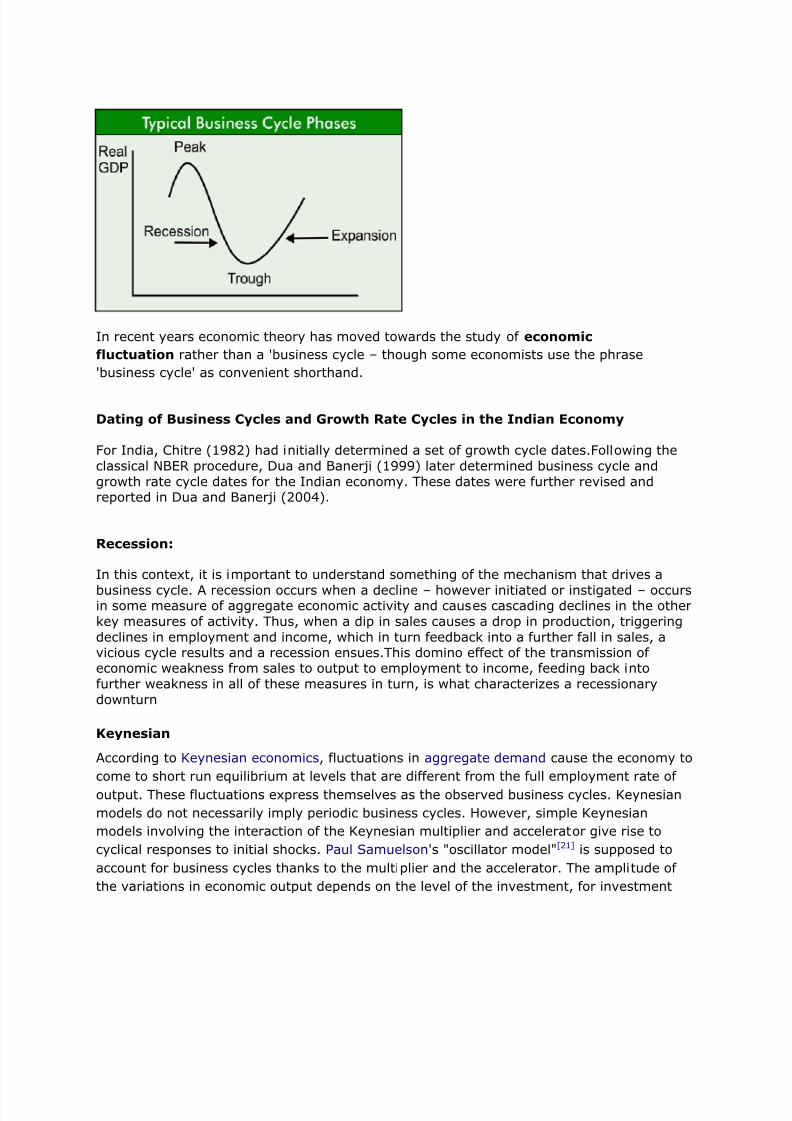
business cycle is identified as a sequence of four phases:
1) An expansion is where the economy is experiencing positive and increasing economic
output. Employment tends to increase (unemployment falls) and there is upward
pressure placed on prices (inflation rises) as output rises.
2) A peak is reached when the economy has produced the greatest amount of output.
At this point employment is generally at or near its highest level (unemployment is
at its lowest level: usually below the full employment rate of approximately 5%) and
prices tend to rise more rapidly (inflation accelerates).
3) Following the peak is a recession, or contraction. During this phase output actually
decreases (the rate of growth becomes negative); unemployment begins to rise and
the inflationary pressure on prices fades In America, due to government
involvement, prices usually don't fall, but the rate of inflation decreases). The low
point of the cycle occurs next.
4) The low point of the cycle occurs next. This is known as a trough and unemployment
tends to be at its peak and production at its low point. There is very little upward
pressure on prices and in some cases there is downward pressure on prices
(deflation).
8/12/2019 Economics - Long Answer
http://slidepdf.com/reader/full/economics-long-answer 21/34
In recent years economic theory has moved towards the study of economic
fluctuation rather than a 'business cycle – though some economists use the phrase
'business cycle' as convenient shorthand.
Dating of Business Cycles and Growth Rate Cycles in the Indian Economy
For India, Chitre (1982) had initially determined a set of growth cycle dates.Following the
classical NBER procedure, Dua and Banerji (1999) later determined business cycle and
growth rate cycle dates for the Indian economy. These dates were further revised andreported in Dua and Banerji (2004).
Recession:
In this context, it is important to understand something of the mechanism that drives a
business cycle. A recession occurs when a decline – however initiated or instigated – occursin some measure of aggregate economic activity and causes cascading declines in the other
key measures of activity. Thus, when a dip in sales causes a drop in production, triggering
declines in employment and income, which in turn feedback into a further fall in sales, avicious cycle results and a recession ensues.This domino effect of the transmission ofeconomic weakness from sales to output to employment to income, feeding back into
further weakness in all of these measures in turn, is what characterizes a recessionary
downturn
Keynesian
According to Keynesian economics, fluctuations in aggregate demand cause the economy to
come to short run equilibrium at levels that are different from the full employment rate of
output. These fluctuations express themselves as the observed business cycles. Keynesian
models do not necessarily imply periodic business cycles. However, simple Keynesian
models involving the interaction of the Keynesian multiplier and accelerator give rise to
cyclical responses to initial shocks. Paul Samuelson's "oscillator model"[21] is supposed to
account for business cycles thanks to the multiplier and the accelerator. The amplitude of
the variations in economic output depends on the level of the investment, for investment

8/12/2019 Economics - Long Answer
http://slidepdf.com/reader/full/economics-long-answer 22/34
determines the level of aggregate output (multiplier), and is determined by aggregate
demand (accelerator).
In the Keynesian tradition, Richard Goodwin accounts for cycles in output by the distribution
of income between business profits and workers‘ wages. The fluctuations in wages are
almost the same as in the level of employment (wage cycle lags one period behind the
employment cycle), for when the economy is at high employment, workers are able to
demand rises in wages, whereas in periods of high unemployment, wages tend to fall.
According to Goodwin, when unemployment and business profits rise, the output rises.
12. Capital Budgeting
Capital budgeting is the planning process used to determine whether anorganization's long term investments such as new machinery, replacement
machinery, new plants, new products, and research development projects are worthpursuing. It is budget for major capital, or investment, expenditures. It is also known
as ―Investment Appraisal‖. Capital budgeting is a required managerial tool. One duty
of a financial manager is to choose investments with satisfactory cash flows andrates of return. Therefore, a financial manager must be able to decide whether an
investment is worth undertaking and be able to choose intelligently between two ormore alternatives. To do this, a sound procedure to evaluate, compare, and select
projects is needed. Capital budgeting is basically concerned with the justification ofcapital expenditures.
Importance of Capital Budgeting:
Capital budgeting decisions are of paramount importance in financial decision. So it needs
special care on account of the following reasons:
1. Long-term Implications: A capital budgeting decision has its effect over a long time
span and inevitably affects the company‘s future cost structure and growth. A wrong
decision can prove disastrous for the long-term survival of firm. On the other hand, lack of
investment in asset would influence the competitive position of the firm. So the capital
budgeting decisions determine the future destiny of the company.
2. Involvement of large amount of funds: Capital budgeting decisions need substantial
amount of capital outlay. This underlines the need for thoughtful, wise and correct decisions
as an incorrect decision would not only result in losses but also prevent the firm from
earning profit from other investments which could not be undertaken.
3. Irreversible decisions: Capital budgeting decisions in most of the cases are irreversible
because it is difficult to find a market for such assets. The only way out will be scrap the
capital assets so acquired and incur heavy losses.
4. Risk and uncertainty: Capital budgeting decision is surrounded by great number of
uncertainties. Investment is present and investment is future. The future is uncertain and

8/12/2019 Economics - Long Answer
http://slidepdf.com/reader/full/economics-long-answer 23/34
full of risks. Longer the period of project, greater may be the risk and uncertainty. The
estimates about cost, revenues and profits may not come true.
5. Difficult to make: Capital budgeting decision making is a difficult and complicated
exercise for the management. These decisions require an overall assessment of future
events which are uncertain. It is really a marathon job to estimate the future benefits andcost correctly in quantitative terms subject to the uncertainties caused by economic-political
social and technological factors.
The problems in capital budgeting decisions may be as follows:
a) Future uncertainty: Capital budgeting decisions involve long term commitments.
However there is lot of uncertainty in the long term. The uncertainty may be with
reference to cost of the project, future expected returns, future competition, legal
provisions, political situation etc.
b) Time Element: The implications of a Capital Budgeting decision are scattered over a
long period. The cost and the benefits of a decision may occur at different points of
time. The cost of a project is incurred immediately. However, the investment is
recovered over a number of years. The future benefits have to be adjusted to make
them comparable with the cost. Longer the time period involved, greater would be
the uncertainty.
c) Difficulty in Quantification of impact: The finance manager may face difficulties
in measuring the cost and benefits of projects in quantitative terms. For example,
the new products proposed to be launched by a firm may result in increase or
decrease in sales of other products already being sold by the same firm. It is very
difficult to ascertain the extent of impact as the sales of other products may also be
influenced by factors other than the launch of the new products.
13. Explain the concept of “Ceteris Paribus”. OR Short Note on “Ceteris Paribus”
Ans: This is a Latin term. It means ―everything else being equal.‖
Ceteris Paribus is a concept that economists use to define cause-and-effectrelationships that are isolated from external factors. Suppose, for example, that
Apple Computer decides to lower the price of its popular iPod device. Economistswould assert that this would increase the demand for iPods.
But this statement ignores other factors. Suppose that at the same time, Microsoftreleases a cool new product that competes directly with the iPod. If the Microsoftproduct is successful, the demand for iPods could decrease--- even though Apple has
lowered the price of iPods. On the other hand, suppose that the decrease in the price
of iPods coincides with an economic downturn. This too could result in a lowerdemand for iPods, despite the lower price.
So how do economists deal with all these outside issues? They assume ceterisparibus, and focus their analysis only on two closely related factors. Otherwise, it

8/12/2019 Economics - Long Answer
http://slidepdf.com/reader/full/economics-long-answer 24/34
would be impossible to establish any economic theory, because economists wouldhave to account for every possible outside factor that could interfere with a given
cause-and-effect relationship
For example, if the price of petrol rose, you would expect more people use public transport,
ceteris paribus. However, everything else may not remain equal. e.g. Cost of cars might go
down even though cost of petrol went up, etc.
Economists need to use this as a benchmark to understand how two different factors relate
to each other. A lot of the time economists speak hypothetically about different subjects in
economics. Hope this helps
Ceteris paribus is an essential feature of the scientific method and economic analysis.
Implementing the ceteris paribus assumption makes it possible to isolate the effect one
factor has on another in the derivation and testing of hypotheses and principles.
Scientific Method
The scientific method seeks to explain the way the world works by testing and verifyinghypothesized cause-and-effect relations. Such relations take the form of "If A, then B." Or
that "Event A causes event B."
To identify the connection between A and B it is essential that only A and B change. If event
A is hypothesized to cause event B, then other possible events C, D, and E, which mightaffect B, cannot be allowed to change, cannot be allowed to influence B.
Consider a basic economic principle, the law of demand. This law states that quantity
demanded is inversely related to demand price. Or stated in other terms, an increase indemand price causes a decrease in quantity demanded.
Suppose, for example, that focus is on the demand for hot fudge sundaes, particular the lawof demand for hot fudge sundaes. The amount of hot fudge sundaes that buyers are willingand able to purchase, however, can be influenced by factors other than the price of hot
fudge sundaes, including income, preferences, or the prices of other goods.
Demand Price Changes: Suppose that the price of hot fudge sundaes increases from
$2 to $3. The law of demand indicates that the quantity demanded of hot fudgesundaes should decrease.
Quantity Demanded Changes: If the quantity demanded of hot fudge sundaes
decreases, then this provides (presumably) confirmation of the law of demand. Butwhat if the quantity demanded increases? Does this refute the law of demand?
Other Factors: The law of demand cannot be confirmed or refuted if other factors
that also influence hot fudge sundae demand also change. Suppose hot fudge sundaebuyers have more income, which they are inclined to spend on hot fudge sundaes.Additionally, suppose the price of yogurt cones (a substitute for hot fudge sundaes)
increases, prompting potential yogurt cones buyers to purchase hot fudge sundaesinstead.
With these other factors also changing, testing the cause-and-effect connection
between demand price and quantity demanded is impossible. It is not possible to sayfor certain if the change in the quantity demanded of hot fudge sundaes is caused by
8/12/2019 Economics - Long Answer
http://slidepdf.com/reader/full/economics-long-answer 25/34
the higher price of hot fudge sundaes or by the change in buyers' income or by thechange in the price of yogurt cones.
Using the scientific method to derive, test, and verify hypotheses, requires the ceteris
paribus assumption, that other factors be kept constant.
Economic Analysis
Although other factors are initially held constant with the ceteris paribus assumption, they
are not necessarily held constant forever. A critical aspect of economic analysis is to
systematically relax the ceteris paribus assumption. In so doing, the specific effect of each
ceteris paribus factor can be identified and analyzed. Much like a chemist adds one chemical
at a time to a mixture to determine the resulting reaction, an economist relaxes one ceteris
paribus assumption at a time to observe the results.
Consider once again the demand for hot fudge sundaes. Once the law of demand isidentified and combined with the supply of hot fudge sundaes, then the hot fudge sundaemarket can be analyzed. The equilibrium price and equilibrium quantity can be identified.
This equilibrium, however, is based on the ceteris paribus assumption. In particular, other
demand factors, such as buyers' income, preferences, and other prices, are held unchanged
in the identification of the equilibrium. What happens to the price and quantity of hot fudgesundaes should one of these ceteris paribus factors change?
Suppose, for example, that buyers have more income. By relaxing the ceteris paribusassumption of constant income, the effect of an increase in buyers' income on the hot fudge
sundae market can be analyzed. The effect of other ceteris paribus factors can subsequently
be analyzed as well, one by one. This systematic analytical approach can provide a greatdeal of insight into the operation of the hot fudge sundae market.
14. Elaborate how the concept of “Consumer Surplus” is useful to a business
manager in his decision making.
Consumer Surplus is defined as the total willingness to pay for a product minus the total
payment for the product.
The concept of consumer’s surplus was introduced by Alfred Marshall. According to him:
A consumer is generally willing to pay more for a given quantity of good than what heactually pays at the price prevailing in the market".
For example, you go to the market for the purchase of a pen. You are mentally prepared
to pay $25 for the pen which the seller has shown to you. He offers the pen for $10 only.
You immediately purchase the pen and say ‗thank you‘. You were willing to pay $25 for the pen but you are delighted to get it for $10 only.
Consumer‘s surplus is the difference between the maximum amount a consumer is willing to
pay for the good and the price he actually pays for the good. In our example given above,the consumer‘s surplus is $15 ($25 – $10).

8/12/2019 Economics - Long Answer
http://slidepdf.com/reader/full/economics-long-answer 26/34
If we are talking about good x, for example, and px and x stand respectively for the price
and the quantity demanded of this good, the total payment for good x is simply price ×
quantity demanded = pxx.
The total willingness to pay for good x is defined as the total utility obtained from
consuming x, measured in terms of money. It is the maximum amount that the consumer is
willing to pay for the product. From the marginal utility theory,remember that this is
measured by the area under the marginal utility (in terms of money). Further, this curve is
same as the demand curve for the product. Hence the total willingness to pay is equal to
the area under the demand curve. Turning to Figure 5.1(a), if px = p0 and the consumer is
demanding x0, her total illingness
to pay is equal to the area 0ABx0. Similarly, if px = p1 and the consumer demands x1, the
total willingness to pay equals the area 0ACx1.We are now ready to compute consumer
surplus. If the price is p0, for instance,
the total willingness to pay = 0ABx0, while the total payment is equal to the area 0p0 × 0x0
= 0p0Bx0. Thus the consumer surplus = 0ABx0 − 0p0Bx0 = p0AB. By similar calculation, atthe price p1, the consumer surplus is equal to p1AC. In general, we then say that the
consumer surplus equals the area under a demand curve over and above the line
representing the price. For example, in panel (b) of Figure 4.23, the
shaded area shows the consumer surplus at the price p0.
Using consumer surplus, we can measure the change in welfare due to a price change. If for
example the price of good x increases from p0 to p1, the change in consumer surplus is
simply the difference between the consumer surpluses associated with p0 and p1. In Figure
5.1(a), this is equal to p0AB − p1AC = −p0p1CB.
The negative sign reflects a welfare loss due to a price increase, which is expected.
In absolute value, the change in the consumer surplus equals the area between the two
respective price lines.
Importance of Consumer‟s Surplus:The concept of consumer‘s surplus has both theoretical as well as practical importance. (i) Theoretical importance: The idea of consumer‘s surplus reveals the benefits which we
derive from our purchase of the commodity in the market.For example, when we purchase salt, or a match box, we are willing to pay the amount
much higher than their market value. For example, a consumer would be willing to pay $10for a match box rather than go without it but he actually pay Re one only on the purchase of
a match box. Consumer‘s surplus on the purchase of match box thus is $ 9.0. (ii) Practical importance: A monopolist can charge higher price for his product if the
consumers are enjoying large consumers surplus on the use of his product.(iii) The inhabitants of a country derive consumer's surplus when they import
commodities from abroad. They are usually prepared to pay more for than what theyactually pay.
(iv) A finance minister imposes taxes of the commodities yielding consumer's surplus.

8/12/2019 Economics - Long Answer
http://slidepdf.com/reader/full/economics-long-answer 27/34
(v) An entrepreneur before investing capital in a project evaluates the consumer'ssurplus to be derived from it. If the benefits to the obtained are greater than the costs, the
investment is undertaken.
Criticism:
The Marshallian concept of consumer’s surplus has been severally criticized by moderneconomists Allen and Hicks. According to them, the concept is based on assumptions which
are unwarranted. Utility, according to them, is a psychological feeling. It cannot be exactly
measured in term of money.
In Marshallian analysis, the marginal utility of money is assumed to remain constant. The
fact is that when a consumer spends money on goods, his income decreases and the
marginal utility of money to him rises. Analysis ignores this basic fact.
Consumer‘s surplus is said to be imaginary as it assumes that utilities derived from various
goods are independent. In real life, this is not true. The fact is that utilities derived from
various goods are independent.
Measurement of Consumer‟s Surplus with the Help of Indifference Curves(Hicksian Method):Professor J.R. Hicks, has explained the concept of consumer surplus with the help of
indifference curve technique . According to Hicks when there is fall in the price of a
commodity, it has two main effects:
First, the consumer can purchase more of the good whose price has fallen.
Secondly, he can purchase the same quantity of the good as he was buying before but with
a lesser amount of money. He spares some money in the bargain. This is a form of rise in
the real income of the consumer.
Diagram/Figure:
The Hicksian method of measuring consumer‘s surplus is now explained with the help of
diagram below.
x

8/12/2019 Economics - Long Answer
http://slidepdf.com/reader/full/economics-long-answer 28/34
In figure 3.20 commodity X is measured on OX axis and money income of an individual on
OY axis. We assume here that a consumer does not know the price of the commodity X and
has OR quantity of money. The indifference curve IC1 represents various combinations of
income and X of commodity X which yield the same level of satisfaction to the consumer.
The indifference curve IC1 originates from point R. It shows the stage when the consumer
retains all of his income and zero units of commodity for a given level of the utility. The
consumer moves down along the curve IC1. The consumer at point P buys OT amount of
commodity X and has OE amount of money income. In other words, the consumer is ready
to sacrifice RE amount of money for getting OT units of commodity X.
We now assume that the consumer is informed of the price of commodity X. The RL is the
budget line. The budget line touches the indifference curve IC2 at point N which is the point
of equilibrium. The consumer now has the OT commodity of X and OF amount of income. He
gives up RF amount of money to buy OT units of commodity X. Previously he was ready to
pay RE amount of income which is higher than the amount he pays now. We infer from this
that RE – RF i.e., FE is the consumer surplus.
FE is the difference between the amount of income the consumer was willing to pay and
what he actually pays. The surplus has also shifted the consumer on the higher level of
satisfaction from IC1 to IC2
15. What are the essential features of a perfectly competitive market? Illustrate a
firm making a short- run loss. Why is this situation unlikely to persist in the
long run?
OR
“Perfectly competitive market in the short run allows even the less efficient to
survive for some time”. Discuss.
OR
Which of the following industries would you say is close to being perfectly
competitive market and why: Brewing and wine making, taxi driving, Airlines,
copper mining, Potato Farming, Car Manufacturing
Ans: Perfect competition or a perfectly competitive industry is defined by thefollowing characteristics:
A) - The product is homogeneous (i.e., they are perfect substitutes).(1). Competition in a market where products are differentiated (e.g., mineral water, owing
to chemical and marketing differences) is not as keen as that in a market where products
are homogeneous.(2). Generally, prices for differentiated products are different.

8/12/2019 Economics - Long Answer
http://slidepdf.com/reader/full/economics-long-answer 29/34
B) - There are many buyers, each of whom purchases a quantity that is small relative to
the market.(1). In a market where some buyers have market power, different buyers pay differentprices: The buyers with market power get lower prices.
2). Where some buyers have market power, it is not possible to construct the marketdemand curve as the buyers with market power can affect the going price.
C) There are many sellers, each of whom supplies a quantity that is small relative to the
market.(1). Where some sellers have market power, it is not possible to construct market supplycurve as the sellers with market power can affect the going price.
D). New buyers and sellers can enter freely, and existing buyers and sellers can exit freely.
There are no technological, regulatory or legal barriers.(1). With free entry and exit, the market price cannot stay above a seller's average cost for
very long.(2). If the market price is above a seller‘s average cost, new sellers will enter, add to the
market supply, and bring down the price.
E) All buyers and all sellers have equal information about market conditions (e.g., prices,
substitutes, and technology).(1). Markets where there are differences in information among buyers, among sellers, or
between buyers and sellers, are not as competitive as those where all buyers and sellershave equal information.
Consider, for instance, wheat or onions. Each of these is a very homogeneous
Product—same or identical everywhere (unlike cars that come in various
Designs, quality and so on). The same is true of leather footballs or cooking gas.In general, by a ‗very homogeneous‘ or ‗identical‘ product, we refer to a very standardised
item for which inherent quality differences are minimal; which does not come in differentdesigns; and on which consumers do not have different perceptions. As for more examples
of which goods are homogeneous and which goods are not, various computer-related itemsare fast becoming standardised items these days, which was not true 20 years ago. ACD R-
W drive, for example, is almost the same everywhere in the world with minimal quality
differences among different brands. In contrast, TVs are available in different sizes, featuresand looks. They
are certainly not homogeneous.
Diff erent types of cotton shirts may have the same ‗quality‘ but their styles may bedifferent so that they are not necessarily homogeneous
from the perspective of consumers. Sometimes, products like toothpaste or lipstick may be
basically the same, but due to the effect of advertising, consumers see them differently—
and their perception matters. Such products are not considered homogeneous from theviewpoint of economic analysis.
The important implication of a product being homogeneous is that all firms producingand selling it have to charge the same price. This is because, between two
firms, if one charges a higher price than the other, no one will buy from the former.1 Given
that a product is homogeneous, the existence of a large number of firms implies that eachfirm is very small compared to the whole market. Thus no single firm can influence theprice. In other words, a firm in a perfectly competitive industry is a price taker—it takes

8/12/2019 Economics - Long Answer
http://slidepdf.com/reader/full/economics-long-answer 30/34
the market price as given. We can say that the market price is exogenous to any individualfirm. This is another way of saying that in a perfectly competitive market, no single firm
possesses any market power.2The last feature leads to a simple relationship between a firm‘s output and a firm‘s totalrevenue (TR), equal to total money generated from sales. By definition,
TR = price ( p) × quantity sold or produced (y ).3 Since p is given to the firm, its totalrevenue must equal p × 1 if one unit is sold, p × 2 if two units are sold and so on. Plottingthese points against the output we obtain the total revenue curve, as shown in Figure 10.1.
It is a ray from the origin with a slope equal to p everywhere because p is given to the
firm.4 A decrease or an increase in p rotates this curve clockwise or anti-clockwiserespectively.By now you might guess that with any ‗total‘, there is always a ‗marginal‘ and an
‗average‘. This is true here. We define marginal revenue (MR) as addition to thetotal revenue from one extra unit produced and sold. In Figure 10.1 notice by how
much TR increases as one extra unit is produced. As output is increased from 0 to 1,MR = p − 0 = p. Similarly, if output increases from 1 unit to 2 units, MR = 2 p − p = p.
Thus, under perfect competition, MR = p. This is because p is exogenous to a firm.5We now define average revenue ( AR) as TR /output. Since TR = py , we have AR = py /y = p.
Thus AR = p. Note that this has nothing to do with p being given to a firm.It holds in competitive and non-competitive markets.As you will see shortly, it will be useful to have another graph called the price line, defined
as a plot of price facing a competitive firm against its output.
However, since p is exogenous to the firm it is simply a flat line as shown in Figure 10.2.From the price line we can measure the total revenue. If, for instance, the output = y 1, TR= 0 p0 × 0y 1 = the area 0 p0 A1y 1. Similarly at y = y 2, the total revenue equals the area0 p0 A2y 2 and so on. Hence , the (rectangular) area under the price line measures total
revenue for a perfectly competitive firm.
Sometimes the price line is referred to as the ‗demand curve facing a competitive firm‘ in
the sense that irrespective of how much a firm wants to sell or equivalently how much the
consumers are buying from the firm, the price they are paying does not change.6 We note
that this demand curve facing a firm has price elasticity, equal to ∞.
16. Define Price elasticity of demand and Income elasticity of demand / Discuss
the concept of price elasticity of demand & income elasticity of demand / What
do you understand by price elasticity of demand? Write short note on Income
elasticity of demand.
Ans:
Price Elasticity of demand
Price Elasticity of Demand is predominantly used in economic analysis; it is alternativelyreferred to as Elasticity of Demand.
Price Elasticity of demand is the degree of responsiveness of demand to a change in its
price. In technical terms it is the ratio of the percentage change in demand to thepercentage change in price.
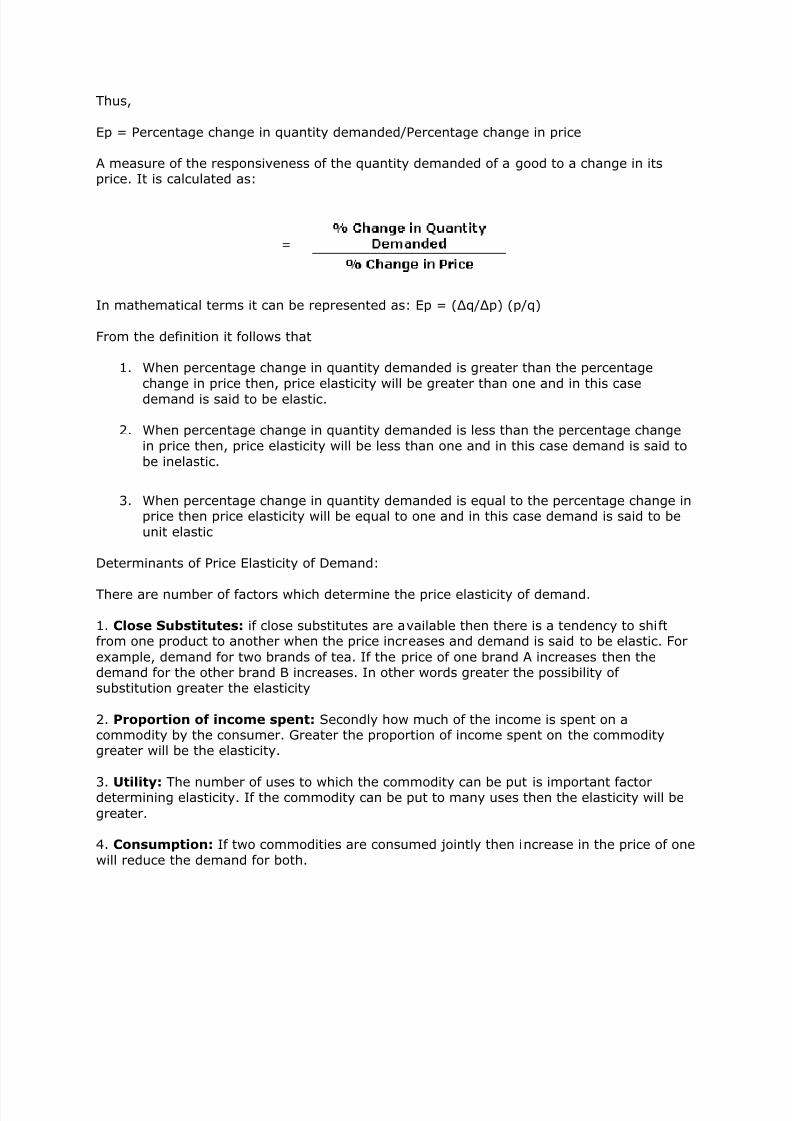
8/12/2019 Economics - Long Answer
http://slidepdf.com/reader/full/economics-long-answer 31/34
Thus,
Ep = Percentage change in quantity demanded/Percentage change in price
A measure of the responsiveness of the quantity demanded of a good to a change in itsprice. It is calculated as:
In mathematical terms it can be represented as: Ep = (Δq/Δp) (p/q)
From the definition it follows that
1. When percentage change in quantity demanded is greater than the percentage
change in price then, price elasticity will be greater than one and in this case
demand is said to be elastic.
2. When percentage change in quantity demanded is less than the percentage change
in price then, price elasticity will be less than one and in this case demand is said to
be inelastic.
3. When percentage change in quantity demanded is equal to the percentage change inprice then price elasticity will be equal to one and in this case demand is said to be
unit elastic
Determinants of Price Elasticity of Demand:
There are number of factors which determine the price elasticity of demand.
1. Close Substitutes: if close substitutes are available then there is a tendency to shiftfrom one product to another when the price increases and demand is said to be elastic. For
example, demand for two brands of tea. If the price of one brand A increases then thedemand for the other brand B increases. In other words greater the possibility ofsubstitution greater the elasticity
2. Proportion of income spent: Secondly how much of the income is spent on acommodity by the consumer. Greater the proportion of income spent on the commoditygreater will be the elasticity.
3. Utility: The number of uses to which the commodity can be put is important factordetermining elasticity. If the commodity can be put to many uses then the elasticity will be
greater.
4. Consumption: If two commodities are consumed jointly then increase in the price of one
will reduce the demand for both.

8/12/2019 Economics - Long Answer
http://slidepdf.com/reader/full/economics-long-answer 32/34
5. Time: Time element has an important role to play in determining the elasticity ofdemand. Demand is more elastic if time involved is long. In the short run, it is difficult to
substitute one commodity for another.
6. Cost: Cost of switching between different products andservice. There may be significant transaction costs involved in switching. In this case
demand tends to be relatively inelastic. For example, mobile phone service providers mayinclude penalty clauses in their contracts.
7. Payment Bearer: Who makes the payment, where the purchaser does not directly pay
for the good they consume, such as perks enjoyed by employees, demand is likely to bemore inelastic.
8. The degree of necessity or whether the good is a luxury: goods and servicesdeemed by consumers to be necessities tend to have an inelastic demand whereas luxuries
will tend to have a more elastic demand because consumers can make do without luxurieswhen their budgets are stretched. I.e. in an economic recession we can cut back on
discretionary items of spending
9. Brand Loyalty: An attachment to a certain brand either out of tradition or because ofpropriety barriers can override sensitivity to price changes, resulting in more inelastic.
Income Elasticity of Demand
Income elasticity of demand refers to the degree of responsiveness of demand to a changein the income level.
From the definition it follows that
E y= Percentage change in quantity demanded /Percentage change in income
A measure of the relationship between a change in income and a change in quantity of a
good demanded:
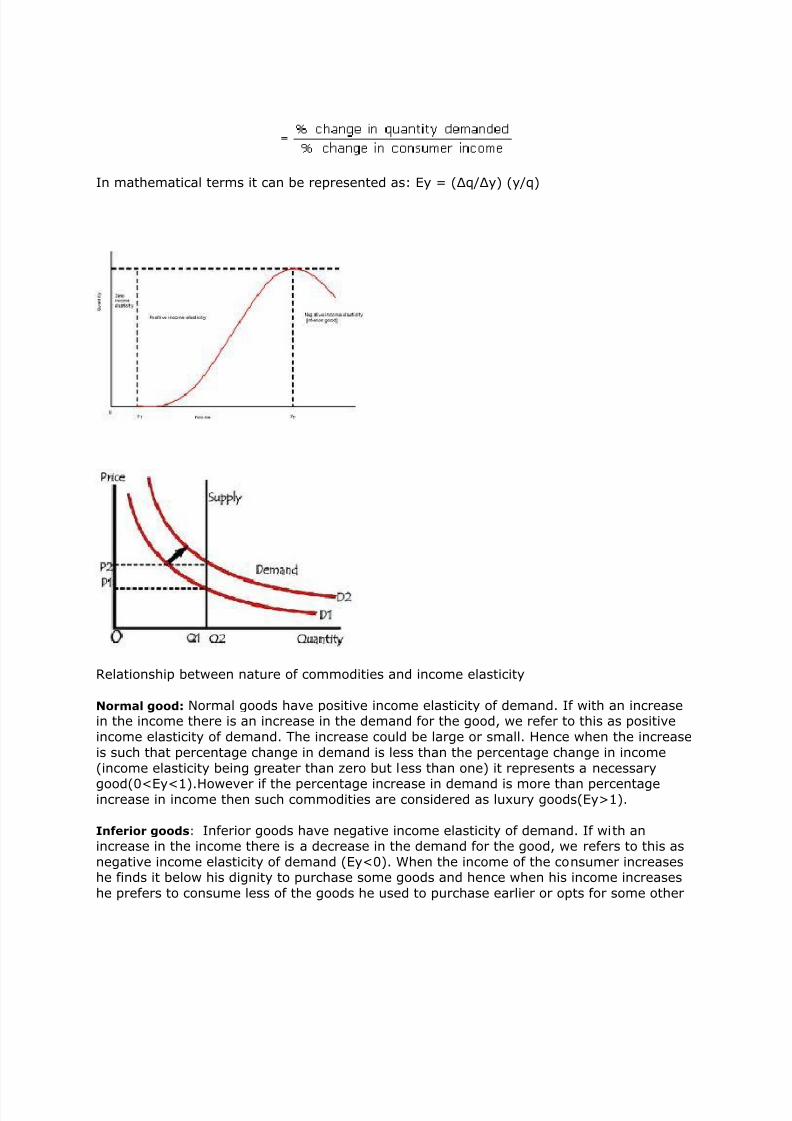
8/12/2019 Economics - Long Answer
http://slidepdf.com/reader/full/economics-long-answer 33/34
In mathematical terms it can be represented as: Ey = (Δq/Δy) (y/q)
Relationship between nature of commodities and income elasticity
Normal good: Normal goods have positive income elasticity of demand. If with an increasein the income there is an increase in the demand for the good, we refer to this as positive
income elasticity of demand. The increase could be large or small. Hence when the increase
is such that percentage change in demand is less than the percentage change in income
(income elasticity being greater than zero but less than one) it represents a necessary
good(0<Ey<1).However if the percentage increase in demand is more than percentageincrease in income then such commodities are considered as luxury goods(Ey>1).
Inferior goods: Inferior goods have negative income elasticity of demand. If with anincrease in the income there is a decrease in the demand for the good, we refers to this as
negative income elasticity of demand (Ey<0). When the income of the consumer increaseshe finds it below his dignity to purchase some goods and hence when his income increases
he prefers to consume less of the goods he used to purchase earlier or opts for some other
8/12/2019 Economics - Long Answer
http://slidepdf.com/reader/full/economics-long-answer 34/34
good which according to him has a better position and are consumed by people belonging tothe higher income group.
Superior Good: A superior good exists if a relatively small increase in income causes arelatively large increase in demand. This is seen as a positive value for the income elasticityof demand greater than 1, or a coefficient of elasticity of N > 1.
Although some goods might intuitively appear to be normal, inferior, or superior goods,economists generally let income elasticity calculations make the actual determination. This
is especially important in that a particularly good might be normal for one buyer, inferior for
another, and superior for a third.
Income elasticity of demand varies across product range. Further over a long run period
with changes in the taste and preference and consumer‘s perception of commodities
elasticity of demand is likely to change. A product which was a luxury at one point of time
becomes a necessity today. Consider the market for foreign travel. A few decades ago, long
distance foreign travel was regarded as a luxury. Now as real price levels have come down
and incomes have grown, a large number of people are travelling to different places for ashort or long period.