Embed Size (px)
DESCRIPTION
economy
Citation preview
7/18/2019 Economics Cram Kit
http://slidepdf.com/reader/full/economics-cram-kit-56d6a0b3cdef5 1/48
ECONOMICS
20 1 32 0 1 4E D I T I O N
Introduction to
Economics
Y E A R S
1 9 D O I N G O U R B E S T , S O Y O U C A N D O Y O
U R
the WorldScholar’s Cup®
®
ECONOMICSCRAM KIT
ALPA CA- IN-CH IEF
Daniel Berdichevsky
EDITOR
Tania Asnes
7/18/2019 Economics Cram Kit
http://slidepdf.com/reader/full/economics-cram-kit-56d6a0b3cdef5 2/48
7/18/2019 Economics Cram Kit
http://slidepdf.com/reader/full/economics-cram-kit-56d6a0b3cdef5 3/48
ECONOMICS CRAM KIT | 2
FUNDAMENTAL ECONOMIC CONCEPTSHow to Think like an Economist
ADMISSION TO THE CLUB THE RATIONAL HOMO ECONOMICUS
SO YOU WANT TO BE AN ECONOMIST?
Repeat after me…
1. There are no free lunches.
2. People have unlimited wants.
3. The cost of doing something includes its fulleconomic cost.
4. Humans behave rationally.
5. Humans benefit from voluntary exchange-----otherwise they wouldn’t trade.
WHY IS THERE SCARCITY?
Because wants are unlimited and resources are limited.
To cope, we must make choices and face trade-offs
MARGINAL ANALYSIS
Marginal analysis involves comparing the costs and benefitsof doing just a little more of something. The marginal benefit
of reading one more page of this Cram Kit is one more questionanswered correctly at competition.
THE COST OF MAKING A CHOICE
We have to pay for our choices. What's more, we give up achoice we don’t make for every choice we do make.
TYPES OF COSTS
Type Definition Example
Opportunitycost (implicit
cost)
Value of thenext-best
choice
Value of sleepyou lose whenyou choose to
cram
Accounting
cost (explicitcost)
What you
tangibly pay toget something
Cost in
dollars of thisCram Kit
Economiccost
Opportunitycost +
accountingcost
Sum of theabove
RATIONALITY CHECKLIST
Perform cost-benefit analysis
Maximize utility, or happiness
Think on the margin
Account for all economic costs
MAXIMIZING UTILITY
An economic agent maximizes utility when marginalutility equals marginal cost
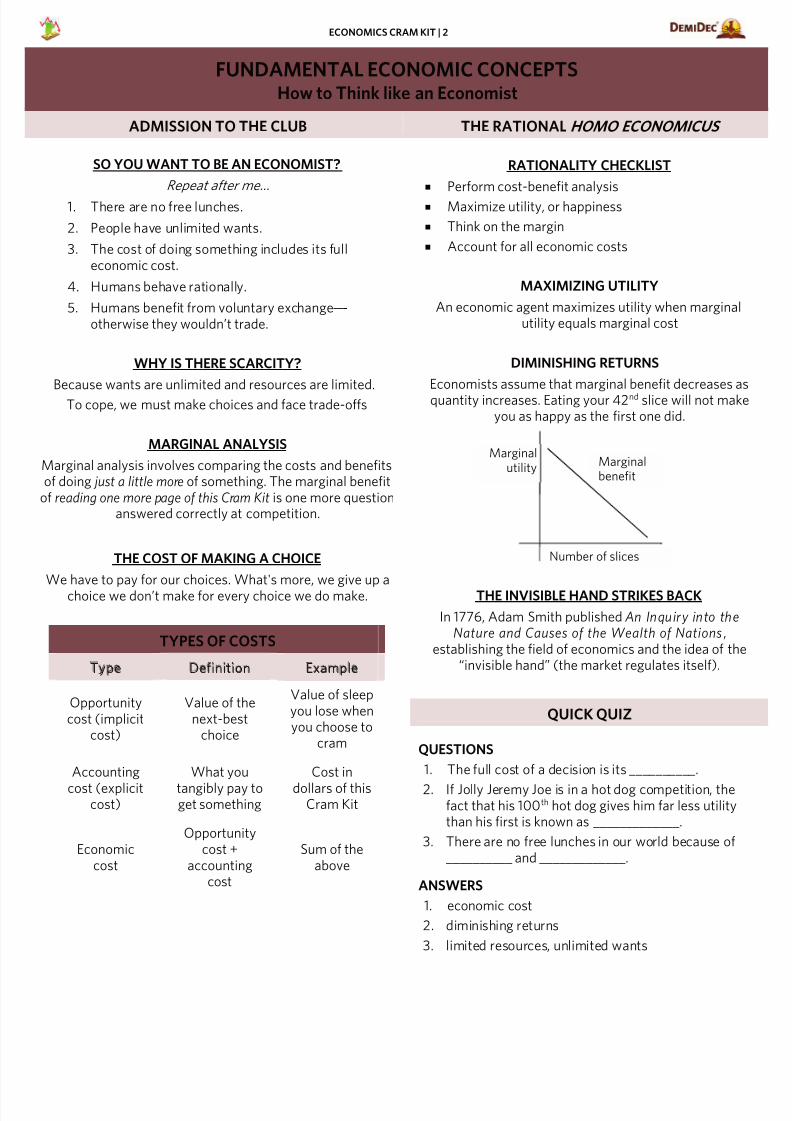
DIMINISHING RETURNS
Economists assume that marginal benefit decreases aquantity increases. Eating your 42nd slice will not mak
you as happy as the first one did.
THE INVISIBLE HAND STRIKES BACK
In 1776, Adam Smith published An Inquiry into theNature and Causes of the Wealth of Nations,
establishing the field of economics and the idea of th“invisible hand” (the market regulates itself).
QUICK QUIZ
QUESTIONS
1. The full cost of a decision is its __________.
2. If Jolly Jeremy Joe is in a hot dog competition, thefact that his 100th hot dog gives him far less utilitythan his first is known as _____________.
3. There are no free lunches in our world because of__________ and _____________.
ANSWERS
1. economic cost
2. diminishing returns
3. limited resources, unlimited wants
Number of slices
Marginalbenefit
Marginalutility
7/18/2019 Economics Cram Kit
http://slidepdf.com/reader/full/economics-cram-kit-56d6a0b3cdef5 4/48
ECONOMICS CRAM KIT | 3
FUNDAMENTAL ECONOMIC CONCEPTSCategorization
MODELING MICROECONOMICS VS. MACROECONOMICS
ECONOMIC ANALYSIS`
Theoretical models capture the basics of economic
interactions while stripping away extra details.
Most models look too simplistic. But it is this simplicitythat allows us to identify what assumptions andcharacteristics are important.
The true strength of a model is how well it captures andpredicts whatever we want to understand.
MODELING PARETO EFFICIENCY
Something is Pareto efficient when no one canhave more without someone else ending up
with less .
If you and your two friends split $100 so thateach of you has $33 and $1 is left on the table,the situation is not pareto efficient. You could
take one more dollar without hurting yourfriends.
But if you and your two friends split $100 sothat you have $100 and each of them has $0,the situation is pareto efficient. They can’t get
any money without taking away some of yours.
THREE FUNDAMENTAL QUESTIONS
Every market must answer three basic questions:
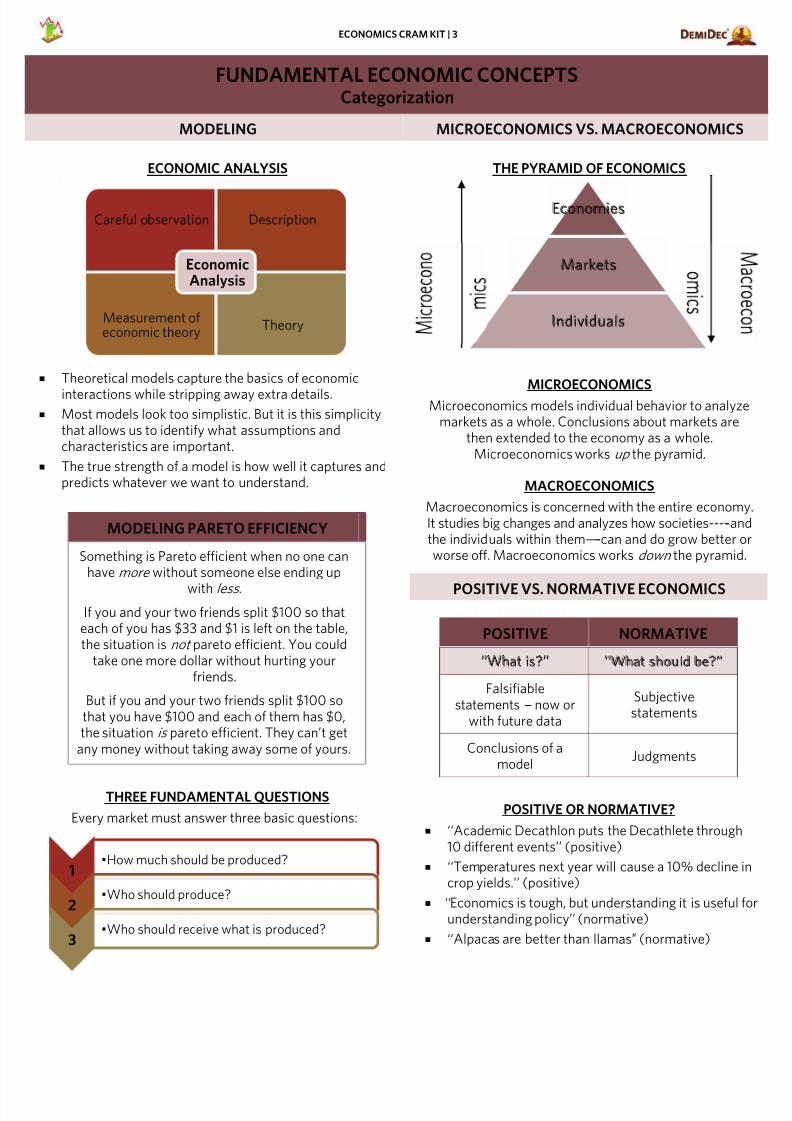
THE PYRAMID OF ECONOMICS
MICROECONOMICS
Microeconomics models individual behavior to analyzmarkets as a whole. Conclusions about markets are
then extended to the economy as a whole.Microeconomics works up the pyramid.
MACROECONOMICS
Macroeconomics is concerned with the entire economIt studies big changes and analyzes how societies-----anthe individuals within them-----can and do grow better oworse off. Macroeconomics works down the pyramid
POSITIVE VS. NORMATIVE ECONOMICS
POSITIVE NORMATIVE
‘‘What is?’’ ‘‘What should be?’’
Falsifiablestatements --- now or
with future data
Subjectivestatements
Conclusions of amodel
Judgments
POSITIVE OR NORMATIVE?
‘‘Academic Decathlon puts the Decathlete through10 different events’’ (positive)
‘‘Temperatures next year will cause a 10% decline crop yields.’’ (positive)
‘‘Economics is tough, but understanding it is useful understanding policy’’ (normative)
‘‘Alpacas are better than llamas’’ (normative)
Economies
Markets
Individuals
Careful observation Description
Measurement ofeconomic theory
Theory
EconomicAnalysis
1•How much should be produced?
2•Who should produce?
3•Who should receive what is produced?
7/18/2019 Economics Cram Kit
http://slidepdf.com/reader/full/economics-cram-kit-56d6a0b3cdef5 5/48
ECONOMICS CRAM KIT | 4
FUNDAMENTAL ECONOMIC CONCEPTSThe Origin of Markets (Trade)
WHY TRADE? PRODUCTION POSSIBILITIES FRONTIER (PPF)
ABSOLUTE VS. COMPARATIVE ADVANTAGE
An agent can be terrible at producing every good and serviceand have no absolute advantages versus a second agent, but
he must have a comparative advantage in at least one good
AN EXAMPLE FROM OUTER SPACE
1. Say Laika is very good at producing both dogtreats and spacesuits. She can produce 80 dogtreats or 20 spacesuits in one month.
2. Neil is not very good at producing either good.He can produce 30 dog treats or 10 spacesuitsin one month.
3. Laika has absolute advantages for both goods,
while Neil has none.4. Laika gives up four dog treats for each spacesuit
produced, while Neil only gives up three.
a. Laika gives up 1/4 of a spacesuit per dogtreat, less than Neil’s 1/3 of an spacesuit
b. Neil gives up 3 dog treats per spacesuit,less than Laika’s 4 dog treats
5. This means Laika has a comparative advantagein producing dog treats, while Neil has acomparative advantage in producing spacesuits.
6. Therefore, Laika should specialize in producingdog treats, and Neil in producing spacesuits.
7. Trade benefits both because they are able tospecialize in their comparative advantages.
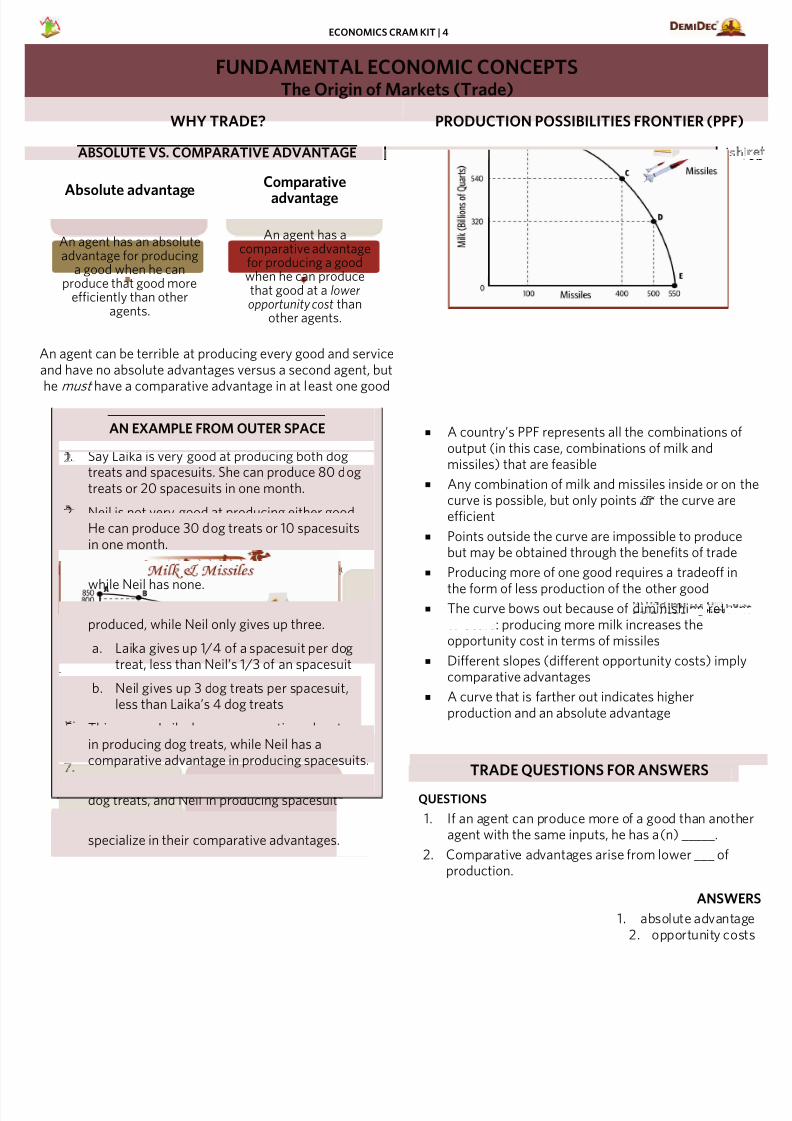
A country’s PPF represents all the combinations ofoutput (in this case, combinations of milk andmissiles) that are feasible
Any combination of milk and missiles inside or on curve is possible, but only points on the curve areefficient
Points outside the curve are impossible to producebut may be obtained through the benefits of trade
Producing more of one good requires a tradeoff in
the form of less production of the other good The curve bows out because of diminishing return
to scale: producing more milk increases theopportunity cost in terms of missiles
Different slopes (different opportunity costs) implcomparative advantages
A curve that is farther out indicates higherproduction and an absolute advantage
TRADE QUESTIONS FOR ANSWERS
QUESTIONS
1. If an agent can produce more of a good than anothagent with the same inputs, he has a(n) _____.
2. Comparative advantages arise from lower ___ ofproduction.
ANSWE
1. absolute advanta2. opportunity cos
Absolute advantage
An agent has an absoluteadvantage for producing
a good when he canproduce that good more
efficiently than otheragents.
Comparative
advantage
An agent has acomparative advantage
for producing a goodwhen he can producethat good at a loweropportunity cost than
other agents.
7/18/2019 Economics Cram Kit
http://slidepdf.com/reader/full/economics-cram-kit-56d6a0b3cdef5 6/48
ECONOMICS CRAM KIT | 5
MICROECONOMICSIntroduction to Markets
PERFECT COMPETITON MARKET MODEL MARKETS
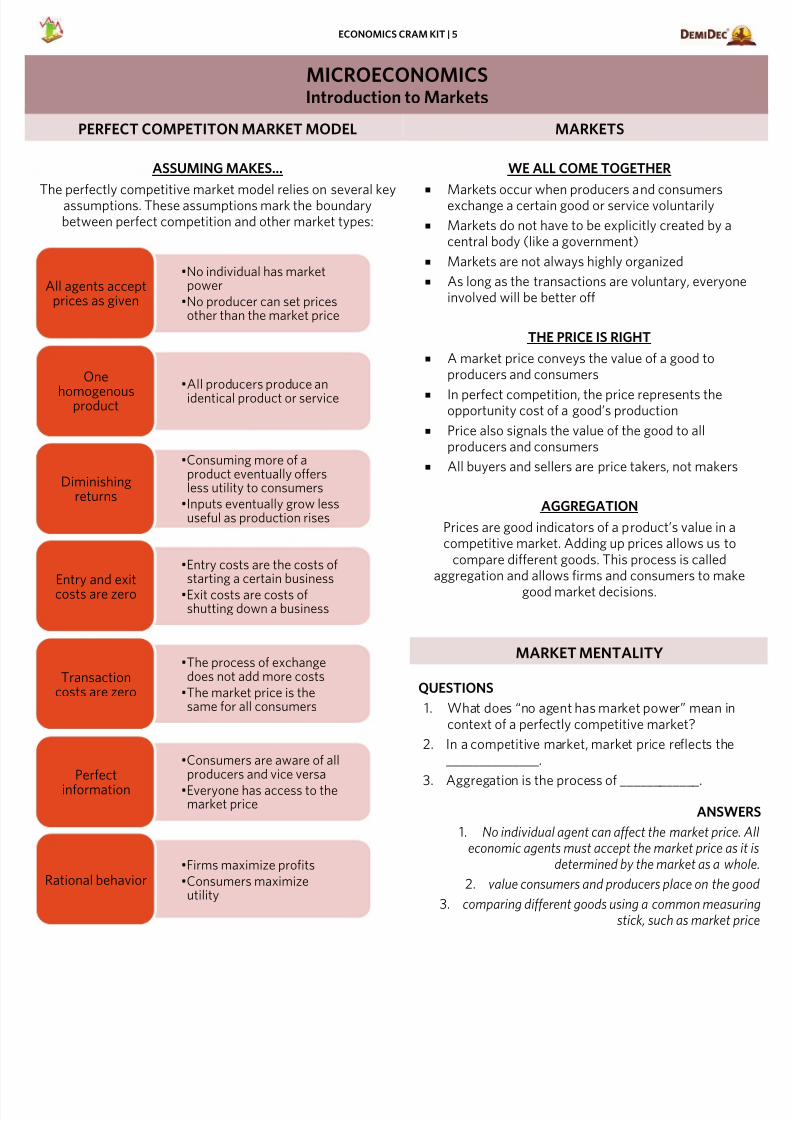
ASSUMING MAKES…
The perfectly competitive market model relies on several keyassumptions. These assumptions mark the boundarybetween perfect competition and other market types:
WE ALL COME TOGETHER
Markets occur when producers and consumersexchange a certain good or service voluntarily
Markets do not have to be explicitly created by acentral body (like a government)
Markets are not always highly organized
As long as the transactions are voluntary, everyoninvolved will be better off
THE PRICE IS RIGHT
A market price conveys the value of a good toproducers and consumers
In perfect competition, the price represents theopportunity cost of a good’s production
Price also signals the value of the good to allproducers and consumers
All buyers and sellers are price takers, not makers
AGGREGATION
Prices are good indicators of a product’s value in acompetitive market. Adding up prices allows us to
compare different goods. This process is calledaggregation and allows firms and consumers to make
good market decisions.
MARKET MENTALITY
QUESTIONS
1. What does “no agent has market power” mean incontext of a perfectly competitive market?
2. In a competitive market, market price reflects the______________.
3. Aggregation is the process of ____________.
ANSWE
1. No individual agent can affect the market price.economic agents must accept the market price as
determined by the market as a wh
2. value consumers and producers place on the go
3. comparing different goods using a common measurstick, such as market p
•No individual has marketpower
•No producer can set pricesother than the market price
All agents acceptprices as given
•All producers produce anidentical product or service
One
homogenousproduct
•Consuming more of aproduct eventually offersless utility to consumers
•Inputs eventually grow lessuseful as production rises
Diminishingreturns
•Entry costs are the costs ofstarting a certain business
•Exit costs are costs ofshutting down a business
Entry and exitcosts are zero
•The process of exchangedoes not add more costs
•The market price is thesame for all consumers
Transactioncosts are zero
•Consumers are aware of allproducers and vice versa
•Everyone has access to themarket price
Perfect
information
•Firms maximize profits
•Consumers maximizeutility
Rational behavior
7/18/2019 Economics Cram Kit
http://slidepdf.com/reader/full/economics-cram-kit-56d6a0b3cdef5 7/48
ECONOMICS CRAM KIT | 6
MICROECONOMICSDemand
THEORY OF THE CONSUMER SHIFTING ALL OVER THE PLACE
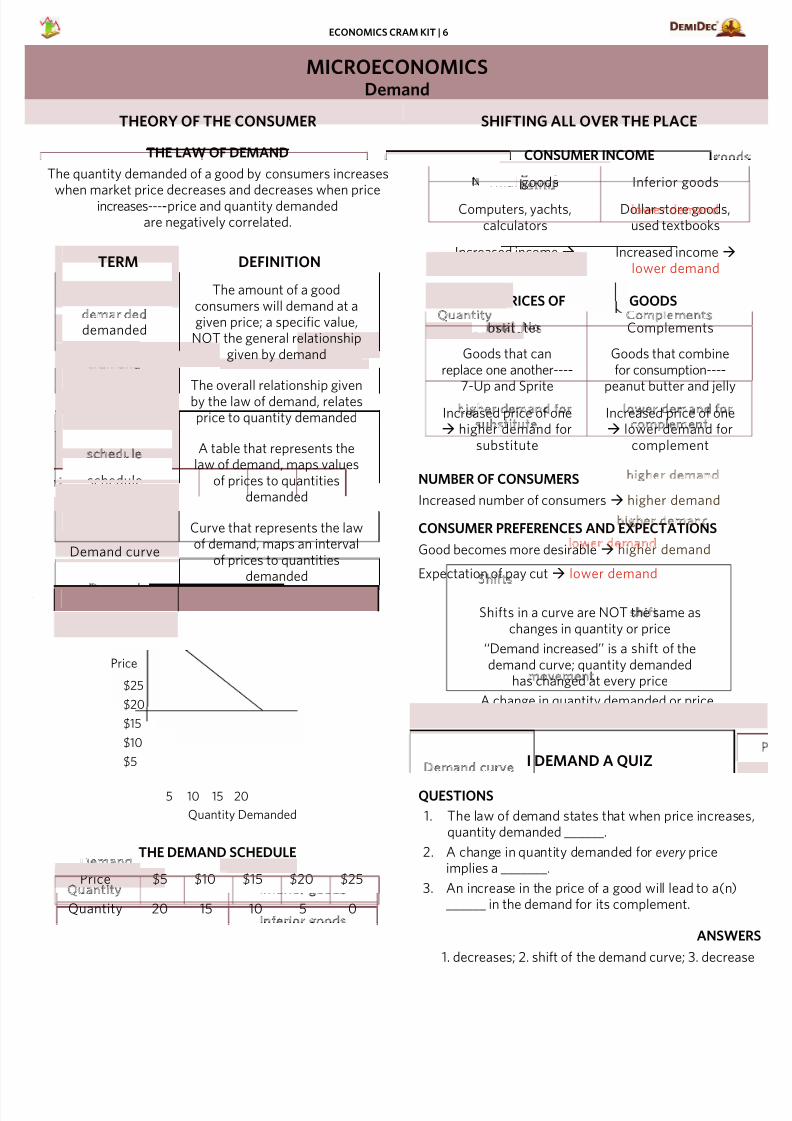
THE LAW OF DEMAND
The quantity demanded of a good by consumers increases
when market price decreases and decreases when priceincreases-----price and quantity demandedare negatively correlated.
TERM DEFINITION
Quantity demanded
The amount of a goodconsumers will demand at agiven price; a specific value,
NOT the general relationshipgiven by demand
Demand The overall relationship givenby the law of demand, relatesprice to quantity demanded
Demand schedule
A table that represents thelaw of demand, maps values
of prices to quantitiesdemanded
Demand curve
Curve that represents the lawof demand, maps an interval
of prices to quantitiesdemanded
[
THE DEMAND CURVE
THE DEMAND SCHEDULE
Price $5 $10 $15 $20 $25
Quantity 20 15 10 5 0
CONSUMER INCOME
Normal goods Inferior goods
Computers, yachts,calculators
Dollar store goods,used textbooks
Increased incomehigher demand
Increased income lower demand
PRICES OF RELATED GOODS
Substitutes Complements
Goods that canreplace one another-----
7-Up and Sprite
Goods that combinefor consumption-----
peanut butter and jellyIncreased price of one higher demand for
substitute
Increased price of one lower demand for
complement
NUMBER OF CONSUMERS
Increased number of consumers higher demand
CONSUMER PREFERENCES AND EXPECTATIONS
Good becomes more desirable higher demand
Expectation of pay cut lower demand
Shifts in a curve are NOT the same aschanges in quantity or price
‘‘Demand increased’’ is a shift of thedemand curve; quantity demanded
has changed at every price
A change in quantity demanded or priceis a movement along the curve
I DEMAND A QUIZ
QUESTIONS
1. The law of demand states that when price increasequantity demanded ______.
2. A change in quantity demanded for every priceimplies a _______.
3. An increase in the price of a good will lead to a(n)______ in the demand for its complement.
ANSWE
1. decreases; 2. shift of the demand curve; 3. decrea
Price
Quantity Demanded
$25
$20
$15
$10
$5
5 10 15 20
7/18/2019 Economics Cram Kit
http://slidepdf.com/reader/full/economics-cram-kit-56d6a0b3cdef5 8/48
ECONOMICS CRAM KIT | 7
MICROECONOMICSSupply
THEORY OF THE FIRM SHIFTY SUPPLY
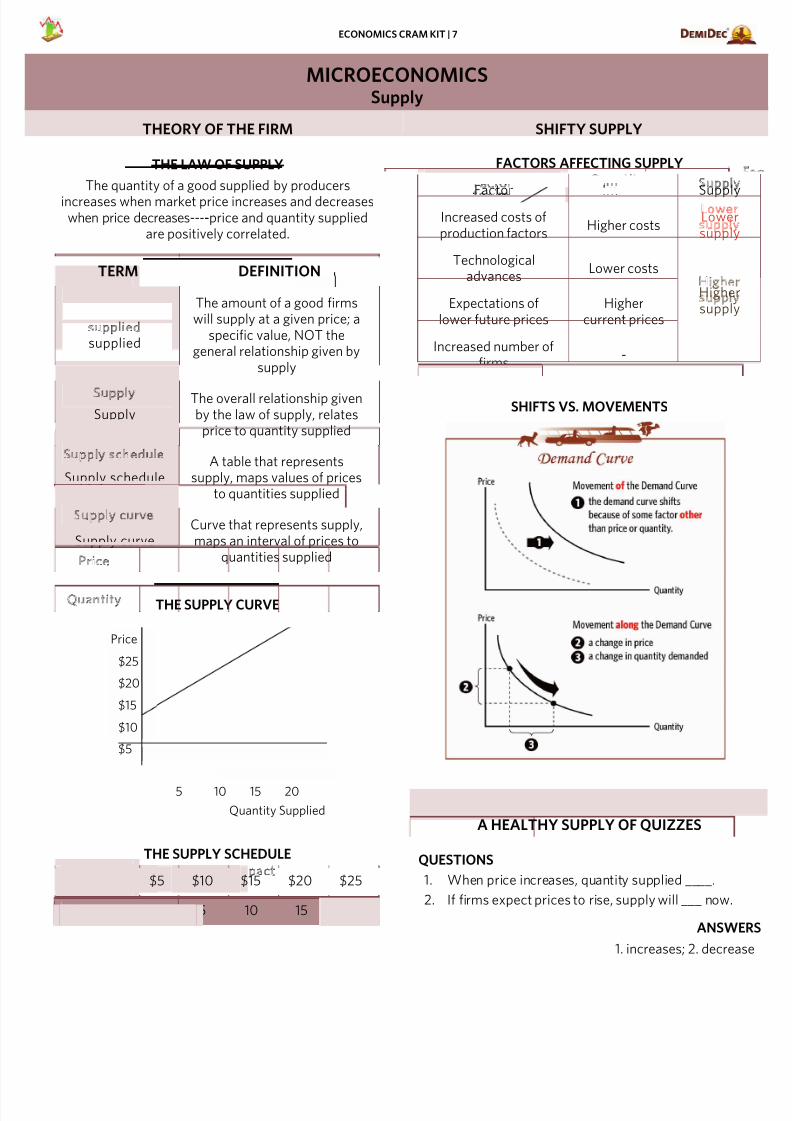
THE LAW OF SUPPLY
The quantity of a good supplied by producers
increases when market price increases and decreaseswhen price decreases-----price and quantity supplied
are positively correlated.
TERM DEFINITION
Quantity supplied
The amount of a good firmswill supply at a given price; a
specific value, NOT thegeneral relationship given by
supply
Supply The overall relationship givenby the law of supply, relates
price to quantity supplied
Supply schedule A table that represents
supply, maps values of pricesto quantities supplied
Supply curve Curve that represents supply,maps an interval of prices to
quantities supplied
THE SUPPLY CURVE
THE SUPPLY SCHEDULE
Price $5 $10 $15 $20 $25
Quantity 0 5 10 15 20
FACTORS AFFECTING SUPPLY
Factor Impact SupplyIncreased costs ofproduction factors
Higher costsLower supply
Technologicaladvances
Lower costs
HighersupplyExpectations of
lower future pricesHigher
current prices
Increased number offirms
-
SHIFTS VS. MOVEMENTS
A HEALTHY SUPPLY OF QUIZZES
QUESTIONS
1. When price increases, quantity supplied ____.
2. If firms expect prices to rise, supply will ___ now.
ANSWE
1. increases; 2. decrea
Price
Quantity Supplied
$25
$20
$15
$10
$5
5 10 15 20
7/18/2019 Economics Cram Kit
http://slidepdf.com/reader/full/economics-cram-kit-56d6a0b3cdef5 9/48
ECONOMICS CRAM KIT | 8
MICROECONOMICSElasticity
ELASTICITY BASICS CALCULATING ELASTICITY
PRICE ELASTICITY OF DEMAND
How much is quantity demanded
affected by changes in the good’s price?
PRICE ELASTICITY OF SUPPLY
How much is quantity suppliedaffected by changes in a good’s price?
ELASTICITY AND GOODS
DEMAND
Elastic Inelastic
Goods with closesubstitutes | Example:
baseball caps
Luxury goods that we cando without | Example:
Porsches
Necessities that peoplemust buy regardless ofprice | Example: insulin
SUPPLY
Elastic Inelastic
In the long run, firms can
reallocate resources
In the short run, firmscannot reallocate
resourcesExtremely scarce goods
FACTORS THAT AFFECT PRICE ELASTICITY
Demand
Degree of substitution (goods withclose substitutes have high elasticityof demand)
Degree of necessity (necessities aremore inelastic)
Time frame (in the short run, goodstend to be more inelastic)
Scope of the market (a larger marketis more inelastic since fewersubstitutes are available)
Supply
Scarcity of inputs (scarcity of inputsmeans more inelastic supply)
Time frame (in the short run, supplyis inelastic)
Presence of barriers to entry (lowerbarriers to entry means more elasticsupply)
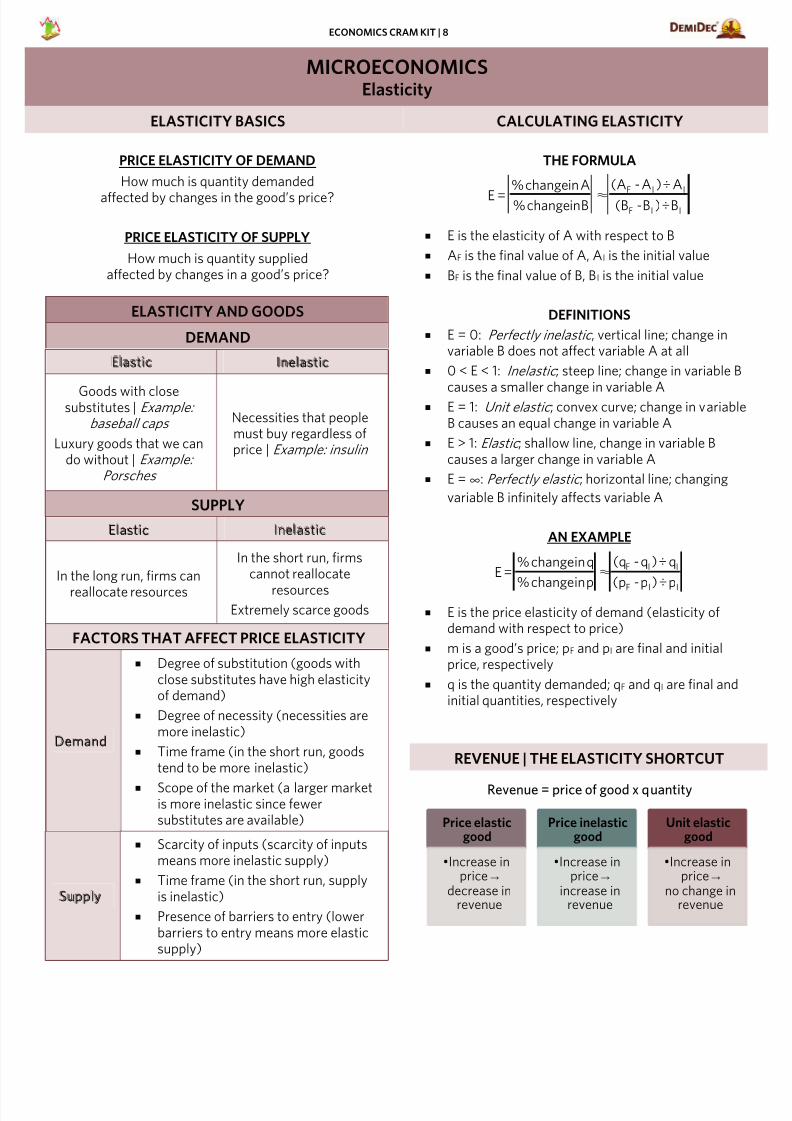
THE FORMULA
E is the elasticity of A with respect to B
AF is the final value of A, AI is the initial value
BF is the final value of B, B I is the initial value
DEFINITIONS
E = 0: Perfectly inelastic , vertical line; change invariable B does not affect variable A at all
0 < E < 1: Inelastic ; steep line; change in variable B
causes a smaller change in variable A E = 1: Unit elastic ; convex curve; change in variabl
B causes an equal change in variable A
E > 1: Elastic ; shallow line, change in variable Bcauses a larger change in variable A
E =∞: Perfectly elastic ; horizontal line; changing
variable B infinitely affects variable A
AN EXAMPLE
E is the price elasticity of demand (elasticity ofdemand with respect to price)
m is a good’s price; pF and pI are final and initialprice, respectively
q is the quantity demanded; qF and qI are final andinitial quantities, respectively
REVENUE | THE ELASTICITY SHORTCUT
Revenue = price of good x quantity
IIF
IIF
B÷)B-(B
A÷)A-(A
Binchange%
Ainchange%
=E ≈
IIF
IIF
p÷)p-(p
q÷)q-(q
pinchange%
qinchange%=E ≈
Price elasticgood
•Increase inprice ®
decrease inrevenue
Price inelasticgood
•Increase inprice ®
increase inrevenue
Unit elasticgood
•Increase inprice ®
no change inrevenue
7/18/2019 Economics Cram Kit
http://slidepdf.com/reader/full/economics-cram-kit-56d6a0b3cdef5 10/48
ECONOMICS CRAM KIT | 9
MICROECONOMICSEquilibrium
MEET ME AT THE INTERSECTION MARKET SURPLUS
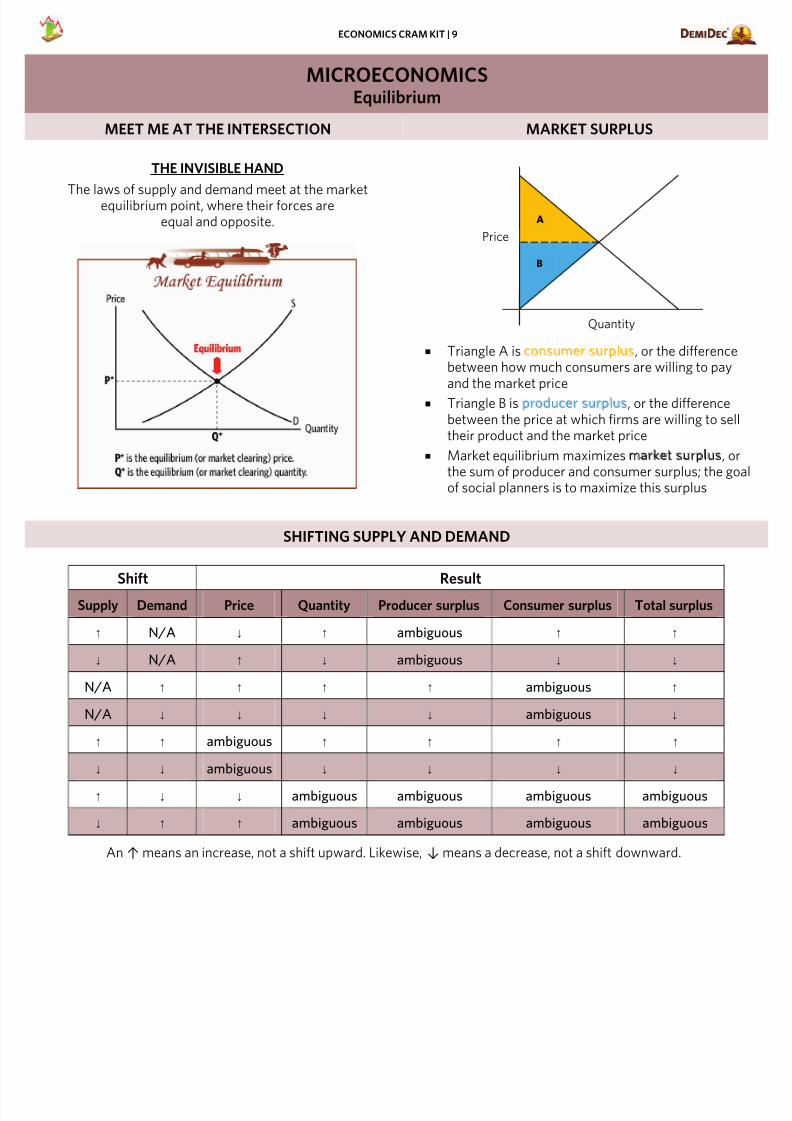
THE INVISIBLE HAND
The laws of supply and demand meet at the marketequilibrium point, where their forces areequal and opposite.
Triangle A is consumer surplus, or the differencebetween how much consumers are willing to payand the market price
Triangle B is producer surplus, or the differencebetween the price at which firms are willing to selltheir product and the market price
Market equilibrium maximizes market surplus, orthe sum of producer and consumer surplus; the goof social planners is to maximize this surplus
SHIFTING SUPPLY AND DEMAND
Shift Result
Supply Demand Price Quantity Producer surplus Consumer surplus Total surplus
- N/A ¯ - ambiguous - -
¯ N/A - ¯ ambiguous ¯ ¯
N/A - - - - ambiguous -
N/A ¯ ¯ ¯ ¯ ambiguous ¯
- - ambiguous - - - -
¯ ¯ ambiguous ¯ ¯ ¯ ¯
- ¯ ¯ ambiguous ambiguous ambiguous ambiguous
¯ - - ambiguous ambiguous ambiguous ambiguous
An- means an increase, not a shift upward. Likewise, ¯ means a decrease, not a shift downward.
A
B
Price
Quantity
7/18/2019 Economics Cram Kit
http://slidepdf.com/reader/full/economics-cram-kit-56d6a0b3cdef5 11/48
ECONOMICS CRAM KIT | 10
MICROECONOMICSGovernment Policies
PRICE CONTROLS TAXATION
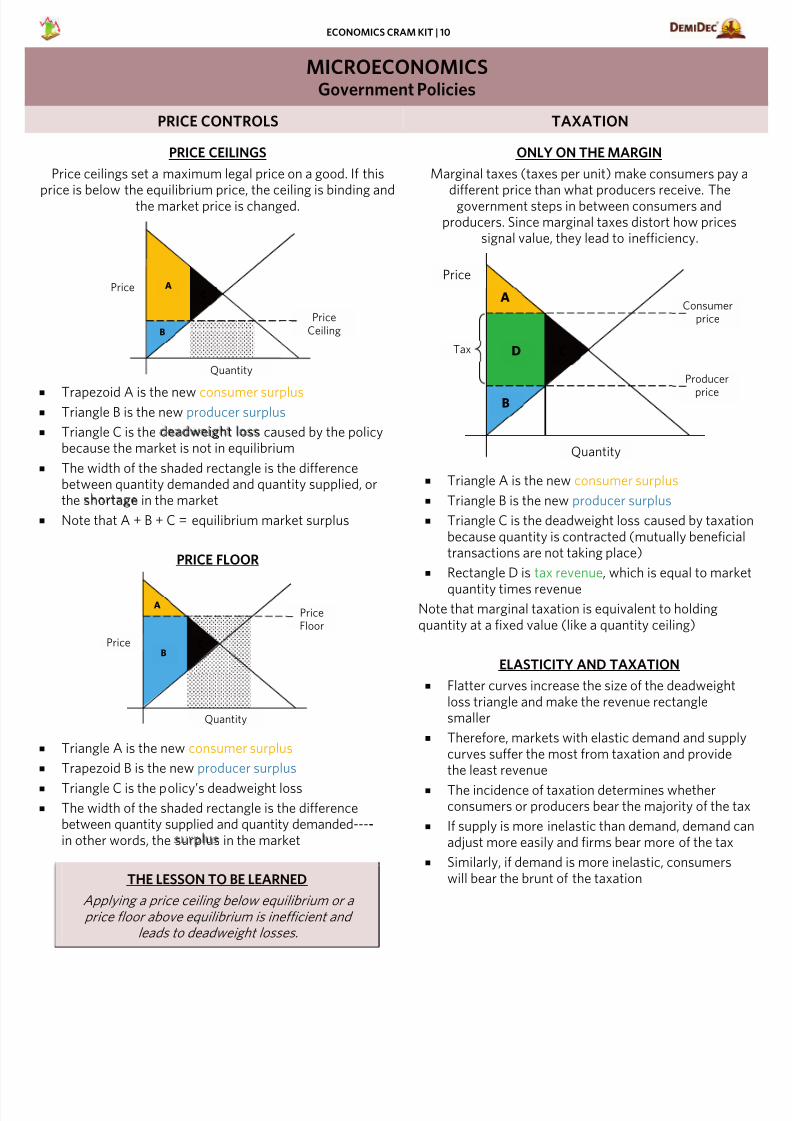
PRICE CEILINGS
Price ceilings set a maximum legal price on a good. If this
price is below the equilibrium price, the ceiling is binding andthe market price is changed.
Trapezoid A is the new consumer surplus Triangle B is the new producer surplus
Triangle C is the deadweight loss caused by the policybecause the market is not in equilibrium
The width of the shaded rectangle is the differencebetween quantity demanded and quantity supplied, orthe shortage in the market
Note that A + B + C = equilibrium market surplus
PRICE FLOOR
Triangle A is the new consumer surplus
Trapezoid B is the new producer surplus
Triangle C is the policy’s deadweight loss
The width of the shaded rectangle is the differencebetween quantity supplied and quantity demanded-----in other words, the surplus in the market
THE LESSON TO BE LEARNED
Applying a price ceiling below equilibrium or a
price floor above equilibrium is inefficient andleads to deadweight losses.
ONLY ON THE MARGIN
Marginal taxes (taxes per unit) make consumers pay
different price than what producers receive. Thegovernment steps in between consumers andproducers. Since marginal taxes distort how prices
signal value, they lead to inefficiency.
Triangle A is the new consumer surplus
Triangle B is the new producer surplus
Triangle C is the deadweight loss caused by taxatiobecause quantity is contracted (mutually beneficiatransactions are not taking place)
Rectangle D is tax revenue, which is equal to mark
quantity times revenueNote that marginal taxation is equivalent to holdingquantity at a fixed value (like a quantity ceiling)
ELASTICITY AND TAXATION
Flatter curves increase the size of the deadweightloss triangle and make the revenue rectanglesmaller
Therefore, markets with elastic demand and supplcurves suffer the most from taxation and providethe least revenue
The incidence of taxation determines whetherconsumers or producers bear the majority of the ta
If supply is more inelastic than demand, demand cadjust more easily and firms bear more of the tax
Similarly, if demand is more inelastic, consumerswill bear the brunt of the taxation
A
PriceB
PriceFloor
Quantity
C
APrice
B
C
PriceCeiling
Quantity
A
Price
B
Producer
price
Quantity
Consumerprice
Tax D C
7/18/2019 Economics Cram Kit
http://slidepdf.com/reader/full/economics-cram-kit-56d6a0b3cdef5 12/48
ECONOMICS CRAM KIT | 11
MICROECONOMICSTariffs and Exports
TRADE IN A SMALL ECONOMY TRADE TAXATION
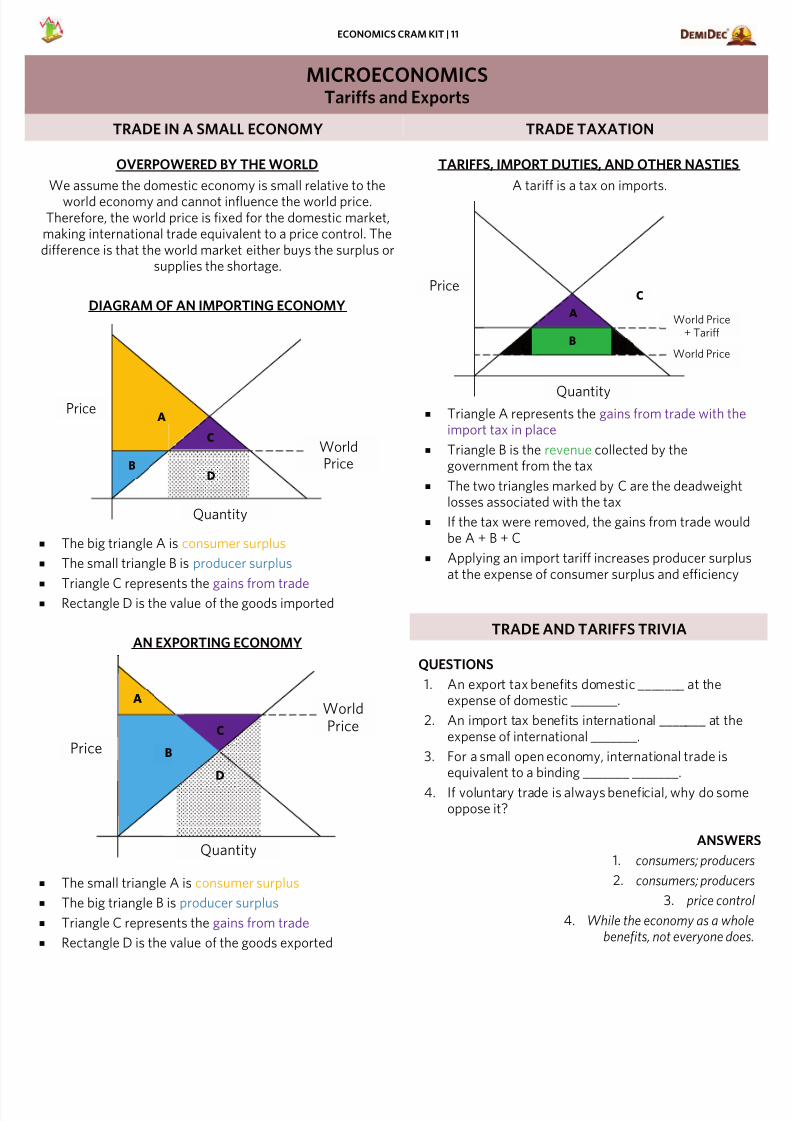
OVERPOWERED BY THE WORLD
We assume the domestic economy is small relative to the
world economy and cannot influence the world price.Therefore, the world price is fixed for the domestic market,
making international trade equivalent to a price control. Thedifference is that the world market either buys the surplus or
supplies the shortage.
DIAGRAM OF AN IMPORTING ECONOMY
The big triangle A is consumer surplus
The small triangle B is producer surplus
Triangle C represents the gains from trade Rectangle D is the value of the goods imported
AN EXPORTING ECONOMY
The small triangle A is consumer surplus
The big triangle B is producer surplus
Triangle C represents the gains from trade
Rectangle D is the value of the goods exported
TARIFFS, IMPORT DUTIES, AND OTHER NASTIES
A tariff is a tax on imports.
Triangle A represents the gains from trade with theimport tax in place
Triangle B is the revenue collected by thegovernment from the tax
The two triangles marked by C are the deadweightlosses associated with the tax
If the tax were removed, the gains from trade woube A + B + C
Applying an import tariff increases producer surpluat the expense of consumer surplus and efficiency
TRADE AND TARIFFS TRIVIA
QUESTIONS
1. An export tax benefits domestic _______ at theexpense of domestic _______.
2. An import tax benefits international _______ at theexpense of international _______.
3. For a small open economy, international trade isequivalent to a binding _______ _______.
4. If voluntary trade is always beneficial, why do somoppose it?
ANSWE
1. consumers; produce
2. consumers; produce
3. price cont
4. While the economy as a whobenefits, not everyone do
A
Price B
WorldPrice
Quantity
D
C
APrice
B
WorldPrice
Quantity
C
D
A
Price
World Price+ Tariff
Quantity
World PriceB
C
C C
7/18/2019 Economics Cram Kit
http://slidepdf.com/reader/full/economics-cram-kit-56d6a0b3cdef5 13/48
ECONOMICS CRAM KIT | 12
MICROECONOMICSBehavior of Firms
FIRM DECISION-MAKING COST CURVES
TYPES OF COSTS
Fixed costs: Incurred even when quantity produced is
zero, independent of output Variable costs: Change with quantity produced,
contribute to marginal cost
Total costs: Sum of fixed costs and variable costs
MARGINAL COST & MARGINAL REVENUE
Marginalcost
Cost of producing ‘‘just onemore’’ of a good
Marginalrevenue
Revenue from producing ‘‘justone more’’ of a good. For a
perfectly competitive market,fixed at market price
TYPES OF PROFIT
1. Accounting profit: Total revenue minus accountingcosts; producers attempt to maximize this
2. Economic profit: Total revenue minus full economiccosts (including opportunity costs)
3. Normal profit: Zero economic profit; means accountingprofit equals opportunity cost of production; in a
competitive market firms can expect normal profits in thelong run
THE GOLDEN RULE: MC = MR
All firms are assumed to seek to maximize profits.
Profit maximization in any market occurs where marginalrevenue equals marginal cost (MC=MR).
All firms will produce up to this point of profit-maximization.
In graphical terms, find where the marginal cost and marginalrevenue curves intersect. Then, look at the quantity wherethat occurs.
In a perfectly competitive market, the marginal revenue curveis the same as the demand curve, which is perfectly elastic at
the market price.
In a perfectly competitive market, therefore, profit-maximization occurs where the demand curve intersects the
MC curve.
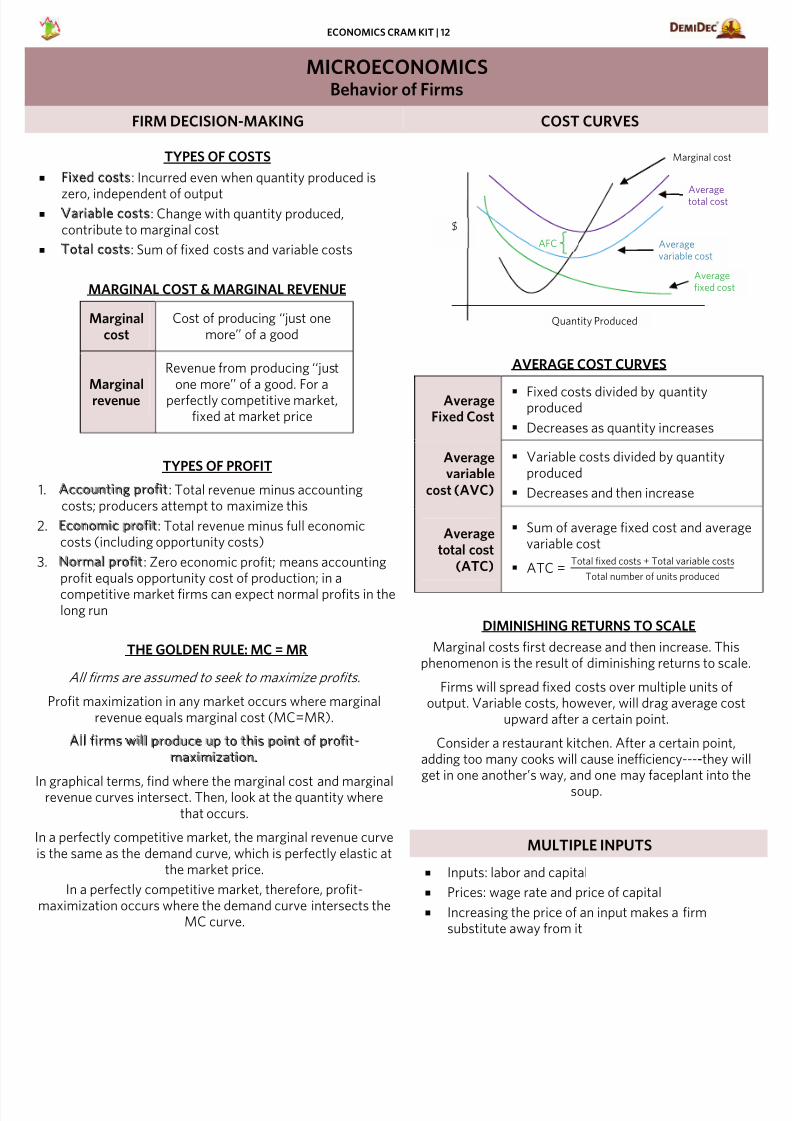
AVERAGE COST CURVES
AverageFixed Cost
Fixed costs divided by quantityproduced
Decreases as quantity increases
Averagevariable
cost (AVC)
Variable costs divided by quantityproduced
Decreases and then increase
Averagetotal cost
(ATC)
Sum of average fixed cost and averagvariable cost
ATC =Total fixed costs + Total variable costs
Total number of units produced
DIMINISHING RETURNS TO SCALE
Marginal costs first decrease and then increase. Thisphenomenon is the result of diminishing returns to scal
Firms will spread fixed costs over multiple units ofoutput. Variable costs, however, will drag average cos
upward after a certain point.
Consider a restaurant kitchen. After a certain point,adding too many cooks will cause inefficiency-----they wget in one another’s way, and one may faceplant into th
soup.
MULTIPLE INPUTS
Inputs: labor and capital
Prices: wage rate and price of capital
Increasing the price of an input makes a firmsubstitute away from it
Quantity Produced
Averagefixed cost
Marginal cost
AFC Averagevariable cost
Averagetotal cost
$
7/18/2019 Economics Cram Kit
http://slidepdf.com/reader/full/economics-cram-kit-56d6a0b3cdef5 14/48
ECONOMICS CRAM KIT | 13
MICROECONOMICSFailures of Perfect Competition
IMPERFECT MARKETS: MONOPOLY I HAVE THE POWER
FAILURES OF PERFECT COMPETITION
Removing any assumptions of perfect competition creates a
new market type. All of these market types are inefficientand create deadweight loss. All firms face downward sloping
demand curves.
MONOPOLY BASICS
Only one firm supplies (example: De Beers diamonds)
This firm has full market power to set prices
Arise from barriers to entry or economies of scale (aftera certain point, producing more of a good will increasecosts due to increasing inefficiency)
Faces a downward sloping demand curve (for the entiremarket)
DEALING WITH MONOPOLIES
The United States government has devised severalmethods of dealing with monopolies.
RegulationLegislation (Sherman
Anti-Trust Act)Public
Ownership
MARKET POWER
Market power is the ability of an individual to influenc
market price. Perfect competitors have no marketpower and must accept the market price.
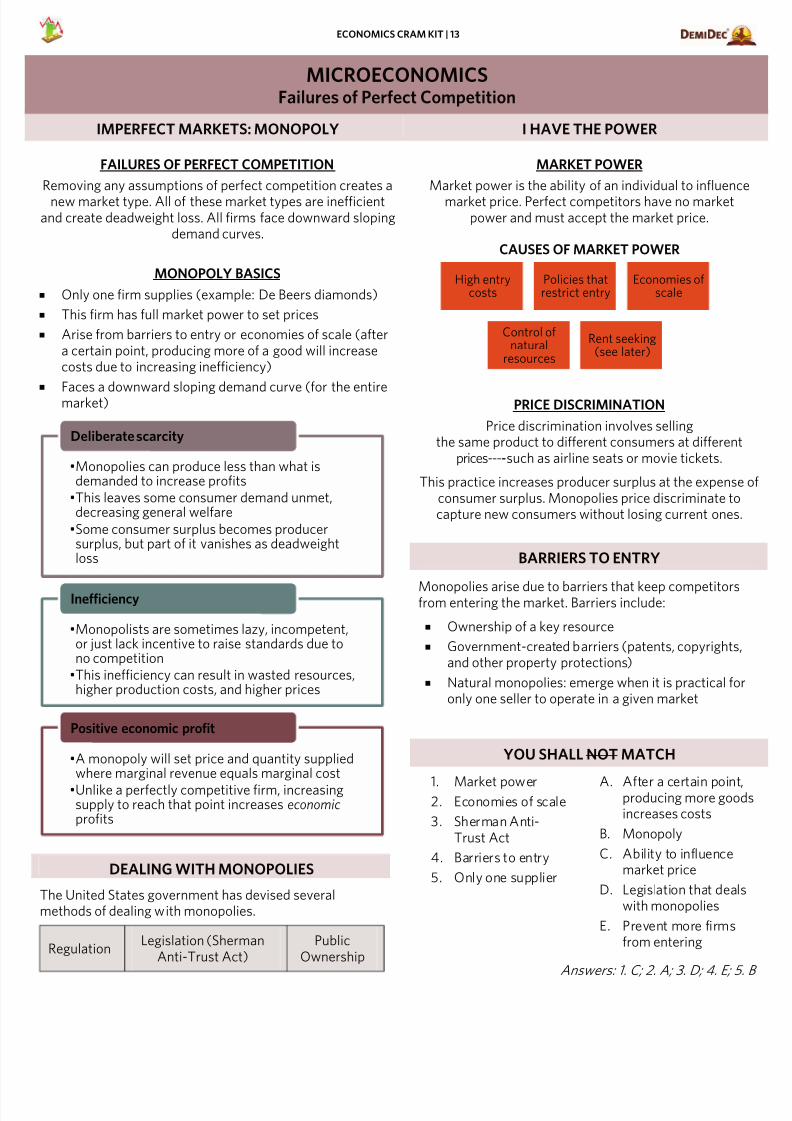
CAUSES OF MARKET POWER
PRICE DISCRIMINATION
Price discrimination involves sellingthe same product to different consumers at different
prices-----such as airline seats or movie tickets.
This practice increases producer surplus at the expenseconsumer surplus. Monopolies price discriminate tocapture new consumers without losing current ones
BARRIERS TO ENTRY
Monopolies arise due to barriers that keep competitorsfrom entering the market. Barriers include:
Ownership of a key resource
Government-created barriers (patents, copyrightsand other property protections)
Natural monopolies: emerge when it is practical foonly one seller to operate in a given market
YOU SHALL NOT MATCH
1. Market power2. Economies of scale
3. Sherman Anti-Trust Act
4. Barriers to entry
5. Only one supplier
A. After a certain pointproducing more gooincreases costs
B. Monopoly
C. Ability to influencemarket price
D. Legislation that dealwith monopolies
E. Prevent more firmsfrom entering
Answers: 1. C; 2. A; 3. D; 4. E; 5
•Monopolies can produce less than what isdemanded to increase profits
•This leaves some consumer demand unmet,decreasing general welfare
•Some consumer surplus becomes producersurplus, but part of it vanishes as deadweightloss
Deliberate scarcity
•Monopolists are sometimes lazy, incompetent,or just lack incentive to raise standards due tono competition
•This inefficiency can result in wasted resources,higher production costs, and higher prices
Inefficiency
•A monopoly will set price and quantity suppliedwhere marginal revenue equals marginal cost
•Unlike a perfectly competitive firm, increasingsupply to reach that point increases economicprofits
Positive economic profit
High entrycosts
Policies thatrestrict entry
Economies ofscale
Control ofnatural
resources
Rent seeking(see later)
7/18/2019 Economics Cram Kit
http://slidepdf.com/reader/full/economics-cram-kit-56d6a0b3cdef5 15/48
ECONOMICS CRAM KIT | 14
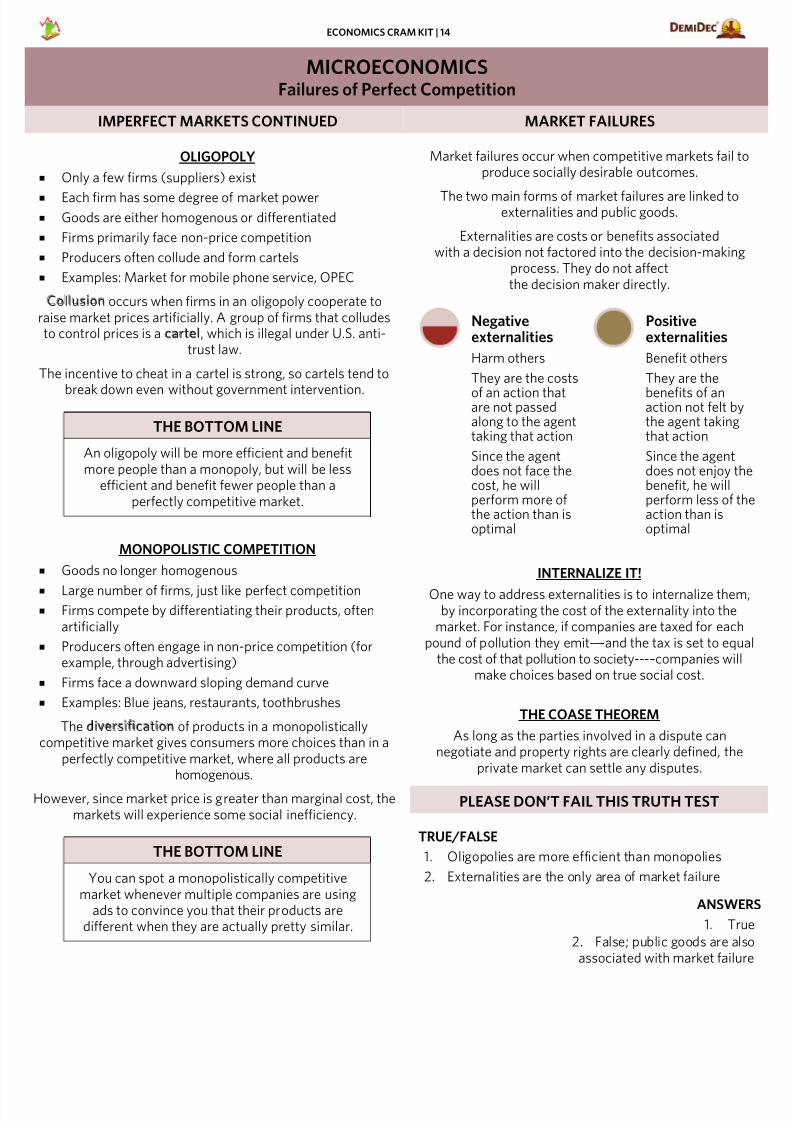
Harm others
They are the costs
of an action thatare not passedalong to the agenttaking that action
Since the agentdoes not face thecost, he willperform more ofthe action than isoptimal
Negativeexternalities
Benefit others
They are the
benefits of anaction not felt bythe agent takingthat action
Since the agentdoes not enjoy thbenefit, he willperform less of taction than isoptimal
Positiveexternalities
MICROECONOMICSFailures of Perfect Competition
IMPERFECT MARKETS CONTINUED MARKET FAILURES
OLIGOPOLY
Only a few firms (suppliers) exist
Each firm has some degree of market power
Goods are either homogenous or differentiated
Firms primarily face non-price competition
Producers often collude and form cartels
Examples: Market for mobile phone service, OPEC
Collusion occurs when firms in an oligopoly cooperate toraise market prices artificially. A group of firms that colludesto control prices is a cartel, which is illegal under U.S. anti-
trust law.
The incentive to cheat in a cartel is strong, so cartels tend to
break down even without government intervention.
THE BOTTOM LINE
An oligopoly will be more efficient and benefitmore people than a monopoly, but will be less
efficient and benefit fewer people than aperfectly competitive market.
MONOPOLISTIC COMPETITION
Goods no longer homogenous
Large number of firms, just like perfect competition
Firms compete by differentiating their products, oftenartificially
Producers often engage in non-price competition (forexample, through advertising)
Firms face a downward sloping demand curve
Examples: Blue jeans, restaurants, toothbrushes
The diversification of products in a monopolisticallycompetitive market gives consumers more choices than in a
perfectly competitive market, where all products arehomogenous.
However, since market price is greater than marginal cost, themarkets will experience some social inefficiency.
THE BOTTOM LINE
You can spot a monopolistically competitivemarket whenever multiple companies are using
ads to convince you that their products aredifferent when they are actually pretty similar.
Market failures occur when competitive markets fail tproduce socially desirable outcomes.
The two main forms of market failures are linked toexternalities and public goods.
Externalities are costs or benefits associatedwith a decision not factored into the decision-making
process. They do not affectthe decision maker directly.
INTERNALIZE IT!
One way to address externalities is to internalize themby incorporating the cost of the externality into the
market. For instance, if companies are taxed for eachpound of pollution they emit-----and the tax is set to equ
the cost of that pollution to society-----companies wilmake choices based on true social cost.
THE COASE THEOREM
As long as the parties involved in a dispute cannegotiate and property rights are clearly defined, the
private market can settle any disputes.
PLEASE DON’T FAIL THIS TRUTH TEST
TRUE/FALSE
1. Oligopolies are more efficient than monopolies
2. Externalities are the only area of market failure
ANSWE
1. Tr
2. False; public goods are alassociated with market failu
7/18/2019 Economics Cram Kit
http://slidepdf.com/reader/full/economics-cram-kit-56d6a0b3cdef5 16/48
ECONOMICS CRAM KIT | 15
MICROECONOMICSInstitutions
PROPERTY RIGHTS ENTREPRENEURS & CREATIVE DESTRUCTION
INSTITUTIONS AND ORGANIZATIONS
Institutions Organizations
Formal or informal rulesthat structure human
interaction
Examples: Codes ofconduct, social norms,
most markets, laws
More formal thaninstitutions
Examples: Stockexchanges, organizedreligions, corporations
MINE, NOT YOURS
Property rights dictate who can and can’t use a good.
The rivalry of a good is how much one person’s use of agood prevents another person from using it.
The excludability of a good is the ease of preventingsomeone from using it.
TYPES OF GOODS
EXCLUDABLE NON-EXCLUDABLE
RIVALPrivate Goods
(food, clothes, cars)
Collective goods (sidewalks, fishing
ponds)
NON-
RIVAL
Common goods
(electricity, cabletelevision)
Public Goods
(national defense,air)
INTELLECTUAL PROPERTY
Copyright: protection given to the creators of literature,art, or music
Patent: rights awarded to inventors so that no one elsecan copy their inventions for a period of time
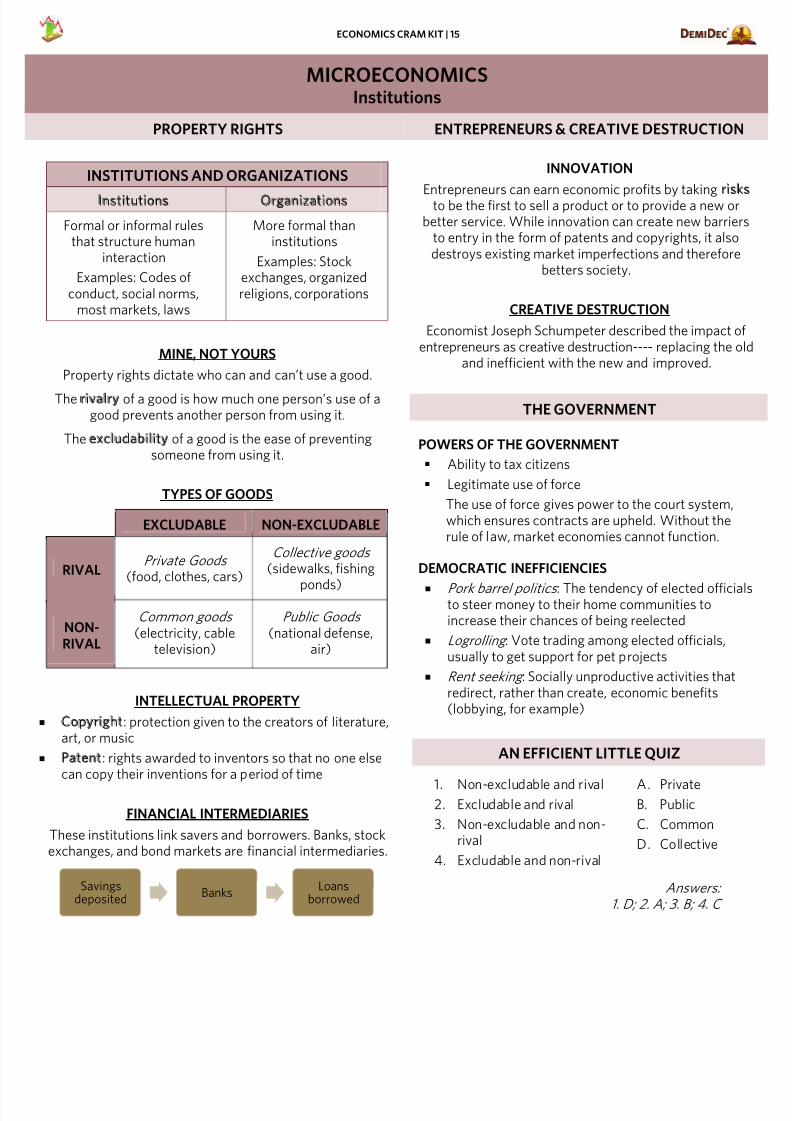
FINANCIAL INTERMEDIARIES
These institutions link savers and borrowers. Banks, stockexchanges, and bond markets are financial intermediaries.
INNOVATION
Entrepreneurs can earn economic profits by taking riskto be the first to sell a product or to provide a new orbetter service. While innovation can create new barrier
to entry in the form of patents and copyrights, it alsodestroys existing market imperfections and therefore
betters society.
CREATIVE DESTRUCTION
Economist Joseph Schumpeter described the impact oentrepreneurs as creative destruction----- replacing the o
and inefficient with the new and improved.
THE GOVERNMENT
POWERS OF THE GOVERNMENT
Ability to tax citizens
Legitimate use of force
The use of force gives power to the court system,which ensures contracts are upheld. Without therule of law, market economies cannot function.
DEMOCRATIC INEFFICIENCIES
Pork barrel politics : The tendency of elected officiato steer money to their home communities toincrease their chances of being reelected
Logrolling : Vote trading among elected officials,usually to get support for pet projects
Rent seeking : Socially unproductive activities thatredirect, rather than create, economic benefits(lobbying, for example)
AN EFFICIENT LITTLE QUIZ
1. Non-excludable and rival2. Excludable and rival
3. Non-excludable and non-rival
4. Excludable and non-rival
A. PrivateB. Public
C. Common
D. Collective
Answers:
1. D; 2. A; 3. B; 4. C
Savingsdeposited
BanksLoans
borrowed
7/18/2019 Economics Cram Kit
http://slidepdf.com/reader/full/economics-cram-kit-56d6a0b3cdef5 17/48
ECONOMICS CRAM KIT | 16
MACROECONOMICSBasics of Macroeconomics
MACROECONOMICS ISSUES THE STATE OF THE ECONOMY
Macroeconomics is concerned with two main issues:
Factors that affect things in the long run (the size of
economies, standard of living, and price level) The causes and consequences of short-run economic
fluctuations (especially unemployment and inflation)
REAL GDP
Real Gross Domestic Product (GDP) measures the totalquantity of goods and services produced in an economy in agiven year, adjusted for the effects of inflation.
REAL GDP PER CAPITA
‘‘Per capita’’ is a Latin phrase meaning ‘‘per head.’’ GDP per
capita is the GDP per person in the economy; it indicates whatthe average person is able to consume in an economy.
If the population were suddenly to double, GDP per capitawould be cut in half. (Technically, the same would be true ifevery person in the economy were to grow a second head.)
AVERAGE LABOR PRODUCTIVITY
Average labor productivity measures how much the typicalworker can produce.
Divide the economy’s total output (GDP) by the total number
of workers employed.
Average labor productivity =Economy's output (GDP)
Total number of workers
Greater levels of production and average labor productivityenable consumption that improves the standard of living.
HUMAN HAPPINESS
Human happiness depends on more than just material levelsof consumption. Other important factors:
A long, healthy life
Access to education
Clean environment
Possession of alpacas
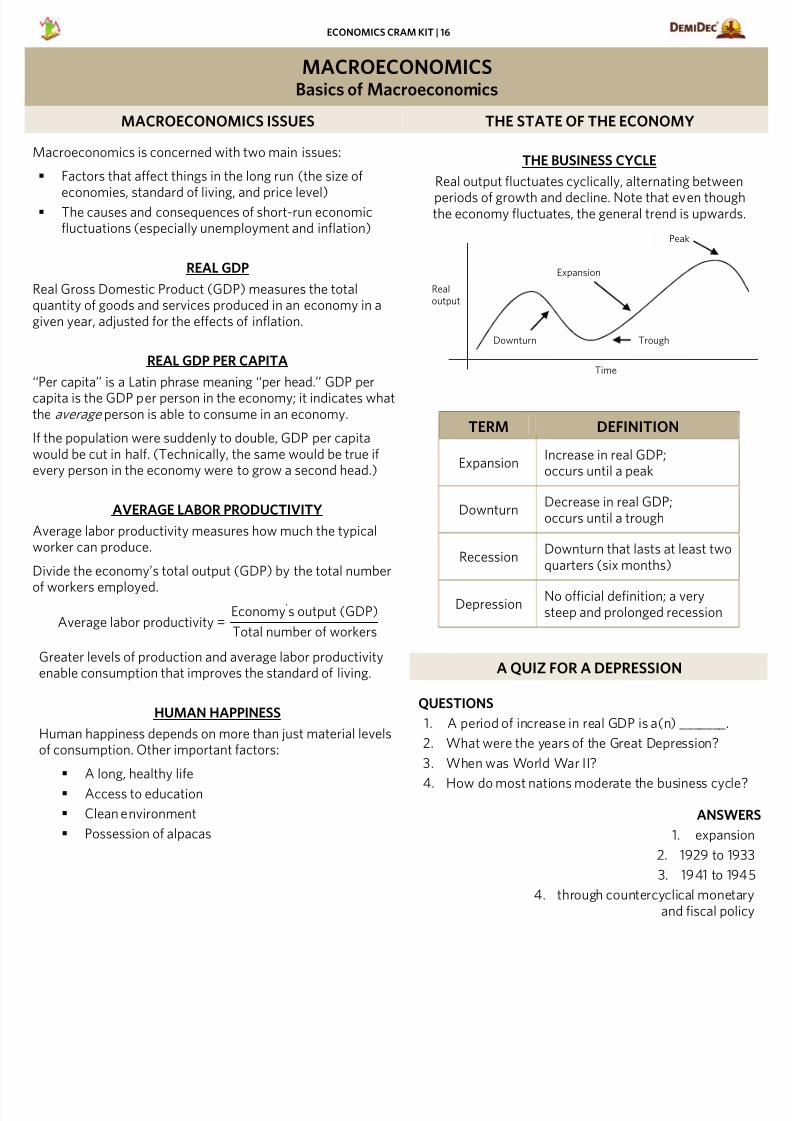
THE BUSINESS CYCLE
Real output fluctuates cyclically, alternating between
periods of growth and decline. Note that even thoughthe economy fluctuates, the general trend is upwards
TERM DEFINITION
ExpansionIncrease in real GDP;occurs until a peak
DownturnDecrease in real GDP;occurs until a trough
RecessionDownturn that lasts at least twoquarters (six months)
DepressionNo official definition; a verysteep and prolonged recession
A QUIZ FOR A DEPRESSION
QUESTIONS
1. A period of increase in real GDP is a(n) _______.
2. What were the years of the Great Depression?
3. When was World War II?
4. How do most nations moderate the business cycle
ANSWE
1. expansi
2. 1929 to 19
3. 1941 to 194
4. through countercyclical monetaand fiscal poli
Peak
Trough
Expansion
Downturn
Realoutput
Time
7/18/2019 Economics Cram Kit
http://slidepdf.com/reader/full/economics-cram-kit-56d6a0b3cdef5 18/48
ECONOMICS CRAM KIT | 17
MACROECONOMICSUnemployment
EMPLOYMENT TYPES OF UNEMPLOYMENT
THE LABOR FORCE
The labor force includes all members of the populationwho have a job (employed) or are actively seekingemployment (unemployed).
To be in the labor force, you cannot be:
Younger than 16 or retired
In jail, in the military, or a homemaker
A discouraged worker : you must have worked in the pastweek or looked for work in the past four weeks
TERM DEFINITION
Employmentrate
Percentage of the labor force thathas a job; number of persons
employed divided by the laborforce; never 100%
Unemploymentrate
Percentage of the labor force thatlacks a job but is searching for one.
The Bureau of Labor Statisticsmeasures unemployment.
Participationrate
Percentage of the population inthe labor force-----about 66%
Employed Worked for pay in the past week,or on vacation or sick leave
UnemployedDid not work during the past
week but did look for paid worksometime in the past four weeks
Discouragedworker / out ofthe labor force
Did not work in the past week orlook for work in the past four
weeks
THE NATURAL RATE OF UNEMPLOYMENT
Key fact: Full employment is NOT 0% unemployment.
There is always unemployment-----some people arealways between jobs, or just joining the labor force
The unemployment rate of an economy at full output isthe natural rate of unemployment
Okun’s law relates unemployment to GDP; every 1%increase in unemployment above the natural rate resultsin a 2% drop in real GDP
No one knows exactly what the natural rate is in 21st
century America-----it might be higher than it used to be
d
QUIZ FOR EMPLOYMENT
QUESTIONS
1. Unemployed workers must be _______, but nothave a _______.
2. Unemployment due to a mismatch between skillsdemanded and skills supplied is _______.
3. No one knows the ____ rate of unemployment.
4. The percentage of the population that is in the laboforce is known as the _______.
ANSWE
1. looking for work; j
2. structural unemployme
3. natu
4. labor participation ra
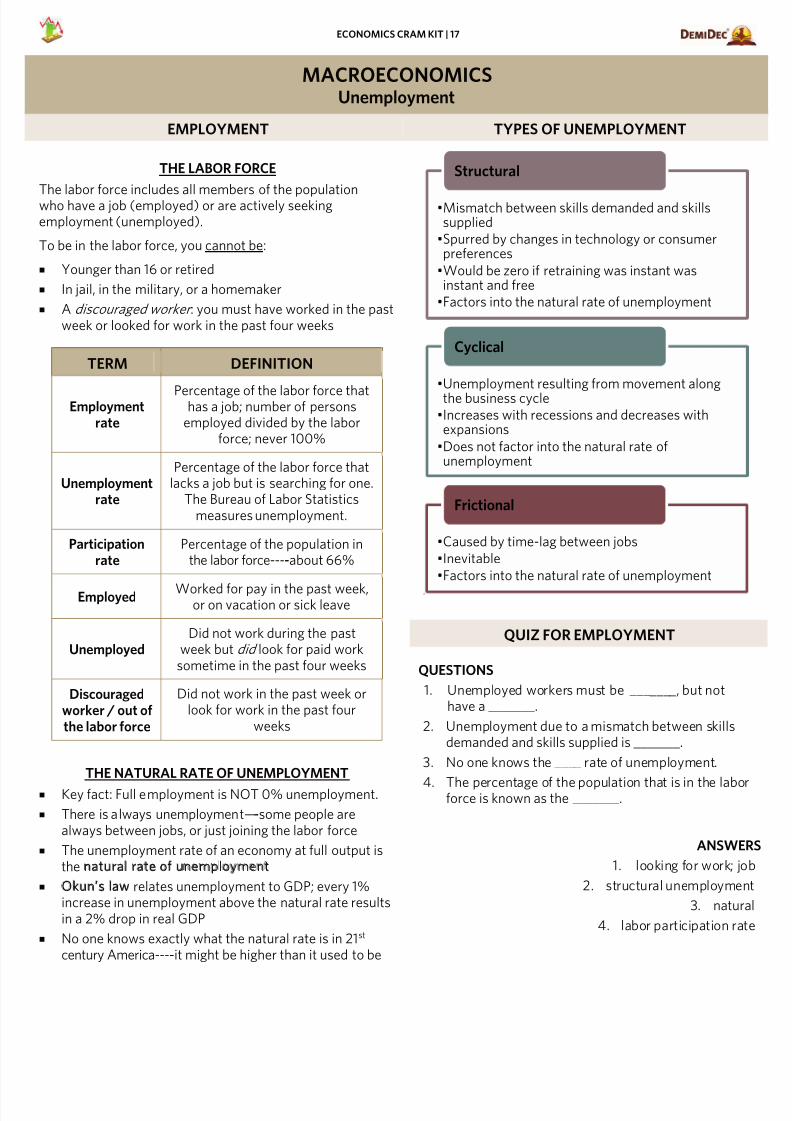
•Mismatch between skills demanded and skillssupplied
•Spurred by changes in technology or consumerpreferences
•Would be zero if retraining was instant wasinstant and free
•Factors into the natural rate of unemployment
Structural
•Unemployment resulting from movement alongthe business cycle
•Increases with recessions and decreases withexpansions
•Does not factor into the natural rate ofunemployment
Cyclical
•Caused by time-lag between jobs
•Inevitable
•Factors into the natural rate of unemployment
Frictional
7/18/2019 Economics Cram Kit
http://slidepdf.com/reader/full/economics-cram-kit-56d6a0b3cdef5 19/48
ECONOMICS CRAM KIT | 18
MACROECONOMICSGross Domestic Product
THE ‘‘BIG’’ PART OF MACRO HISTORY OF GDP
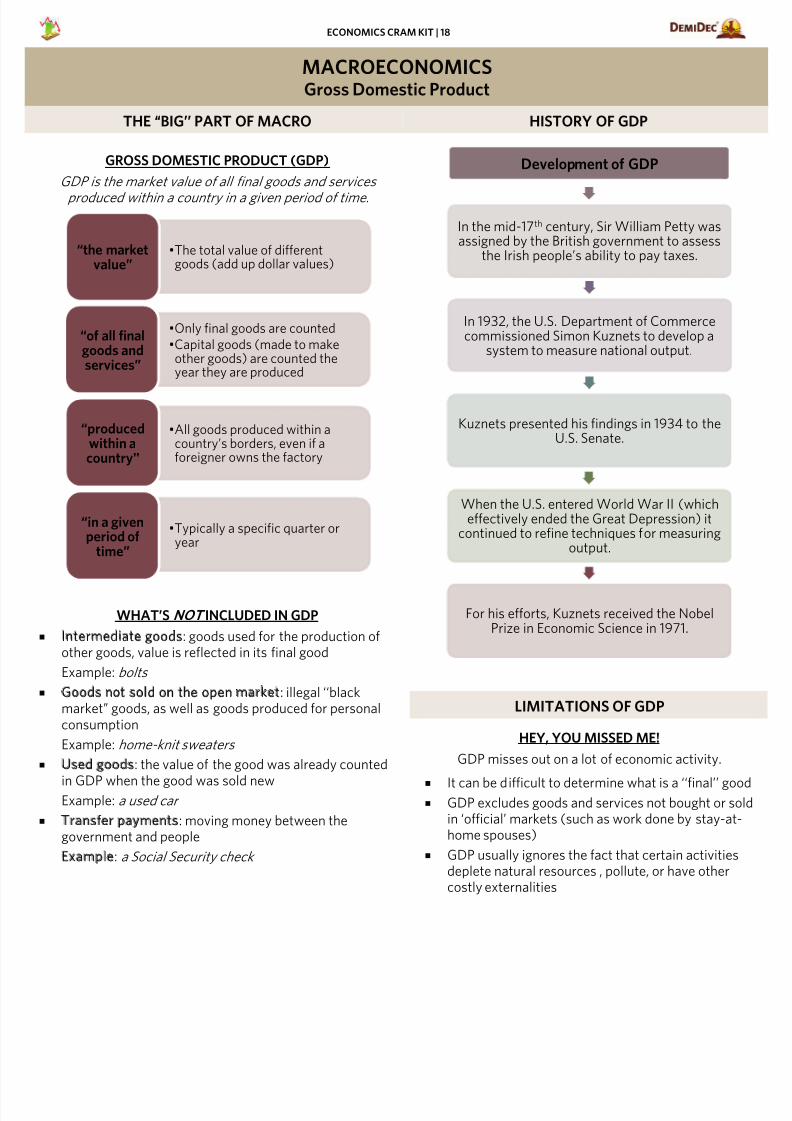
GROSS DOMESTIC PRODUCT (GDP)
GDP is the market value of all final goods and services
produced within a country in a given period of time.
WHAT’S NOT INCLUDED IN GDP
Intermediate goods: goods used for the production ofother goods, value is reflected in its final good
Example: bolts
Goods not sold on the open market: illegal ‘‘blackmarket’’ goods, as well as goods produced for personalconsumption
Example: home-knit sweaters
Used goods: the value of the good was already counted
in GDP when the good was sold newExample: a used car
Transfer payments: moving money between thegovernment and people
Example: a Social Security check
LIMITATIONS OF GDP
HEY, YOU MISSED ME!
GDP misses out on a lot of economic activity.
It can be difficult to determine what is a ‘‘final’’ goo GDP excludes goods and services not bought or so
in ‘official’ markets (such as work done by stay-at-home spouses)
GDP usually ignores the fact that certain activitiesdeplete natural resources , pollute, or have othercostly externalities
•The total value of differentgoods (add up dollar values)
“the marketvalue”
•Only final goods are counted
•Capital goods (made to makeother goods) are counted theyear they are produced
“of all finalgoods andservices”
•All goods produced within acountry’s borders, even if aforeigner owns the factory
“producedwithin acountry"
•Typically a specific quarter oryear
“in a givenperiod of
time”
Development of GDP
In the mid-17th century, Sir William Petty wasassigned by the British government to assess
the Irish people’s ability to pay taxes.
In 1932, the U.S. Department of Commercecommissioned Simon Kuznets to develop a
system to measure national output.
Kuznets presented his findings in 1934 to theU.S. Senate.
When the U.S. entered World War II (whicheffectively ended the Great Depression) it
continued to refine techniques for measuringoutput.
For his efforts, Kuznets received the NobelPrize in Economic Science in 1971.
7/18/2019 Economics Cram Kit
http://slidepdf.com/reader/full/economics-cram-kit-56d6a0b3cdef5 20/48
ECONOMICS CRAM KIT | 19
MACROECONOMICSMeasuring GDP
MEASURING GDP, PART A MEASURING GDP, PART B
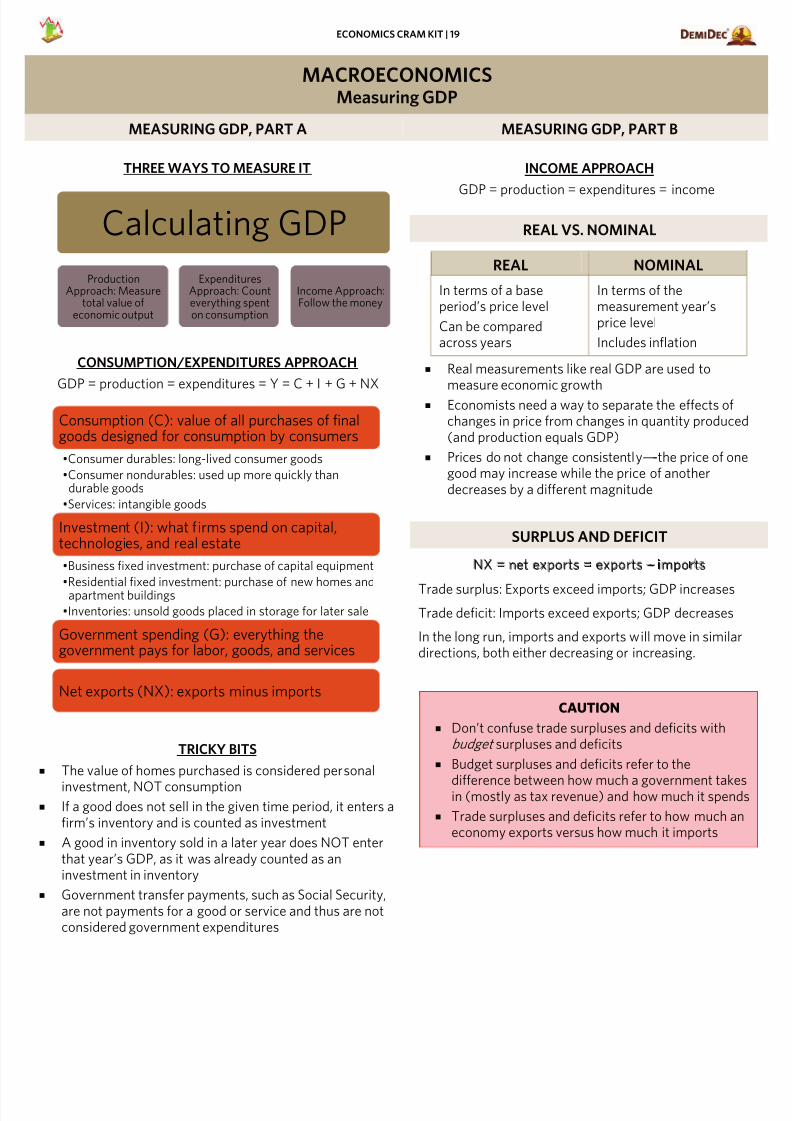
THREE WAYS TO MEASURE IT
CONSUMPTION/EXPENDITURES APPROACH
GDP = production = expenditures = Y = C + I + G + NX
TRICKY BITS
The value of homes purchased is considered personal
investment, NOT consumption If a good does not sell in the given time period, it enters a
firm’s inventory and is counted as investment
A good in inventory sold in a later year does NOT enterthat year’s GDP, as it was already counted as aninvestment in inventory
Government transfer payments, such as Social Security,are not payments for a good or service and thus are notconsidered government expenditures
INCOME APPROACH
GDP = production = expenditures = income
REAL VS. NOMINAL
REAL NOMINAL
In terms of a baseperiod’s price level
Can be comparedacross years
In terms of themeasurement year’sprice level
Includes inflation
Real measurements like real GDP are used tomeasure economic growth
Economists need a way to separate the effects ofchanges in price from changes in quantity produce(and production equals GDP)
Prices do not change consistently-----the price of ongood may increase while the price of anotherdecreases by a different magnitude
SURPLUS AND DEFICIT
NX = net exports = exports --- imports
Trade surplus: Exports exceed imports; GDP increases
Trade deficit: Imports exceed exports; GDP decreases
In the long run, imports and exports will move in similardirections, both either decreasing or increasing.
CAUTION
Don’t confuse trade surpluses and deficits withbudget surpluses and deficits
Budget surpluses and deficits refer to the
difference between how much a government takein (mostly as tax revenue) and how much it spend
Trade surpluses and deficits refer to how much aneconomy exports versus how much it imports
Consumption (C): value of all purchases of finalgoods designed for consumption by consumers
•Consumer durables: long-lived consumer goods
•Consumer nondurables: used up more quickly thandurable goods
•Services: intangible goods
Investment (I): what firms spend on capital,technologies, and real estate
•Business fixed investment: purchase of capital equipment
•Residential fixed investment: purchase of new homes andapartment buildings
•Inventories: unsold goods placed in storage for later sale
Government spending (G): everything thegovernment pays for labor, goods, and services
Net exports (NX): exports minus imports
Calculating GDP
ProductionApproach: Measure
total value ofeconomic output
ExpendituresApproach: Counteverything spenton consumption
Income Approach:Follow the money
7/18/2019 Economics Cram Kit
http://slidepdf.com/reader/full/economics-cram-kit-56d6a0b3cdef5 21/48
ECONOMICS CRAM KIT | 20
MACROECONOMICSMeasuring Inflation
INFLATION AND THE CONSUMER PRICE INDEX GDP DEFLATOR
WHAT IS INFLATION?
Inflation is an increase in the aggregate price level or,
equivalently, a decrease in the value of money
THE CONSUMER PRICE INDEX (CPI)
In the United States, the Bureau of Labor Statistics calculatesthe CPI each month by comparing the prices of a given basketof goods between the current year and a base year.
This basket includes the sorts of goods that an averagehousehold would buy regularly (housing is the maincomponent), and varies by income and region.
The CPI in the base year is always 100.
A CPI of 120 = prices are 20% higher than in the base year.A CPI of 75 = prices went down 25% since the base year.
THE FORMULA: CPIYEAR T=COST OF BASKETYEAR T
COST OF BASKETBASE YEAR X 100
ADVANTAGES DISADVANTAGES
Used to reflect changesin cost of living (so as to
adjust Social Securitybenefits and other
‘‘COLA’’ accounts)
New goods andservices are introduced all
of the time. Example: Kenyaadded mobile phone airtime
to its CPI basket in 2010.
Captures changes inprice for basic consumer
goods
Does not account forsubstitution bias
(consumers may switch to agood not in the basket if one
gets too expensive)
Makes inflation rateeasy to calculate
Does not account forchanges in quality
THE BOSKIN COMMISSION
In 1996, economist Michael Boskin was appointed to head acommission to evaluate CPI. His group found that the CPI
overstated the rate of price inflation by 1.3% a year.
The GDP deflator also measures inflation.
The deflator corrects for price increases in
nominal GDP.THE FORMULA
GDP deflator=nominal GDP
real GDP x 100
VOLATILITY
Compared to the CPI, the GDP deflator is much lessvolatile.
It increases less at peaks and declines less at troug
DIFFERENCES
The GDP deflator is differentfrom the CPI in two main ways.
The GDP deflator reflects only the prices ofdomestically produced goods.
The CPI can include imports like oil.
The GDP deflator and CPI place different weights ogoods.
Since the deflator weights prices by production, itadjusts to changing consumption patterns.
DEFLATING THE DEFLATOR: SHORTCOMINGS
Unfortunately, the GDP deflator is difficult to calculateaccurately and therefore is only published once per yea
That means the deflator cannot track inflation veryquickly. As a result, it is not very useful for guiding
government policy, despite its accuracy.
Like the CPI, the GDP deflator fails to take into accounchanges in product quality.
7/18/2019 Economics Cram Kit
http://slidepdf.com/reader/full/economics-cram-kit-56d6a0b3cdef5 22/48
ECONOMICS CRAM KIT | 21
MACROECONOMICSMoney
IT’S A… THE MONEY SUPPLY
DEFINITION
Money is something accepted as payment for goods
and for the settlement of debts.
FUNCTIONS OF MONEY
Medium of exchange: Eliminates the need to barter forgoods, which requires both parties to want what theother has (double coincidence of wants)
Unit of account: Establishes the value of goods relativeto one another
Store of value: Allows individuals to store wealth over aperiod of time
For something to be money, it must satisfy these threefunctions.
TYPES OF MONEY
Commodity money
Money with value outside of justbeing money, such as gold, orcigarettes in prison
Fiat money Money only valuable because thegovernment says it is and we believeit to be so
WHAT IS NOT MONEY
Credit cards are NOT money. They just provide a convenientway to accumulate debt.
The use of credit cards reduces the economy’s need formoney, since credit cards are convenient.
THE QUANTITY THEORY OF MONEY
MV = PQ
M = the money supply
V = velocity (how often a dollar is spent in a year)
P = the aggregate price level
Q = total output
V and Q are generally held constant,meaning an increase in M (money supply)
will lead to an increase in P (inflation).
DEFINITION
The money supply is the stock of all liquid assets in a
economy that can be exchanged for goods.
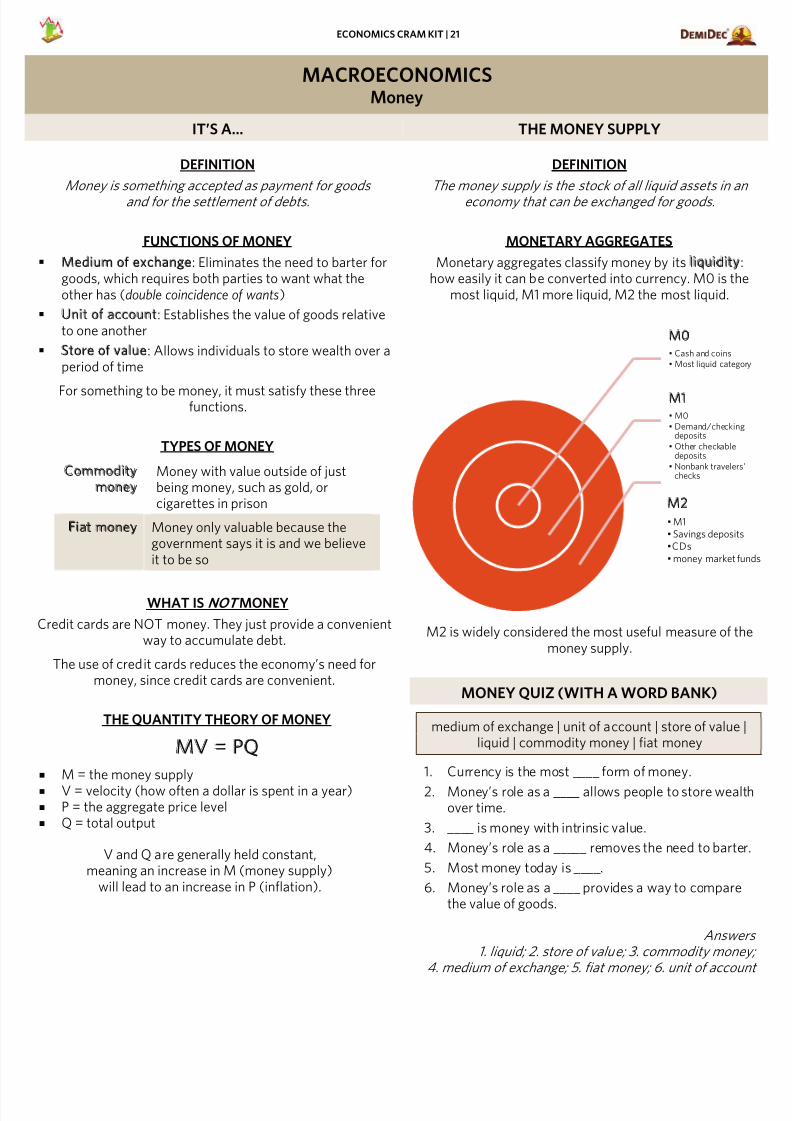
MONETARY AGGREGATES
Monetary aggregates classify money by its liquidityhow easily it can be converted into currency. M0 is th
most liquid, M1 more liquid, M2 the most liquid.
M2 is widely considered the most useful measure of thmoney supply.
MONEY QUIZ (WITH A WORD BANK)
medium of exchange | unit of account | store of valueliquid | commodity money | fiat money
1. Currency is the most ____ form of money.
2. Money’s role as a ____ allows people to store weaover time.
3. ____ is money with intrinsic value.
4. Money’s role as a _____ removes the need to barte
5. Most money today is ____.
6. Money’s role as a ____ provides a way to comparethe value of goods.
Answe1. liquid; 2. store of value; 3. commodity mon
4. medium of exchange; 5. fiat money; 6. unit of accou
M0• Cash and coins• Most liquid categ
M1• M0
• Demand/checkindeposits
• Other checkabledeposits
• Nonbank travelerschecks
M2
• M1
• Savings deposit
•CDs
• money market f
7/18/2019 Economics Cram Kit
http://slidepdf.com/reader/full/economics-cram-kit-56d6a0b3cdef5 23/48
ECONOMICS CRAM KIT | 22
MACROECONOMICSThe Financial System
SAVING AND INVESTMENT FINANCIAL INTERMEDIARIES
DEFINITIONS
Saving: Difference between what is earned and spent
Investment: Purchase of new capital equipment Financial institutions: Coordinate the saving and
investment decisions in the economy
Financial markets: Institutions in which people withmoney to save supply their funds to those who wish toborrow for investment
BONDS AND STOCKS
BONDS STOCKS
DEFINITION
Certificate that
specifies how muchthe borrower owesthe bond holder
Share of ownershipin a firm
SELLING Debt finance Equity finance
PROFITING
The bondpurchaser receivesboth the principalback and interest
on the loan
Shareholders hopeto have their stockincrease in value(and may receive
dividends)
RISKS
Market interestrates can fluctuate
The borrower maydefault by declaring
bankruptcy
Riskier than bond(bondholders are
paid beforeshareholders) but
rewards are greater
OTHER
The date ofmaturity is the dateon which the loan
will be repaid
Often sold to thepublic on stock
exchanges, such asthe NASDAQ orNew York Stock
Exchange
A financial intermediary links two other parties in afinancial transaction. Banks and mutual funds are the
most common.
BANKS
Most businesses turn to banks for the funds they needsince most small businesses do not have the resources
sell bonds or stocks.
Banks draw their funds from deposits made by peoplewho wish to save money. Banks pay their depositors a
rate of interest and charge borrowers an even higher raof interest for taking loans.
MUTUAL FUNDS
Mutual funds allow investors to buy into a diverse pool stocks and bonds in a single investment vehicle.
Diversification means mutual funds are less riskyand volatile than individual stocks
Mutual funds are managed by experts
Even someone with only a small amount of savingscan invest in a mutual fund and effectively have adiverse portfolio
INTRODUCING THE FEDERAL RESERVE
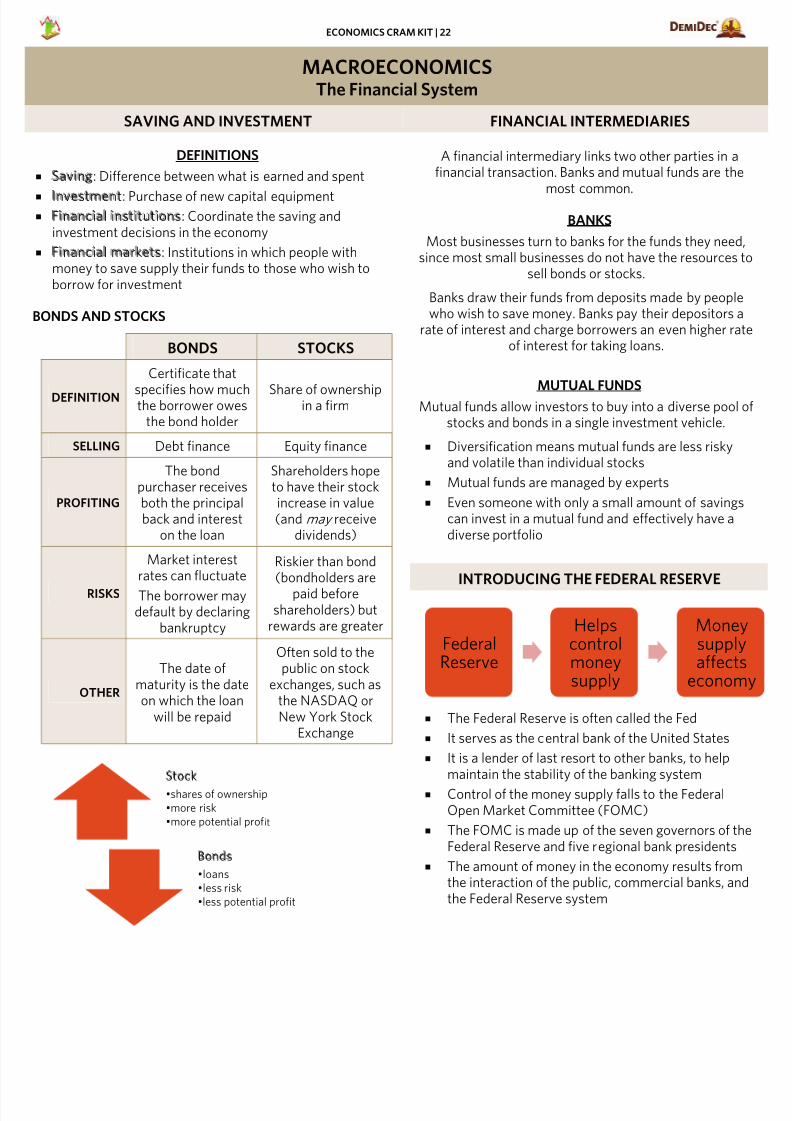
The Federal Reserve is often called the Fed
It serves as the central bank of the United States
It is a lender of last resort to other banks, to helpmaintain the stability of the banking system
Control of the money supply falls to the FederalOpen Market Committee (FOMC)
The FOMC is made up of the seven governors of thFederal Reserve and five regional bank presidents
The amount of money in the economy results fromthe interaction of the public, commercial banks, anthe Federal Reserve system
Stock
•shares of ownership
•more risk
•more potential profit
Bonds
•loans
•less risk
•less potential profit
FederalReserve
Helpscontrolmoneysupply
Monesupplyaffects
econom
7/18/2019 Economics Cram Kit
http://slidepdf.com/reader/full/economics-cram-kit-56d6a0b3cdef5 24/48
ECONOMICS CRAM KIT | 23
MACROECONOMICSMonetary Policy
SHOW ME THE MONEY THE FED IN SLIGHTLY MORE DETAIL
WHAT IS MONETARY POLICY?
The Federal Reserve can use monetary policy to stimulate orslow down the economy.
Monetary policy has three goals: price stability, full employment, and economic growth.
Policy makers cannot achieve all three goals simultaneously
WAYS TO IMPLEMENT MONETARY POLICY
OPEN MARKET OPERATIONS
FOMC trades securities onthe open market
Open market operationsare performed daily
Buying securities injectsmoney into the economy
Selling securities takesmoney out of the economy
DISCOUNT RATE AND FEDERAL FUNDS RATE
Discount rate Federal funds rate
Interest rate the Fedcharges banks for loans
Overnight rate charged onloans between banks
Changed infrequently andby the board of governors
Not directly set by the Fed,but strongly influenced
Increasing the interest rate decreases the money supply
RESERVE REQUIREMENT
Dictates how much of itsdeposits a bank must hold
in reserve
Set by the board ofgovernors
Increasing the reserverequirement decreases the
money supply
Money Multiplier=1
RR
(RR = reserve requirement)
AMERICA’S CENTRAL BANK
The Federal Reserve is the central bankingsystem of the United States.
Created by the Federal Reserve Act (1913)
It contains 12 district banks.
It sets monetary policy, manages banks, and serveas lender of last resort
FEDERAL RESERVE BOARD OF GOVERNORS
Located in Washington, D.C.
Directed by a presidentially-appointed chairman---as of 2012, Ben Bernanke.
Members appointed by the President, approved bySenate and serve 14 year terms
FEDERAL OPEN MARKET COMMITTEE (FOMC)
Manages open market operations
Made up of
Seven rotating governors of the Fed
President of the New York district bank
Presidents of four other district banks
Day-to-day operations run by New York bank
Meets every six weeks in Washington, D.C.
MONETARY POLICY: PROS AND CONS
THE POSITIVE
Monetary policy can be enacted immediately, unlikmost fiscal policy, which must be legislated
Central banks are relatively free of politicalinterference; thus, they can pursue unpopular butimportant policies
Central banks are staffed by professionals, notpoliticians
THE BAD
Monetary policy does not affect the economyquickly
Central banks are hard to hold accountable
Increasing the money supply may not boost theeconomy as well as traditional fiscal policy would
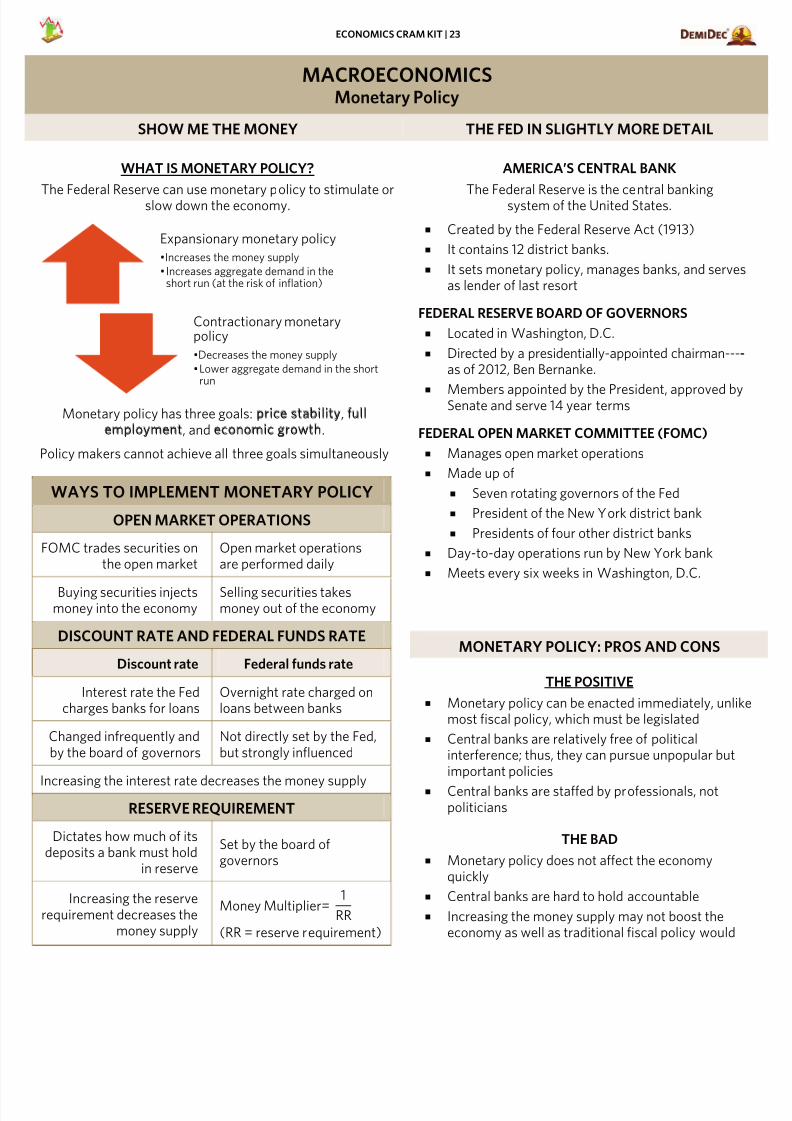
Expansionary monetary policy
•Increases the money supply
•Increases aggregate demand in theshort run (at the risk of inflation)
Contractionary monetarypolicy
•Decreases the money supply
•Lower aggregate demand in the shortrun
7/18/2019 Economics Cram Kit
http://slidepdf.com/reader/full/economics-cram-kit-56d6a0b3cdef5 25/48
ECONOMICS CRAM KIT | 24
MACROECONOMICSMore on Saving and Investment
SAVING AND INVESTMENT IN AGGREGATE COORDINATING SAVING AND INVESTMENT
IDENTITY
An identity will always be true, just like the equality of GDP,
production, income, and expenditures.
CLOSED TO TRADE
Assume the economy in question is closed to trade.
GDP = Y = C + I + G
I = Y --- C --- G = national savings = S
By subtracting net taxes (T) from each side:
S = (Y --- C --- T) + (T --- G) = I
Savings is equal to investment and to the sum of privatesavings (Y --- C --- T) and government saving (T --- G).
GOVERNMENT SAVINGS
If government savings are positive, thegovernment is running a budget surplus.
If government savings are negative, thegovernment is running a budget deficit.
This implies that when the government runs a deficit,investment decreases.
INTERNATIONAL CAPITAL FLOWS
In an open economy, domestic savings do not need to equaldomestic investment.
There are two kinds of international capital flows.
Foreign direct investment: A company or individualacquires and actively manages assets in a foreigncountry-----such as an airport in Belgium run by the British
Portfolio investment: An individual or companypurchases stock or bonds issued by a foreign corporationbut does not play a direct role in managing it
Net capital output (NCO) equals the purchase of foreign
capital or financial assets by domestic residents minus foreignpurchase of domestic assets.
In an open economy, NCO = NX
Remember: Y = C + I + G + NX, so:
Y --- C --- G = S = I + NX
Therefore, S = I + NCO
In an open economy, savings can differ from investment onlyas much as the difference is offset by net capital outflow.
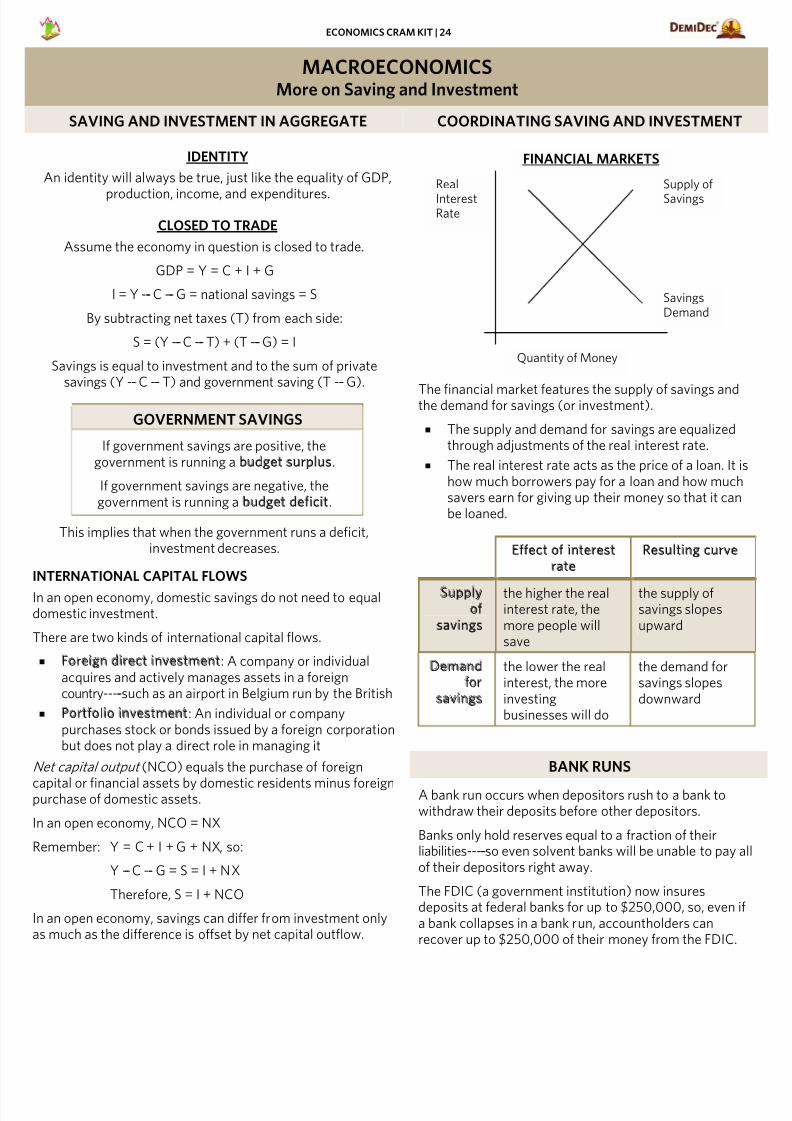
The financial market features the supply of savings andthe demand for savings (or investment).
The supply and demand for savings are equalizedthrough adjustments of the real interest rate.
The real interest rate acts as the price of a loan. It ihow much borrowers pay for a loan and how muchsavers earn for giving up their money so that it canbe loaned.
Effect of interest rate
Resulting curve
Supply of
savings
the higher the realinterest rate, themore people willsave
the supply ofsavings slopesupward
Demand for
savings
the lower the realinterest, the moreinvestingbusinesses will do
the demand forsavings slopesdownward
BANK RUNS
A bank run occurs when depositors rush to a bank towithdraw their deposits before other depositors.
Banks only hold reserves equal to a fraction of theirliabilities-----so even solvent banks will be unable to pay aof their depositors right away.
The FDIC (a government institution) now insuresdeposits at federal banks for up to $250,000, so, even ia bank collapses in a bank run, accountholders canrecover up to $250,000 of their money from the FDIC.
Quantity of Money
FINANCIAL MARKETS
Real
InterestRate
SavingsDemand
Supply of
Savings
7/18/2019 Economics Cram Kit
http://slidepdf.com/reader/full/economics-cram-kit-56d6a0b3cdef5 26/48
ECONOMICS CRAM KIT | 25
MACROECONOMICSMoney Market in the Long Run
PRICES AND THE LONG RUN BACK TO THE NEUTRALITY OF MONEY
The aggregate price level is the level of prices for the entireeconomy. It rises and falls over time.
If P is the price level, then it also measures the cost of abasket of goods.
Therefore, the amount of goods and service that can bebought with $1 is 1/P. 1/P is also the value of money
measured in terms of goods and services.
PRICES IN THE LONG RUN: MONEY MARKET
Just like in any other market, the value of money isdetermined by the interaction of supply and demand.
MONEY SUPPLY MONEY DEMAND
Depends on thedecisions of the
Federal Reserve andthe banking system
Depends on how muchwealth people want to hold
as money
Inelastic in the short-run since it is set bythe Federal Reserve
Relates to the volume andprices of the transactions
that take place
If the real level of economicactivity stays the same,doubling prices should
double demand for money
The long run is the time period it takes for the price level toequate demand for money with the money supply.
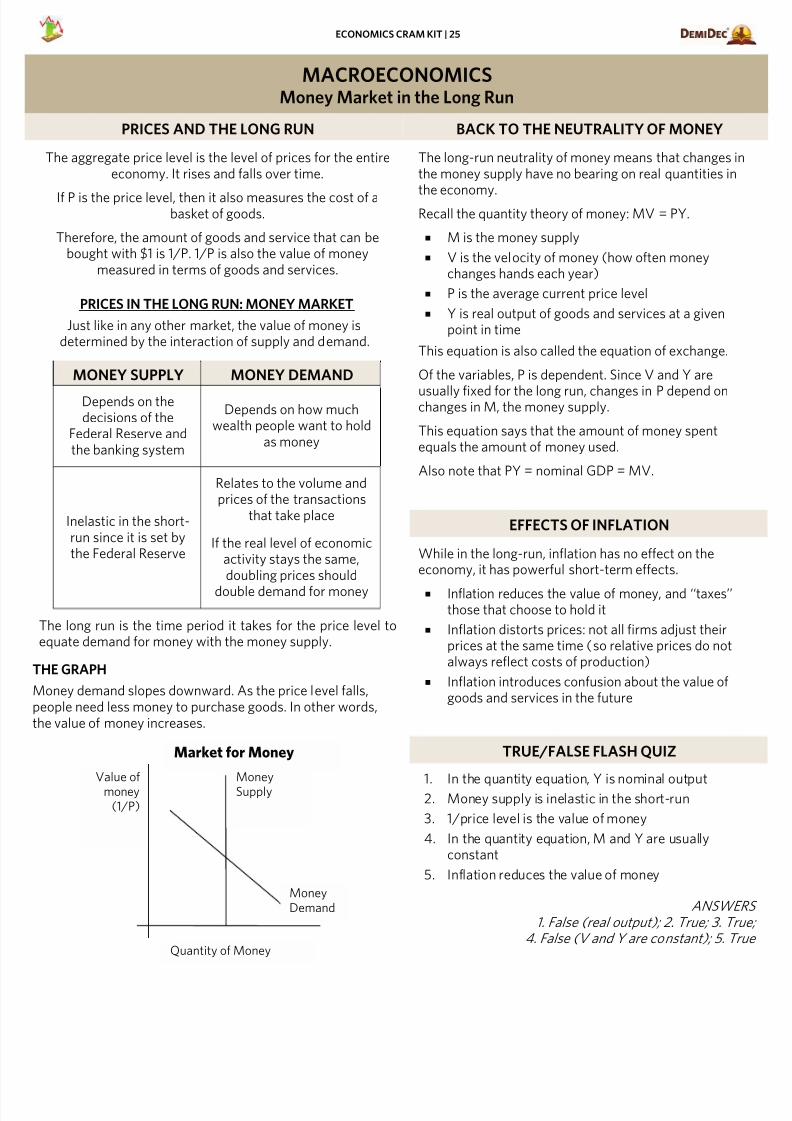
THE GRAPH
Money demand slopes downward. As the price level falls,people need less money to purchase goods. In other words,the value of money increases.
The long-run neutrality of money means that changes inthe money supply have no bearing on real quantities in
the economy.Recall the quantity theory of money: MV = PY.
M is the money supply
V is the velocity of money (how often moneychanges hands each year)
P is the average current price level
Y is real output of goods and services at a givenpoint in time
This equation is also called the equation of exchange.
Of the variables, P is dependent. Since V and Y are
usually fixed for the long run, changes in P depend onchanges in M, the money supply.
This equation says that the amount of money spentequals the amount of money used.
Also note that PY = nominal GDP = MV.
EFFECTS OF INFLATION
While in the long-run, inflation has no effect on theeconomy, it has powerful short-term effects.
Inflation reduces the value of money, and ‘‘taxes’’those that choose to hold it
Inflation distorts prices: not all firms adjust theirprices at the same time (so relative prices do notalways reflect costs of production)
Inflation introduces confusion about the value ofgoods and services in the future
TRUE/FALSE FLASH QUIZ
1. In the quantity equation, Y is nominal output2. Money supply is inelastic in the short-run
3. 1/price level is the value of money
4. In the quantity equation, M and Y are usuallyconstant
5. Inflation reduces the value of money
ANSWE
1. False (real output); 2. True; 3. Tru4. False (V and Y are constant); 5. Tr
Quantity of Money
Market for Money
Value ofmoney
(1/P)
MoneyDemand
MoneySupply

7/18/2019 Economics Cram Kit
http://slidepdf.com/reader/full/economics-cram-kit-56d6a0b3cdef5 27/48
ECONOMICS CRAM KIT | 26
MACROECONOMICSModeling the Economy
THE CIRCULAR FLOW MODEL FLOWS
GOODS AND SERVICES (CLOCKWISE)
MONEY (COUNTER-CLOCKWISE)
THE ACTORS
FIRMSProduce goods and services usingthe factors of production ownedby households
HOUSEHOLDS
Rent the factors of production(land, labor, capital,entrepreneurship) to firms
Consume goods produced by firms
GOVERNMENT
Ability to tax to earn income
Can borrow from financial marketsto produce goods for society
GDP AS FLOW
GDP is equal to the flow around the model at any
given point The expenditure approach is the sum of consumpt
and government purchases (since investment andexports are not counted in this model)
The income approach uses the flow of income tohouseholds
Totaling the flow in the money diagram yieldsnominal GDP
Totaling the flow in the goods and services diagramyields real GDP
ENTERING THE CIRCULAR FLOW MODELNew wealth enters the cycle through households.
Households provide the human labor used to work. Eveinputs such as land belong to individuals, which in turnbelong to households. These land-owning individuals retheir land to businesses.
CIRCULAR FLOW FLASH QUIZ
QUESTIONS
1. The three actors in the circular flow model are_______, _______, and _______.
2. The two markets in the circular flow model are themarkets for _______ and _______.
3. All factors of production are owned by _______.
4. With regard to the circular flow, nominal GDP isequal to the _______.
5. ______ sits between households and the goods andservices market.
ANSWERS
1. households; firms; government
2. goods and services; factors of production
3. households
4. flow around the money diagram
5. government
FactorMarkets
Firms
Goods andServicesMarkets
Households
FactorMarkets
Households
Goods andServicesMarkets
FirmsGovernment
Governmentpurchases
Income Wages andrent
RevenueConsumption
Taxes
Government
Goods andservices
Land, capitallabor
Factors ofproduction
Goods andservices
Goods andservices
Transfers
7/18/2019 Economics Cram Kit
http://slidepdf.com/reader/full/economics-cram-kit-56d6a0b3cdef5 28/48
ECONOMICS CRAM KIT | 27
MACROECONOMICSLiving Standards
AVERAGE LABOR PRODUCTIVITY GDP PER CAPITA
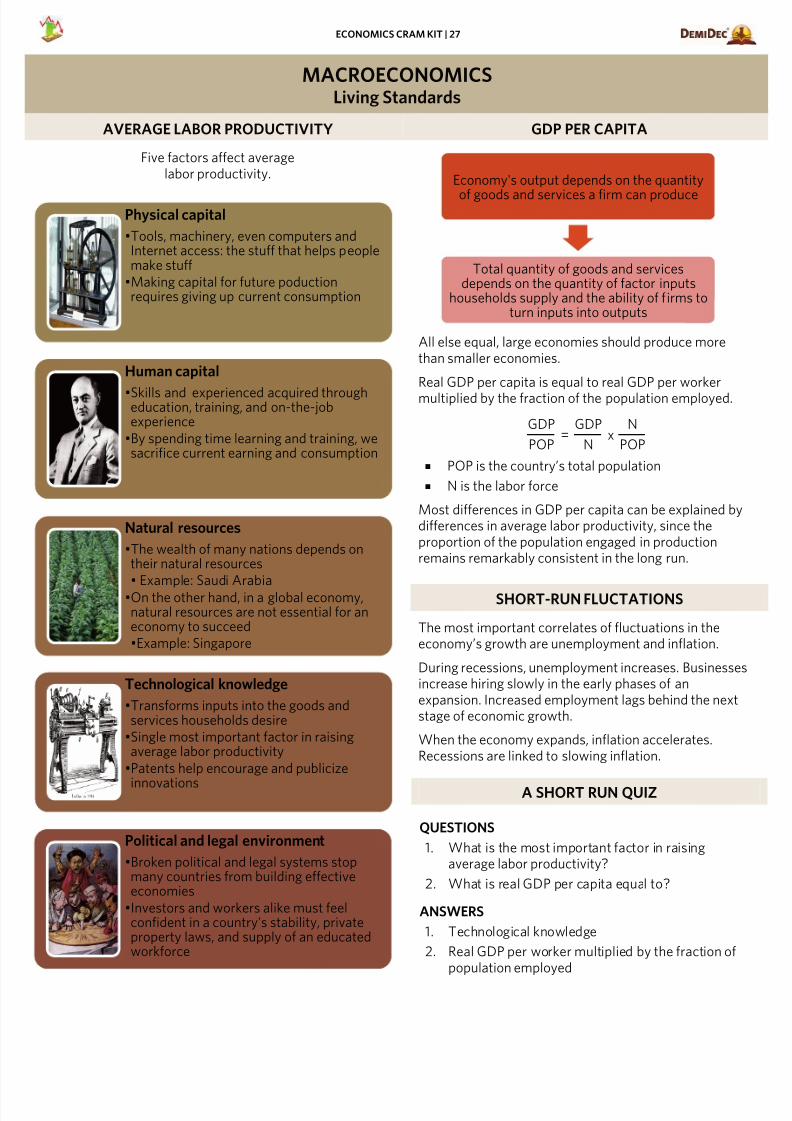
Five factors affect averagelabor productivity.
All else equal, large economies should produce morethan smaller economies.
Real GDP per capita is equal to real GDP per workermultiplied by the fraction of the population employed.
GDP
POP =
GDP
N x
N
POP
POP is the country’s total population
N is the labor force
Most differences in GDP per capita can be explained bydifferences in average labor productivity, since theproportion of the population engaged in productionremains remarkably consistent in the long run.
SHORT-RUN FLUCTATIONS
The most important correlates of fluctuations in theeconomy’s growth are unemployment and inflation.
During recessions, unemployment increases. Businesseincrease hiring slowly in the early phases of anexpansion. Increased employment lags behind the nextstage of economic growth.
When the economy expands, inflation accelerates.Recessions are linked to slowing inflation.
A SHORT RUN QUIZ
QUESTIONS
1. What is the most important factor in raisingaverage labor productivity?
2. What is real GDP per capita equal to?
ANSWERS
1. Technological knowledge
2. Real GDP per worker multiplied by the fraction ofpopulation employed
Physical capital
•Tools, machinery, even computers andInternet access: the stuff that helps peoplemake stuff
•Making capital for future poductionrequires giving up current consumption
Human capital
•Skills and experienced acquired througheducation, training, and on-the-jobexperience
•By spending time learning and training, wesacrifice current earning and consumption
Natural resources
•The wealth of many nations depends ontheir natural resources• Example: Saudi Arabia
•On the other hand, in a global economy,natural resources are not essential for aneconomy to succeed•Example: Singapore
Technological knowledge
•Transforms inputs into the goods andservices households desire
•Single most important factor in raisingaverage labor productivity
•Patents help encourage and publicize
innovations
Political and legal environment
•Broken political and legal systems stopmany countries from building effectiveeconomies
•Investors and workers alike must feelconfident in a country's stability, privateproperty laws, and supply of an educatedworkforce
Economy's output depends on the quantity
of goods and services a firm can produce
Total quantity of goods and servicesdepends on the quantity of factor inputs
households supply and the ability of firms toturn inputs into outputs
7/18/2019 Economics Cram Kit
http://slidepdf.com/reader/full/economics-cram-kit-56d6a0b3cdef5 29/48
ECONOMICS CRAM KIT | 28
MACROECONOMICSThe Output Gap and the Short Run
OUTPUT GAP SHORT RUN FLUCTATIONS AGAIN
TWO PART STRUCTURE
Think of the actual level of GDP as having two parts.
POTENTIAL OUTPUT
Potential output is the quantity of goods and services that theeconomy could produce when using all its resources atnormal rates.
Over time, the level of potential output can increase over timeas technology improves and the country obtains moreresources.
Y symbolizes actual output
Y* symbolizes potential output
OUTPUT GAPThe output gap is the difference between actual and potentialoutput.
Output gap = Y --- Y*
When an output gap exists, the economy’s resources are notbeing fully utilized.
When the economy is in recession, an output gap exists.Unemployment rises beyond the natural rate ofunemployment.
During the presence of an output gap, Okun’s Law (that for
every 1% the unemployment rate differs from the natural rateof unemployment, the output gap deviates by 2%) applies.
JOHN MAYNARD KEYNES
British economist John Maynard Keynes (1883-1946)developed the model to explain short-run fluctuations.
His theory was first published in the 1936 book, TheGeneral Theory of Employment, Interest, and Money .
Keynes believed known economic models were
inadequate to account for the Great Depression.His view of the business cycle—and how to manage it by
adjusting taxation and government spending—wouldbecome known as Keynesian economics.
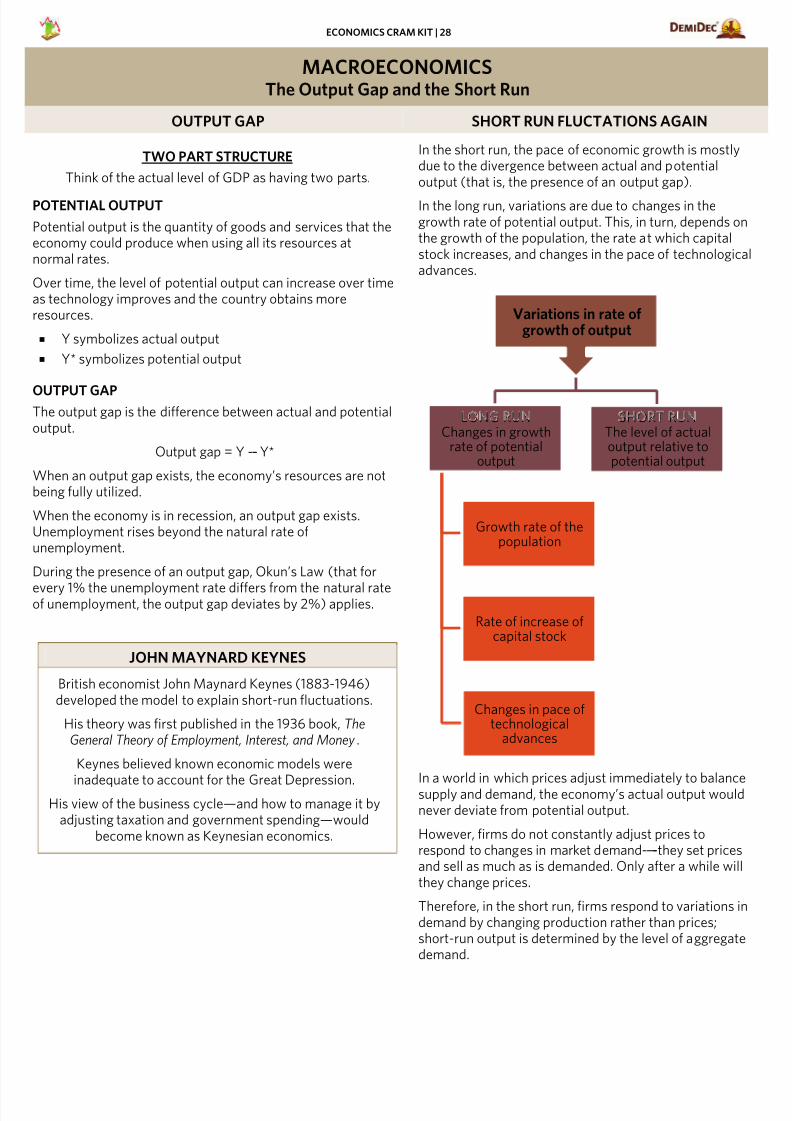
In the short run, the pace of economic growth is mostlydue to the divergence between actual and potentialoutput (that is, the presence of an output gap).
In the long run, variations are due to changes in thegrowth rate of potential output. This, in turn, depends othe growth of the population, the rate at which capitalstock increases, and changes in the pace of technologicadvances.
In a world in which prices adjust immediately to balancesupply and demand, the economy’s actual output wouldnever deviate from potential output.
However, firms do not constantly adjust prices torespond to changes in market demand-----they set pricesand sell as much as is demanded. Only after a while wilthey change prices.
Therefore, in the short run, firms respond to variations idemand by changing production rather than prices;short-run output is determined by the level of aggregatedemand.
Variations in rate ofgrowth of output
LONG RUNChanges in growth
rate of potentialoutput
Growth rate of thepopulation
Rate of increase ofcapital stock
Changes in pace oftechnological
advances
SHORT RUNThe level of actualoutput relative topotential output
7/18/2019 Economics Cram Kit
http://slidepdf.com/reader/full/economics-cram-kit-56d6a0b3cdef5 30/48
ECONOMICS CRAM KIT | 29
MACROECONOMICSAggregate Demand
INTRODUCING THE AD/AS MODEL AGGREGATE SHIFTS RESULT FROM…
WHAT IS AGGREGATE DEMAND?
Aggregate demand is the sum of all expenditures in aneconomy, or the country’s output for a period. Aggregate
demand describes how expenditures change in response tochanges in the aggregate price level.
C = consumer spending
I = investment
G = government spending and purchases
NX = net exports
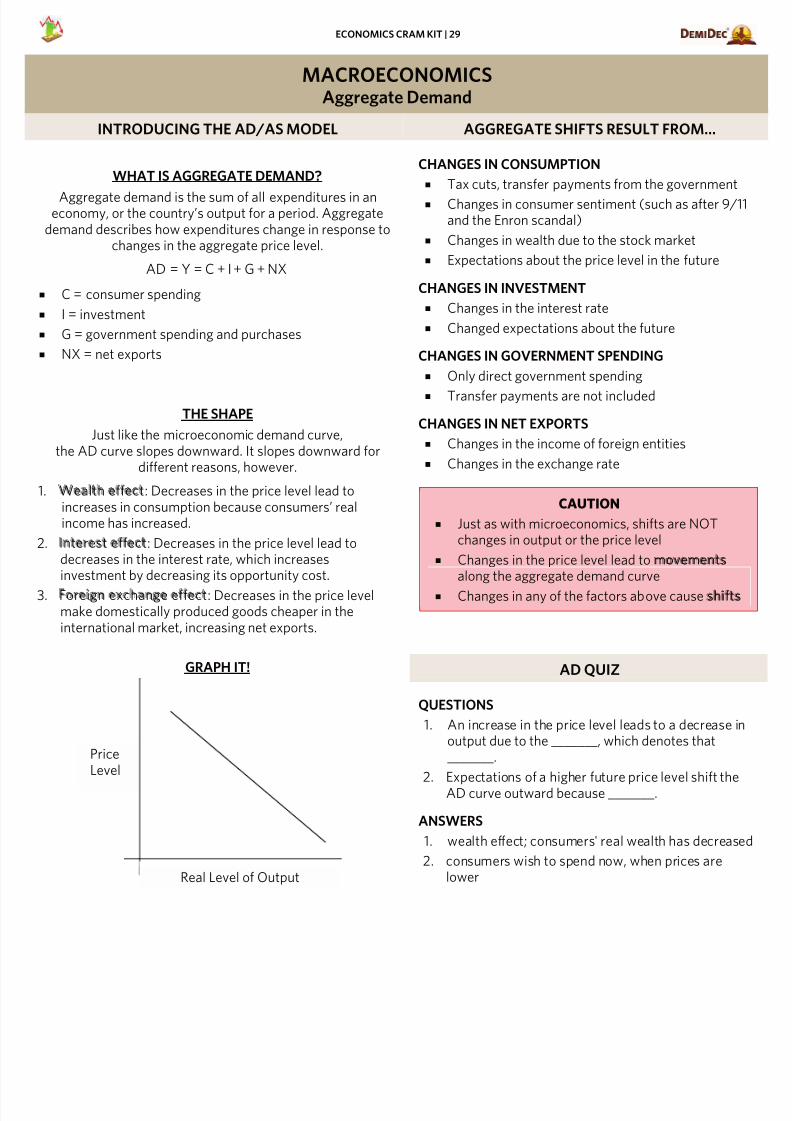
THE SHAPE
Just like the microeconomic demand curve,the AD curve slopes downward. It slopes downward for
different reasons, however.
1. Wealth effect: Decreases in the price level lead toincreases in consumption because consumers’ realincome has increased.
2. Interest effect: Decreases in the price level lead todecreases in the interest rate, which increasesinvestment by decreasing its opportunity cost.
3. Foreign exchange effect: Decreases in the price levelmake domestically produced goods cheaper in theinternational market, increasing net exports.
GRAPH IT!
CHANGES IN CONSUMPTION
Tax cuts, transfer payments from the government
Changes in consumer sentiment (such as after 9/1and the Enron scandal)
Changes in wealth due to the stock market
Expectations about the price level in the future
CHANGES IN INVESTMENT
Changes in the interest rate
Changed expectations about the future
CHANGES IN GOVERNMENT SPENDING
Only direct government spending
Transfer payments are not included
CHANGES IN NET EXPORTS
Changes in the income of foreign entities
Changes in the exchange rate
CAUTION
Just as with microeconomics, shifts are NOTchanges in output or the price level
Changes in the price level lead to movements along the aggregate demand curve
Changes in any of the factors above cause shifts
AD QUIZ
QUESTIONS
1. An increase in the price level leads to a decrease inoutput due to the _______, which denotes that_______.
2. Expectations of a higher future price level shift theAD curve outward because _______.
ANSWERS
1. wealth effect; consumers' real wealth has decrease
2. consumers wish to spend now, when prices arelower
NX+G+I+C=Y=AD
PriceLevel
Real Level of Output
7/18/2019 Economics Cram Kit
http://slidepdf.com/reader/full/economics-cram-kit-56d6a0b3cdef5 31/48
ECONOMICS CRAM KIT | 30
MACROECONOMICSAggregate Supply
LOTS OF SUPPLIES SHORT RUN AGGREGATE SUPPLY (SRAS)
WHAT IS AGGREGATE SUPPLY?
Aggregate supply is the potential supply of all the goods and
services an economy can produce at different price levels.Aggregate supply behaves very differently in the short term
and long term.
LONG RUN VS. SHORT RUN
Economists define the long run as the period when themarket is in equilibrium
All prices have adjusted to their equilibrium values andall markets clear
The short run is the period in which other effects, such asprice stickiness, can prevent long run equilibrium
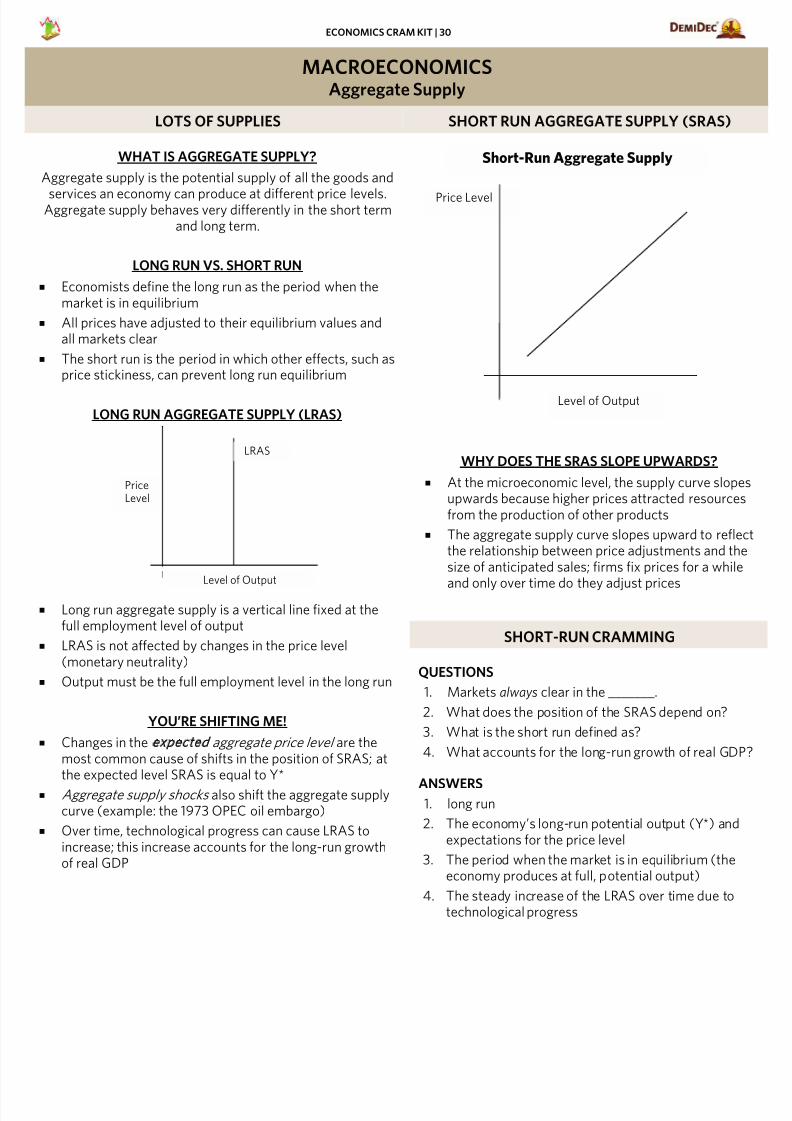
LONG RUN AGGREGATE SUPPLY (LRAS)
Long run aggregate supply is a vertical line fixed at thefull employment level of output
LRAS is not affected by changes in the price level(monetary neutrality)
Output must be the full employment level in the long run
YOU’RE SHIFTING ME!
Changes in the expected aggregate price level are themost common cause of shifts in the position of SRAS; atthe expected level SRAS is equal to Y*
Aggregate supply shocks also shift the aggregate supplycurve (example: the 1973 OPEC oil embargo)
Over time, technological progress can cause LRAS toincrease; this increase accounts for the long-run growthof real GDP
WHY DOES THE SRAS SLOPE UPWARDS?
At the microeconomic level, the supply curve slopeupwards because higher prices attracted resourcefrom the production of other products
The aggregate supply curve slopes upward to reflethe relationship between price adjustments and thsize of anticipated sales; firms fix prices for a while
and only over time do they adjust prices
SHORT-RUN CRAMMING
QUESTIONS
1. Markets always clear in the _______.
2. What does the position of the SRAS depend on?
3. What is the short run defined as?
4. What accounts for the long-run growth of real GD
ANSWERS1. long run
2. The economy’s long-run potential output (Y*) andexpectations for the price level
3. The period when the market is in equilibrium (theeconomy produces at full, potential output)
4. The steady increase of the LRAS over time due totechnological progress
PriceLevel
Level of Output
LRAS
Short-Run Aggregate Supply
Price Level
Level of Output
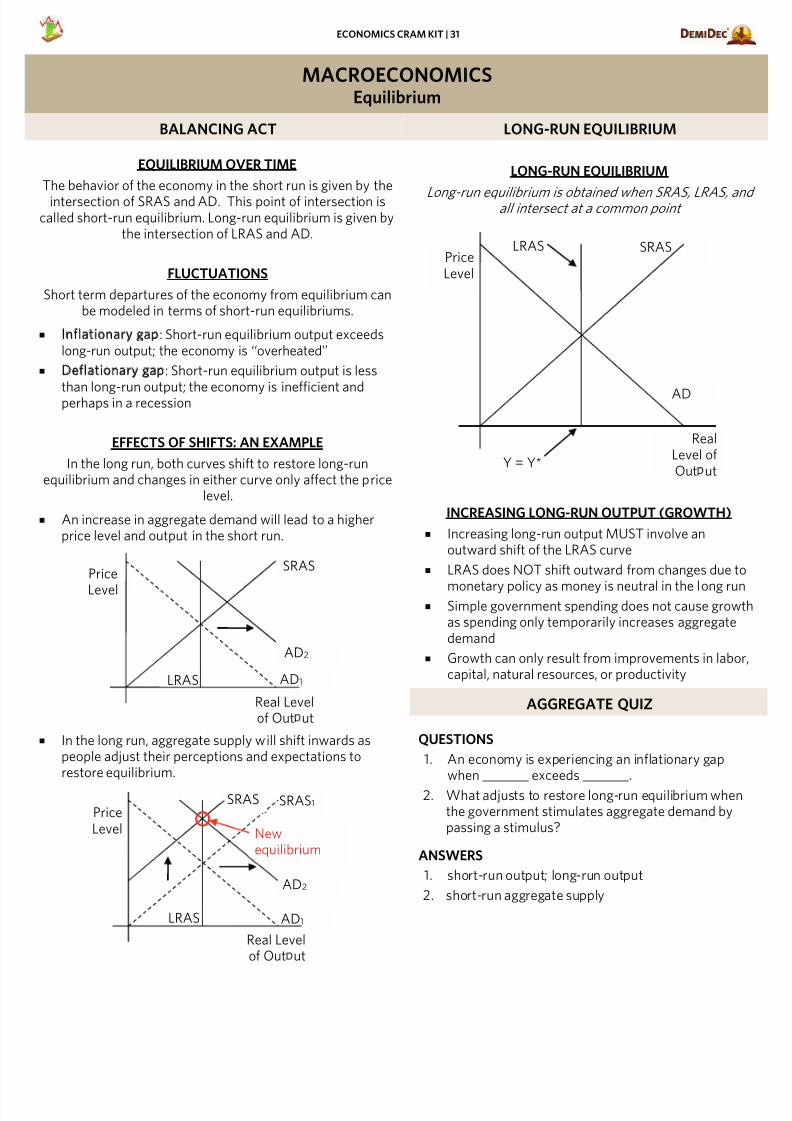
7/18/2019 Economics Cram Kit
http://slidepdf.com/reader/full/economics-cram-kit-56d6a0b3cdef5 32/48
ECONOMICS CRAM KIT | 31
MACROECONOMICSEquilibrium
BALANCING ACT LONG-RUN EQUILIBRIUM
EQUILIBRIUM OVER TIME
The behavior of the economy in the short run is given by the
intersection of SRAS and AD. This point of intersection iscalled short-run equilibrium. Long-run equilibrium is given by
the intersection of LRAS and AD.
FLUCTUATIONS
Short term departures of the economy from equilibrium canbe modeled in terms of short-run equilibriums.
Inflationary gap: Short-run equilibrium output exceedslong-run output; the economy is ‘‘overheated’’
Deflationary gap: Short-run equilibrium output is less
than long-run output; the economy is inefficient andperhaps in a recession
EFFECTS OF SHIFTS: AN EXAMPLE
In the long run, both curves shift to restore long-runequilibrium and changes in either curve only affect the price
level.
An increase in aggregate demand will lead to a higherprice level and output in the short run.
In the long run, aggregate supply will shift inwards aspeople adjust their perceptions and expectations torestore equilibrium.
LONG-RUN EQUILIBRIUM
Long-run equilibrium is obtained when SRAS, LRAS, aall intersect at a common point
INCREASING LONG-RUN OUTPUT (GROWTH)
Increasing long-run output MUST involve anoutward shift of the LRAS curve
LRAS does NOT shift outward from changes due to
monetary policy as money is neutral in the long run Simple government spending does not cause grow
as spending only temporarily increases aggregatedemand
Growth can only result from improvements in labocapital, natural resources, or productivity
AGGREGATE QUIZ
QUESTIONS
1. An economy is experiencing an inflationary gapwhen _______ exceeds _______.
2. What adjusts to restore long-run equilibrium whenthe government stimulates aggregate demand bypassing a stimulus?
ANSWERS
1. short-run output; long-run output
2. short-run aggregate supply
Price Level
RealLevel ofOut ut
AD
SRASLRAS
Y = Y*
Price
Level
Real Levelof Out ut
AD1
SRAS
LRAS
AD2
PriceLevel
Real Levelof Out ut
AD1
SRAS1
LRAS
AD2
SRAS
Newequilibrium
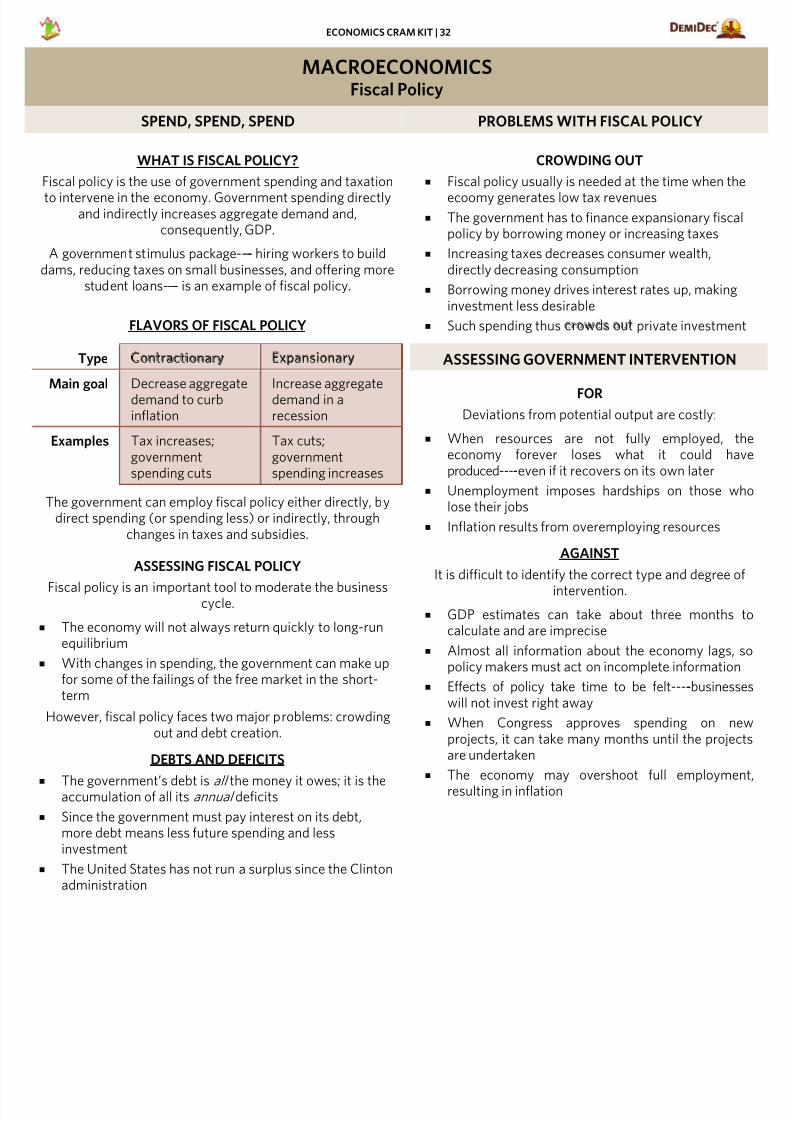
7/18/2019 Economics Cram Kit
http://slidepdf.com/reader/full/economics-cram-kit-56d6a0b3cdef5 33/48
ECONOMICS CRAM KIT | 32
MACROECONOMICSFiscal Policy
SPEND, SPEND, SPEND PROBLEMS WITH FISCAL POLICY
WHAT IS FISCAL POLICY?
Fiscal policy is the use of government spending and taxation
to intervene in the economy. Government spending directlyand indirectly increases aggregate demand and,
consequently, GDP.
A government stimulus package----- hiring workers to builddams, reducing taxes on small businesses, and offering more
student loans----- is an example of fiscal policy.
FLAVORS OF FISCAL POLICY
Type Contractionary Expansionary
Main goal Decrease aggregatedemand to curbinflation
Increase aggregatedemand in arecession
Examples Tax increases;governmentspending cuts
Tax cuts;governmentspending increases
The government can employ fiscal policy either directly, bydirect spending (or spending less) or indirectly, through
changes in taxes and subsidies.
ASSESSING FISCAL POLICY
Fiscal policy is an important tool to moderate the businesscycle.
The economy will not always return quickly to long-runequilibrium
With changes in spending, the government can make upfor some of the failings of the free market in the short-term
However, fiscal policy faces two major problems: crowdingout and debt creation.
DEBTS AND DEFICITS
The government’s debt is all the money it owes; it is theaccumulation of all its annual deficits
Since the government must pay interest on its debt,more debt means less future spending and lessinvestment
The United States has not run a surplus since the Clintonadministration
CROWDING OUT
Fiscal policy usually is needed at the time when the
ecoomy generates low tax revenues
The government has to finance expansionary fiscapolicy by borrowing money or increasing taxes
Increasing taxes decreases consumer wealth,directly decreasing consumption
Borrowing money drives interest rates up, makinginvestment less desirable
Such spending thus crowds out private investmen
ASSESSING GOVERNMENT INTERVENTION
FORDeviations from potential output are costly:
When resources are not fully employed, teconomy forever loses what it could haproduced-----even if it recovers on its own later
Unemployment imposes hardships on those wlose their jobs
Inflation results from overemploying resources
AGAINST
It is difficult to identify the correct type and degree o
intervention.
GDP estimates can take about three months calculate and are imprecise
Almost all information about the economy lags, policy makers must act on incomplete information
Effects of policy take time to be felt-----businesswill not invest right away
When Congress approves spending on neprojects, it can take many months until the projecare undertaken
The economy may overshoot full employme
resulting in inflation
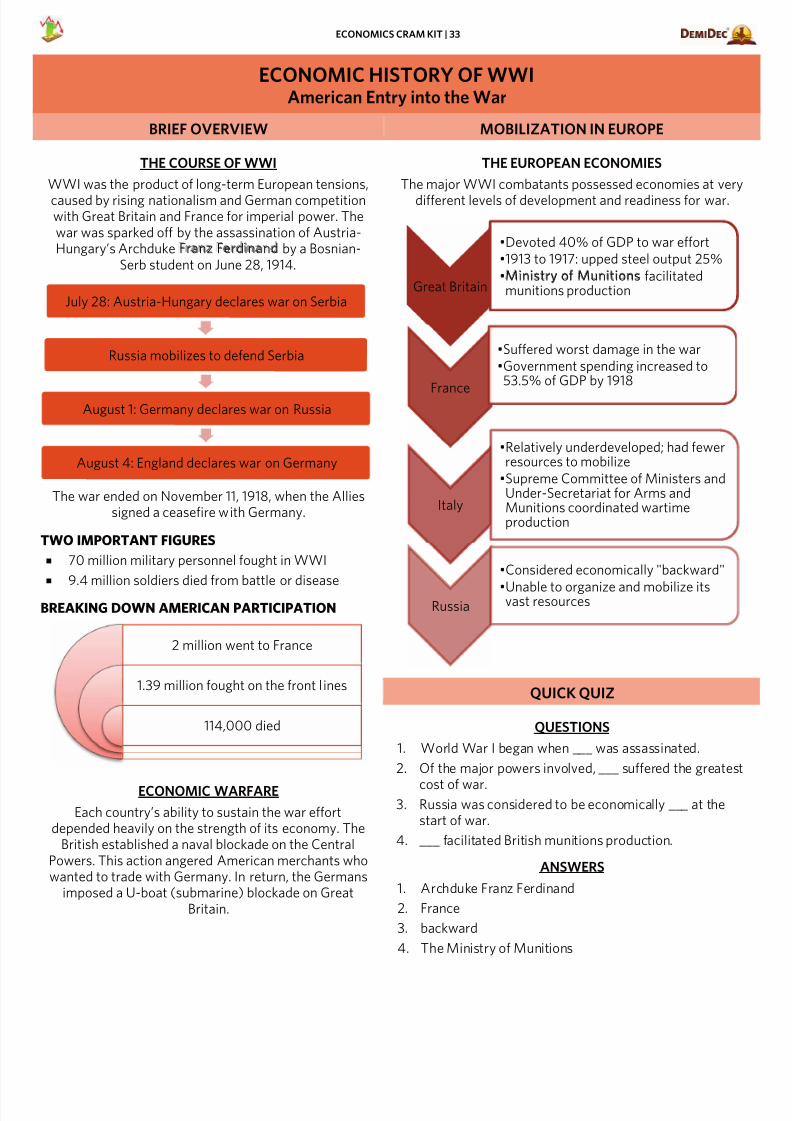
7/18/2019 Economics Cram Kit
http://slidepdf.com/reader/full/economics-cram-kit-56d6a0b3cdef5 34/48
ECONOMICS CRAM KIT | 33
ECONOMIC HISTORY OF WWIAmerican Entry into the War
BRIEF OVERVIEW MOBILIZATION IN EUROPE
THE COURSE OF WWI
WWI was the product of long-term European tensions,
caused by rising nationalism and German competitionwith Great Britain and France for imperial power. Thewar was sparked off by the assassination of Austria-Hungary’s Archduke Franz Ferdinand by a Bosnian-
Serb student on June 28, 1914.
The war ended on November 11, 1918, when the Alliessigned a ceasefire with Germany.
TWO IMPORTANT FIGURES
70 million military personnel fought in WWI
9.4 million soldiers died from battle or disease
BREAKING DOWN AMERICAN PARTICIPATION
ECONOMIC WARFARE
Each country’s ability to sustain the war effortdepended heavily on the strength of its economy. The
British established a naval blockade on the CentralPowers. This action angered American merchants whowanted to trade with Germany. In return, the Germans
imposed a U-boat (submarine) blockade on GreatBritain.
THE EUROPEAN ECONOMIES
The major WWI combatants possessed economies at very
different levels of development and readiness for war.
QUICK QUIZ
QUESTIONS
1. World War I began when ___ was assassinated.
2. Of the major powers involved, ___ suffered the greatest
cost of war.3. Russia was considered to be economically ___ at the
start of war.
4. ___ facilitated British munitions production.
ANSWERS
1. Archduke Franz Ferdinand
2. France
3. backward
4. The Ministry of Munitions
July 28: Austria-Hungary declares war on Serbia
Russia mobilizes to defend Serbia
August 1: Germany declares war on Russia
August 4: England declares war on Germany
2 million went to France
1.39 million fought on the front lines
114,000 died
Great Britain
•Devoted 40% of GDP to war effort•1913 to 1917: upped steel output 25%
•Ministry of Munitions facilitatedmunitions production
France
•Suffered worst damage in the war•Government spending increased to53.5% of GDP by 1918
Italy
•Relatively underdeveloped; had fewerresources to mobilize
•Supreme Committee of Ministers andUnder-Secretariat for Arms andMunitions coordinated wartimeproduction
Russia
•Considered economically "backward"
•Unable to organize and mobilize itsvast resources
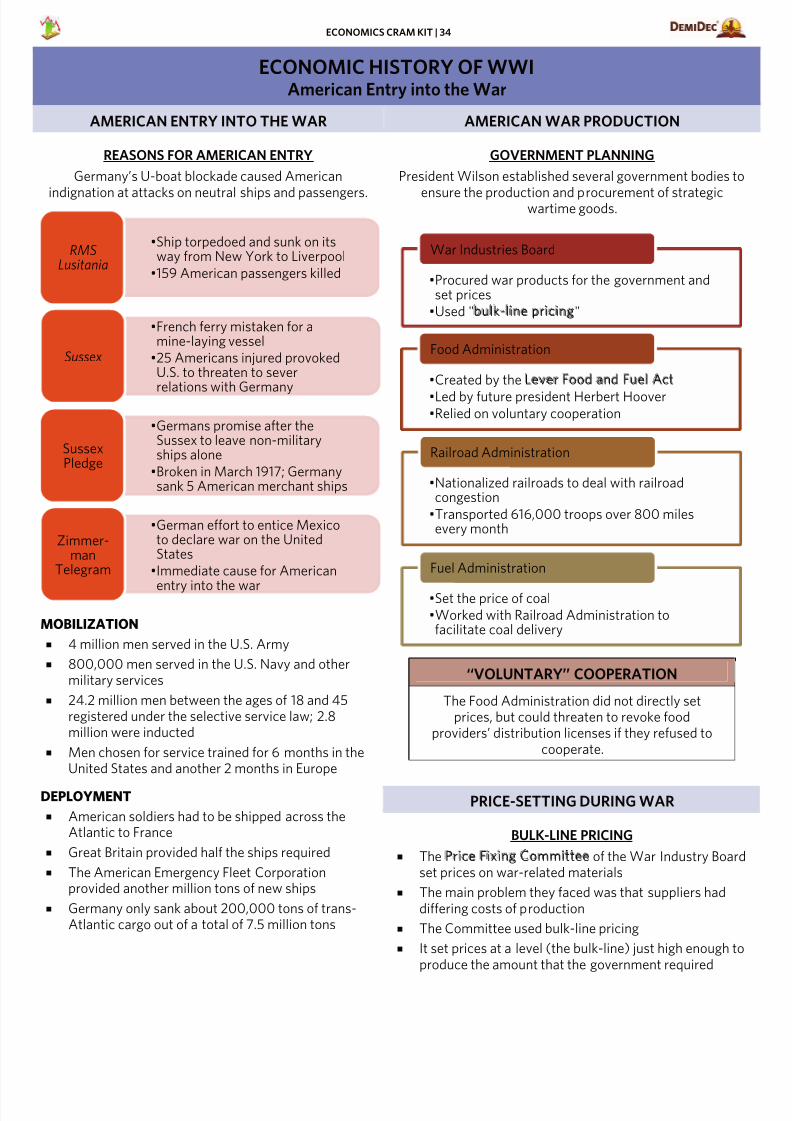
7/18/2019 Economics Cram Kit
http://slidepdf.com/reader/full/economics-cram-kit-56d6a0b3cdef5 35/48
ECONOMICS CRAM KIT | 34
ECONOMIC HISTORY OF WWIAmerican Entry into the War
AMERICAN ENTRY INTO THE WAR AMERICAN WAR PRODUCTION
REASONS FOR AMERICAN ENTRY
Germany’s U-boat blockade caused American
indignation at attacks on neutral ships and passengers.
MOBILIZATION
4 million men served in the U.S. Army
800,000 men served in the U.S. Navy and othermilitary services
24.2 million men between the ages of 18 and 45registered under the selective service law; 2.8million were inducted
Men chosen for service trained for 6 months in theUnited States and another 2 months in Europe
DEPLOYMENT
American soldiers had to be shipped across theAtlantic to France
Great Britain provided half the ships required
The American Emergency Fleet Corporationprovided another million tons of new ships
Germany only sank about 200,000 tons of trans-Atlantic cargo out of a total of 7.5 million tons
GOVERNMENT PLANNING
President Wilson established several government bodies to
ensure the production and procurement of strategicwartime goods.
‘‘VOLUNTARY’’ COOPERATION
The Food Administration did not directly setprices, but could threaten to revoke food
providers’ distribution licenses if they refused tocooperate.
PRICE-SETTING DURING WAR
BULK-LINE PRICING
The Price Fixing Committee of the War Industry Boardset prices on war-related materials
The main problem they faced was that suppliers haddiffering costs of production
The Committee used bulk-line pricing
It set prices at a level (the bulk-line) just high enough toproduce the amount that the government required
•Ship torpedoed and sunk on itsway from New York to Liverpool
•159 American passengers killed
RMSLusitania
•French ferry mistaken for amine-laying vessel
•25 Americans injured provokedU.S. to threaten to sever
relations with Germany
Sussex
•Germans promise after theSussex to leave non-militaryships alone
•Broken in March 1917; Germanysank 5 American merchant ships
SussexPledge
•German effort to entice Mexicoto declare war on the UnitedStates
•Immediate cause for American
entry into the war
Zimmer-man
Telegram
•Procured war products for the government andset prices
•Used "bulk-line pricing"
War Industries Board
•Created by the Lever Food and Fuel Act
•Led by future president Herbert Hoover•Relied on voluntary cooperation
Food Administration
•Nationalized railroads to deal with railroadcongestion
•Transported 616,000 troops over 800 milesevery month
Railroad Administration
•Set the price of coal•Worked with Railroad Administration tofacilitate coal delivery
Fuel Administration
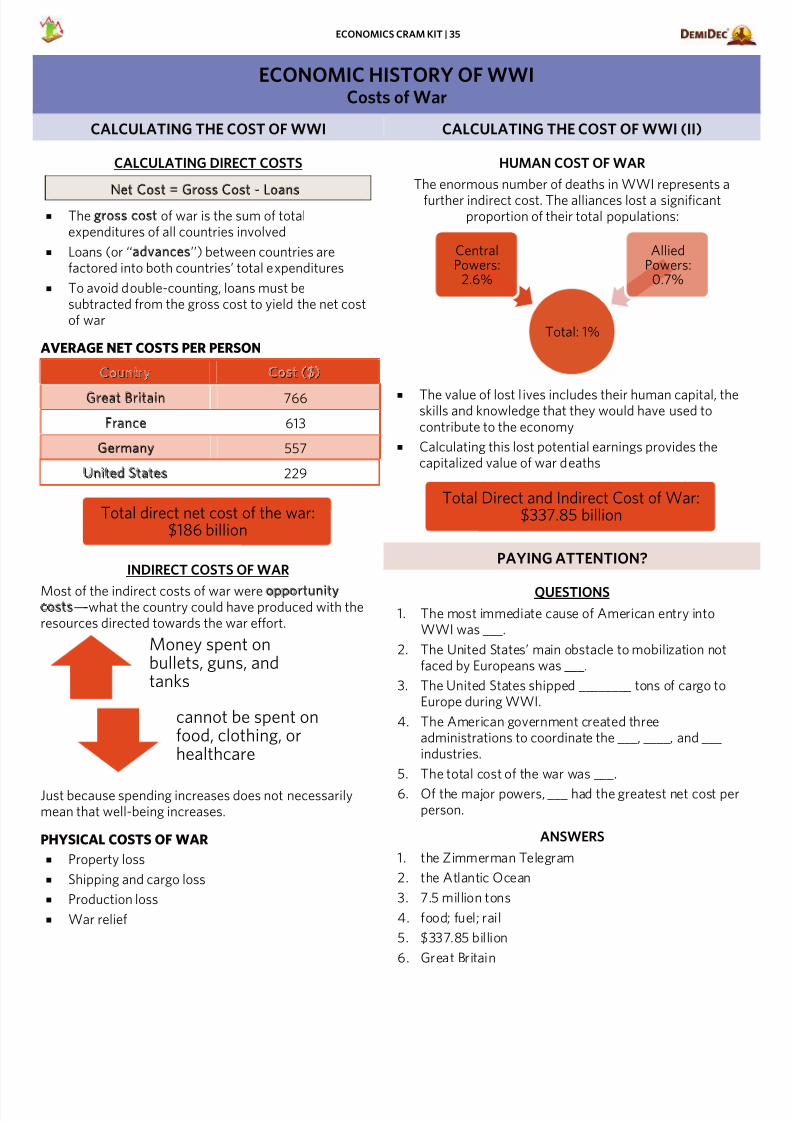
7/18/2019 Economics Cram Kit
http://slidepdf.com/reader/full/economics-cram-kit-56d6a0b3cdef5 36/48
ECONOMICS CRAM KIT | 35
ECONOMIC HISTORY OF WWICosts of War
CALCULATING THE COST OF WWI CALCULATING THE COST OF WWI (II)
CALCULATING DIRECT COSTS
Net Cost = Gross Cost - Loans The gross cost of war is the sum of total
expenditures of all countries involved
Loans (or ‘‘advances’’) between countries arefactored into both countries’ total expenditures
To avoid double-counting, loans must besubtracted from the gross cost to yield the net costof war
AVERAGE NET COSTS PER PERSON
Country Cost ($)
Great Britain 766
France 613
Germany 557
United States 229
INDIRECT COSTS OF WAR
Most of the indirect costs of war were opportunity costs-----what the country could have produced with theresources directed towards the war effort.
Just because spending increases does not necessarilymean that well-being increases.
PHYSICAL COSTS OF WAR
Property loss
Shipping and cargo loss
Production loss
War relief
HUMAN COST OF WAR
The enormous number of deaths in WWI represents a
further indirect cost. The alliances lost a significantproportion of their total populations:
The value of lost lives includes their human capital, theskills and knowledge that they would have used tocontribute to the economy
Calculating this lost potential earnings provides thecapitalized value of war deaths
PAYING ATTENTION?
QUESTIONS
1. The most immediate cause of American entry intoWWI was ___.
2. The United States’ main obstacle to mobilization notfaced by Europeans was ___.
3. The United States shipped ________ tons of cargo toEurope during WWI.
4. The American government created threeadministrations to coordinate the ___, ____, and ___industries.
5. The total cost of the war was ___.
6. Of the major powers, ___ had the greatest net cost perperson.
ANSWERS
1. the Zimmerman Telegram
2. the Atlantic Ocean
3. 7.5 million tons
4. food; fuel; rail
5. $337.85 billion
6. Great Britain
Total direct net cost of the war:$186 billion
Money spent onbullets, guns, andtanks
cannot be spent onfood, clothing, orhealthcare
Total: 1%
CentralPowers:
2.6%
AlliedPowers:
0.7%
Total Direct and Indirect Cost of War:$337.85 billion
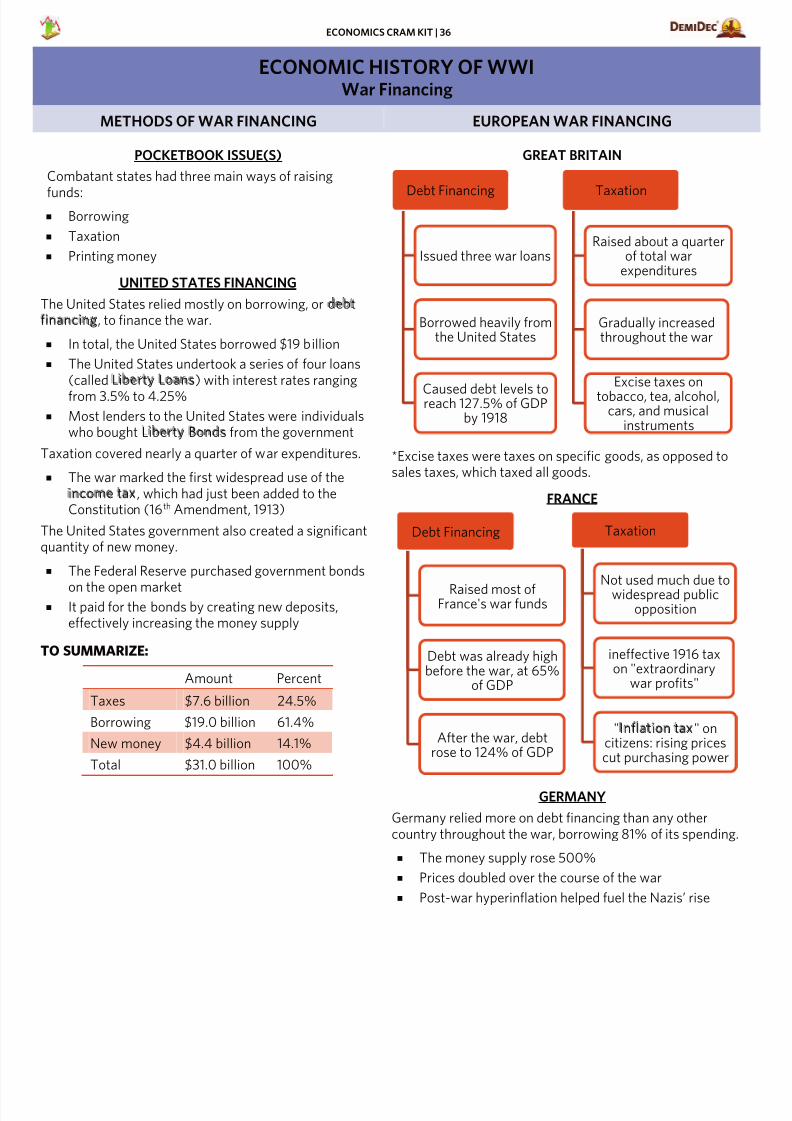
7/18/2019 Economics Cram Kit
http://slidepdf.com/reader/full/economics-cram-kit-56d6a0b3cdef5 37/48
ECONOMICS CRAM KIT | 36
ECONOMIC HISTORY OF WWIWar Financing
METHODS OF WAR FINANCING EUROPEAN WAR FINANCING
POCKETBOOK ISSUE(S)
Combatant states had three main ways of raising
funds: Borrowing
Taxation
Printing money
UNITED STATES FINANCING
The United States relied mostly on borrowing, or debt financing, to finance the war.
In total, the United States borrowed $19 billion
The United States undertook a series of four loans(called Liberty Loans) with interest rates ranging
from 3.5% to 4.25%
Most lenders to the United States were individualswho bought Liberty Bonds from the government
Taxation covered nearly a quarter of war expenditures.
The war marked the first widespread use of theincome tax, which had just been added to theConstitution (16th Amendment, 1913)
The United States government also created a significantquantity of new money.
The Federal Reserve purchased government bonds
on the open market It paid for the bonds by creating new deposits,
effectively increasing the money supply
TO SUMMARIZE:
Amount Percent
Taxes $7.6 billion 24.5%
Borrowing $19.0 billion 61.4%
New money $4.4 billion 14.1%
Total $31.0 billion 100%
GREAT BRITAIN
*Excise taxes were taxes on specific goods, as opposed tosales taxes, which taxed all goods.
FRANCE
GERMANY
Germany relied more on debt financing than any othercountry throughout the war, borrowing 81% of its spending.
The money supply rose 500%
Prices doubled over the course of the war
Post-war hyperinflation helped fuel the Nazis’ rise
Debt Financing
Issued three war loans
Borrowed heavily fromthe United States
Caused debt levels toreach 127.5% of GDPby 1918
Taxation
Raised about a quarterof total war
expenditures
Gradually increasedthroughout the war
Excise taxes on
tobacco, tea, alcohol,cars, and musical
instruments
Debt Financing
Raised most ofFrance's war funds
Debt was already highbefore the war, at 65%
of GDP
After the war, debtrose to 124% of GDP
Taxation
Not used much due towidespread public
opposition
ineffective 1916 taxon "extraordinary
war profits"
"Inflation tax" oncitizens: rising pricescut purchasing power
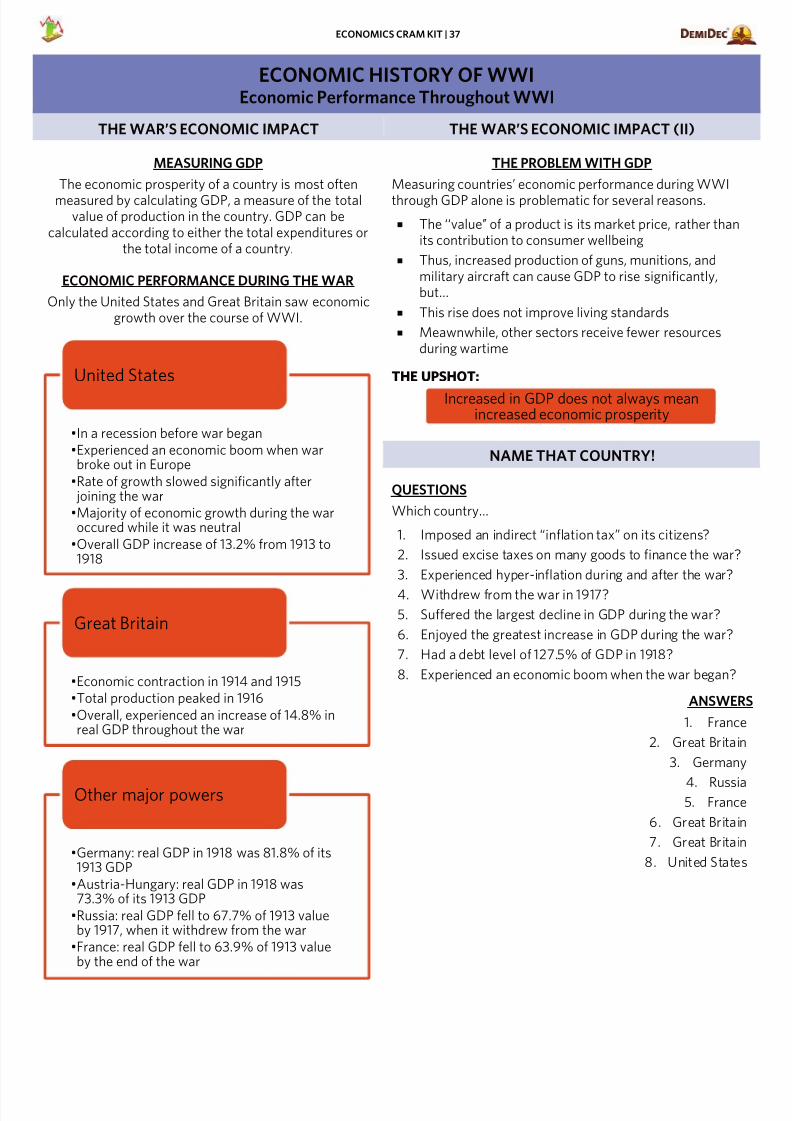
7/18/2019 Economics Cram Kit
http://slidepdf.com/reader/full/economics-cram-kit-56d6a0b3cdef5 38/48
ECONOMICS CRAM KIT | 37
ECONOMIC HISTORY OF WWIEconomic Performance Throughout WWI
THE WAR’S ECONOMIC IMPACT THE WAR’S ECONOMIC IMPACT (II)
MEASURING GDP
The economic prosperity of a country is most often
measured by calculating GDP, a measure of the totalvalue of production in the country. GDP can be
calculated according to either the total expenditures orthe total income of a country.
ECONOMIC PERFORMANCE DURING THE WAR
Only the United States and Great Britain saw economicgrowth over the course of WWI.
THE PROBLEM WITH GDP
Measuring countries’ economic performance during WWI
through GDP alone is problematic for several reasons.
The ‘‘value’’ of a product is its market price, rather thanits contribution to consumer wellbeing
Thus, increased production of guns, munitions, andmilitary aircraft can cause GDP to rise significantly,but…
This rise does not improve living standards
Meawnwhile, other sectors receive fewer resourcesduring wartime
THE UPSHOT:
NAME THAT COUNTRY!
QUESTIONS
Which country…
1. Imposed an indirect “inflation tax” on its citizens?
2. Issued excise taxes on many goods to finance the war?
3. Experienced hyper-inflation during and after the war?
4. Withdrew from the war in 1917?
5. Suffered the largest decline in GDP during the war?
6. Enjoyed the greatest increase in GDP during the war?
7. Had a debt level of 127.5% of GDP in 1918?
8. Experienced an economic boom when the war began?
ANSWER
1. Franc
2. Great Britai
3. German
4. Russi5. Franc
6. Great Britai
7. Great Britai
8. United State
•In a recession before war began•Experienced an economic boom when warbroke out in Europe
•Rate of growth slowed significantly after joining the war•Majority of economic growth during the waroccured while it was neutral
•Overall GDP increase of 13.2% from 1913 to1918
United States
•Economic contraction in 1914 and 1915•Total production peaked in 1916
•Overall, experienced an increase of 14.8% inreal GDP throughout the war
Great Britain
•Germany: real GDP in 1918 was 81.8% of its1913 GDP
•Austria-Hungary: real GDP in 1918 was73.3% of its 1913 GDP
•Russia: real GDP fell to 67.7% of 1913 valueby 1917, when it withdrew from the war
•France: real GDP fell to 63.9% of 1913 valueby the end of the war
Other major powers
Increased in GDP does not always meanincreased economic prosperity
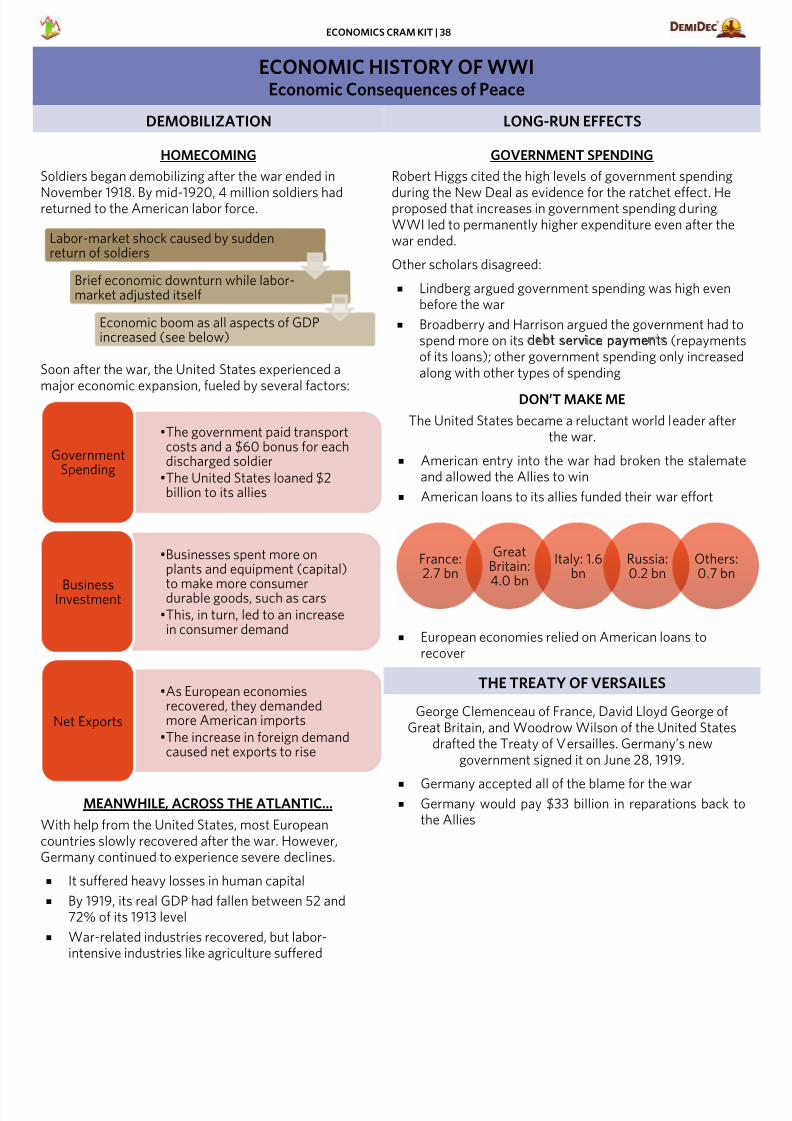
7/18/2019 Economics Cram Kit
http://slidepdf.com/reader/full/economics-cram-kit-56d6a0b3cdef5 39/48
ECONOMICS CRAM KIT | 38
ECONOMIC HISTORY OF WWIEconomic Consequences of Peace
DEMOBILIZATION LONG-RUN EFFECTS
HOMECOMING
Soldiers began demobilizing after the war ended in
November 1918. By mid-1920, 4 million soldiers hadreturned to the American labor force.
Soon after the war, the United States experienced a
major economic expansion, fueled by several factors:
MEANWHILE, ACROSS THE ATLANTIC…
With help from the United States, most Europeancountries slowly recovered after the war. However,Germany continued to experience severe declines.
It suffered heavy losses in human capital
By 1919, its real GDP had fallen between 52 and72% of its 1913 level
War-related industries recovered, but labor-intensive industries like agriculture suffered
GOVERNMENT SPENDING
Robert Higgs cited the high levels of government spending
during the New Deal as evidence for the ratchet effect. Heproposed that increases in government spending duringWWI led to permanently higher expenditure even after thewar ended.
Other scholars disagreed:
Lindberg argued government spending was high evenbefore the war
Broadberry and Harrison argued the government had tospend more on its debt service payments (repaymentof its loans); other government spending only increasedalong with other types of spending
DON’T MAKE ME
The United States became a reluctant world leader afterthe war.
American entry into the war had broken the stalematand allowed the Allies to win
American loans to its allies funded their war effort
European economies relied on American loans torecover
THE TREATY OF VERSAILES
George Clemenceau of France, David Lloyd George ofGreat Britain, and Woodrow Wilson of the United States
drafted the Treaty of Versailles. Germany’s newgovernment signed it on June 28, 1919.
Germany accepted all of the blame for the war Germany would pay $33 billion in reparations back to
the Allies
Labor-market shock caused by suddenreturn of soldiers
Brief economic downturn while labor-market adjusted itself
Economic boom as all aspects of GDPincreased (see below)
•The government paid transportcosts and a $60 bonus for eachdischarged soldier
•The United States loaned $2billion to its allies
GovernmentSpending
•Businesses spent more onplants and equipment (capital)
to make more consumerdurable goods, such as cars•This, in turn, led to an increasein consumer demand
BusinessInvestment
•As European economiesrecovered, they demandedmore American imports
•The increase in foreign demandcaused net exports to rise
Net Exports
France:2.7 bn
GreatBritain:4.0 bn
Italy: 1.6bn
Russia:0.2 bn
Others:0.7 bn
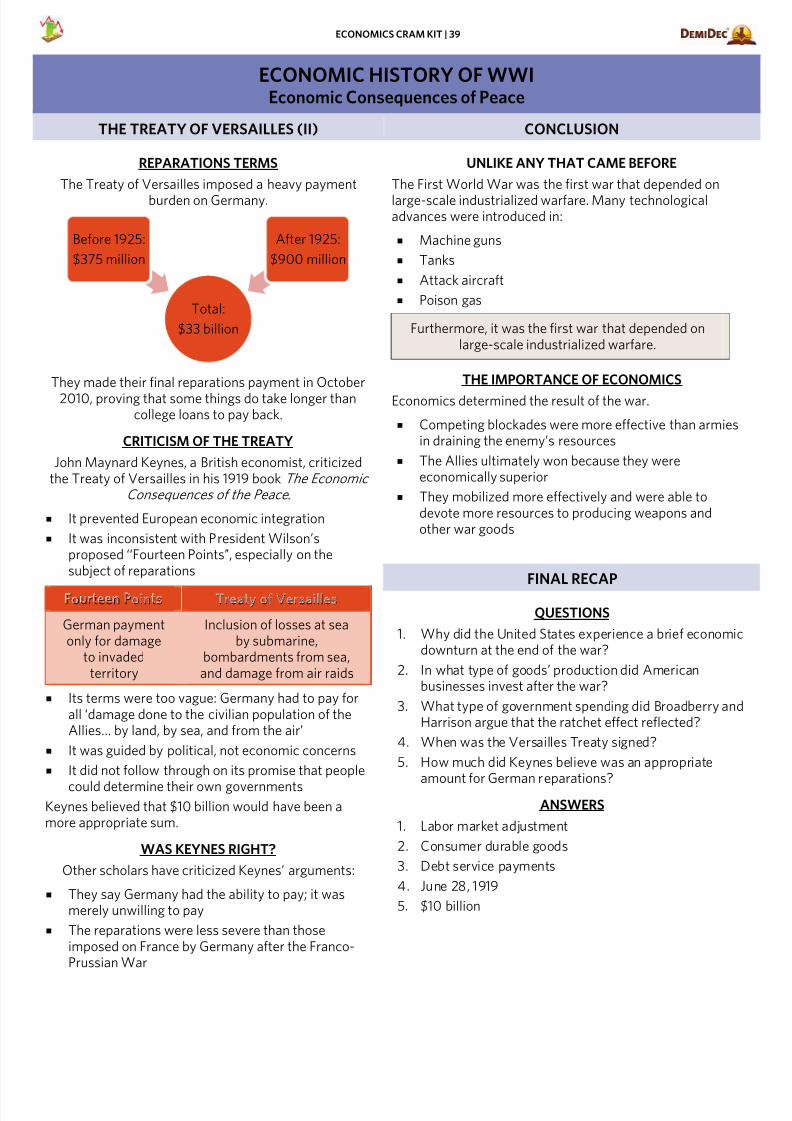
7/18/2019 Economics Cram Kit
http://slidepdf.com/reader/full/economics-cram-kit-56d6a0b3cdef5 40/48
ECONOMICS CRAM KIT | 39
ECONOMIC HISTORY OF WWIEconomic Consequences of Peace
THE TREATY OF VERSAILLES (II) CONCLUSION
REPARATIONS TERMS
The Treaty of Versailles imposed a heavy payment
burden on Germany.
They made their final reparations payment in October2010, proving that some things do take longer than
college loans to pay back.
CRITICISM OF THE TREATY
John Maynard Keynes, a British economist, criticizedthe Treaty of Versailles in his 1919 book The Economic
Consequences of the Peace .
It prevented European economic integration
It was inconsistent with President Wilson’sproposed ‘‘Fourteen Points’’, especially on thesubject of reparations
Fourteen Points Treaty of Versailles
German paymentonly for damage
to invadedterritory
Inclusion of losses at seaby submarine,
bombardments from sea,and damage from air raids
Its terms were too vague: Germany had to pay forall ‘damage done to the civilian population of theAllies… by land, by sea, and from the air’
It was guided by political, not economic concerns
It did not follow through on its promise that people
could determine their own governmentsKeynes believed that $10 billion would have been amore appropriate sum.
WAS KEYNES RIGHT?
Other scholars have criticized Keynes’ arguments:
They say Germany had the ability to pay; it wasmerely unwilling to pay
The reparations were less severe than thoseimposed on France by Germany after the Franco-Prussian War
UNLIKE ANY THAT CAME BEFORE
The First World War was the first war that depended on
large-scale industrialized warfare. Many technologicaladvances were introduced in:
Machine guns
Tanks
Attack aircraft
Poison gas
Furthermore, it was the first war that depended onlarge-scale industrialized warfare.
THE IMPORTANCE OF ECONOMICS
Economics determined the result of the war.
Competing blockades were more effective than armiesin draining the enemy’s resources
The Allies ultimately won because they wereeconomically superior
They mobilized more effectively and were able todevote more resources to producing weapons andother war goods
FINAL RECAP
QUESTIONS
1. Why did the United States experience a brief economicdownturn at the end of the war?
2. In what type of goods’ production did Americanbusinesses invest after the war?
3. What type of government spending did Broadberry andHarrison argue that the ratchet effect reflected?
4. When was the Versailles Treaty signed?
5. How much did Keynes believe was an appropriateamount for German reparations?
ANSWERS
1. Labor market adjustment
2. Consumer durable goods
3. Debt service payments
4. June 28, 1919
5. $10 billion
Total:
$33 billion
Before 1925:
$375 million
After 1925:
$900 million
7/18/2019 Economics Cram Kit
http://slidepdf.com/reader/full/economics-cram-kit-56d6a0b3cdef5 41/48
ECONOMICS CRAM KIT | 40
CRUNCH KITEconomics in Four Pages (Page 1)
BASICS OF ECONOMICS
Human wants are unlimited, but goods are scarce
There are no free lunches; you can never get something trulyfree (due to the cost of time, and other costs)
To get one thing, we must give up another Humans behave rationally in economics
Economic cost includes opportunity and accounting costs
Accounting cost: tangible cost
Opportunity cost: value of the next-best alternative
RATIONALITY
Marginal cost: cost of producing/consuming ‘‘one more’’
Marginal benefit: benefit of producing/consuming ‘‘onemore’’
Diminishing returns: marginal benefit decreases as quantityincreases
Rational agents will produce or consume a good untilmarginal cost = marginal benefit/revenue (MC = MR)
Rational consumers maximize their utility, or satisfaction;rational firms maximize their profits
POSITIVE VS. NORMATIVE
Positive: ‘‘What is’’ (taxes are 20%)
Normative: ‘‘What should be’’ (taxes should be lower)
MICRO VS. MACRO
Microeconomics: focuses on individual decision making;works its way up from individuals to markets to economies
Macroeconomics: focuses on the economy as a whole;
tracks economy wide variables; takes a top-down approachCOMPARATIVE ADVANTAGE
Comparative advantage: being able to produce a good at alower opportunity cost than anyone else
Absolute advantage: being able to produce a good moreefficiently than everyone else
An individual can have an absolute advantage in everything,but NOT a comparative advantage in everything
Agents should specialize in what they have a comparativeadvantage for, and then everyone will benefit from trade
THE PRODUCTION POSSIBILITIES FRONTIER (PPF)
A PPF shows all of the ways an economy can produce goods Each axis features a good; the PPF measure trade-offs
between these two goods
All points outside the curve are impossible to produce at
Points inside the curve are possible but inefficient and do notuse all available resources
PARETO EFFICIENCY
Something is Pareto efficient if it is impossible to improvewell-being without hurting someone else
Pareto efficiency provides no way to judge the superiority ofone distribution versus another
THREE FUNDAMENTAL QUESTIONS OF ECONOMICS
How much should be produced?
Who should produce the good?
Who should receive the good?
PERFECTLY COMPETITIVE MARKETS
The good being sold must be highly standardized
Large number of buyers and sellers
Everyone is well informed about the market price
No barriers to entry exist; firms enter and exit easily
Everyone is a price taker
The market price represents the opportunity cost of agood’s production
DEMAND
Law of demand: the quantity demanded of a gooddecreases when the price increases and vice versa
Demand: this relationship between prices and quantitiesfor a particular market
Quantity demanded: amount demanded at each price
Demand can shift due to consumer income, substitutesand complements, the number of consumers, andconsumer preferences and expectations
SUPPLY
Law of supply: the quantity supplied of a good increaseswhen the price increases and vice versa
Supply: relationship between prices and quantities for aparticular market
Quantity supplied: the amount supplied at a given price Supply can shift due to changes in factor costs,
technology, expectations of future prices, number ofproducers, and government regulations
Changes in demand or supply cause a shift of the curve;quantity changes at every price
Change in quantity demanded or supplied causes amovement along the curve
MICROECONOMIC EQUILIBRIUM
Equilibrium: intersection of supply and demand
Consumer surplus: difference between how muchconsumers are willing to pay and the market price
Producer surplus: difference between the price at whichfirms are willing to sell and the market price
Market equilibrium maximizes consumer and producersurplus
ELASTICITY
Percent change in quantity over percentage change inprice
Price elastic demand: goods with close substitutes,luxuries
Price inelastic demand: necessities
Price elastic supply: long run
7/18/2019 Economics Cram Kit
http://slidepdf.com/reader/full/economics-cram-kit-56d6a0b3cdef5 42/48
ECONOMICS CRAM KIT | 41
CRUNCH KITEconomics in Four Pages (Page 2)
ELASTICITY
Price inelastic supply: short run, scarce good
Factors affecting demand elasticity: substitutes, necessities,scope of market, time horizon
Factors affecting supply elasticity: scarcity of inputs,presence of barriers to entry, time horizon
Elasticity= 0: perfectly inelastic
0 < Elasticity < 1: price inelastic
Elasticity = 1: unit elastic
Elasticity > 1: elastic
Elasticity =∞: perfectly inelastic
ECONOMIC AND ACCOUNTING PROFIT
Total revenue: amount a firm receives from selling its goods
Total cost: costs of a firm supplying its goods
Accounting cost: actual monetary cost Accounting profit: straight monetary profit earned
Economic cost: both monetary (accounting) cost and theopportunity cost of the resources used
Economic profit: monetary profit minus opportunity cost;always equal to zero in the long run
FIRMS AND COSTS
Fixed costs: costs that a firm must pay regardless of howmuch it produces (rent, utilities); only fixed in short run
Variable costs: costs that change with the amount produced
Average cost: the sum of fixed costs and total variable costs,divided by the total number of units produced
After a certain point, marginal costs stop decreasing andbegin increasing-----this is called diminishing returns to scale
In the long run, all costs are variable
PRICE CONTROLS
Price ceilings set a maximum; price floors set a minimum
Deadweight loss: lost efficiency due the market not being inequilibrium
Binding price controls ALWAYS have deadweight losses
Price controls transfer surplus from consumers to producersor vice versa
Taxes distort the market, transferring surplus from the
market to the government at the expense of efficiency
The more inelastic party always bears more of the tax
Revenue equals price times quantity
MARKET FAILURES
A market failure is when competitive markets fail to producesocially desirable outcomes
Two types discussed here are externalities and public goods
EXTERNALITIES
Externalities are costs or benefits that affect a third partyuninvolved in the activity or transaction in question
EXTERNALITIES
Individuals do not factor externalities into their decisions
Negative externalities harm third parties; the tendency isto overproduce them
Positive externalities benefit third parties; there are notenough of them
Coase Theorem: private parties can resolve theinefficiencies created by externalities as long as propertyrights are clearly defined and all parties can negotiatewith each other
PUBLIC GOODS
A rival good, when it is consumed, can no longer beconsumed by anyone else
People have limited access to excludable goods
Private goods are both rival and excludable
Public goods are neither
Collective goods are non-rival and excludable
Common resources are non-excludable and rival
The tragedy of the commons occurs when peopleoveruse a resource because no one owns it
MARKET POWER
A firm with a downward sloping demand curve hasmarket power; they can choose their price
The combinations of price and quantity available tochoose from are determined by the market demand
MONOPOLY
Market with only one firm Produce less than what consumers demand, and sell it at
higher than the market price
Arise due to the presence of barriers to entry
Price discrimination: charging different customersdifferent prices; a monopoly can capture more of theconsumer surplus for the firm
OLIGOPOLY
Market with only a few firms
Collusion: when firms cooperate to artificially raisemarket prices by restricting supply
Cartel: group of firms that collude
Cartels often break up due to an incentive to cheat
MONOPOLISTIC COMPETITION
Firms compete through product differentiation, not pricecompetition
Few barriers to entry exist
INSTITUTIONS, ORGANIZATIONS, AND GOVERNMENT
Institutions: formal or informal rules that guide humaninteractions
Organizations are like institutions but more formal
Governments can tax their citizens and use force
7/18/2019 Economics Cram Kit
http://slidepdf.com/reader/full/economics-cram-kit-56d6a0b3cdef5 43/48
ECONOMICS CRAM KIT | 42
CRUNCH KIT
Economics in Four Pages (Page 3)
INSTITUTIONS, ORGANIZATIONS, AND GOVERNMENT
Pork barrel politics: elected officials tend to steer money totheir constituents by introducing projects
Logrolling: vote trading among elected officials
Rent seeking: socially unproductive activities that simplydirect economic benefits
GROSS DOMESTIC PRODUCT (GDP)
Market value of all final goods and services produced withina country in a given period of time; four components
GDP = Y = C + I + G + NX
Consumption: consumer spending on final goods
Investment: value of all money spent on capital ortechnology
Government expenditures
Net exports: exports minus imports
Business cycle: fluctuations in GDP over recessions andexpansions
Average labor productivity: GDP divided by the total numberof workers employed
MACROECONOMIC MODELLING
Circular flow model: households own factors of production;firms rent factors and produce goods, which households buy;two markets: goods market and factor market
Aggregate demand (AD): quantity of goods demanded by aneconomy at different price levels, slopes downward
Aggregate supply (AS): potential supply of goods andservices in an economy at different price levels
Short run aggregate supply (SRAS): slopes upwards
Long run aggregate supply (LRAS); fixed at full employmentoutput; vertical line; independent of price level
Short run equilibrium: intersection of SRAS and AD; long runequilibrium is at the intersection of all three curves
UNEMPLOYMENT
Labor force: all individuals 16 or over, not in prison or armedforces, and actively looking for work or has a job
Employment rate: percentage of labor force with a job
Participation rate: percentage of population in the labor force
Structural unemployment: unemployment due to large shifts
in economy; mismatch between skills demanded and skillssupplied
Cyclical unemployment: caused by the business cycle
Frictional unemployment: natural unemployment due totime-lag between jobs
Unemployment rate calculated every month by the BLS
Natural rate of unemployment: never 100%; structural +frictional unemployment
Okun’s Law: for every 1% increase in unemployment, GDPdrops by 2%
MONEY
A medium of exchange, unit of account, and store ofvalue
Commodity money: money with intrinsic value
Fiat money: intrinsically worthless; declared valuable bygovernment
Inflation: rise in price level; decrease in purchasing poweof money; measured by the CPI and GDP deflator
Liquidity: how easily an asset can be converted intocurrency
THE FINANCIAL SYSTEM
Savings: income that is not spent
Investment: purchase of new capital equipment
Bond: a certificate of indebtedness
Stock: ownership of a portion of a company
Net capital outflow: domestic purchase of foreign capitaminus foreign purchase of domestic assets
FISCAL POLICY
Government spending or taxes to influence AD
Contractionary: increasing taxes, decreasing spending
Expansionary: decreasing taxes, increasing spending
MONETARY POLICY
Open market operations: buying or selling securities,done by the FOMC
Reserve ratio: fraction of deposits banks must keep inreserve; adjusted by Board of Governors
Discount rate: interest rate the Fed charges to memberbanks; adjusted by Board of Governors
Contractionary: selling securities, increasing reserveratio, increasing discount rate
Expansionary: buying securities, decreasing reserve ratiodecreasing discount rate
Quantity theory of money: MV = PY
ECONOMIC HISTORY OF WWI
Great Britain and Germany carried out economic warfarethrough blockades
The Allies used central government planning tocoordinate war output
Great Britain’s wealth allowed it to devote a highproportion of its economy to war output
France suffered the greatest economic losses as mostbattles were fought on its territory
Italy was economically underdeveloped and Russiaeconomically backward at the start of the war
Russia withdrew from WWI in 1917
7/18/2019 Economics Cram Kit
http://slidepdf.com/reader/full/economics-cram-kit-56d6a0b3cdef5 44/48
ECONOMICS CRAM KIT | 43
CRUNCH KIT
Economics in Four Pages (Page 4)
AMERICAN ENTRY INTO THE WAR
Germany’s unrestricted submarine warfare and theZimmerman telegram prompted American entry into the war
The United States’ contribution tipped the balance to the
Allies
4.8 million Americans served in the military during WWI
The Emergency Fleet Corporation and the British providedtroop transport vessels to ship American soldiers to France
Losses to German U-boat attacks after 1917 were small
AMERICAN WARTIME PRODUCTION
The War Industries Board obtained war products for thegovernment
The Board’s Price Fixing Committee used bulk-line pricing toset prices for such products
Bulk-line pricing involved setting prices at a level that would
obtain the corresponding output desired The Food Administration licensed food producers and
controlled food production through voluntary cooperation
The Railroad Administration was formed after the railroadswere nationalized
It organized troop transports and worked with the FuelAdministration to ensure coal deliveries
COST OF THE WAR
WWI’s direct net cost was $186 billion
Great Britain had the highest per capita spending of $766 perperson
The United States spent $229 per capita
WWI had additional indirect costs, including the opportunitycost of resources diverted to wartime output
The combatant states also suffered from the destruction ofhuman and physical capital
Peoples’ deaths represented a loss of their future potentialearnings
WWI’s total cost was $337.85 billion
WAR FINANCING IN THE UNITED STATES
The United States spent $31 billion on the war effort
The United States borrowed $19 billion through public LibertyBonds to fund the war effort
Income taxes were raised during the war and contributed$7.6 billion of the war budget
The Federal Reserve also issued $4.4 billion of money
WAR FINANCING IN GREAT BRITAIN
Great Britain borrowed heavily during WWI, domesticallyand from the United States
Its debt level was 127.5% of GDP
Taxes contributed 24.5% of war expenditure
Great Britain increased its excise, property, and income taxesover the course of the war
WAR FINANCING IN FRANCE
France took on long-term debt from 1915 onwards, andhad debt amounting to 124% of GDP by 1916
Public opposition limited the government’s ability to
raise taxes
However, inflation caused by a growth in the moneysupply imposed an implicit tax by reducing consumers’purchasing power
WAR FINANCING IN GERMANY
Germany used debt financing to supply 80% of its warexpenditures
Its money supply increased fivefold during WWI andprices doubled
Germany’s heavy debt contributed to hyperinflationafter the war
ECONOMIC PERFORMANCE DURING THE WAR European demand for American goods pulled the
American economy out of recession
American entry into the war slowed its growth, but itsGDP still grew by 13.2% overall
Great Britain’s economy grew after 1916, with an overal14.8% increase in GDP
Germany’s GDP dropped by 19.2%, and Austria-Hungary’s by 26.7%
France’s GDP declined by 34.1% and Russia’s GDP in1917 was 67.7% of its 1913 level
ECONOMIC IMPACT OF THE WAR
Demobilization caused a sudden expansion in the laborforce and a brief recession in the United States
However, American government spending remainedhigh, fuelling economic growth
The United States loaned money to its allies
Europe relied on American goods during itsreconstruction
American businesses invested in plants and equipmentto produce consumer durable goods
Some scholars believe that WWI permanentlyincreased government spending
Others argue that spending only increased to repaydebt, or that it had already increased before the war
ECONOMIC CONSEQUENCES OF THE PEACE
The United States’ allies owed it a combined $9.2 billion
Germany had to pay $33 billion in reparations under theTreaty of Versailles
It would have to pay $375 million per year until 1925and $900 million in yearly interest payments after 1925
British economist Keynes believed this unduly harshand unrealistic
German resentment of the Treaty helped fuel the Nazisrise to power and hence the Second World War.
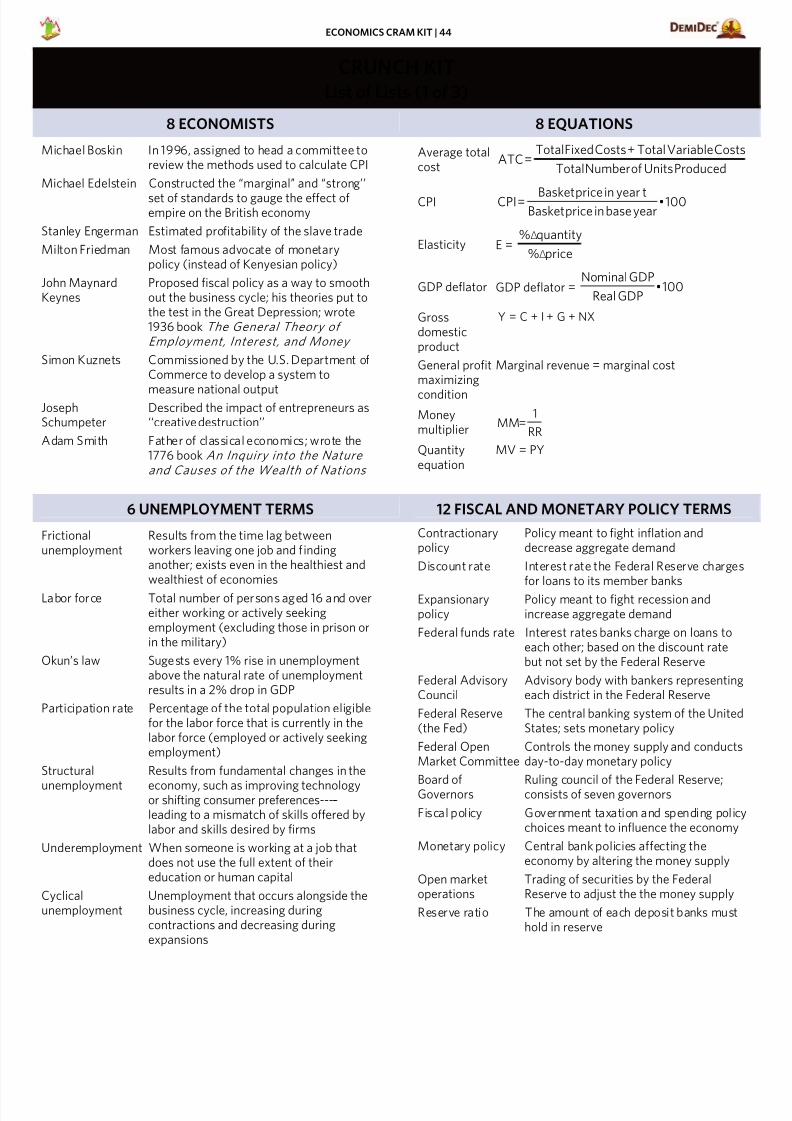
7/18/2019 Economics Cram Kit
http://slidepdf.com/reader/full/economics-cram-kit-56d6a0b3cdef5 45/48
ECONOMICS CRAM KIT | 44
CRUNCH KIT
List of Lists (1 of 3)
8 ECONOMISTS 8 EQUATIONS
Michael Boskin In 1996, assigned to head a committee toreview the methods used to calculate CPI
Michael Edelstein Constructed the ‘‘marginal’’ and ‘‘strong’’
set of standards to gauge the effect ofempire on the British economy
Stanley Engerman Estimated profitability of the slave trade
Milton Friedman Most famous advocate of monetarypolicy (instead of Kenyesian policy)
John MaynardKeynes
Proposed fiscal policy as a way to smoothout the business cycle; his theories put tothe test in the Great Depression; wrote1936 book The General Theory of
Employment, Interest, and Money
Simon Kuznets Commissioned by the U.S. Department ofCommerce to develop a system to
measure national outputJosephSchumpeter
Described the impact of entrepreneurs as‘‘creative destruction’’
Adam Smith Father of classical economics; wrote the1776 book An Inquiry into the Nature
and Causes of the Wealth of Nations
Average totalcost
CPI
Elasticity E =
GDP deflator GDP deflator =
Grossdomesticproduct
General profitmaximizing
condition
Marginal revenue = marginal cost
Moneymultiplier
Quantityequation
MV = PY
6 UNEMPLOYMENT TERMS 12 FISCAL AND MONETARY POLICY TERMS
Frictionalunemployment
Results from the time lag betweenworkers leaving one job and findinganother; exists even in the healthiest andwealthiest of economies
Labor force Total number of persons aged 16 and overeither working or actively seekingemployment (excluding those in prison orin the military)
Okun’s law Sugests every 1% rise in unemploymentabove the natural rate of unemploymentresults in a 2% drop in GDP
Participation rate Percentage of the total population eligiblefor the labor force that is currently in thelabor force (employed or actively seekingemployment)
Structural
unemployment
Results from fundamental changes in the
economy, such as improving technologyor shifting consumer preferences-----leading to a mismatch of skills offered bylabor and skills desired by firms
Underemployment When someone is working at a job thatdoes not use the full extent of theireducation or human capital
Cyclicalunemployment
Unemployment that occurs alongside thebusiness cycle, increasing duringcontractions and decreasing duringexpansions
Contractionarypolicy
Policy meant to fight inflation anddecrease aggregate demand
Discount rate Interest rate the Federal Reserve chargesfor loans to its member banks
Expansionarypolicy
Policy meant to fight recession andincrease aggregate demand
Federal funds rate Interest rates banks charge on loans toeach other; based on the discount ratebut not set by the Federal Reserve
Federal AdvisoryCouncil
Advisory body with bankers representingeach district in the Federal Reserve
Federal Reserve(the Fed)
The central banking system of the UnitedStates; sets monetary policy
Federal OpenMarket Committee
Controls the money supply and conductsday-to-day monetary policy
Board ofGovernors Ruling council of the Federal Reserve;consists of seven governors
Fiscal policy Government taxation and spending policchoices meant to influence the economy
Monetary policy Central bank policies affecting theeconomy by altering the money supply
Open marketoperations
Trading of securities by the FederalReserve to adjust the the money supply
Reserve ratio The amount of each deposit banks musthold in reserve
ProducedUnitsofNumberTotal
CostVariableTotal+CostsFixedTotal=ATC
100•yearbaseinpriceBasket
tyearinpriceBasket=CPI
price%
quantity%
100•GDPalRe
GDPalminNo
NX+G+I+C=Y
RR
1=MM
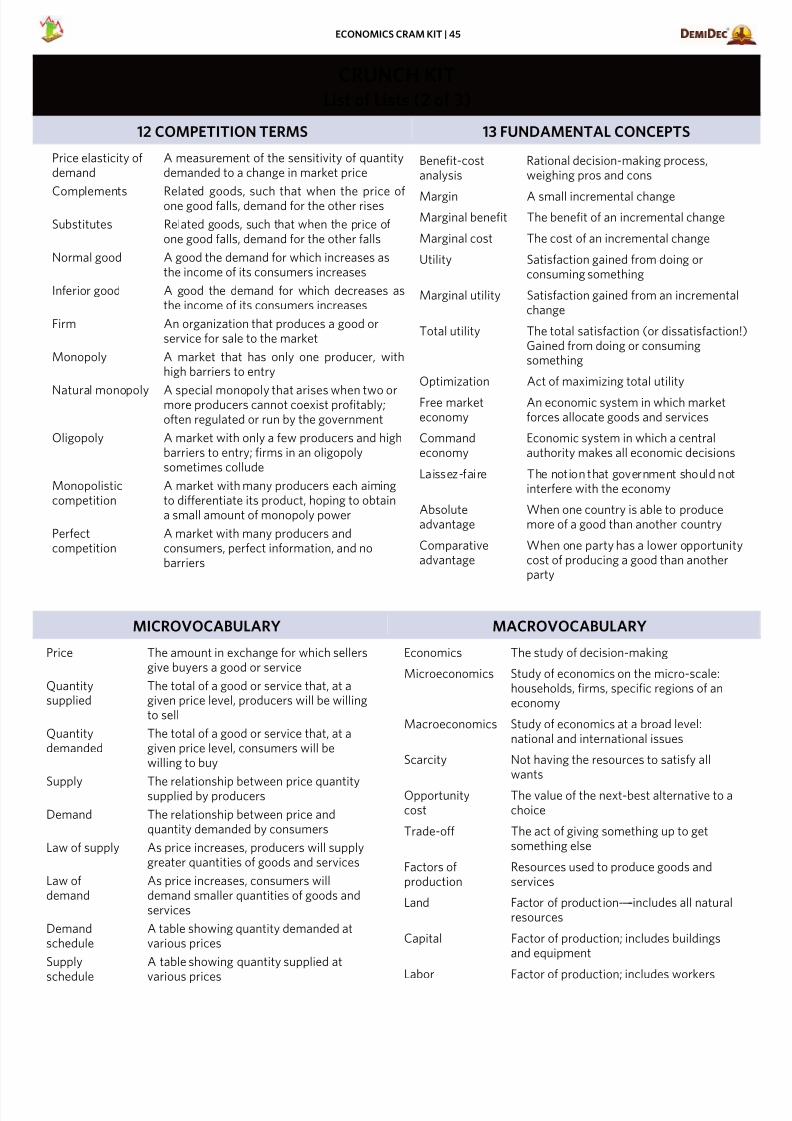
7/18/2019 Economics Cram Kit
http://slidepdf.com/reader/full/economics-cram-kit-56d6a0b3cdef5 46/48
ECONOMICS CRAM KIT | 45
CRUNCH KIT
List of Lists (2 of 3)
12 COMPETITION TERMS 13 FUNDAMENTAL CONCEPTS
Price elasticity ofdemand
A measurement of the sensitivity of quantitydemanded to a change in market price
Complements Related goods, such that when the price ofone good falls, demand for the other rises
Substitutes Related goods, such that when the price ofone good falls, demand for the other falls
Normal good A good the demand for which increases asthe income of its consumers increases
Inferior good A good the demand for which decreases asthe income of its consumers increases
Firm An organization that produces a good orservice for sale to the market
Monopoly A market that has only one producer, withhigh barriers to entry
Natural monopoly A special monopoly that arises when two ormore producers cannot coexist profitably;often regulated or run by the government
Oligopoly A market with only a few producers and highbarriers to entry; firms in an oligopolysometimes collude
Monopolisticcompetition
A market with many producers each aimingto differentiate its product, hoping to obtaina small amount of monopoly power
Perfectcompetition
A market with many producers andconsumers, perfect information, and nobarriers
Benefit-costanalysis
Rational decision-making process,weighing pros and cons
Margin A small incremental change
Marginal benefit The benefit of an incremental change
Marginal cost The cost of an incremental change
Utility Satisfaction gained from doing orconsuming something
Marginal utility Satisfaction gained from an incrementalchange
Total utility The total satisfaction (or dissatisfaction!Gained from doing or consumingsomething
Optimization Act of maximizing total utility
Free marketeconomy
An economic system in which marketforces allocate goods and services
Commandeconomy
Economic system in which a centralauthority makes all economic decisions
Laissez-faire The notion that government should notinterfere with the economy
Absoluteadvantage
When one country is able to producemore of a good than another country
Comparativeadvantage
When one party has a lower opportunitycost of producing a good than anotherparty
MICROVOCABULARY MACROVOCABULARY
Price The amount in exchange for which sellersgive buyers a good or service
Quantitysupplied
The total of a good or service that, at agiven price level, producers will be willingto sell
Quantitydemanded
The total of a good or service that, at agiven price level, consumers will bewilling to buy
Supply The relationship between price quantitysupplied by producers
Demand The relationship between price andquantity demanded by consumers
Law of supply As price increases, producers will supplygreater quantities of goods and services
Law ofdemand
As price increases, consumers willdemand smaller quantities of goods andservices
Demandschedule
A table showing quantity demanded atvarious prices
Supply
schedule
A table showing quantity supplied at
various prices
Economics The study of decision-making
Microeconomics Study of economics on the micro-scale:households, firms, specific regions of aneconomy
Macroeconomics Study of economics at a broad level:national and international issues
Scarcity Not having the resources to satisfy allwants
Opportunitycost
The value of the next-best alternative to achoice
Trade-off The act of giving something up to getsomething else
Factors ofproduction
Resources used to produce goods andservices
Land Factor of production-----includes all naturalresources
Capital Factor of production; includes buildingsand equipment
Labor Factor of production; includes workers
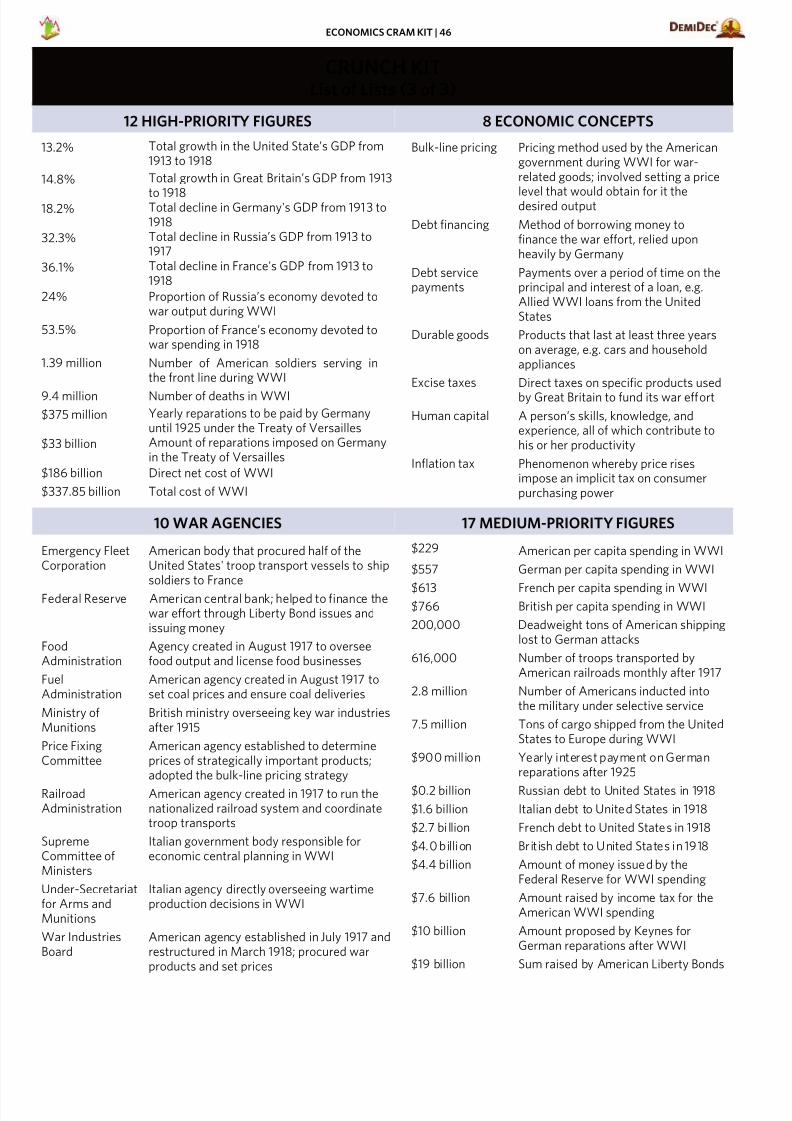
7/18/2019 Economics Cram Kit
http://slidepdf.com/reader/full/economics-cram-kit-56d6a0b3cdef5 47/48
ECONOMICS CRAM KIT | 46
CRUNCH KITList of Lists (3 of 3)
12 HIGH-PRIORITY FIGURES 8 ECONOMIC CONCEPTS
13.2% Total growth in the United State’s GDP from1913 to 1918
14.8% Total growth in Great Britain’s GDP from 1913
to 191818.2% Total decline in Germany's GDP from 1913 to
1918
32.3% Total decline in Russia’s GDP from 1913 to1917
36.1% Total decline in France's GDP from 1913 to1918
24% Proportion of Russia’s economy devoted towar output during WWI
53.5% Proportion of France’s economy devoted towar spending in 1918
1.39 million Number of American soldiers serving inthe front line during WWI
9.4 million Number of deaths in WWI
$375 million Yearly reparations to be paid by Germanyuntil 1925 under the Treaty of Versailles
$33 billion Amount of reparations imposed on Germanyin the Treaty of Versailles
$186 billion Direct net cost of WWI
$337.85 billion Total cost of WWI
Bulk-line pricing Pricing method used by the Americangovernment during WWI for war-related goods; involved setting a price
level that would obtain for it thedesired output
Debt financing Method of borrowing money tofinance the war effort, relied uponheavily by Germany
Debt servicepayments
Payments over a period of time on theprincipal and interest of a loan, e.g.Allied WWI loans from the UnitedStates
Durable goods Products that last at least three yearson average, e.g. cars and householdappliances
Excise taxes Direct taxes on specific products used
by Great Britain to fund its war effort
Human capital A person’s skills, knowledge, andexperience, all of which contribute tohis or her productivity
Inflation tax Phenomenon whereby price risesimpose an implicit tax on consumerpurchasing power
10 WAR AGENCIES 17 MEDIUM-PRIORITY FIGURES
Emergency FleetCorporation
American body that procured half of theUnited States' troop transport vessels to shipsoldiers to France
Federal Reserve American central bank; helped to finance thewar effort through Liberty Bond issues andissuing money
FoodAdministration
Agency created in August 1917 to overseefood output and license food businesses
FuelAdministration
American agency created in August 1917 toset coal prices and ensure coal deliveries
Ministry ofMunitions
British ministry overseeing key war industriesafter 1915
Price FixingCommittee
American agency established to determineprices of strategically important products;adopted the bulk-line pricing strategy
RailroadAdministration
American agency created in 1917 to run thenationalized railroad system and coordinatetroop transports
SupremeCommittee ofMinisters
Italian government body responsible foreconomic central planning in WWI
Under-Secretariatfor Arms andMunitions
Italian agency directly overseeing wartimeproduction decisions in WWI
War IndustriesBoard
American agency established in July 1917 andrestructured in March 1918; procured warproducts and set prices
$229 American per capita spending in WWI
$557 German per capita spending in WWI
$613 French per capita spending in WWI$766 British per capita spending in WWI
200,000 Deadweight tons of American shippinglost to German attacks
616,000 Number of troops transported byAmerican railroads monthly after 1917
2.8 million Number of Americans inducted intothe military under selective service
7.5 million Tons of cargo shipped from the UnitedStates to Europe during WWI
$900 million Yearly interest payment on Germanreparations after 1925
$0.2 billion Russian debt to United States in 1918
$1.6 billion Italian debt to United States in 1918
$2.7 bi llion French debt to United States in 1918
$4.0 billion British debt to United States in 1918
$4.4 billion Amount of money issued by theFederal Reserve for WWI spending
$7.6 billion Amount raised by income tax for theAmerican WWI spending
$10 billion Amount proposed by Keynes forGerman reparations after WWI
$19 billion Sum raised by American Liberty Bonds

7/18/2019 Economics Cram Kit
http://slidepdf.com/reader/full/economics-cram-kit-56d6a0b3cdef5 48/48
ECONOMICS CRAM KIT | 47
FINAL TIPS AND ABOUT THE AUTHOR
FINAL TIPS ABOUT THE AUTHORS
Don’t just learn definitions by rote; rephrasethem in ways that make sense to you
Repeat after me: shifts in demand are notthe same as shifts in quantiy demanded
Come prepared to draw out supply anddemand diagrams
Draw out supply and demand diagrams
The marginal utility of eliminating wronganswers before answering is very high
When short on time, memorize key factsfrom Section IV by leader, reform, and year
Make a study playlist that gets you pumpedfor brain workouts
Catherine Tran is a studentof philosophy and religiousstudies at the University ofTexas. When she isn’t
studying, her next-bestalternatives include writingabout morality, attendinglive concerts, and shoppingfor second-hand clothing.The previous sentencemakes her appear a lot hipper than she actually is. JacquelineKhor (unpictured) was the 2010 Global Round champion in theWorld Scholar’s Cup, and lives in an ambiguous land calledSingapore where top-scoring students often wear green.
ABOUT THE EDITORSROBB DOOLING DANIEL BERDICHEVSKY SOPHY LEE
Robb Dooling first became aDemiDec factor of production in2009-----namely, a beta tester. Inaddition to beta testers, DemiDecfactors of production includewriters, editors, and frequently-misplaced laptops.
Daniel Berdichevsky is conducting alifelong experiment to determinewhether the law of diminishingmarginal utility applies to theconsumption of tea. He is picturedhere speaking at a school in Indiaafter drinking four cups.
Sophy Lee rides her bike the wayshe pursues everything in life, fromAcademic Decathlon, Harvard, anDemiDec, to her recent appearancon Million Second Quiz : withdetermination, focus, and a diet ofberries, yogurt, and self-appraisal