Embed Size (px)
Citation preview
Economics and integration ofhydro-electric plant in developing
countriesT.E. Norris, B.Sc. C.Eng., F.I.MechE.. F.I.E.E. and M.D. Dwek. B.Sc.(Eng.).
F.I.E.E.
Indexing terms: Natural resources, Engineering administration and management
Abstract: Rather than provide a general guide to the economic evaluation of hydro-electric schemes indeveloping countries, and to the assessment of their effect when integrated into the electricity systems, onescheme, the Lupohlo-Ezulwini scheme first studied in 1978 and recently completed in Swaziland, is discussed indetail. Many of the aspects discussed will be common to other schemes. The paper is based on a presentation toan IEE Colloquium on Hydro-Power in May 1984.
1 Energy resources of Swaziland
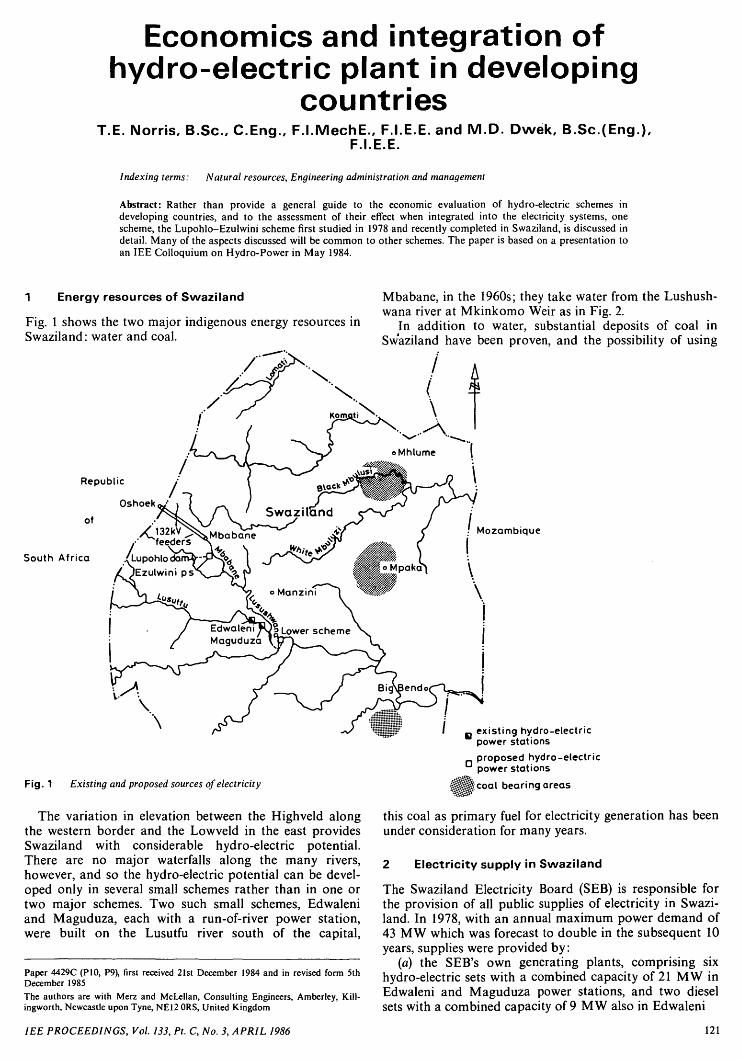
Fig. 1 shows the two major indigenous energy resources inSwaziland: water and coal.
Mbabane, in the 1960s; they take water from the Lushush-wana river at Mkinkomo Weir as in Fig. 2.
In addition to water, substantial deposits of coal inSwaziland have been proven, and the possibility of using
Republic
Oshoek
of
South Africa
Mozambique
\
\
Fig. 1 Existing and proposed sources of electricity
The variation in elevation between the Highveld alongthe western border and the Lowveld in the east providesSwaziland with considerable hydro-electric potential.There are no major waterfalls along the many rivers,however, and so the hydro-electric potential can be devel-oped only in several small schemes rather than in one ortwo major schemes. Two such small schemes, Edwaleniand Maguduza, each with a run-of-river power station,were built on the Lusutfu river south of the capital,
Paper 4429C (P10, P9), first received 21st December 1984 and in revised form 5thDecember 1985
The authors are with Merz and McLellan, Consulting Engineers, Amberley, Kill-ingworth, Newcastle upon Tyne, NE12 ORS, United Kingdom
existing hydro-electricpower stations
proposed hydro-electricpower stations
coal bearing areas
this coal as primary fuel for electricity generation has beenunder consideration for many years.
2 Electricity supply in Swaziland
The Swaziland Electricity Board (SEB) is responsible forthe provision of all public supplies of electricity in Swazi-land. In 1978, with an annual maximum power demand of43 MW which was forecast to double in the subsequent 10years, supplies were provided by:
(a) the SEB's own generating plants, comprising sixhydro-electric sets with a combined capacity of 21 MW inEdwaleni and Maguduza power stations, and two dieselsets with a combined capacity of 9 MW also in Edwaleni
IEE PROCEEDINGS, Vol. 133, Pt. C, No. 3, APRIL 1986 121
(b) import from the system of South Africa's ElectricitySupply Commission (Escom) through a single 132 kV
Lusutfu river
GS9Lupohlo reservoir A
Ferreira canal Little Usutu canal[Main canalJHeadpond
)EdwaleniMaguduza canal
QMaguduza
Lusushwana river
GS15
IEzulwiniUmwubu river
Mbabane riverGS2
AMkinkomo weir
Lusushwana river
v Diversion weir
AHeadpond
©Lower scheme
Lusutfu river
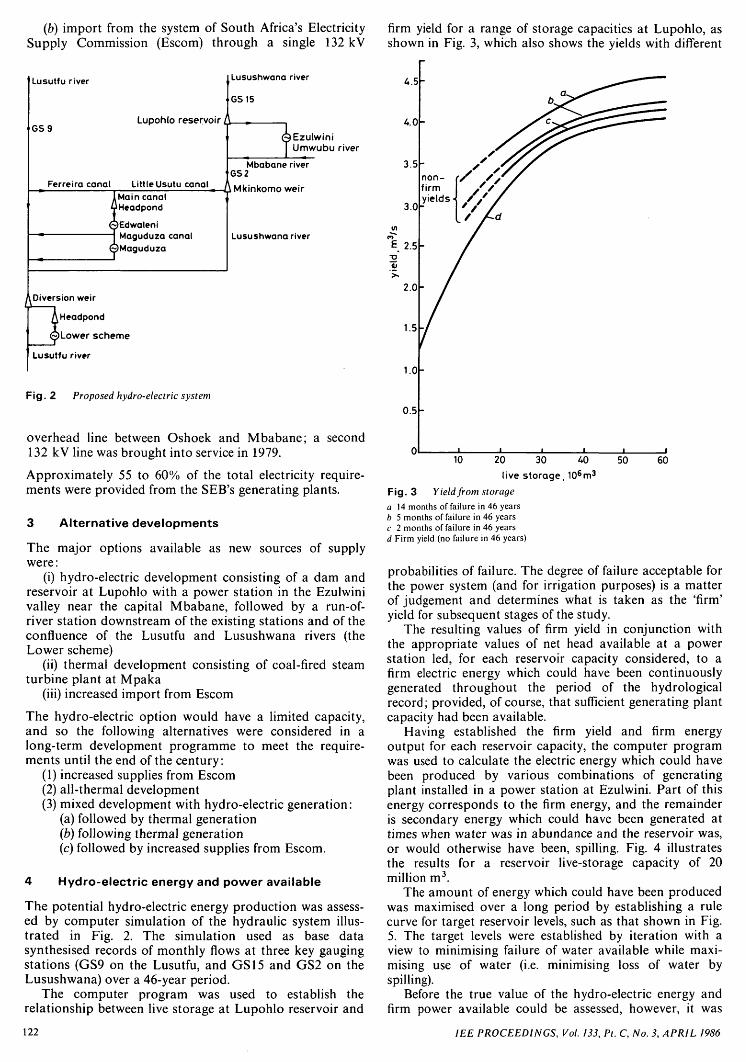
Fig. 2 Proposed hydro-electric system
overhead line between Oshoek and Mbabane; a second132 kV line was brought into service in 1979.
Approximately 55 to 60% of the total electricity require-ments were provided from the SEB's generating plants.
3 Alternative developments
The major options available as new sources of supplywere:
(i) hydro-electric development consisting of a dam andreservoir at Lupohlo with a power station in the Ezulwinivalley near the capital Mbabane, followed by a run-of-river station downstream of the existing stations and of theconfluence of the Lusutfu and Lusushwana rivers (theLower scheme)
(ii) thermal development consisting of coal-fired steamturbine plant at Mpaka
(iii) increased import from Escom
The hydro-electric option would have a limited capacity,and so the following alternatives were considered in along-term development programme to meet the require-ments until the end of the century:
(1) increased supplies from Escom(2) all-thermal development(3) mixed development with hydro-electric generation:
(a) followed by thermal generation(b) following thermal generation(c) followed by increased supplies from Escom.
4 Hydro-electric energy and power available
The potential hydro-electric energy production was assess-ed by computer simulation of the hydraulic system illus-trated in Fig. 2. The simulation used as base datasynthesised records of monthly flows at three key gaugingstations (GS9 on the Lusutfu, and GS15 and GS2 on theLusushwana) over a 46-year period.
The computer program was used to establish therelationship between live storage at Lupohlo reservoir and
122
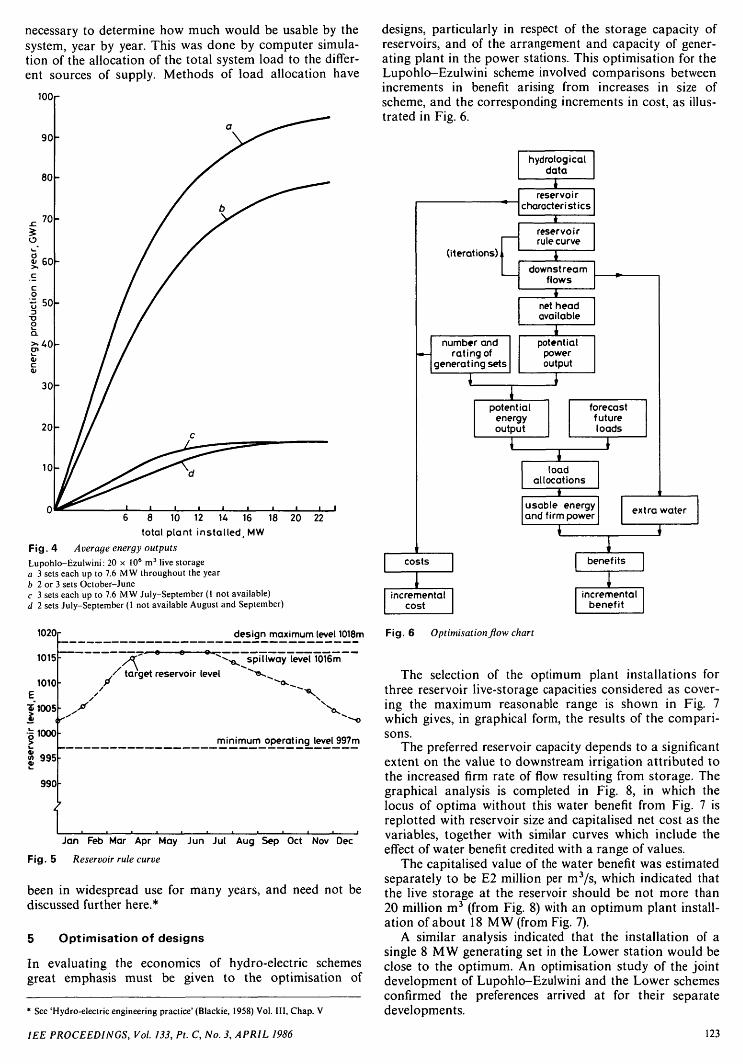
firm yield for a range of storage capacities at Lupohlo, asshown in Fig. 3, which also shows the yields with different
4.5
3.5
3.0
E 2.5
2.0
1.5
1.0
0.5
non-firmyields
10 50 6020 30 40live storage, 106m3
Fig. 3 Yield from storagea 14 months of failure in 46 yearsb 5 months of failure in 46 yearsc 2 months of failure in 46 yearsd Firm yield (no failure in 46 years)
probabilities of failure. The degree of failure acceptable forthe power system (and for irrigation purposes) is a matterof judgement and determines what is taken as the 'firm'yield for subsequent stages of the study.
The resulting values of firm yield in conjunction withthe appropriate values of net head available at a powerstation led, for each reservoir capacity considered, to afirm electric energy which could have been continuouslygenerated throughout the period of the hydrologicalrecord; provided, of course, that sufficient generating plantcapacity had been available.
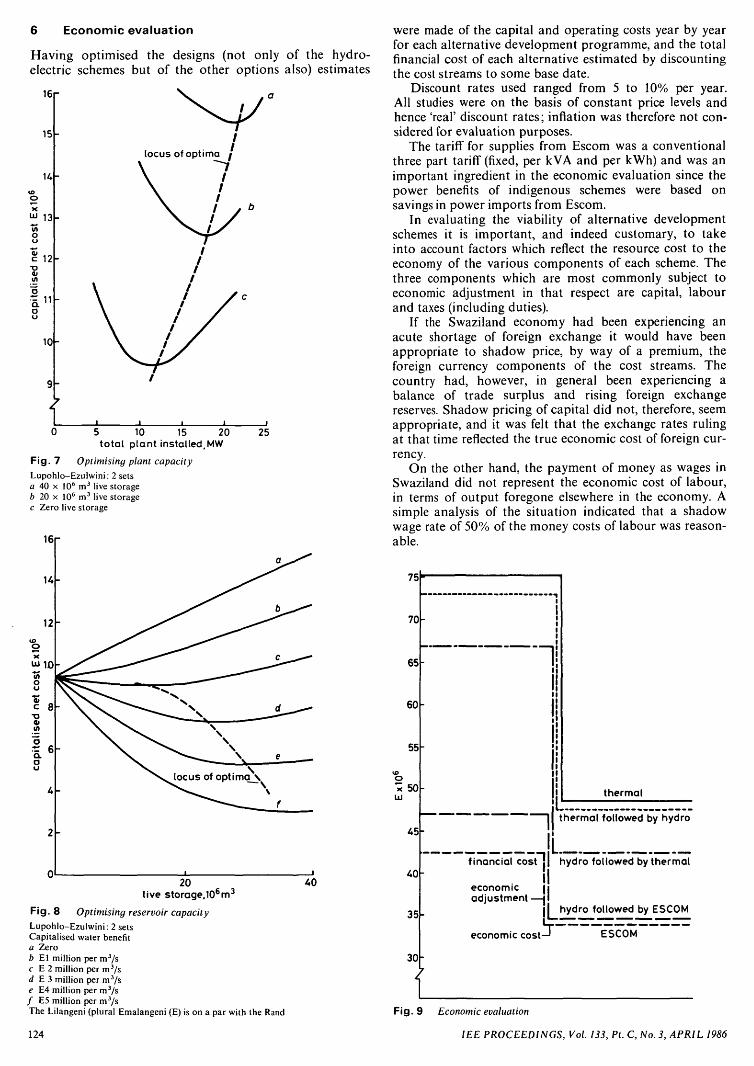
Having established the firm yield and firm energyoutput for each reservoir capacity, the computer programwas used to calculate the electric energy which could havebeen produced by various combinations of generatingplant installed in a power station at Ezulwini. Part of thisenergy corresponds to the firm energy, and the remainderis secondary energy which could have been generated attimes when water was in abundance and the reservoir was,or would otherwise have been, spilling. Fig. 4 illustratesthe results for a reservoir live-storage capacity of 20million m3.
The amount of energy which could have been producedwas maximised over a long period by establishing a rulecurve for target reservoir levels, such as that shown in Fig.5. The target levels were established by iteration with aview to minimising failure of water available while maxi-mising use of water (i.e. minimising loss of water byspilling).
Before the true value of the hydro-electric energy andfirm power available could be assessed, however, it was
1EE PROCEEDINGS, Vol. 133, Pi. C, No. 3, APRIL 1986
necessary to determine how much would be usable by thesystem, year by year. This was done by computer simula-tion of the allocation of the total system load to the differ-ent sources of supply. Methods of load allocation have
100r
90
80
^ 7 0
o
8 60
o• | 50
30
20
10
designs, particularly in respect of the storage capacity ofreservoirs, and of the arrangement and capacity of gener-ating plant in the power stations. This optimisation for theLupohlo-Ezulwini scheme involved comparisons betweenincrements in benefit arising from increases in size ofscheme, and the corresponding increments in cost, as illus-trated in Fig. 6.
6 8 10 12 14 16 18 20 22
total plant installed, MWFig. 4 Average energy outputsLupohlo-Ezulwini: 20 x 106 m3 live storagea 3 sets each up to 7.6 MW throughout the yearb 2 or 3 sets October-Junec 3 sets each up to 7.6 MW July-September (1 not available)d 2 sets July-September (1 not available August and September)
(iterations)
hydrologicaldata
reservoircharacteristics
c reservoirrule curve
downstreamflows
net headavailable
number andrating of
generating sets
Ipotential
poweroutput
1 Jpotential
energyoutput
forecastfutureloads
loadallocations
usable energyand firm power
extra water
costs benefits
incrementalcost
incrementalbenefit
1020r
1015
1010
*1005• if
- 1000
995
990
design maximum level 1018m Fig. 6 Optimisation flow chart
/ target reservoir level
spillway level 1016m
minimum operating level 997m
Jan Feb Mar Apr May Jun Jul Aug Sep Oct Nov Dec
Fig. 5 Reservoir rule curve
been in widespread use for many years, and need not bediscussed further here.*
5 Optimisation of designs
In evaluating the economics of hydro-electric schemesgreat emphasis must be given to the optimisation of
* See 'Hydro-electric engineering practice' (Blackie, 1958) Vol. Ill, Chap. V
IEE PROCEEDINGS, Vol. 133, Pt. C, No. 3, APRIL 1986
The selection of the optimum plant installations forthree reservoir live-storage capacities considered as cover-ing the maximum reasonable range is shown in Fig. 7which gives, in graphical form, the results of the compari-sons.
The preferred reservoir capacity depends to a significantextent on the value to downstream irrigation attributed tothe increased firm rate of flow resulting from storage. Thegraphical analysis is completed in Fig. 8, in which thelocus of optima without this water benefit from Fig. 7 isreplotted with reservoir size and capitalised net cost as thevariables, together with similar curves which include theeffect of water benefit credited with a range of values.
The capitalised value of the water benefit was estimatedseparately to be E2 million per m3/s, which indicated thatthe live storage at the reservoir should be not more than20 million m3 (from Fig. 8) with an optimum plant install-ation of about 18 MW (from Fig. 7).
A similar analysis indicated that the installation of asingle 8 MW generating set in the Lower station would beclose to the optimum. An optimisation study of the jointdevelopment of Lupohlo-Ezulwini and the Lower schemesconfirmed the preferences arrived at for their separatedevelopments.
123
6 Economic evaluation
Having optimised the designs (not only of the hydro-electric schemes but of the other options also) estimates
I6r
15
13
c 12"S
10
0 5 10 15 20total plant installed,MW
Fig. 7 Optimising plant capacityLupohlo-Ezulwini: 2 setsa 40 x 106 m3 live storageb 20 x 106 m3 live storagec Zero live storage
16r
14
12
W10
c 8a*(A
25
20live storage,106m3
Fig. 8 Optimising reservoir capacityLupohlo-Ezulwini: 2 setsCapitalised water benefita Zerob El million per m3/sc E 2 million per m3/sd E 3 million per m3/se E4 million per m3/s/ E5 million per m3/sThe Lilangeni (plural Emalangeni (E) is on a par with the Rand
124
40
were made of the capital and operating costs year by yearfor each alternative development programme, and the totalfinancial cost of each alternative estimated by discountingthe cost streams to some base date.
Discount rates used ranged from 5 to 10% per year.All studies were on the basis of constant price levels andhence 'real' discount rates; inflation was therefore not con-sidered for evaluation purposes.
The tariff for supplies from Escom was a conventionalthree part tariff (fixed, per kVA and per kWh) and was animportant ingredient in the economic evaluation since thepower benefits of indigenous schemes were based onsavings in power imports from Escom.
In evaluating the viability of alternative developmentschemes it is important, and indeed customary, to takeinto account factors which reflect the resource cost to theeconomy of the various components of each scheme. Thethree components which are most commonly subject toeconomic adjustment in that respect are capital, labourand taxes (including duties).
If the Swaziland economy had been experiencing anacute shortage of foreign exchange it would have beenappropriate to shadow price, by way of a premium, theforeign currency components of the cost streams. Thecountry had, however, in general been experiencing abalance of trade surplus and rising foreign exchangereserves. Shadow pricing of capital did not, therefore, seemappropriate, and it was felt that the exchange rates rulingat that time reflected the true economic cost of foreign cur-rency.
On the other hand, the payment of money as wages inSwaziland did not represent the economic cost of labour,in terms of output foregone elsewhere in the economy. Asimple analysis of the situation indicated that a shadowwage rate of 50% of the money costs of labour was reason-able.
75
70
65
60
55
50
35
30
1
thermal
11 thermal followed by hydro
financial cost ' | hydro followed by thermal
economicadjustment —
I hydro followed by ESCOM
economic cost—" ESCOM
Fig. 9 Economic evaluation
IEE PROCEEDINGS, Vol. 133, Pt. C, No. 3, APRIL 1986

Adjustment was also made for the residual value, at theend of the period considered, of assets acquired under thealternative investment programmes: the useful lives ofassets acquired under the alternative programmes wouldextend beyond the year 2000, and so the unused portionsof the assets' lives would represent residual economicresources at that time, for which an adjustment was appro-priate.
The effect of applying economic adjustments to thefinancial costs is shown in Fig. 9. The least-cost alternativeat economic prices was found to be that involvingincreased supplies from Escom. However, mixed develop-ment with hydro-electric generation followed by increasedsupply from Escom, which was some 11% more costlythan the all-Escom alternative in financial terms, virtuallyjoined it as least-cost alternative in economic terms.
Furthermore, the mixed alternative had unquantifiedbenefits of local use of a renewable resource (water),greater employment creation effect in Swaziland, nationalcontrol over a larger proportion of the country's electricitysupplies and possible agricultural benefits from better-regulated river flows.
The results of sensitivity tests indicated that reasonablechanges in the parameters assumed for the main economicevaluation did not significantly alter the economic rankingof the alternatives.
7 Financial evaluation
The financial consequences of hydro-electric developmentwere evaluated in a series of computer-based projections ofthe SEB's future operations, which took the form of con-ventional financial statements: profit and loss accounts,balance sheets, and statements of sources and applicationsof funds.
The objectives of this analysis were to assess the SEB'sfuture financing requirements and the tariff revenues itwould require to meet the likely conditions attached tosuch financing.
8 Environmental, social and ecological impact
By its very nature, hydro-electric development can make asubstantial impact on the environment, for example as aresult of damming and flooding a valley to provide storageof water. The environmental changes in turn can make animpact not only on people by way of affecting their socialpatterns, but also on other forms of animal life and onvegetation.
A study of these factors as they related to the Lupohlo-Ezulwini and Lower schemes was carried out and indi-cated that:
(a) the principal effect of the impoundment of theLupohlo reservoir would be on people, with a number offamilies then living in the area to be flooded having to beresettled; other families living just above the full supplylevel of the reservoir would probably also need to be re-settled. The effect of impoundment at the lower schemewould be minimal
(b) the creation of a large reservoir at Lupohlo and of asmall reservoir at the Lower scheme would lend impetus toincreases in the fish population
(c) there would be little effect on vegetation apart fromthe flooding of some commercial and non-commercialforest, grazing land and riparian vegetation
(d) the creation of a large expanse of slow-movingwater at the Lupohlo reservoir might cause an increase inthe incidence of bilharzia
(e) the major impact at the Lower scheme would bemade during the construction phase on the lives of twocommercial farmers and their labour forces in the area, byway of possible distraction or disruption caused not onlyby the construction activities themselves, but also by theintroduction, albeit temporary, of a large, relatively sophis-ticated and probably urban, labour force into a rural area
(/) the Ezulwini power station would be built in fullview of the busiest and one of the most scenic roads inSwaziland, and great care in the design of the schemewould be required to avoid, or at least minimise, detrac-tion from the aesthetic aspects of the area
(g) the creation of a large reservoir at Lupohlo, close toMbabane and also in an aesthetically beautiful area, wouldencourage the development of recreation facilities.
Accordingly, recommendations were made on measuresconsidered to be necessary to investigate further certain ofthe aspects mentioned above, to minimise the effects ofsome of the worst aspects and maximise the effects of thebetter aspects.
It should be mentioned in closing that the reservoir,now full of water, is a popular week-end spot for all formsof water pursuits, mainly sailing and fishing.
9 Acknowledgments
The authors are indebted to the Swaziland ElectricityBoard for permission to publish this paper.
IEE PROCEEDINGS, Vol. 133, Pt. C, No. 3, APRIL 1986 125