Embed Size (px)
DESCRIPTION
ECONOMICS 201 INTRODUCTION TO MICROECONOMICS Spring 2001. ECONOMICS IS ABOUT DECIDING. Economists do not restrict themselves to considering only decision problems involving money and markets, though that is a big part of economics. EXAMPLES OF SOME DECISIONS ECONOMISTS HAVE ANALYZED. - PowerPoint PPT Presentation
Citation preview
Introduction slide 1
ECONOMICS 201
INTRODUCTION TO MICROECONOMICS
Spring 2001
Introduction slide 2
ECONOMICS IS ABOUT DECIDING
Economists do not restrict themselves to considering only decision problems involving money and markets, though that is a big part of economics.
Introduction slide 3
EXAMPLES OF SOME DECISIONS ECONOMISTS
HAVE ANALYZEDWhether to buy a car this week.
Whether to have pizza for dinner tonight, or something else.
Whether to marry your sweetheart.
How hard to study for this course.
Whether to go to college, and if so, which one.
Whether to buy a lottery ticket in the Michigan lottery.
Introduction slide 4
Factors in decision making
1. People face tradeoffs.
2. Opportunity cost.
3. Making decisions at the margin.
4. People respond to incentives.
Introduction slide 5
How individual decisions affect others
5. Trade (exchange) can benefit everyone.
6. Markets are often a good way to organize exchange.
7. Government can sometimes improve on
markets.
Introduction slide 6
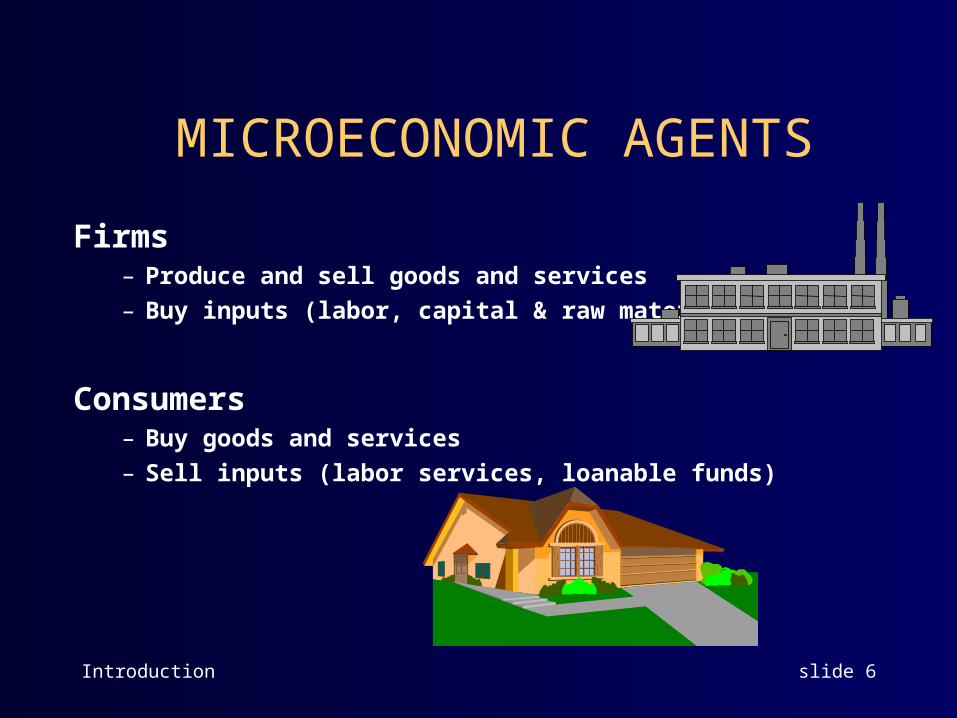
MICROECONOMIC AGENTS
Firms– Produce and sell goods and services
– Buy inputs (labor, capital & raw materials)
Consumers– Buy goods and services
– Sell inputs (labor services, loanable funds)
Introduction slide 7
Methodology: Positive v. Normative Economics
Positive econ. -- Studies the way the world is.How much will a new gasoline tax raise the price of gasoline?
Will an increase in the minimum wage increase unemployment?
Why is the price of corn $4.20 per bushel?
How much will a drought in the corn belt raise the price of corn? Of wheat?
What will be the effect on Byron Brown’s pizza consumption if we take $1000 away from Tom Izzo and give it to Brown?
Introduction slide 8
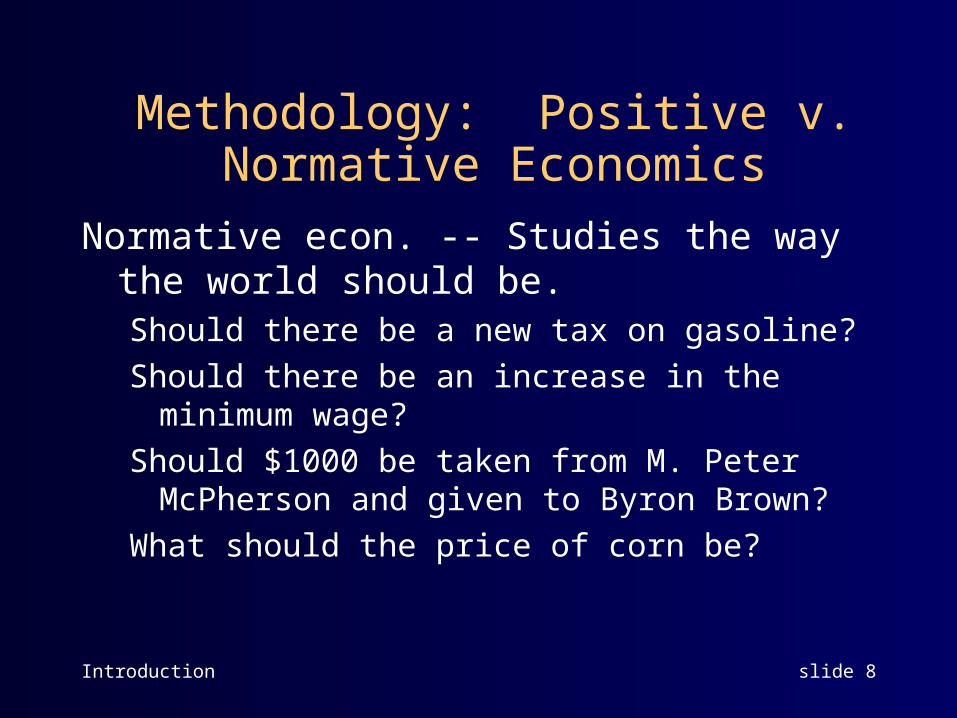
Normative econ. -- Studies the way the world should be.Should there be a new tax on gasoline?
Should there be an increase in the minimum wage?
Should $1000 be taken from M. Peter McPherson and given to Byron Brown?
What should the price of corn be?
Methodology: Positive v. Normative Economics
Introduction slide 9
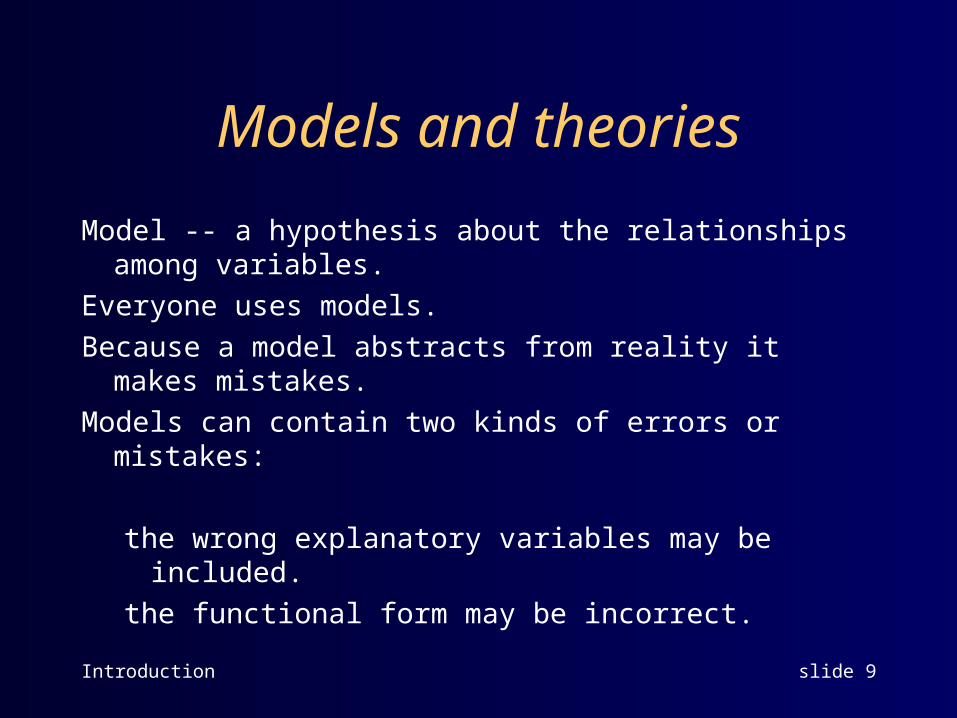
Models and theories
Model -- a hypothesis about the relationships among variables.
Everyone uses models.
Because a model abstracts from reality it makes mistakes.
Models can contain two kinds of errors or mistakes:
the wrong explanatory variables may be included.
the functional form may be incorrect.
Introduction slide 10
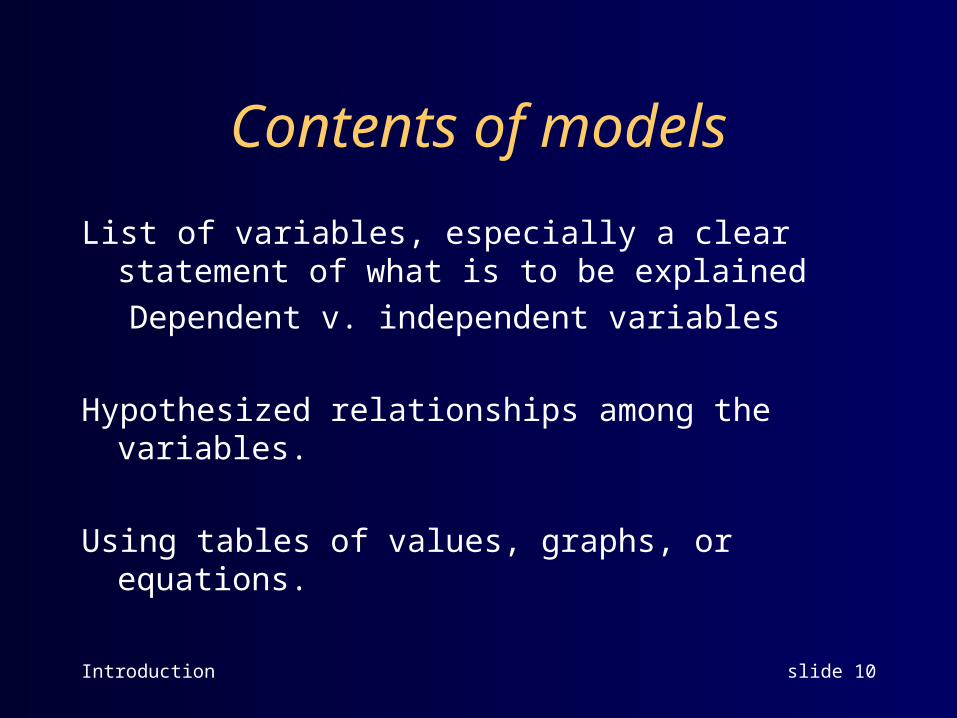
Contents of models
List of variables, especially a clear statement of what is to be explained
Dependent v. independent variables
Hypothesized relationships among the variables.
Using tables of values, graphs, or equations.
Introduction slide 11
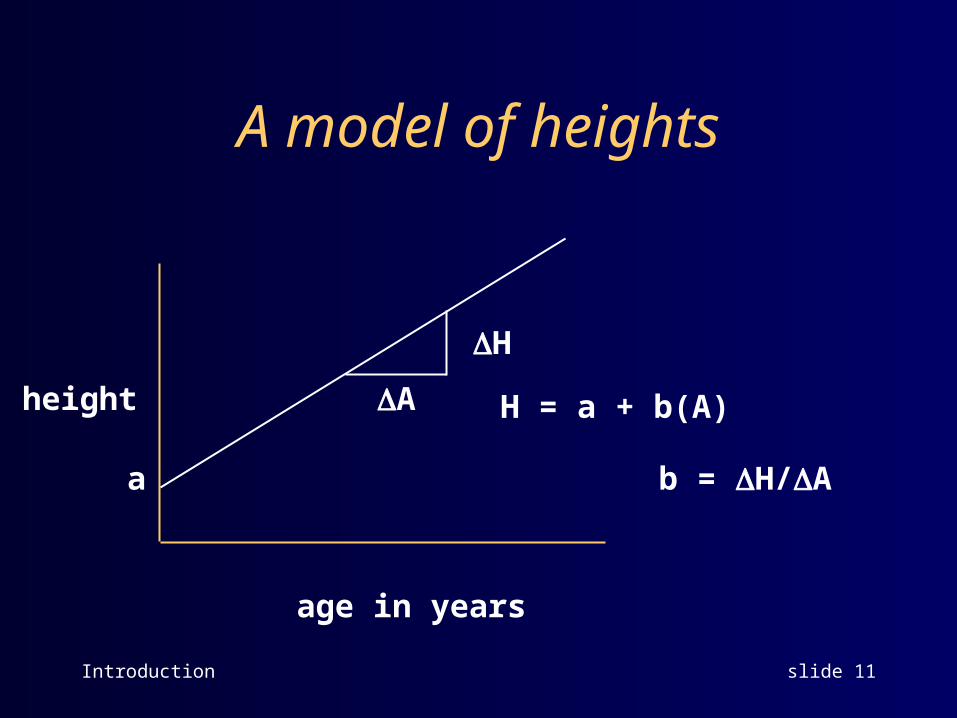
A model of heights
age in years
height H = a + b(A)
a
H
A
b = H/A
Introduction slide 12
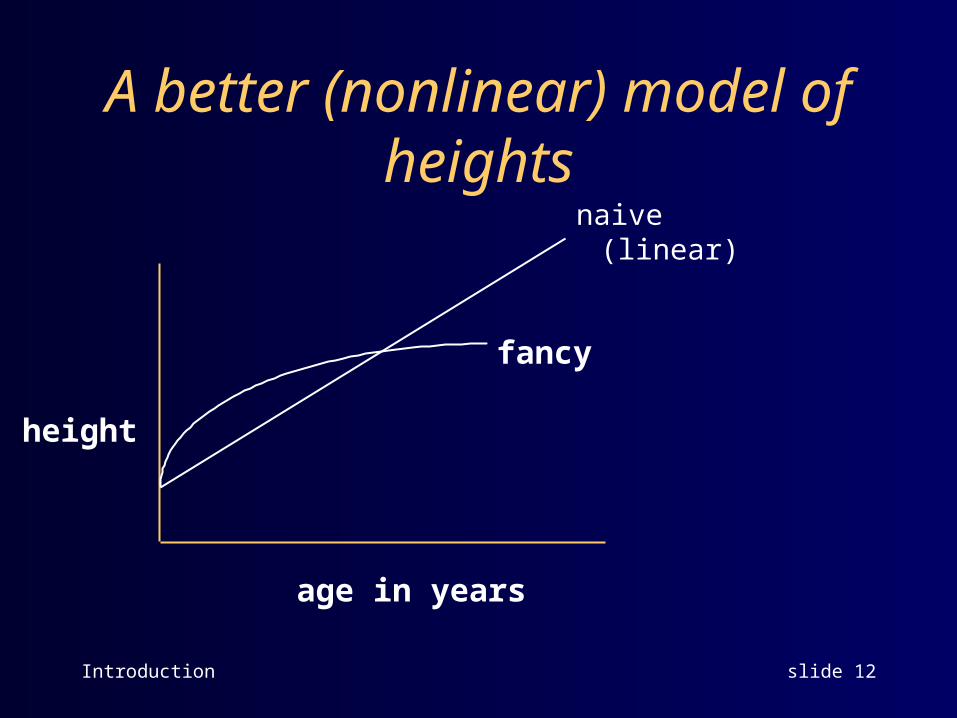
A better (nonlinear) model of heights
naive (linear)
age in years
height
fancy
Introduction slide 13
A better model?
Height = f(age, gender, parents’ heights, nutrition, ...)
Introduction slide 14
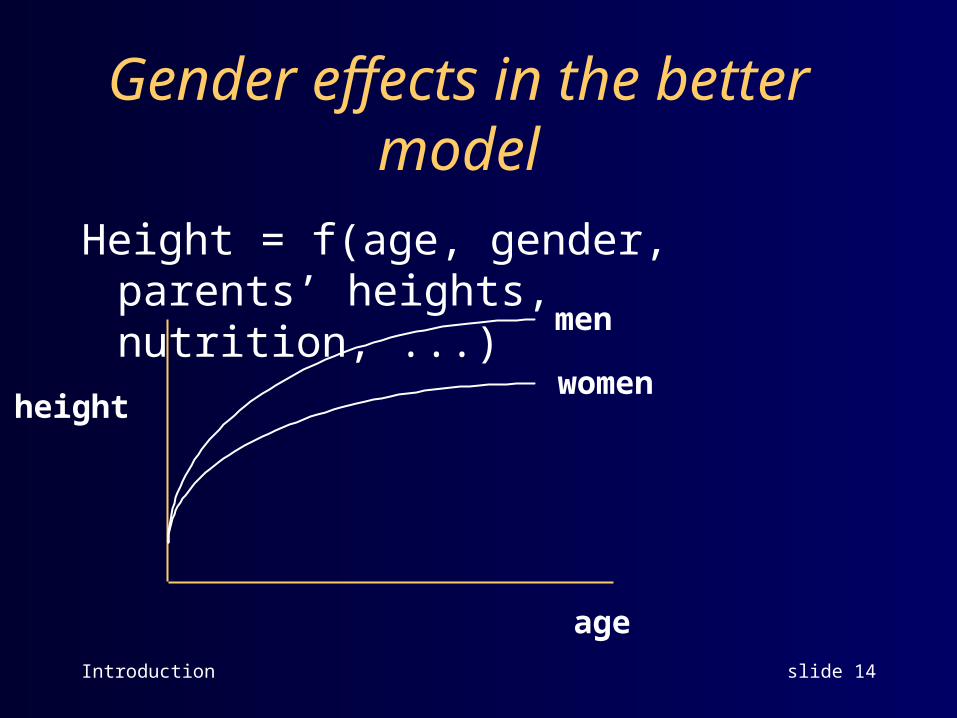
Gender effects in the better model
Height = f(age, gender, parents’ heights, nutrition, ...)
height
age
men
women
Introduction slide 15
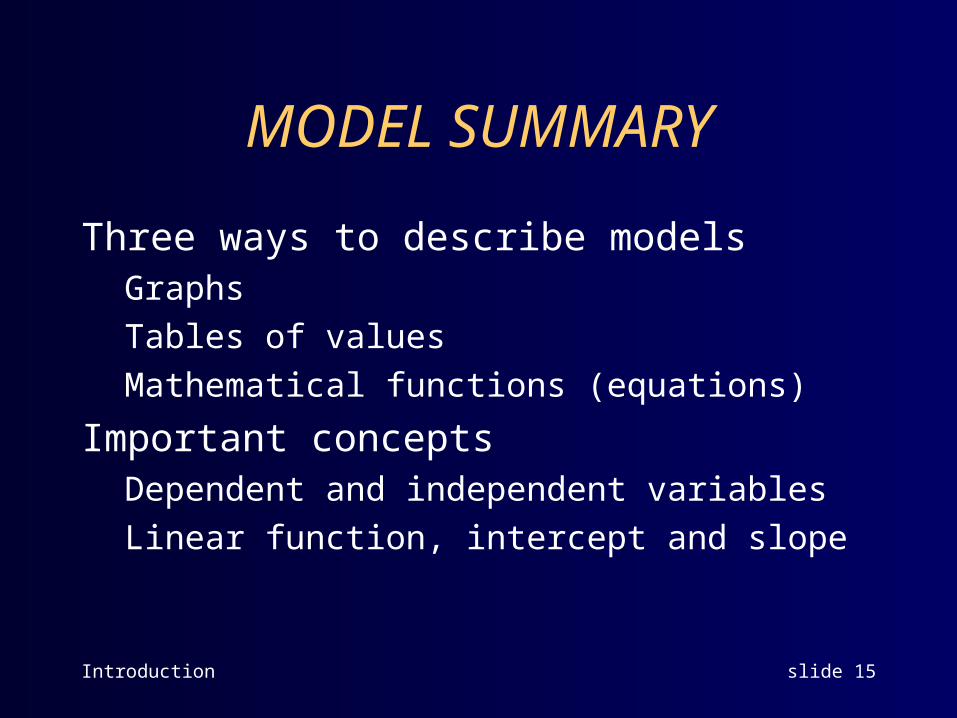
MODEL SUMMARY
Three ways to describe modelsGraphs
Tables of values
Mathematical functions (equations)
Important conceptsDependent and independent variables
Linear function, intercept and slope
Introduction slide 16
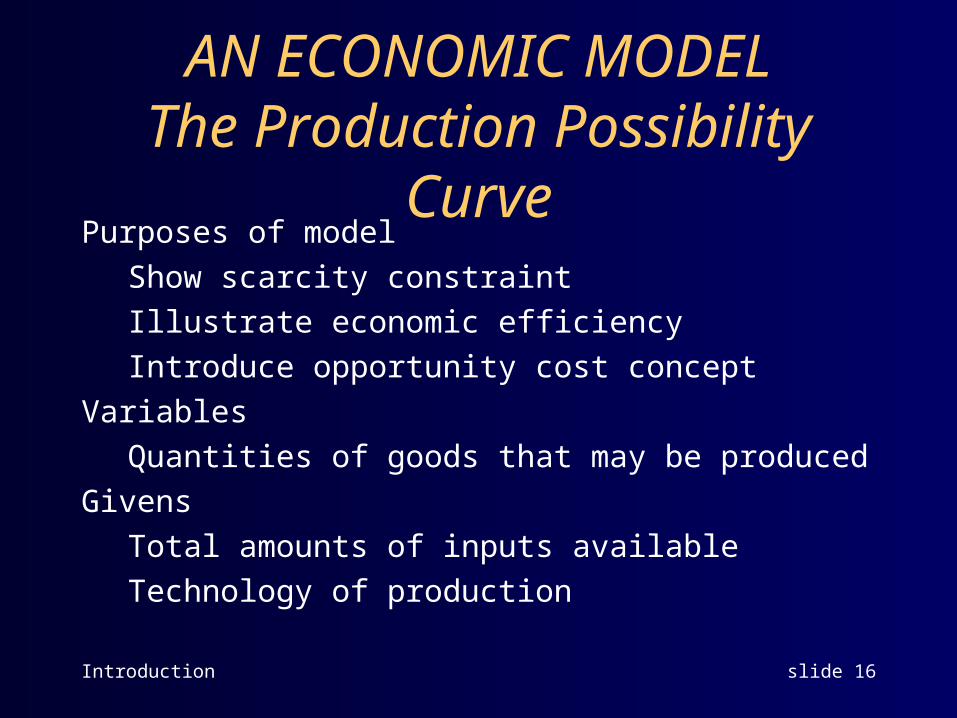
AN ECONOMIC MODELThe Production Possibility CurvePurposes of model
Show scarcity constraint
Illustrate economic efficiency
Introduce opportunity cost concept
Variables
Quantities of goods that may be produced
Givens
Total amounts of inputs available
Technology of production
Introduction slide 17
PPF DEFINED
The Production Possibility Curve (or frontier) shows the maximum amount of a good you can produce given the amounts of other goods produced, and given the total amounts of inputs available, and given the technology of production.
Introduction slide 18
PPC EXAMPLE
Assumptions:
There are only two goods, pizza and spaghetti.
There are limited inputs and given technology of production.
Definition:
The PPC shows the maximum amount of pizza you can produce, given the amount of spaghetti to be produced.
Introduction slide 19
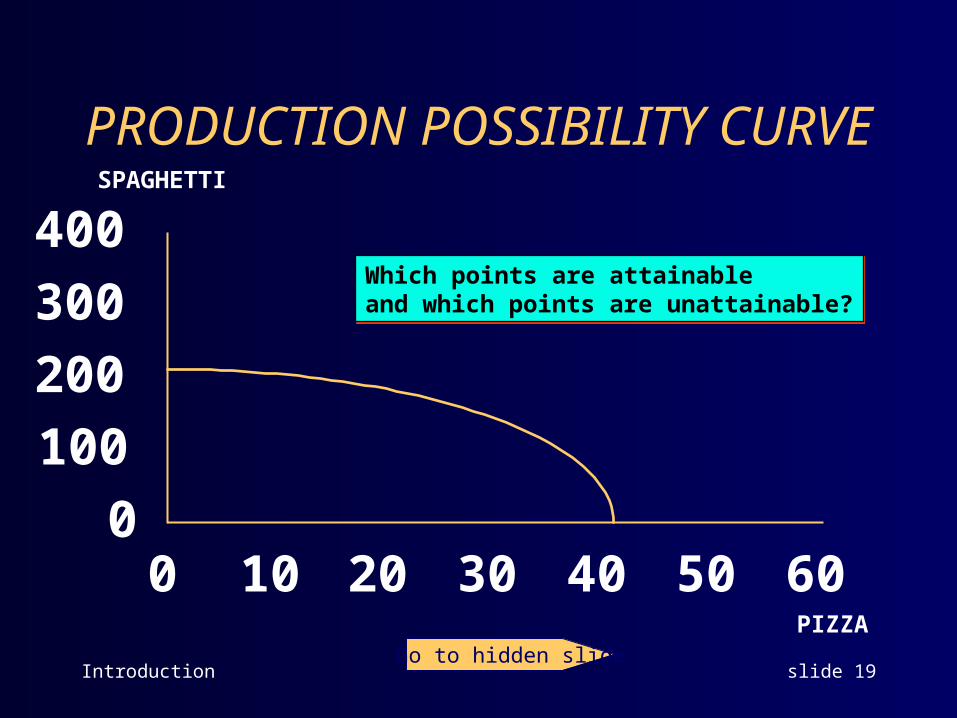
PRODUCTION POSSIBILITY CURVESPAGHETTI
PIZZA
Which points are attainableand which points are unattainable?Which points are attainableand which points are unattainable?
0
100
200
300
400
0 10 20 30 40 50 60
Go to hidden slide
Introduction slide 21
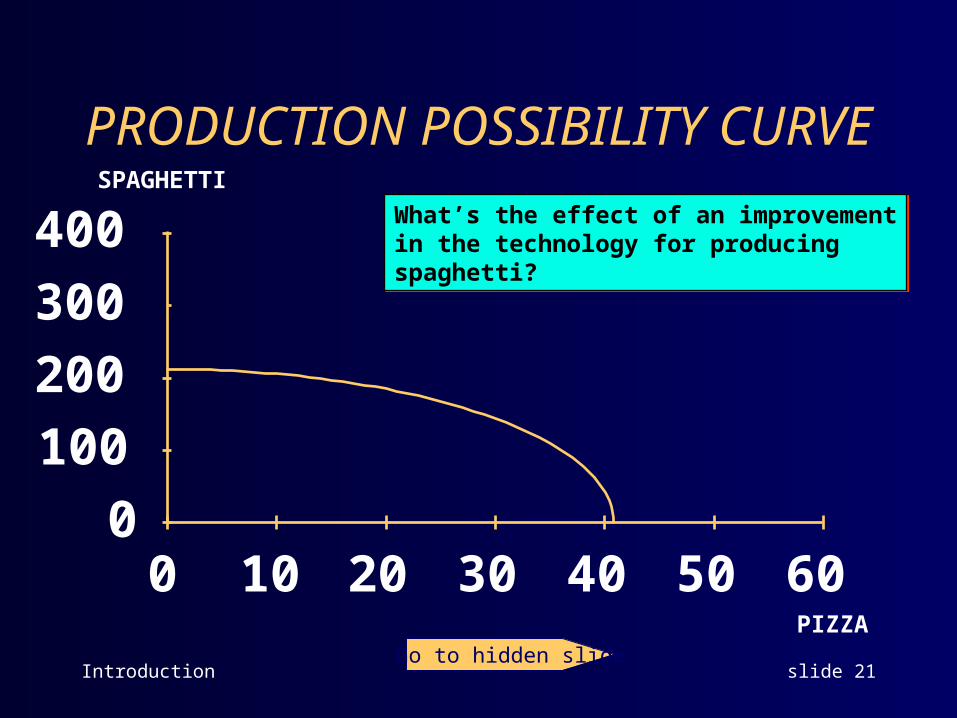
PRODUCTION POSSIBILITY CURVESPAGHETTI
PIZZA
What’s the effect of an improvementin the technology for producing spaghetti?
What’s the effect of an improvementin the technology for producing spaghetti?
0
100
200
300
400
0 10 20 30 40 50 60
Go to hidden slide
Introduction slide 23
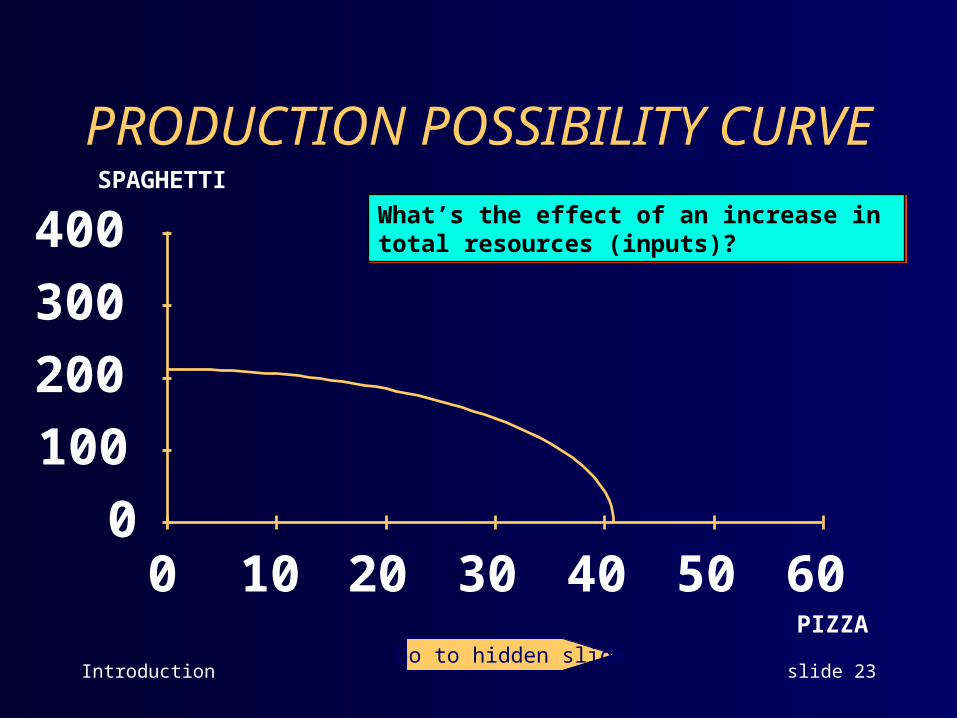
PRODUCTION POSSIBILITY CURVESPAGHETTI
PIZZA
What’s the effect of an increase in total resources (inputs)?What’s the effect of an increase in total resources (inputs)?
0
100
200
300
400
0 10 20 30 40 50 60
Go to hidden slide
Introduction slide 25
Points “inside” the PPC are inefficient.
For any point “inside” there corresponds some point that represents more production of both goods.
Note that while points on the PPC are efficient, we cannot say at this time whether some are better for society than others.
Introduction slide 26
OPPORTUNITY COST DEFINED
The opportunity cost of doing something is what you must give up in order to do it.The cost of a pizza is what you must give up to consume it,
which in this case is easily computed in money.
The cost of a college education includes both money and other foregone alternatives. For example, the cost of a year at MSU includes not only tuition and books, but the income you could have earned working on a full time job.
The cost of attending a Lugnuts baseball game includes the value of the time you could have spent studying economics.
Introduction slide 27
The PPC can show opportunity cost
Suppose you are at some point on a PPC.
Then suppose you want to consume one more pizza.
The opportunity cost of one more pizza is the amount of spaghetti you must give up in order to get it.
Note that this opportunity cost is equal to minus the slope of the PPC.
Introduction slide 28
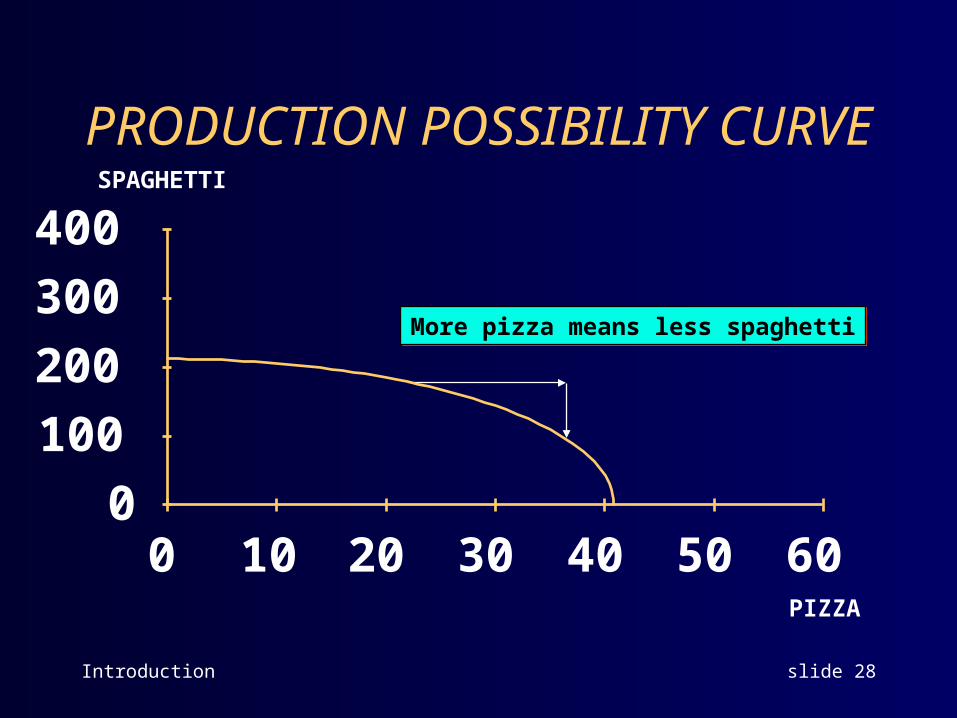
PRODUCTION POSSIBILITY CURVESPAGHETTI
PIZZA
More pizza means less spaghettiMore pizza means less spaghetti
0
100
200
300
400
0 10 20 30 40 50 60
Introduction slide 29
OPPORTUNITY COST INCREASES AS MORE OF A
GOOD IS PRODUCEDNot only does more pizza mean less spaghetti,
but each additional pizza costs more than the one before it.
This idea shows up as the PPC being concave to the origin. (The curve bows out.)
Introduction slide 30
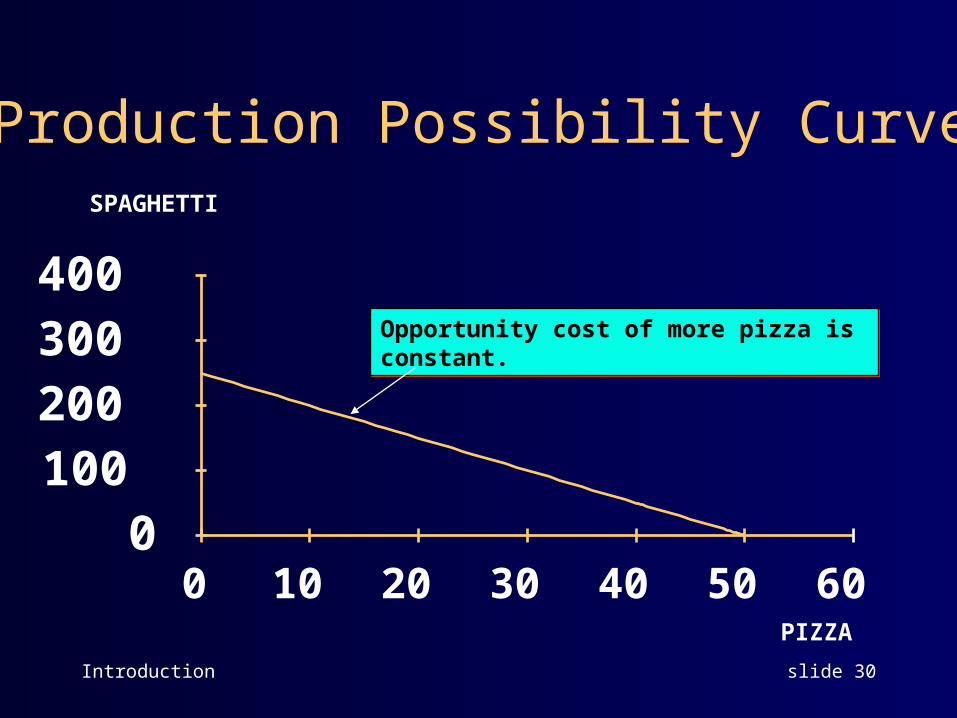
Opportunity cost of more pizza is constant.Opportunity cost of more pizza is constant.
Production Possibility Curve
0100200300400
0 10 20 30 40 50 60
SPAGHETTI
PIZZA
Introduction slide 31
We will use Production Possibilities Curves that are straight lines (i.e., that have constant opportunity cost) to illustrate some important economic principles.