Embed Size (px)
Citation preview
DOI 10.1007/s10584-006-9137-z
Economically optimal risk reduction strategies in the faceof uncertain climate thresholds
David McInerney · Klaus Keller
Received: 4 November 2005 / Accepted: 31 March 2006C© Springer Science + Business Media B.V. 2007
Abstract Anthropogenic greenhouse gas emissions may trigger climate threshold responses,
such as a collapse of the North Atlantic meridional overturning circulation (MOC). Climate
threshold responses have been interpreted as an example of “dangerous anthropogenic inter-
ference with the climate system” in the sense of the United Nations Framework Convention
on Climate Change (UNFCCC). One UNFCCC objective is to “prevent” such dangerous an-
thropogenic interference. The current uncertainty about important parameters of the coupled
natural–human system implies, however, that this UNFCCC objective can only be achieved
in a probabilistic sense. In other words, climate management can only reduce – but not
entirely eliminate – the risk of crossing climate thresholds. Here we use an integrated assess-
ment model of climate change to derive economically optimal risk-reduction strategies. We
implement a stochastic version of the DICE model and account for uncertainty about four
parameters that have been previously identified as dominant drivers of the uncertain system
response. The resulting model is, of course, just a crude approximation as it neglects, for
example, some structural uncertainty, and focuses on a single threshold, out of many poten-
tial climate responses. Subject to this caveat, our analysis suggests five main conclusions.
First, reducing the numerical artifacts due to sub-sampling the parameter probability density
functions to reasonable levels requires sample sizes exceeding 103. Conclusions of previous
studies that are based on much smaller sample sizes may hence need to be revisited. Second,
following a business-as-usual (BAU) scenario results in odds for an MOC collapse in the
next 150 years exceeding 1 in 3 in this model. Third, an economically “optimal” strategy
(that maximizes the expected utility of the decision-maker) reduces carbon dioxide (CO2)
emissions by approximately 25% at the end of this century, compared with BAU emissions.
Perhaps surprisingly, this strategy leaves the odds of an MOC collapse virtually unchanged
compared to a BAU strategy. Fourth, reducing the odds for an MOC collapse to 1 in 10 would
require an almost complete decarbonization of the economy within a few decades. Finally,
further risk reductions (e.g., to 1 in 100) are possible in the framework of the simple model,
but would require faster and more expensive reductions in CO2 emissions.
D. McInerney (�) · K. KellerDepartment of Geosciences, The Pennsylvania State University, PA, 16802-2714e-mail: [email protected]
Springer
/ Published online: 16 January 2007
Climatic Change (2008) 91:29–41
1 Introduction
Anthropogenic greenhouse gas emissions may trigger climate threshold responses (Alley
et al. 2003). For example, some ocean models predict a collapse of the North Atlantic
meridional overturning circulation (MOC) as a potential threshold response to anthropogenic
carbon dioxide (CO2) emissions (Stocker and Schmittner 1997; Cubasch and Meehl 2001).
An MOC collapse has the potential to cause widespread temperature and precipitation
changes and nontrivial ecological and economic impacts (Keller et al. 2000; Vellinga and
Wood 2002; Link and Tol 2004). The potential for adverse impacts due to anthropogenic
greenhouse gas emissions raises the question of how – if at all – this risk should be reduced.
An economically efficient strategy would find some optimal balance between the costs and
benefits of reducing these impacts. Numerous studies have applied integrated assessment
models (IAMs) of climate change to analyze risk management strategies in the face of
uncertain climate thresholds (e.g., Nordhaus 1992; Toth et al. 1997; Kelly and Kolstad 1999;
Keller et al. 2000, 2004; Zickfeld and Bruckner 2003; Bruckner and Zickfeld 2004). Here
we use a simple IAM that accounts for uncertainty in key parameters and the potential for an
MOC collapse to analyze two main questions: (i) What would be the odds of triggering an
MOC collapse for a strategy with unabated CO2 emissions? (ii) What would be economically
optimal strategies to reduce the odds of triggering an MOC collapse to various levels? We
address these questions using a simple integrated assessment model of climate change. This
framework is, as any model, subject to numerous caveats (discussed at the end of this paper).
Our study improves on previous work by a more refined examination of the effects of
parametric uncertainty and the effects of imposing a reliability constraint. Uncertain param-
eters are represented by sets of stratified Latin-hypercube samples. We find that sample sizes
exceeding 103 are required to reduce the effects of sampling resolution to arguably reasonable
levels. For a business-as-usual policy (i.e., no CO2 abatement) the odds for triggering an MOC
collapse over the next 150 years exceed 1 in 3. Considering previously published estimates
for climate change damages, we find that optimal carbon abatement increases steadily from
more than 10% in 2005 to almost 30% over the next 150 years. However, this economically
“optimal” policy does not considerably reduce the future odds of an MOC collapse compared
to the BAU strategy. Constraining the odds of triggering an MOC collapse to below 1 in 10
requires CO2 abatement exceeding 80% within the next 60 years. Reducing these odds further
to 1 in 100 is possible in the model, but requires faster and more expensive abatement – close
to 90% abatement over the next 40 years.
2 The integrated assessment model
We adopt the Dynamic Integrated model of Climate and the Economy, DICE (Nordhaus
1994), as a simple and transparent framework. This model links an economic growth model,
as pioneered by Ramsey (1928), to a description of the CO2 induced climate change and the
resulting economic impacts. Here we describe the general structure and key parameters of
the model. An excellent and very thorough description is given in Nordhaus (1994).
The objective of the decision-problem is to determine abatement and investment policies
that maximize the discounted sum of utility across the considered states of the world
U ∗ =N∑
s=1
t∗∑t=t0
U (s, t)(1 + ρ)−t , (1)
Springer
30 Climatic Change (2008) 91:29–41

where t0 is an initial point (the year 1965), t∗ is the considered time horizon, ρ is the pure
rate of social time preference, and s denotes a particular state of the world (SOW) out of Nconsidered discrete samples (discussed below). Well-being in the DICE model is represented
by a flow of utility
U (t) = L(t) ln c(t), (2)
where L is population, specified exogenously, and c is per capita consumption. (The used
symbols are summarized and defined in the Appendix.)
Consumption is the difference between economic output and the sum of investment in
capital stocks, damages caused by climate change and investment in reducing CO2 emissions.
The DICE model describes economic output using a constant-returns-to-scale Cobb Douglass
production function with parameters for labor, capital, and level of technology. Labor inputs
are proportional to population.
Economic activity has the side effect of CO2 production with an exogenously evolving
ratio between economic output – measured as gross world product (GWP) – and CO2 produc-
tion. A linear carbon cycle model links CO2 emissions to atmospheric CO2 concentrations.
Radiative forcings by greenhouse gases besides CO2 and through aerosols are prescribed
exogenously.
The climate system in DICE is represented by a simple model consisting of a combined
atmosphere and surface ocean layer and a deep ocean layer (Schneider and Thompson 1981).
Higher greenhouse gas levels enhance radiative forcing, warming the atmosphere and (over
time) the deep ocean. The climate sensitivity is an important parameter in this model and
represents the equilibrium temperature increase for a hypothetical doubling of atmospheric
CO2. Economic damages due to climate change are approximated by a polynomial fit to
previous studies, as described in Nordhaus (1994). The original DICE model is modified to
consider economic damages caused by an MOC collapse. Following previous studies, we
approximate the model results of Stocker and Schmittner (1997) by a critical equivalent CO2
concentration that is exponentially related to the climate sensitivity, beyond which the MOC
collapses (Keller et al. 2004). Damages due to an MOC collapse, taken as a fraction of GWP,
are applied at each time period after the collapse. The cost of carbon emissions abatement
is expressed as a function of the fractional reduction in CO2 emissions, μ(t), relative to
uncontrolled emissions.
3 Representation of parametric uncertainty
Previous work identified four parameters as key drivers of the optimal policy under uncertainty
(Nordhaus and Popp 1997; Keller et al. 2004). We improve on these studies by considering
(i) a more refined resolution, (ii) the combined effects of multiple parameter uncertainty,
and (iii) the effects of a “reliability constraint” on optimal policies (discussed below). The
considered parameters are: (i) the damage associated with an MOC collapse (θ3); (ii) the
climate sensitivity (λ�); (iii) the decline in population growth rate (δL ); and (iv) the initial
growth of the CO2–GDP ratio, (gσ ). The specific choices of parameter distributions, given
in Table 1, are discussed below.
Following Keller et al. (2004), we adopt a uniform distribution for the damages due to an
MOC collapse (θ3) between 0% and 3% GWP. For the climate sensitivity (λ�) we adopt the
empirical distribution reported by Andronova and Schlesinger (2001) with an expected value
of 3.4 ◦C and 95% confidence limits of 0.9 ◦C and 12.7 ◦C. Population growth in the DICE
Springer
31Climatic Change (2008) 91:29–41
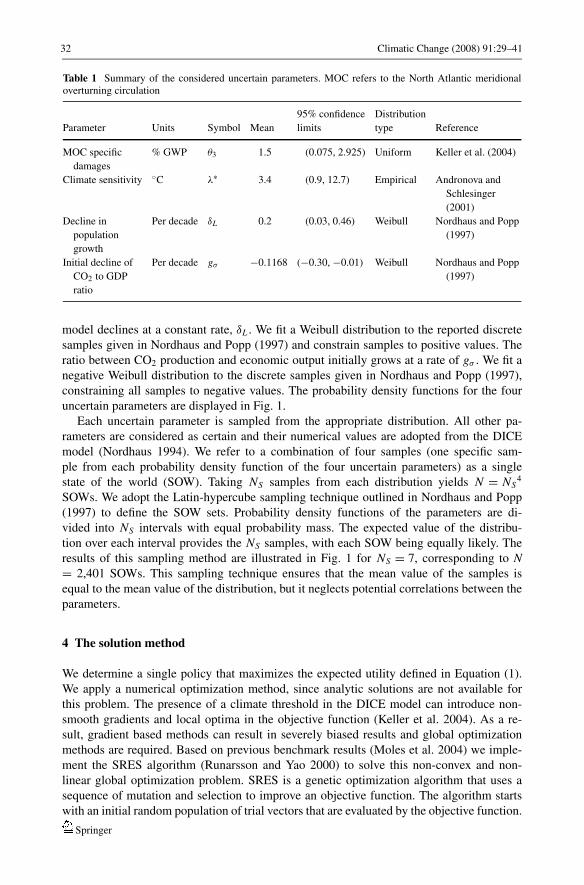
Table 1 Summary of the considered uncertain parameters. MOC refers to the North Atlantic meridionaloverturning circulation
95% confidence Distribution
Parameter Units Symbol Mean limits type Reference
MOC specific
damages
% GWP θ3 1.5 (0.075, 2.925) Uniform Keller et al. (2004)
Climate sensitivity ◦C λ∗ 3.4 (0.9, 12.7) Empirical Andronova and
Schlesinger
(2001)
Decline in
population
growth
Per decade δL 0.2 (0.03, 0.46) Weibull Nordhaus and Popp
(1997)
Initial decline of
CO2 to GDP
ratio
Per decade gσ −0.1168 (−0.30, −0.01) Weibull Nordhaus and Popp
(1997)
model declines at a constant rate, δL . We fit a Weibull distribution to the reported discrete
samples given in Nordhaus and Popp (1997) and constrain samples to positive values. The
ratio between CO2 production and economic output initially grows at a rate of gσ . We fit a
negative Weibull distribution to the discrete samples given in Nordhaus and Popp (1997),
constraining all samples to negative values. The probability density functions for the four
uncertain parameters are displayed in Fig. 1.
Each uncertain parameter is sampled from the appropriate distribution. All other pa-
rameters are considered as certain and their numerical values are adopted from the DICE
model (Nordhaus 1994). We refer to a combination of four samples (one specific sam-
ple from each probability density function of the four uncertain parameters) as a single
state of the world (SOW). Taking NS samples from each distribution yields N = NS4
SOWs. We adopt the Latin-hypercube sampling technique outlined in Nordhaus and Popp
(1997) to define the SOW sets. Probability density functions of the parameters are di-
vided into NS intervals with equal probability mass. The expected value of the distribu-
tion over each interval provides the NS samples, with each SOW being equally likely. The
results of this sampling method are illustrated in Fig. 1 for NS = 7, corresponding to N= 2,401 SOWs. This sampling technique ensures that the mean value of the samples is
equal to the mean value of the distribution, but it neglects potential correlations between the
parameters.
4 The solution method
We determine a single policy that maximizes the expected utility defined in Equation (1).
We apply a numerical optimization method, since analytic solutions are not available for
this problem. The presence of a climate threshold in the DICE model can introduce non-
smooth gradients and local optima in the objective function (Keller et al. 2004). As a re-
sult, gradient based methods can result in severely biased results and global optimization
methods are required. Based on previous benchmark results (Moles et al. 2004) we imple-
ment the SRES algorithm (Runarsson and Yao 2000) to solve this non-convex and non-
linear global optimization problem. SRES is a genetic optimization algorithm that uses a
sequence of mutation and selection to improve an objective function. The algorithm starts
with an initial random population of trial vectors that are evaluated by the objective function.
Springer
32 Climatic Change (2008) 91:29–41
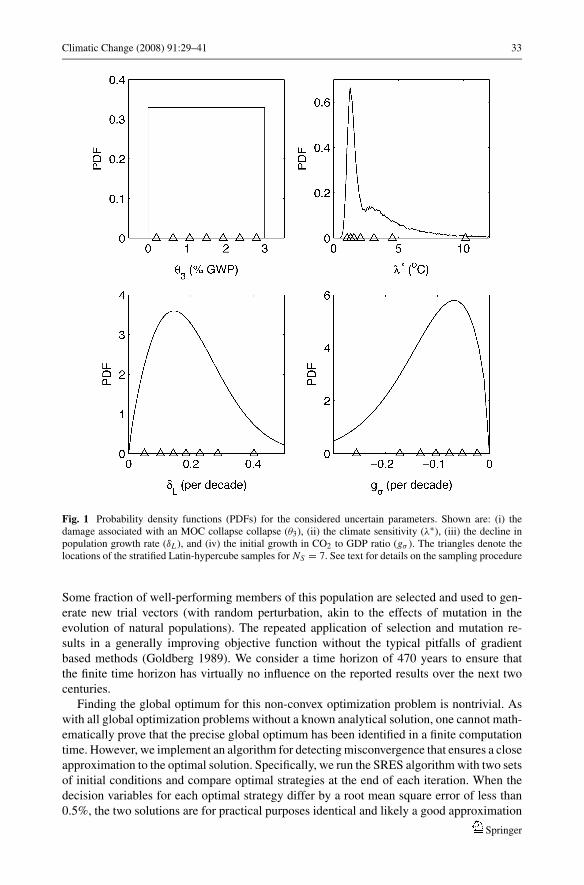
Fig. 1 Probability density functions (PDFs) for the considered uncertain parameters. Shown are: (i) thedamage associated with an MOC collapse collapse (θ3), (ii) the climate sensitivity (λ∗), (iii) the decline inpopulation growth rate (δL ), and (iv) the initial growth in CO2 to GDP ratio (gσ ). The triangles denote thelocations of the stratified Latin-hypercube samples for NS = 7. See text for details on the sampling procedure
Some fraction of well-performing members of this population are selected and used to gen-
erate new trial vectors (with random perturbation, akin to the effects of mutation in the
evolution of natural populations). The repeated application of selection and mutation re-
sults in a generally improving objective function without the typical pitfalls of gradient
based methods (Goldberg 1989). We consider a time horizon of 470 years to ensure that
the finite time horizon has virtually no influence on the reported results over the next two
centuries.
Finding the global optimum for this non-convex optimization problem is nontrivial. As
with all global optimization problems without a known analytical solution, one cannot math-
ematically prove that the precise global optimum has been identified in a finite computation
time. However, we implement an algorithm for detecting misconvergence that ensures a close
approximation to the optimal solution. Specifically, we run the SRES algorithm with two sets
of initial conditions and compare optimal strategies at the end of each iteration. When the
decision variables for each optimal strategy differ by a root mean square error of less than
0.5%, the two solutions are for practical purposes identical and likely a good approximation
Springer
33Climatic Change (2008) 91:29–41
to the global maximum. In case this approach does not lead to convergence, we switch to
another global optimization algorithm (Runarsson and Yao 2005). Solutions that still have
not converged with the second algorithm are discarded and the process is reinitialized with
a new random initial population. This procedure is continued until the convergence criteria
is satisfied. The model code is available upon request.
5 Analyzed strategies
We compare three strategies: (i) business-as-usual (BAU), (ii) unconstrained optimal, and
(iii) reliability constrained optimal. For BAU, carbon emissions remain unabated. This is
implemented by setting abatement (μ) to zero and optimizing utility (Equation 1) as a function
of relative investment (I/Q) only. For the unconstrained optimal policy, we maximize the
objective function by choosing μ and I/Q. Abatement is set to zero between 1965 and
1995, to reflect past policies, and BAU investment values are used for these times. Reliability
constrained optimal policies maximize the expected utility with the additional constraint to
keep the odds of triggering an MOC collapse below a specified level. This is implemented
by introducing a penalty to the objective function when the odds of an MOC collapse exceed
the specified reliability.
6 Results and discussion
6.1 Effects of sampling resolution
Previous studies analyzing related decision problems use relatively low resolutions for the
SOW sampling, ranging on the order of 100 to 102 samples (e.g., Chao 1995; Yohe 1996;
Zickfeld and Bruckner 2003; Bruckner and Zickfeld 2004; Keller et al. 2004). For a nonlinear
system, such low resolutions can introduce considerable biases (Tol 2003). Here we evaluate
these biases for a subset of the uncertain parameters and model structure. To this end, we
compare optimal strategies estimated at different resolutions to identify when further resolu-
tion increases have negligible effects. In each case, NS samples of each uncertain parameter
are taken, leading to NS4 SOWs. Figure 2 illustrates the unconstrained optimal abatements
when one (circles), seven (squares), and 15 (stars) samples of each uncertain parameter are
taken. Note that the linear increase in samples per model parameter (NS) results in a geomet-
ric growth of the number of SOWs (following N = NS4) and the approximate computational
requirements. Solving the optimal control problem for NS = 15 implies N = 50,625 SOWs
and requires approximately 16 hours on a high performance computer cluster (8 nodes with
dual 2.4 GHz processors).
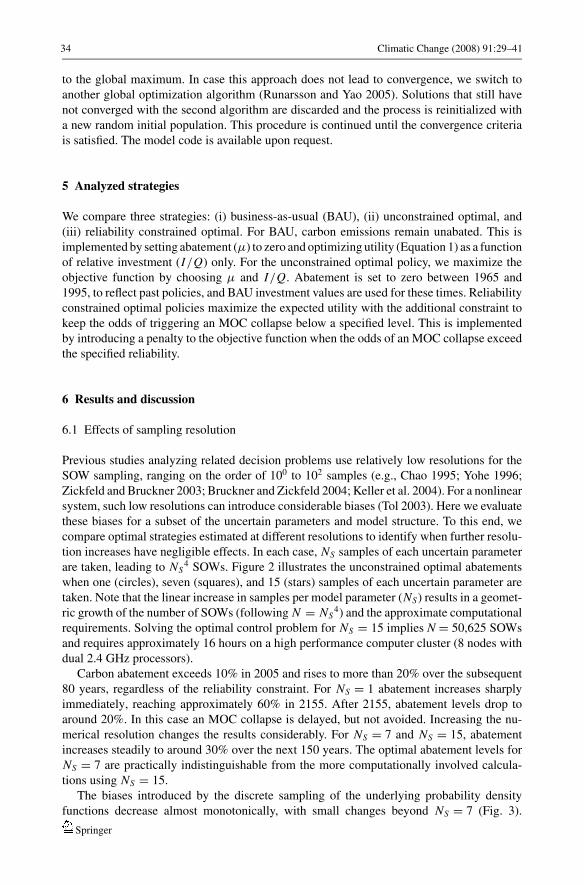
Carbon abatement exceeds 10% in 2005 and rises to more than 20% over the subsequent
80 years, regardless of the reliability constraint. For NS = 1 abatement increases sharply
immediately, reaching approximately 60% in 2155. After 2155, abatement levels drop to
around 20%. In this case an MOC collapse is delayed, but not avoided. Increasing the nu-
merical resolution changes the results considerably. For NS = 7 and NS = 15, abatement
increases steadily to around 30% over the next 150 years. The optimal abatement levels for
NS = 7 are practically indistinguishable from the more computationally involved calcula-
tions using NS = 15.
The biases introduced by the discrete sampling of the underlying probability density
functions decrease almost monotonically, with small changes beyond NS = 7 (Fig. 3).
Springer
34 Climatic Change (2008) 91:29–41
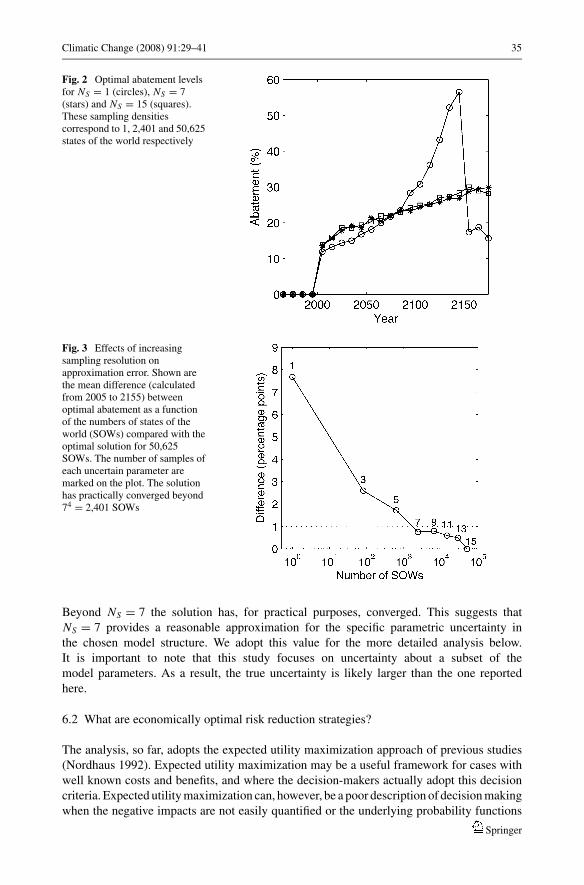
Fig. 2 Optimal abatement levelsfor NS = 1 (circles), NS = 7(stars) and NS = 15 (squares).These sampling densitiescorrespond to 1, 2,401 and 50,625states of the world respectively
Fig. 3 Effects of increasingsampling resolution onapproximation error. Shown arethe mean difference (calculatedfrom 2005 to 2155) betweenoptimal abatement as a functionof the numbers of states of theworld (SOWs) compared with theoptimal solution for 50,625SOWs. The number of samples ofeach uncertain parameter aremarked on the plot. The solutionhas practically converged beyond74 = 2,401 SOWs
Beyond NS = 7 the solution has, for practical purposes, converged. This suggests that
NS = 7 provides a reasonable approximation for the specific parametric uncertainty in
the chosen model structure. We adopt this value for the more detailed analysis below.
It is important to note that this study focuses on uncertainty about a subset of the
model parameters. As a result, the true uncertainty is likely larger than the one reported
here.
6.2 What are economically optimal risk reduction strategies?
The analysis, so far, adopts the expected utility maximization approach of previous studies
(Nordhaus 1992). Expected utility maximization may be a useful framework for cases with
well known costs and benefits, and where the decision-makers actually adopt this decision
criteria. Expected utility maximization can, however, be a poor description of decision making
when the negative impacts are not easily quantified or the underlying probability functions
Springer
35Climatic Change (2008) 91:29–41
are deeply uncertain (Bradford 1999; Lempert 2002). Decision problems that arguably fall
into these categories include the design of dikes, water reservoirs and nuclear power stations.
Such problems are often solved by imposing a reliability constraint on the accepted odds of
failure (Ouarda and Labadie 2001; van Manen and Brinkhaus 2005). Here we analyze how a
reliability constraint on the odds of avoiding an MOC collapse affects the timing and extent
of CO2 abatement.
The odds for an MOC collapse over the next 150 years (based on the proportion of
SOWs where an MOC collapse is triggered in the model) exceed 1 in 3 for the BAU pol-
icy (Fig. 4b). Optimal reductions of CO2 emissions without a reliability constraint do not
considerably decrease these odds. The fact that the optimal policy in this model consider-
ing published estimates of economic damages of climate change (including damages due
to an MOC collapse) results in considerable odds of an MOC collapse is in contrast to
previous results and warrants some discussion. Nordhaus (1994, p. 115) considers the ef-
fects of a climate catastrophe (with economic impacts in the tens of percent of GWP) on
optimal climate policy for a single SOW. In this case, the optimal policy without param-
eter uncertainty is to avoid the catastrophe. Keller et al. (2004) show that much smaller
damages (less than 2% of GWP) results in an optimal policy that avoids an MOC collapse
for a single SOW. Considering parametric uncertainty in the model of Keller et al. (2004)
results in lower optimal abatement levels. The current study considers a more thorough
representation of parametric uncertainty. Compared to Keller et al. (2004), the increased
odds of an MOC collapse are due to two reasons. First, we consider a wider range in the
sample of the climate sensitivity. The higher climate sensitivity results in a lower critical
CO2 level (Stocker and Schmittner 1997). Second, we consider uncertainty in factors af-
fecting business-as-usual emissions, such as population growth rate. As a result, a certain
abatement strategy generates an uncertain CO2 trajectory. The current results are generally
consistent with the previously observed effects of parameter uncertainty in this decision
problem (Keller et al. 2004). We hypothesize that improving some of the known shortcom-
ings of the DICE model (e.g., the static representation of the technology for reducing CO2
emissions (Keller et al. 2003) and the use of a relatively high rate of social time preference
that decreases the importance of future climate change impacts (Nordhaus 1994)) would
result in higher CO2 abatement and lower odds of triggering an MOC collapse in the optimal
policy.
One might ask how much CO2 abatement is required to significantly reduce the odds
for an MOC collapse? Decreasing the odds of an MOC collapse to 1 in 10 increases
the (constrained) optimal abatement to approximately 80% in the next 60 years (Fig. 4a).
Decreasing these odds further to 1 in 20 or 1 in 100 is possible (in the framework
of the model), but requires higher and more expensive abatement. A reliability con-
straint of 1 in 100 implies almost 90% abatement in the next 40 years. Whether such a
rapid and almost complete decarbonization of the global economy is feasible is an open
question.
Parametric uncertainty translates into predictive uncertainty. This is illustrated in Fig. 5 for
BAU, the unconstrained optimal policy, and the reliability constrained optimal policy with
odds for an MOC collapse of 1 in 10. Emissions increase substantially between 2055 and 2105
for the BAU and optimal policies (Fig. 5a,b); the mean value of emissions increases from
24 Gt C a−1 to 38 Gt C a−1 for BAU and from 19 Gt C a−1 to 28 Gt C a−1 for the optimal policy.
In contrast, the optimal reliable policy results in mean CO2 emissions of 5.7 Gt C a−1 in 2055
and 2.8 Gt C a−1 in 2105. The differences in CO2 emissions drive differences in atmospheric
CO2 concentrations (Fig. 5 c,d). Between 2055 and 2105, mean CO2 concentrations increase
from 560 ppm to 850 ppm for the BAU policy, and from 520 ppm to 725 ppm for the optimal
Springer
36 Climatic Change (2008) 91:29–41
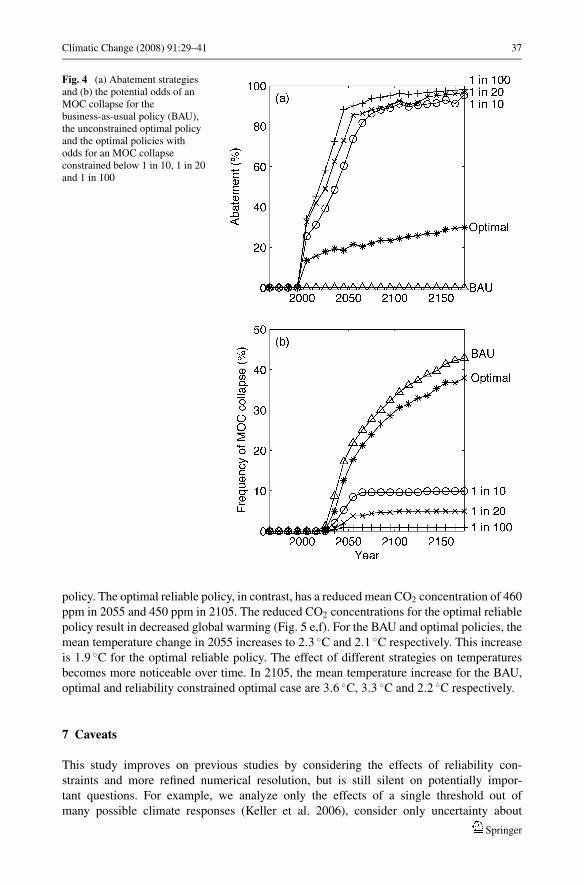
Fig. 4 (a) Abatement strategiesand (b) the potential odds of anMOC collapse for thebusiness-as-usual policy (BAU),the unconstrained optimal policyand the optimal policies withodds for an MOC collapseconstrained below 1 in 10, 1 in 20and 1 in 100
policy. The optimal reliable policy, in contrast, has a reduced mean CO2 concentration of 460
ppm in 2055 and 450 ppm in 2105. The reduced CO2 concentrations for the optimal reliable
policy result in decreased global warming (Fig. 5 e,f). For the BAU and optimal policies, the
mean temperature change in 2055 increases to 2.3 ◦C and 2.1 ◦C respectively. This increase
is 1.9 ◦C for the optimal reliable policy. The effect of different strategies on temperatures
becomes more noticeable over time. In 2105, the mean temperature increase for the BAU,
optimal and reliability constrained optimal case are 3.6 ◦C, 3.3 ◦C and 2.2 ◦C respectively.
7 Caveats
This study improves on previous studies by considering the effects of reliability con-
straints and more refined numerical resolution, but is still silent on potentially impor-
tant questions. For example, we analyze only the effects of a single threshold out of
many possible climate responses (Keller et al. 2006), consider only uncertainty about
Springer
37Climatic Change (2008) 91:29–41
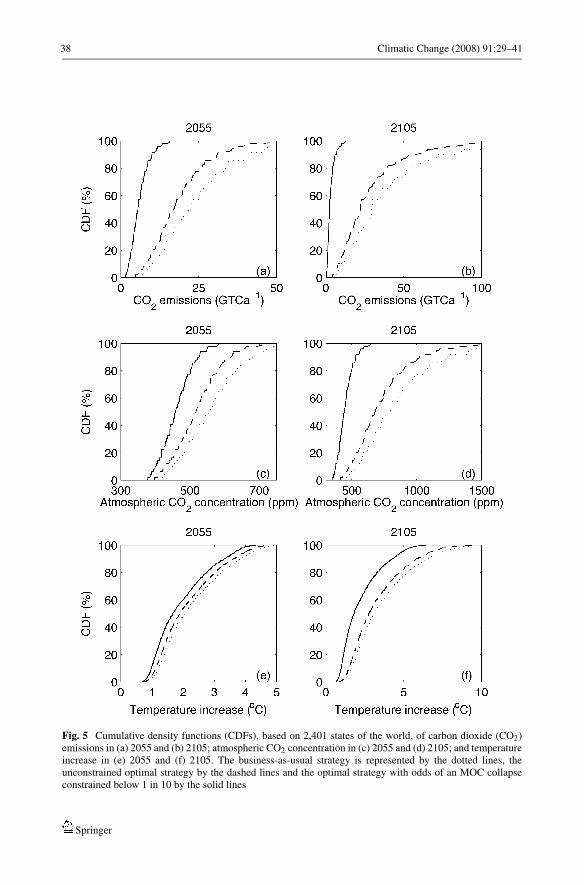
Fig. 5 Cumulative density functions (CDFs), based on 2,401 states of the world, of carbon dioxide (CO2)emissions in (a) 2055 and (b) 2105; atmospheric CO2 concentration in (c) 2055 and (d) 2105; and temperatureincrease in (e) 2055 and (f) 2105. The business-as-usual strategy is represented by the dotted lines, theunconstrained optimal strategy by the dashed lines and the optimal strategy with odds of an MOC collapseconstrained below 1 in 10 by the solid lines
Springer
38 Climatic Change (2008) 91:29–41
a subset of the model parameters, and neglect structural uncertainty, stochastic vari-
ability, and the distinct possibility that we may learn in the future (Kelly and Kolstad
1999).
The issue of structural uncertainty can be illustrated by the adopted choice of a single
MOC model (Stocker and Schmittner 1997). As discussed in Cubasch and Meehl (2001), the
MOC varies widely across model implementations. Several models (e.g. Latif et al. 2000)
suggest the existence of stabilizing feedbacks that result in a basically insensitive MOC.
Which MOC model is a more appropriate description of reality is currently deeply uncertain
(Cubasch and Meehl 2001). This structural uncertainty could be represented by a Bayesian
Model Averaging approach (Hoeting et al. 1999). Assuming a binary mixture of the adopted
sensitive MOC model (Stocker and Schmittner 1997) and a member of the insensitive MOC
models (Latif et al. 2000) with ignorant priors (p = 0.5 for both) would reduce the reported
odds of triggering an MOC collapse by a factor of two. Future observations have a strong
potential to reduce uncertainty about the MOC sensitivity (Keller et al. 2005; Baehr et al.
2007).
8 Conclusion
We examine the effect of parametric uncertainty and the potential for an MOC collapse in
an economic optimal growth model. We expand on previous studies by considering (i) the
effects of a reliability constraint, (ii) a larger number of uncertain parameters, and (iii) a more
realistic numerical resolution.
A business-as-usual strategy results in considerable odds of an MOC collapse (exceeding
1 in 3 in the next 150 years in this simple model). An unconstrained optimal policy does not
reduce these odds considerably. Reducing these odds to 1 in 10 requires an almost complete
decarbonization (greater than 80%) over the next 60 years. A further reduction to 1 in 100
reduces this decarbonization time scale to 40 years.
Acknowledgements We thank Brian Tuttle, Alex Robinson and Robert Lempert (as well as the anonymousreviewers) for helpful inputs. Thomas Runarsson provided the source code for the SRES algorithms. Supportfrom the National Science Foundation (SES #0345925) is gratefully acknowledged. Any opinions, findingsand conclusions or recommendations expressed in this material are those of the authors and do not necessarilyreflect the views of the funding entity.
Appendix 1: List of symbols
Symbol Definition
BAU Business-as-usual
CO2 Carbon dioxide
c Per capita consumption per year
δL Decline in population growth rate
GDP Gross domestic product
GWP Gross world product
gσ Initial growth in CO2-GDP ratio
I Gross investment
L Population
Springer
39Climatic Change (2008) 91:29–41
Symbol Definition
λ∗ Climate sensitivity
μ CO2 abatement relative to the BAU scenario
N Number of SOWs
NS Number of samples of each uncertain parameter
Q GWP
ρ Pure rate of social time preference
SOW State of the world
s SOW index
t Time
t0 Start of considered time horizon
t∗ End of considered time horizon
θ3 Threshold specific fractional economic damage
U Flow of utility
U ∗ Discounted sum of utility
References
Alley RB, Marotzke J, Nordhaus WD, Overpeck JT, Peteet DM, Pielke RA, Pierrehumbert RT, Rhines PB,Stocker TF, Talley LD, Wallace JM (2003) Abrupt climate change. Science 299:2005–2010
Andronova NG, Schlesinger ME (2001) Objective estimate of the probability density function for climatesensitivity. Journal of Geophysical Research 106:22.605–22.612
Baehr J, Keller K, Marotzke J (2007) Detecting potential changes in the meridional overturning circulation at26◦N in the atlantic. Climatic Change, 10.1007/s10584-006-9153-z, this issue
Bradford DF (1999) On the uses of benefit-cost reasoning in choosing policy toward global climate change.Discounting and intergenerational equity, Resources for the Future pp 37–44
Bruckner T, Zickfeld K (2004) Low risk emissions corridors for safeguarding the Atlantic thermohalinecirculation. Greenhouse Gas Emissions and Abrupt Climate Change: Positive Options and Robust policiesParis
Chao HP (1995) Managing the risk of global climate catastrophe: An uncertainty analysis. Risk Analysis15:69–78
Cubasch U, Meehl GA (2001) Climate Change – The scientific basis. Contribution of working group I of thethird assessment report of the Intergovernmental Panel on Climate Change, Chapter Projections of futureclimate change, Cambridge University Press, pp 526–582
Goldberg DE (1989) Genetic Algorithms in Search, Optimization, and Machine Learning. Addison-WesleyLongman Publishing Company, Inc
Hoeting JA, Madigan D, Raftery AE, Volinsky CT (1999) Bayesian model averaging: A tutorial. StatisticalScience 14(4):382–401
Keller K, Bolker BM, Bradford DF (2004) Uncertain climate thresholds and optimal economic growth. Journalof Environmental Economics and Management 48:723–741
Keller K, Hall M, Kim SR, Bradford DF, Oppenheimer M (2005) Avoiding dangerous anthropogenic inter-ference with the climate system. Climatic Change 73:227–238
Keller K, Hall MG, Yang Z, Bradford DF (2003) Carbon dioxide sequestration: When and how much? Centerfor Economic Policy studies, Working paper No. 94. Available at: http://www.princeton.edu/∼ceps
Keller K, Tan K, Morel FMM, Bradford DF (2000) Preserving the ocean circulation: Implications for climatepolicy. Climatic Change 47:17–43
Keller K, Yohe G, Schlesinger M (2006) Managing the risks of climate thresholds: Uncertainties and neededinformation. Climatic Change, 10.1007/s10584-006-9114-6, this issue
Kelly DL, Kolstad CD (1999) Bayesian learning, growth and pollution. Journal of Economic Dynamics andControl 23:491–518
Latif M, Roeckner E, Mikolajewski U, Voss R (2000) Tropical stabilization of the thermohaline circulation ina greenhouse warming simulation. Journal of Climate 13:1809–1813
Springer
40 Climatic Change (2008) 91:29–41
Lempert RJ (2002) A new decision sciences for complex systems Proceedings of the National Academy ofSciences of the United States of America 99:7309–7313
Link PM, Tol RSJ (2004) Possible economic impacts of a shutdown of the thermohaline circulation: Anapplication of FUND. Portugese Economic Journal 3:99–114
Moles CG, Banga JR, Keller K (2004) Solving nonconvex climate control problems: Pitfalls and algorithmperformances. Applied Soft Computing 5:35–44
Nordhaus WD (1992) An optimal transition path for controlling greenhouse gases. Science 258:1315–1319Nordhaus WD (1994) Managing the global commons: The economics of climate change. The MIT press,
Cambridge, MassachusettsNordhaus WD, Popp D (1997) What is the value of scientific knowledge? An application to global warming
using the PRICE model. Energy Journal 18(1):1–45Ouarda TBMJ, Labadie JW (2001) Chance-constrained optimal control for multireservoir system optimization
and risk analysis. Stochastic Environmental Research and Risk Assessment 15:185–204Ramsey F (1928) A mathematical theory of saving. Economic Journal 37:543–559Runarsson TP, Yao X (2000) Stochastic ranking for constrained evolutionary optimization. IEEE Transactions
on Evolutionary Computation 4(3):284–294Runarsson TR, Yao X (2005) Search biases in constrained evolutionary optimization – Part C: Applications
and reviews. IEEE Transactions on Systems, Man and Cybernetics 35(2):233–243Schneider SH, Thompson SL (1981) Atmospheric CO2 and climate – importance of the transient response.
Journal of Geophysical Research 86:NC4 3135–3147Stocker TF, Schmittner A (1997) Influence of CO2 emission rates on the stability of the thermohaline circu-
lation. Nature 388:862–865Tol RSJ (2003) Is the uncertainty about climate change too large for expected cost-benefit analysis? Climatic
Change 56(3):265–289Toth FL, Bruckner T, Fussel H-F, Leimbach M, G P-H, Schnellnhuber H (1997) The tolerable windows
approach to integrated assessments. Proceedings of the IPCC Asia-Pacific Workshop on integrated as-sessment models (IAMs)
van Manen SE, Brinkhaus M (2005) Quantitative flood risk assessment for polders. Reliability engineering &system safety 90:229–237
Vellinga M, Wood RA (2002) Global climatic impacts of a collapse of the Atlantic thermohaline circulation.Climatic Change 54(3):251–267
Yohe G (1996) Exercises in hedging against extreme consequences of global change and the expected valueof information. Global Environmental Change 6:87–101
Zickfeld K, Bruckner T (2003) Reducing the risk of abrupt climate change: Emissions corridors preservingthe Atlantic thermohaline circulation. Integrated Assessment 4:106–115
Springer
41Climatic Change (2008) 91:29–41