Embed Size (px)
Citation preview
8 3 Economic Well Being
CHAPTER - 5
Economic Well Being
I. Introduction1. In the early development literature economic
development was defined in terms of growth of total orper capita income. Limitations of this approach soonbecame evident and the concept of development wasgradually broadened to include other aspects of wellbeing. Today, the concept of human development hasdethroned per capita income as a measure ofdevelopment from the high pedestal it enjoyed earlier.Human development does not ignore the importance ofeconomic growth, but looks at it not as the end but onlyas a means for human development. As the HumanDevelopment Report 1996 observes policy makers shouldnot be ‘mesmerized by the quantity of economic growth.’They need to be more concerned with the structure andquality of growth.
2. However, it has to be recognized that economicgrowth is an essential pre-requisite for humandevelopment as higher income levels are required tomeet the basic physical and social needs of the people,increase their access to educational and health facilitiesand generate higher revenues to the government forinvestment in economic and social infrastructure. Thus,economic growth enlarges the freedom of choice bothfor the individual and the society. But how these choicesare exercised and their outcome on human developmentwould depend on the decisions of individual householdsand the government.
3. The outcomes of economic growth in terms ofhuman development depend on a number of factors likethe pace, pattern and structure of growth. A process ofspatially widespread, employment intensive and sociallyequitable economic growth is more conducive for humandevelopment. Unless governments take timely correctivemeasures, economic growth can become lop-sided andflawed. Deliberate intervention is required to see thatthe benefits of growth are equitably shared and growthdoes not lead to increased misery and joblessness fordifferent sections of the people. Economic growth is,thus, a necessary but not a sufficient pre-condition forhuman development. The focus of the policy makers,therefore, must be on strengthening the links betweeneconomic growth and human development.
4. Thus, both priory reasoning and empiricalanalysis establish that economic growth and humandevelopment are interlinked processes (see Singh et. al.2006). But there happen to be situations where there islack of convergence between economic growth and
human development. For a good number of countriesthe human development index does not match theincome rankings. Many countries with relatively higherlevel of income show lower levels of human development.On the other hand, some countries rank high in humandevelopment index despite low per capita income, e.g.Sri Lanka. Similar situations are observed at the statelevel in India. Punjab and Kerala provide the classic case.Kerala has a much higher level of human developmentas compared to Punjab, although its per capita incomeis much lower than Punjab.
5. In a more conducive social environment, whereparents and society place higher valuation on education,one can have a better human development status.Uttaranchal, the former hill region of UP is an example.The region scored much better in human developmentindicators than the other regions of UP. On the otherhand, in societies and regions where strong gender biasexists due to economic and socio-cultural values as inPunjab, Haryana, West UP, human developmentindicators for women are likely to be depressedirrespective of the higher income levels.
6. UP presents a dismal scenario with regard toeconomic growth as well as human development. In fact,a vicious circle is operating in the state where low incomelevels and slow economic growth keep the attainmentin human development levels low, while poor humandevelopment status acts as a constraint on rapideconomic progress and restricts participation of the largemasses in the development process.
7. It is in this context, the present chapter givesan overview of the structure and growth of income andemployment levels in Uttar Pradesh and focuses on thelevels of poverty and unemployment. In view of the largesize of the state and prevalent disparities in economicconditions at regional and district level the analysis iscarried out at the disaggregated levels depending ondata availability. The chapter is divided into six sectionsincluding the introduction. Section II deals with incomelevels and economic growth at the state, regional anddistrict levels. Section III discusses the growth andstructure of employment and shifts in work forcestructure. Section IV analyses the poverty trends in thestate and the associated factors, while Section V dealswith unemployment situation. Government programmesfor poverty reduction and employment generation arealso reviewed briefly in these sections. The concludingsection makes suggestions for meeting the challenge ofrapid growth with employment generation in the state.

8 4Human Development Report, Uttar Pradesh
II. Income Levels and Growth8. The trends in the total and per capita Gross
State Domestic Product (GSDP), are the mostcomprehensive measure of the level of economicactivities in the state. It measures the value of thetotal final output of goods and services produced inthe various sectors of the economy like agriculture,industry, trade, transport, services, etc. Net StateDomestic Product (NSDP) refers to the total value offinal output minus the depreciation of capital in theprocess of production.
9. Economic activities are usually classified intothree broad sectors, namely, primary sector, secondarysector and tertiary sector. Primary Sector includesactivities like agriculture, animal husbandry, forestry,fishing and mining. Secondary Sector includesmanufacturing, construction and electricity, gas andwater supply. Tertiary Sector includes services liketransport, warehousing and communications, trade,hotels, banking, insurance, ownership of property, publicadministration and other social and domestic services.
10. Growth rate in SDP in U.P., which hadremained extremely sluggish during the first four FiveYear Plan periods, started picking up since the FifthPlan period and caught up with the national growthrate in the Sixth and the Seventh plan period, whenU.P recorded growth rate of over 5 per cent per annum.However, since the beginning of the nineties growthrate in U.P. dropped significantly. It affected all thesectors of the state economy. GSDP in U.P. increased atthe rate of around 4 per cent per annum during theperiod from 1993-94 to 2004-05. Trend growth duringthe period was only 2.0% per annum in case of primary
sector, and around 4.4% in case of the secondary sectorand 4.7% in case of the tertiary sector. Slow growth ofthe economy was coupled with large fluctuations ingrowth rate in all the sectors of the economy, largelyemanating from the fluctuations in the agriculturaloutput (see Figure 5.1).
11. Among the major factors responsible fordeceleration of growth rates in U.P. are the decliningpublic investments due to the creeping fiscal crisis andthe inability to attract investment from outside due tothe poor state of infrastructure particularly power shortage.
12. However, some upward trend in the growth rateof GSDP in U.P. is discernible during Tenth plan period asboth public and private investment has picked up. Thus,the growth rate of U.P. economy works out to 5.3 percent during Tenth Plan as compared to a growth rate of7.3 per cent as all India level during the same period.
13. The growth rate of the U.P. economy hasremained markedly below that of the country as a wholethroughout the planning period, resulting into everwidening divergence between the national and the stateper capita income. Thus, per capita income of U.P., whichwas almost equal to the national average at the beginningof the planning period, is now almost half of that.However, the rate of growth in per capita income ofthe state works out to 3.3 per cent during Tenth planperiod as compared to corresponding growth rate of 6.0per cent at all India level.
14. The relatively slow growth of the state economyis a matter of serious concern for the state and nationallevel planners. Growth rates have to be substantiallyimproved in the lagging states like U.P. to deal with theproblem of poverty and poor living conditions. This would
Figure 5.1 : Region wise Net Per Capita DomesticProduct, 2004-05 (at Current prices)
8000 10000 12000 14000 16000
PC
ND
P

8 5 Economic Well Being
require a big push to investment levels in the state, whichwill not be possible without larger transfers from thecentre and higher investment from the private sector.
15. The sectoral composition of state income hasundergone significant changes during the planningperiod. Thus, the primary sector’s share in GSDP has comedown from nearly 60 per cent in 1950-51 to around 42per cent in 1993-94. It presently stands at around 35.8per cent against the national figure of 22.0 per cent.The slower growth of the primary sector as compared tothe non-primary sector has led to increasing disparity inthe per capita income in the two sectors.
Regional Differentials in Per Capita Income16. The low per capita income in the state conceals
sharp differentials at the regional and the state level.Western region of the state is relatively more prosperousas compared with the other regions, while Eastern regionis the poorest, Central region and Bundelkhand fallingin the middle category (Figure 5.1). Per capita NDDP ofWestern region is about 70 per cent higher than that ofEastern region. The difference is only around 10 per centin case of the other regions.
17. The income differentials are even sharper atthe district level. Per capita Net District Domestic Product
(NNDP) in 2004-05 ranged from a low of Rs.5,687 inShrawasti district to Rs.34,709 in Gautam Budh Nagardistrict, i.e. a difference of nearly 7 times (AppendixTable 5.1). Only one district of the state, namely, GautamBudh Nagar had per capita income higher than thenational average.
18. Table 5.1 arranges districts in order of percapita NDDP. Out of the 14 districts in the top quartile8 districts belong to Western region, 2 to Central region,2 to Eastern region and 2 to Bundelkhand. On the otherhand, all the 14 districts in the bottom quartile in termsof per capita income fall in Eastern region.
19. The disparities in case of manufacturing sectorare much higher as compared to the primary and thetertiary sector as revealed by the coefficient of variationin per capita NDDP (Figure 5.2). Over time disparitieshave slightly narrowed in case of the manufacturingsector and have slightly widened in case of the primarysector, but have remained more or less constant in caseof tertiary sector as well as total NDDP per capita.
Growth Rates of NDDP20. Growth rates of income at regional and district
levels have been calculated for two periods, i.e. 1980-81 to 1996-97 and 1993-94 to 2004-05. In the first periodthe pattern of regional development was more balanced
Table 5.1: Districts arranged in Descending order of Per Capita NDDP, 2004-05
First Quartile Second Quartile Third Quartile Fourth Quartile Fifth Quartile
R R R R R
A A A A A
N N N N N
K Districts K Districts K Districts K Districts K Districts
1 Gautambuddha nagar 15 Muzaffarnagar 29 Unnao 43 Rae Bareli 57 Faizabad
2 Lucknow 16 Mathura 30 Kanpur Dehat 44 Sitapur 58 Maharaj Ganj
3 Bagpat 17 Agra 31 Barabanki 45 Gorakhpur 59 Basti
4 Buland Shahar 18 Kannauj 32 Kheri 46 Hardoi 60 Ambedkar Nagar
5 Jyotiba phule nagar 19 Bijnor 33 Etah 47 Mau 61 Azamgarh
6 Sonbhadra 20 Farrukhabad 34 Moradabad 48 Banda 62 Kushi Nagar
7 Jhansi 21 Aligarh 35 Kaushambi 49 Mirzapur 63 Sant kabir nagar
8 Saharanpur 22 Etawah 36 Allahabad 50 Fatehpur 64 Ghazipur
9 Kanpur Nagar 23 Firozabad 37 Shahjahanpur 51 Sultanpur 65 Jaunpur
10 Meerut 24 Bareilly 38 Mainpuri 52 St.Ravi Das Nagar 66 Ballia
11 Jalaun 25 Lalitpur 39 Auraiyya 53 Gonda 67 Deoria
12 Mahoba 26 Rampur 40 Chandauli 54 Bahraich 68 Pratap Garh
13 Hathras 27 Hamirpur 41 Varanasi 55 Chitrakoot 69 Siddharth Nagar
14 Ghaziabad 28 Pilibhit 42 Badaun 56 Balrampur 70 Shrawasti

8 6Human Development Report, Uttar Pradesh
Source: Economics and Statistics Division, State Planning Institute, U.P.
Map 5.1
Rs.7500Rs.7500 - Rs.10000Rs.10000 - Rs.15000Rs.15000 - Rs.20000Rs.20000
UTTAR PRADESH
(BELOW)
(AND ABOVE)
U.P.
Sahranpur
Muzaffar Nagar Bijnore
Moradabad
MeerutBaghpat
Rampur
PilibhitBareilly
Ghaziabad
Budaun
Bulandshahar
ShahjahanpurAligarh Bahraich
Sitapur
Hardoi
Mathura
Farrukhabad
EtahShravasti
GondaBarabanki
Hathras
AgraMainpuri
Firozabad
Balarampur
LucknowUnnao
Kannauj
Etawah
Maharajganj
Basti GorakhpurFaizabad
SultanpurRaebareli
Deoria
Auraiya
Azamagarh mauFatehpur
Jalaun
Hamirpur
Ballia
Jaunpur
Pratapgarh
Jhansi GhazipurKaushambi
Chitrakoot
Banda
Allahabad
VaranasiMahoba
Lalitpur
ChandauliMirzapur
Sonbharda
GB. Nagar
JP Nagar
Lakhimpur
KanpurKanpur
Siddharth
SK Nagar
Ambedkar
Kushi Nagar
SR Nagar
Kheri
DehatNagar
Nagar
Nagar
16575
15228 14088
11392
18166
1616119130
12333
1228112608
15351
10189
1874934709
10995
1157712824
8220
9494
9272
14972
13345
115545682
822111640
15497
14870 1081412608
7724
20811
6202
12186
16177
14153
126106799
7425
67537341
94567662
89199689
641311854
10607
6916
6887 92139030
15814
12312
6508
6618
6328
16598 669511191
7929
9116
11081
10425873015586
12600
105799110
16798
CATEGORIES
- 11477
Per Capita Net District Domestic Product at Current Prices, 2004-05 (in Rs.)
Tertiary Sector
All Sectors
Figure 5.2 : Trends in Disparities in Per Capita NDDP(at Current prices)

8 7 Economic Well Being
with all the four regions growing at a growth rate ofaround 4 per cent per annum (Table 5.2). Economicgrowth during this period was led by agricultural sectorgrowth and spread of green revolution technology todifferent regions of the state. In the second periodgrowth has become regionally more concentrated.Eastern and Western regions show a slower growth inthis period, while Central U.P. and Bundelkhand improvedtheir performance. The differences in per capita incomegrowth are also much sharper in the latter period.Bundelkhand and Central U.P. showing betterperformance than the other two regions.
Table 5.2: Annual Compound Growth Rate of Total Per Capita Net Regional DomesticProduct since 1980-81 (Per cent)
Total Per CapitaNet Regiona Domestic Product Net Regional Domestic Product
Region 1980-81 to 1996-97 1993-94 to 2004-05 1980-81 to 1996-97 1993-94 to 2004-05
Western Region 4.2 3.8 1.8 1.5Central Region 4.3 4.6 2.1 2.3Eastern Region 4.2 3.9 2.0 1.6Bundel Khand Region 4.0 5.2 1.8 3.2Uttar Pradesh 4.2 4.0 1.8 1.8
Source: Economics and Statistics Division, State Planning Institute, U.P.
Map 5.2
Source: Economics and Statistics Division, State Planning Institute, U.P.
21. At the district level, however, differences ingrowth rate of income are quite marked ranging from anegative growth of 0.6 per cent per annum in Varanasito a growth rate of 7.6 per cent in Mirzapur (Appendix5.2). Mirzapur, Lucknow, Jalaun, Firozabad, Farrukhabadand Kanpur Nagar are the fastest growing districts of thestate registering an annual growth of over 6 per cent perannum. On the other hand, very low growth rate of lessthan 2 per cent per annum were registered in the districtsof Fatehpur, Sonbhadra, Sultanpur, Kanpur Dehat andGonda, while Varanasi registered a negative growth.Within all regions and sectors considerable differencesin growth rates are noticeable at the district level.
-2.002.00 - 3.003.00 - 4.004.00 - 5.005.00
UTTAR PRADESH
(BELOW)
(AND ABOVE)
Sahranpur
Muzaffar Nagar Bijnore
MeerutBaghpat
Rampur
PilibhitBareilly
Ghaziabad
BudaunBulandshahar
ShahjahanpurAligarh Bahraich
Sitapur
Hardoi
Mathura
Farrukhabad
Etah Shravasti
GondaBarabanki
Hathras
Agra MainpuriFirozabad
Balarampur
LucknowUnnao
Kannauj
EtawahKushi Nagar
Maharajganj
BastiGorakhpurFaizabad
SultanpurRaebareliDeoria
Auraiya
Azamagarh mauFatehpur
Jalaun
HamirpurBallia
JaunpurPratapgarh
Jhansi GhazipurKaushambi
Chitrakoot
BandaAllahabad
VaranasiMahoba
Lalitpur
ChandauliMirzapur
Sonbharda
G. B. Nagar
J.P Nagar
S. R. Nagar
Kanpur
Kanpur
Lakhimpur
Siddharth
S.K. Nagar
Ambedkar
Moradabad
Data not available
Dehat
Nagar
Kheri
Nagar
Nagar
CATEGORIES
Percent
PercentPercentPercentPercent
U.P.- 4.05
3.68
2.84 2.37
3.57
2.76
3.39
3.433.64
4.75
3.15
4.31
2.39
4.15
5.23
4.28
3.59
4.56
3.25
5.14
4.34
5.533.124.26 3.624.70
6.42
4.21
5.11
6.67
4.80
1.43
3.964.684.09
4.664.483.081.10
2.812.70
2.457.19
5.362.60
3.232.99
5.72 2.762.41
4.84 2.67
6.16
7.99
3.26
Annual Compound Growth Rate of Net District Domestc Product

8 8Human Development Report, Uttar Pradesh
Sectoral Growth Rates22. To understand the dynamics of growth we have
to look at the sectoral growth rates. Bundelkhand showsa balanced pattern of economic growth with all thesectors registering relatively higher growth rates duringthe period from 1993-94 to 2004-05. Bundelkhand comesout as the best performing region in terms of primarysector growth, which have been contributed by growthof irrigation and diversification of agriculture in favour
Source: Economics and Statistics Division, State Planning Institute, U.P.
of horticulture crops in the region. On the other hand,Eastern region registered very low growth rates of theprimary sector. Agriculture in this region is constrainedby the predominance of very small and marginal holdings,recurring floods in some parts and inadequate supportin terms of credit facilities and poor rural infrastructure.Inter-regional differences in growth rates are quite sharpin case of the primary and secondary sector, but thetertiary sector shows a regionally more even pattern ofgrowth (Figure 5.3).
Figure 5.3: Compound Annual Growth rate in Sectoral Net Regional
Domestic Product : 1993-94 to 2004-05 (%)
0
1
2
3
4
5
6
Prim
ary
Sec
onda
ry
Terti
ary
ND
DP
Regions
CA
GR
(%)
Western Region Central Region Eastern Region Bundelkhand Uttar Pradesh
Map 5.3
10.0010.00 - 20.0020.00 - 30.0030.00
UTTAR PRADESH
(BELOW)
(AND ABOVE)
U.P.
Sahranpur
Muzaffar Nagar Bijnore
Moradabad
MeerutBaghpat
Rampur
PilibhitBareilly
Ghaziabad
Budaun
Bulandshahar
ShahjahanpurAligarh Bahraich
Sitapur
Hardoi
Mathura
Farrukhabad
EtahShravasti
GondaBarabanki
Hathras
AgraMainpuriFirozabad
Balarampur
LucknowUnnao
Kannauj
Etawah
Maharajganj
Basti GorakhpurFaizabad
SultanpurRaebareli
Deoria
Auraiya
Azamagarh mauFatehpur
Jalaun
Hamirpur
Ballia
Jaunpur
Pratapgarh
Jhansi GhazipurKaushambi
Chitrakoot
Banda
Allahabad
VaranasiMahoba
Lalitpur
ChandauliMirzapur
Sonbharda
GB. Nagar
JP Nagar
Lakhimpur
KanpurKanpur
Siddharth
SK Nagar
Ambedkar
Kushi Nagar
SR Nagar
Kheri
DehatNagar
Nagar
Nagar
16.78
17.20 24.87
22.85
25.11
22.4514.39
19.63
24.50
37.36
12.14
21.9259.04
14.93
9.83
20.857.69
11.67
10.66
20.40
17.42
15.446.93
7.5613.97
15.15
23.438.3322.77
10.64
21.58
6.37
13.20
23.05
21.55
13.7211.37
7.90
11.6511.14
15.6013.61
18.4714.84
14.0715.54
14.16
7.34
11.41 21.6713.77
10.18
17.72
12.78
14.65
7.47
19.97 11.8412.42
12.70
9.35
24.50
31.1530.638.38
21.7518.03
17.37
13.91
13.97
- 18.86
CATEGORIES
PercentPercentPercentPercent
Per Cent Share of Secondary Sector in Net District Domestic Product, 2004-05

8 9 Economic Well Being
23. Table 5.3 shows the top ten and the bottomten districts in terms of compound growth rate between1993-94 and 2003-04 in total and sectoral NDDP. Bothcategories include districts from all the four regions.However, majority of the poor performing districts incase of all the three sub-sectors belong to Eastern andCentral region. The inter-sectoral growth raters showan unbalanced pattern for most of the districts, withdifferent sectors showing divergent rates of growth.
24. Due to differential growth rate in total andper capita NDDP, the relative ranks of some districts haveundergone a change over the period (Appendix Table 5.3).Highest jump in ranks in terms of per capita incomebetween 1993-94 and 2004-05 has taken place in thecase of Farrukhabad, Jalaun, Etawah, Firozabad, KanpurDehat and Unnao (all gaining ten or more positions inrank). On the other hand, sharpest decline in rank hasoccurred in the case of Varanasi, Gonda, Sultanpur,Shahjahanpur and Fatehpur (all of which have lost 10 ormore ranks).
Sectoral Shifts25. The sectoral composition of Net Regional
Domestic Product shows some variation across theregions. The share of the primary sector is highest inBundelkhand and lowest in Central region (Table 5.4).The share of the secondary sector is highest in Westernregion and lowest in Bundelkhand. The share of tertiarysector is relatively higher in the Central and the Easternregions as compared to the other three regions.Between 1993-94 and 2004-05, the sectoral compositionhas undergone marked changes. The share of primarysector has declined clearly in all the regions. The shiftis mainly in favour of the tertiary sector. The secondarysector has also recorded positive shift in Western regionand Bundelkhand but a negative shift in the other tworegions.
26. At the district level, however, extremely sharpvariations in the structure of district income areobservable (Appendix Table 5.4). The share of primarysector ranges from as low as 11 per cent in Gautam Budh
Table 5.3: Districts with Highest and Lowest Compound Annual Growth Rate in NDDP During 1993-94 and20004-05 (Percent)
Primary Sector Secondary Sector Tertiary Sector All Sectors
District CAGR District CAGR District CAGR District CAGR
TOP TEN DISTRICTS
Kanpur Nagar 11.47 Firozabad 15.37 Mirzapur 9.77 Mirzapur 7.64
Lucknow 7.54 Farrukhabbad 14.05 Lucknow 6.93 Lucknow 7.02
Jalaun 7.13 Badaun 10.22 Jalaun 6.41 Jalaun 6.85
Unnao 5.48 Etawah 10.13 Farrukhabad 6.29 Firozabad 6.78Hamirpur 5.47 Mirzapur 9.56 Etawah 6.25 Farrukhabad 6.40
Jhansi 5.25 Moradabad 9.40 Gorakhpur 6.17 Kanpur Nagar 6.16
Aligarh 5.18 Pilibhit 8.73 Kanpur Nagar 5.96 Agra 5.35
Ghaziabad 5.06 Maharajganj 8.72 Allahabad 5.94 Hamirpur 5.33
Mainpuri 4.93 Lalitpur 8.66 Siddharth Nagar 5.80 Etawah 5.23
Firozabad 4.27 Basti 8.43 Agra 5.73 Allahabad 5.21
BOTTOM TEN DISTRICTS
Pilibhit 1.05 Rae Bareli 2.11 Rampur 3.52 Azamgarh 2.79
Jaunpur 1.02 Banda 1.66 Sonbhadra 3.52 ShahjahanPur 2.77
Deoria 0.98 Fatehpur 1.57 Barabanki 3.50 Pilibhit 2.71
Bijnor 0.91 SiddharthNagar 1.50 Pilibhit 3.45 Maharajganj 2.21Fatehpur 0.85 Meerut 1.41 Maharajganj 3.38 Fatehpur 1.89
Maharajganj 0.72 Sitapur 0.87 Sultanpur 3.30 Sonbhadra 1.65
Ghazipur 0.01 Sonbhadra -1.79 Fatehpur 3.06 Sultanpur 1.59
Varanasi -0.41 Sultanpur -2.26 Gonda 2.29 Kanpur Dehat 0.93
Ballia -1.06 Varanasi -4.07 Kanpur Dehat 2.12 Gonda 0.33
Kanpur Dehat -1.75 Gonda -9.23 Varanasi 1.95 Varanasi -0.57

9 0Human Development Report, Uttar Pradesh
Table 5.4: Sectoral Composition of Net Regional Domestic Product (percent)
Region Primary Secondary Tertiary NDDPSector Sector Sector
1993-94 2004-05 1993-94 2004-05 1993-94 2004-05 1993-94 2004-05
Western Region 41.10 36.85 19.94 22.56 38.96 40.59 100.00 100.00
Central Region 36.16 33.25 17.28 16.32 46.56 50.43 100.00 100.00
Eastern Region 40.04 35.75 19.32 15.69 40.64 48.56 100.00 100.00
Bundelkhand 46.76 44.45 12.50 13.99 40.74 41.55 100.00 100.00
Uttar Pradesh 40.18 36.25 18.86 18.86 40.96 44.89 100.00 100.00
Source: Economics and Statistics Division, State Planning Institute, U.P
Nagar to around 57 per cent in Mahoba district. In tendistricts the share of primary sector is around 50 percent or more. Most of them belong to Bundelkhand andCentral regions. In six districts this share is below 20 percent. These are more urbanized districts.
27. Around 57 per cent of total income in GautamBudh Nagar district emanates from secondary sector. Butin as many as ten districts, this share is below ten percent. These districts belong to Bundelkhand and Eastern
region with the sole exception of Mainpuri which falls inWestern region.
28. Tertiary sector is now emerging as the mostimportant sector in majority of districts the share rangingfrom a low of 31 per cent in Gautam Budh Nagar to 65per cent in Kanpur Nagar. In 15 districts services arecontributing more than half of district income.
29. Table 5.5 lists the districts with relatively highand low share of different sectors in district income.
Table 5.5: Districts with the Highest and Lowest Share of Different Sectors in District Income 2004-05
PRIMARY SECTOR SECONDARY SECTOR TERTIARY SECTOR
Rank Districts Share Rank Districts Share Rank Districts Share (%) (%) (%)
Top Ten Districts
1 Mahoba 55.69 1 Gautambuddha nagar 59.04 1 Kanpur Nagar 67.022 Kheri 54.16 2 Ghaziabad 37.36 2 Lucknow 60.833 Sonbhadra 51.18 3 Varanasi 31.15 3 Gorakhpur 58.944 Jalaun 51.08 4 Sant Ravi Das Nagar 30.63 4 Allahabad 56.045 MaharajGanj 50.94 5 Jyotibaphule nagar 25.11 5 Kaushambi 54.826 Siddharth Nagar 50.27 6 Bijnor 24.87 6 PratapGarh 54.307 Mainpuri 49.72 7 Bareilly 24.50 7 Ballia 53.648 Bahraich 49.35 8 Allahabad 24.50 8 Varanasi 53.209 Hardoi 49.11 9 Agra 23.43 9 Mirzapur 52.4210 Banda 49.07 10 Kanpur Nagar 23.05 10 Faizabad 52.32
Bottom Ten Districts
61 Chandauli 28.20 61 Banda 9.35 61 Lalitpur 38.5562 Agra 27.69 62 Mahoba 8.38 62 Kannauj 38.1463 Gorakhpur 25.46 63 Mainpuri 8.33 63 Muzaffarnagar 37.8964 Ghaziabad 23.17 64 Maharaj Ganj 7.90 64 Bijnor 37.8265 Allahabad 19.46 65 Bahraich 7.69 65 Buland Shahar 37.5166 Sant Ravi Das Nagar 18.67 66 Gonda 7.56 66 JyotibaPhule Nagar 36.0767 Lucknow 17.59 67 Pratap Garh 7.47 67 Kheri 36.0168 Varanasi 15.65 68 Ambedkar Nagar 7.34 68 Mahoba 35.9369 Gautambudh Nagar 12.01 69 Shrawasti 6.93 69 Sonbhadra 31.4570 Kanpur Nagar 9.93 70 Siddharth Nagar 6.37 70 Gautambuddha Nagar 28.95
9 1 Economic Well Being
III. Trends and the Pattern of Employment30. The concept of ‘work’ and ‘employment’ poses
problems in terms of measurement particularly in case offemales. The population census uses the concept of mainand marginal workers, while the National Sample SurveyOrganization uses the concept of primary and subsidiaryworkers in terms of usual, weekly and daily status.Population Census, conducted every ten years, collectsinformation on economic activity of the people. Work isdefined as participation in any economically productiveactivity. Such participation may be physical or mental innature. Work involves not only actual work but alsoeffective supervision and direction of work. It also includesunpaid work on farm or in family enterprise. The referenceperiod is one year preceding the date of enumeration.
31. Census classifies workers into two categories:
(i) Main workers, i.e. those who had worked in someeconomic activity for the major part of the year,that is, for a period of six months (183 days) ormore; and,
(ii) Marginal Workers, i.e., those who had worked forsome time during the last year, but not for themajor part, that is, less than 183 days.
32. The National Sample Survey Organizationconducts quinquennial surveys on employment andunemployment. NSSO has defined work or gainful activityas the activity pursued for pay, profit or family gain orin other words the activity, which adds value to thenational product. Like Census it includes work in anymarket activity and any non-market activity relating tothe agricultural sector.
33. The NSSO has adopted three differentapproaches to measure employment and unemployment:
(i) Usual Status, which has a reference period of 365days preceding the date of survey;
(ii) Current Weekly Status, which has a referenceperiod of seven days preceding the date of survey;
(iii) Current Daily Status, with each day of the sevendays preceding the date of survey, which measureswork in person days.
34. NSS concept of employment based on usualstatus approach is broadly comparable with the Census.The NSS workers are further classified as principal statusworkers and subsidiary status workers on the basiswhether their involvement in economic activity was fora longer part of the year or not. While male workparticipation rate as estimated by NSSO are roughlycomparable with that of Census, the former reports muchhigher work participation rates for females.
Work Participation Rates35. Work participation rates (WPR), i.e. the ratio
of workers to total population, shows the proportion ofpopulation engaged in gainful economic activity. Takingmain and marginal workers together, 32.5 percent ofpopulation was economically active in U.P. as per 2001Census. WPR was very low for females at 16.5 percentas compared to 46.8 percent for males. WPR was lowerin urban area, where only 26.3 percent of persons wereeconomically active as compared to the figure of 33.9percent in rural areas. Only 19.0 percent of rural womenand 6.8 percent of urban women in U.P. were found tobe economically active. Thus, employment opportunitiesseem to be much lower for women in U.P., whichconstraints the role of the women in development.
36. District-wise work participation rates havebeen shown in Appendix Table 5.5. Male CWPR does notshow large variation across districts. But very sharpvariations in female CWPRs are observed at the district
Box 5.1: Highlights of Income Growth
Major Achievementsl Between 1993-94 and 2004-05 U.P. registered a
moderate growth of 4.0 per cent per annum intotal SDP and 1.4 per cent per annum in percapita SDP.
l There has been acceleration in growth ratesduring the Tenth Plan.
l Growth process has been geographicallywidespread particularly in case of theagricultural sector.
l Inter district disparities have remained stableover the period.
l The composition of state income has undergonesignificant changes with a clear shift in favourof the secondary and tertiary sectors and a sharpdecline in the share of the primary sector. Thisis true for all the regions.
Areas of Concernl Growth rates in U.P. have been much slower than
in other parts of the country leading to a growinggap between the state and the national per capitaincome.
l Wide variations in growth rate of NDDP areobserved at the district level. Eastern districtshave shown a relatively slower growth.
l Sharp differentials in per capita incomes existat the regional and district levels, with Westerndistricts enjoying a much higher level of percapita income than districts in other regions. EastU.P. is the poorest region in terms of per capitaincome.
There is a high degree of concentration ofindustrial activities in a few selected districtsmostly in Western region.

9 2Human Development Report, Uttar Pradesh
Map 5.4
Source: Economics and Statistics Division, State Planning Institute, U.P.
levels ranging from a low of 6.3 per cent in Saharanpurto 36 per cent in Chitrakoot district. In general femalework participation rates are higher in the poorer regionsof Bundelkhand and Eastern U.P. as compared to theother two regions.
37. It is well known that population census doesnot truly reflect the economically active populationparticularly in case of females. NSS surveys are morerepresentative of the reality in this respect and showhigher WPR particularly for females. According to NSS61st Round 36.3 percent of the persons in U.P. wereemployed according to UPSS (Usual + Subsidiary) status.WPR for males and females were 50.2 percent and 21.6percent respectively. The corresponding rates of WPRat the national level were 54.7 per cent for males, 28.7for females and 42.0 percent for all persons. Thus, theWPRs in the state are clearly lower than that in thecountry particularly for females. WPR was somewhathigher in rural areas of U.P. at 37.1 percent as comparedto the urban areas, where only 33.1 per cent of personswere economically active. Work participation rates forwomen are particularly low in U.P.- 24.0 percent in ruralareas and only 11.7 percent in urban areas. The latest
NSS round shows an improvement in WPR between 1999-00 and 2004-05 for both males and females in rural aswell as urban areas (Table 5.6).
Sectoral Pattern and Shifts38. The sectoral pattern of employment is an
important indicator of the nature of economic activitiesin an economy as well as the level of its economicdevelopment. Detailed tables on industrial classificationof workers for the Census of 2001 are not yet available.However, it is possible to see structure of the work forceand changes therein in terms of the agricultural and non-agricultural segments of the economy.
39. According to the 2001 Census about two thirdsof the total workers (main + marginal) in U.P. are engagedin agriculture. About one-fourth of the workers areagricultural labourers (Table 5.7). In case of the ruralworkers a little over 77 percent were engaged inagriculture, out of which 49 percent were cultivatorsand 28 percent agricultural labourers. Three-fourths offemale workers were engaged in agriculture as comparedto around three-fifth of male workers.
25.00 - 30.0030.00 - 35.0035.00 - 40.0040.00
UTTAR PRADESH
(AND ABOVE)
U.P.
CATEGORIES
Sahranpur
Muzaffar Nagar Bijnore
Moradabad
MeerutBaghpat
Rampur
PilibhitBareilly
Ghaziabad
Budaun
Bulandshahar
ShahjahanpurAligarh Bahraich
Sitapur
Hardoi
Mathura
Farrukhabad
EtahShravasti
GondaBarabanki
Hathras
AgraMainpuri
Firozabad
Balarampur
LucknowUnnao
Kannauj
Etawah
Maharajganj
Basti GorakhpurFaizabad
SultanpurRaebareli
Deoria
Auraiya
Azamagarh mauFatehpur
Jalaun
Hamirpur
Ballia
Jaunpur
Pratapgarh
Jhansi GhazipurKaushambi
Chitrakoot
Banda
Allahabad
VaranasiMahoba
Lalitpur
ChandauliMirzapur
Sonbharda
GB. Nagar
JP Nagar
Lakhimpur
KanpurKanpur
Siddharth
SK Nagar
Ambedkar
Kushi Nagar
SR Nagar
Kheri
DehatNagar
Nagar
Nagar
Worker Population Ratio in Per Cent, 2001: All Persons
- 32.77
PercentPercentPercent
Percent
28.22
33.11 28.24
31.02
31.89
29.8932.67
28.30
28.0430.26
28.51
30.04
40.2930.27
28.63
31.45
30.6235.46
31.09
32.30
37.16
29.47
28.7641.35
33.9636.80
29.34
27.1927.51
27.23
42.44
29.78
38.06
34.30
29.94
32.95
27.5334.22
39.12
34.4435.26
30.1439.43
32.1235.63
28.5332.83
32.90
33.45
30.4532.33
37.67
35.95
39.16
28.77
31.07
33.53
37.02 31.3939.19
42.28
40.29
33.86
31.2928.7142.31
43.20
32.1133.78
36.76

9 3 Economic Well Being
Map 5.5
Source: Economics and Statistics Division, State Planning Institute, U.P
Table 5.6: Trends in Work Participation Rate (UPSS)
Year Rural Urban Total
M F T M F T M F T
1983 * 53.05 25.67 40.03 50.10 9.66 31.11 52.52 22.81 38.42
1987-88 * 51.85 21.93 37.73 46.33 9.12 27.30 51.31 19.70 36.44
1993-94 * 52.23 21.86 37.82 48.23 10.22 30.48 51.43 19.61 36.38
1999-00 * 48.10 20.05 34.48 49.01 9.41 30.38 48.29 17.94 33.65
2004-2005 49.60 24.00 37.10 52.40 11.70 33.10 50.22 21.40 36.25
Note: * Figures are for undivided U.P. including Uttarakhand
Source: Calculated from NSS Rounds.
40. Over time the structure of work force hasundergone noticeable change. The shift is away fromagricultural sector to non-agricultural sector mainly inthe tertiary activities. This is true for total as well asrural workers both for males and females. The rate ofdecline in the proportion of agricultural workers wasmuch sharper in the nineties as compared to the eighties,
as agricultural is no longer in a position to absorb moreworkers. It needs to be noted that among the agriculturalworkers the proportion of cultivators has sharply declinedwhile that of agricultural labourers has increased. Thus,it looks that marginal farmers are unable to sustainthemselves on agricultural income and are either becomingagricultural labourers or moving to other activities.
10.0010.00 - 15.0015.00 - 20.0020.00 - 25.0025.00 - 30.0030.00
UTTAR PRADESH
(BELOW)
(AND ABOVE)
U.P.
Sahranpur
Muzaffar Nagar Bijnore
Moradabad
MeerutBaghpat
Rampur
PilibhitBareilly
Ghaziabad
Budaun
Bulandshahar
ShahjahanpurAligarh Bahraich
Sitapur
Hardoi
Mathura
Farrukhabad
EtahShravasti
GondaBarabanki
Hathras
AgraMainpuri
Firozabad
Balarampur
LucknowUnnao
Kannauj
Etawah
Maharajganj
Basti GorakhpurFaizabad
SultanpurRaebareli
Deoria
Auraiya
Azamagarh mauFatehpur
Jalaun
Hamirpur
Ballia
Jaunpur
Pratapgarh
Jhansi GhazipurKaushambi
Chitrakoot
Banda
Allahabad
VaranasiMahoba
Lalitpur
ChandauliMirzapur
Sonbharda
GB. Nagar
JP Nagar
Lakhimpur
KanpurKanpur
Siddharth
SK Nagar
Ambedkar
Kushi Nagar
SR Nagar
Kheri
DehatNagar
Nagar
Nagar
6.34
14.86 7.92
11.67
14.13
10.7315.14
6.90
5.569.18
8.62
7.59
28.2510.90
4.66
8.88
13.31
16.13
8.51
10.01
24.46
7.65
7.9025.95
15.7719.96
10.03
7.246.30
6.88
31.22
10.4416.79
9.71
14.62
6.32
29.92
23.6523.00 17.0627.85
19.3322.71
16.5914.69
14.77
21.83
20.22 22.5225.48
20.32
27.38
15.44
21.8824.21
23.12 20.80
36.06
30.26
23.05
19.4715.0332.70
34.99
18.9320.62
25.03
22.52
- 13.92
Worker Population Ratio in Per Cent, 2001: Females
PercentPercentPercentPercent
Percent
Percent
CATEGORIES30.07
27.95

9 4Human Development Report, Uttar Pradesh
Table 5.7: Percent Distribution of Total and Rural Workers (Main + Marginal)by Industrial Category : 1981, 1991 and 2001
State Cultivators Agricultural Agricultural Household Others Total
Labour Workers Industry Workers
Total Workers
1981* 58.57 16.73 75.29 3.74 20.97 100.00
1991* 53.30 20.36 73.66 4.20 22.14 100.00
2001* 41.41 24.19 65.60 5.16 29.25 100.00
Male Workers
1981* 59.58 14.22 73.80 3.56 22.65 100.00
1991* 53.86 16.94 70.79 4.18 25.03 100.00
2001* 42.56 19.64 62.20 4.29 33.51 100.00
Female Workers
1981* 51.37 34.56 85.93 5.04 9.02 100.00
1991* 50.96 34.89 85.85 4.29 9.86 100.00
2001 37.81 38.37 76.18 7.86 15.96 100.00
* including Uttarakhand Source: Calculated from Census Reports.
Figure 5.4: Workers Distribution (Main +Marginal) by Industrial Category(%)
01020304050607080
Agricultural Workers Household Industry Others
Workers/Years
Per
cent
1981 1991 2001
41. The NSS data shows greater diversification ofthe economy as compared to the Census data (see Table5.8). Thus, according to 61st Round of NSS, 61.7 percentof total workers were employed in primary sector, 18.2percent in secondary sector and remaining 20.1 percentin tertiary sector. Only 12.4 percent workers wereemployed in manufacturing activities. The rural economycontinues to be predominantly agrarian in nature with72.8 percent workers employed in agriculture and alliedactivities. Female workers are overwhelminglyconcentrated in agricultural activities. 80.5 percent of
total women workers and 86.7 percent of rural womenworkers were found engaged in agriculture.
42. A fairly sharp reduction of around 8 percentagepoints in the proportion of workers employed inagriculture has taken place during the period 1993-2005(Table 5.9). On the other hand, the proportion ofworkers in manufacturing and construction has goneup by around 3.0 and 2.4 percentage points respectively.Among the services trade, hotels and transport sectorshave gained, while other services show a decline intheir share.

9 5 Economic Well Being
Table 5.8: Per 1000 Distribution of Usual Status Workers (Principal + Subsidiary)by Sectors, 2004-05
S.No. Industrial Rural Urban Total
Division Male Female Persons Male Female Persons Male Female Persons
1. Agriculture,Etc. 663 865 728 72 265 105 538 803 615
2. Mining ,etc. 2 2 2 1 0 1 2 2 2
Primary 665 867 730 73 265 106 540 805 617Sector
3. Manufacturing. 96 74 89 262 389 284 131 107 124
4. Electricity Etc. 1 0 1 5 2 5 2 0 1
5. Construction 74 6 53 85 21 74 76 8 57
Secondary 171 80 143 352 412 363 209 115 182Sector
6. Trade, Hotel 82 18 62 299 103 266 128 27 99& Restaurant
7. Transport, Etc. 30 1 21 108 0 90 47 1 33
8. Finance & 6 0 4 38 18 34 13 2 10Business Act.
9. Other .Services 45 32 41 130 202 143 63 50 59
Tertiary Sector 163 51 128 575 323 533 250 80 201
Source: NSS 61st Round, 2004-05
Table 5.9: Shifts in Sectoral Distribution of Workers: 1993-94 to 2004-05
S.No. Industry Division Percent of Workers Employed Change in % Points
1993-94 1999-00 2004-05 1990-00 2004-05over over
1993-94 1999-00
0. Agriculture 69.07 63.70 61.48 -5.36 -2.22
1. Mining and Quarrying 0.19 0.18 0.18 -0.01 0.00
2-3. Manufacturing 9.34 11.07 12.43 1.73 1.36
4. Electricity 0.19 0.18 0.14 -0.01 -0.04
5. Construction 2.33 3.81 5.65 1.48 1.84
6. Whole sale and 7.20 9.80 9.89 2.60 0.09
retail trades & hotels
7. Transport storage 2.53 3.09 3.34 0.56 0.25
& communication
8-9. Other Services 9.14 8.17 6.89 -0.98 -1.28
Total 100.00 100.00 99.99 0.00 -0.01
Source: NSS Reports

9 6Human Development Report, Uttar Pradesh
Figure 5.5: Distribution of Usual Status Workers (PS+SS) by Sectors-2004-05
0
100
200
300
400
500
600
700
800
900
Primary Sector Secondary Sector Tertiary Sector
Per
Tho
usa
nd
Total Male Total Female Total Persons
Regional and District Pattern of Employment43. Sectoral pattern of employment shows large
variations across regions and districts. The economy ofthe Western region is more diversified as compared toother regions of the state with over 43 percent workersemployed in non-agricultural sector (Figure 5.6). Arelatively higher proportion of women workers also areengaged in non-agricultural activities in this region ascompared to other regions, where over 75 percent offemale workers are found in the agricultural sector.
44. At the district level the differences in industrialstructure are much more marked (Appendix Table 5.6).Thus, the share of agricultural workers to total workersranges from 25 per cent in Ghaziabad to 89 percent inShrawasti district. Non-agricultural activity shows a highdegree of concentration in a few districts, mostlybelonging to the Western region. Thus, in as many as 28out of 70 districts of the state less than 25 per cent ofworkers are employed in the non-agricultural sector.Table 5.10 arranges the districts in terms of theproportion of workers in non-agricultural sector.
Growth of Employment45. The Census shows that between 1991 and 2001
total work force (main and marginal) in U.P. increasedat an annual compound growth rate of 2.6 per cent (Table5.11). The growth rate was much faster for femaleworkers (6.4 per cent per annum) as compared to maleworkers (1.6 per cent per annum). The important factto note is that the growth in employment has been almostwholly contributed by the growth of marginal workers,who work for less than 183 days in a year. In fact, incase of male workers the number of main workers hasmarginally declined during 1991-2001. Thus, employmentopportunities are not being generated on a regular basis.The growth rate of workers during 1991-2001 shows adecline as compared to their growth during 1981-91especially in the case of main workers.
46. Marginal workers, i.e. persons who havereported work for less than 183 days, in a yearconstituted 4.8 per cent of total workers in 1981.This percentage increased to 7.7 per cent in 1991and further to 25.3 per cent in 2001. Over 60 percent
Figure 5.6: Regionwise Share of Agricultural and Non-Agricultural Workers (%)
01020304050607080
Western Region Central Region Bundelkhand Eastern Region Uttar Pradesh
Regions
Per
cent
Agricultural workers Persons Non Agricultural Workers Persons

9 7 Economic Well Being
Table 5.10: Districts arranged according to the proportion of Workers in Non-Agricultural Sector, 2001
Above 40 Percent Between 25 and 40 Percent Below 25 Percent
District % Non-Ag District % Non-Ag District % Non-Ag
Ghaziabad 75.45 Mau 39.64 Unnao 24.90Kanpur Nagar 69.71 Jhansi 39.34 Faizabad 24.87Lucknow 68.44 Mirzapur 36.78 Ambedkar Nagar 24.76Varanasi 68.41 Jyotiba Phule Nagar 36.57 Kanpur Dehat 23.76Gautam Buddha Nagar 65.00 Chandauli 35.54 Fatehpur 23.23Meerut 63.44 Gorakhpur 34.44 Hamirpur 23.21Agra 59.30 Rampur 34.04 Mainpuri 22.83Sant Ravidas Nagar 59.14 Etawah 33.66 Pratapgarh 22.72Firozabad 54.46 Farrukhabad 32.88 Mahoba 22.65Aligarh 47.66 Kannauj 30.06 Rae Bareli 22.52Bulandshahar 47.54 Ballia 29.77 Budaun 22.49Saharanpur 47.38 Pilibhit 29.10 Sitapur 22.21Moradabad 44.58 Ghazipur 28.30 Barabanki 21.76Allahabad 42.76 Shahjahanpur 27.80 Hardoi 21.68Mathura 42.75 Jaunpur 27.67 Kaushambi 21.50Bijnor 42.67 Etah 27.55 Banda 21.25Hathras 42.21 Deoria 27.48 Kheri 21.05Baghpat* 41.75 Azamgarh 27.19 Lalitpur 19.70Muzaffarnagar 41.46 Sonbhadra 26.87 Basti 19.21Bareilly 41.26 Auraiya 26.23 Chitrakoot 18.69
Sultanpur 25.64 Sant Kabir Nagar 17.83Jalaun 25.47 Kushinagar 17.48
Bahraich 16.76Gonda 16.45Mahrajganj 15.68Balrampur 13.14Siddharthnagar 12.96Shrawasti 11.25
Source: Calculated from Census 2001
Table 5.11: Annual Growth Rate Of Main And Marginal Workers 1981-2001 (percent)
Item Between 1981-91 Between 1991-2001(Including Uttrakhand) (Excluding Uttrakhand)
Total Male Female Total Male Female
Main Workers 2.47 2.12 5.62 0.12 (-) 0.13 2.02
Marginal Workers 7.58 0.19 8.58 16.79 40.80 10.74
Total Workers 2.78 2.11 6.69 2.55 1.59 6.42
Source: Based on Census data
of female workers and 15 per cent of male workersbelong to the category of marginal workers in 2001.The incidence of marginal workers is much higherin the two backward regions of Bundelkhand andEastern region.
47. Growth rates of work force at the districtlevel during 1991 and 2001 have been shown inAppendix Table 5.7. The districts which have shownvery high growth of workers (above 3.0 per cent perannum) include: Ghaziabad, Bulandshahr, Moradabad

9 8Human Development Report, Uttar Pradesh
Map 5.6
Source: Economics and Statistics Division, State Planning Institute, U.P
Map 5.7
Source: Economics and Statistics Division, State Planning Institute, U.P
UTTAR PRADESH
(AND ABOVE)
U.P.
Sahranpur
Muzaffar Nagar Bijnore
Moradabad
MeerutBaghpat
Rampur
PilibhitBareilly
Ghaziabad
Budaun
Bulandshahar
ShahjahanpurAligarh Bahraich
Sitapur
Hardoi
Mathura
Farrukhabad
EtahShravasti
GondaBarabanki
Hathras
AgraMainpuri
Firozabad
Balarampur
LucknowUnnao
Kannauj
Etawah
Maharajganj
Basti GorakhpurFaizabad
SultanpurRaebareli
Deoria
Auraiya
AzamagarhmauFatehpur
Jalaun
Hamirpur
Ballia
Jaunpur
Pratapgarh
Jhansi GhazipurKaushambi
Chitrakoot
Banda
Allahabad
VaranasiMahoba
Lalitpur
ChandauliMirzapur
Sonbharda
GB. Nagar
JP Nagar
Lakhimpur
KanpurKanpur
Siddharth
SK Nagar
Ambedkar
Kushi Nagar
SR Nagar
Kheri
DehatNagar
Nagar
Nagar
47.38
41.46 42.67
44.58
32.88
30.0633.6634.04
27.5554.46
26.23
59.30
36.57
22.83
21.05
41.7516.76
22.21
21.6829.10
42.2111.25
16.4569.71
75.45
47.5442.7547.66
13.14
68.44
12.96
24.90
21.76
22.49
27.8017.48
15.68
17.8319.21
34.4424.87
25.6422.52
27.4823.23
41.26
24.76
27.19 39.6423.76
25.47
23.21
29.77
27.6722.72
39.3421.50
18.69
21.25
42.76
68.4459.1422.65
19.70
35.5436.78
26.87
63.44
65.00
28.30
Per Cent of Non-Agricultural Workers to Total Workers, 2001
- 34.11
10.00 - 20.0020.00 - 30.0030.00 - 40.0040.00 - 50.0050.00
CATEGORIES
PercentPercentPercentPercentPercent
- . 1.00 - 2.00 2.00 - 2.50 2.50 - 3.50 3.50
UTTAR PRADESH
(AND ABOVE)
Sahranpur
Muzaffar Nagar Bijnore
MeerutBaghpat
Rampur
PilibhitBareilly
Ghaziabad
BudaunBulandshahar
ShahjahanpurAligarhBahraich
Sitapur
Hardoi
Mathura
Farrukhabad
Etah Shravasti
GondaBarabanki
Hathras
Agra MainpuriFirozabad
Balarampur
Lucknow
Unnao
Kannauj
EtawahKushi Nagar
Maharajganj
Basti
GorakhpurFaizabad
SultanpurRaebareliDeoria
Auraiya
Azamagarh mauFatehpur
Jalaun
Hamirpur
Ballia
JaunpurPratapgarh
Jhansi GhazipurKaushambi
Chitrakoot
BandaAllahabad
VaranasiMahoba
Lalitpur
ChandauliMirzapur
Sonbharda
G. B. Nagar
J.P Nagar
S. R. Nagar
Kanpur
Kanpur
Lakhimpur
Siddharth
S.K. Nagar
Ambedkar
Data not available
Dehat
Nagar
Kheri
Nagar
Nagar
1.80
2.162.43
3.28
1.95
1.58
1.722.85
4.77
1.773.58
1.63
1.81
2.852.18
1.32
2.22
3.20
2.41
1.50
2.331.61
2.44 1.872.91
3.14
2.15
2.58
6.48
2.65
2.86
3.10
2.594.76
2.433.412.45-2.80
2.44 2.253.22
2.47
1.91
2.21
3.07
2.67
2.60 3.051.60
2.73 -0.18
2.99
6.57
1.79
U.P. - 2.55
Negetive
CATEGORIES
PercentPercentPercentPercent
Annual Compound Growth Rate of Total Workers in Per Cent: 1991-2001
Moradabad
9 9 Economic Well Being
and Mathura in West U.P., Kanpur Nagar, Lucknow,Fatehpur and Rae Bareli in Central U.P., Faizabad,Basti, Jaunpur, Ghazipur and Mizapur in East U.P. Onthe other hand, the group of districts showing slowgrowth of employment (below 1.5 per cent per annum)included Shahjahanpur, Rampur, Etah, Barabanki,Sitapur, Varanasi and Kanpur Dehat. In fact the lasttwo districts show an absolute decline in the numberof workers during the period.
48. The growth rate of main workers shows amixed picture with as many as 24 districts, mostlyfalling in the Eastern region, recording a decline innumber of workers. Only some districts of westernregion show a relatively higher growth of mainworkers. Marginal workers show a very rapid increase
Figure 5.7: CAGR of Workers by Sectors- 1993-94 to 2004-05
-6
-4
-2
0
2
4
6
8
10
12
CA
GR
(%)
0.A
gric
ultu
re
1.M
inin
ga
ndQ
uarr
ying
2-3
.M
anuf
actu
ring
4.E
lect
ricity
5.C
onst
ruct
ion
6.W
hole
sale
and
reta
iltra
des
&ho
tels
7.Tr
ansp
ort
stor
age
&co
mm
unic
atio
n
8-9.
Oth
erS
ervi
ces
CAGR in % 1993-00 CAGR in % 2000-05 CAGR in % 1993-05
Table 5.12: Compound Annual Growth Rate of Workers by Sectors:1993-94 to 2004-05 (in percent)
Industry Division Workers ( in lakh) CAGR in %
1993-94 1999-00 2004-05 1993-00 2000-05 1993-05
0. Agriculture 355.0 351.0 365.4 -0.19 0.81 0.26
1. Mining and Quarrying 1.0 1.0 1.1 0.00 1.17 0.532-3. Manufacturing 48.0 61.0 73.9 4.08 3.91 4.004. Electricity 1.0 1.0 0.8 0.00 -3.89 -1.795. Construction 12.0 21.0 33.6 9.78 9.86 9.816. Whole sale and 37.0 54.0 58.8 6.50 1.70 4.29
retail trades & hotels7. Transport storage & 13.0 17.0 19.8 4.57 3.13 3.91
communication8-9. Other Services 47.0 45.0 41.0 -0.72 -1.86 -1.24
Total Workers 514.0 551.0 594.4 1.17 1.53 1.33
*Excludes UttarakhandSource: Calculated from various NSS rounds
in all districts, though the rate of growth shows widevariations across districts. In Bundelkhand growth ofmarginal workers was relatively much lower ascompared to other regions.
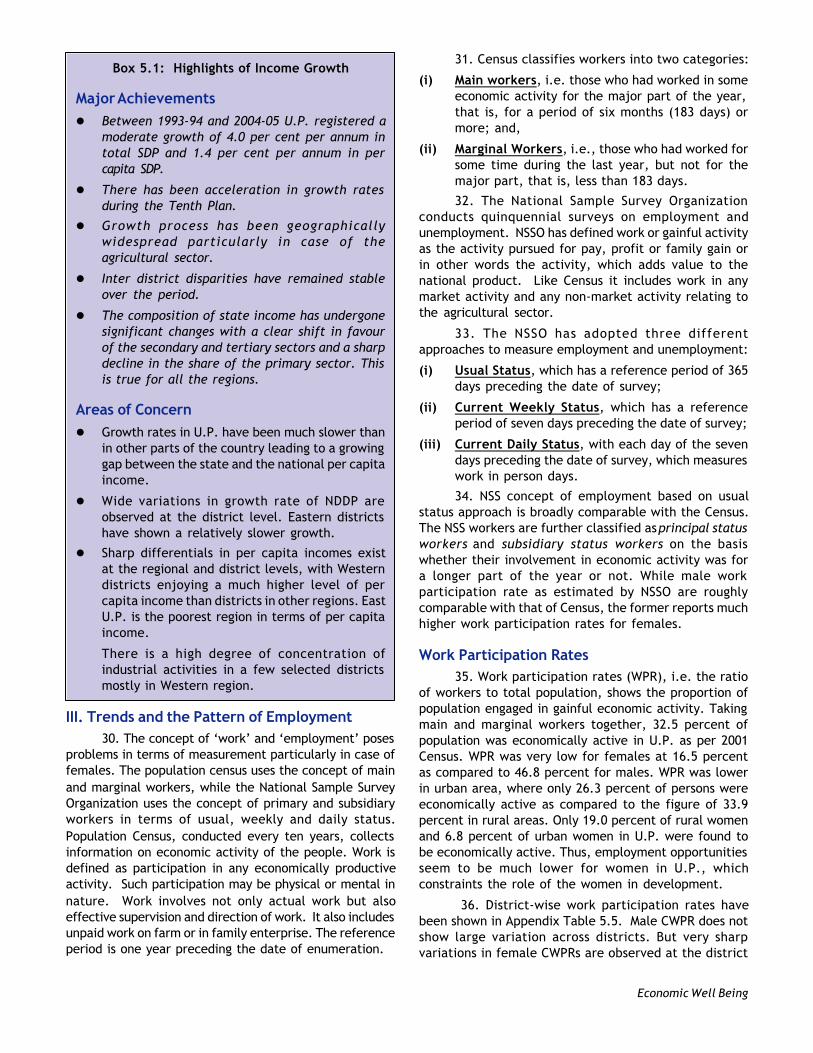
Sectoral Growth Rates in Employment49. Detailed industrial classification of Census 2001
workers is not yet available. However, NSS data enablesus to study the sectoral pattern of growth of work forcein the recent period. Employment growth of all workersshows a jump in growth rate from 1.17 percent during1993-00 to 1.53 percent during 1999-2005 (Table 5.12).For the entire period from 1993-2005, fastest growthwas observed in case of construction sector (around 10% per annum), followed by trade (4.3%), manufacturing

1 0 0Human Development Report, Uttar Pradesh
Table 5.13: Districts With High and Low Growth Rate of Workers in Agriculture and Non-agriculturalSectors: 1991-2001
High Growth of Employment Low Growth of EmploymentAgriculture Non Agriculture Agriculture Non Agriculture
District Growth District Growth District Growth District GrowthRate in % Rate in % Rate in % Rate in %
Kanpur Nagar 9.84 Mirzapur 8.29 Bulandshahar -2.21 Etah 2.87Bareilly 1.15 Ghaziabad 6.35 Azamgarh -2.39 Allahabad 2.85Budaun 0.99 Kheri 6.21 Pratapgarh -2.41 Mathura 2.83Lalitpur 0.96 Sultanpur 5.35 Meerut -2.46 Sonbhadra 2.77Mirzapur 0.52 Mahrajganj 5.06 Sultanpur -2.77 Shahjahanpur 2.76Bahraich 0.16 Faizabad 4.80 Sonbhadra -2.85 Pilibhit 2.76Moradabad 0.08 Moradabad 4.54 Mau -2.85 Rae Bareli 2.63Kheri 0.07 Banda 4.47 Allahabad -2.93 Barabanki 2.60
Ghazipur 4.45 Mahrajganj -2.95 Jhansi 2.51Bulandshahar 4.39 Deoria -2.99 Rampur 2.45Azamgarh 4.33 Ballia -3.85 Agra 2.15Siddharthnagar 4.23 Gorakhpur -4.43 Farrukhabad 2.03Basti 4.16 Bijnor -4.47 Mainpuri 1.04Mau 4.15 Varanasi -5.78 Varanasi 0.44Lalitpur 4.12 Kanpur Dehat -5.87 Kanpur Dehat -1.04
Source: Calculated from Census Reports
(4.0%) and transport (3.9%). Electricity and ‘otherservices’ have, however, registered a decline in workforce. Agricultural workers had shown a marginal declineduring 1993-00, but show an increase at the rate of 0.8percent during 1999-05. Trade and transport sectors showa relatively slower growth of workers in the latter period,while the pace of increase was more or less the same inthe two periods in case of manufacturing and construction
50. The Census also shows that the number of mainagricultural workers in U.P. has declined at the rate of 1.46percent per annum between 1991 and 2001. The rate of declinewas relatively high in Central and Eastern regions. Only Western
region shows a positive though nominal growth of agricultureduring this period. In fact, except eight districts all the otherdistricts show a decline in the number of main agriculturalworkers (Appendix Table 5.8). Non-agricultural main workersshow a fairly high growth of 3.5 per cent per annum during1991 and 2001. Growth rates of non-agricultural workers wererelatively slower in the Western region. Considerabledifferences in growth rate of employment in both the sectorsare observed at the regional and district level.
51. Table 5.13 identifies the districts with relativelyhigh and relatively low growth of work force in agricultureand non-agricultural sectors.
Figure 5.8: Percent Distribution of Workers by Type of Employment in U.P.
01020304050607080
Self Employment Regular wage/Salary Earners Casual Labourers
NSS Rounds
Per
cen
t
32nd Round 43rd Round 50th Round 55th Round 61st Round
1 0 1 Economic Well Being
Table 5.14 : Trends in Organized Sector Employment (Nos.)
Year Total Employees Women Employees % of Women Employees(As on31st Public Private Public Private Public Private
March) Sector Sector Total Sector Sector Total Sector Sector Total1 2 3 4 5 6 7 8 9 10
1991 2141757 536215 2677972 162965 48243 211208 7.6 9.0 7.91992 2142493 537573 2680066 166157 49536 215693 7.8 9.2 8.01993 2140342 530564 2670906 172062 49268 221330 8.0 9.3 8.31994 2133659 522800 2656459 172362 49846 222208 8.1 9.5 8.41995 2121943 532719 2654662 174315 50352 224667 8.2 9.5 8.51996 2116500 541173 2657673 179117 51949 231066 8.5 9.6 8.71997 2113386 542179 2655565 184303 53455 237758 8.7 9.9 9.01998 2088385 535514 2623899 184864 53624 238488 8.9 10.0 9.11999 2064698 528815 2593513 186031 54389 240420 9.0 10.3 9.32000 2029288 523380 2552668 188283 53165 241448 9.3 10.2 9.52001 1757966 465839 2223805 159844 48460 208304 9.1 10.4 9.42002 1718086 455545 2173631 162206 48497 210703 9.4 10.6 9.72003 1692291 451499 2143790 166493 49652 216145 9.8 11.0 10.12004 1680028 444540 2124568 168622 50382 219004 10.0 11.3 10.32005 1650370 437529 2087899 171102 50101 221203 10.4 11.5 10.6
Source: Directorate of Training & Employment
Casualisation of Work Force52. The dominant form of employment in U.P., as
in the country as a whole, is that of self-employment.NSS data show a decline in self-employment and anincrease in the proportion of casual labourers duringthe period 1977-78 and 1999-00 (Figure 5.8). However,the latest NSS round shows a clear decline between 1999-00 and 2004-05 in the proportion of casual labourers andan increase in that of self employed workers. This mayreflect the growth of workers in the informal sectorespecially in the tertiary sector. The extent ofcasualisation of labour force is much lower in U.P. thanin India as a whole. Less than one-fifth of the workersare employed as casual workers in U.P. against one-thirdin the country. The regular wage/salary employedworkers constitute around one-tenth of total workers inthe State.
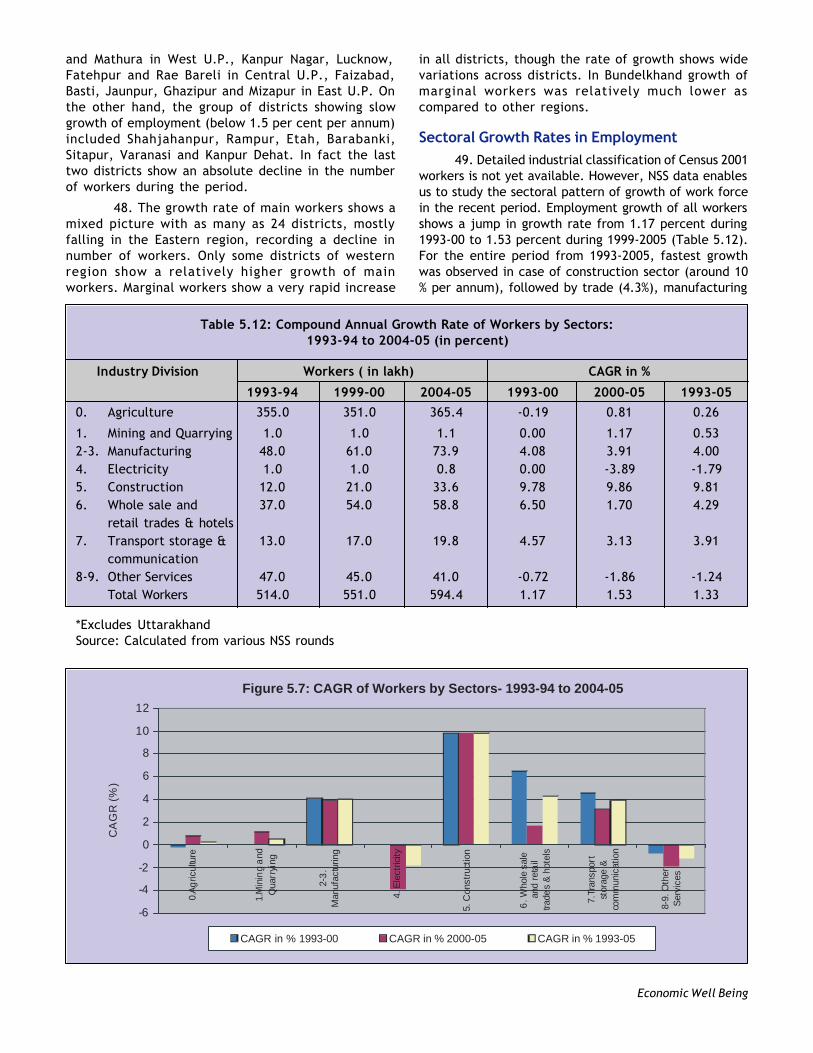
Organized Sector Employment53. The organized sector accounts for less than 5
per cent of total workforce and around one-fifth of non-agricultural workforce in the State. Almost four-fifthsof total organized sector employment is in the publicsector. Nearly half of the organized sector employmentis found in the social services, notably publicadministration and education. Private sector has a largepresence in case of manufacturing sector only. Recent
trends show that organized sector employment hasdeclined in case of manufacturing, trade and transportsectors. The proportion of female employees in theorganized sector has been increasing in recent years,though they still constitute hardly one-tenth of totalorganized sector workers. They are mainly concentratedin social services.
54. In the sixties and the seventies, the organizedsector employment increased fairly sharply rising from10.9 lakh in 1960-61 to 23.5 lakh in 1980-81 and furtherto 26.7 lakh in 1991, mainly on account of the expansionin public sector employment. The growth of organizedsector slowed down in the eighties. Since 1991employment in the organized sector has shown acontinuous decline coming down to 22.2 lakh in 2001and further to 20.8 lakh in 2005 (Table 5.14). Strikingly,private sector employment in the organized sector hasfailed to register any increase in U.P. since 1970-71.
55. A number of factors have contributed to thedecline in the public sector employment. These includethe shifts in policy in the wake of the economic reformsin favour of market led rather than state led growth,fiscal constraints on the state budget leading to reducedpublic investment and poor performance of publicenterprises. Industrial sickness in the private sector andlow level of new investment in the state also led to adecline in organized private sector employment.

1 0 2Human Development Report, Uttar Pradesh
Labour Productivity56. Labour productivity is measured by dividing
NSDP by the number of workers. It shows the rate oftechnical progress in an economy and is a majordeterminant of economic growth. During the period1993-94 and 2004-05 labour productivity in the stateincreased at an annual compound growth rate of 2.16percent (Table 5.15). Highest growth rate was observedin the tertiary sector followed by the primary sector.Labour productivity, however, stagnated in thesecondary sector due to the proliferation of enterprisesin the unorganized sector. There are very largedifferences in labour productivity both between sectorsand between districts / regions. The primary sector,which employs the largest work force, has the lowestlabour productivity - less than one-half of the labourproductivity in the secondary sector and one-fourth ofthat in the tertiary sector.
Box 5.2: Salient Features of Employment Situation
CharacteristicsThe employment structure of the state is
characterized by:l Low participation of population in economic
activity specially in case of womenl Low degree of diversification with predominant
proportion of workers engaged in the primary sectorl Concentration of industrial activity in a few
districtsl Very low proportion of workers in the organized
sector
Achievementsl Growth rate of workforce has been fairly high at
2.5 per cent per annum during the decade 1991-2001 as per Census
l Female workers have registered a higher growthrate (6.4 per cent per annum) than male workers(1.6 per cent per annum)
l Non-agricultural workers show a faster increasethan agricultural workers
Areas of Concernl Growth rate of employment has been uneven
across districts
l Female CWPR are extremely low
l A very high proportion of female workers areengaged in agricultural and allied activities oftenas marginal workers
l Bulk of additional employment has beengenerated in low paid over crowded activitieslike agriculture and allied activities,construction, petty trade, informal sector andsocial services
l Organized sector employment has been decliningsince 1991
l The pace of diversification towards non-agricultural activities is slow
IV. Poverty in Uttar Pradesh57. Generally poverty is looked at as relative or
absolute material deprivation reflected in low levels ofincome or consumption. However, poverty has manydimensions, though all of them are not equally amenableto measurement. Low levels of income not only result inlow levels of consumption and material deprivation, butalso restrict human capabilities by restricting the accessof the poor to education and health facilities, therebycreating a vicious cycle of poverty. Poverty also involvesvarious forms of vulnerability and exposure to risk,powerlessness and social exclusion. In this section wefocus on material deprivation as reflected in lowness ofincome/consumption.
58. Indian planners have defined poverty in termsof nutritional norm of 2400 calories per capita per dayfor rural areas and 2100 calories per capita per day forurban areas. The nutritional norm is converted intomonetary equivalent in terms of per capita consumptionexpenditure using NSS consumer expenditure data. Theproportion of population below the poverty line, i.e.,the poverty ratio, is then calculated using the distributionof persons over different expenditure classes as given inNSS surveys, which are conducted quinquennially. The
Table 5.15: Sector-wise Per Worker NSDP at Constant 1993-94 Prices (Rs.)
Sector 1993-94 2004-05 CAGR (%)
Primary Sector 9096 10727 1.51
Secondary Sector 20794 20061 -0.33
Tertiary Sector 26875 40700 3.85
All Sectors 14601 18479 2.16
Source: Calculated by dividing the NSDP estimated by Division of Economics and Statistics and work force asestimated by NSS surveys in the two years.

1 0 3 Economic Well Being
Table 5.16: Trends in Poverty Ratios in U.P. and India (%)
NSS Round Uttar Pradesh All-India
Rural Urban Combined Rural Urban Combined
1973-74 56.53 60.09 57.07 56.44 49.01 54.881977-78 47.60 56.23 49.05 53.07 45.24 51.321983-84 46.45 49.82 47.07 45.85 40.79 44.481987-88 41.10 42.96 41.46 39.09 38.20 38.861993-94 42.28 35.39 40.85 37.27 32.36 35.971999-00* 31.22 30.89 31.15 27.09 23.62 26.102004-05 URP 33.4 30.6 32.8 28.3 25.7 27.52004-05 MRP 25.3 26.3 25.5 21.8 21.7 21.8
Source: Planning Commission estimates based on NSS rounds.* Based on 30 days recall period.URP=Uniform reference period using 30 day recall period.MRP=Mixed recall period, where for some items recall period is 365 days, while for the rest it is 30 days.
poverty line originally calculated for 1973-74 has beenrevised from time to time using the appropriate priceindex for rural and urban areas. Lately state specificpoverty lines have been used for measuring the trendsin poverty. Poverty line for 2004-05 for U.P. has beenestimated by the Planning Commission at Rs.365.84 percapita monthly consumption expenditure in rural areasand Rs.483.26 in urban areas.
Poverty Trends at the State Level59. Poverty ratios in Uttar Pradesh have been
relatively high. According to the latest estimate of thePlanning Commission based on NSS 61st round, aboutone-third of the population of the state was livingbelow the poverty line in 2004-05 as compared to thefigure of 27.5 percent for the country on the basis onuniform recall period. Only Bihar, Chhattisgarh,Jharkhand, Madhya Pradesh and Orissa had a higherpoverty ratio as compared to U.P. Around 80 percentof the poor in the state live in the rural areas. However,rural and urban poverty ratios do not show muchdifference in U.P.
60. Both rural and urban poverty have steadilydeclined in U.P. in the last three decades (Table 5.16).
61. On the basis of the uniform recall period, povertyratio declined by 8.1 percentage points in U.P. between1993-94 and 2004-05, which compares well with the declineof poverty in India as a whole during the period. The declinewas higher in rural areas where poverty ratio declined by8.3 percentage points as compared to the urban areas wherethe decline was by 4.8 percentage points only.
62. Doubts have been expressed about thecomparability of poverty estimates between 1993-94 and1999-00 due to differences in the reference period. However,a rough comparison based on mixed reference surveys revealsthat poverty ratio declined from 31.2 percent in 1999-00
and further to 25.2 percent in 2004-05, i.e. a decline of 6percentage point. This would suggest that the rate of declinein poverty was relatively faster during 1999-2005 as comparedto the period 1993-00. It may also be noted that the mixedreference period estimates indicate a lower incidence ofpoverty (around 25 per cent).
63. It is remarkable that the decline in poverty inU.P. has taken place at the same rate as in India, despiteof the fact that the growth rate in U.P. was markedlybelow the national average. Also, poverty ratio hascontinued to decline although agricultural growth hasslowed down in the recent period. A number of factorsincluding the gradual diversification of the economy, risein real wage rate and government programmes forpoverty alleviation and employment generation seem tobe responsible for the decline in poverty.
64. Despite the substantial decline in the povertyratio, the absolute number of poor has remained high inthe state. Almost 6 million people in U.P. were livingbelow the poverty line in 2004-05 constituting over one-fifth of the total poor in the country on the basis ofuniform recall period (Table 5.17). In fact, the proportionof the poor living in U.P. has increased over time.
Regional Variations in Poverty65. Considerable variations in poverty levels are
observed across regions of the state. The relativelydeveloped Western region has a lower incidence ofpoverty, while Eastern region had much higher incidenceof poverty. Bundelkhand had the highest proportion ofpopulation below poverty line in 1993-94. However, 1999-00 NSS survey shows a much sharper reduction in povertyin this region, while Central region shows the highestincidence of poverty (Figure 5.9). Variations in populationpressure, resource endowment and productivity levels liebehind the regional variations in poverty levels.

1 0 4Human Development Report, Uttar Pradesh
Table 5.17: No. of Poor in U.P. by Area
NSS Round Uttar Pradesh U.P. as % of All-India
Rural Urban Combined Rural Urban Combined
1973-74 449.99 85.74 535.73 17.22 14.28 16.67
1977-78 407.41 96.96 504.37 15.42 15.00 15.34
1983-84 448.03 108.71 556.74 17.78 15.32 17.24
1987-88 429.74 106.79 536.53 18.53 14.21 17.47
1993-94 496.18 108.28 604.46 20.33 14.18 18.87
1999-00* 412.01 117.88 529.89 21.32 17.59 20.36
2004-05 URP 473.0 117.03 590.03 21.41 14.48 19.56
2004-05 MRP 357.68 100.47 458.15 21.00 14.73 19.21
Source: Planning Commission estimates based on NSS rounds.* Based on 30 days recall period.URP=Uniform reference period using 30 day recall period.MRP=Mixed recall period, where for some items recall period is 365 days, while for the rest it is 30 days.
Figure 5.9: Regional Trends in Poverty (%)
0 10 20 30 40 50 60 70 80
Western Central Eastern Bundelkhand Uttar Pradesh Incidence of Poverty Overall 1993 -94 Incidence of Poverty Overall 1999-00
Pov
erty
Inci
de
nce
(%)
Poverty at the District Level66. NSS sample design is not aimed at measuring
poverty at the district level. The recent Below PovertyLine Survey (BPL) of the Ministry of Rural Development,however, makes it possible to study district levelvariations in poverty. The advantage of BPL survey isthat it is based on a complete census of rural householdsand identifies BPL households on the basis of multipleindicators of deprivation. The results of BPL Survey are,however, not comparable with poverty ratios derivedfrom NSS data on consumer expenditure.
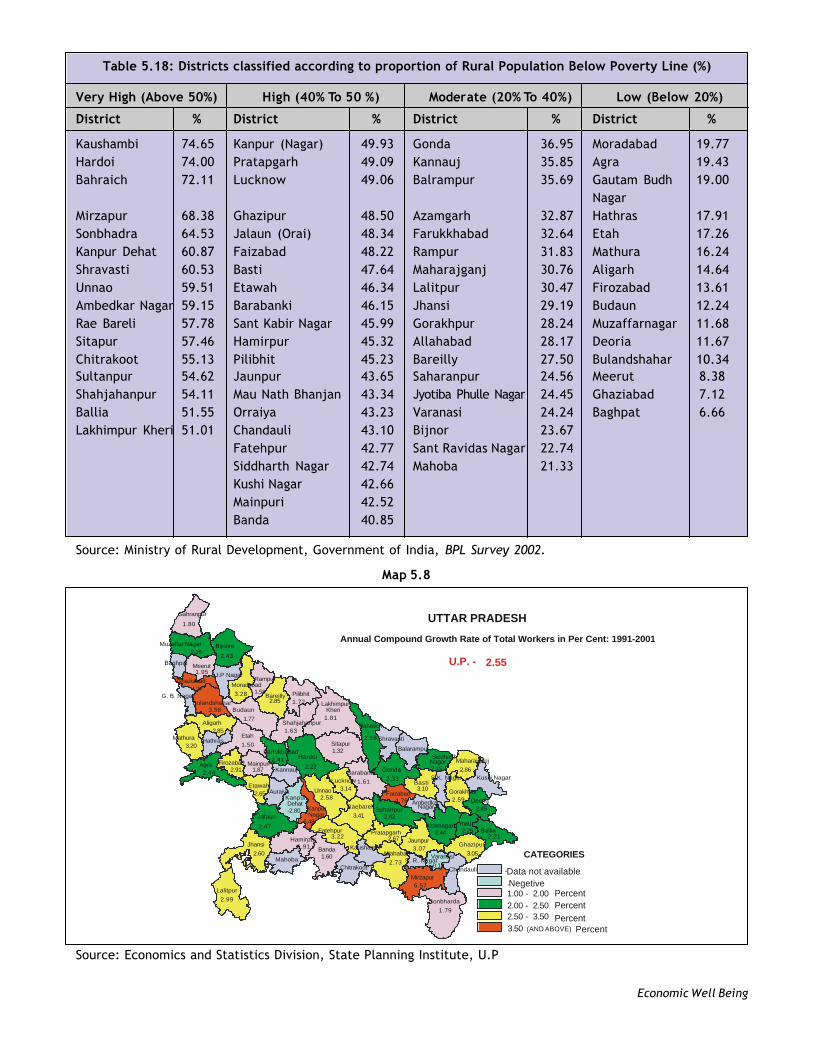
67. Table 5.18 arranges districts according to thelevel of poverty according to BPL survey 2002. Thevariations in poverty levels among districts are very stark,ranging from a low of 6.7 per cent in Baghpat to as muchas 74.65 percent in Kaushambi. In 16 districts poverty
levels are above 50 percent. These districts mostly belongto central U.P. and Bundelkhand. In another 21 districtspoverty ratios are high (between 40 and 50 per cent).Majority of these districts falls in Eastern U.P. In 18 districtspoverty levels are between 20 and 40 percent. Povertylevels are relatively low in (below 20 percent) in 15districts. All these districts except one belong to WesternU.P.
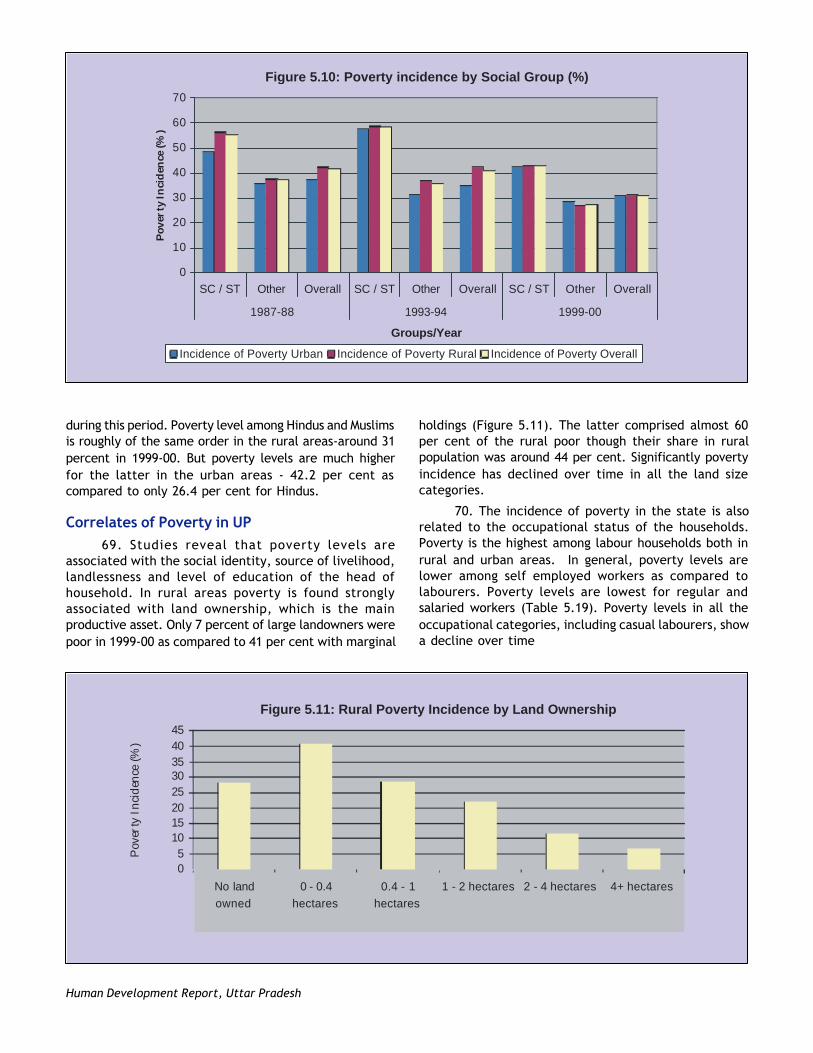
Poverty among Social Groups68. The incidence of poverty is much higher among
SC and ST households in U.P. (Figure 5.10). Nearly 60 percent of SC households were below poverty line in U.P. in1993-94. However, this proportion came down to 43 percent in 1999-00. The pace of decline of poverty was fasterfor the SC/ST households as compared to other households
1 0 5 Economic Well Being
Table 5.18: Districts classified according to proportion of Rural Population Below Poverty Line (%)
Very High (Above 50%) High (40% To 50 %) Moderate (20% To 40%) Low (Below 20%)
District % District % District % District %
Kaushambi 74.65 Kanpur (Nagar) 49.93 Gonda 36.95 Moradabad 19.77Hardoi 74.00 Pratapgarh 49.09 Kannauj 35.85 Agra 19.43Bahraich 72.11 Lucknow 49.06 Balrampur 35.69 Gautam Budh 19.00
NagarMirzapur 68.38 Ghazipur 48.50 Azamgarh 32.87 Hathras 17.91Sonbhadra 64.53 Jalaun (Orai) 48.34 Farukkhabad 32.64 Etah 17.26Kanpur Dehat 60.87 Faizabad 48.22 Rampur 31.83 Mathura 16.24Shravasti 60.53 Basti 47.64 Maharajganj 30.76 Aligarh 14.64Unnao 59.51 Etawah 46.34 Lalitpur 30.47 Firozabad 13.61Ambedkar Nagar 59.15 Barabanki 46.15 Jhansi 29.19 Budaun 12.24Rae Bareli 57.78 Sant Kabir Nagar 45.99 Gorakhpur 28.24 Muzaffarnagar 11.68Sitapur 57.46 Hamirpur 45.32 Allahabad 28.17 Deoria 11.67Chitrakoot 55.13 Pilibhit 45.23 Bareilly 27.50 Bulandshahar 10.34Sultanpur 54.62 Jaunpur 43.65 Saharanpur 24.56 Meerut 8.38Shahjahanpur 54.11 Mau Nath Bhanjan 43.34 Jyotiba Phulle Nagar 24.45 Ghaziabad 7.12Ballia 51.55 Orraiya 43.23 Varanasi 24.24 Baghpat 6.66Lakhimpur Kheri 51.01 Chandauli 43.10 Bijnor 23.67
Fatehpur 42.77 Sant Ravidas Nagar 22.74Siddharth Nagar 42.74 Mahoba 21.33Kushi Nagar 42.66Mainpuri 42.52Banda 40.85
Source: Ministry of Rural Development, Government of India, BPL Survey 2002.
Source: Economics and Statistics Division, State Planning Institute, U.P
Map 5.8
- . 1.00 - 2.00 2.00 - 2.50 2.50 - 3.50 3.50
UTTAR PRADESH
(AND ABOVE)
Sahranpur
Muzaffar Nagar Bijnore
MeerutBaghpat
Rampur
PilibhitBareilly
Ghaziabad
BudaunBulandshahar
ShahjahanpurAligarh Bahraich
Sitapur
Hardoi
Mathura
Farrukhabad
Etah Shravasti
GondaBarabanki
Hathras
Agra MainpuriFirozabad
Balarampur
Lucknow
Unnao
Kannauj
EtawahKushi Nagar
Maharajganj
BastiGorakhpurFaizabad
SultanpurRaebareliDeoria
Auraiya
Azamagarh mauFatehpur
Jalaun
HamirpurBallia
JaunpurPratapgarh
Jhansi GhazipurKaushambi
Chitrakoot
BandaAllahabad VaranasiMahoba
Lalitpur
ChandauliMirzapur
Sonbharda
G. B. Nagar
J.P Nagar
S. R. Nagar
Kanpur
Kanpur
Lakhimpur
Siddharth
S.K. Nagar
Ambedkar
Data not available
Dehat
Nagar
Kheri
Nagar
Nagar
1.80
2.162.43
3.28
1.95
1.58
1.722.85
4.77
1.773.58
1.63
1.81
2.852.18
1.32
2.22
3.20
2.41
1.50
2.331.612.44 1.872.91
3.14
2.15
2.58
6.48
2.65
2.86
3.10
2.594.76
2.433.412.45-2.80
2.44 2.253.22
2.47
1.91
2.21
3.07
2.67
2.60 3.051.602.73 -0.18
2.99
6.57
1.79
U.P. - 2.55
Negetive
CATEGORIES
PercentPercentPercentPercent
Annual Compound Growth Rate of Total Workers in Per Cent: 1991-2001
Moradabad
1 0 6Human Development Report, Uttar Pradesh
Figure 5.10: Poverty incidence by Social Group (%)
0
10
20
30
40
50
60
70
SC / ST Other Overall SC / ST Other Overall SC / ST Other Overall
1987-88 1993-94 1999-00
Groups/Year
Pov
erty
Inci
den
ce(%
)
Incidence of Poverty Urban Incidence of Poverty Rural Incidence of Poverty Overall
during this period. Poverty level among Hindus and Muslimsis roughly of the same order in the rural areas-around 31percent in 1999-00. But poverty levels are much higherfor the latter in the urban areas - 42.2 per cent ascompared to only 26.4 per cent for Hindus.
Correlates of Poverty in UP69. Studies reveal that poverty levels are
associated with the social identity, source of livelihood,landlessness and level of education of the head ofhousehold. In rural areas poverty is found stronglyassociated with land ownership, which is the mainproductive asset. Only 7 percent of large landowners werepoor in 1999-00 as compared to 41 per cent with marginal
holdings (Figure 5.11). The latter comprised almost 60per cent of the rural poor though their share in ruralpopulation was around 44 per cent. Significantly povertyincidence has declined over time in all the land sizecategories.
70. The incidence of poverty in the state is alsorelated to the occupational status of the households.Poverty is the highest among labour households both inrural and urban areas. In general, poverty levels arelower among self employed workers as compared tolabourers. Poverty levels are lowest for regular andsalaried workers (Table 5.19). Poverty levels in all theoccupational categories, including casual labourers, showa decline over time
Figure 5.11: Rural Poverty Incidence by Land Ownership
0 5 10 15 20 25 30 35 40 45
No land
owned 0 - 0.4
hectares 0.4 - 1
hectares 1 - 2 hectares
2 - 4 hectares
4+ hectares
Pov
erty
Inci
denc
e(%
)

1 0 7 Economic Well Being
71. Education is a crucial instrument for raisingincome levels of people and moving out of the viciouscircle of poverty. Studies indicate a strong correlationbetween educational attainment and poverty levels. Thisis true for Uttar Pradesh as well. As educational
attainment of head of household improves, poverty leveldeclines sharply (Figure 5.12). In fact, poverty levelsare almost four times higher among illiterates ascompared to persons with higher education. Nearly 60per cent of poor belong to the category of illiterates.
Table 5.19: Poverty Incidence by Occupation of Household Head
Rural Areas Urban AreasMain Occupation Poverty Percentage of: Main Poverty Percentage of:
Incidence Population Poor Occupation Incidence Population Poor
1993-94
Self Employed 44.3 13 14 Self-employed 39.9 53 61non-agricultureAgriculture labor 63.5 18 26 Reg. wage/salary 17.4 31 16Other labor 52.3 5 6 Casual labor 66.7 11 20Self employed 36.4 58 50AgricultureOther 25.9 6 4 Other 25.8 5 3Over all 42.3 100 100 Over all 35 100 100
1999-00
Self employed 33.7 16 17 Self-employed 34.3 50 56non-agricultureAgriculture labor 50.9 18 30 Reg. wage/salary 14.4 31 15Other labor 36.9 6 7 Casual labor 67.3 11 24Self employed 24.2 52 40AgricultureOther 21.3 9 6 Other 20.0 8 5Over all 31.1 100 100 Over all 30.7 100 100
Source: World Bank (2002), Poverty in India: The Challenge of Uttar Pradesh, New Delhi
Figure 5.12: Poverty Incidence by Level of Education of the Household Head
0 10 20 30 40 50 60
Not Literate
Less than
Primary
Primary
Completed CompletedCompletedMiddle
Secondary Completed
Higher Level Overall
Educational Level
Incidence of Poverty Overall 1993 -94 Incidence of Poverty Overall 1999 -00

1 0 8Human Development Report, Uttar Pradesh
Box 5.3: Living Conditions in U.P.
l The percentage of Pucca houses in rural andurban areas are found to be 32.0 and 73.7respectively.
l The corresponding percentage of householdsusing latrine were 19.1 and 84.4 percent.
l Households using tap water were 10.8 and 52.8in rural and urban areas respectively.
l The percentage of households using electricityin rural and urban areas were found to be 28.1and 83.6 respectively.
l The availability of electricity per day for morethan 15 hours and less than 24 hours was reportedto be 10.4% and 47.1% in rural and urban areasrespectively.
Source: Second Poverty and Social Monitoring SystemsReport, Planning Department, U.P. Government
Rural Poverty Alleviation Programmes72. Since the early seventies a number of
programmes for poverty alleviation have been introducedin the country. Integrated Rural Development Programme(IRDP) is the most well known of these programmes.Under the programme credit and subsidy were providedto the poor for income generating activities. Variousevaluation studies revealed a number of weaknesses inthe implementation of the programme. The reach of thepoverty alleviation programme has remained limited interms of coverage and level of assistance and itsimplementation have been lackadaisical anduncoordinated with little local participation to have anysignificant impact on the poverty situation in the state.
73. To rectify the situation, the self-employmentprogrammes were restructured and a new programmeknown as Swarnajayanti Gram Swarozgar Yojana (SGSY)was launched from 1st April 1999 replacing earlierprogrammes like IRDP, TRYSEM, DWCRA, etc. The SGSY isa holistic programme covering all aspects of self-employment including training, credit, technology,
infrastructure and marketing. The distinctive features ofthe SGSY are (i) a project approach for each key activity,(ii) provision of adequate investment, and (iii) groupapproach with focus on women groups. The new approachwas thus conceptually superior to the early approach andwas expected to yield better results. The programme isfunded by the Centre and the State in the ratio of 75:25.
74. Nearly 2.9 lakh Self Help Groups have beenformed in U.P. since the inception of the programmeunder the SGSY covering 10.46 lakh beneficiaries.Cumulative expenditure on the programme amountedto Rs.1332.67 crore. Average investment per group hasbeen Rs.23,575. The progress of the programme in thelast three years has been shown in Table 5. 20. Thefinancial and physical progress of the scheme wasunsatisfactory during 2003-04, but shows improvementafter that.
V. Unemployment Situation75. A major challenge before development planners
is to ensure gainful employment in income earningactivities to all those willing to work. Productive andgainful employment is necessary for obtaining the meansfor satisfying human needs apart from its psychologicalrole of generating feelings of self-esteem and purposeof life among the workers. Unemployment not onlydeprives a man of the means of livelihood but also causesdisruption of personal family and social life. In thissection we analyze changes in the level and structure ofemployment and unemployment in the state.
Unemployment Levels76. In an underdeveloped economy open
unemployment is found to be low as unemployment usuallytakes the form of underemployment or disguisedunemployment with people engaged in low productivityactivities. To capture different forms of unemployment,the National Sample Surveys provide estimates ofunemployment in terms of usual status, current weeklystatus and current daily status. The usual status (US) isakin to open unemployment and is measured with
Table 5.20: Progress of Swarn Jayanti Swarozgar Yojana
Year Financial Progress (Rs. in crore) Physical Progress (Nos.)
Funds Expenditure % Target Achievement %
Available Expenditure Achievement
2003-04 256.06 195.64 76 2.50,000 1,40.622 56
2004-05 315.24 276.30 88 2,50,000 2,46,824 99
2005-06 293.55 267.79 91 2,75,000 2,61,080 95
Source: Department of Rural Development, U.P. Government

1 0 9 Economic Well Being
reference to the status of person during the previous year.The current weekly status (CWS) shows unemploymentrates with reference to the previous week respectively.The current daily status (CDS) is the most comprehensiveconcept, which covers unemployment as well as the extentof under-employment of the labour force.
77. Traditionally unemployment rates have beenlower in U.P. as compared to India as a whole (Figure 5.13).Thus, only 1.1 per cent of rural labour force and 3.9 percent of urban labour force were unemployed in U.P. in 2004-05 according to the usual status. The correspondingestimates of unemployment were 1.9 per cent and 4.9 percent according to weekly status and 3.7 per cent and 6.3per cent according to daily status. The unemployment ratesare distinctly higher in the urban areas as compared to therural areas. For females unemployment rates aresignificantly lower as compared to the unemployment ratesfor male workers in the rural areas. But in urban areasunemployment rate of women on the basis of usual status
is higher than that for male workers, though lower on thebasis of weekly and daily status.
78. Unemployment rates are found to be much higherin case of the educated labour force as compared to totallabour force both in the rural and urban areas, thoughclearly below the national average (Table 5.21).Unemployment rates for educated females are much higheras compared to educated males particularly in the urbanareas, where 17.2 per cent of educated females areunemployed on UPS basis and 13.1 per cent on weekly basis.
79. The incidence of unemployment is much higheramong the youth aged 15 to 29 years as compared to thetotal labour force (Table 5.22) in 2004-05, 8.6 per centof urban youth (15-29 years) were chronicallyunemployed on usual status basis. Only 2.9 per cent ofrural youth were in this category. Similarly, 9.4 per centof the youth in the labour force in the urban areas wereunemployed on the basis of current weekly status, while3.6 per cent of rural youth are in this category. Highest
Figure 5.13: Unemployment Rates in U.P. and India as Percent - 2004-05
0 1 2 3 4 5 6 7 8 9
Rural Usual Status
Rural Usual Status
Adjusted *
Rural Weekly Status
Rural Daily Status
Urban Usual Status
Urban Usual Status
Adjusted *
Urban Weekly Status
Urban Daily
Status
Per
cen
t
Uttar Pradesh Persons
India Persons
Table 5.21: Unemployment Rates (%) for Educated Labour Force(15 Years and Above), 2004-05
Area/Status Uttar Pradesh India
Male Female Persons Male Female Persons
Rural Areas
Usual Principal Status 2.2 3.5 2.1 5.9 23.1 8.5Usual Principal Status 1.3 1.6 1.3 4.4 15.2 6.5& Subsidiary StatusWeekly Status 2.5 2.3 2.5 6.5 18.2 8.5
Urban Areas
Usual Principal Status 4.4 17.2 3.4 6 19.4 8.2Usual Principal Status 3.8 10.9 4.6 5.1 15.6 7.1& Subsidiary StatusWeekly Status 4.6 13.1 5.5 6.2 17.9 8.3
Source: NSS Sixty First Round, 2004-05 (Report 515).

1 1 0Human Development Report, Uttar Pradesh
Table 5.22: Unemployment Rates (%) among Youth by Age Group, 2004-05
Age Group (Years) Rural Areas Urban Areas
Male Female Persons Male Female Persons
A. Usual Principal Status
15 –19 4.1 3.0 3.9 8.6 0.0 7.620 – 24 3.7 3.2 3.7 12.0 37.2 14.225 – 29 1.4 1.5 1.5 3.5 10.1 3.915 – 29 3.0 2.4 2.9 7.9 15.8 8.6
B. Current Weekly Status
15 –19 4.7 0.5 3.5 10.3 0.0 8.320 – 24 4.8 2.0 4.3 12.1 20.4 12.125 – 29 3.4 2.1 3.1 5.3 14.6 6.315 – 29 4.2 1.5 3.6 9.1 11.2 9.4
Source: NSS Sixty First Round, 2004-05 (Report 515).
unemployment rates are found in the age group 20-24years. Unemployment rates for educated girls aremarkedly higher as compared to educated boys in theurban areas, though a reverse position prevails in therural areas. Thus, employment opportunities appear tobe less for educated females as compared to theeducated males in the urban areas.
80. Employment policy has to address the issueof variations in the unemployment rates accordingto age, sex and area. Finding adequate employmentopportunities for urban youth in the age group 20-24will be a major challenge of development policy inthe coming years. For rural women efforts arerequired to provide additional work opportunity on aregular basis.
Trends in Unemployment Rates81. Looking at the trends in unemployment rates
over time, it is observed that unemployment rates formales as well as total person declined between 1999-00and 2004-05 in terms of UPS and CWS, but show an increasein terms of daily status (Figure 5.14). For rural femalesunemployment rates show an increase in both rural andurban areas, except in case of CDS unemployment in ruralareas. It may also be noted that the changes are moderate.
82. Unemployment rates for educated adults alsoshow a clear decline for rural males and females as wellas urban males for all categories of between 1993-94and 2004-05 (Table 5.23). However, unemployment ratesfor urban females show a very sharp jump during thecorresponding period.
Figure 5.14: Recent trends in Unemployment Rates in U.P.as percent of Labour Force
0 1 2 3 4 5 6 7 8
Usual Status Weekly Status
Daily Status Usual Status Weekly Status
Daily Status
Rural Areas Urban Areas
Per
cent
38th Round 1983 43rd Round 1987-88 50th Round 1993-94 55th Round 1999-00 61st Round 2004-05

1 1 1 Economic Well Being
Under-Employment83. In the developing economies with heavy
population pressure the unemployment assumes the formof underemployment or disguised unemployment, whichdenotes a situation where the employed person may notbe fully utilized (visible underemployment) or where theincome received from work is not perceived to be adequateand the person is willing to seek additional and/oralternative work (invisible underemployment). NSS providesdata to assess the extent of invisible underemployment interms of the proportion of employed persons who are willingto take up additional/alternate work.
84. According to NSS 50th Round (1993-94) 3.7percent of rural workers and 2.6 per cent of urbanworkers by usual status reported seeking or available
for additional work. This proportion went up sharply to9.2 per cent and 6.3 percent in the 61st Round (2004-05). Another 7.4 percent of rural workers and 5.4 percentof urban workers reported availability for alternate workin 2004-05 (Table 5.24).
85. A fairly high proportion of employed personson UPS basis are found unemployed according to currentlyweekly or current daily basis, indicating prevalence ofvisible underemployment. This may be due to non-availability of work or withdrawal from work force forother reasons. The extent of visible unemployment isvery high in case of females both in the rural and theurban areas. Thus, 43.7 per cent of usually employedfemales in the rural areas and 30.7 per cent in urbanareas reported being out of work on current daily basis
Table 5.23: Trends in Unemployment Rates (%) for Educated Labour Force
(15 Years and Above)
Area/Status 50th Round 1993-94 61st Round 2004-05
Male Female Persons Male Female Persons
Rural Areas
Usual Principal Status 4.8 6.9 4.8 2.2 3.5 2.1
Usual Principal Status 3.0 3.9 3.1 1.3 1.6 1.3
& Subsidiary Status
Weekly Status 4.3 9.3 4.4 2.5 2.3 2.5
Urban Areas
Usual Principal Status 5.5 5.6 5.5 4.4 17.2 3.4
Usual Principal Status 5.2 5.0 5.2 3.8 10.9 4.6
& Subsidiary Status
Weekly Status 6.0 6.6 6 4.6 13.1 5.5
Source : National Sample Survey (Various Rounds)
Table 5.24: Distribution of Usually Employed Persons Aged 15 Years and above who sought or wereavailable for additional / Alternate Work (%)
Area 50th Round 61st Round1993-94 2004-05
Male Female Persons Male Female Persons
A. Available for Additional Work
Rural 3.8 3.1 3.7 9.8 6.6 9.2
Urban 2.5 3.3 2.6 5.9 9.2 6.3
B. Available for Alternate Work
Rural 3.4 3.0 3.3 8.2 4.2 7.4
Urban 2.7 1.4 2.6 5.1 7.8 5.4
Source : NSS, 50th Round, Sarvekshana, Vol. XX, No.1, July-September, 1996. NSS Report 515, 61st Round, 2004-05

1 1 2Human Development Report, Uttar Pradesh
in 2004-05 (Table 5.25). The corresponding figures formales were relatively low at 8.1 per cent and 4.6 percentrespectively. The extent of visible underemployment hasincreased in 61st Round as compared to the 50th Round interms of current daily basis but declined slightly on thebasis of current weekly basis.
Growth of Job Seekers86. The number of job seekers registered with
the Employment Exchanges expanded very rapidlyduring the eighties rising from 14.18 lakh in 1981 to27.96 lakh in 1991. But since 1991 the number of job
seekers has come down sharply (Table 5.26). InDecember 2005, there were only 17.8 lakh job seekersregistered with Employment Exchanges in the State.This was due to the fact that a negligible number,around 3500 per year, were placed in job through theEmployment Exchanges. It is to be noted that femalesconstitute only one-tenth of the registered persons.
87. Generally it is the educated persons in theurban who get themselves registered with theEmployment Exchanges. Of the total numbers on thelive registers of Employment Exchanges at the end of2004, a little over one fifth were below high school.
Table 5.25: Per Cent of Usually Employed (Principal and Subsidiary Status) reporting out ofWork by their Current Weekly and Daily Status, 1993-94 and 2004-05
Status/Area 50th Round 61st Round1993-94 2004-05
Males Females Males Females
I. Out of Work by Current Weekly Status
A. Rural Areas(i) Due to being Unemployed 1.1 0.9 1.4 0.4(ii) Being out of Labour Force 3.2 22.7 3.0 19.5B. Urban Areas(i) Due to being Unemployed 0.9 0.5 1.5 1.0(ii) Being out of Labour Force 1.2 12.2 0.8 11.2
II. Out of Work by Current Daily Status
A. Rural Areas(i) Due to being Unemployed 2.0 0.9 3.3 0.6(ii) Being out of Labour Force 5.3 38.4 4.8 43.1B. Urban Areas(i) Due to being Unemployed 1.5 1.0 3.0 1.3(ii) Being out of Labour Force 2.4 25.6 1.6 29.4
Source : NSS, 50th Round, Sarvekshana, Vol.XX, No.1, July-September, 1996.
Table 5.26: Number of Job Seekers on Live Register of Employment Exchanges
Year Total Persons Females %
Registration Placing Live Registration Placing Live Females OnRegister Register Register Live
1990 727445 18839 3118928 61708 1019 229906 7.37
1995 780967 11219 2508819 116056 1412 261585 10.43
2000 371728 3392 2037846 45019 105 186742 9.16
2001 361595 3528 1864128 43344 74 168831 9.06
2002 416653 3333 1816801 33523 62 159118 8.76
2003 520983 3493 1929328 59466 135 176372 9.14
2004 352579 2779 1902066 46372 80 176079 9.262005 351915 2486 1861577 40239 113 178316 9.58
Source: Directorate of Employment and Training, U.P.
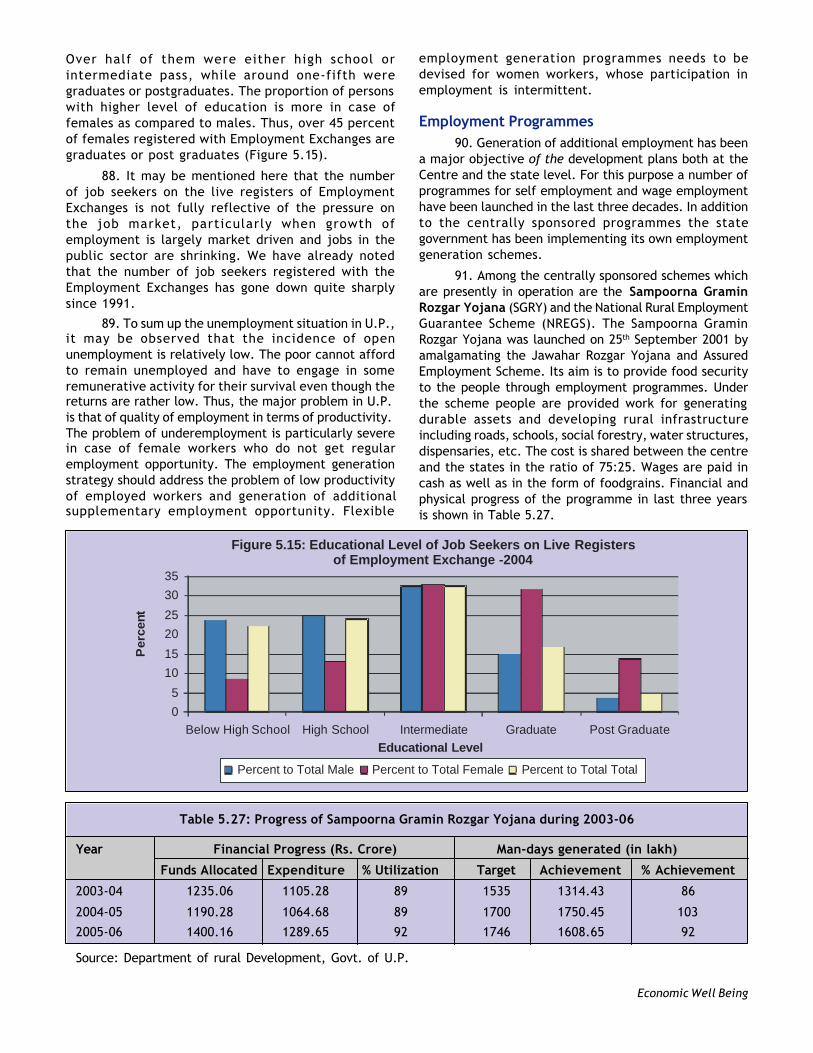
1 1 3 Economic Well Being
Over half of them were either high school orintermediate pass, while around one-fifth weregraduates or postgraduates. The proportion of personswith higher level of education is more in case offemales as compared to males. Thus, over 45 percentof females registered with Employment Exchanges aregraduates or post graduates (Figure 5.15).
88. It may be mentioned here that the numberof job seekers on the live registers of EmploymentExchanges is not fully reflective of the pressure onthe job market, particularly when growth ofemployment is largely market driven and jobs in thepublic sector are shrinking. We have already notedthat the number of job seekers registered with theEmployment Exchanges has gone down quite sharplysince 1991.
89. To sum up the unemployment situation in U.P.,it may be observed that the incidence of openunemployment is relatively low. The poor cannot affordto remain unemployed and have to engage in someremunerative activity for their survival even though thereturns are rather low. Thus, the major problem in U.P.is that of quality of employment in terms of productivity.The problem of underemployment is particularly severein case of female workers who do not get regularemployment opportunity. The employment generationstrategy should address the problem of low productivityof employed workers and generation of additionalsupplementary employment opportunity. Flexible
employment generation programmes needs to bedevised for women workers, whose participation inemployment is intermittent.
Employment Programmes90. Generation of additional employment has been
a major objective of the development plans both at theCentre and the state level. For this purpose a number ofprogrammes for self employment and wage employmenthave been launched in the last three decades. In additionto the centrally sponsored programmes the stategovernment has been implementing its own employmentgeneration schemes.
91. Among the centrally sponsored schemes whichare presently in operation are the Sampoorna GraminRozgar Yojana (SGRY) and the National Rural EmploymentGuarantee Scheme (NREGS). The Sampoorna GraminRozgar Yojana was launched on 25th September 2001 byamalgamating the Jawahar Rozgar Yojana and AssuredEmployment Scheme. Its aim is to provide food securityto the people through employment programmes. Underthe scheme people are provided work for generatingdurable assets and developing rural infrastructureincluding roads, schools, social forestry, water structures,dispensaries, etc. The cost is shared between the centreand the states in the ratio of 75:25. Wages are paid incash as well as in the form of foodgrains. Financial andphysical progress of the programme in last three yearsis shown in Table 5.27.
Figure 5.15: Educational Level of Job Seekers on Live of Employment Exchange -2004
Registers
0 5
10 15 20
25
30
35
Below High School High School Intermediate Graduate Post Graduate
Per
cent
Educational Level
Percent to Total Male
Percent to Total Female
Percent to Total Total
Table 5.27: Progress of Sampoorna Gramin Rozgar Yojana during 2003-06
Year Financial Progress (Rs. Crore) Man-days generated (in lakh)
Funds Allocated Expenditure % Utilization Target Achievement % Achievement
2003-04 1235.06 1105.28 89 1535 1314.43 86
2004-05 1190.28 1064.68 89 1700 1750.45 103
2005-06 1400.16 1289.65 92 1746 1608.65 92
Source: Department of rural Development, Govt. of U.P.
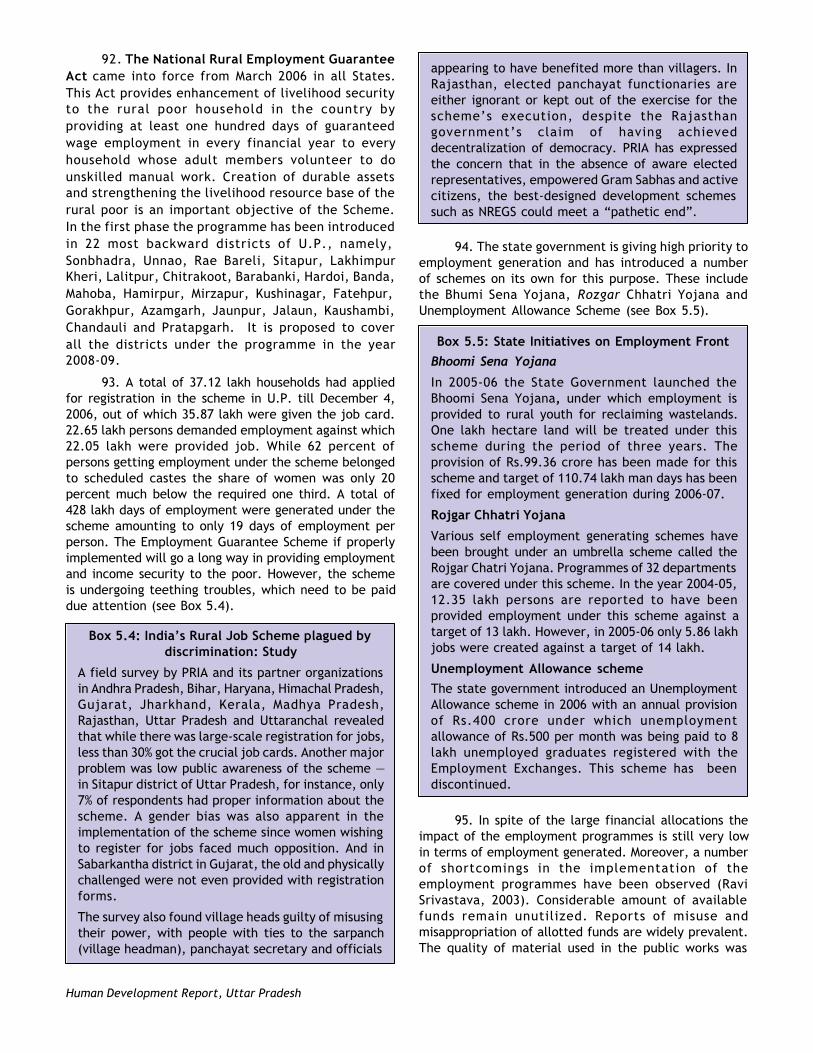
1 1 4Human Development Report, Uttar Pradesh
92. The National Rural Employment GuaranteeAct came into force from March 2006 in all States.This Act provides enhancement of livelihood securityto the rural poor household in the country byproviding at least one hundred days of guaranteedwage employment in every financial year to everyhousehold whose adult members volunteer to dounskilled manual work. Creation of durable assetsand strengthening the livelihood resource base of therural poor is an important objective of the Scheme.In the first phase the programme has been introducedin 22 most backward districts of U.P., namely,Sonbhadra, Unnao, Rae Bareli, Sitapur, LakhimpurKheri, Lalitpur, Chitrakoot, Barabanki, Hardoi, Banda,Mahoba, Hamirpur, Mirzapur, Kushinagar, Fatehpur,Gorakhpur, Azamgarh, Jaunpur, Jalaun, Kaushambi,Chandauli and Pratapgarh. It is proposed to coverall the districts under the programme in the year2008-09.
93. A total of 37.12 lakh households had appliedfor registration in the scheme in U.P. till December 4,2006, out of which 35.87 lakh were given the job card.22.65 lakh persons demanded employment against which22.05 lakh were provided job. While 62 percent ofpersons getting employment under the scheme belongedto scheduled castes the share of women was only 20percent much below the required one third. A total of428 lakh days of employment were generated under thescheme amounting to only 19 days of employment perperson. The Employment Guarantee Scheme if properlyimplemented will go a long way in providing employmentand income security to the poor. However, the schemeis undergoing teething troubles, which need to be paiddue attention (see Box 5.4).
Box 5.4: India’s Rural Job Scheme plagued bydiscrimination: Study
A field survey by PRIA and its partner organizationsin Andhra Pradesh, Bihar, Haryana, Himachal Pradesh,Gujarat, Jharkhand, Kerala, Madhya Pradesh,Rajasthan, Uttar Pradesh and Uttaranchal revealedthat while there was large-scale registration for jobs,less than 30% got the crucial job cards. Another majorproblem was low public awareness of the scheme —in Sitapur district of Uttar Pradesh, for instance, only7% of respondents had proper information about thescheme. A gender bias was also apparent in theimplementation of the scheme since women wishingto register for jobs faced much opposition. And inSabarkantha district in Gujarat, the old and physicallychallenged were not even provided with registrationforms.
The survey also found village heads guilty of misusingtheir power, with people with ties to the sarpanch(village headman), panchayat secretary and officials
appearing to have benefited more than villagers. InRajasthan, elected panchayat functionaries areeither ignorant or kept out of the exercise for thescheme’s execution, despite the Rajasthangovernment’s claim of having achieveddecentralization of democracy. PRIA has expressedthe concern that in the absence of aware electedrepresentatives, empowered Gram Sabhas and activecitizens, the best-designed development schemessuch as NREGS could meet a “pathetic end”.
94. The state government is giving high priority toemployment generation and has introduced a numberof schemes on its own for this purpose. These includethe Bhumi Sena Yojana, Rozgar Chhatri Yojana andUnemployment Allowance Scheme (see Box 5.5).
Box 5.5: State Initiatives on Employment Front
Bhoomi Sena Yojana
In 2005-06 the State Government launched theBhoomi Sena Yojana, under which employment isprovided to rural youth for reclaiming wastelands.One lakh hectare land will be treated under thisscheme during the period of three years. Theprovision of Rs.99.36 crore has been made for thisscheme and target of 110.74 lakh man days has beenfixed for employment generation during 2006-07.
Rojgar Chhatri Yojana
Various self employment generating schemes havebeen brought under an umbrella scheme called theRojgar Chatri Yojana. Programmes of 32 departmentsare covered under this scheme. In the year 2004-05,12.35 lakh persons are reported to have beenprovided employment under this scheme against atarget of 13 lakh. However, in 2005-06 only 5.86 lakhjobs were created against a target of 14 lakh.
Unemployment Allowance scheme
The state government introduced an UnemploymentAllowance scheme in 2006 with an annual provisionof Rs.400 crore under which unemploymentallowance of Rs.500 per month was being paid to 8lakh unemployed graduates registered with theEmployment Exchanges. This scheme has beendiscontinued.
95. In spite of the large financial allocations theimpact of the employment programmes is still very lowin terms of employment generated. Moreover, a numberof shortcomings in the implementation of theemployment programmes have been observed (RaviSrivastava, 2003). Considerable amount of availablefunds remain unutilized. Reports of misuse andmisappropriation of allotted funds are widely prevalent.The quality of material used in the public works was

1 1 5 Economic Well Being
often sub-standard. The norms regarding the coverageof weaker sections and women often remain unmet. Inshort, there appears to be considerable scope ofimproving the efficiency of the employment generationprogrammes through better designing andimplementation.
VI. The Challenge of Employment and PovertyEradication in U.P.96. In spite of the substantial reduction in poverty
levels over the past decades, the proportion of povertyis still relatively high in the state and the absolute numberof the poor is very large. Though open unemploymentrates are low in U.P., a very high proportion of workersare engaged in low income generating activities inagriculture and the informal sector. Poor asset base ofthe people, lack of economic diversification, poor levelsof human capabilities and low productivity in thetraditional sectors are among the major causes ofpoverty.
97. The challenge of employment generation anderadication of poverty requires a broad based, labourintensive and regionally equitous pattern of sustainedgrowth. Rate of economic growth has to be stepped upby raising substantially investment levels in the publicsector and creating a favourable investment climate toattract private capital in the state on a massive scale.
98. Improvement in agricultural productivity anddiversification of the rural economy by promoting non-farm activities are vitally needed for poverty reductionin the rural areas, where bulk of the poor live.Improvement in productivity levels in the informal sectorthrough technological upgradation and better input andmarketing facilities will be necessary for improving the
income levels of the poor masses. Large scale investmentin rural infrastructure is needed for acceleratingeconomic growth in the rural areas and improving livingconditions of the people.
99. The working of the wage employment and selfemployment programmes has to be improved to removethe deficiencies in their implementation. The strategyof promotion of self help groups of the poor supportedby credit, training and marketing facilities needs to bevigorously pursued.
100. Social safety networks need to be substantiallyexpanded for the protection of the vulnerable groups anddestitutes, suffering from temporary and/or permanentshocks and handicaps will remain important.
101. The economic opportunities of the poorare restricted by lack of education and poor healthconditions. Therefore, a human development strategyis critical for meeting the challenge of poverty andinclusive growth in the state. While the continued roleof state in provision of social services like education,health, water and sanitation will remain important,efforts should be made to encourage private investmentin social sector by adopting public private partnershipmodels in this field. The quality of public services needsto be improved and access of the poor to these facilitiesencouraged.
102. A participatory approach needs to beencouraged by involving the people in planning andimplementation of development programmes and inmaintenance and running of the various social servicesmeant for their benefits. Strengthening of the PanchayatiRaj Institutions and their real empowerment will go along way in strengthening the participatory approach.


![[XLS]media.dgrindia.commedia.dgrindia.com/pdf/directorate/training/management/... · Web viewGarhi-Balhi Road Rewari, HR 9416949568 Vill Po Vijwara, Dist-Bagpat (UP)-250345 14256391](https://img.pdfslide.us/doc/110x75/5aff1fc17f8b9aa34d8fdf00/xlsmedia-viewgarhi-balhi-road-rewari-hr-9416949568-vill-po-vijwara-dist-bagpat.jpg)