Embed Size (px)
Citation preview

The Economic Value of a Dairy CowVictor E. Cabrera
University of Wisconsin-Madison

Discounted future net return of a cowCompared to a replacement
What is the cow value?What the cow value means?
General interpretation•Positive cow value = keep•Negative cow value = replace
Net return of a cow minus net return of a replacementIncludes the replacement transaction cost
Vs.

Cow expected milk production•This lactation•Future lactations
Important factorsVariables with large impact
Replacement Expected genetic gain
MilkGenetics
Valu
e

Optimal managementKeep or replace
Why to worry about the cow value?Critical economic implications
Crucial decisionsBreed or not breed
Important information• Value of pregnancy• Cost of pregnancy loss• Cost of a day open

How to calculate the cow value?Markov chains to simulate herd dynamics
Cabrera, 2012
MIM
123456789101112131415161718192021222324252627282930313233
0 1 2 3 4 5 6 7 8 9
1 2 3 4 5 6 7 8 9 PAR
MIP
b
dnb
123456789101112131415161718192021222324252627282930313233
1 2 3 4 5 6 7 8 9
Replacement
Cow
Cow Value

Current state•Lactation (PAR)•Months after calving (MIM)•Pregnancy (MIP)
Data required for modelEvaluated cow
Expected milk production•Rest current lactation•Next lactations

Genetic improvement•Expected productivity gain with the replacement
Data required for modelReplacement heifer

Milk production•Rolling herd average•Butterfat content
Data required for modelHerd level
40
60
80
100
120Milk production
lb/c
ow/d
ay
Months after calving
Lactation 1Lactation 2Lactation 3
21-d pregnancy ratePercentage of cows becoming pregnant every 21 days

Herd turnover ratioPercentage of animals leaving the herd
Data required for modelHerd level
0
5
10
15
20Herd turnover ratio
Leav
ing
the
herd
, %Moths after calving
Lactation 1Lactation 2Lactation 3
Reproductive replacement•Last month to breed non-pregnant cows
•Milk threshold to replace do-not-breed cows

Body weight•Within a lactation•Between lactations
Data required for modelHerd level
1,100
1,200
1,300
1,400
200 400 600 800
Body
wei
ght,
lb
Days after calving
Lactation 1 (1,100 lb)Lactation > 1 (1,320 lb)
Pregnancy lossAbortion of pregnant cows between 35 days and end of gestation

Data required for modelFarm data, economic variables
Milk price
Feed cost
Reproductive cost
Replacement cost
Salvage value
Calf value
Interest rate

Economic net return Expected future net returns
$0
$75
$150
$225
$300
Cow Replacement
Months in the future
Cow Value = $625
PAR=3, MIM=5, MIP=1

Difference in cow value:•Cow becoming pregnant•Cow remaining non-pregnant
The value of a new pregnancyHow much more when a cow becomes pregnant?
Vs.
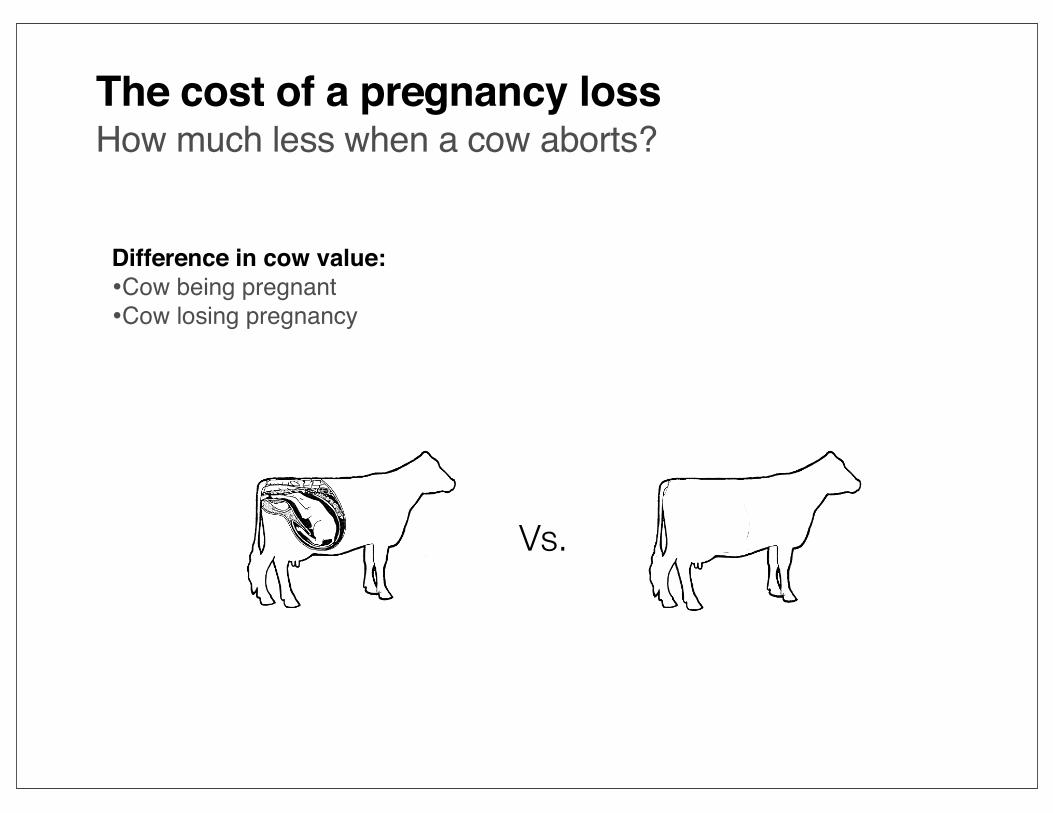
Difference in cow value:•Cow being pregnant•Cow losing pregnancy
The cost of a pregnancy lossHow much less when a cow aborts?
Vs.

Model illustrationHerd baseline data
Cabrera, 2012
Herd turnover ratio, %/year 35
Rolling herd average, kg/cow per year 10,896
21-d pregnancy rate, % 18
Reproduction cost, $/cow per month 20
Last MIM to breed a cow 10
Milk threshold, kg/cow per day 22.7
Pregnancy loss after 35 d pregnant, % 22.6
Average cow body weight, kg 593

Model illustrationHerd baseline data
Cabrera, 2012
Replacement cost, $/cow 1,300
Salvage value, $/kg live weight 0.84
Calf value, $/calf 100
Milk price, $/kg 0.35
Milk butterfat, % 3.5
Feed cost for lactating cows, $/kg dry matter diet 0.22
Feed cost for dry cows, $/kg dry matter diet 0.18
Interest rate, %/year 6

Open cow value• Decreases • Becomes negative
Model illustrationAverage cow and replacement
-$225
$0
$225
$450
$675
$900
Cow
val
ue, $
Months after calving
Open Pregnant 3 MIMPregnant 5 MIM Pregnant 7 MIM
Pregnant cow value• Higher than open• U-shaped• Similar value at calving
Overall cow value• Increases to 3rd or 4rd
lactation

Model illustrationThe value of a new pregnancy, $
PAR MIM Cow value Milk Feed Repro. Non-Repro.
Morta-lity Calf Repro.
cost1 4 151 36 -34 45 26 5 29 451 6 194 40 -40 73 39 8 32 411 8 233 22 -43 116 55 10 36 363 4 202 46 -17 43 46 9 26 493 6 215 39 -25 69 50 9 27 473 8 203 -9 -29 108 53 10 27 435 4 196 36 -17 37 55 10 26 495 6 203 25 -22 60 57 11 26 475 8 186 -24 -25 94 61 12 26 44
Culling

Model illustrationThe impact of expected milk productivity
Rest lact.
Next lact.
1st lact.
2nd lact. 3rd lact
120 120 2,458 2,038 2,002120 100 1,045 877 829120 80 -380 -284 -345100 120 1,891 1,499 1,477100 100 479 338 304100 80 -934 -823 -87080 120 1,325 961 95280 100 -88 -200 -22180 80 -1,501 -1,361 -1,395
Cow MIM = 8 and MIP = 2
-$600
-$70
$460
$990
$1,520
$2,050

Model illustrationThe impact of genetic gain with a replacement
Replacement genetic gain• Cow value is $211 lower for
every 1% expected milk productivity of replacement

Decision support systemPerform your own calculations
Cow value is farm specificEvery farm is different
Market conditions change permanently Might impact decisions
User-friendly applicationEasy to use, still robust
Farm conditions change dynamicallyCow value and cow net return change
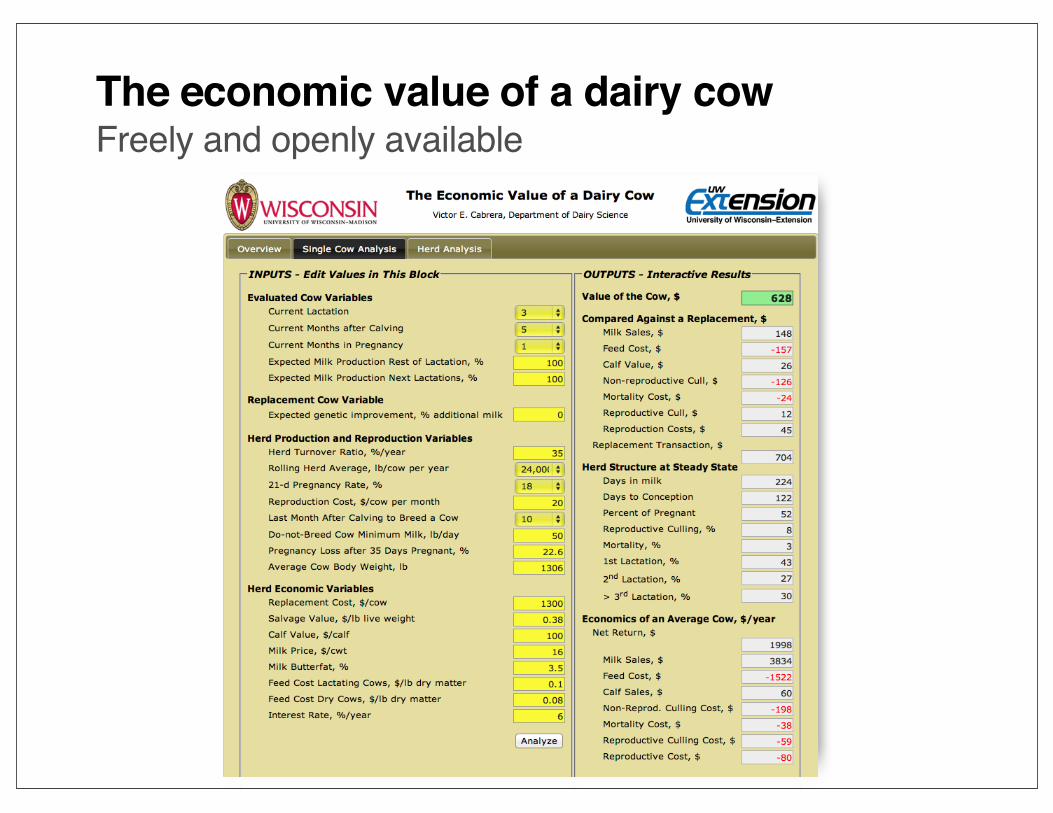
The economic value of a dairy cowFreely and openly available

The economic value of all cows in a herdUse the herd analysis

The economic value of a dairy cowWhere to find it
DairyMGT.infoTools

Time to replace a cow•Cow value is negative•Include milk expectancy•Include genetic gain
Examples of usesHow the tool could help decision making
Herd performance•Herd demographics•Herd net returns
The value of a:•Pregnancy•Day open•Pregnancy loss
Sorted list of cow values•Candidates for replacement•Best performing animals•Treatment decisions
Cow ID Cow value, $5892 -1,123
6344 -243
435 -10
221 269
5543 2,213

AcknowledgementProject support
This project is supported by Agriculture and Food Research Initiative Competitive Grant No. 2010-85122-20612 from the USDA National Institute of Food and Agriculture
This project was also supported by Hatch project to V.E.C. WIS01577

© 2011 Wisconsin Milk Marketing Board, Inc.
Thanks