Embed Size (px)
Citation preview

Economic value and
impact of public
libraries in Latvia
Study report
16.01.2012. Economic value and impact of public libraries in Latvia: Study report 2
Economic value and impact of public libraries
in Latvia
Study report
2012
16.01.2012. Economic value and impact of public libraries in Latvia: Study report 3
TABLE OF CONTENT
Abbreviations ....................................................................................................................................................... 6
Public libraries in Latvia........................................................................................................................................ 8
Introduction to the study ................................................................................................................................... 10
Limitations and assumptions .............................................................................................................................. 11
Methodology...................................................................................................................................................... 15
General Research Approach .................................................................................................................................. 15
Detailed Methodology for Calculations................................................................................................................. 18
Overall economic impact of public libraries ...................................................................................................... 19
Value of ICT training Classes ............................................................................................................................. 20
Individual consultations on ict .......................................................................................................................... 21
Lending .............................................................................................................................................................. 21
Reading.............................................................................................................................................................. 23
Use of PCs and Internet ..................................................................................................................................... 23
Services for library users with disabilities ......................................................................................................... 24
Printing .............................................................................................................................................................. 25
Scanning ............................................................................................................................................................ 26
Photocopying .................................................................................................................................................... 26
Public events ..................................................................................................................................................... 27
Exhibitions ......................................................................................................................................................... 28
reference services ............................................................................................................................................. 29
Economic impact and benefit-cost ratio of public libraries ................................................................................. 31
Summary of findings of economic impact of public library services ..................................................................... 31
Overall economic impact of public libraries .......................................................................................................... 32
The economic impact of individual library services .............................................................................................. 42
The economic impact and return indicators of the public library services supported by BMGF .......................... 45
Concluding remarks ............................................................................................................................................ 50
Appendices ........................................................................................................................................................ 53
Tasks and activities of the project ......................................................................................................................... 53
Economic impact of specific library services – detailed analysis .......................................................................... 55
Reading.............................................................................................................................................................. 55
Printing .............................................................................................................................................................. 57
Scanning ............................................................................................................................................................ 59
Photocopying .................................................................................................................................................... 61
Public Events ..................................................................................................................................................... 63
Exhibitions ......................................................................................................................................................... 65
reference services ............................................................................................................................................. 67
Sensitivity analysis ................................................................................................................................................. 69
Endnotes ............................................................................................................................................................ 70
16.01.2012. Economic value and impact of public libraries in Latvia: Study report 4
EXECUTIVE SUMMARY
Nowadays Latvian public libraries face many challenges. For example, libraries are expected to deliver traditional
services in an environment of rapidly changing technologies, maintain high quality service taking into account the
social patterns defined by technological innovations, urbanisation, globalisation and the greater social role of
public libraries in rural areas. Furthermore, libraries are expected to operate in ways that are financially
sustainable. At the same time, libraries remain largely dependent on public financing, and hence they compete
for state funding with other institutions and activities. Accordingly, it is important for policy makers to understand
the benefits and impact generated by the public library system today.
This report presents a study with the purpose of analysing and quantifying the economic impact of public libraries
in Latvia and to produce indicators of the return on investment in public libraries. Consequently, the report
provides an assessment of the monetary and non-monetary value and benefits generated by libraries. A
comparison of these benefits with costs allows estimating the ratio of benefits to cost in the public library system.
The present study is unique in the sense that it covers all public libraries in Latvia (more than 800) rather than
individual libraries that have been considered in various studies before. The study is based on a substantial
dataset – the survey sample included 3,004 individuals comprising 0.14% of population in all regions of Latvia.
This allows making inferences at a regional level. The data collected allows estimation over a 3-year period (2008-
2010) and the results can be analysed from both national and regional perspective. This makes the study the first
of its kind and establishes a framework for future evaluation of the impact of public libraries.
The data sources for this study are twofold – part of the data comes from the annual national statistics provided
by libraries; the other part of data has been assembled using specially conducted surveys. Altogether 596 heads
of public libraries and 1 246 librarians took part in the survey. In order to estimate the benefits generated by
public libraries in Latvia the contingent valuation method was used with the aim to identify a monetary estimate
of the subjective value of a good or service consumed or enjoyed by an individual in a given quantity. Two ways of
approaching this valuation were used: willingness to pay (WTP) that represents what a person would be willing to
pay to ensure that he/she continues to enjoy the good or service rather than go without and the willingness to
accept (WTA) that represents how much a person has to be compensated to leave wellbeing the same without
the service as it is with. It should be noted that the data used for calculating benefits of services represent the
most conservative approach in order to avoid overstating the benefits.
Results of the study indicate that the annual average total benefit created by public libraries in Latvia over 2008-
2010 was almost 23.8 million lats while the annual costs of the library system were just over 17 million lats. The
resulting net benefits were nearly 6.5 million lats annually.
The study has also identified important non-monetary benefits generated by the library system. These include in
particular the role of the library as a social space which enables socialising and networking. For less well-off
people the availability of free of charge services is also important. People also highlight the important role of
public libraries as a force for education, information circulation and culture besides their traditional role as a
source of the newest literature. The results indicate that the greatest net benefits of public libraries are gained
from services that allow free of charge access to various information sources, for example, the use of PCs and
Internet (the benefit-cost ratio was 3,04), reading rooms (1,45) and lending service (1,42). Positive net benefits
were also revealed for exhibitions organised at public libraries making up
the benefit-cost ratio of 5,77. This shows a positive trend indicating that the basic services public libraries provide
yield monetary benefits that exceed the costs of those services.
Finally, the study suggests that the indirect monetary benefit of public libraries in Latvia is around 9.8 million lats
countrywide. However, it should be taken into account that indirect benefits are difficult to estimate. Thus, there
are limitations to precisely estimating the benefits of society that becomes more intelligent and knowledgeable
by the use of public libraries` services which broadens their view.

16.01.2012. Economic value and impact of public libraries in Latvia: Study report 5
Overall, the findings lead to a crucial conclusion suggesting that public libraries not only contribute to the cultural
development of society, but also serve a solid economic ground for their existence as the benefits they provide
outweigh the costs. It should be noted that the study does not suggest that public libraries should provide
chargeable services. Rather, it intends to identify the value of services public libraries provide that society would
be willing to pay for, which, in its turn, allows estimating in monetary terms the benefits created by public
libraries.
16.01.2012. Economic value and impact of public libraries in Latvia: Study report 6
ABBREVIATIONS
BMGF Bill & Melinda Gates Foundation
CAPI Computer-assisted personal interviewing
CATI Computer-assisted telephone interviewing
CAWI Computer-assisted web interviewing
h Hours
ICT Information and communication technologies
Ls or LVL Latvian lats
m Million
min. Minutes
PC Personal computer
ROI Return on investment
WiFi Wireless Internet
WTP Willingness to pay
WTA Willingness to accept
The report was prepared by Ieva Strode (SKDS SIA), Alfreds Vanags (The Baltic International Centre for Economic
Policy Studies), Renate Strazdina (Ernst & Young Baltic SIA), Janis Dirveiks (Ernst & Young Baltic SIA), Helena
Dombrovska (Ernst & Young Baltic SIA), Daina Pakalna (University of Latvia) un Kristine Paberza (State agency
„Culture Information Systems”).

16.01.2012. Economic value and impact of public libraries in Latvia: Study report 7
Public libraries in Latvia
16.01.2012. Economic value and impact of public libraries in Latvia: Study report 8
PUBLIC LIBRARIES IN LATVIA
The network of more than 800 public libraries
covers the entire territory of Latvia. Public libraries
provide access to information and knowledge in all
municipalities; it is one of the most democratic tools
for accessing information that is open to all age
groups. There is 1 library per 1,458 inhabitants in
regions, 1 library per 12,606 inhabitants in big cities
and 1 library per 25,326 inhabitants in Riga1.
Libraries in Latvia manage information resources,
provide research tools and help their users to locate
the information they seek. Public libraries in many
regions are also frontrunners in the use of the latest
information technologies. Besides the provision of
lending and other services, public libraries develop
electronic catalogues, digitalise their collections,
integrate their services with social networks and
serve as a tool for connecting their users to other
information seekers and providers via Internet.
Libraries also serve as a valuable tool for the
integration of disadvantaged groups of society.
Special equipment for people with visual
impairment is available in 36 libraries across Latvia.
These libraries also organise trainings on the use of
library resources for people with special needs.
The library system in Latvia consists of 1 831
libraries. This number includes:
1 national library;
1 national academic library;
52 libraries of higher education institutions;
38 special libraries;
910 school libraries;
829 public libraries (including 817
municipal libraries and Library for the Blind
with 7 branches).
The role of all libraries is enshrined in Library law.
According to the law, all libraries have the following
functions:
Establish and maintain the collection;
Ensure access to the national libraries’
collection and information systems;
Provide timely services of good quality to
library users;
Improve library staff skills through regular
trainings;
Provide information on the local collection
to be integrated into the national
catalogue;
Ensure the access of library services to
everyone;
Conserve and preserve historical materials
in library collection;
Install new information technologies in the
libraries;
Lend library collection free of charge;
Provide free of charge access to PCs and
Internet.
The national library develops and preserves the
national collection (this includes all national
literature and significant foreign literature) and
ensures its preservation for future generations. The
National library is also responsible for the national
bibliography database and fostering library sciences
in Latvia.
Public libraries are established under regional
municipalities. The services provided by public
libraries are integrated in the set of services
provided by municipalities. Libraries can have a
regional or local importance depending on the
number of their functions. There are 28 public
libraries of regional importance that provide
support to local libraries.
Below is a list of the main services provided at
public libraries in Latvia:
1. ICT training classes;
2. Lending (books, newspapers, CDs, DVDs, music scores, magazines, etc.);
3. Individual consultation on ICT;
4. Use of reading rooms;
5. Use of PCs and Internet;
6. Services for library users with disabilities;
7. Printing;
16.01.2012. Economic value and impact of public libraries in Latvia: Study report 9
8. Scanning;
9. Photocopying;
10. Organisation of public events;
11. Organisation of exhibitions;
12. Reference services;
13. Online and offline book reservations;
14. Delivery of books from other libraries;
15. Home delivery of books;
16. Organising sightseeing tours or theatre/ concert visits;
17. Movies screening;
18. Use of video or audio resources;
19. Access to online databases;
20. Entertainment (e.g. computer games);
21. Use of Skype;
22. Saving of information (on CD, DVD, USB or other drives)
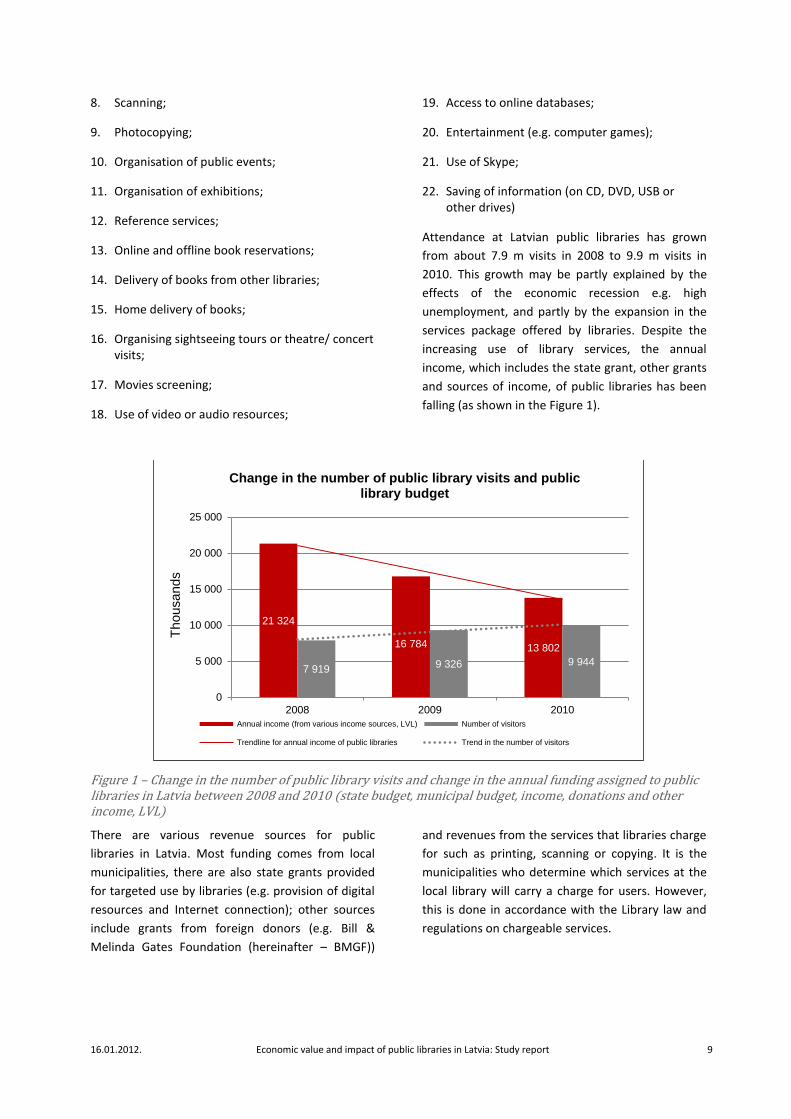
Attendance at Latvian public libraries has grown
from about 7.9 m visits in 2008 to 9.9 m visits in
2010. This growth may be partly explained by the
effects of the economic recession e.g. high
unemployment, and partly by the expansion in the
services package offered by libraries. Despite the
increasing use of library services, the annual
income, which includes the state grant, other grants
and sources of income, of public libraries has been
falling (as shown in the Figure 1).
Figure 1 – Change in the number of public library visits and change in the annual funding assigned to public libraries in Latvia between 2008 and 2010 (state budget, municipal budget, income, donations and other income, LVL)
There are various revenue sources for public
libraries in Latvia. Most funding comes from local
municipalities, there are also state grants provided
for targeted use by libraries (e.g. provision of digital
resources and Internet connection); other sources
include grants from foreign donors (e.g. Bill &
Melinda Gates Foundation (hereinafter – BMGF))
and revenues from the services that libraries charge
for such as printing, scanning or copying. It is the
municipalities who determine which services at the
local library will carry a charge for users. However,
this is done in accordance with the Library law and
regulations on chargeable services.
21 324
16 784 13 802
7 919 9 326 9 944
0
5 000
10 000
15 000
20 000
25 000
2008 2009 2010
Thousands
Change in the number of public library visits and public library budget
Annual income (from various income sources, LVL) Number of visitors
Trendline for annual income of public libraries Trend in the number of visitors
16.01.2012. Economic value and impact of public libraries in Latvia: Study report 10
INTRODUCTION TO THE STUDY
Latvian public libraries face many challenges in the
21st century. First, libraries are expected to deliver
traditional services in an environment of rapidly
changing technologies. Second, libraries are
expected to maintain high quality service taking into
account the social patterns defined by technological
innovations, urbanisation, globalisation and the
greater social role of public libraries in the
countryside. Thirdly, they are expected to operate in
ways that are financially sustainable. At the same
time, libraries remain largely dependent on public
financing, and hence they are in competition with
other institutions and activities for public funds.
Accordingly, it is important to understand the
benefits and impact generated by the public library
system today.
The purpose of this study is to analyse and quantify
the economic impact of public libraries in Latvia and
to produce indicators of the return on investment in
public libraries. To do this it is necessary to estimate
the value created by the services that libraries
provide. This involves assessment of the monetary
and non-monetary value and benefits generated by
libraries and when this is compared with costs this
enables estimation of the ratio of benefits to cost in
the public library system.
This is the final study in a larger project aiming at
assessing the impact of the investment in public
libraries. The first phase of the project involved
examination of foreign studies on the economic
impact of public libraries conducted in other
countries. This was done in order to determine the
approach to be taken for this study. The second part
of project involved analysis of the existing data and
studies done in Latvia in order to assess what
additional data was required for this study. The
third step involved designing a survey for the
necessary data collection which was followed by the
fourth step – the determination of the survey
sample. Then followed the fifth step: the survey and
the data collection. The final step was analysis of the
data to generate estimates of the value of libraries
and the services they provide. This report presents
the final stages of the project: the data analysis for
the library valuation based on the survey results and
impact assessment as well as the calculation of
return indicators. The aforementioned steps of the
project are summarised below and in section “Tasks
and activities of the project” of the Appendices:
1. Analysis of the foreign studies evaluating
impact of public libraries.
2. Analysis of previous studies and the existing
statistical data in Latvia about public libraries.
2.1. Data analysis of the existing studies.
2.2. Designing and testing the survey for the
collection of the necessary data.
2.3. Carrying out the research.
2.4. Data collection and organisation.
3. Data analysis for the calculation of the value
and economic impact of public libraries.
4. Estimation of the value and impact of public
libraries.
5. Calculation of benefit cost ratios and other
return indicators.
This is the first study of such kind in Latvia. Other
similar studies have been carried out abroad. The
present study is unusual in the sense that it covers
all public libraries in Latvia (more than 800) rather
than individual libraries as it has been done in
various studies before. The study is based on a
substantial dataset – the survey sample included
3,004 individuals (0.14% of population) in all regions
of Latvia. This allows making inferences at a regional
level. Questionnaires were also sent to all public
libraries (to both library directors and librarians) and
all local authorities in Latvia. The data collected
allows estimation over a 3-year period (2008-2010)
and the results can be analysed both from national
and regional perspective. This makes the study first
of such kind and establishes a strong framework for
future evaluation of the impact of public libraries.
The study has been conducted within the public
library development project “Father’s Third Son”
(“Trešais tēva dēls”) that has been financed by the
Bill & Melinda Gates Foundation, Latvian
government and municipalities.
16.01.2012. Economic value and impact of public libraries in Latvia: Study report 11
LIMITATIONS AND ASSUMPTIONS
The scale of the study determined a number of
limitations which required certain assumptions to
be made in order to generate usable results. Some
of the main issues are identified and discussed
below.
While the initial terms of reference required to
analyse the value of public libraries across time
(2007-2010), the contingent valuation method
used to determine the hypothetical value of
libraries and their services delivers results at
the particular moment in time (survey time –
2011). Thus the WTP and WTA results are for a
particular point in time.
The use of WTP and WTA methods has a
potential limitation that respondents may not
always be motivated to reveal their true
underlying willingness to pay. For example the
response to a WTP question might depend on
whether the respondent believed that what
they actually have to pay for a service depends
on their response. One approach to mitigate
some of the problems is to provide a “starting
value” for the service and ask the respondent
to agree or disagree to pay this amount of
money for the particular service. However,
according to the literature, this approach
contains potential bias – by suggesting an
approximate value that the user could use
regardless of the individual preferences or
capabilitiesii. In order to minimise bias, experts
involved in this study agreed to structure
questions in the following way. First ask
responders if they are willing to pay a certain
amount of money for library service. This first
amount was determined by experts taking into
account market prices of similar services or
other costs that are similar to the library
services in question. If the respondent
answered “yes” to the first question – a follow-
up question was asked – if the respondent
would pay more than the stated sum. If
responder said no – then the initial sum
(proposed) was recorded as the value given to
the service. If the responder was willing to pay
more – an open question of “how much would
you be willing to pay” for the service followed.
If the answer to the first question was “no”,
then the open question about the willingness
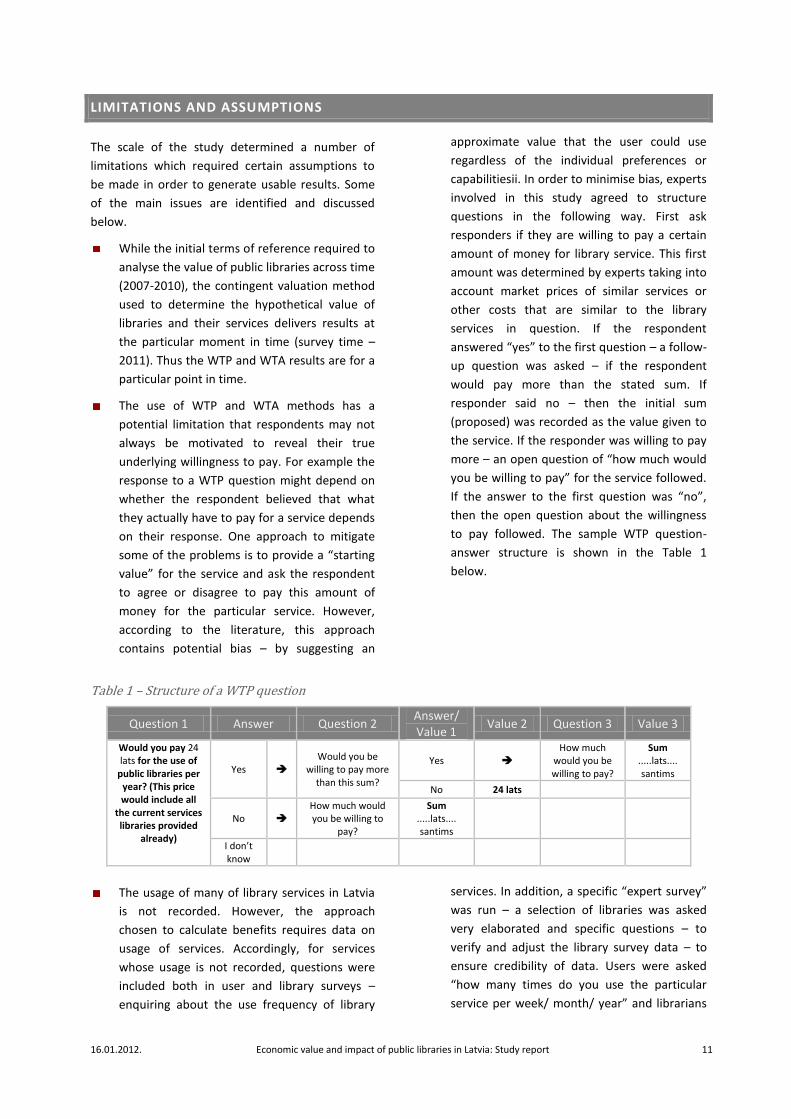
to pay followed. The sample WTP question-
answer structure is shown in the Table 1
below.
Table 1 – Structure of a WTP question
Question 1 Answer Question 2 Answer/ Value 1
Value 2 Question 3 Value 3
Would you pay 24 lats for the use of
public libraries per year? (This price would include all
the current services libraries provided
already)
Yes Would you be
willing to pay more than this sum?
Yes How much
would you be willing to pay?
Sum .....lats.... santims
No 24 lats
No How much would you be willing to
pay?
Sum .....lats.... santims
I don’t know
The usage of many of library services in Latvia
is not recorded. However, the approach
chosen to calculate benefits requires data on
usage of services. Accordingly, for services
whose usage is not recorded, questions were
included both in user and library surveys –
enquiring about the use frequency of library
services. In addition, a specific “expert survey”
was run – a selection of libraries was asked
very elaborated and specific questions – to
verify and adjust the library survey data – to
ensure credibility of data. Users were asked
“how many times do you use the particular
service per week/ month/ year” and librarians
16.01.2012. Economic value and impact of public libraries in Latvia: Study report 12
were asked “how many times is this service
used per day/ week/ month/ year”. The results
were later extrapolated to arrive at the usage
data per year. Therefore the results on the
value of library services can be evaluated from
the “viewpoint” of library staff (taking into
account their perception of how often they
provide services) and from the users’ point of
view (their perception of how often they use
certain library services. For services whose
usage is recorded – the official use statistics
was used in calculations rather than the
questionnaire data. For other services – it was
decided to use results from the data provided
by survey of library experts because users tend
to report exaggerated use of some services,
for example, because they mix use in libraries
with the usage of similar services elsewhere
(e.g. computer use at the library versus
computer use at home or at work). However,
the general library user survey generated very
similar results on the usage of services as did
the library expert survey – thereby further
strengthening the credibility of the data
provided by experts. This approach also has an
impact on the year-by-year comparison of
data.
Since the surveys provided a single “as-is”
situation regarding the WTP, benefit
calculations based on survey data cannot be
differentiated by year.
It is complicated to determine the exact cost of
each library service. A major part of costs is
staff salaries but there are multiple ways of
allocating salary costs to individual services
from the salaries data. One approach is to
determine the hourly pay for a librarian; then
multiply the hourly pay with the number of
times the service has been provided annually
and the time that each service provision took.
While the hourly pay can be precisely
determined from the official statistics, the
delivery times and duration of services are
variables that depend on the “opinion” of
either library staff or users. In order to
minimise the number of subjective variables
and increase the credibility of cost calculations
– different approach was taken. Library staff
was asked to indicate how many hours per
week they spend on delivering various
services. This data indicated on a weekly basis
the fraction of time that library staff spends on
each service. The same fraction was applied to
the total salaries paid to library staff annually
in order to arrive at the labour costs of each
service.
Similarly, it is difficult to allocate the overheads
(electricity, heating, water, rent, other services
or administrative expenses etc.) to each library
service. Libraries collect data on the annual
expenses for electricity, heating and some
related services. This data was used for the
calculation of overheads for services that
require substantial office space and resources
– such as reading rooms, collections and
computer rooms. Consequently for such
services as lending/ borrowing library
materials, or reading/ using library materials
on-site as well as the use of PCs the overheads
were calculated by first calculating the room-
space taken by the particular service – and
then calculating the proportion of the total
room-space taken by each service; this same
proportion was later attributed to the
expenses for electricity, heating and other
services in order to determine overheads for
the particular service.
For library services without significant room-
space (copying, printing, scanning, individual
consultations on ICT etc.), the overheads were
calculated at 25% of the total expenses on
salaries. This is a standard rate used to
calculate overhead expenses in many other
public sector studies in Latvia3.
When calculating total costs for library
services, expenses on investments in land,
buildings, refurbishment and renovations were
not taken into account because these
investments have long-term impact and any
significant investment can seriously distort the
data.
For the regional breakdown the official
statistical regions of Latvia4 were used rather
than the specific regional division used by
libraries.
16.01.2012. Economic value and impact of public libraries in Latvia: Study report 13
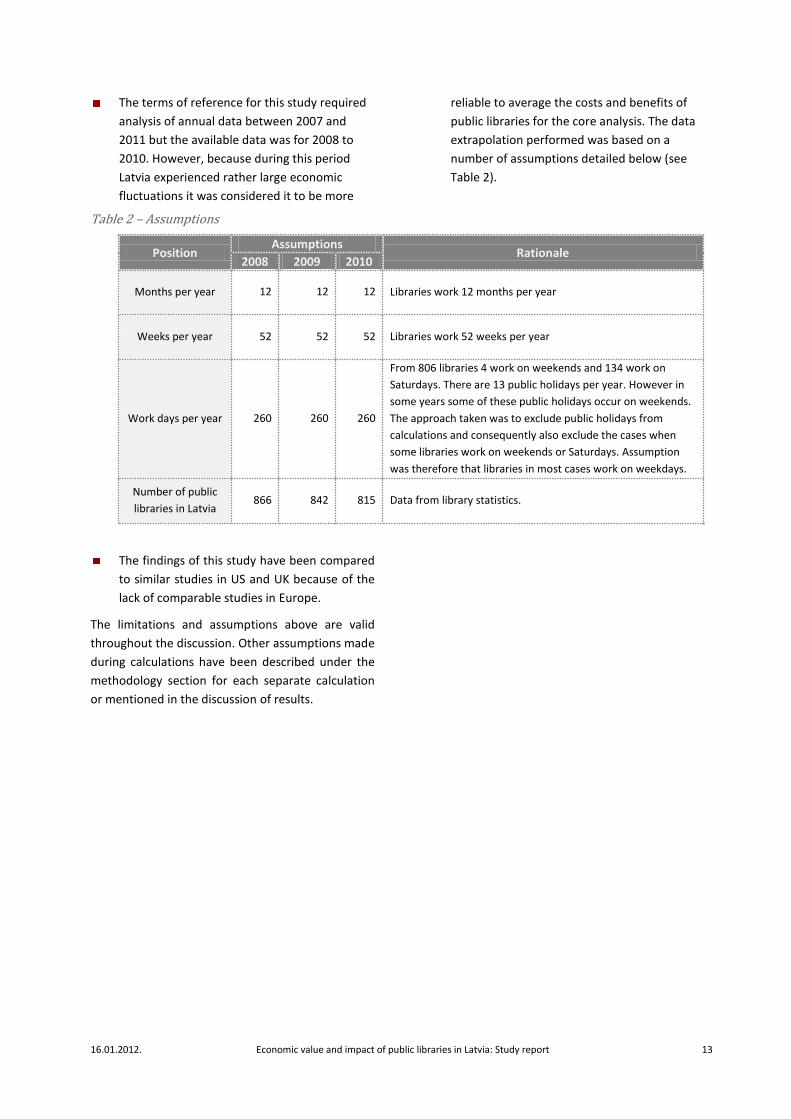
The terms of reference for this study required
analysis of annual data between 2007 and
2011 but the available data was for 2008 to
2010. However, because during this period
Latvia experienced rather large economic
fluctuations it was considered it to be more
reliable to average the costs and benefits of
public libraries for the core analysis. The data
extrapolation performed was based on a
number of assumptions detailed below (see
Table 2).
Table 2 – Assumptions
Position Assumptions
Rationale 2008 2009 2010
Months per year 12 12 12 Libraries work 12 months per year
Weeks per year 52 52 52 Libraries work 52 weeks per year
Work days per year 260 260 260
From 806 libraries 4 work on weekends and 134 work on
Saturdays. There are 13 public holidays per year. However in
some years some of these public holidays occur on weekends.
The approach taken was to exclude public holidays from
calculations and consequently also exclude the cases when
some libraries work on weekends or Saturdays. Assumption
was therefore that libraries in most cases work on weekdays.
Number of public
libraries in Latvia 866 842 815 Data from library statistics.
The findings of this study have been compared
to similar studies in US and UK because of the
lack of comparable studies in Europe.
The limitations and assumptions above are valid
throughout the discussion. Other assumptions made
during calculations have been described under the
methodology section for each separate calculation
or mentioned in the discussion of results.
16.01.2012. Economic value and impact of public libraries in Latvia: Study report 14
Methodology
16.01.2012. Economic value and impact of public libraries in Latvia: Study report 15
METHODOLOGY
This section outlines the general methodological
approach to the analysis.
GENERAL RESEARCH APPROACH
Types of Economic Impact of Public Libraries
The economic impact of public libraries can be
divided into costs and benefits which can be direct
or indirect. All these components have in some way
been accounted for in the study and are described
below:
Direct benefits – these are benefits that are
directly related to the use of library services
that can be measured, such as the number of
borrowed materials or the number of events
organised by libraries. Each of these services is
measured by assigning a value via the
population and library surveys (see approach
below).
Indirect benefits – these are benefits to society
or economy at large that accrue from the
existence and activities of libraries but they are
not directly captured by the use of library
services; these benefits are difficult to measure,
particularly assigning them a monetary value.
Indirect benefits are of two types – indirect
monetary benefits and indirect non-monetary
benefits:
Indirect monetary benefits – these are
secondary economic benefits emanating
from expenditures of libraries and library
clients that would not occur unless libraries
existed. These can be thought of as local or
regional multiplier effects. Employment
effects are also sometimes counted as
indirect benefits.
Indirect non-monetary benefits – these are
qualitative benefits that are related to the
existence of libraries and the services they
provide. Some examples of indirect non-
monetary benefits are that the use of
libraries helps to create a literate
population, the services provided by
libraries reduces social exclusion and
juvenile delinquency and the presence of a
library in a community might affect the
value of properties. Because of difficulties
in assessing indirect non-monetary
benefits, these effects have been estimated
via qualitative surveys of library users,
librarians and heads of local authorities.
Direct costs – are direct expenses of libraries
such as wages, purchase of library stock, capital
investments, operating expenses and any
overheads.
Indirect costs – are indirect costs related to the
existence of libraries – for example the travel
costs of library staff and users represent a ‘cost’
that does not appear in the budget of the
library service.
Ideally one would wish to quantify all costs and
benefits to arrive at the economic impact of the
library system. In practice there is insufficient data
to quantify the indirect effects. Accordingly, as
already noted the most important non-monetary
indirect benefits have been identified on the basis of
qualitative surveys; quantitative estimates of
indirect monetary benefits are offered using the
assumption that indirect benefits in Latvia are
similar in relation to the size of the library system as
those found in other countries.
16.01.2012. Economic value and impact of public libraries in Latvia: Study report 16
Data Scope and Sources
The data sources for this study are twofold – part of
the data comes from the annual national statistics
provided by libraries; the other part of data has
been assembled using specially conducted surveys.
Library data – comes from the annual library
reports in the period 2008-2010 containing
standardised set of information on library
infrastructure, use of libraries (number of users,
lending etc.), data on library collection (size),
data on library employees (number) and
financial indices (simplified balance sheet), data
on ICT as well as a number of ratios describing
the work efficiency of libraries.
Survey data – refers to an extensive survey of
library users, libraries and local authorities
carried out by the Marketing and Public Opinion
Research Centre SKDS in 2011 as well as
express-survey of selected library experts in
order to verify the general library survey data;
the survey sought to identify a contingent
valuation of libraries and library services, the
data on the use of library services and also
sought to identify the qualitative impact
(indirect benefits) of public libraries.
The survey had the following target audiences (also
indicates the surveying technique):
Employees of public libraries (via CAWI);
Users of public libraries (via CAPI);
Non-users of public libraries (via CAPI);
Chairpersons of local authorities (via CATI).
The survey was based upon a representative sample
containing at least 500 respondents in the 6
statistical regions of Latvia:
Rīga region;
Pierīga region (locality of Rīga);
Vidzeme region;
Latgale region;
Kurzeme region;
Zemgale region
Altogether 3,004 residents were surveyed (not less
than 500 in each region)5. In order to attribute the
data to the entire population – they were weighted
against the following features: region, nationality,
gender and age. All 119 municipalities were
approached (91 of which responded) and all public
libraries (more than 800) were included in the
survey. Altogether 596 heads of public libraries and
1 246 librarians took part in the survey.
The content of all survey questionnaires was agreed
with the impact assessment specialist of the project
and tested with real target audiences before the
actual survey took place. The results of library
survey were checked via library expert survey.
The scope of the survey and analysis involved not
only data on libraries as a whole but also data on
specific services that were selected by the impact
assessment specialists of the project. The following
specific library services were included in the
analysis:
1. ICT training classes;
2. Lending;
3. Individual consultations on ICT;
4. Reading;
5. Use of PCs and Internet;
6. Services for library users with disabilities;
7. Printing;
8. Scanning;
9. Photocopying;
10. Public events;
11. Exhibitions;
12. Reference services.
The analysis in this study interchangeably refers to
“library data” and “library staff data”; these
references imply that the data from either the
library annual statistics or the special tailored survey
of library staff and directors has been used. Overall
this indicates that the data came from inside
libraries and the results are based upon the opinion,
observations or measurements by library staff and
directors. The references to “user data” refer to the
results that have been calculated by using data from
the special survey of the public i.e. library users and
non-users – a representative survey of inhabitants
that was carried out specifically for this study.
16.01.2012. Economic value and impact of public libraries in Latvia: Study report 17
Valuation of Public Library Services
Public libraries and many of the services provided at
public libraries in Latvia are provided either free of
charge or at fees that do not fully reflect costs.
Accordingly, revenues cannot be used as a measure
of the benefits generated by the public library
system. The standard method of assessing
consumer benefits in cost benefit analysis is to
estimate consumer surplus and when there is
insufficient information to estimate a demand curve
from which consumers’ surplus could be calculated
a widely used approach is contingent valuation.
Contingent valuation is a survey based method of
eliciting the subjective valuation of a service or a
facility that is not provided through a market i.e.
that is not bought and sold. It is a method that is
widely used in other spheres, for example in the
valuation of environmental benefits. The survey of
foreign practice as well as the advice from project
experts therefore endorsed the use of contingent
valuation method as an appropriate instrument for
estimating the benefits generated by public
libraries.
The aim of the contingent valuation method is to
identify a monetary estimate of the subjective value
of a good or service consumed or enjoyed by an
individual in a given quantity. There are two ways of
approaching this valuation: one is to consider what
the person would be willing to pay to ensure that
she continues to enjoy the good or service rather
than go without. This is called the willingness to pay
(WTP). An alternative is to consider by how much
she has to be compensated to leave wellbeing the
same without the service as it is with. This is called
the willingness to accept (WTA)6.
These valuations are typically elicited by means of a
survey and both the WTP and WTA types of
questions were used in the survey conducted for the
project. Respondents were asked about their
willingness to pay (and willingness to accept) both
for libraries as such and for specific library services.
It should be noted that answers to WTP questions
are logically constrained by the ability of
respondents to pay (by their income), while answers
to WTA questions are not constrained in such a
way7 and some people may place very high values
on the compensation needed for the removal of a
service. Thus in general one would expect WTP to
be less than WTA.
16.01.2012. Economic value and impact of public libraries in Latvia: Study report 18
DETAILED METHODOLOGY FOR CALCULATIONS
General Approach to Cost Benefit Calculations
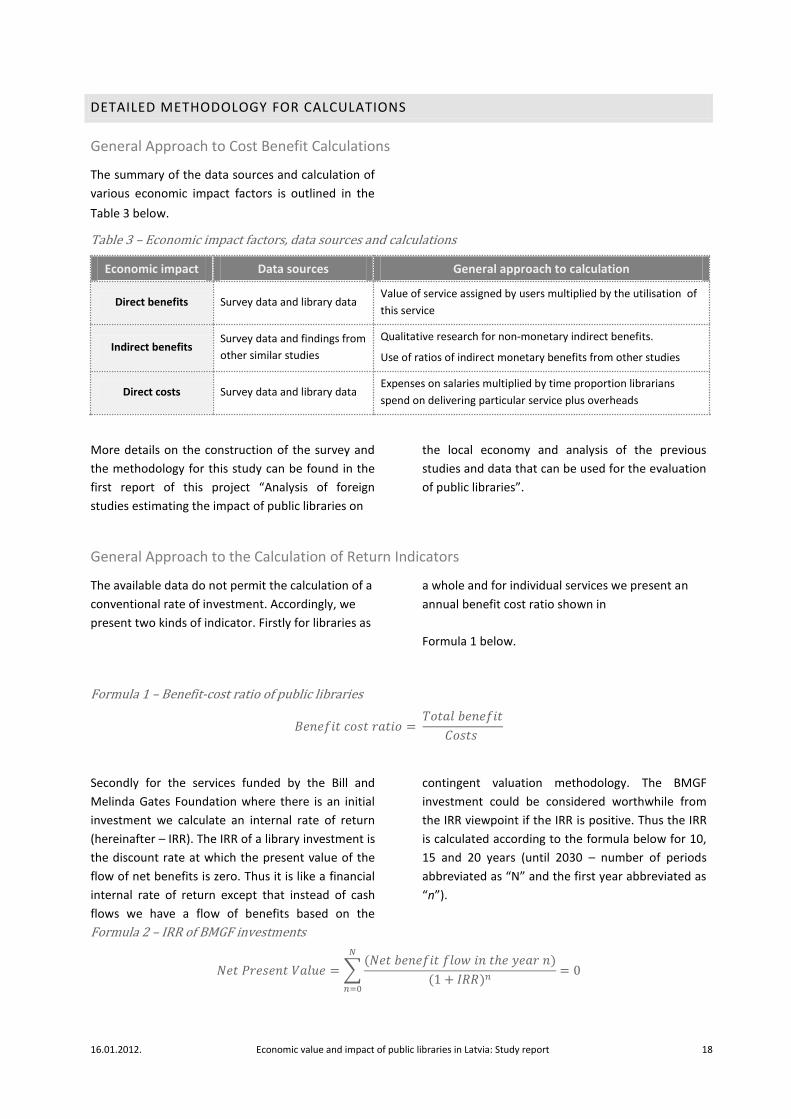
The summary of the data sources and calculation of
various economic impact factors is outlined in the
Table 3 below.
Table 3 – Economic impact factors, data sources and calculations
Economic impact Data sources General approach to calculation
Direct benefits Survey data and library data Value of service assigned by users multiplied by the utilisation of
this service
Indirect benefits Survey data and findings from
other similar studies
Qualitative research for non-monetary indirect benefits.
Use of ratios of indirect monetary benefits from other studies
Direct costs Survey data and library data Expenses on salaries multiplied by time proportion librarians
spend on delivering particular service plus overheads
More details on the construction of the survey and
the methodology for this study can be found in the
first report of this project “Analysis of foreign
studies estimating the impact of public libraries on
the local economy and analysis of the previous
studies and data that can be used for the evaluation
of public libraries”.
General Approach to the Calculation of Return Indicators
The available data do not permit the calculation of a
conventional rate of investment. Accordingly, we
present two kinds of indicator. Firstly for libraries as
a whole and for individual services we present an
annual benefit cost ratio shown in
Formula 1 below.
Formula 1 – Benefit-cost ratio of public libraries
Secondly for the services funded by the Bill and
Melinda Gates Foundation where there is an initial
investment we calculate an internal rate of return
(hereinafter – IRR). The IRR of a library investment is
the discount rate at which the present value of the
flow of net benefits is zero. Thus it is like a financial
internal rate of return except that instead of cash
flows we have a flow of benefits based on the
contingent valuation methodology. The BMGF
investment could be considered worthwhile from
the IRR viewpoint if the IRR is positive. Thus the IRR
is calculated according to the formula below for 10,
15 and 20 years (until 2030 – number of periods
abbreviated as “N” and the first year abbreviated as
“n”).
Formula 2 – IRR of BMGF investments
∑
16.01.2012. Economic value and impact of public libraries in Latvia: Study report 19
OVERALL ECONOMIC IMPACT OF PUBLIC LIBRARIES
The economic impact of public libraries is a
combination of the direct benefits produced by
public libraries and the indirect benefits to the local
or national economy that are generated by the
existence of libraries and their services. The overall
economic impact includes also the most important
non-monetary indirect benefits identified in the
survey.
Direct Benefit Calculation
Calculation of the economic impact and return
indicators of investment of public libraries first
depends on calculation of the value (or direct
economic benefit) of public libraries. This
constitutes the “return” and “impact” value of
libraries in monetary terms. The calculation of the
value of public libraries has been done by using the
contingent valuation method - measuring the
willingness of the members of society to pay (or
accept) for library services.
Valuation of the benefit of libraries as a whole
involves two components: one component
corresponds to the willingness to pay8 for libraries
as a whole – this can be interpreted as a kind of
‘option value’. The second component is the sum of
the willingness to pay for individual services.
Willingness to pay, based on the survey results, was
the valuation method used for all library services
even though some services are charged for. The
study included three paid-for services:
photocopying, scanning and printing. The surveys
showed that respondents typically value these
services higher than the prices they are charged i.e.
respondents were willing to pay more for the
services than their prices set at libraries. Therefore,
using revenues from paid services would understate
the benefit they generate. Accordingly, the
valuation of the benefit of all services, paid and
unpaid, was based on the survey results.
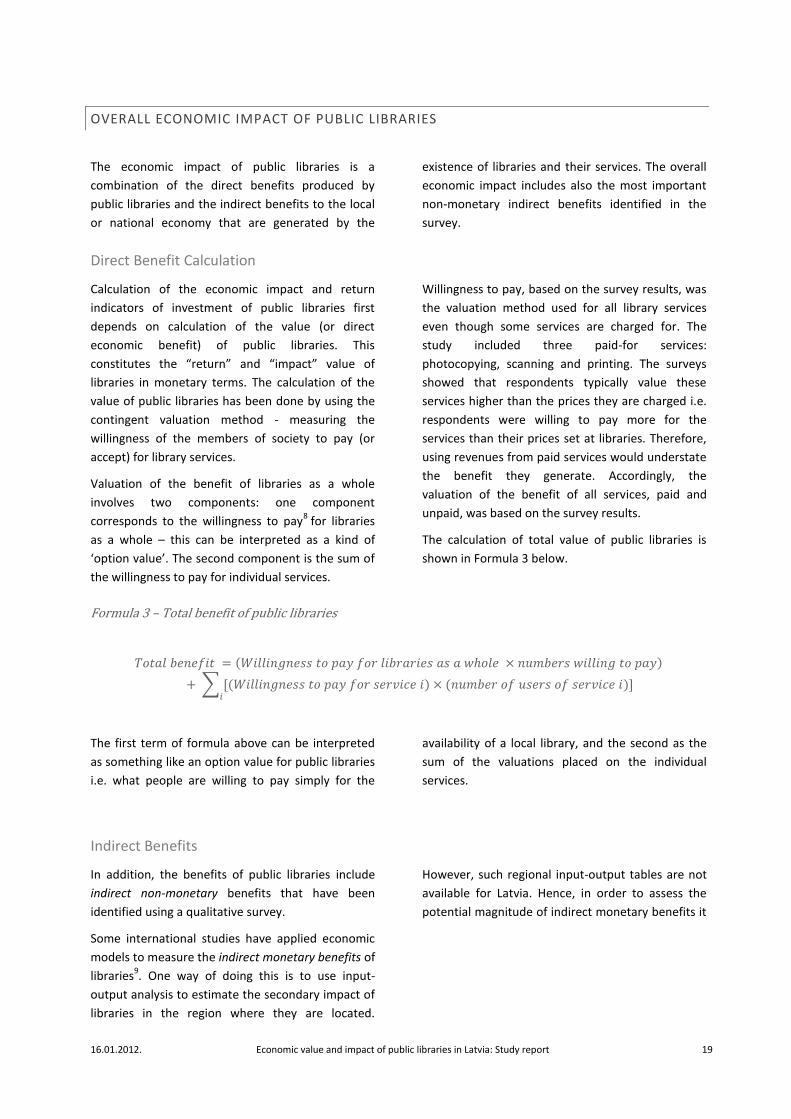
The calculation of total value of public libraries is
shown in Formula 3 below.
Formula 3 – Total benefit of public libraries
∑
The first term of formula above can be interpreted
as something like an option value for public libraries
i.e. what people are willing to pay simply for the
availability of a local library, and the second as the
sum of the valuations placed on the individual
services.
Indirect Benefits
In addition, the benefits of public libraries include
indirect non-monetary benefits that have been
identified using a qualitative survey.
Some international studies have applied economic
models to measure the indirect monetary benefits of
libraries9. One way of doing this is to use input-
output analysis to estimate the secondary impact of
libraries in the region where they are located.
However, such regional input-output tables are not
available for Latvia. Hence, in order to assess the
potential magnitude of indirect monetary benefits it
16.01.2012. Economic value and impact of public libraries in Latvia: Study report 20
was decided to use the evidence from experience
abroad. Since the services provided by libraries is
much the same across countries as is the technology
of delivering those services it was assumed that the
indirect monetary benefits are likely to be similar in
relation to direct benefits. The average of this ratio
was calculated from a number of international
studies an applied to Latvian libraries.
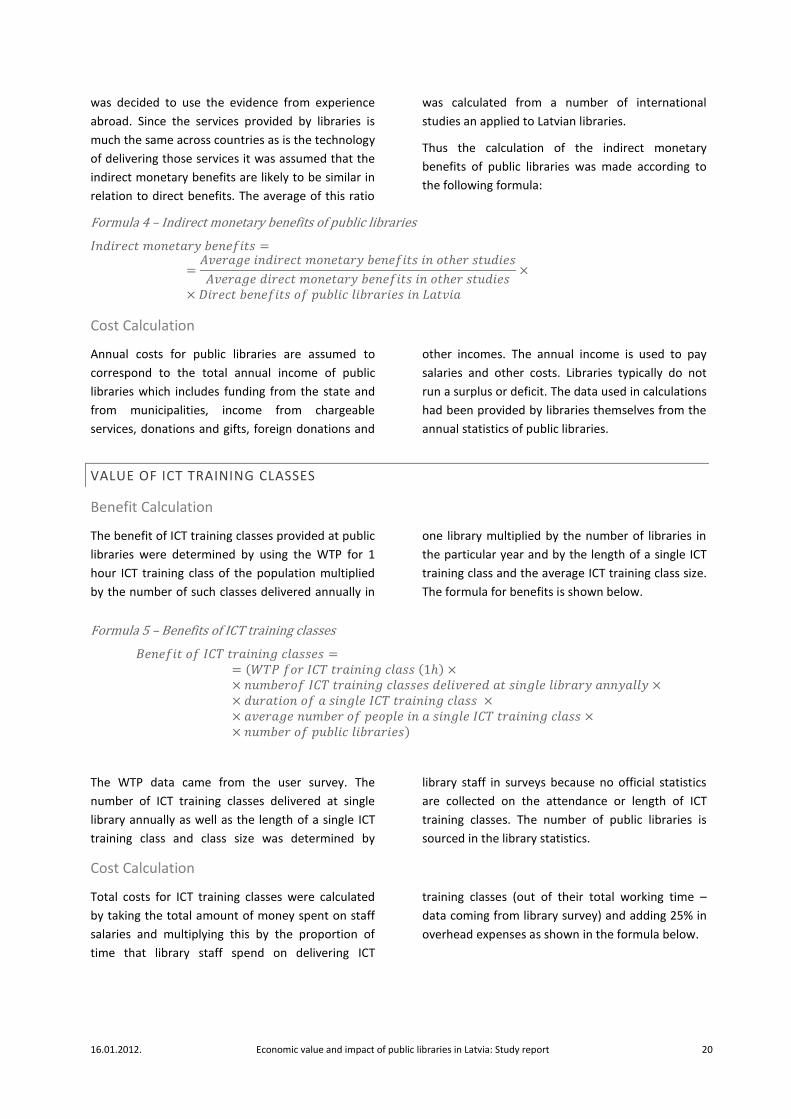
Thus the calculation of the indirect monetary
benefits of public libraries was made according to
the following formula:
Formula 4 – Indirect monetary benefits of public libraries
Cost Calculation
Annual costs for public libraries are assumed to
correspond to the total annual income of public
libraries which includes funding from the state and
from municipalities, income from chargeable
services, donations and gifts, foreign donations and
other incomes. The annual income is used to pay
salaries and other costs. Libraries typically do not
run a surplus or deficit. The data used in calculations
had been provided by libraries themselves from the
annual statistics of public libraries.
VALUE OF ICT TRAINING CLASSES
Benefit Calculation
The benefit of ICT training classes provided at public
libraries were determined by using the WTP for 1
hour ICT training class of the population multiplied
by the number of such classes delivered annually in
one library multiplied by the number of libraries in
the particular year and by the length of a single ICT
training class and the average ICT training class size.
The formula for benefits is shown below.
Formula 5 – Benefits of ICT training classes
The WTP data came from the user survey. The
number of ICT training classes delivered at single
library annually as well as the length of a single ICT
training class and class size was determined by
library staff in surveys because no official statistics
are collected on the attendance or length of ICT
training classes. The number of public libraries is
sourced in the library statistics.
Cost Calculation
Total costs for ICT training classes were calculated
by taking the total amount of money spent on staff
salaries and multiplying this by the proportion of
time that library staff spend on delivering ICT
training classes (out of their total working time –
data coming from library survey) and adding 25% in
overhead expenses as shown in the formula below.
16.01.2012. Economic value and impact of public libraries in Latvia: Study report 21
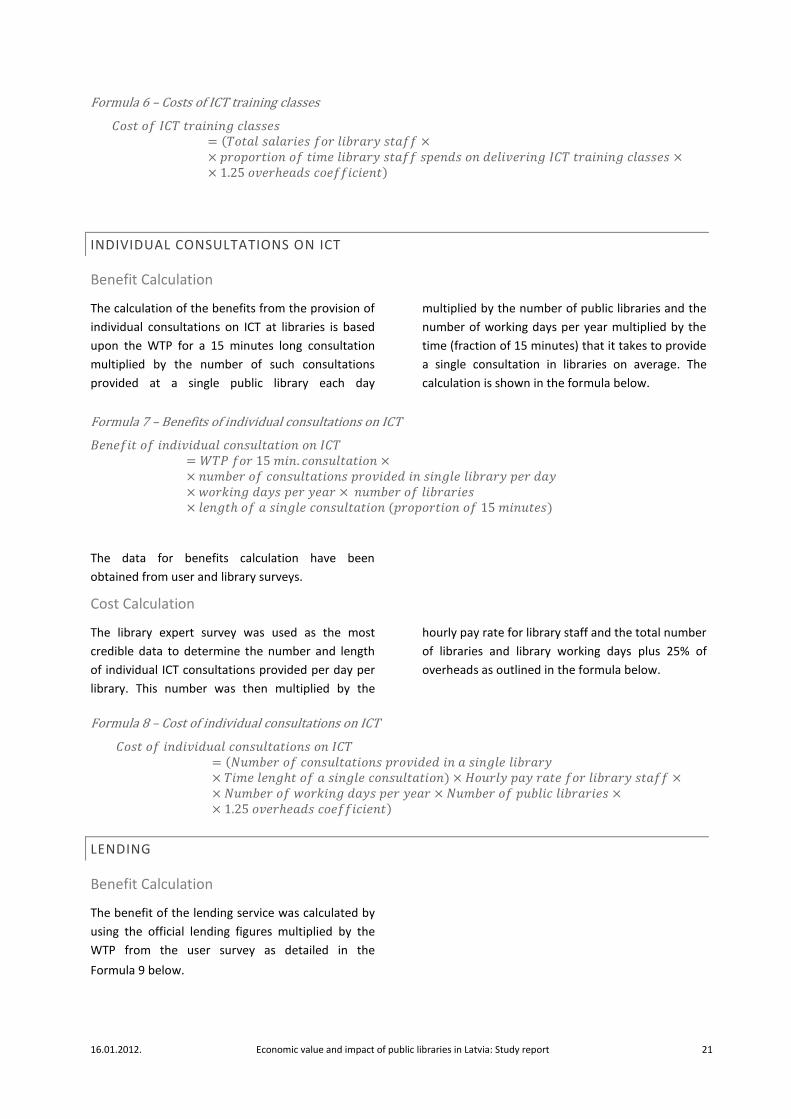
Formula 6 – Costs of ICT training classes
INDIVIDUAL CONSULTATIONS ON ICT
Benefit Calculation
The calculation of the benefits from the provision of
individual consultations on ICT at libraries is based
upon the WTP for a 15 minutes long consultation
multiplied by the number of such consultations
provided at a single public library each day
multiplied by the number of public libraries and the
number of working days per year multiplied by the
time (fraction of 15 minutes) that it takes to provide
a single consultation in libraries on average. The
calculation is shown in the formula below.
Formula 7 – Benefits of individual consultations on ICT
The data for benefits calculation have been
obtained from user and library surveys.
Cost Calculation
The library expert survey was used as the most
credible data to determine the number and length
of individual ICT consultations provided per day per
library. This number was then multiplied by the
hourly pay rate for library staff and the total number
of libraries and library working days plus 25% of
overheads as outlined in the formula below.
Formula 8 – Cost of individual consultations on ICT
LENDING
Benefit Calculation
The benefit of the lending service was calculated by
using the official lending figures multiplied by the
WTP from the user survey as detailed in the
Formula 9 below.
16.01.2012. Economic value and impact of public libraries in Latvia: Study report 22
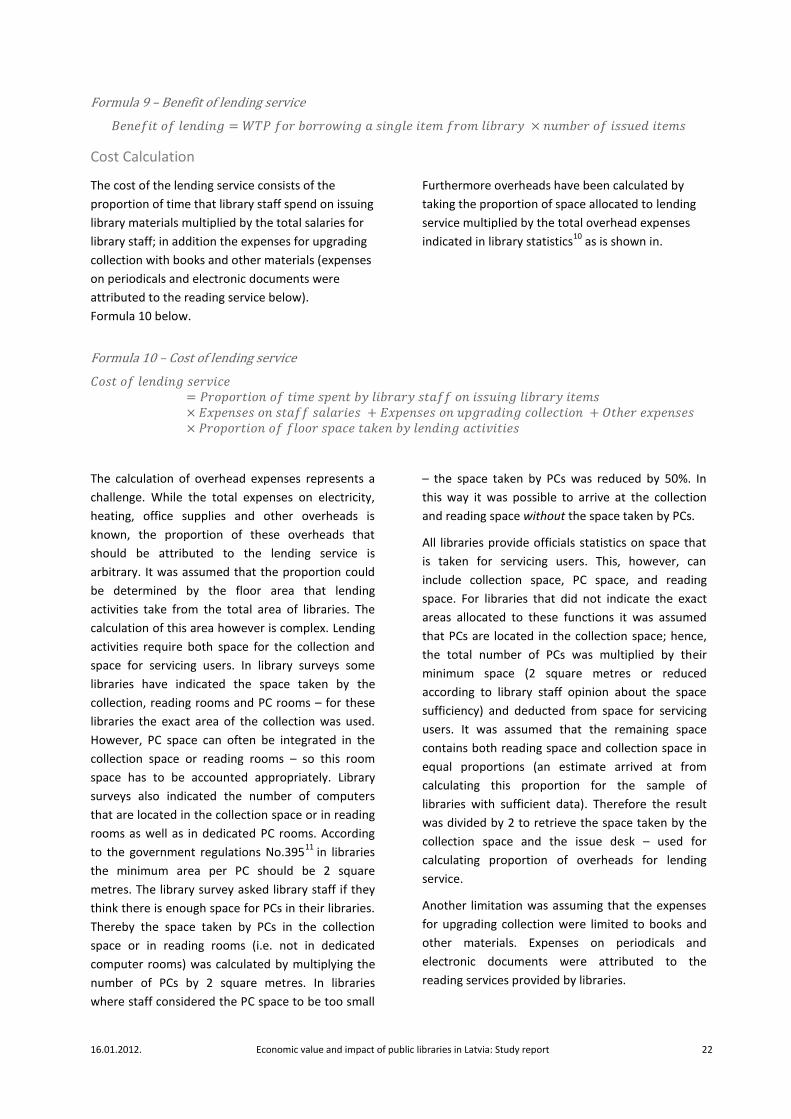
Formula 9 – Benefit of lending service
Cost Calculation
The cost of the lending service consists of the
proportion of time that library staff spend on issuing
library materials multiplied by the total salaries for
library staff; in addition the expenses for upgrading
collection with books and other materials (expenses
on periodicals and electronic documents were
attributed to the reading service below).
Furthermore overheads have been calculated by
taking the proportion of space allocated to lending
service multiplied by the total overhead expenses
indicated in library statistics10
as is shown in.
Formula 10 below.
Formula 10 – Cost of lending service
The calculation of overhead expenses represents a
challenge. While the total expenses on electricity,
heating, office supplies and other overheads is
known, the proportion of these overheads that
should be attributed to the lending service is
arbitrary. It was assumed that the proportion could
be determined by the floor area that lending
activities take from the total area of libraries. The
calculation of this area however is complex. Lending
activities require both space for the collection and
space for servicing users. In library surveys some
libraries have indicated the space taken by the
collection, reading rooms and PC rooms – for these
libraries the exact area of the collection was used.
However, PC space can often be integrated in the
collection space or reading rooms – so this room
space has to be accounted appropriately. Library
surveys also indicated the number of computers
that are located in the collection space or in reading
rooms as well as in dedicated PC rooms. According
to the government regulations No.39511
in libraries
the minimum area per PC should be 2 square
metres. The library survey asked library staff if they
think there is enough space for PCs in their libraries.
Thereby the space taken by PCs in the collection
space or in reading rooms (i.e. not in dedicated
computer rooms) was calculated by multiplying the
number of PCs by 2 square metres. In libraries
where staff considered the PC space to be too small
– the space taken by PCs was reduced by 50%. In
this way it was possible to arrive at the collection
and reading space without the space taken by PCs.
All libraries provide officials statistics on space that
is taken for servicing users. This, however, can
include collection space, PC space, and reading
space. For libraries that did not indicate the exact
areas allocated to these functions it was assumed
that PCs are located in the collection space; hence,
the total number of PCs was multiplied by their
minimum space (2 square metres or reduced
according to library staff opinion about the space
sufficiency) and deducted from space for servicing
users. It was assumed that the remaining space
contains both reading space and collection space in
equal proportions (an estimate arrived at from
calculating this proportion for the sample of
libraries with sufficient data). Therefore the result
was divided by 2 to retrieve the space taken by the
collection space and the issue desk – used for
calculating proportion of overheads for lending
service.
Another limitation was assuming that the expenses
for upgrading collection were limited to books and
other materials. Expenses on periodicals and
electronic documents were attributed to the
reading services provided by libraries.
16.01.2012. Economic value and impact of public libraries in Latvia: Study report 23
READING
Benefit Calculation
The benefit of the library reading rooms is
calculated by using the WTP for 1 hour use of library
reading rooms multiplied by the number of times
people use a single library reading room per day
multiplied by the number of hours each such visit
takes multiplied by the number of libraries and the
number of working days per year as has been
outlined in Formula 11 below.
Formula 11 – Benefit of reading rooms
The data for reading room benefits calculations
came from user surveys (WTP) and library surveys
(times of use, length of a single visit). The number of
working days per year is fixed at 260 while the
number of libraries changes over the time.
Cost Calculation
The costs of reading rooms were calculated in a
similar way to the lending service. Proportion of
time library staff spend on servicing reading rooms
was multiplied by total salaries for library staff plus
the expenses on periodicals and electronic
documents plus other expenses times the
proportion of floor space occupied by reading
rooms.
Formula 12 – Cost of reading service
The data for the calculation of reading room costs
was retrieved in exactly the same way as the data
for calculating the costs of the lending service.
USE OF PCS AND INTERNET
Benefit calculation
The benefit of the open access PC service at libraries
is calculated by taking the WTP for 1 hour use of PC
and Internet at a public library multiplied by the
number of times a PC is used at a public library per
day multiplied by the time of a single use of PC at
public libraries multiplied by the number of libraries
and the number of working days per year as is
outlined in Formula 13 below.
16.01.2012. Economic value and impact of public libraries in Latvia: Study report 24
Formula 13 – Value of PC/ Internet service
The data sources for the calculation is the user
survey (for WTP) and the library data on the
frequency of PCs use and the duration of such use.
Cost Calculation
The costs of the PCs and Internet use in public
libraries first takes the time that librarians spend on
servicing each service user – multiplying the
percentage of time librarians spend on this task by
the total salaries paid to library staff; then the
proportion of floor space taken by PCs relative to
the total floor space is attributed to the other
expenses (see description of calculating floor space
proportion above).
Formula 14 – Cost of PCs and Internet service
SERVICES FOR LIBRARY USERS WITH DISABILITIES
Benefit of Services for Users with Visual Impairment
The benefit of library services for users with
disabilities is calculated by multiplying the WTP for 1
hour use of special equipment by the number of
times such equipment is used in a library per day
multiplied by the length of time of each use of the
special equipment multiplied by the number of
libraries with the special equipment and by the
number of working days per year as outlined in the
Formula 15 below.
Formula 15 – Benefits of services for users with disabilities
The data sources for the calculation have been the
user surveys (WTP) and librarians (use frequency
and time)xii
.
16.01.2012. Economic value and impact of public libraries in Latvia: Study report 25
Cost of Services for Users with Visual Impairment
The cost of services for users with visual impairment
is calculated by multiplying the proportion of time
that library staff spend on servicing users with visual
impairment by the total salaries of the library staff
and the 25% overheads coefficient as is shown in
Formula 16 below.
Formula 16 – Cost of services for users with visual impairment
The proportion of the time spent on servicing users
with visual impairment is obtained from the survey
of library staff.
PRINTING
Benefit of Printing Services
The value of printing services provided at public
libraries is calculated by multiplying the WTP for
printing a single page by the number of printouts
generated at a single library per day multiplied by
the number of libraries and the number of working
days per year. This calculation is outlined in
Formula 17 below.
Formula 17 – Benefit of printing services
The data for the calculation is sourced from the user
survey (WTP) and the library survey (frequency of
use).
Cost of Printing Service
The cost of printing service is calculated by
multiplying the proportion of time that library staff
spend on providing printing service by the total
salaries of the library staff and the 25% overheads
coefficient as is shown in Formula 18 below.
Formula 18 – Cost of printing services
16.01.2012. Economic value and impact of public libraries in Latvia: Study report 26
The proportion of the time spent on printing
services is obtained from the survey of library staff.
SCANNING
Benefit of Scanning Services
The value of scanning services provided at public
libraries is calculated by multiplying the WTP for
scanning a single page by the number of scans
generated at a single library per day multiplied by
the number of libraries and the number of working
days per year. This calculation is outlined in
Formula 19 below.
Formula 19 – Benefit of scanning services
The data for the calculation is sourced from the user
survey (WTP) and the library survey (frequency of
use).
Cost of Scanning Service
The cost of scanning service is calculated by
multiplying the proportion of time that library staff
spends on providing scanning service by the total
salaries of the library staff and the 25% overheads
coefficient as is shown in Formula 20 below.
Formula 20 – Cost of scanning services
The proportion of the time spent on scanning
services is obtained from the survey of library staff.
PHOTOCOPYING
Benefit of Photocopying Services
The value of photocopying services provided at
public libraries is calculated by multiplying the WTP
for copying a single page by the number of copies
generated at a single library per day multiplied by
the number of libraries and the number of working
days per year. This calculation is outlined in
Formula 21 below.

16.01.2012. Economic value and impact of public libraries in Latvia: Study report 27
Formula 21 – Benefit of photocopying services
The data for the calculation is sourced from the user
survey (WTP) and the library survey (frequency of
use).
Cost of Photocopying Service
The cost of photocopying service is calculated by
multiplying the proportion of time that library staff
spend on providing photocopying service by total
salaries and the 25% overheads coefficient as is
shown in Formula 22 below.
Formula 22 – Cost of photocopying services
The proportion of the time spent on printing
services is obtained from the survey of library staff.
PUBLIC EVENTS
Benefit of Public Events at Libraries
The value of public events provided at public
libraries was calculated by multiplying the WTP for
attending a single public event organised at a public
library by the number of such events organised at
public libraries and multiplied by the number of
people that on average attend public events at
libraries. This calculation is outlined in Formula 23
below.
Formula 23 – Benefit of public events
The WTP data for the calculation comes from the
user survey, the number of public events is
accounted in the annual library statistics but the
average number of people that attend a public
event at library was based on estimates by
librarians.
Cost of Public Events at Libraries
The cost of public events organised at libraries was
calculated by multiplying the proportion of time
that library staff spend on preparing the events by
the total salaries of library staff and the 25%
overheads coefficient as is shown in Formula 24
below.
16.01.2012. Economic value and impact of public libraries in Latvia: Study report 28
Formula 24 – Cost of public events at libraries
The proportion of the time spent on preparing
public events was obtained from the survey of
library staff.
EXHIBITIONS
Benefit of Exhibitions at Public Libraries
The value of exhibitions was calculated by
multiplying the WTP for attending a single exhibition
organised at public library by the number of
exhibitions organised and multiplied by the number
of people that on average attend exhibitions at
libraries. This calculation is outlined in Formula 25
below.
Formula 25 – Benefit of exhibitions
The WTP data comes from the user survey, the
number of exhibitions is from annual library
statistics but the average number of people that
attend an exhibition was based on librarian
estimates.
Cost of Exhibitions at Public Libraries
The cost of exhibitions organised at libraries is
calculated by multiplying the proportion of time
that library staff spend on preparing an exhibition
by the total salaries of the library staff and the 25%
overheads coefficient as is shown in Formula 26
below.
Formula 26 – Cost of exhibitions at libraries
The proportion of the time spent on preparing
exhibitions was obtained from the survey of library
staff.
16.01.2012. Economic value and impact of public libraries in Latvia: Study report 29
REFERENCE SERVICES
Benefit of reference services
The benefit of reference services provided at public
libraries was calculated by multiplying the WTP for a
single reference by the number of references
provided in a library per day multiplied by the
number of libraries and the number of working days
per year. This calculation is outlined in Formula 27
below.
Formula 27 – Benefit of reference services
Cost of Reference Services
The cost of reference services at public libraries is
calculated by multiplying the proportion of time
that library staff spends on providing references by
the total salaries of the library staff and the 25%
overheads coefficient as is shown in Formula 28
below.
Formula 28 – Cost of reference services at libraries
The proportion of the time spent on providing
references was obtained from the survey of library
staff.

16.01.2012. Economic value and impact of public libraries in Latvia: Study report 30
Economic impact and benefit
– cost ratio of public libraries
16.01.2012. Economic value and impact of public libraries in Latvia: Study report 31
ECONOMIC IMPACT AND BENEFIT-COST RATIO OF PUBLIC LIBRARIES
SUMMARY OF FINDINGS OF ECONOMIC IMPACT OF PUBLIC LIBRARY SERVICES
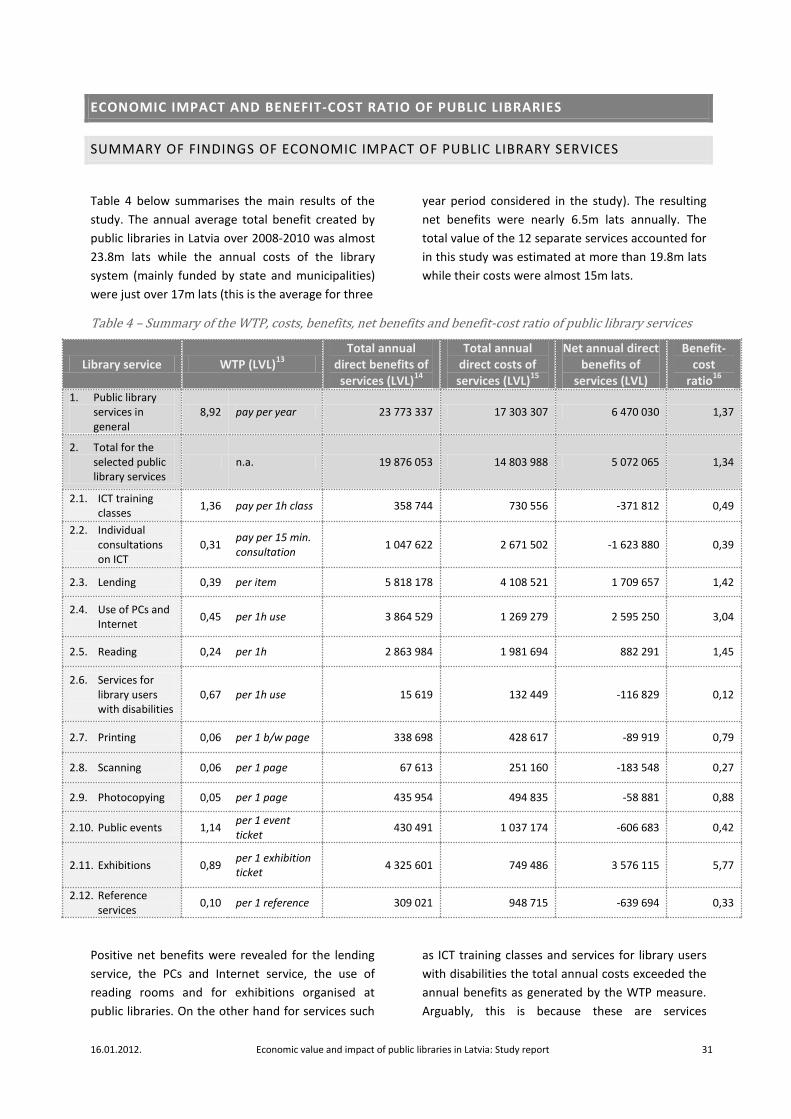
Table 4 below summarises the main results of the
study. The annual average total benefit created by
public libraries in Latvia over 2008-2010 was almost
23.8m lats while the annual costs of the library
system (mainly funded by state and municipalities)
were just over 17m lats (this is the average for three
year period considered in the study). The resulting
net benefits were nearly 6.5m lats annually. The
total value of the 12 separate services accounted for
in this study was estimated at more than 19.8m lats
while their costs were almost 15m lats.
Table 4 – Summary of the WTP, costs, benefits, net benefits and benefit-cost ratio of public library services
Library service WTP (LVL)13
Total annual
direct benefits of services (LVL)
14
Total annual direct costs of services (LVL)
15
Net annual direct benefits of
services (LVL)
Benefit-cost
ratio16
1. Public library
services in general
8,92 pay per year 23 773 337 17 303 307 6 470 030 1,37
2. Total for the selected public library services
n.a. 19 876 053 14 803 988 5 072 065 1,34
2.1. ICT training classes
1,36 pay per 1h class 358 744 730 556 -371 812 0,49
2.2. Individual consultations on ICT
0,31 pay per 15 min. consultation
1 047 622 2 671 502 -1 623 880 0,39
2.3. Lending 0,39 per item 5 818 178 4 108 521 1 709 657 1,42
2.4. Use of PCs and Internet
0,45 per 1h use 3 864 529 1 269 279 2 595 250 3,04
2.5. Reading 0,24 per 1h 2 863 984 1 981 694 882 291 1,45
2.6. Services for library users with disabilities
0,67 per 1h use 15 619 132 449 -116 829 0,12
2.7. Printing 0,06 per 1 b/w page 338 698 428 617 -89 919 0,79
2.8. Scanning 0,06 per 1 page 67 613 251 160 -183 548 0,27
2.9. Photocopying 0,05 per 1 page 435 954 494 835 -58 881 0,88
2.10. Public events 1,14 per 1 event ticket
430 491 1 037 174 -606 683 0,42
2.11. Exhibitions 0,89 per 1 exhibition ticket
4 325 601 749 486 3 576 115 5,77
2.12. Reference services
0,10 per 1 reference 309 021 948 715 -639 694 0,33
Positive net benefits were revealed for the lending
service, the PCs and Internet service, the use of
reading rooms and for exhibitions organised at
public libraries. On the other hand for services such
as ICT training classes and services for library users
with disabilities the total annual costs exceeded the
annual benefits as generated by the WTP measure.
Arguably, this is because these are services
16.01.2012. Economic value and impact of public libraries in Latvia: Study report 32
consumed by relatively low income people whose
WTP is constrained by income. As shown in the
sensitivity analysis reported in Table 12 of the
Appendices in some cases the use as WTA as the
benefit measure results in a closing of the gap
between costs and benefits
It should be noted that, the survey of staff time
spent on the nominated services did not fully
account for their working day. Some 15% of staff
time is spent on other activities rather than the ones
included in this study. These other services were not
explicitly included in the terms of reference of the
study but very likely to also produce positive
benefits.
OVERALL ECONOMIC IMPACT OF PUBLIC LIBRARIES
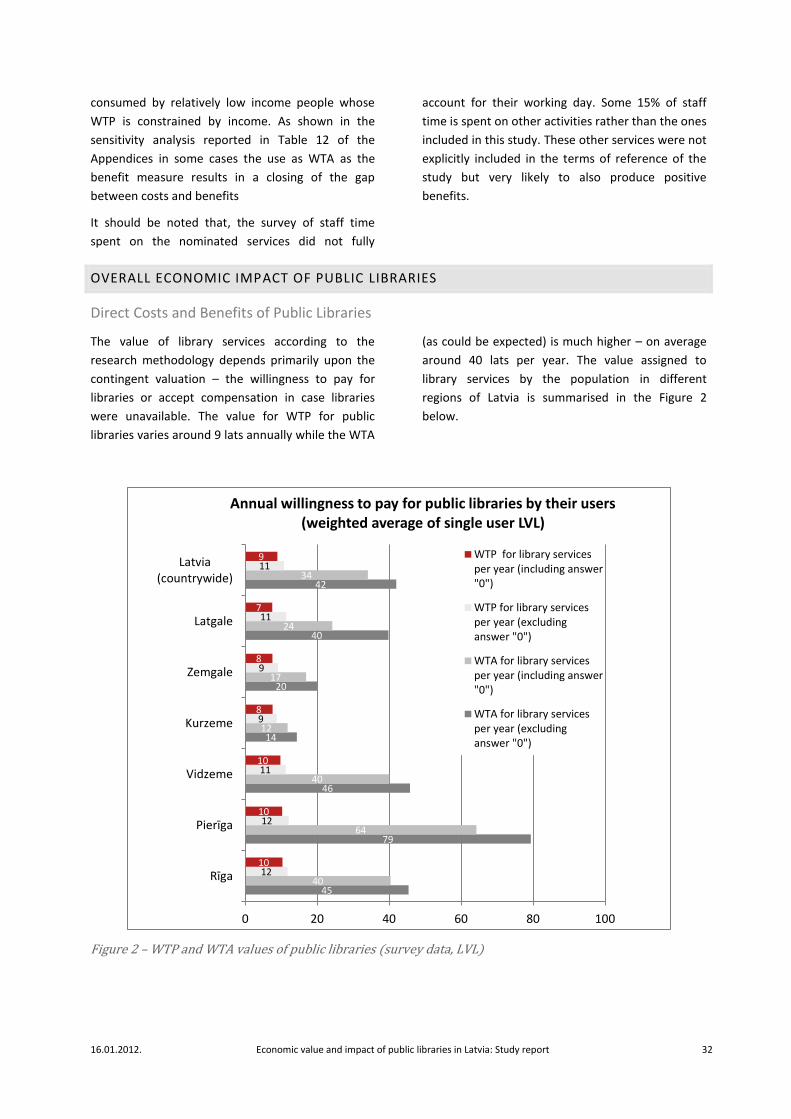
Direct Costs and Benefits of Public Libraries
The value of library services according to the
research methodology depends primarily upon the
contingent valuation – the willingness to pay for
libraries or accept compensation in case libraries
were unavailable. The value for WTP for public
libraries varies around 9 lats annually while the WTA
(as could be expected) is much higher – on average
around 40 lats per year. The value assigned to
library services by the population in different
regions of Latvia is summarised in the Figure 2
below.
Figure 2 – WTP and WTA values of public libraries (survey data, LVL)
45
79
46
14
20
40
42
40
64
40
12
17
24
34
12
12
11
9
9
11
11
10
10
10
8
8
7
9
0 20 40 60 80 100
Rīga
Pierīga
Vidzeme
Kurzeme
Zemgale
Latgale
Latvia(countrywide)
Annual willingness to pay for public libraries by their users (weighted average of single user LVL)
WTP for library servicesper year (including answer"0")
WTP for library servicesper year (excludinganswer "0")
WTA for library servicesper year (including answer"0")
WTA for library servicesper year (excludinganswer "0")
16.01.2012. Economic value and impact of public libraries in Latvia: Study report 33
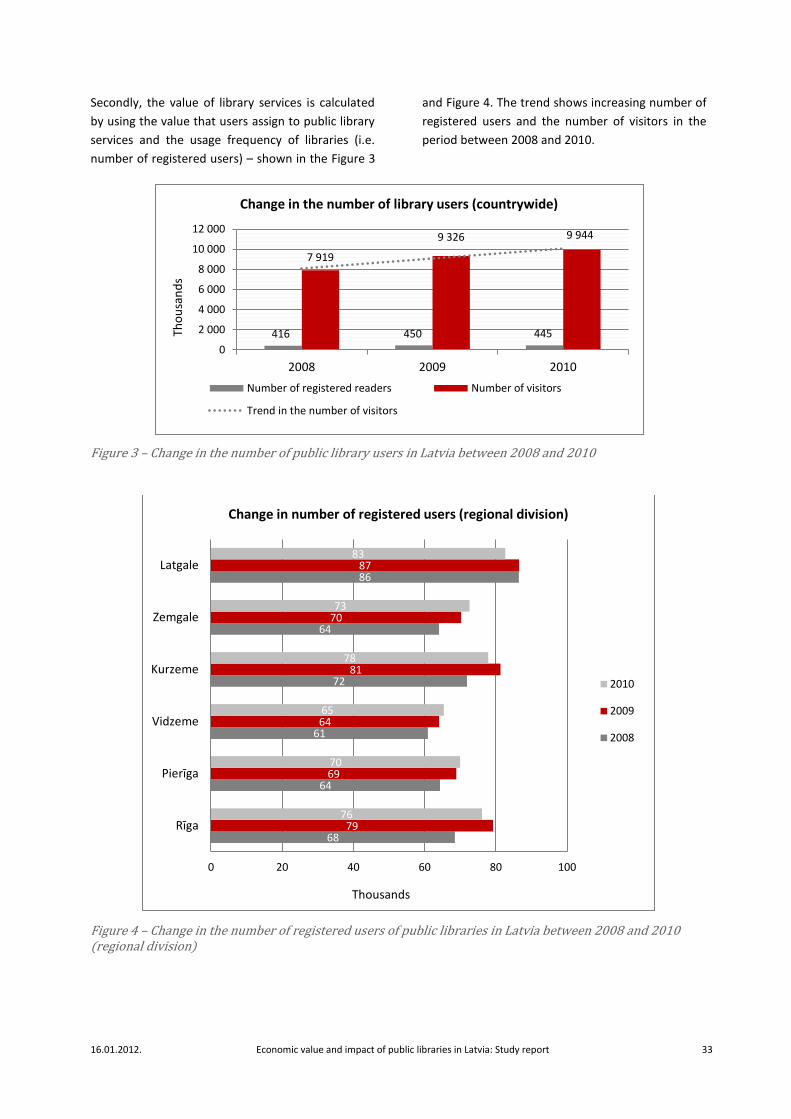
Secondly, the value of library services is calculated
by using the value that users assign to public library
services and the usage frequency of libraries (i.e.
number of registered users) – shown in the Figure 3
and Figure 4. The trend shows increasing number of
registered users and the number of visitors in the
period between 2008 and 2010.
Figure 3 – Change in the number of public library users in Latvia between 2008 and 2010
Figure 4 – Change in the number of registered users of public libraries in Latvia between 2008 and 2010 (regional division)
416 450 445
7 919
9 326 9 944
0
2 000
4 000
6 000
8 000
10 000
12 000
2008 2009 2010
Tho
usa
nd
s
Change in the number of library users (countrywide)
Number of registered readers Number of visitors
Trend in the number of visitors
68
64
61
72
64
86
79
69
64
81
70
87
76
70
65
78
73
83
0 20 40 60 80 100
Rīga
Pierīga
Vidzeme
Kurzeme
Zemgale
Latgale
Thousands
Change in number of registered users (regional division)
2010
2009
2008
16.01.2012. Economic value and impact of public libraries in Latvia: Study report 34
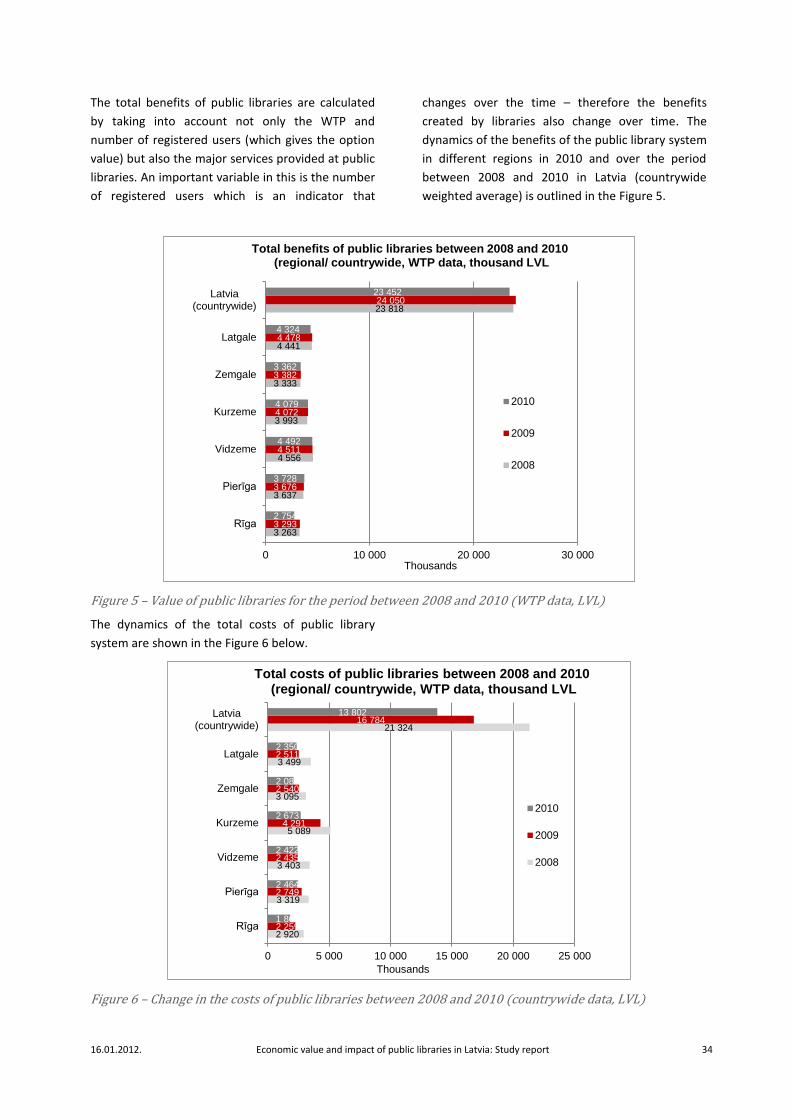
The total benefits of public libraries are calculated
by taking into account not only the WTP and
number of registered users (which gives the option
value) but also the major services provided at public
libraries. An important variable in this is the number
of registered users which is an indicator that
changes over the time – therefore the benefits
created by libraries also change over time. The
dynamics of the benefits of the public library system
in different regions in 2010 and over the period
between 2008 and 2010 in Latvia (countrywide
weighted average) is outlined in the Figure 5.
Figure 5 – Value of public libraries for the period between 2008 and 2010 (WTP data, LVL)
The dynamics of the total costs of public library
system are shown in the Figure 6 below.
Figure 6 – Change in the costs of public libraries between 2008 and 2010 (countrywide data, LVL)
3 263
3 637
4 556
3 993
3 333
4 441
23 818
3 293
3 676
4 511
4 072
3 382
4 478
24 050
2 754
3 728
4 492
4 079
3 362
4 324
23 452
0 10 000 20 000 30 000
Rīga
Pierīga
Vidzeme
Kurzeme
Zemgale
Latgale
Latvia(countrywide)
Thousands
Total benefits of public libraries between 2008 and 2010 (regional/ countrywide, WTP data, thousand LVL
2010
2009
2008
2 920
3 319
3 403
5 089
3 095
3 499
21 324
2 259
2 749
2 435
4 291
2 540
2 511
16 784
1 808
2 464
2 422
2 673
2 084
2 350
13 802
0 5 000 10 000 15 000 20 000 25 000
Rīga
Pierīga
Vidzeme
Kurzeme
Zemgale
Latgale
Latvia(countrywide)
Thousands
Total costs of public libraries between 2008 and 2010 (regional/ countrywide, WTP data, thousand LVL
2010
2009
2008
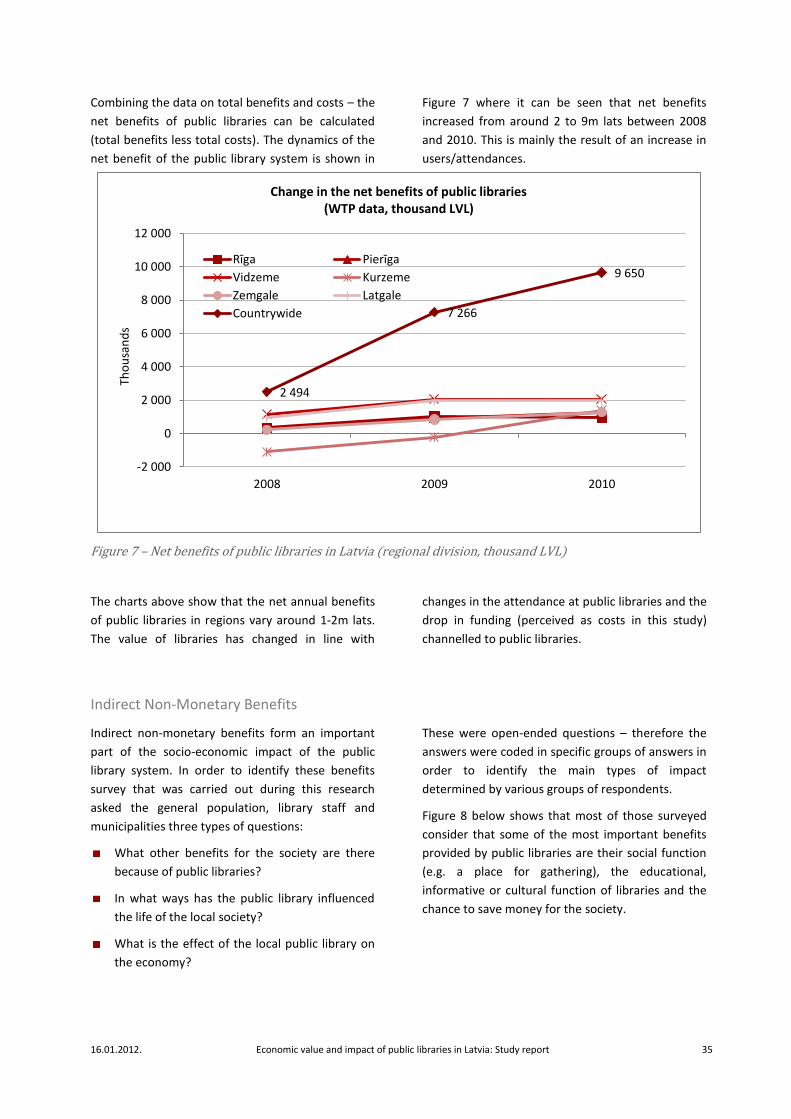
16.01.2012. Economic value and impact of public libraries in Latvia: Study report 35
Combining the data on total benefits and costs – the
net benefits of public libraries can be calculated
(total benefits less total costs). The dynamics of the
net benefit of the public library system is shown in
Figure 7 where it can be seen that net benefits
increased from around 2 to 9m lats between 2008
and 2010. This is mainly the result of an increase in
users/attendances.
Figure 7 – Net benefits of public libraries in Latvia (regional division, thousand LVL)
The charts above show that the net annual benefits
of public libraries in regions vary around 1-2m lats.
The value of libraries has changed in line with
changes in the attendance at public libraries and the
drop in funding (perceived as costs in this study)
channelled to public libraries.
Indirect Non-Monetary Benefits
Indirect non-monetary benefits form an important
part of the socio-economic impact of the public
library system. In order to identify these benefits
survey that was carried out during this research
asked the general population, library staff and
municipalities three types of questions:
What other benefits for the society are there
because of public libraries?
In what ways has the public library influenced
the life of the local society?
What is the effect of the local public library on
the economy?
These were open-ended questions – therefore the
answers were coded in specific groups of answers in
order to identify the main types of impact
determined by various groups of respondents.
Figure 8 below shows that most of those surveyed
consider that some of the most important benefits
provided by public libraries are their social function
(e.g. a place for gathering), the educational,
informative or cultural function of libraries and the
chance to save money for the society.
2 494
7 266
9 650
-2 000
0
2 000
4 000
6 000
8 000
10 000
12 000
2008 2009 2010
Tho
usa
nd
s
Change in the net benefits of public libraries (WTP data, thousand LVL)
Rīga Pierīga
Vidzeme Kurzeme
Zemgale Latgale
Countrywide
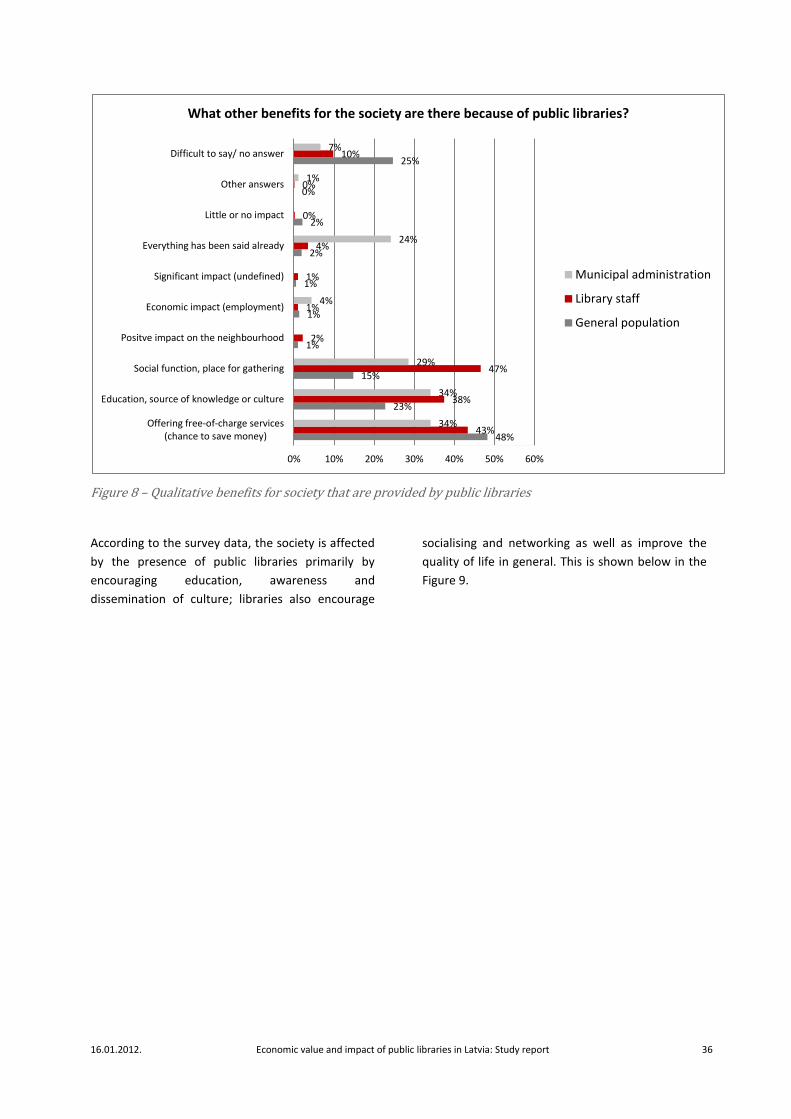
16.01.2012. Economic value and impact of public libraries in Latvia: Study report 36
Figure 8 – Qualitative benefits for society that are provided by public libraries
According to the survey data, the society is affected
by the presence of public libraries primarily by
encouraging education, awareness and
dissemination of culture; libraries also encourage
socialising and networking as well as improve the
quality of life in general. This is shown below in the
Figure 9.
48%
23%
15%
1%
1%
1%
2%
2%
0%
25%
43%
38%
47%
2%
1%
1%
4%
0%
0%
10%
34%
34%
29%
4%
24%
1%
7%
0% 10% 20% 30% 40% 50% 60%
Offering free-of-charge services(chance to save money)
Education, source of knowledge or culture
Social function, place for gathering
Positve impact on the neighbourhood
Economic impact (employment)
Significant impact (undefined)
Everything has been said already
Little or no impact
Other answers
Difficult to say/ no answer
What other benefits for the society are there because of public libraries?
Municipal administration
Library staff
General population
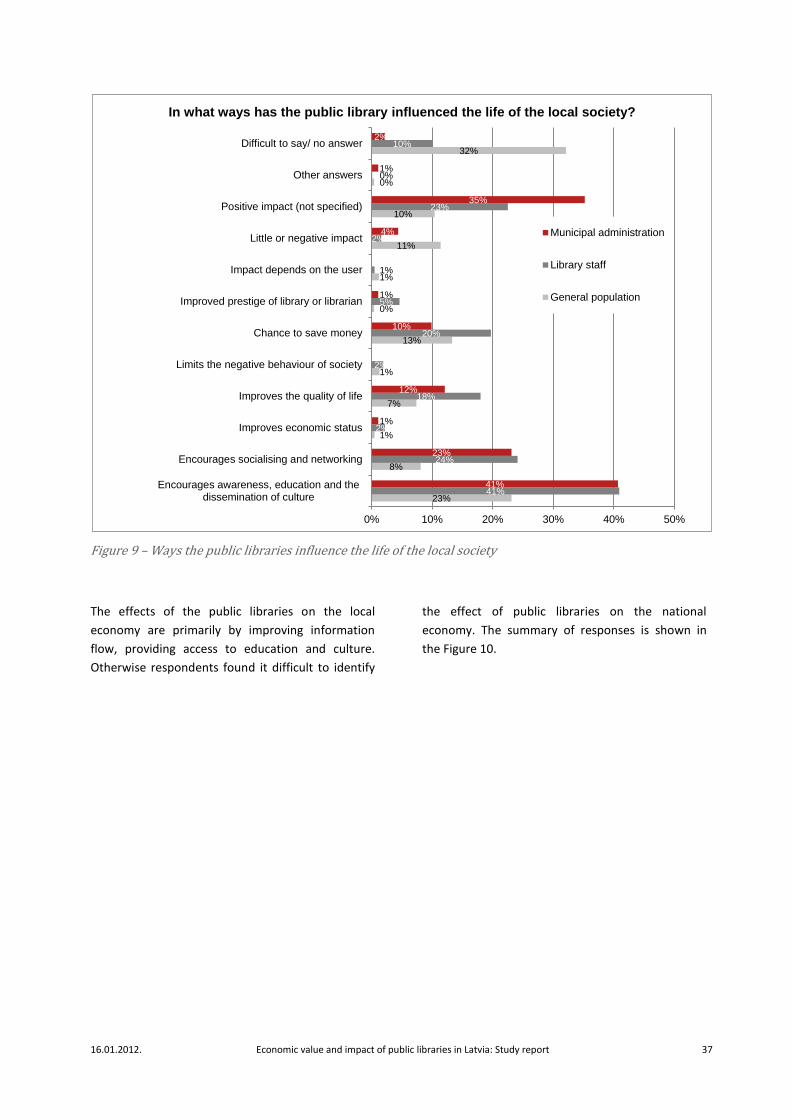
16.01.2012. Economic value and impact of public libraries in Latvia: Study report 37
Figure 9 – Ways the public libraries influence the life of the local society
The effects of the public libraries on the local
economy are primarily by improving information
flow, providing access to education and culture.
Otherwise respondents found it difficult to identify
the effect of public libraries on the national
economy. The summary of responses is shown in
the Figure 10.
23%
8%
1%
7%
1%
13%
0%
1%
11%
10%
0%
32%
41%
24%
2%
18%
2%
20%
5%
1%
2%
23%
0%
10%
41%
23%
1%
12%
10%
1%
4%
35%
1%
2%
0% 10% 20% 30% 40% 50%
Encourages awareness, education and thedissemination of culture
Encourages socialising and networking
Improves economic status
Improves the quality of life
Limits the negative behaviour of society
Chance to save money
Improved prestige of library or librarian
Impact depends on the user
Little or negative impact
Positive impact (not specified)
Other answers
Difficult to say/ no answer
In what ways has the public library influenced the life of the local society?
Municipal administration
Library staff
General population
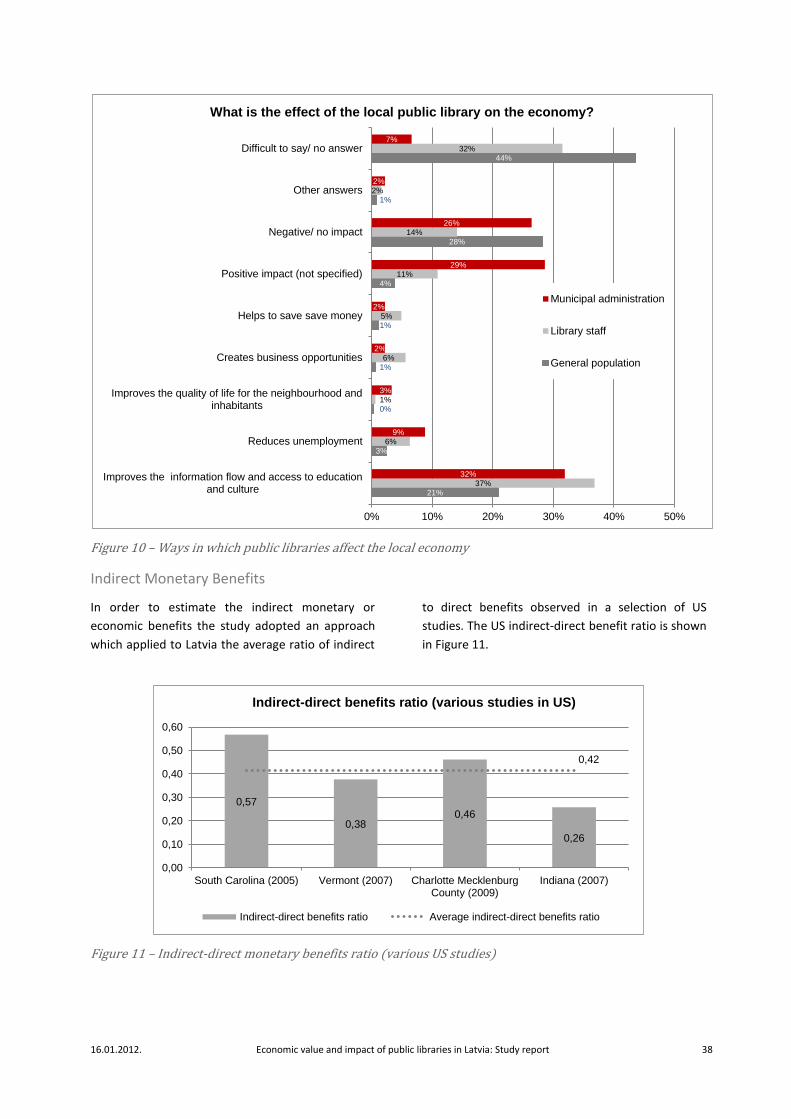
16.01.2012. Economic value and impact of public libraries in Latvia: Study report 38
Figure 10 – Ways in which public libraries affect the local economy
Indirect Monetary Benefits
In order to estimate the indirect monetary or
economic benefits the study adopted an approach
which applied to Latvia the average ratio of indirect
to direct benefits observed in a selection of US
studies. The US indirect-direct benefit ratio is shown
in Figure 11.
Figure 11 – Indirect-direct monetary benefits ratio (various US studies)
21%
3%
0%
1%
1%
4%
28%
1%
44%
37%
6%
1%
6%
5%
11%
14%
2%
32%
32%
9%
3%
2%
2%
29%
26%
2%
7%
0% 10% 20% 30% 40% 50%
Improves the information flow and access to educationand culture
Reduces unemployment
Improves the quality of life for the neighbourhood andinhabitants
Creates business opportunities
Helps to save save money
Positive impact (not specified)
Negative/ no impact
Other answers
Difficult to say/ no answer
What is the effect of the local public library on the economy?
Municipal administration
Library staff
General population
0,57
0,38 0,46
0,26
0,42
0,00
0,10
0,20
0,30
0,40
0,50
0,60
South Carolina (2005) Vermont (2007) Charlotte MecklenburgCounty (2009)
Indiana (2007)
Indirect-direct benefits ratio (various studies in US)
Indirect-direct benefits ratio Average indirect-direct benefits ratio
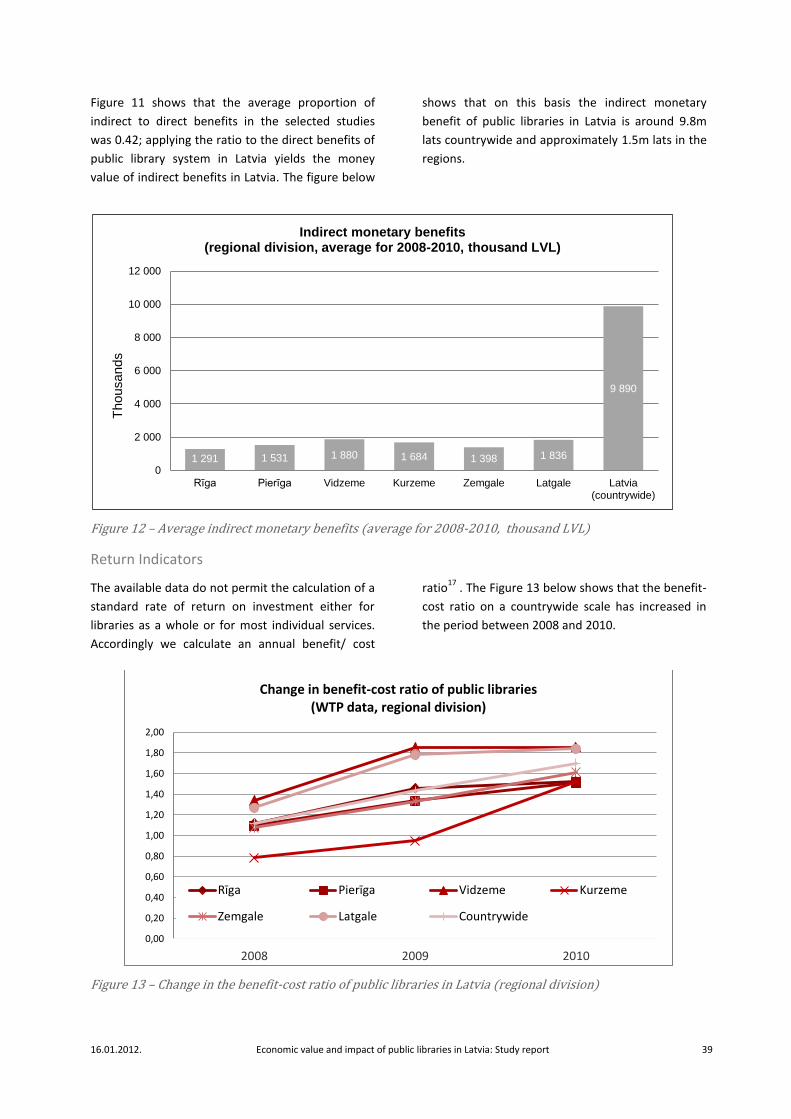
16.01.2012. Economic value and impact of public libraries in Latvia: Study report 39
Figure 11 shows that the average proportion of
indirect to direct benefits in the selected studies
was 0.42; applying the ratio to the direct benefits of
public library system in Latvia yields the money
value of indirect benefits in Latvia. The figure below
shows that on this basis the indirect monetary
benefit of public libraries in Latvia is around 9.8m
lats countrywide and approximately 1.5m lats in the
regions.
Figure 12 – Average indirect monetary benefits (average for 2008-2010, thousand LVL)
Return Indicators
The available data do not permit the calculation of a
standard rate of return on investment either for
libraries as a whole or for most individual services.
Accordingly we calculate an annual benefit/ cost
ratio17
. The Figure 13 below shows that the benefit-
cost ratio on a countrywide scale has increased in
the period between 2008 and 2010.
Figure 13 – Change in the benefit-cost ratio of public libraries in Latvia (regional division)
1 291 1 531 1 880 1 684 1 398 1 836
9 890
0
2 000
4 000
6 000
8 000
10 000
12 000
Rīga Pierīga Vidzeme Kurzeme Zemgale Latgale Latvia(countrywide)
Thousands
Indirect monetary benefits (regional division, average for 2008-2010, thousand LVL)
0,00
0,20
0,40
0,60
0,80
1,00
1,20
1,40
1,60
1,80
2,00
2008 2009 2010
Change in benefit-cost ratio of public libraries (WTP data, regional division)
Rīga Pierīga Vidzeme Kurzeme
Zemgale Latgale Countrywide
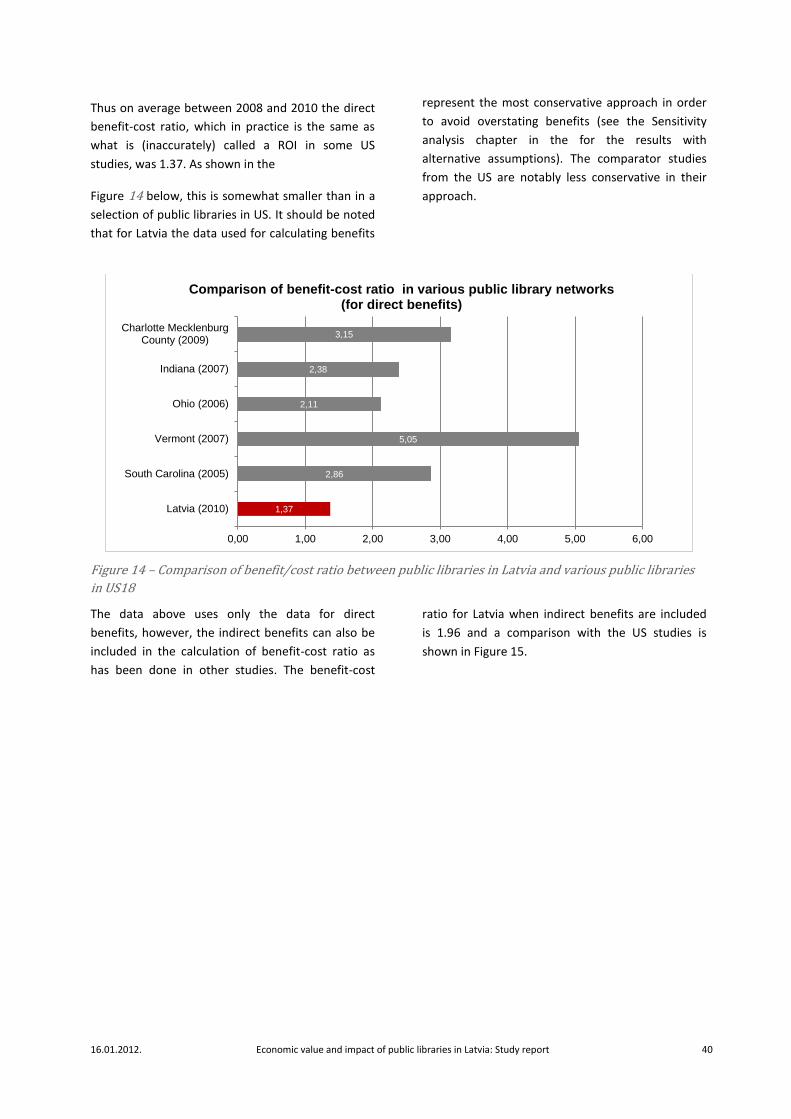
16.01.2012. Economic value and impact of public libraries in Latvia: Study report 40
Thus on average between 2008 and 2010 the direct
benefit-cost ratio, which in practice is the same as
what is (inaccurately) called a ROI in some US
studies, was 1.37. As shown in the
Figure 14 below, this is somewhat smaller than in a
selection of public libraries in US. It should be noted
that for Latvia the data used for calculating benefits
represent the most conservative approach in order
to avoid overstating benefits (see the Sensitivity
analysis chapter in the for the results with
alternative assumptions). The comparator studies
from the US are notably less conservative in their
approach.
Figure 14 – Comparison of benefit/cost ratio between public libraries in Latvia and various public libraries
in US18
The data above uses only the data for direct
benefits, however, the indirect benefits can also be
included in the calculation of benefit-cost ratio as
has been done in other studies. The benefit-cost
ratio for Latvia when indirect benefits are included
is 1.96 and a comparison with the US studies is
shown in Figure 15.
1,37
2,86
5,05
2,11
2,38
3,15
0,00 1,00 2,00 3,00 4,00 5,00 6,00
Latvia (2010)
South Carolina (2005)
Vermont (2007)
Ohio (2006)
Indiana (2007)
Charlotte MecklenburgCounty (2009)
Comparison of benefit-cost ratio in various public library networks (for direct benefits)

16.01.2012. Economic value and impact of public libraries in Latvia: Study report 41
Figure 15 – Benefit/cost ratio of total benefits of various public library networks19
The data shows that the benefit-cost ratio of public
libraries in Latvia is smaller than that in US public
libraries. There is a number of reasons for such
result some of which are that the study used the
most conservative approach in calculation of
benefits of services (see the differences in results
when using less conservative data in the Sensitivity
analysis of the Appendices), the compared studies
had much smaller scale – none of them included all
public libraries in a country and this study used
contingency analysis and users’ “willingness to pay”
for services for the benefit calculation that are
constrained by users’ ability to pay (can be
considered lower than that in US).
1,96
5,55
4,48
6,96
4,06
3,81
4,40
6,54
4,61
0,00 1,00 2,00 3,00 4,00 5,00 6,00 7,00 8,00
Latvia (2010)
Pennsylvania (2006)
South Carolina (2005)
Vermont (2007)
Wisconsin (2008)
Ohio (2006)
British Library
Florida (2004)
Charlotte MecklenburgCounty (2009)
Comparison of benefit-cost ratio in various public library networks (total benefits)
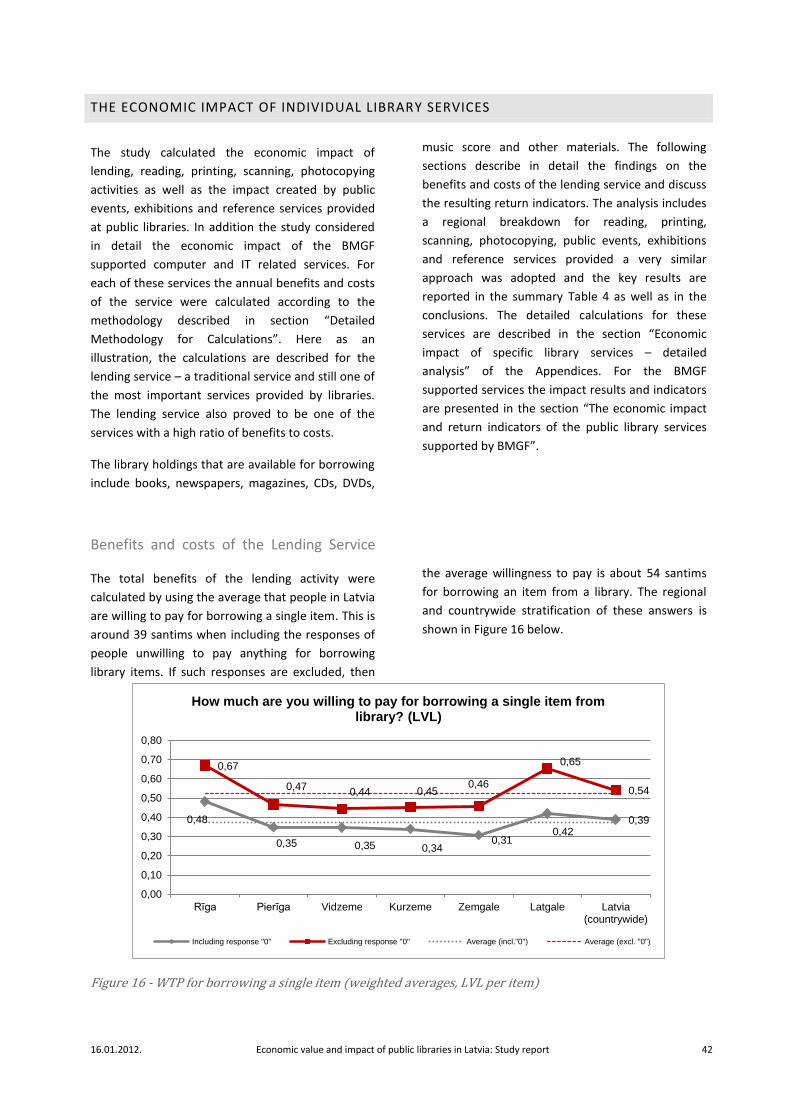
16.01.2012. Economic value and impact of public libraries in Latvia: Study report 42
THE ECONOMIC IMPACT OF INDIVIDUAL LIBRARY SERVICES
The study calculated the economic impact of
lending, reading, printing, scanning, photocopying
activities as well as the impact created by public
events, exhibitions and reference services provided
at public libraries. In addition the study considered
in detail the economic impact of the BMGF
supported computer and IT related services. For
each of these services the annual benefits and costs
of the service were calculated according to the
methodology described in section “Detailed
Methodology for Calculations”. Here as an
illustration, the calculations are described for the
lending service – a traditional service and still one of
the most important services provided by libraries.
The lending service also proved to be one of the
services with a high ratio of benefits to costs.
The library holdings that are available for borrowing
include books, newspapers, magazines, CDs, DVDs,
music score and other materials. The following
sections describe in detail the findings on the
benefits and costs of the lending service and discuss
the resulting return indicators. The analysis includes
a regional breakdown for reading, printing,
scanning, photocopying, public events, exhibitions
and reference services provided a very similar
approach was adopted and the key results are
reported in the summary Table 4 as well as in the
conclusions. The detailed calculations for these
services are described in the section “Economic
impact of specific library services – detailed
analysis” of the Appendices. For the BMGF
supported services the impact results and indicators
are presented in the section “The economic impact
and return indicators of the public library services
supported by BMGF”.
Benefits and costs of the Lending Service
The total benefits of the lending activity were
calculated by using the average that people in Latvia
are willing to pay for borrowing a single item. This is
around 39 santims when including the responses of
people unwilling to pay anything for borrowing
library items. If such responses are excluded, then
the average willingness to pay is about 54 santims
for borrowing an item from a library. The regional
and countrywide stratification of these answers is
shown in Figure 16 below.
Figure 16 - WTP for borrowing a single item (weighted averages, LVL per item)
0,48
0,35 0,35 0,34 0,31
0,42 0,39
0,67
0,47 0,44 0,45
0,46
0,65
0,54
0,00
0,10
0,20
0,30
0,40
0,50
0,60
0,70
0,80
Rīga Pierīga Vidzeme Kurzeme Zemgale Latgale Latvia(countrywide)
How much are you willing to pay for borrowing a single item from library? (LVL)
Including response "0" Excluding response "0" Average (incl."0") Average (excl. "0")
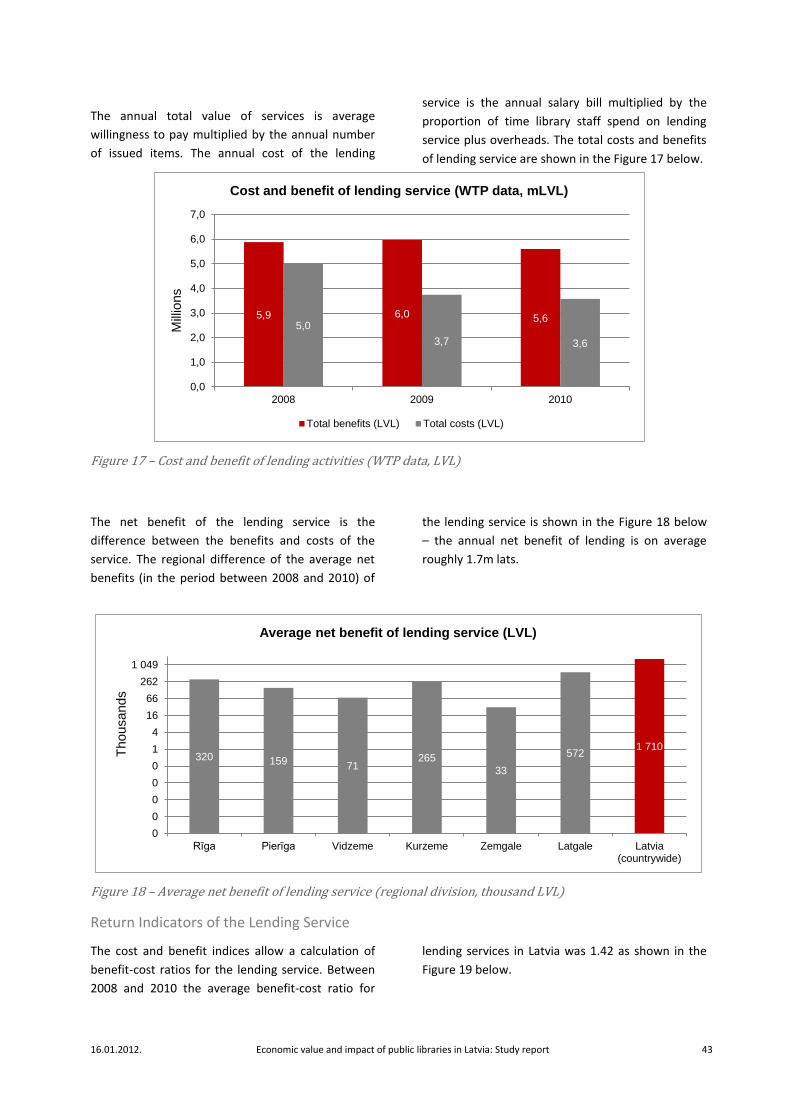
16.01.2012. Economic value and impact of public libraries in Latvia: Study report 43
The annual total value of services is average
willingness to pay multiplied by the annual number
of issued items. The annual cost of the lending
service is the annual salary bill multiplied by the
proportion of time library staff spend on lending
service plus overheads. The total costs and benefits
of lending service are shown in the Figure 17 below.
Figure 17 – Cost and benefit of lending activities (WTP data, LVL)
The net benefit of the lending service is the
difference between the benefits and costs of the
service. The regional difference of the average net
benefits (in the period between 2008 and 2010) of
the lending service is shown in the Figure 18 below
– the annual net benefit of lending is on average
roughly 1.7m lats.
Figure 18 – Average net benefit of lending service (regional division, thousand LVL)
Return Indicators of the Lending Service
The cost and benefit indices allow a calculation of
benefit-cost ratios for the lending service. Between
2008 and 2010 the average benefit-cost ratio for
lending services in Latvia was 1.42 as shown in the
Figure 19 below.
5,9 6,0 5,6 5,0
3,7 3,6
0,0
1,0
2,0
3,0
4,0
5,0
6,0
7,0
2008 2009 2010
Mill
ions
Cost and benefit of lending service (WTP data, mLVL)
Total benefits (LVL) Total costs (LVL)
320 159 71 265
33
572 1 710
0
0
0
0
0
1
4
16
66
262
1 049
Rīga Pierīga Vidzeme Kurzeme Zemgale Latgale Latvia(countrywide)
Thousands
Average net benefit of lending service (LVL)
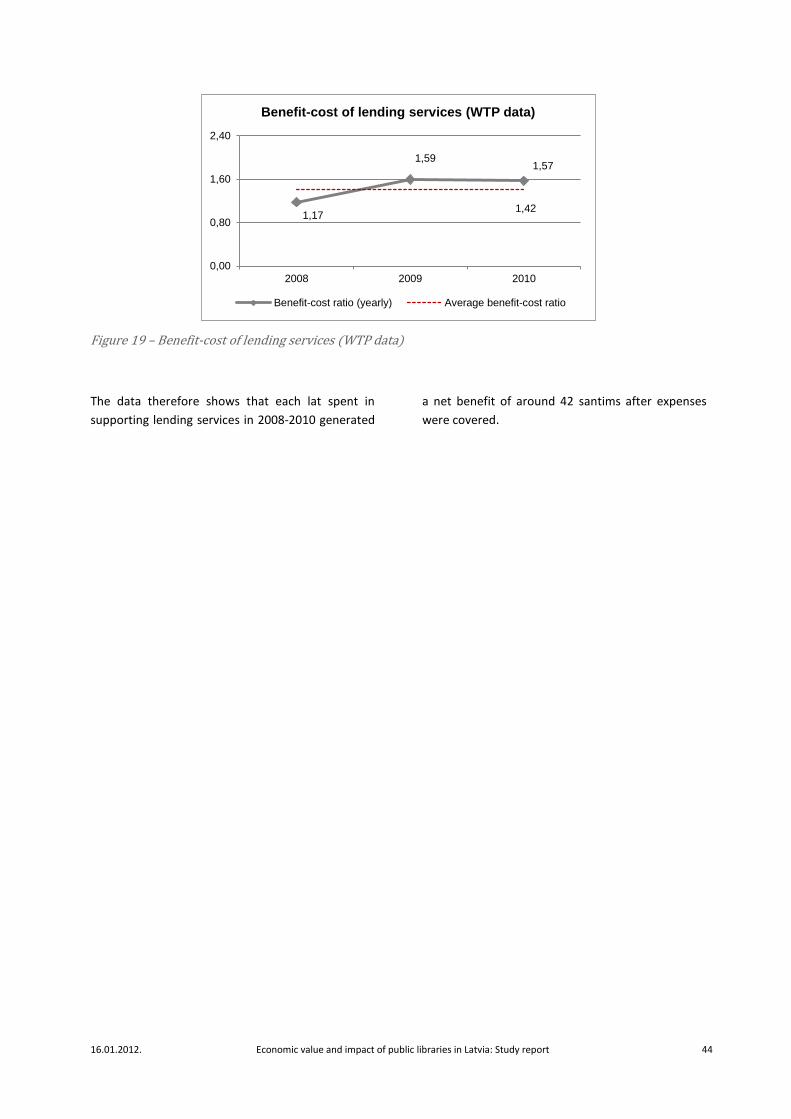
16.01.2012. Economic value and impact of public libraries in Latvia: Study report 44
Figure 19 – Benefit-cost of lending services (WTP data)
The data therefore shows that each lat spent in
supporting lending services in 2008-2010 generated
a net benefit of around 42 santims after expenses
were covered.
1,17
1,59 1,57
1,42
0,00
0,80
1,60
2,40
2008 2009 2010
Benefit-cost of lending services (WTP data)
Benefit-cost ratio (yearly) Average benefit-cost ratio
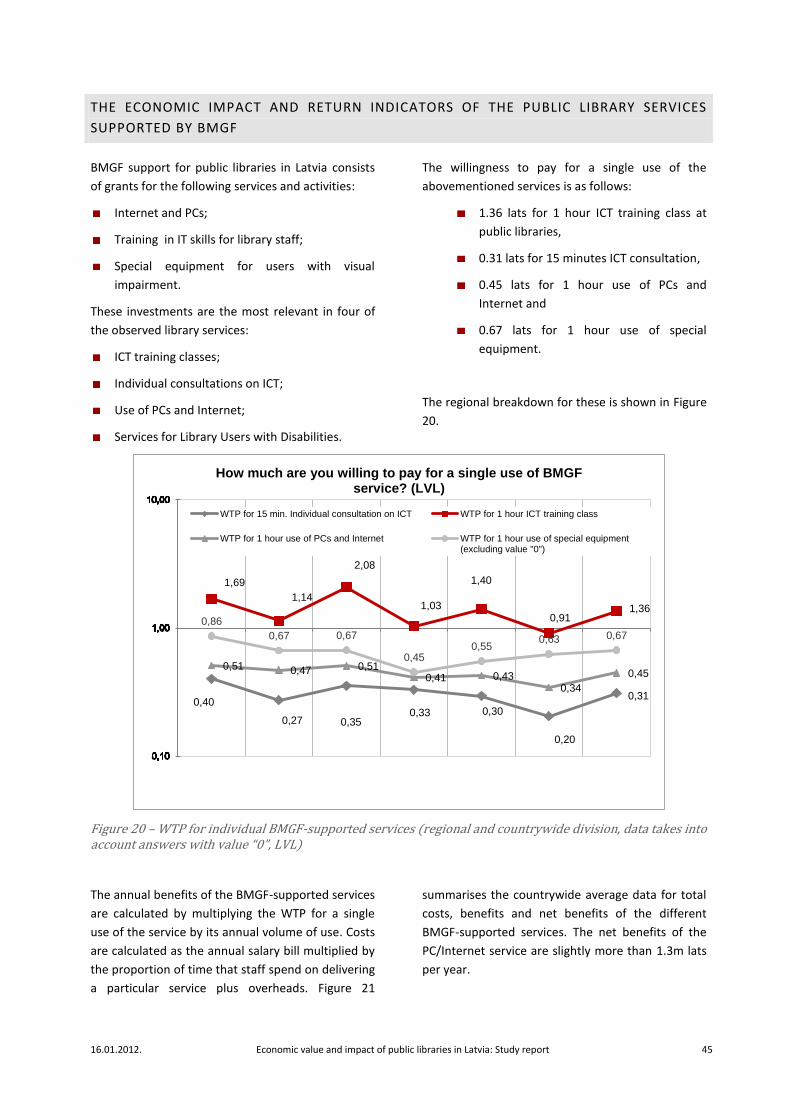
16.01.2012. Economic value and impact of public libraries in Latvia: Study report 45
THE ECONOMIC IMPACT AND RETURN INDICATORS OF THE PUBLIC LIBRARY SERVICES
SUPPORTED BY BMGF
BMGF support for public libraries in Latvia consists
of grants for the following services and activities:
Internet and PCs;
Training in IT skills for library staff;
Special equipment for users with visual
impairment.
These investments are the most relevant in four of
the observed library services:
ICT training classes;
Individual consultations on ICT;
Use of PCs and Internet;
Services for Library Users with Disabilities.
The willingness to pay for a single use of the
abovementioned services is as follows:
1.36 lats for 1 hour ICT training class at
public libraries,
0.31 lats for 15 minutes ICT consultation,
0.45 lats for 1 hour use of PCs and
Internet and
0.67 lats for 1 hour use of special
equipment.
The regional breakdown for these is shown in Figure
20.
Figure 20 – WTP for individual BMGF-supported services (regional and countrywide division, data takes into account answers with value “ ”, LVL)
The annual benefits of the BMGF-supported services
are calculated by multiplying the WTP for a single
use of the service by its annual volume of use. Costs
are calculated as the annual salary bill multiplied by
the proportion of time that staff spend on delivering
a particular service plus overheads. Figure 21
summarises the countrywide average data for total
costs, benefits and net benefits of the different
BMGF-supported services. The net benefits of the
PC/Internet service are slightly more than 1.3m lats
per year.
0,40
0,27 0,35 0,33 0,30
0,20
0,31
1,69
1,14
2,08
1,03
1,40
0,91 1,36
0,51 0,47 0,51 0,41 0,43
0,34
0,45
0,86
0,67 0,67
0,45 0,55
0,63 0,67
Rīga Pierīga Vidzeme Kurzeme Zemgale Latgale Latvia(countrywide)
How much are you willing to pay for a single use of BMGF service? (LVL)
WTP for 15 min. Individual consultation on ICT WTP for 1 hour ICT training class
WTP for 1 hour use of PCs and Internet WTP for 1 hour use of special equipment(excluding value "0")
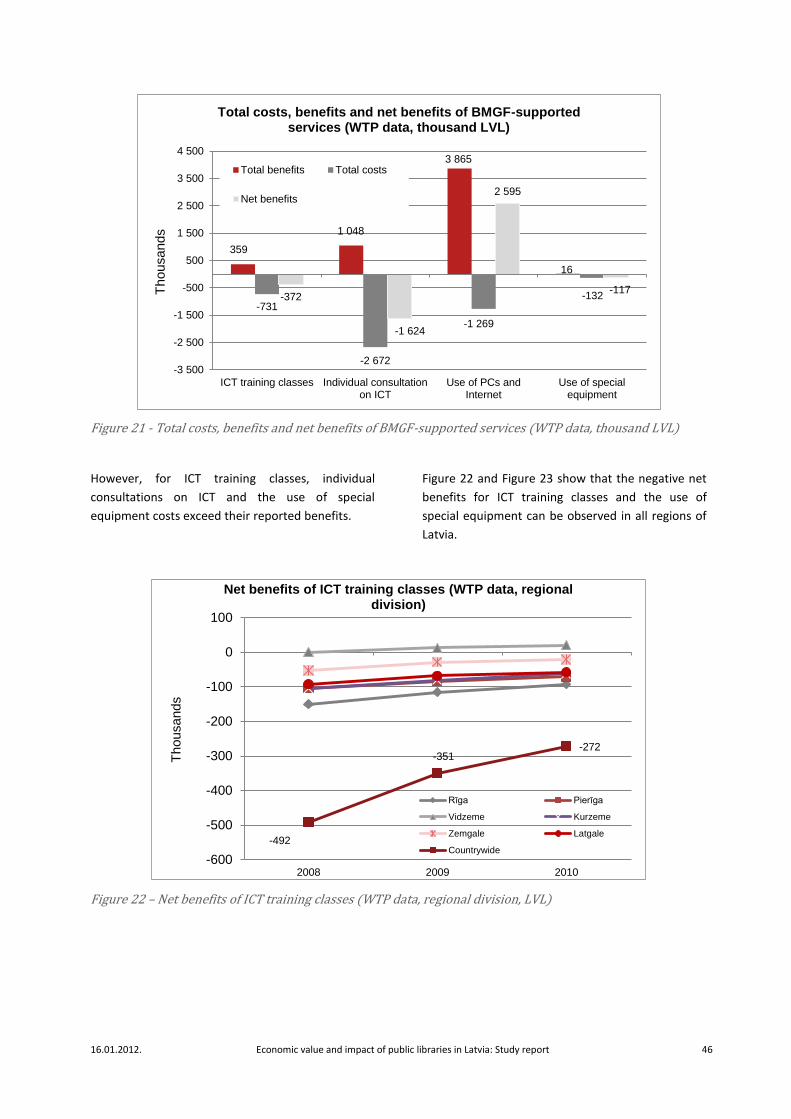
16.01.2012. Economic value and impact of public libraries in Latvia: Study report 46
Figure 21 - Total costs, benefits and net benefits of BMGF-supported services (WTP data, thousand LVL)
However, for ICT training classes, individual
consultations on ICT and the use of special
equipment costs exceed their reported benefits.
Figure 22 and Figure 23 show that the negative net
benefits for ICT training classes and the use of
special equipment can be observed in all regions of
Latvia.
Figure 22 – Net benefits of ICT training classes (WTP data, regional division, LVL)
359
1 048
3 865
16
-731
-2 672
-1 269
-132 -372
-1 624
2 595
-117
-3 500
-2 500
-1 500
-500
500
1 500
2 500
3 500
4 500
ICT training classes Individual consultationon ICT
Use of PCs andInternet
Use of specialequipment
Thousands
Total costs, benefits and net benefits of BMGF-supported services (WTP data, thousand LVL)
Total benefits Total costs
Net benefits
-492
-351 -272
-600
-500
-400
-300
-200
-100
0
100
2008 2009 2010
Thousands
Net benefits of ICT training classes (WTP data, regional division)
Rīga Pierīga
Vidzeme Kurzeme
Zemgale Latgale
Countrywide
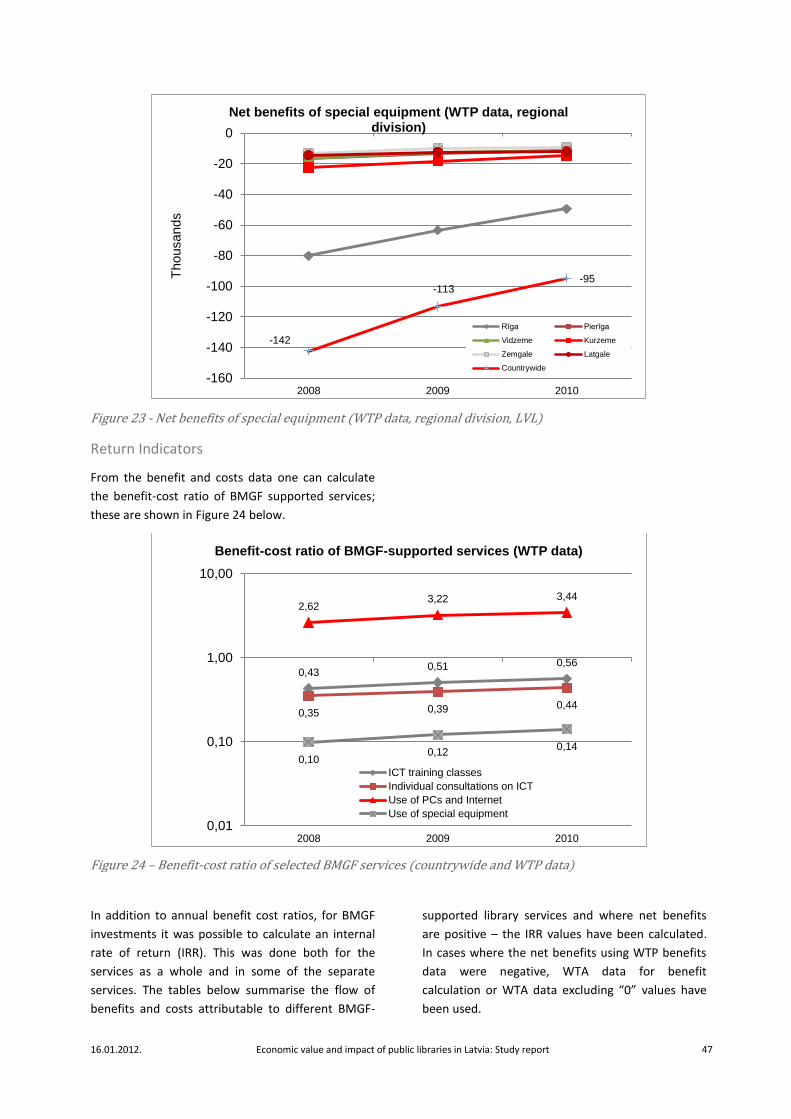
16.01.2012. Economic value and impact of public libraries in Latvia: Study report 47
Figure 23 - Net benefits of special equipment (WTP data, regional division, LVL)
Return Indicators
From the benefit and costs data one can calculate
the benefit-cost ratio of BMGF supported services;
these are shown in Figure 24 below.
Figure 24 – Benefit-cost ratio of selected BMGF services (countrywide and WTP data)
In addition to annual benefit cost ratios, for BMGF
investments it was possible to calculate an internal
rate of return (IRR). This was done both for the
services as a whole and in some of the separate
services. The tables below summarise the flow of
benefits and costs attributable to different BMGF-
supported library services and where net benefits
are positive – the IRR values have been calculated.
In cases where the net benefits using WTP benefits
data were negative, WTA data for benefit
calculation or WTA data excluding “0” values have
been used.
-142
-113 -95
-160
-140
-120
-100
-80
-60
-40
-20
0
2008 2009 2010
Thousands
Net benefits of special equipment (WTP data, regional division)
Rīga Pierīga
Vidzeme Kurzeme
Zemgale Latgale
Countrywide
0,43 0,51 0,56
0,35 0,39 0,44
2,62 3,22 3,44
0,10 0,12
0,14
0,01
0,10
1,00
10,00
2008 2009 2010
Benefit-cost ratio of BMGF-supported services (WTP data)
ICT training classes
Individual consultations on ICT
Use of PCs and Internet
Use of special equipment
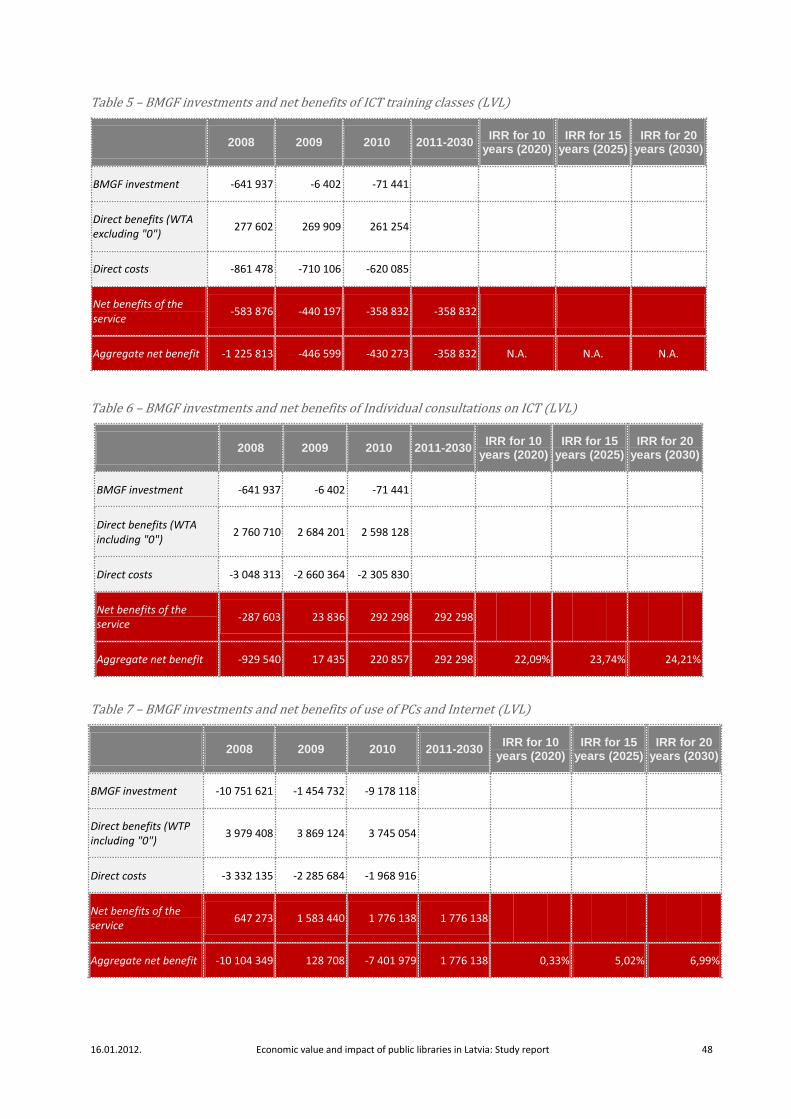
16.01.2012. Economic value and impact of public libraries in Latvia: Study report 48
Table 5 – BMGF investments and net benefits of ICT training classes (LVL)
2008 2009 2010 2011-2030 IRR for 10
years (2020) IRR for 15
years (2025) IRR for 20
years (2030)
BMGF investment -641 937 -6 402 -71 441
Direct benefits (WTA excluding "0")
277 602 269 909 261 254
Direct costs -861 478 -710 106 -620 085
Net benefits of the service
-583 876 -440 197 -358 832 -358 832
Aggregate net benefit -1 225 813 -446 599 -430 273 -358 832 N.A. N.A. N.A.
Table 6 – BMGF investments and net benefits of Individual consultations on ICT (LVL)
2008 2009 2010 2011-2030 IRR for 10
years (2020) IRR for 15
years (2025) IRR for 20
years (2030)
BMGF investment -641 937 -6 402 -71 441
Direct benefits (WTA including "0")
2 760 710 2 684 201 2 598 128
Direct costs -3 048 313 -2 660 364 -2 305 830
Net benefits of the service
-287 603 23 836 292 298 292 298
Aggregate net benefit -929 540 17 435 220 857 292 298 22,09% 23,74% 24,21%
Table 7 – BMGF investments and net benefits of use of PCs and Internet (LVL)
2008 2009 2010 2011-2030 IRR for 10
years (2020) IRR for 15
years (2025) IRR for 20
years (2030)
BMGF investment -10 751 621 -1 454 732 -9 178 118
Direct benefits (WTP including "0")
3 979 408 3 869 124 3 745 054
Direct costs -3 332 135 -2 285 684 -1 968 916
Net benefits of the service
647 273 1 583 440 1 776 138 1 776 138
Aggregate net benefit -10 104 349 128 708 -7 401 979 1 776 138 0,33% 5,02% 6,99%
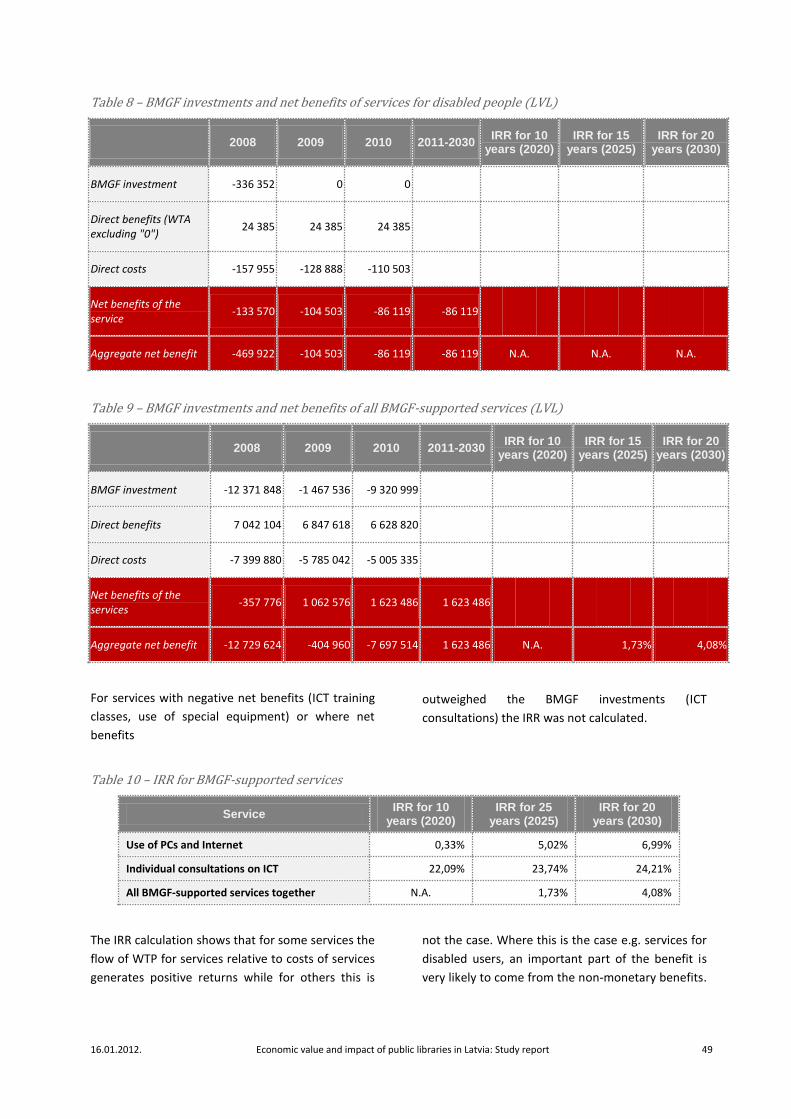
16.01.2012. Economic value and impact of public libraries in Latvia: Study report 49
Table 8 – BMGF investments and net benefits of services for disabled people (LVL)
2008 2009 2010 2011-2030 IRR for 10
years (2020) IRR for 15
years (2025) IRR for 20
years (2030)
BMGF investment -336 352 0 0
Direct benefits (WTA excluding "0")
24 385 24 385 24 385
Direct costs -157 955 -128 888 -110 503
Net benefits of the service
-133 570 -104 503 -86 119 -86 119
Aggregate net benefit -469 922 -104 503 -86 119 -86 119 N.A. N.A. N.A.
Table 9 – BMGF investments and net benefits of all BMGF-supported services (LVL)
2008 2009 2010 2011-2030 IRR for 10
years (2020) IRR for 15
years (2025) IRR for 20
years (2030)
BMGF investment -12 371 848 -1 467 536 -9 320 999
Direct benefits 7 042 104 6 847 618 6 628 820
Direct costs -7 399 880 -5 785 042 -5 005 335
Net benefits of the services
-357 776 1 062 576 1 623 486 1 623 486
Aggregate net benefit -12 729 624 -404 960 -7 697 514 1 623 486 N.A. 1,73% 4,08%
For services with negative net benefits (ICT training
classes, use of special equipment) or where net
benefits
outweighed the BMGF investments (ICT
consultations) the IRR was not calculated.
Table 10 – IRR for BMGF-supported services
Service IRR for 10
years (2020) IRR for 25
years (2025) IRR for 20
years (2030)
Use of PCs and Internet 0,33% 5,02% 6,99%
Individual consultations on ICT 22,09% 23,74% 24,21%
All BMGF-supported services together N.A. 1,73% 4,08%
The IRR calculation shows that for some services the
flow of WTP for services relative to costs of services
generates positive returns while for others this is
not the case. Where this is the case e.g. services for
disabled users, an important part of the benefit is
very likely to come from the non-monetary benefits.
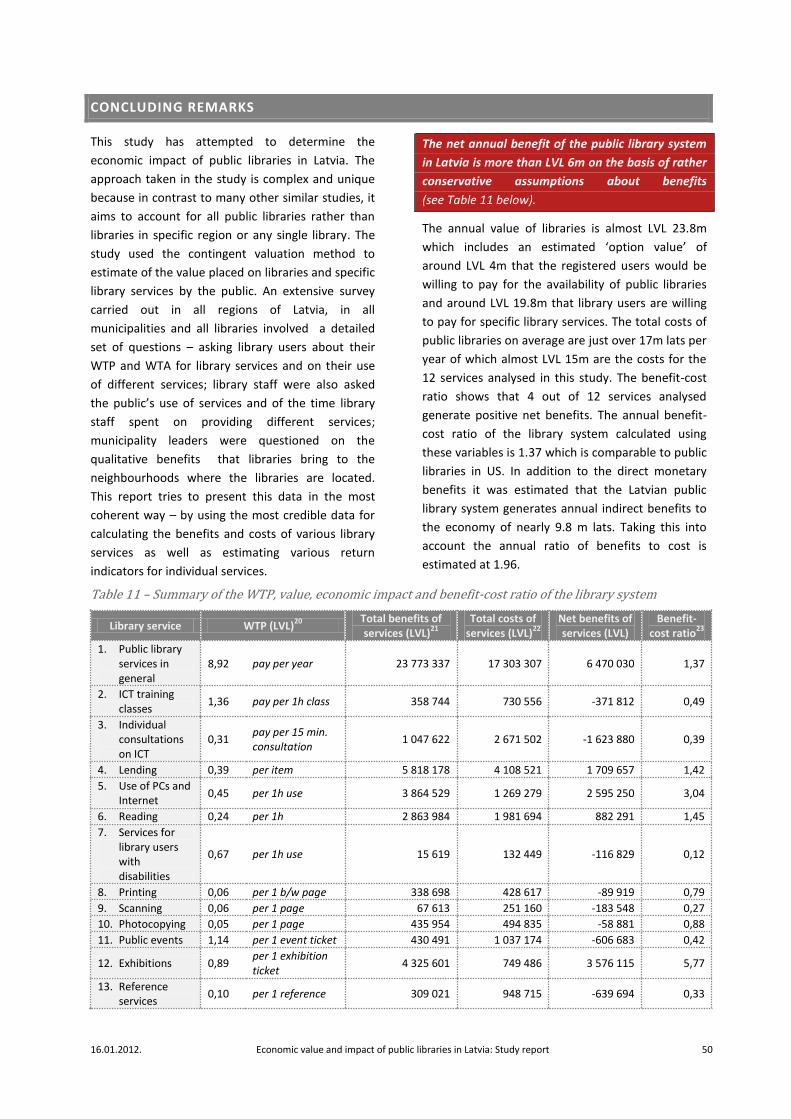
16.01.2012. Economic value and impact of public libraries in Latvia: Study report 50
CONCLUDING REMARKS
This study has attempted to determine the
economic impact of public libraries in Latvia. The
approach taken in the study is complex and unique
because in contrast to many other similar studies, it
aims to account for all public libraries rather than
libraries in specific region or any single library. The
study used the contingent valuation method to
estimate of the value placed on libraries and specific
library services by the public. An extensive survey
carried out in all regions of Latvia, in all
municipalities and all libraries involved a detailed
set of questions – asking library users about their
WTP and WTA for library services and on their use
of different services; library staff were also asked
the public’s use of services and of the time library
staff spent on providing different services;
municipality leaders were questioned on the
qualitative benefits that libraries bring to the
neighbourhoods where the libraries are located.
This report tries to present this data in the most
coherent way – by using the most credible data for
calculating the benefits and costs of various library
services as well as estimating various return
indicators for individual services.
The net annual benefit of the public library system
in Latvia is more than LVL 6m on the basis of rather
conservative assumptions about benefits
(see Table 11 below).
The annual value of libraries is almost LVL 23.8m
which includes an estimated ‘option value’ of
around LVL 4m that the registered users would be
willing to pay for the availability of public libraries
and around LVL 19.8m that library users are willing
to pay for specific library services. The total costs of
public libraries on average are just over 17m lats per
year of which almost LVL 15m are the costs for the
12 services analysed in this study. The benefit-cost
ratio shows that 4 out of 12 services analysed
generate positive net benefits. The annual benefit-
cost ratio of the library system calculated using
these variables is 1.37 which is comparable to public
libraries in US. In addition to the direct monetary
benefits it was estimated that the Latvian public
library system generates annual indirect benefits to
the economy of nearly 9.8 m lats. Taking this into
account the annual ratio of benefits to cost is
estimated at 1.96.
Table 11 – Summary of the WTP, value, economic impact and benefit-cost ratio of the library system
Library service WTP (LVL)20
Total benefits of services (LVL)
21
Total costs of services (LVL)
22
Net benefits of services (LVL)
Benefit-cost ratio
23
1. Public library services in general
8,92 pay per year 23 773 337 17 303 307 6 470 030 1,37
2. ICT training classes
1,36 pay per 1h class 358 744 730 556 -371 812 0,49
3. Individual consultations on ICT
0,31 pay per 15 min. consultation
1 047 622 2 671 502 -1 623 880 0,39
4. Lending 0,39 per item 5 818 178 4 108 521 1 709 657 1,42
5. Use of PCs and Internet
0,45 per 1h use 3 864 529 1 269 279 2 595 250 3,04
6. Reading 0,24 per 1h 2 863 984 1 981 694 882 291 1,45
7. Services for library users with disabilities
0,67 per 1h use 15 619 132 449 -116 829 0,12
8. Printing 0,06 per 1 b/w page 338 698 428 617 -89 919 0,79
9. Scanning 0,06 per 1 page 67 613 251 160 -183 548 0,27
10. Photocopying 0,05 per 1 page 435 954 494 835 -58 881 0,88
11. Public events 1,14 per 1 event ticket 430 491 1 037 174 -606 683 0,42
12. Exhibitions 0,89 per 1 exhibition ticket
4 325 601 749 486 3 576 115 5,77
13. Reference services
0,10 per 1 reference 309 021 948 715 -639 694 0,33
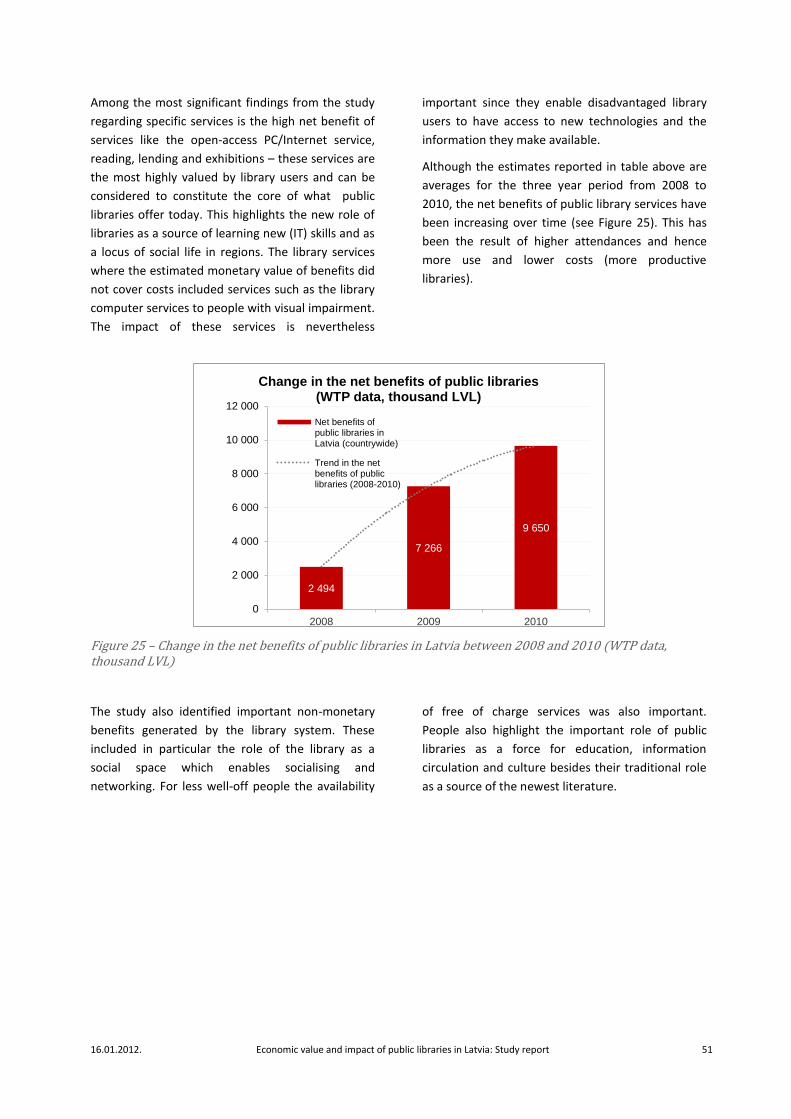
16.01.2012. Economic value and impact of public libraries in Latvia: Study report 51
Among the most significant findings from the study
regarding specific services is the high net benefit of
services like the open-access PC/Internet service,
reading, lending and exhibitions – these services are
the most highly valued by library users and can be
considered to constitute the core of what public
libraries offer today. This highlights the new role of
libraries as a source of learning new (IT) skills and as
a locus of social life in regions. The library services
where the estimated monetary value of benefits did
not cover costs included services such as the library
computer services to people with visual impairment.
The impact of these services is nevertheless
important since they enable disadvantaged library
users to have access to new technologies and the
information they make available.
Although the estimates reported in table above are
averages for the three year period from 2008 to
2010, the net benefits of public library services have
been increasing over time (see Figure 25). This has
been the result of higher attendances and hence
more use and lower costs (more productive
libraries).
Figure 25 – Change in the net benefits of public libraries in Latvia between 2008 and 2010 (WTP data, thousand LVL)
The study also identified important non-monetary
benefits generated by the library system. These
included in particular the role of the library as a
social space which enables socialising and
networking. For less well-off people the availability
of free of charge services was also important.
People also highlight the important role of public
libraries as a force for education, information
circulation and culture besides their traditional role
as a source of the newest literature.
2 494
7 266
9 650
0
2 000
4 000
6 000
8 000
10 000
12 000
2008 2009 2010
Th
ousands
Change in the net benefits of public libraries (WTP data, thousand LVL)
Net benefits ofpublic libraries inLatvia (countrywide)
Trend in the netbenefits of publiclibraries (2008-2010)

16.01.2012. Economic value and impact of public libraries in Latvia: Study report 52
Appendices
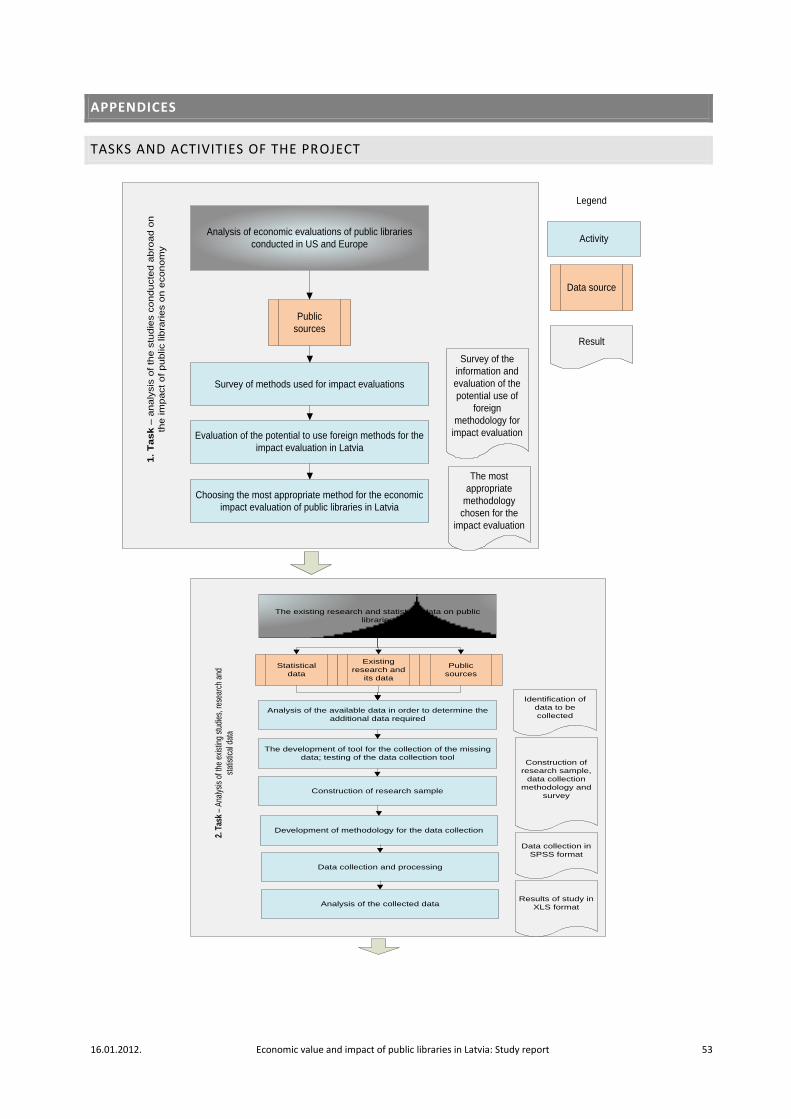
16.01.2012. Economic value and impact of public libraries in Latvia: Study report 53
APPENDICES
TASKS AND ACTIVITIES OF THE PROJECT
Analysis of economic evaluations of public libraries
conducted in US and Europe
Survey of methods used for impact evaluations
Evaluation of the potential to use foreign methods for the
impact evaluation in Latvia
Survey of the
information and
evaluation of the
potential use of
foreign
methodology for
impact evaluation
1.
Ta
sk –
analy
sis
of th
e s
tud
ies c
ondu
cte
d a
bro
ad o
n
the
im
pact o
f p
ublic lib
rari
es o
n e
con
om
y
Public
sources
Result
Activity
Data source
Legend
Choosing the most appropriate method for the economic
impact evaluation of public libraries in Latvia
The most
appropriate
methodology
chosen for the
impact evaluation
The existing research and statistical data on public
libraries
Analysis of the available data in order to determine the
additional data required
The development of tool for the collection of the missing
data; testing of the data collection tool
Identification of
data to be
collected
2. T
ask –
Ana
lysi
s of
the
exis
ting
stud
ies,
rese
arch
and
stat
istic
al d
ata
Public
sources
Statistical
data
Existing
research and
its data
Construction of
research sample,
data collection
methodology and
surveyConstruction of research sample
Development of methodology for the data collection
Data collection and processing
Analysis of the collected data
Data collection in
SPSS format
Results of study in
XLS format
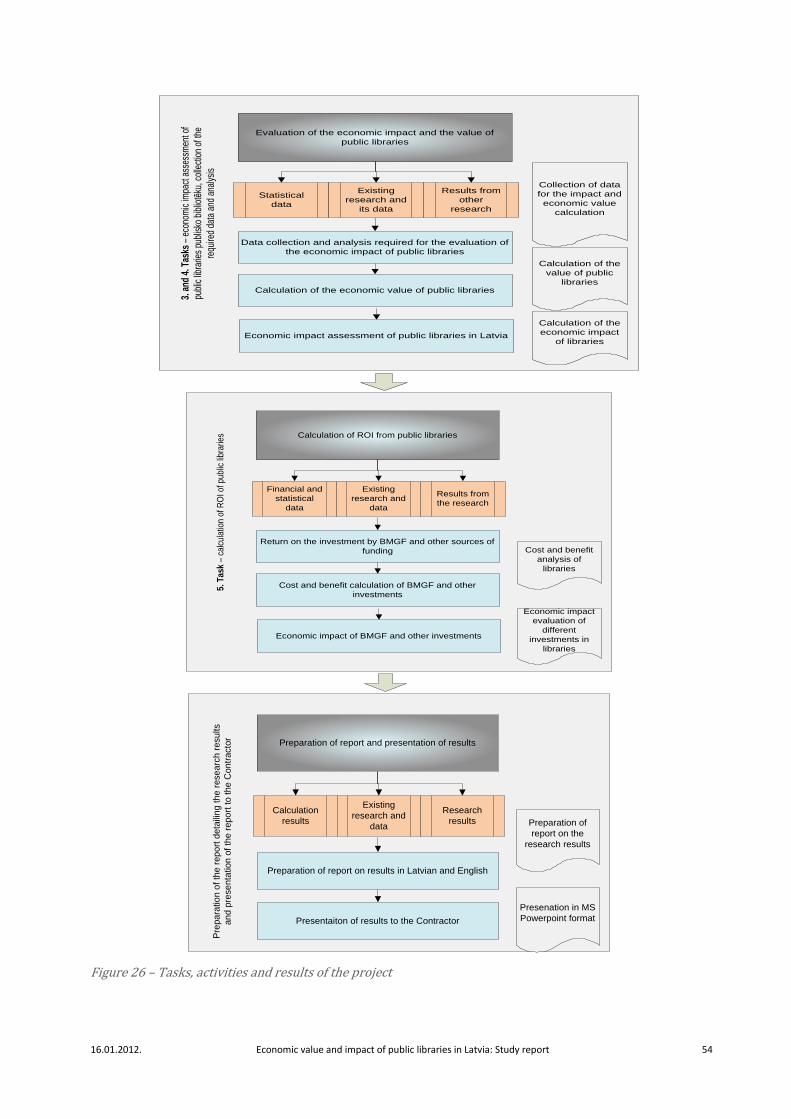
16.01.2012. Economic value and impact of public libraries in Latvia: Study report 54
Evaluation of the economic impact and the value of
public libraries
Data collection and analysis required for the evaluation of
the economic impact of public libraries
Calculation of the economic value of public libraries
Collection of data
for the impact and
economic value
calculation
3. a
nd 4
. Tas
ks –
eco
nom
ic im
pact
ass
essm
ent o
f
publ
ic li
brar
ies
publ
isko
bib
liotē
ku, c
olle
ctio
n of
the
requ
ired
data
and
ana
lysi
s
Results from
other
research
Statistical
data
Existing
research and
its data
Calculation of the
economic impact
of librariesEconomic impact assessment of public libraries in Latvia
Calculation of the
value of public
libraries
Calculation of ROI from public libraries
Return on the investment by BMGF and other sources of
funding
Cost and benefit calculation of BMGF and other
investments
Cost and benefit
analysis of
libraries
5. T
ask –
calc
ulat
ion
of R
OI o
f pub
lic li
brar
ies
Results from
the research
Financial and
statistical
data
Existing
research and
data
Economic impact of BMGF and other investments
Economic impact
evaluation of
different
investments in
libraries
Preparation of report and presentation of results
Preparation of report on results in Latvian and English
Presentaiton of results to the Contractor
Preparation of
report on the
research results
Pre
pa
ratio
n o
f th
e r
ep
ort
deta
ilin
g t
he
rese
arc
h r
esu
lts
an
d p
rese
nta
tio
n o
f th
e r
ep
ort
to t
he C
on
tracto
r
Research
results
Calculation
results
Existing
research and
data
Presenation in MS
Powerpoint format
Figure 26 – Tasks, activities and results of the project
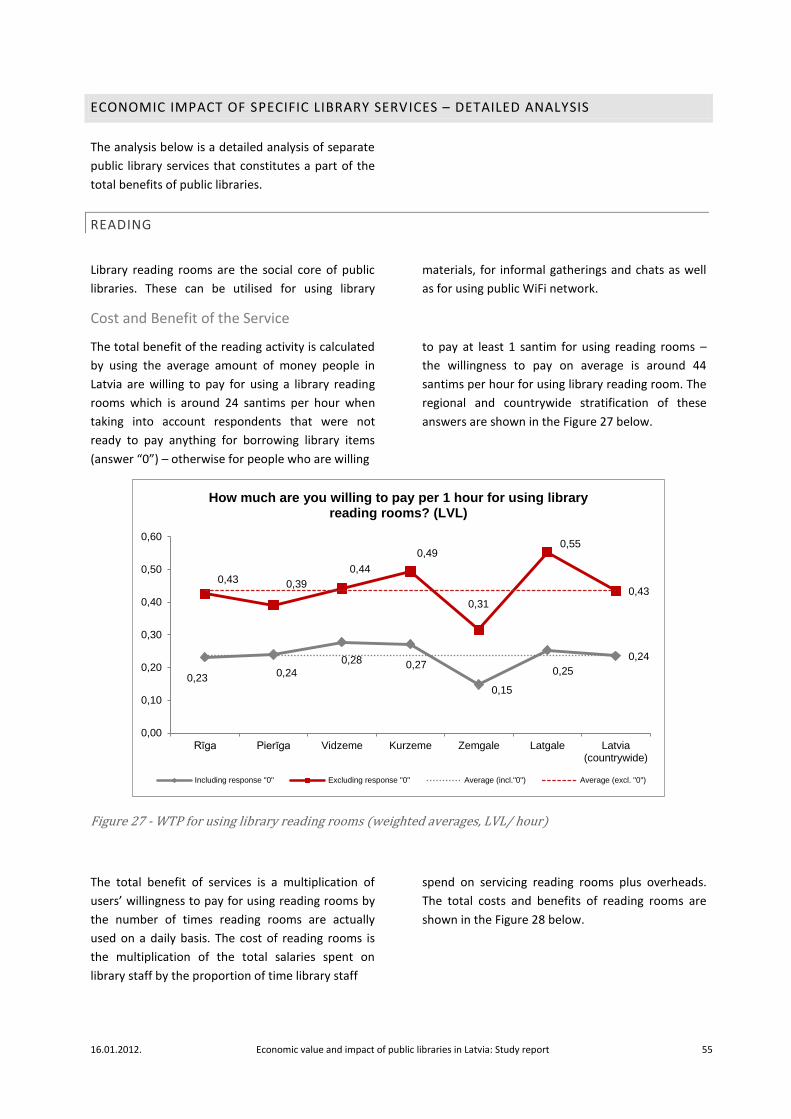
16.01.2012. Economic value and impact of public libraries in Latvia: Study report 55
ECONOMIC IMPACT OF SPECIFIC LIBRARY SERVICES – DETAILED ANALYSIS
The analysis below is a detailed analysis of separate
public library services that constitutes a part of the
total benefits of public libraries.
READING
Library reading rooms are the social core of public
libraries. These can be utilised for using library
materials, for informal gatherings and chats as well
as for using public WiFi network.
Cost and Benefit of the Service
The total benefit of the reading activity is calculated
by using the average amount of money people in
Latvia are willing to pay for using a library reading
rooms which is around 24 santims per hour when
taking into account respondents that were not
ready to pay anything for borrowing library items
(answer “0”) – otherwise for people who are willing
to pay at least 1 santim for using reading rooms –
the willingness to pay on average is around 44
santims per hour for using library reading room. The
regional and countrywide stratification of these
answers are shown in the Figure 27 below.
Figure 27 - WTP for using library reading rooms (weighted averages, LVL/ hour)
The total benefit of services is a multiplication of
users’ willingness to pay for using reading rooms by
the number of times reading rooms are actually
used on a daily basis. The cost of reading rooms is
the multiplication of the total salaries spent on
library staff by the proportion of time library staff
spend on servicing reading rooms plus overheads.
The total costs and benefits of reading rooms are
shown in the Figure 28 below.
0,23 0,24
0,28 0,27
0,15
0,25
0,24
0,43 0,39
0,44
0,49
0,31
0,55
0,43
0,00
0,10
0,20
0,30
0,40
0,50
0,60
Rīga Pierīga Vidzeme Kurzeme Zemgale Latgale Latvia(countrywide)
How much are you willing to pay per 1 hour for using library reading rooms? (LVL)
Including response "0" Excluding response "0" Average (incl."0") Average (excl. "0")
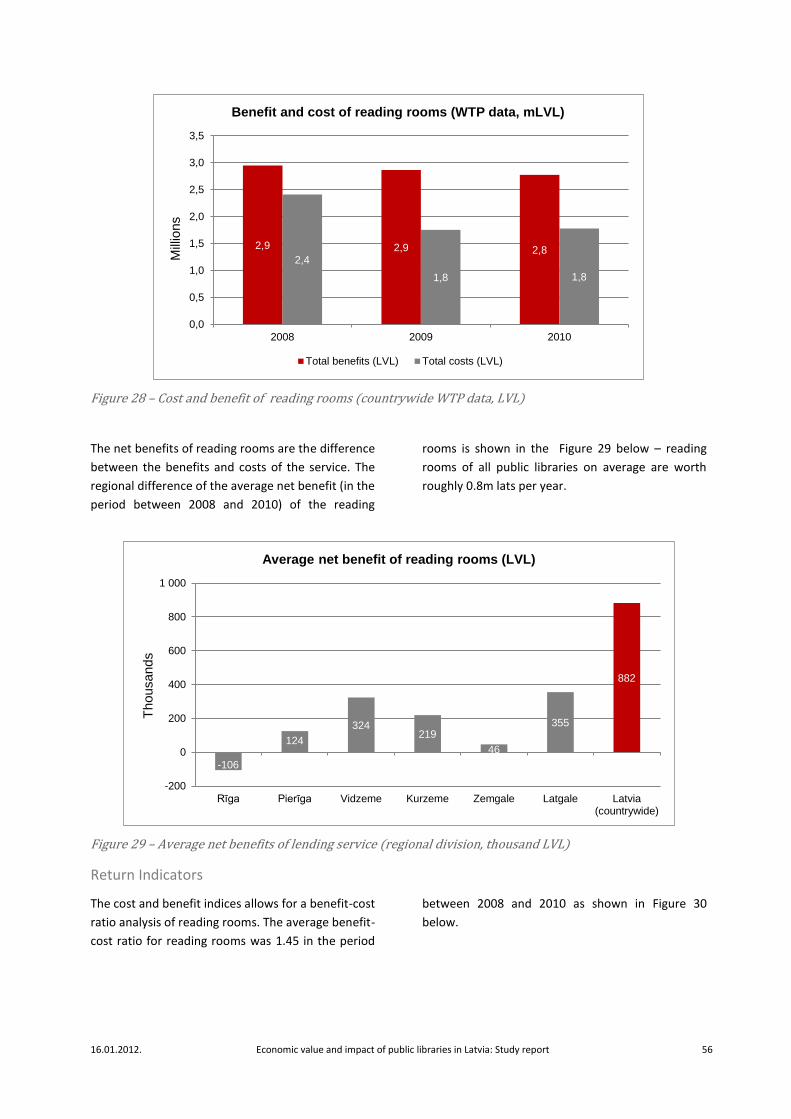
16.01.2012. Economic value and impact of public libraries in Latvia: Study report 56
Figure 28 – Cost and benefit of reading rooms (countrywide WTP data, LVL)
The net benefits of reading rooms are the difference
between the benefits and costs of the service. The
regional difference of the average net benefit (in the
period between 2008 and 2010) of the reading
rooms is shown in the Figure 29 below – reading
rooms of all public libraries on average are worth
roughly 0.8m lats per year.
Figure 29 – Average net benefits of lending service (regional division, thousand LVL)
Return Indicators
The cost and benefit indices allows for a benefit-cost
ratio analysis of reading rooms. The average benefit-
cost ratio for reading rooms was 1.45 in the period
between 2008 and 2010 as shown in Figure 30
below.
2,9 2,9 2,8 2,4
1,8 1,8
0,0
0,5
1,0
1,5
2,0
2,5
3,0
3,5
2008 2009 2010
Mill
ions
Benefit and cost of reading rooms (WTP data, mLVL)
Total benefits (LVL) Total costs (LVL)
-106
124
324 219
46
355
882
-200
0
200
400
600
800
1 000
Rīga Pierīga Vidzeme Kurzeme Zemgale Latgale Latvia(countrywide)
Thousands
Average net benefit of reading rooms (LVL)
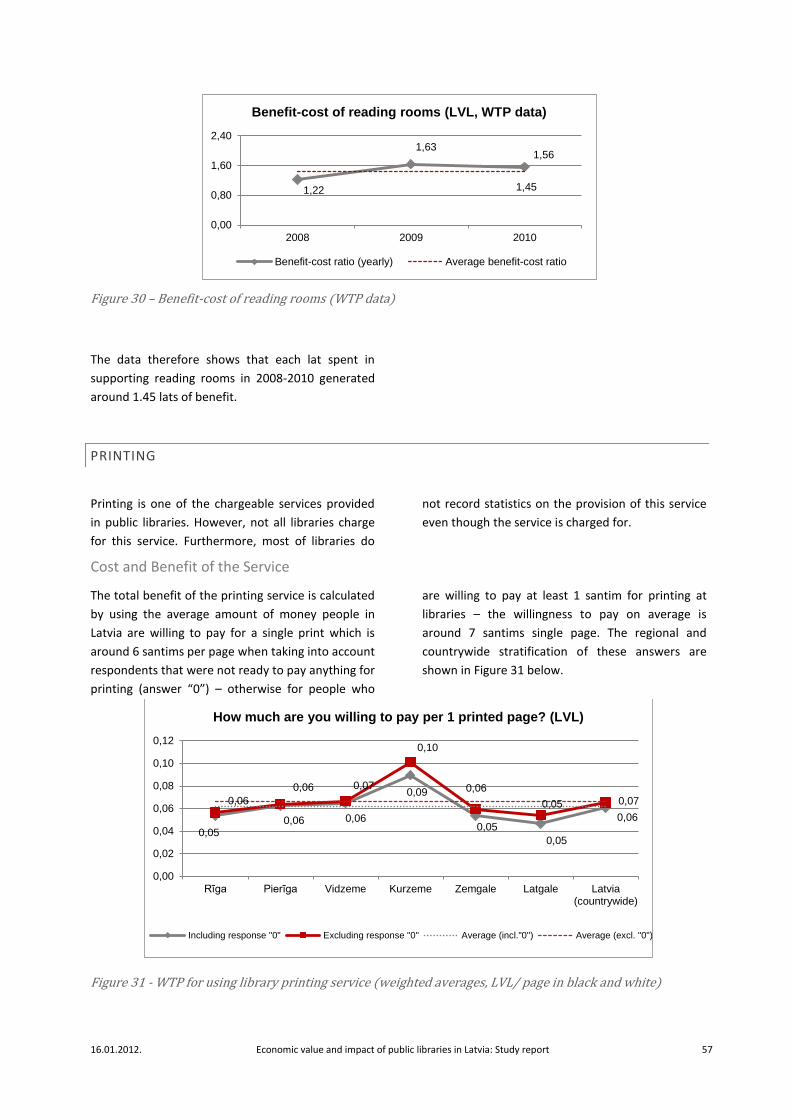
16.01.2012. Economic value and impact of public libraries in Latvia: Study report 57
Figure 30 – Benefit-cost of reading rooms (WTP data)
The data therefore shows that each lat spent in
supporting reading rooms in 2008-2010 generated
around 1.45 lats of benefit.
PRINTING
Printing is one of the chargeable services provided
in public libraries. However, not all libraries charge
for this service. Furthermore, most of libraries do
not record statistics on the provision of this service
even though the service is charged for.
Cost and Benefit of the Service
The total benefit of the printing service is calculated
by using the average amount of money people in
Latvia are willing to pay for a single print which is
around 6 santims per page when taking into account
respondents that were not ready to pay anything for
printing (answer “0”) – otherwise for people who
are willing to pay at least 1 santim for printing at
libraries – the willingness to pay on average is
around 7 santims single page. The regional and
countrywide stratification of these answers are
shown in Figure 31 below.
Figure 31 - WTP for using library printing service (weighted averages, LVL/ page in black and white)
1,22
1,63 1,56
1,45
0,00
0,80
1,60
2,40
2008 2009 2010
Benefit-cost of reading rooms (LVL, WTP data)
Benefit-cost ratio (yearly) Average benefit-cost ratio
0,05 0,06 0,06
0,09
0,05
0,05
0,06
0,06
0,06 0,07
0,10
0,06
0,05 0,07
0,00
0,02
0,04
0,06
0,08
0,10
0,12
Rīga Pierīga Vidzeme Kurzeme Zemgale Latgale Latvia(countrywide)
How much are you willing to pay per 1 printed page? (LVL)
Including response "0" Excluding response "0" Average (incl."0") Average (excl. "0")
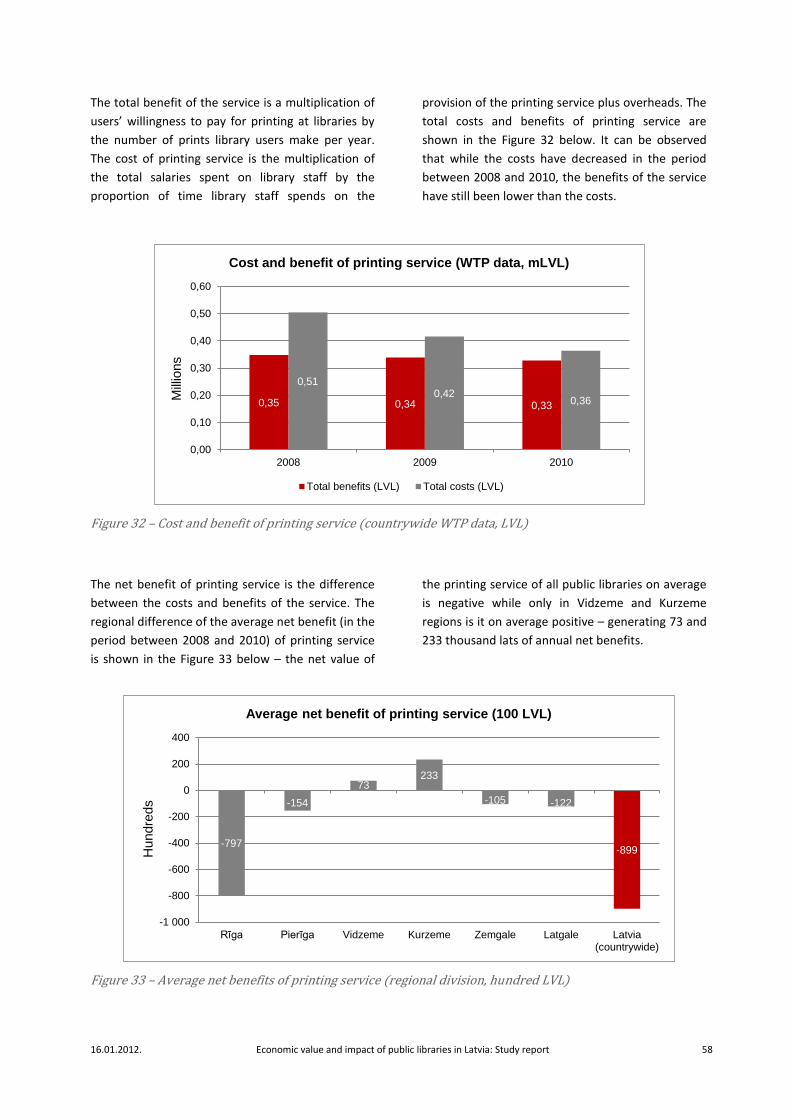
16.01.2012. Economic value and impact of public libraries in Latvia: Study report 58
The total benefit of the service is a multiplication of
users’ willingness to pay for printing at libraries by
the number of prints library users make per year.
The cost of printing service is the multiplication of
the total salaries spent on library staff by the
proportion of time library staff spends on the
provision of the printing service plus overheads. The
total costs and benefits of printing service are
shown in the Figure 32 below. It can be observed
that while the costs have decreased in the period
between 2008 and 2010, the benefits of the service
have still been lower than the costs.
Figure 32 – Cost and benefit of printing service (countrywide WTP data, LVL)
The net benefit of printing service is the difference
between the costs and benefits of the service. The
regional difference of the average net benefit (in the
period between 2008 and 2010) of printing service
is shown in the Figure 33 below – the net value of
the printing service of all public libraries on average
is negative while only in Vidzeme and Kurzeme
regions is it on average positive – generating 73 and
233 thousand lats of annual net benefits.
Figure 33 – Average net benefits of printing service (regional division, hundred LVL)
0,35 0,34 0,33
0,51 0,42
0,36
0,00
0,10
0,20
0,30
0,40
0,50
0,60
2008 2009 2010
Mill
ions
Cost and benefit of printing service (WTP data, mLVL)
Total benefits (LVL) Total costs (LVL)
-797
-154
73 233
-105 -122
-899
-1 000
-800
-600
-400
-200
0
200
400
Rīga Pierīga Vidzeme Kurzeme Zemgale Latgale Latvia(countrywide)
Hundre
ds
Average net benefit of printing service (100 LVL)
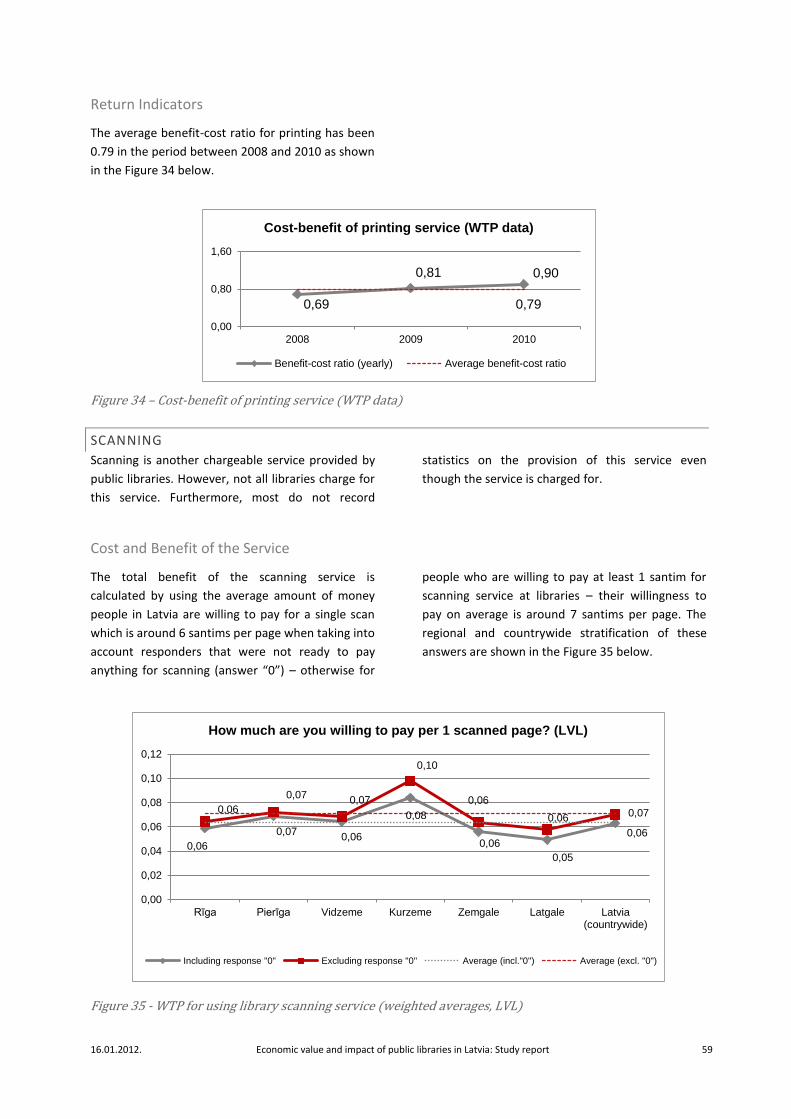
16.01.2012. Economic value and impact of public libraries in Latvia: Study report 59
Return Indicators
The average benefit-cost ratio for printing has been
0.79 in the period between 2008 and 2010 as shown
in the Figure 34 below.
Figure 34 – Cost-benefit of printing service (WTP data)
SCANNING
Scanning is another chargeable service provided by
public libraries. However, not all libraries charge for
this service. Furthermore, most do not record
statistics on the provision of this service even
though the service is charged for.
Cost and Benefit of the Service
The total benefit of the scanning service is
calculated by using the average amount of money
people in Latvia are willing to pay for a single scan
which is around 6 santims per page when taking into
account responders that were not ready to pay
anything for scanning (answer “0”) – otherwise for
people who are willing to pay at least 1 santim for
scanning service at libraries – their willingness to
pay on average is around 7 santims per page. The
regional and countrywide stratification of these
answers are shown in the Figure 35 below.
Figure 35 - WTP for using library scanning service (weighted averages, LVL)
0,69
0,81 0,90
0,79
0,00
0,80
1,60
2008 2009 2010
Cost-benefit of printing service (WTP data)
Benefit-cost ratio (yearly) Average benefit-cost ratio
0,06
0,07 0,06
0,08
0,06
0,05
0,06
0,06
0,07 0,07
0,10
0,06
0,06 0,07
0,00
0,02
0,04
0,06
0,08
0,10
0,12
Rīga Pierīga Vidzeme Kurzeme Zemgale Latgale Latvia(countrywide)
How much are you willing to pay per 1 scanned page? (LVL)
Including response "0" Excluding response "0" Average (incl."0") Average (excl. "0")
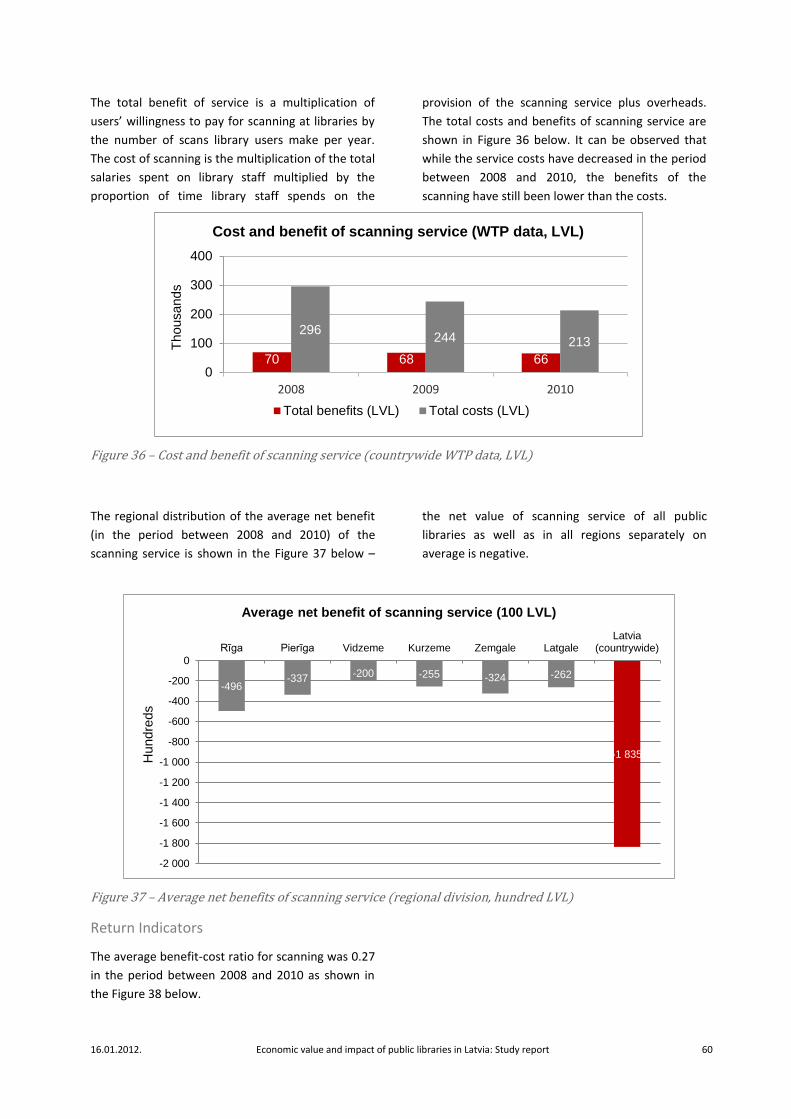
16.01.2012. Economic value and impact of public libraries in Latvia: Study report 60
The total benefit of service is a multiplication of
users’ willingness to pay for scanning at libraries by
the number of scans library users make per year.
The cost of scanning is the multiplication of the total
salaries spent on library staff multiplied by the
proportion of time library staff spends on the
provision of the scanning service plus overheads.
The total costs and benefits of scanning service are
shown in Figure 36 below. It can be observed that
while the service costs have decreased in the period
between 2008 and 2010, the benefits of the
scanning have still been lower than the costs.
Figure 36 – Cost and benefit of scanning service (countrywide WTP data, LVL)
The regional distribution of the average net benefit
(in the period between 2008 and 2010) of the
scanning service is shown in the Figure 37 below –
the net value of scanning service of all public
libraries as well as in all regions separately on
average is negative.
Figure 37 – Average net benefits of scanning service (regional division, hundred LVL)
Return Indicators
The average benefit-cost ratio for scanning was 0.27
in the period between 2008 and 2010 as shown in
the Figure 38 below.
70 68 66
296 244 213
0
100
200
300
400
2008 2009 2010
Thousands
Cost and benefit of scanning service (WTP data, LVL)
Total benefits (LVL) Total costs (LVL)
-496 -337 -200 -255 -324 -262
-1 835
-2 000
-1 800
-1 600
-1 400
-1 200
-1 000
-800
-600
-400
-200
0
Rīga Pierīga Vidzeme Kurzeme Zemgale LatgaleLatvia
(countrywide)
Hundre
ds
Average net benefit of scanning service (100 LVL)
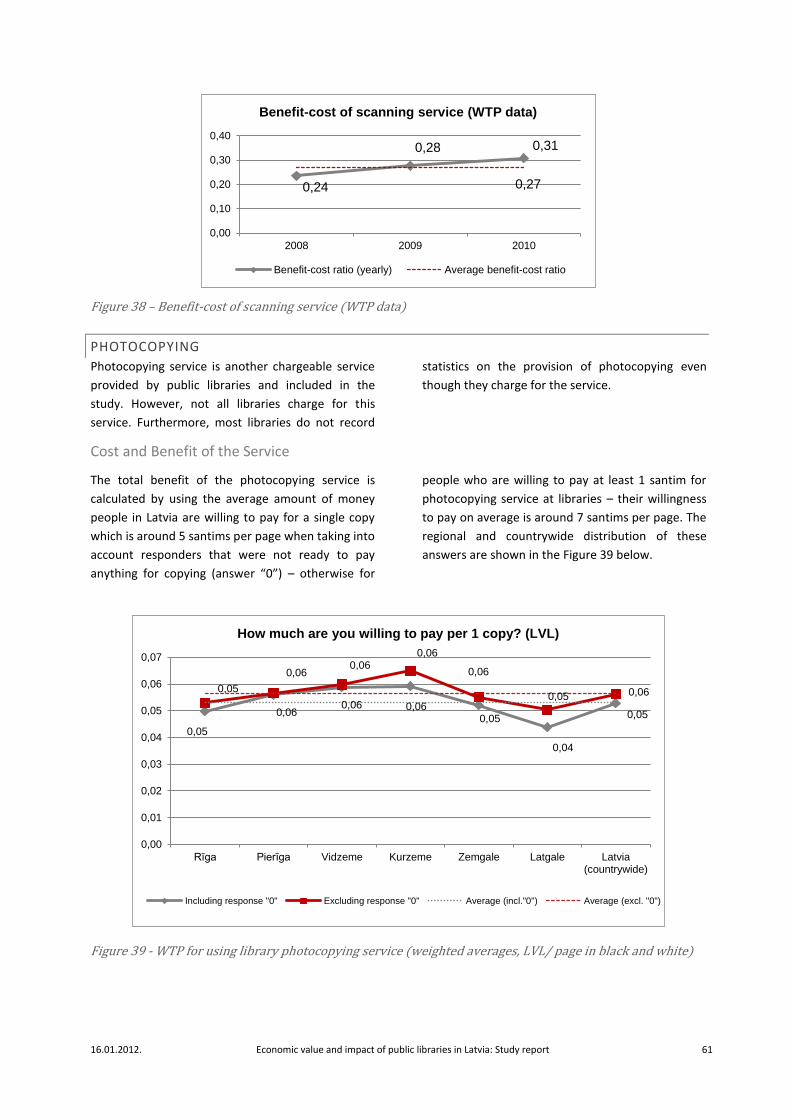
16.01.2012. Economic value and impact of public libraries in Latvia: Study report 61
Figure 38 – Benefit-cost of scanning service (WTP data)
PHOTOCOPYING
Photocopying service is another chargeable service
provided by public libraries and included in the
study. However, not all libraries charge for this
service. Furthermore, most libraries do not record
statistics on the provision of photocopying even
though they charge for the service.
Cost and Benefit of the Service
The total benefit of the photocopying service is
calculated by using the average amount of money
people in Latvia are willing to pay for a single copy
which is around 5 santims per page when taking into
account responders that were not ready to pay
anything for copying (answer “0”) – otherwise for
people who are willing to pay at least 1 santim for
photocopying service at libraries – their willingness
to pay on average is around 7 santims per page. The
regional and countrywide distribution of these
answers are shown in the Figure 39 below.
Figure 39 - WTP for using library photocopying service (weighted averages, LVL/ page in black and white)
0,24
0,28 0,31
0,27
0,00
0,10
0,20
0,30
0,40
2008 2009 2010
Benefit-cost of scanning service (WTP data)
Benefit-cost ratio (yearly) Average benefit-cost ratio
0,05
0,06 0,06 0,06
0,05
0,04
0,05
0,05
0,06 0,06
0,06
0,06
0,05 0,06
0,00
0,01
0,02
0,03
0,04
0,05
0,06
0,07
Rīga Pierīga Vidzeme Kurzeme Zemgale Latgale Latvia(countrywide)
How much are you willing to pay per 1 copy? (LVL)
Including response "0" Excluding response "0" Average (incl."0") Average (excl. "0")
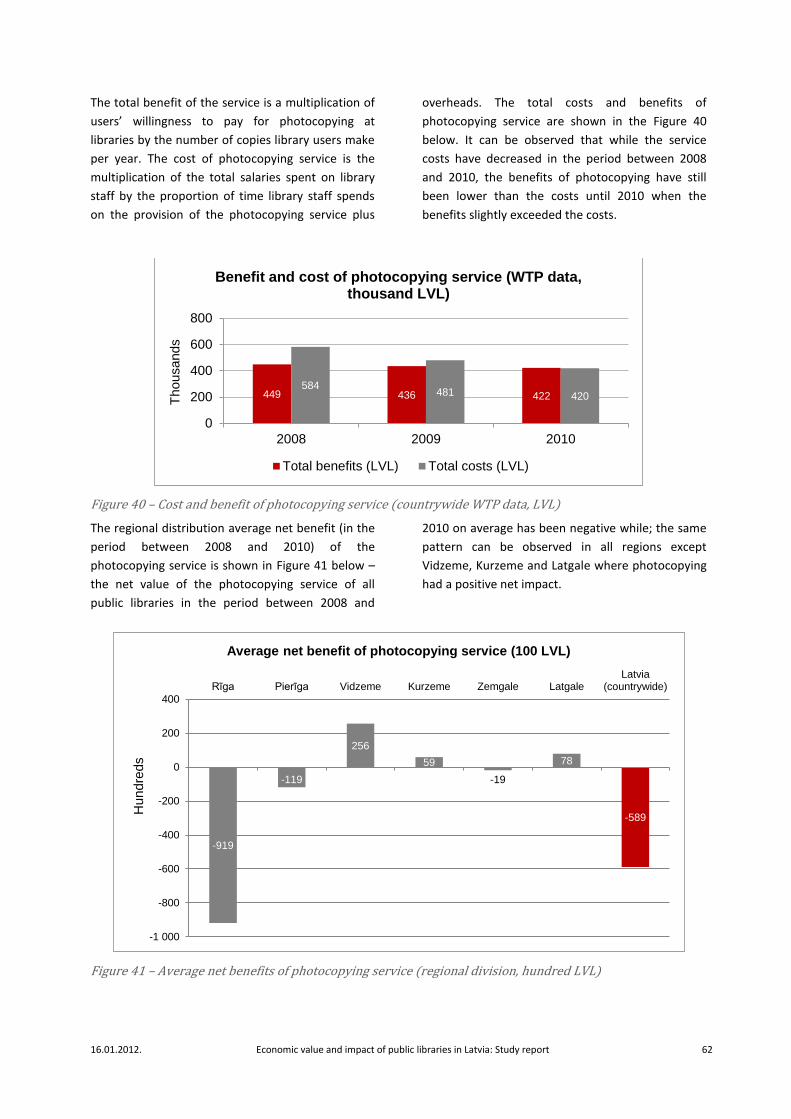
16.01.2012. Economic value and impact of public libraries in Latvia: Study report 62
The total benefit of the service is a multiplication of
users’ willingness to pay for photocopying at
libraries by the number of copies library users make
per year. The cost of photocopying service is the
multiplication of the total salaries spent on library
staff by the proportion of time library staff spends
on the provision of the photocopying service plus
overheads. The total costs and benefits of
photocopying service are shown in the Figure 40
below. It can be observed that while the service
costs have decreased in the period between 2008
and 2010, the benefits of photocopying have still
been lower than the costs until 2010 when the
benefits slightly exceeded the costs.
Figure 40 – Cost and benefit of photocopying service (countrywide WTP data, LVL)
The regional distribution average net benefit (in the
period between 2008 and 2010) of the
photocopying service is shown in Figure 41 below –
the net value of the photocopying service of all
public libraries in the period between 2008 and
2010 on average has been negative while; the same
pattern can be observed in all regions except
Vidzeme, Kurzeme and Latgale where photocopying
had a positive net impact.
Figure 41 – Average net benefits of photocopying service (regional division, hundred LVL)
449 436 422 584
481 420
0
200
400
600
800
2008 2009 2010
Thousands
Benefit and cost of photocopying service (WTP data, thousand LVL)
Total benefits (LVL) Total costs (LVL)
-919
-119
256
59
-19
78
-589
-1 000
-800
-600
-400
-200
0
200
400
Rīga Pierīga Vidzeme Kurzeme Zemgale LatgaleLatvia
(countrywide)
Hundre
ds
Average net benefit of photocopying service (100 LVL)
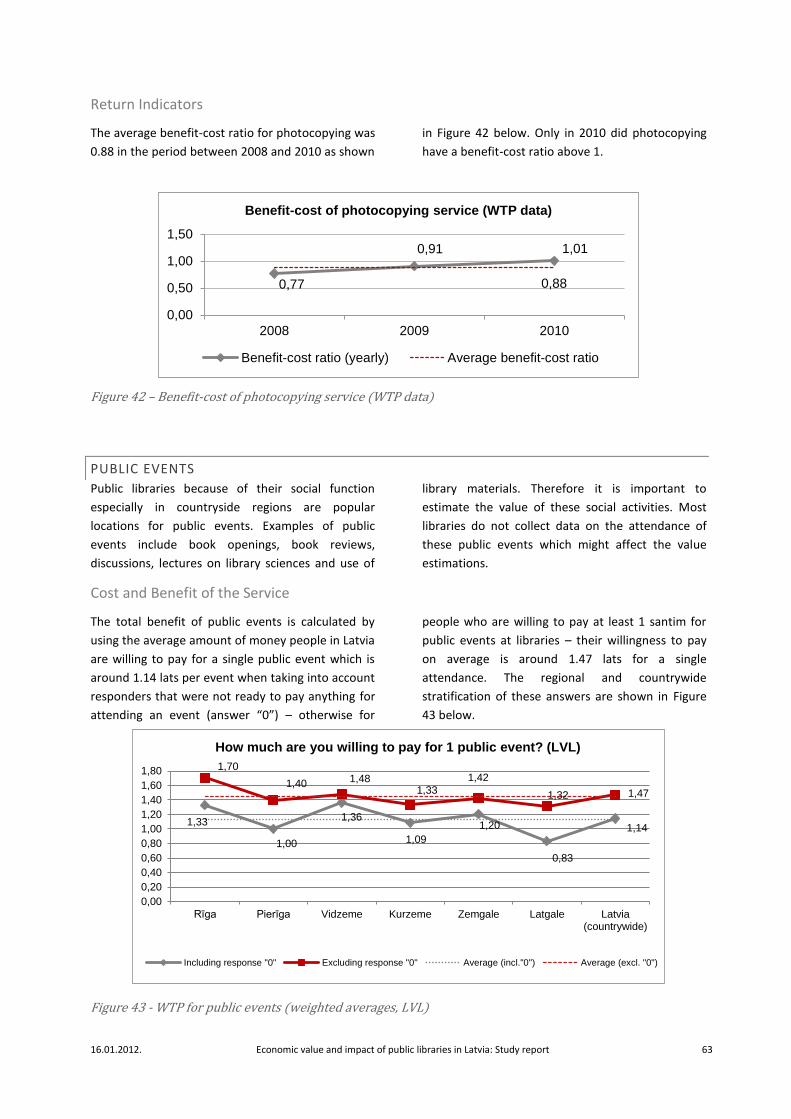
16.01.2012. Economic value and impact of public libraries in Latvia: Study report 63
Return Indicators
The average benefit-cost ratio for photocopying was
0.88 in the period between 2008 and 2010 as shown
in Figure 42 below. Only in 2010 did photocopying
have a benefit-cost ratio above 1.
Figure 42 – Benefit-cost of photocopying service (WTP data)
PUBLIC EVENTS
Public libraries because of their social function
especially in countryside regions are popular
locations for public events. Examples of public
events include book openings, book reviews,
discussions, lectures on library sciences and use of
library materials. Therefore it is important to
estimate the value of these social activities. Most
libraries do not collect data on the attendance of
these public events which might affect the value
estimations.
Cost and Benefit of the Service
The total benefit of public events is calculated by
using the average amount of money people in Latvia
are willing to pay for a single public event which is
around 1.14 lats per event when taking into account
responders that were not ready to pay anything for
attending an event (answer “0”) – otherwise for
people who are willing to pay at least 1 santim for
public events at libraries – their willingness to pay
on average is around 1.47 lats for a single
attendance. The regional and countrywide
stratification of these answers are shown in Figure
43 below.
Figure 43 - WTP for public events (weighted averages, LVL)
0,77
0,91 1,01
0,88
0,00
0,50
1,00
1,50
2008 2009 2010
Benefit-cost of photocopying service (WTP data)
Benefit-cost ratio (yearly) Average benefit-cost ratio
1,33
1,00
1,36
1,09
1,20
0,83
1,14
1,70
1,40 1,48 1,33
1,42
1,32 1,47
0,00
0,20
0,40
0,60
0,80
1,00
1,20
1,40
1,60
1,80
Rīga Pierīga Vidzeme Kurzeme Zemgale Latgale Latvia(countrywide)
How much are you willing to pay for 1 public event? (LVL)
Including response "0" Excluding response "0" Average (incl."0") Average (excl. "0")
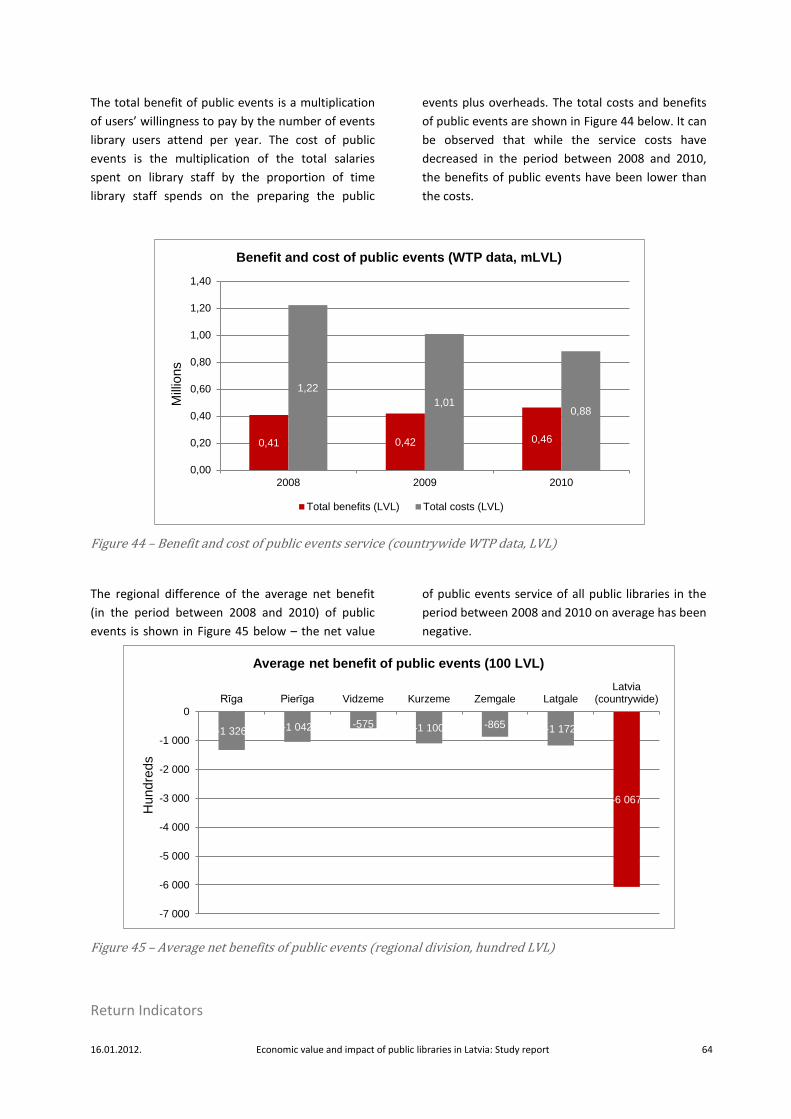
16.01.2012. Economic value and impact of public libraries in Latvia: Study report 64
The total benefit of public events is a multiplication
of users’ willingness to pay by the number of events
library users attend per year. The cost of public
events is the multiplication of the total salaries
spent on library staff by the proportion of time
library staff spends on the preparing the public
events plus overheads. The total costs and benefits
of public events are shown in Figure 44 below. It can
be observed that while the service costs have
decreased in the period between 2008 and 2010,
the benefits of public events have been lower than
the costs.
Figure 44 – Benefit and cost of public events service (countrywide WTP data, LVL)
The regional difference of the average net benefit
(in the period between 2008 and 2010) of public
events is shown in Figure 45 below – the net value
of public events service of all public libraries in the
period between 2008 and 2010 on average has been
negative.
Figure 45 – Average net benefits of public events (regional division, hundred LVL)
Return Indicators
0,41 0,42 0,46
1,22
1,01 0,88
0,00
0,20
0,40
0,60
0,80
1,00
1,20
1,40
2008 2009 2010
Mill
ions
Benefit and cost of public events (WTP data, mLVL)
Total benefits (LVL) Total costs (LVL)
-1 326 -1 042 -575 -1 100 -865 -1 172
-6 067
-7 000
-6 000
-5 000
-4 000
-3 000
-2 000
-1 000
0
Rīga Pierīga Vidzeme Kurzeme Zemgale LatgaleLatvia
(countrywide)
Hundre
ds
Average net benefit of public events (100 LVL)
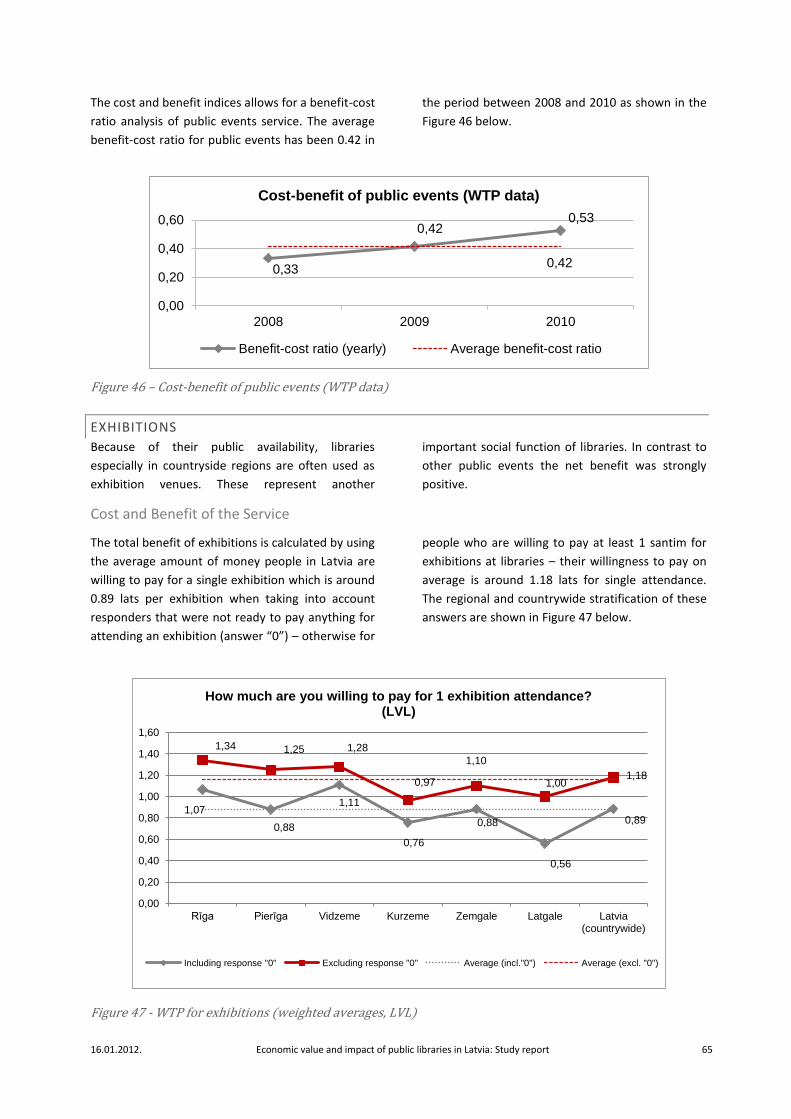
16.01.2012. Economic value and impact of public libraries in Latvia: Study report 65
The cost and benefit indices allows for a benefit-cost
ratio analysis of public events service. The average
benefit-cost ratio for public events has been 0.42 in
the period between 2008 and 2010 as shown in the
Figure 46 below.
Figure 46 – Cost-benefit of public events (WTP data)
EXHIBITIONS
Because of their public availability, libraries
especially in countryside regions are often used as
exhibition venues. These represent another
important social function of libraries. In contrast to
other public events the net benefit was strongly
positive.
Cost and Benefit of the Service
The total benefit of exhibitions is calculated by using
the average amount of money people in Latvia are
willing to pay for a single exhibition which is around
0.89 lats per exhibition when taking into account
responders that were not ready to pay anything for
attending an exhibition (answer “0”) – otherwise for
people who are willing to pay at least 1 santim for
exhibitions at libraries – their willingness to pay on
average is around 1.18 lats for single attendance.
The regional and countrywide stratification of these
answers are shown in Figure 47 below.
Figure 47 - WTP for exhibitions (weighted averages, LVL)
0,33
0,42 0,53
0,42
0,00
0,20
0,40
0,60
2008 2009 2010
Cost-benefit of public events (WTP data)
Benefit-cost ratio (yearly) Average benefit-cost ratio
1,07
0,88
1,11
0,76
0,88
0,56
0,89
1,34 1,25 1,28
0,97
1,10
1,00 1,18
0,00
0,20
0,40
0,60
0,80
1,00
1,20
1,40
1,60
Rīga Pierīga Vidzeme Kurzeme Zemgale Latgale Latvia(countrywide)
How much are you willing to pay for 1 exhibition attendance? (LVL)
Including response "0" Excluding response "0" Average (incl."0") Average (excl. "0")
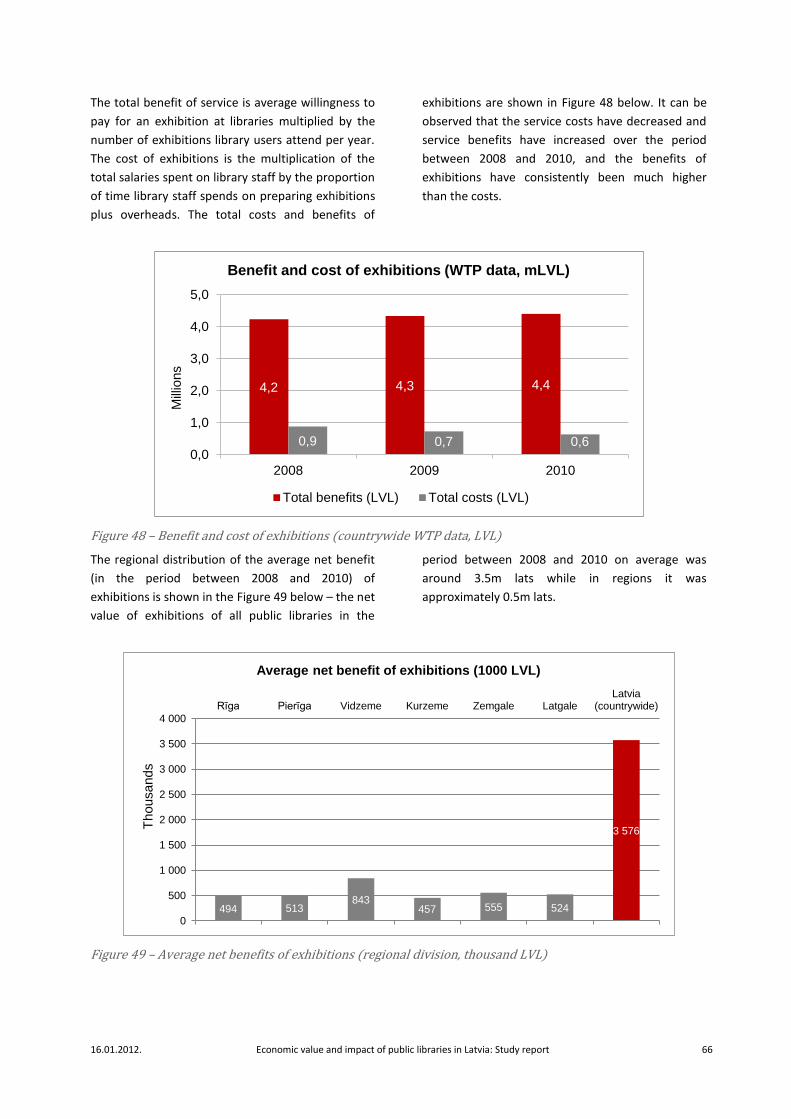
16.01.2012. Economic value and impact of public libraries in Latvia: Study report 66
The total benefit of service is average willingness to
pay for an exhibition at libraries multiplied by the
number of exhibitions library users attend per year.
The cost of exhibitions is the multiplication of the
total salaries spent on library staff by the proportion
of time library staff spends on preparing exhibitions
plus overheads. The total costs and benefits of
exhibitions are shown in Figure 48 below. It can be
observed that the service costs have decreased and
service benefits have increased over the period
between 2008 and 2010, and the benefits of
exhibitions have consistently been much higher
than the costs.
Figure 48 – Benefit and cost of exhibitions (countrywide WTP data, LVL)
The regional distribution of the average net benefit
(in the period between 2008 and 2010) of
exhibitions is shown in the Figure 49 below – the net
value of exhibitions of all public libraries in the
period between 2008 and 2010 on average was
around 3.5m lats while in regions it was
approximately 0.5m lats.
Figure 49 – Average net benefits of exhibitions (regional division, thousand LVL)
4,2 4,3 4,4
0,9 0,7 0,6 0,0
1,0
2,0
3,0
4,0
5,0
2008 2009 2010
Mill
ions
Benefit and cost of exhibitions (WTP data, mLVL)
Total benefits (LVL) Total costs (LVL)
494 513 843
457 555 524
3 576
0
500
1 000
1 500
2 000
2 500
3 000
3 500
4 000
Rīga Pierīga Vidzeme Kurzeme Zemgale LatgaleLatvia
(countrywide)
Thousands
Average net benefit of exhibitions (1000 LVL)
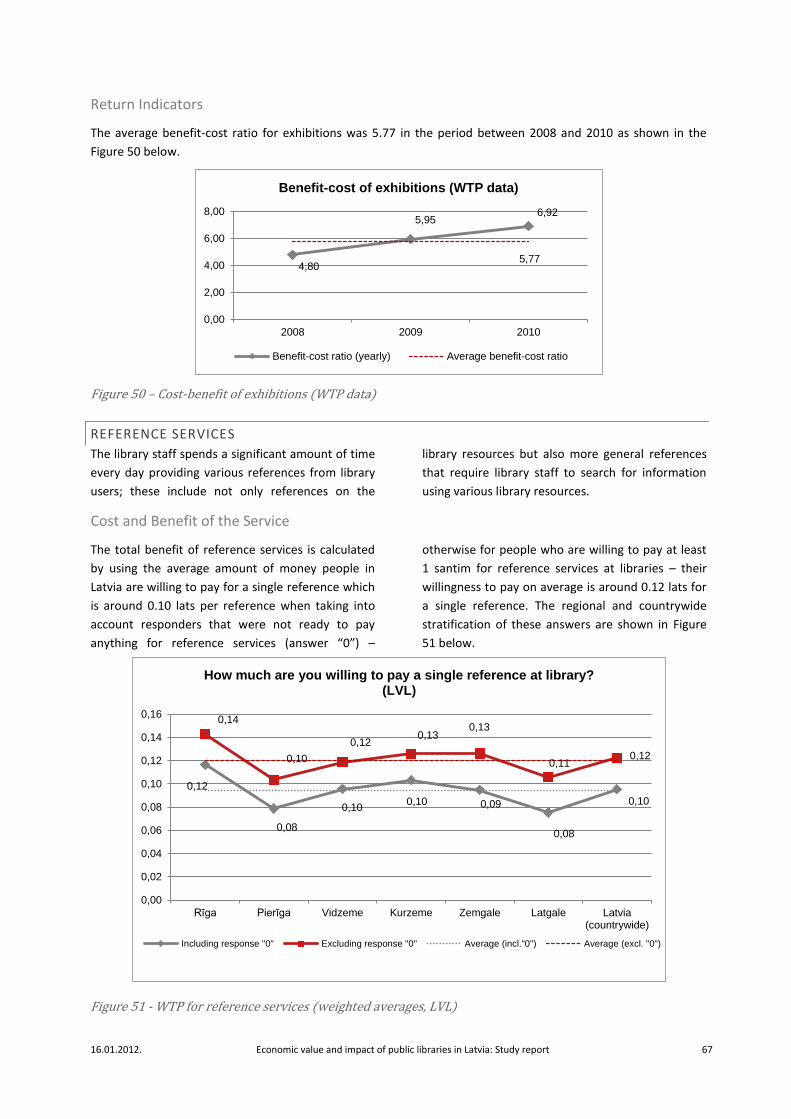
16.01.2012. Economic value and impact of public libraries in Latvia: Study report 67
Return Indicators
The average benefit-cost ratio for exhibitions was 5.77 in the period between 2008 and 2010 as shown in the
Figure 50 below.
Figure 50 – Cost-benefit of exhibitions (WTP data)
REFERENCE SERVICES
The library staff spends a significant amount of time
every day providing various references from library
users; these include not only references on the
library resources but also more general references
that require library staff to search for information
using various library resources.
Cost and Benefit of the Service
The total benefit of reference services is calculated
by using the average amount of money people in
Latvia are willing to pay for a single reference which
is around 0.10 lats per reference when taking into
account responders that were not ready to pay
anything for reference services (answer “0”) –
otherwise for people who are willing to pay at least
1 santim for reference services at libraries – their
willingness to pay on average is around 0.12 lats for
a single reference. The regional and countrywide
stratification of these answers are shown in Figure
51 below.
Figure 51 - WTP for reference services (weighted averages, LVL)
4,80
5,95 6,92
5,77
0,00
2,00
4,00
6,00
8,00
2008 2009 2010
Benefit-cost of exhibitions (WTP data)
Benefit-cost ratio (yearly) Average benefit-cost ratio
0,12
0,08
0,10 0,10 0,09
0,08
0,10
0,14
0,10
0,12 0,13
0,13
0,11 0,12
0,00
0,02
0,04
0,06
0,08
0,10
0,12
0,14
0,16
Rīga Pierīga Vidzeme Kurzeme Zemgale Latgale Latvia(countrywide)
How much are you willing to pay a single reference at library? (LVL)
Including response "0" Excluding response "0" Average (incl."0") Average (excl. "0")
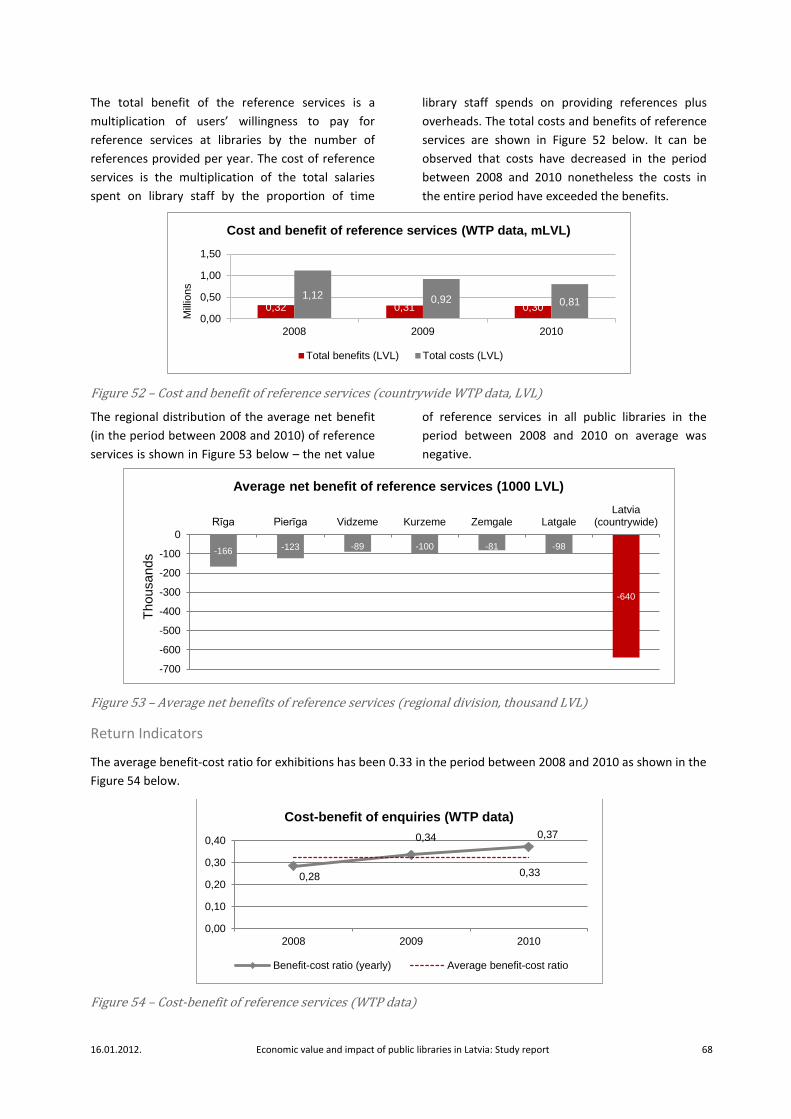
16.01.2012. Economic value and impact of public libraries in Latvia: Study report 68
The total benefit of the reference services is a
multiplication of users’ willingness to pay for
reference services at libraries by the number of
references provided per year. The cost of reference
services is the multiplication of the total salaries
spent on library staff by the proportion of time
library staff spends on providing references plus
overheads. The total costs and benefits of reference
services are shown in Figure 52 below. It can be
observed that costs have decreased in the period
between 2008 and 2010 nonetheless the costs in
the entire period have exceeded the benefits.
Figure 52 – Cost and benefit of reference services (countrywide WTP data, LVL)
The regional distribution of the average net benefit
(in the period between 2008 and 2010) of reference
services is shown in Figure 53 below – the net value
of reference services in all public libraries in the
period between 2008 and 2010 on average was
negative.
Figure 53 – Average net benefits of reference services (regional division, thousand LVL)
Return Indicators
The average benefit-cost ratio for exhibitions has been 0.33 in the period between 2008 and 2010 as shown in the
Figure 54 below.
Figure 54 – Cost-benefit of reference services (WTP data)
0,32 0,31 0,30 1,12 0,92 0,81
0,00
0,50
1,00
1,50
2008 2009 2010
Mill
ions
Cost and benefit of reference services (WTP data, mLVL)
Total benefits (LVL) Total costs (LVL)
-166 -123 -89 -100 -81 -98
-640
-700
-600
-500
-400
-300
-200
-100
0
Rīga Pierīga Vidzeme Kurzeme Zemgale LatgaleLatvia
(countrywide)
Thousands
Average net benefit of reference services (1000 LVL)
0,28
0,34 0,37
0,33
0,00
0,10
0,20
0,30
0,40
2008 2009 2010
Cost-benefit of enquiries (WTP data)
Benefit-cost ratio (yearly) Average benefit-cost ratio
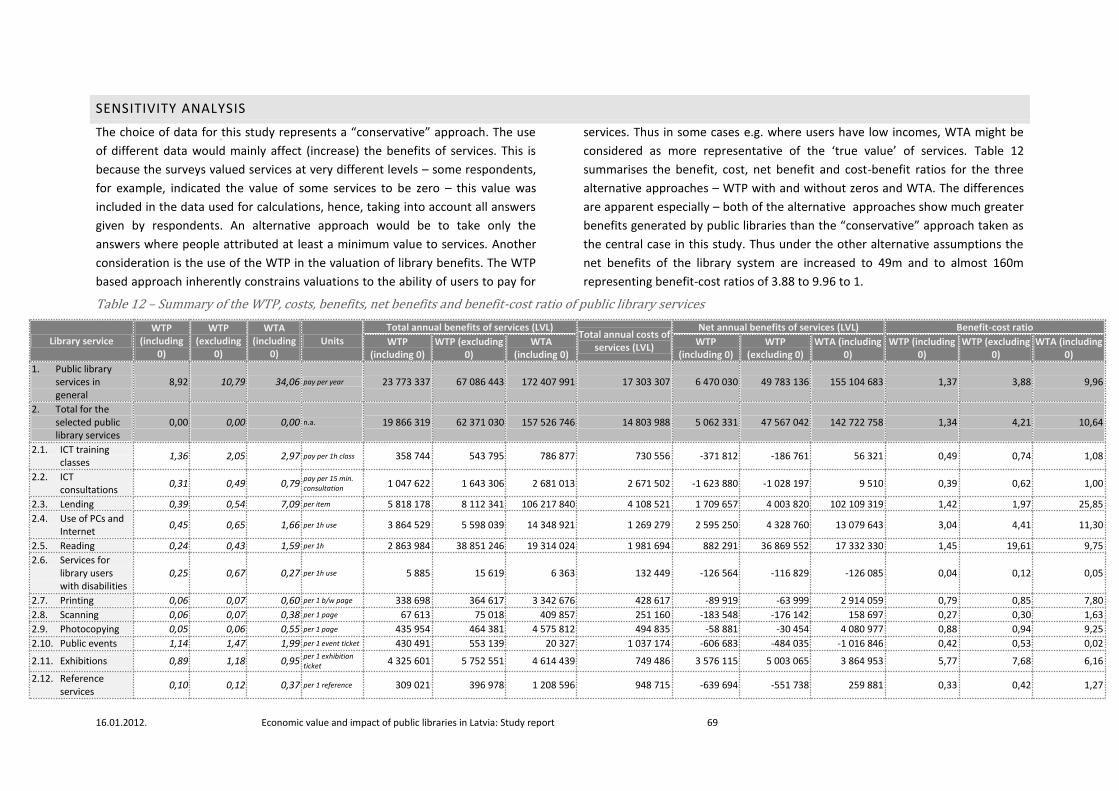
16.01.2012. Economic value and impact of public libraries in Latvia: Study report 69
SENSITIVITY ANALYSIS
The choice of data for this study represents a “conservative” approach. The use
of different data would mainly affect (increase) the benefits of services. This is
because the surveys valued services at very different levels – some respondents,
for example, indicated the value of some services to be zero – this value was
included in the data used for calculations, hence, taking into account all answers
given by respondents. An alternative approach would be to take only the
answers where people attributed at least a minimum value to services. Another
consideration is the use of the WTP in the valuation of library benefits. The WTP
based approach inherently constrains valuations to the ability of users to pay for
services. Thus in some cases e.g. where users have low incomes, WTA might be
considered as more representative of the ‘true value’ of services. Table 12
summarises the benefit, cost, net benefit and cost-benefit ratios for the three
alternative approaches – WTP with and without zeros and WTA. The differences
are apparent especially – both of the alternative approaches show much greater
benefits generated by public libraries than the “conservative” approach taken as
the central case in this study. Thus under the other alternative assumptions the
net benefits of the library system are increased to 49m and to almost 160m
representing benefit-cost ratios of 3.88 to 9.96 to 1.
Table 12 – Summary of the WTP, costs, benefits, net benefits and benefit-cost ratio of public library services
Library service WTP
(including 0)
WTP (excluding
0)
WTA (including
0) Units
Total annual benefits of services (LVL) Total annual costs of
services (LVL)
Net annual benefits of services (LVL) Benefit-cost ratio
WTP (including 0)
WTP (excluding 0)
WTA (including 0)
WTP (including 0)
WTP (excluding 0)
WTA (including 0)
WTP (including 0)
WTP (excluding 0)
WTA (including 0)
1. Public library services in general
8,92 10,79 34,06 pay per year 23 773 337 67 086 443 172 407 991 17 303 307 6 470 030 49 783 136 155 104 683 1,37 3,88 9,96
2. Total for the selected public library services
0,00 0,00 0,00 n.a. 19 866 319 62 371 030 157 526 746 14 803 988 5 062 331 47 567 042 142 722 758 1,34 4,21 10,64
2.1. ICT training classes
1,36 2,05 2,97 pay per 1h class 358 744 543 795 786 877 730 556 -371 812 -186 761 56 321 0,49 0,74 1,08
2.2. ICT consultations
0,31 0,49 0,79 pay per 15 min. consultation 1 047 622 1 643 306 2 681 013 2 671 502 -1 623 880 -1 028 197 9 510 0,39 0,62 1,00
2.3. Lending 0,39 0,54 7,09 per item 5 818 178 8 112 341 106 217 840 4 108 521 1 709 657 4 003 820 102 109 319 1,42 1,97 25,85
2.4. Use of PCs and Internet
0,45 0,65 1,66 per 1h use 3 864 529 5 598 039 14 348 921 1 269 279 2 595 250 4 328 760 13 079 643 3,04 4,41 11,30
2.5. Reading 0,24 0,43 1,59 per 1h 2 863 984 38 851 246 19 314 024 1 981 694 882 291 36 869 552 17 332 330 1,45 19,61 9,75
2.6. Services for library users with disabilities
0,25 0,67 0,27 per 1h use 5 885 15 619 6 363 132 449 -126 564 -116 829 -126 085 0,04 0,12 0,05
2.7. Printing 0,06 0,07 0,60 per 1 b/w page 338 698 364 617 3 342 676 428 617 -89 919 -63 999 2 914 059 0,79 0,85 7,80
2.8. Scanning 0,06 0,07 0,38 per 1 page 67 613 75 018 409 857 251 160 -183 548 -176 142 158 697 0,27 0,30 1,63
2.9. Photocopying 0,05 0,06 0,55 per 1 page 435 954 464 381 4 575 812 494 835 -58 881 -30 454 4 080 977 0,88 0,94 9,25
2.10. Public events 1,14 1,47 1,99 per 1 event ticket 430 491 553 139 20 327 1 037 174 -606 683 -484 035 -1 016 846 0,42 0,53 0,02
2.11. Exhibitions 0,89 1,18 0,95 per 1 exhibition ticket
4 325 601 5 752 551 4 614 439 749 486 3 576 115 5 003 065 3 864 953 5,77 7,68 6,16
2.12. Reference services
0,10 0,12 0,37 per 1 reference 309 021 396 978 1 208 596 948 715 -639 694 -551 738 259 881 0,33 0,42 1,27
16.01.2012. Economic value and impact of public libraries in Latvia: Study report 70
ENDNOTES
1 Bibliotēku attīstības pamatnostādnes 2011.–2015.gadam (http://www.km.gov.lv/lv/doc/nozaru/biblio/dokumenti/LBPpamatnost.proj_2011.2015.pdf)
ii Introduction and General Description of the Method of Contingent Valuation, Food and Agriculture Organization of the United Nations
(http://www.fao.org/DOCREP/003/X8955E/x8955e03.htm)
3 See, for example, a handbook on the extended standard cost model (“Paplašinātais standarta izmaksu modelis”) issued by the State Chancellery.
(www.mk.gov.lv/file/files/ESfondi/2011/as_metrgr_psim_e-vide.pdf)
4 http://www.csb.gov.lv/en/node/28607
5 The sample size of more than 3,000 was chosen to increase the confidence level and reduce margin of error. Out of all respondents, 25% were non-users, 47% were active
users and 27% were passive users of libraries.
6 c.f. BusinessDictionary.com, 2011
7 c.f. Smith, Richard D., 2005. "Sensitivity to scale in contingent valuation: the importance of the budget constraint," Journal of Health Economics, Elsevier, vol. 24(3), pages
515-529.
8 Here we refer to willingness to pay throughout but logically willingness to accept is an alternative, which in some cases might be more informative.
9 c.f. Kamer, Pearl M. Placing an Economic Value on the Services of Public Libraries in Suffolk County, New York, a study prepared by the Long Island Association, June 2005.
(http://scls.suffolk.lib.ny.us/pdf/librarystudy.pdf).
10 Other expenses include items like electricity, office supplies, heating, maintenance expenses and other similar costs.
11 http://www.likumi.lv/doc.php?id=53872
xii In this particular case the WTP data used excluded responses that assigned value “0” to this service on the grounds that including the zero valuations of people who did
not need such a service would undluly bias the results.
13 Survey dataset including values „0” except for services for visually impaired (survey conducted in autumn/ winter 2011).
14 Countrywide weighted average data for period of 2008-2010; based upon service usage frequency from library dataset using WTP dataset.
15 Countrywide weighted average data for period of 2008-2010; based upon service usage frequency from library dataset.
16 Using cost and benefit countrywide weighted average data for period of 2008-2010.
16.01.2012. Economic value and impact of public libraries in Latvia: Study report 71
17 The study included only those capital investments related to instalment of PC and Internet access equipment (mainly BMGF donation and state subsidy). Capital
investments in buildings and land were not accounted for because the effect of these investments is long standing and would artificially raise the costs of library services. For this study investments are perceived as financial investments in salaries and support of services (purchase of materials and overheads, directly related to the provision of services).
18The Economic Contribution of Wisconsin Public Libraries 2008, A Return on Investment Study of the Charlotte Mecklenburg Library 2010, The Economic Impact of
Libraries in Indiana, Indiana Business Research Center, November 2007, The Economic Impact of Public Libraries on South Carolina, Daniel D. Barron, Robert V. Williams, Stephen Bajjaly, Jennifer Arns, Steven Wilson, January 2005, The Economic Value of Vermont's Public Libraries 2005-2006, Marianne Kotch, February 2007, Information Searches That Solve Problems: How People Use the Internet, Libraries, and Government Agencies When They Need Help, PEW / Internet & American Life Project and Graduate School of Library and Information Science, December 30, 2007, Taxpayer Return on Investment in Florida Public Libraries: Summary Report, Jose- Marie Griffiths, Donald W. King, Christinger Tomer, Thomas Lynch, Julie Harrington, September 2004, Taxpayer Return-on-Investment (ROI) in Pennsylvania Public Libraries, Jose-Marie Griffiths, Donald W. King, Sarah E. Aerni, with Scott Beach, Janet Schlarb, Chris Briem, Chris Tomer, Matt Herbison, Songphan Choemprayong, September 2006, Value for Money: Southwestern Ohio's Return from Investment in Public Libraries, Levin, Driscoll and Fleeter, June 2006, The Wisconsin Library User (and Non-User) II: Outcomes of a Second Statewide Survey (2003-2007 Comparisons), Joshua H. Morrill, Ph.D., June 2007.
19Ibid. and Measuring Our Value. The British Library, 2004
20 Survey dataset including values „0” except for services for disabled people (survey conducted in autumn/ winter 2011).
21 Countrywide weighted average data for period of 2008-2010; based upon service usage frequency from library dataset using WTP dataset.
22 Countrywide weighted average data for period of 2008-2010; based upon service usage frequency from library dataset.
23 Using cost and benefits countrywide weighted average data for period of 2008-2010.


![IMPACT ASSESSMENT OF BIOGAS PROJECTS IN LATVIA · 2014-08-08 · biogas plants help Latvia to comply with the European Parliament and Council Directive 2009/28/EC [1] on the promotion](https://img.pdfslide.us/doc/110x75/5e6ac8c1b31b5f7605604f2a/impact-assessment-of-biogas-projects-in-latvia-2014-08-08-biogas-plants-help-latvia.jpg)