Embed Size (px)
Citation preview
CHAPTER 2
Economic Value of Wetlandsi A Review of Literature
Despite Wet|and’s ecological and economic significance, they were traditionally
viewed as “wastelands” that could be sacrificed for the sake of increasing social
welfare. The recent attempts of natural and social scientists to highlight the
significance of these ecosystems have drawn various procedures andmethodologies to account for the sustainable uses of these ecosystems indevelopment projects. While the ecologists targeted on identifying variousecological functions and services of wetlands to establish their economic and
social relevance to humanity, economists were mainly engaged in evolving
procedures to attribute monitory values to such uses. The objective of thischapter is to survey briefly relevant literature on the economics of wetland
valuation. The chapter is divided into four sections Section 1 presents a brief
survey of studies dealing with economic valuation of wetlands. ln doing these
surveys, special care is taken to explore the major issues of wetland valuation
and the various theoretical approaches developed to address them. Section 2
brings together the major findings of various case studies on wetland valuation to
highlight how these studies are useful in planning and managing wetlands. A
brief note on the limitations of the approach and reasoning for using the valuation
framework is presented in section 3. This is followed by a brief summary of the
chapter in section 4.
2.1 Economic Valuation of Wetlands: A Methodological Review
Economic valuation “is an attempt to assign quantitative values to goods and
services provided by environmental resources, whether or not market prices are
available to assist us. It is conceived of as putting a number, either on an ordinal
15
or cardinal scale, on the utility accruing from current production, which may be
either consumed or saved" (J. S. Mill). According to environmental economists,
wetlands deliver a variety of direct and indirect benefits to various sections of the
society and therefore the process of assigning monetary values invoke moral and
ethical arguments. Economic value of an ecosystem function or service is thecontribution it makes to human welfare and is measured in terms of each
individual’s own assessment of his or her well being and what one is willing to
pay for the commodity, less what it costs to supply it (Smith, 1995). Freeman,
(1993) pointed out that wetland's value is the sum of the present values of the
flow of all private goods and non-marketed goods and service from this natural
system. These arguments led to the development of the general taxonomy of
Total Economic Value (TEV) that represents the economic value of wetlands‘.
2.1.1 Total Economic Value (TEV)
8Several economists (Krutilla, 1967; Boyle and Bishop, 1987; Bateman and
Turner, 1993; Freeman, 1993) have offered well-composed definitions of total
economic value and the relationships among its components. Total economic
value of a wetland area is the sum of the amount of money that all people who
benefit from the wetland area would be willing to pay to see it protected(Whitehead 1992). Accordingly, it is the sum of its direct, indirect, option and
existence values (Pearce, 1991). ln this sense, estimating economic values
would guide resolving the fundamental issues of wetland uses and abuses
Economists disagree on the components that constitute economic value.Broadly, environmental values can be broadly split into use and non-use values
‘ The total economic valuation fi-amework is a means to identify different uses and services, which oould bepotentially provided by an environmental good or service and to facilitate an understanding of the origins ofdifferent wetland values. it helps to ensure that all-important values are accounted for in the valuation exercise.
16
(Pearce 1993; Barbier, 1994). The former is further divided into direct use valuez
and indirect use values depending on whether the resource is used as an input in
production or directly as consumption good or for protecting or sustaining
economic activity indirectly (Barbier et al., 1997). Option value is defined as the
value of actually retaining the good for future consumption and expected value of
future consumption of the good (Weisbrod, 1964). It is the value an individual
places on the environment for future consumption. lt represents an individual‘s
willingness to pay to maintain the option of utilizing a resource at some time in
the future. Quasi option value“ refers to uncertain future benefits (Torras, 2000).
Existence value,5 the most debated component of non-use value, is commonly
used to denote the value individuals place on the environment unrelated to its
present or future use (Turner et al., 2000). it represents an individual‘swillingness to pay to ensure that some resource exists. Part of this motivation
may be the desire to bequeath the resource to future generations (Bishop 1987).
Non-use value on the other hand refers to the monitory gain to people who derive
satisfaction from the mere existence of a resource, even though they may never
see it or consume any product obtained from it (Boyle and Bishop, 1987“; Pearce
1993). Two broad types of non-use values - ‘existence value’ and ‘bequest value’
- are recognized (Weisbrod 1964; Krutilla 1967).
2 Direct use value includes goods input in production or good consumed directly such as fishery resources, paddy,mangroves etc and services such as recreation, tourism and ferry etc.
3 Economists often disagree on what constitutes each type of value. According to Aylward and Barbier (1992), thedistinction between components of indirect use values lies predominantly in the support function of ecologicalsystems on the one and their protection function on the other hand. Farnsworth et al. (1981) used the tern‘inherent’ value instead of indirect value. Costanza ct al. (1997) refers to them as “Infrastructure values” of anecosystem while Norton (1986) used the term ‘contributory value’.
‘ Quasi-option values also exist according to some economist. It is the value of obtaining better information bydelaying a decision that may result in irreversible environmental loss (Walsh et al., 1984).
5 Only in I967 was existence values identified as a potential benefit of natural assets. They were altogetherunknown before that date (Krutilla, 1967). Existence value have been variously defined in the literature as bequestvalue, cognitive value, non-patemalistic altruism, patemalistic altruism, option value, intrinsic value, ethical,moral and social values (McConnell, 1983; Randall and Stoll, 1983; Smith, 1987; Boyle and Bishop, 1987;Loomis, 1988; Stevens et al., 199i; Bishop and Welsh, I992; Kopp I992; Freeman, I993; McConnell, 1997;Kramer and Mercer, 1997; Turner et al., 2000).
17
Although the “total economic value taxonomy" is the forerunner in wetland
valuation, economists have pointed out two serious obiections to this approach.
First, some economists object to using a framework with classification of values
into use and non-use values. This is not fully satisfactory since it does notexplicitly differentiate between alternative life-support functions of anenvironmental resource (Gren et al., 1995) and therefore fails to reflect Total
Primary Values (TPV) of the ecosystem (Turner et al., 1993). But going beyond
total economic value to measure the extra ‘glue value’ that comprises total
primary value is extremely difficult (Barbier, 1995). Secondly, wetlands being
complex systems, simple aggregation of the value of ecosystem benefits are not
acceptable since some functions are pre-conditional to others (Gren et al., 1995).
Departing from the conventionally followed definition of the components of total
economic value, Maler (1992) distinguished between values revealed by markets
and those not revealed by markets.’ His argument was that estimations could be
made of benefits based on observed behaviour, but lack of complete knowledge
about ecosystem services made it impossible to value the whole system.
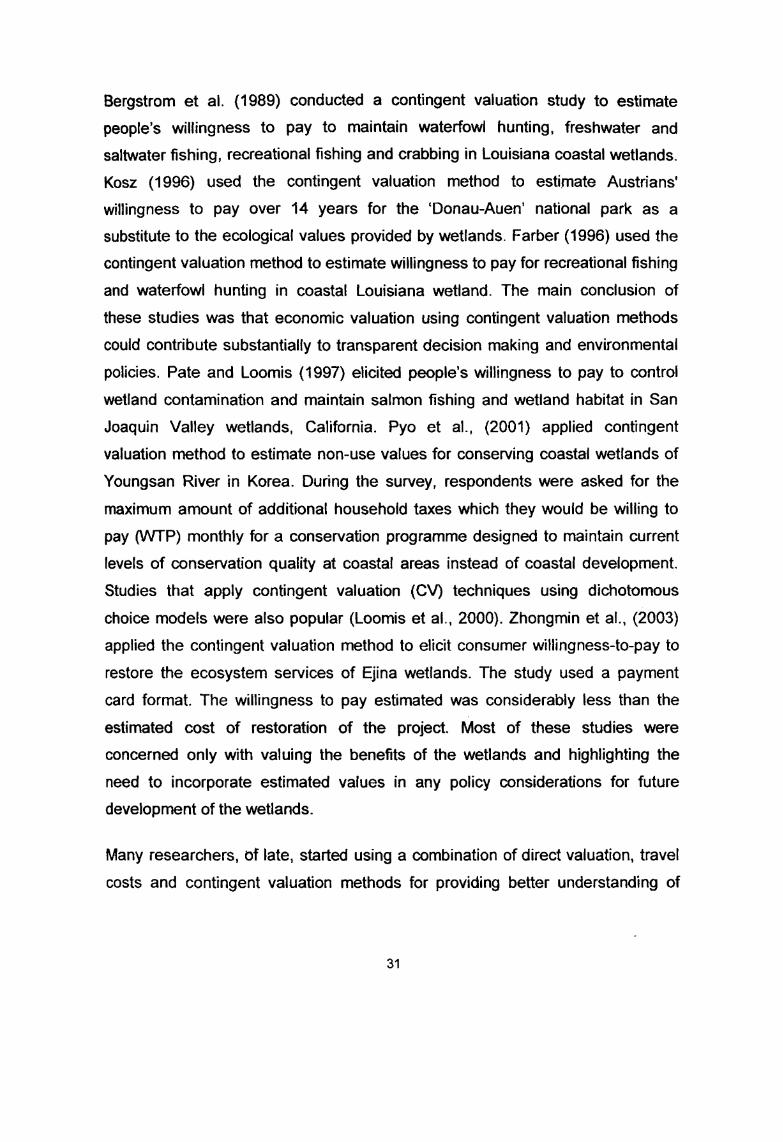
As noted, most objections raised were regarding the components of TotalEconomic Value rather that the framework as a whole. It has been accepted and
used by many economists as a first step. Hence, it provides a useful framework
and starting point for a wetland valuation study. Figure 2.1 below presents the
famous taxonomy for estimating the total economic value of wetlands.
6 Although a lack of consensus exists with regard to the components of Total Economic Value, academiciansgenerally agree that a clear distinction exist between the concept of Total Economic Value and Total Value of anecosystem (Tumer et al., 1993). Total Value of a system is much more than just an aggregation of its individualparts and includes a ‘glue value’. Most studies conclude with the observation that only a part of total wetlandvalues can be captured in monetary terms and this part is referred to as total economic value.
7 The former referring to those values obtained fi'om observed market behaviour while the latter refers to all othervalues that can never be revealed from observing individual behaviour in markets.
18
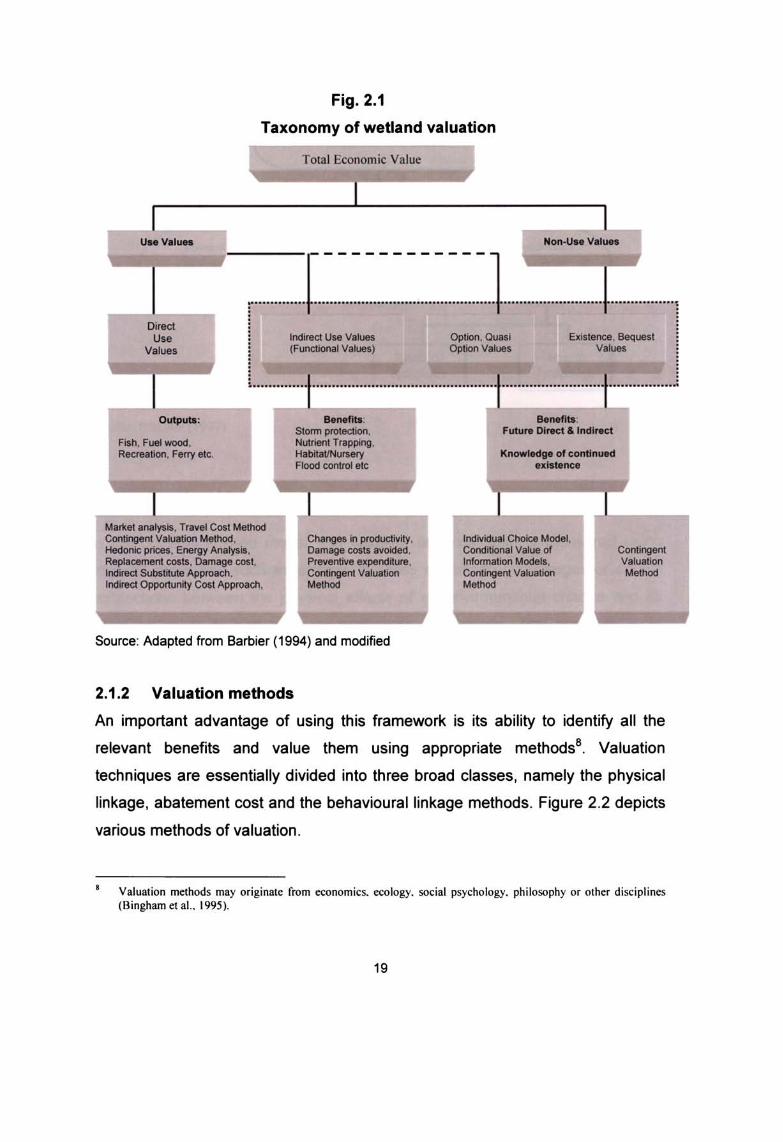
Fig. 2.1
Taxonomy of wetland valuation
Total Economic Value
UM Val1lM '- C-------............. . ..............................
----1 ............... ·························r················
0;_ I U .. Inclifed use ValUes
V.'ues (FuncIional vatues)
1 ............ -1 ............................... -, r--' ....... , &onn ptOtedion,
FIItI. Fuel wood. Nutrienl Trapping. RectHtion, Feny etc. HabltatlNlAeIV
Flood control etc
I M8fII;. analy$l$, Travel Cos, Method • ContingenI Valuation Method, Changes In produdIvily, Hodonlc prices, Energy Analysis . Dam. COIls avoided. ReplaOllmlKt costs, Damage cost. Preventive oxpendilunt, Indirect SobsbMe Approach, ContIngent Valuation Indirect Oppoftunity Cost Approach, M""'"
Source: Adapted from Barbier (1994) and modified
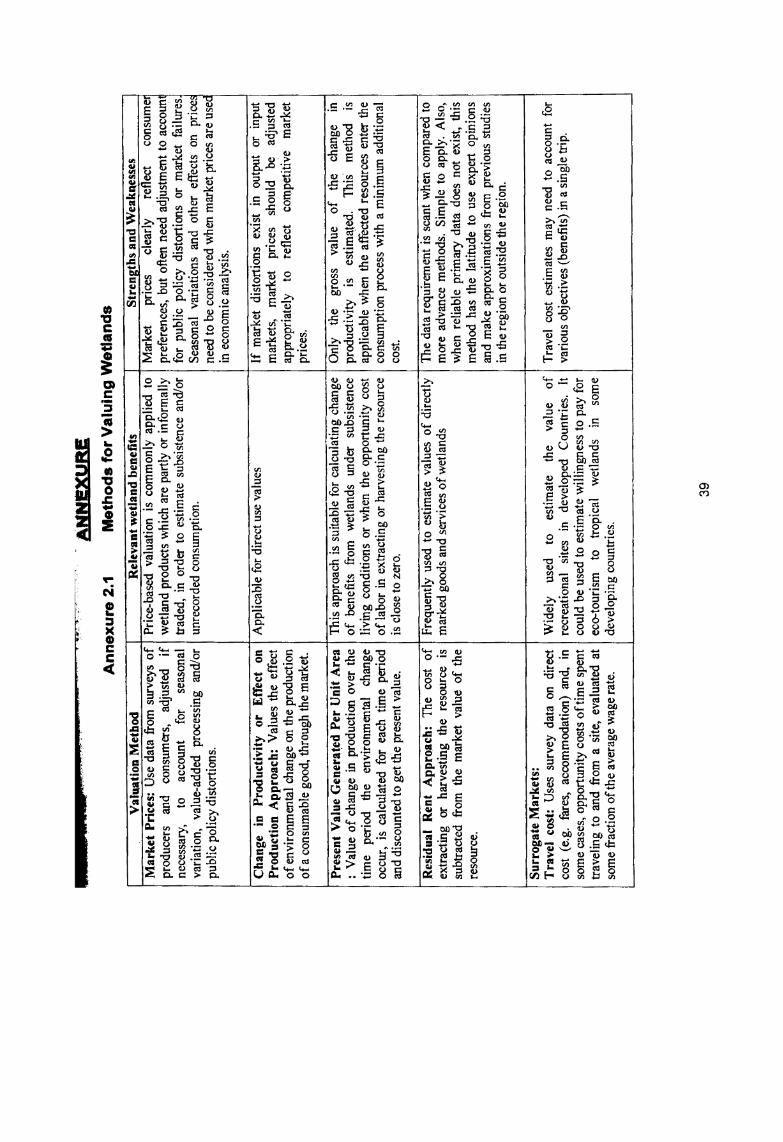
2.1.2 Valuation methods
Oplion, Quasi Option V.IUIIS
Existence, Bequest v ......
.............. J ....................... J-............. . Futu,. :::: Inclnct 1
.. -KnowtedgIl of conGn .... J I I
IndNIOual CMice Model, I Conditional Value DI Contingent Information Models. ValUation Cootingent Valuation M~"'"
~"'"
An importanl advanlage of using this framework is its ability to identify all the
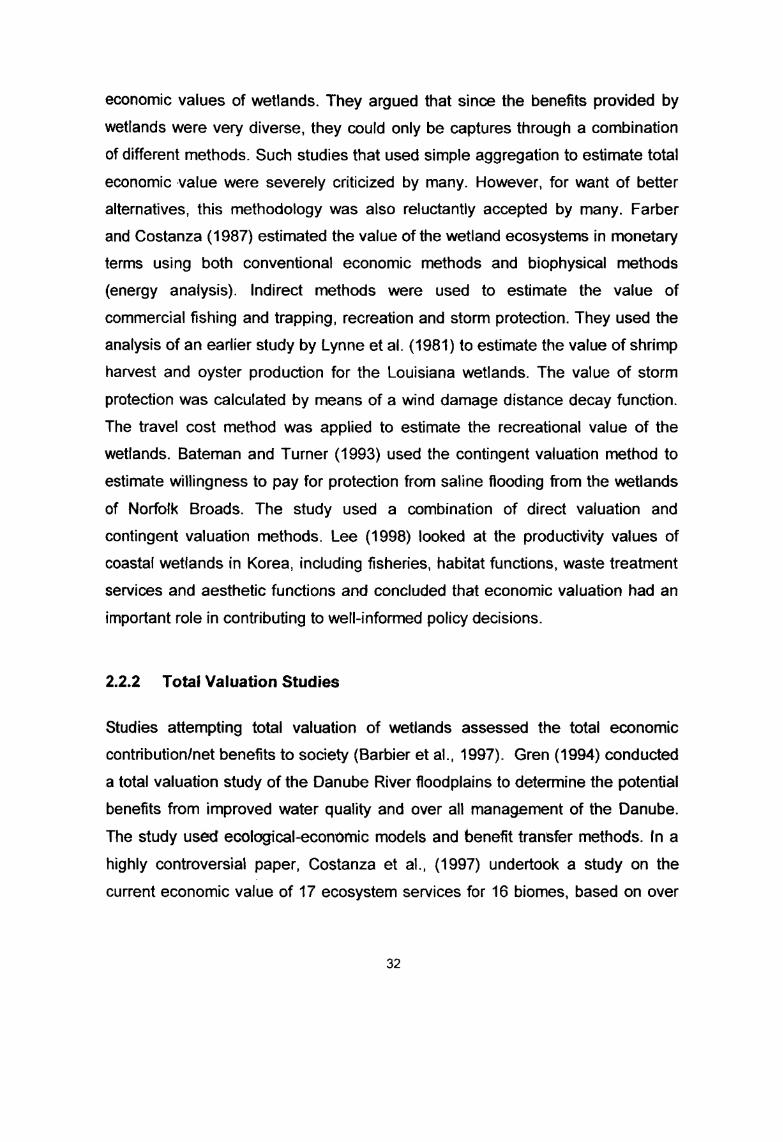
relevant benefits and value them using appropriate methods'. Valuation
techniques are essentially divided into three broad classes. namely the physical
linkage. abatement cost and the behavioural linkage methods. Figure 2.2 depicts
various methods of valuation.
Valuation methods may originate rrom economics. ecology. social psychology. philosophy or other disciplines (B ingham et al.. 1995).
19
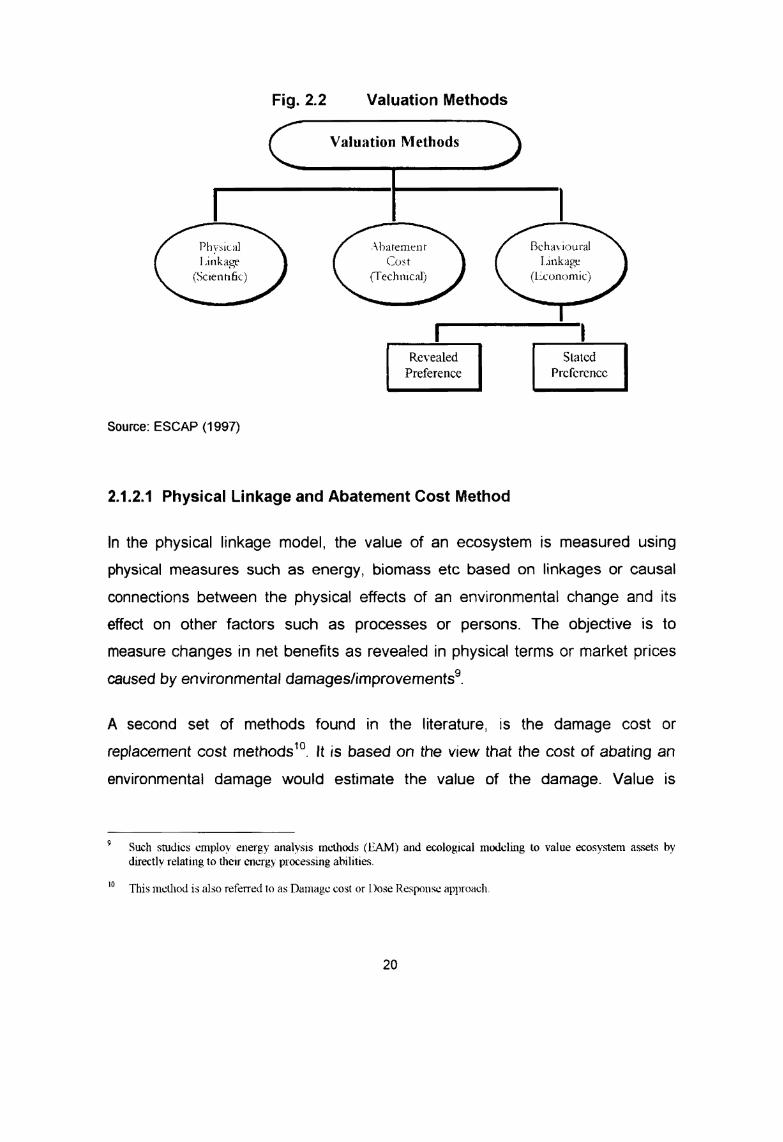
Fig. 2.2 Valuation Methods
Valuation Methods
Physical Bchax-"iouralI ,inka§2§E Linkage(Scientific) (liconontie)
Revealed StatedPreference Pref ercnce
Source: ESCAP (1997)
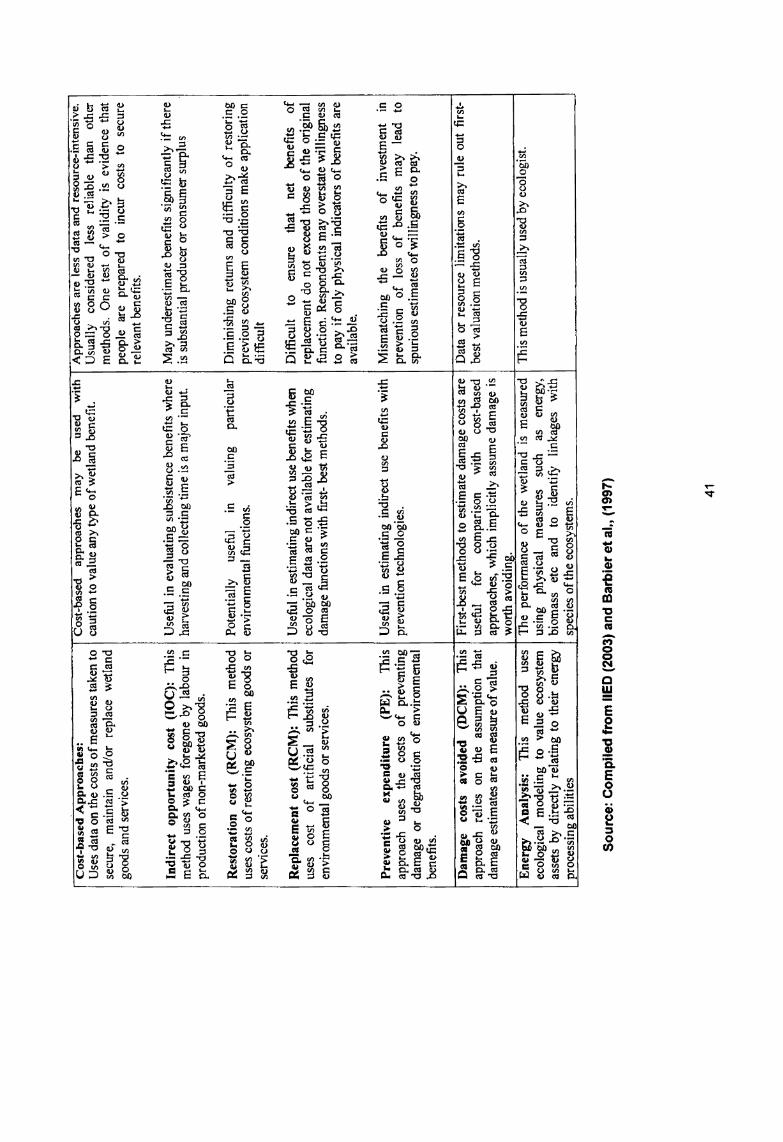
2.1.2.1 Physical Linkage and Abatement Cost Method
ln the physical linkage model, the value of an ecosystem is measured using
physical measures such as energy, biomass etc based on linkages or causal
connections between the physical effects of an environmental change and its
effect on other factors such as processes or persons. The objective is tomeasure changes in net benefits as revealed in physical terms or market prices
caused by environmental damages/improvementsg.
A second set of methods found in the literature, is the damage cost orreplacement cost methodsw. It is based on the view that the cost of abating an
environmental damage would estimate the value of the damage- Value is
9 Such studies employ energy analysis methods (EAM) and ecological modeling to value ecosystem assets bydirectly relating to their energy processing abilities.0 . .
1 This metliod 1S also referred to as Damage cost or Dose Response approach.
20
reflected in the proxy costs of providing, maintaining or restoring environmental
goods and services (Bishop, 1998).
Since boththese methods use the biophysical and functional relationships as thebasis of value rather than an attempt to measure the environmental value of
resources, economists do not generally favour these methods for wetlandvaluation.
2.1.2.2 Behavioural Linkage Method
The behavioural linkage methods, on the other hand, assume that the value of an
environmental good should be based on people's willingness to pay (V\fl' P) to
secure better environmental quality or to escape deterioration. These techniques
estimate behavioural parameters“ that reveal preferences directly (market
prices, net factor income, cost of avoidance), or indirectly in the market (travel
cost method and the hedonic price method) or are stated in a survey (contingent
valuation, choice experiments and conjoint analysis).
2.1.2.2 (1) Market Based Techniques
Price is the value in exchange of a good or service. Market based methods
therefore use'market prices for valuation. These methods have the advantage of
easy applicability as well as simplicity in methodology. Most of the calculations
can be done using simple accounting techniques like change in productivity”
The usefulness of any particular classification depends upon how well it illuminates important similarities anddifferences among types of service flows. Mitchell and Carson (1989) have otfered classification of methods forestimating values that are based on two characteristics of the method. The first characteristic is whether the datacome fiom observations of actual human behavior. The second yields monitory values directly or must be inferredindirectly through technique based on models of human behaviour and choice.
'2 The basic assumption of this method is -that mvironmental changes cause changes in productivity of resourcesand/or environmental goods or services. in such a case, the cost of environmental change is estimated usingmarket prices, provided these resourcesl environmental goods and services have a direct market value.
21
(Barbier et al., 1993), production function approach“ (Barbier, 1994; Bell, 1997),
present value generated per unit area“ or the residual rent approach“.Annexure 2.1 provides details.
2.1.2.2 (2) Non-Market Based Techniques
[a.] Revealed Preference Methods
Non-marketbased techniques are broadly classified into revealed preference
and stated preference approaches. The revealed preference approach infers
value of the missing markets for environmental resources from data onbehavioural changes in actual markets related to the resource/service in some
way. The value of an environmental amenity is estimated directly or indirectly
from the purchase price of a commodity whose market value at least partly
depends on the quality of the environmental amenity in question. Threeapproaches - travel cost, random utility and hedonic price models - are worth
mentioning.
In this approach, the environmental attribute (soil stability, water quality, etc) is considered as an input in theproduction fimction, which relates the output of a particular marketed good or service (for example wetlandagicultural production, fishing catches) to the inputs necessary to produce it. The effects of the other factorsaffecting production can be incorporated into the production function as well. Although this method is verypopular and widely applied, it is not commonly used in multiple use systems such as wetland studies especiallythose measuring total economic value since its application is slightly more problematic (Mater, I992; Aylward andBarbier, 1992; Barbier eta1., 1993; Barbier, 2000).
I3
1‘ Under this method, the gross value of change in production over the time period the environmental changeoccurred is calculated for each time period and discounted to get the present value. Then the total gross value perunit area is calculated by dividing the change in production by the total area affected. This method is applicablewhen the aflected resource enters the consumption process with a minimum additional cost. This approachhowever, ignores the cost of inputs, which are expended in extracting the resource.
*5 In this approach, the cost of extracting or harvesting the resource is subtracted from the market value of theresource. When the extraction/harvest costs includes labour costs (as usually would be the case), it is theopportunity cost of labour and not the market wages that is considered.
22
The travel cost methodls (TCM) is often used to measure direct uses of wetlands
such as the recreational benefits. This method attempts to place a value on a
non-market environmental good (such as a recreation site) by drawing inferences
from expenditure made to “consume” the good, including the cost of traveling to
the site, entry fees, on~site expenditures and outlays on capital equipment (such
as fishing equipment or a boat). It translates the physical, psychological and
social benefits generated by the individual use of this non-marketableenvironmental resource for recreational purposes, into monetary terms. Anumber of studies were conducted in different parts of the world to estimate the
recreational values of wetlands (Farber, 1988; Amacher et al., 1989). Seesection 2.2 and chapter 6 for details.
The Random Utility Model (RUM) is conceptually similar to the travel cost model.
They seek the same kind of values and use similar logic. However, instead of
focusing on the number of trips a tourist takes to a given site in a season, these
models focus their choice amongst the discrete alternative recreational sites.
This type of model is particularly appropriate when there are many substitutes
available to the individual and when the attempt is to value a change in the
quality characteristics of one or more site altematives.
'6 The travel cost method originated in a letter from Harold Hotelling to the director of the US Park Service in 1947,but was-formally introduced in the writings of Trice and Wood (1958) and Clawson and K.net$ch (I966). Sincethen, all research on travel cost methods in the last 50 years have attempted to elaborate on the original suggestioneither theoretically or empirically. Hotelling suggested measuring differential travel rates according to traveldistances that visitors overcome in reaching a site. Exploiting the empirical relationship between increased traveldistances and associated declining visitation rates should permit the estimation of a true demand relationship. Itwas generally believed then and is still believed that development of a method to measure economic values ofoutdoor recreation and outdoor recreation policies should be based on underlying preferences of visitors and theeconomic constraints that govem their choices. Clawson (1959), Knetsch (1963) and later Clawson and Knctsch(I966) were instrumental in further development of travel cost method.
23
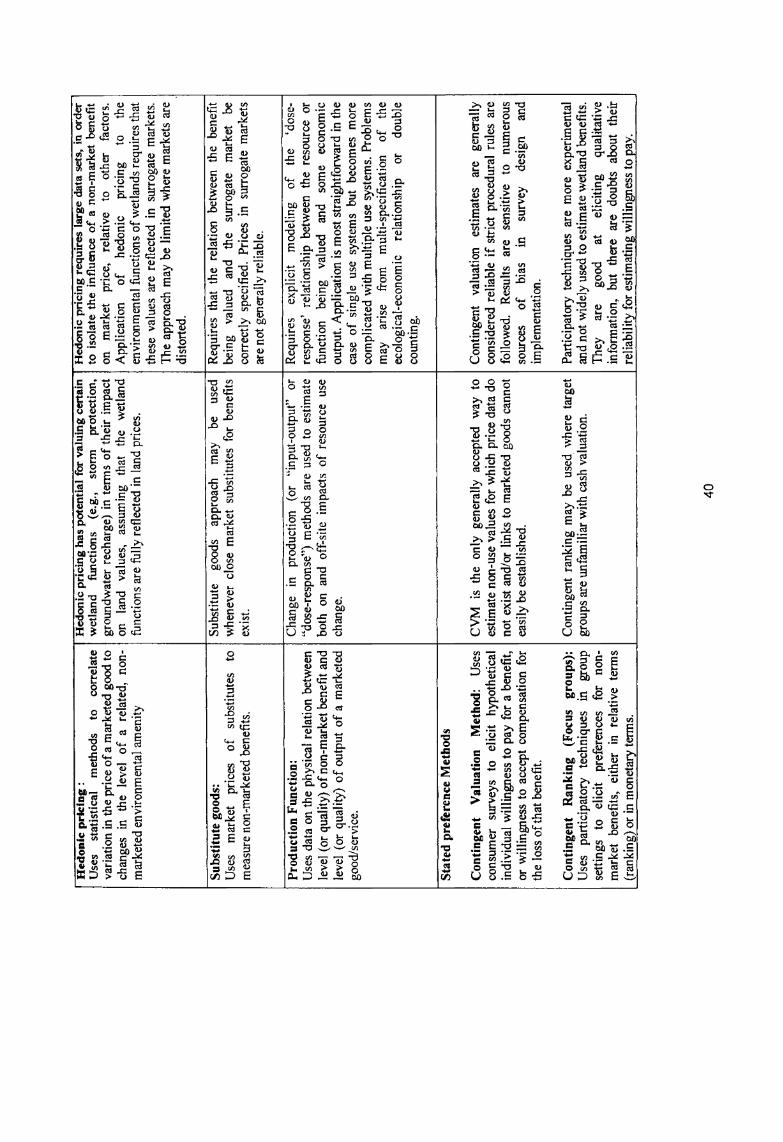
The Hedonic Price Method” (HPM) attempts to evaluate environmental goods
or services by estimating their effects on certain market prices such as property
and land. It is based on the assumption that the prices of marketed goods such
as houses are affected by the numerous characteristics including size, location,
neighbourhood, etc.
[b.] Stated Preference Methods
The stated preference approach avoids conventional markets and searchesstimulated markets (UNEP, 1995). A survey instrument is designed in which a
market like situation is constructed. Respondents record their choices in the light
of the hypothetically changed circumstances and the data are used to calculate
the value of environmental amenities and other goods or services. TheContingent Valuation Methodw (CVM) is the most common form of stated
preference method for valuing non-market goods. lt is a standardized and widely
used survey method to estimate willingness to pay for use, option, existence, and
bequest values (Mitchell and Carson, 1989; Brent, 1995; Fisher, 1996).
'7 Hedonic models are used to capture the relationship between the bundle of environmental characteristics and itsprice. Hedonic models estimate the implicit price of the characteristics of a good. Environmental attributes such astrees, aesthetic views, etc also influence market price of the commodity. By explaining the price of the commoditywith these features using a multiple regression model, it is possible to isolate and value the effects ofenvironmental characteristics on property prices and infer how much money individuals are willing to pay-forcertain environmental attributes. The value of the change in the environment is therefore given by the commodityprice change. However, even when implicit prices for environmental amenities can be estimated, the comectionbetween the implicit prices and value measures is techniailly very complex and sometimes empiricallyunobtainable.
'8 The contingent valuation method began to be used in the early 1960s. Robert Davis (1963, 1964) usedquestionnaires in an attempt to measure the benefits associated with outdoor recreation in Maine. Acton (1973)conducted the first contingent valuation study examining health risks. He estimated willingness-to-pay forimproved ambulance service to heart attack sufferers. Historically, the growth of the contingent valuation methodas a viable altemative for estimating the benefits of public goods was in part fed by funding fiom the United StatesEnvironmental Protection Agency, beginning in the mid 1970s. The method developed through gradualacceptance and use by United States Government Agencies. An important milestone was the acceptance by theUnited States courts of the use of contingent valuation method in natural resource damage assessments under the1980 Comprehensive Environmental Response, Compensation and Liability Act (CERCLA). In July I984, areview panel of experts, including economists and psychologists, actively involved with contingent valuationresearch (NOOA Panel) concluded that although the contingent valuation method held promise, furtherexploration of the technique was necessary (Mitchell and Carson, I989). Through the 1970s and 1980s, contingentvaluation (CV) research progressed steadily.
24
Contingent valuation method tries to obtain information on consumers‘preferences by posing direct questions about willingness to pay. “lt basically asks
people what they are willing to pay for a benefit, andlor what they are willing to
accept by way of compensation to tolerate a cost. This process of "asking" may
be either through a direct questionnaire/survey, or by experimental techniques in
which subjects respond to various stimuli in "laboratory" conditions. What is
sought are personal valuations of the respondent for increases or decreases in
the quantity of some good, contingent upon a hypothetical market” (Munasinghe,
1990). The Contingent valuation method involves constructing a hypothetical
market or referendum scenario in a survey. lt represents the amount people
would be willing to pay to avoid a specifiedenvironmental damage, to achieve a
stated improvement in environmental quality, or to receive a specified supply of a
public good.
Early work attempted to examine the “design bias” effects (Mitchell and Carson
1989). Later, much attention was, in contrast, given to explain large differences
between willingness to pay (WT P) and willingness to accept (WT A)'9 measures
of value (Schulze et al., 1983; Knetsch and Sinden, 1984; Cummings et al.,
1986; Shogren et al., 1994; Goldar and Misra, 2001; Bateman et al., 2002).
Standard economic theory’s prediction is that WTP and WTA should be approximately equal. ln practice, thediscrepancy between an individual’s willingness-to-pay (WTP) and willingness-to-accept (WTA) for the sameamenity, was sometimes four to fifteen times (l-lammack and Brown (1974) Hausman, 1993). This disparity washeavily researched throughout the late 1970s and 1980s and four possible explanations began to emerge: rejectionof the WTA property right, consumer cautiousness, prospect theory and modifications of established economictheory (Mitchell and Carson, 1989). Mansfield (1999), Hanemann (1991), Tversky and Kahneman (I991), Hoehnand Randall (1987), Boyce ct al., (1992) examined various issues behind this variability. Mitchell and Carson(1989), after extensive review of the literature surrounding the WTP-WTA discrepancy, concluded that thisdiscrepancy may be due to a combination of the factors discussed above. Randall (1987) reported that thediscrepancy between WTP and WTA values tended to narrow as respondents repeated the valuation process.Hanemann (1984) argued that this discrepancy was due, in part, to the discrete choice fonnat prevalent in CVMsurveys. Theoretical work by Hanemann (I986) further explored the work of Randall and Stoll (I980) andreported that the size of the WTP-WTA gap depended upon availability of substitutes for the hypothetical publicgood in question, narrowing as the number of available substitutes increased.
19
25
Although the Blue Ribbon Panel (NOAA panel) put forth a set of guidelines2° on
the use of contingent valuation method especially in the case of non-use values
(Carson et al, 1996), the controversy surrounding the method continued(Hausman, 1993; Diamond and Hausman, 1993; Hanemann, 1994; Bateman and
Langford, 1997).
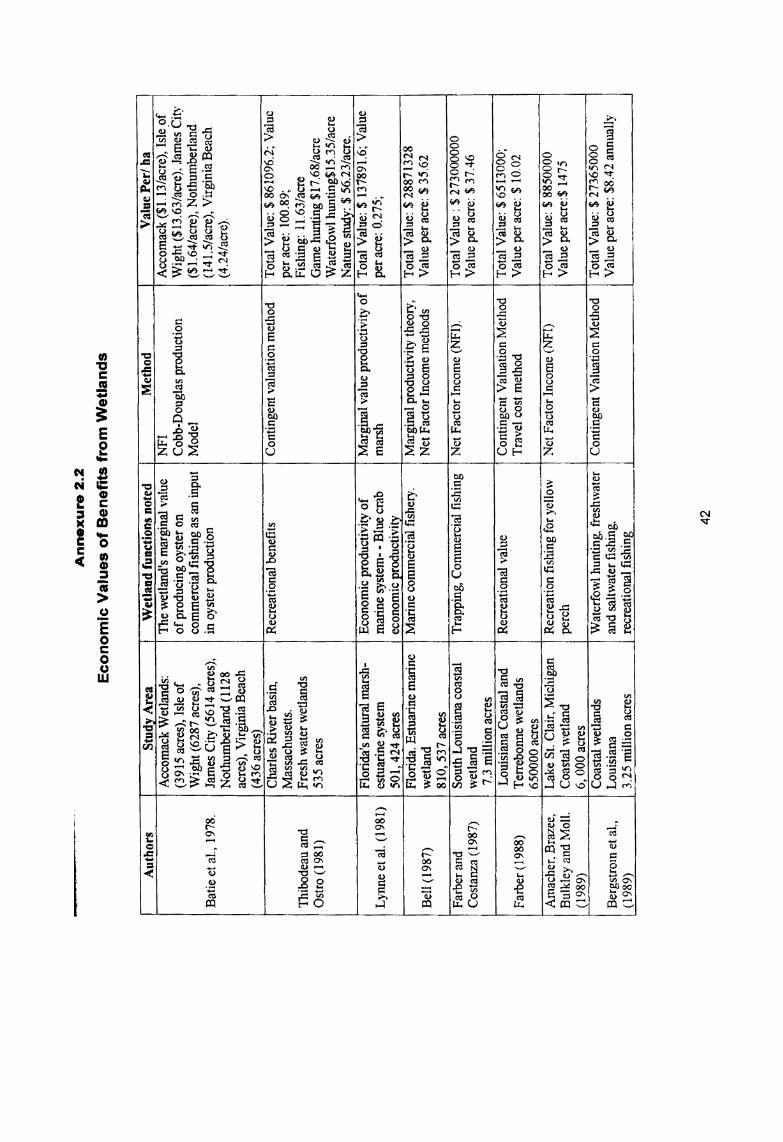
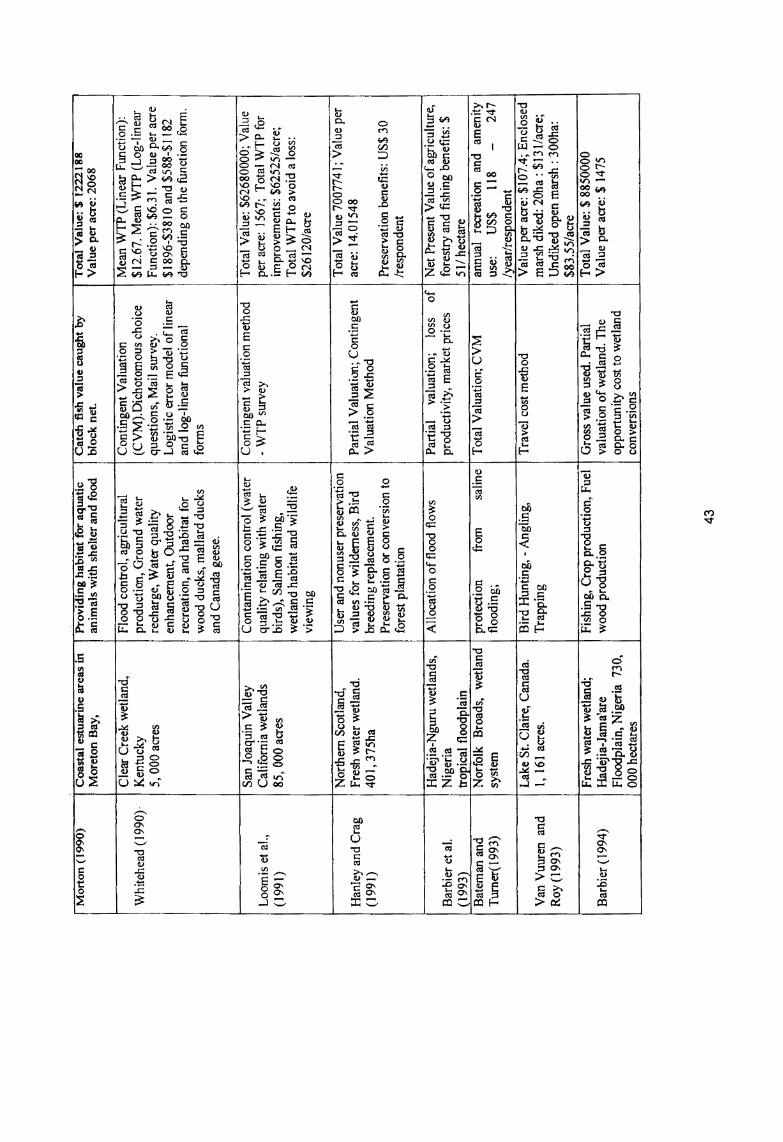
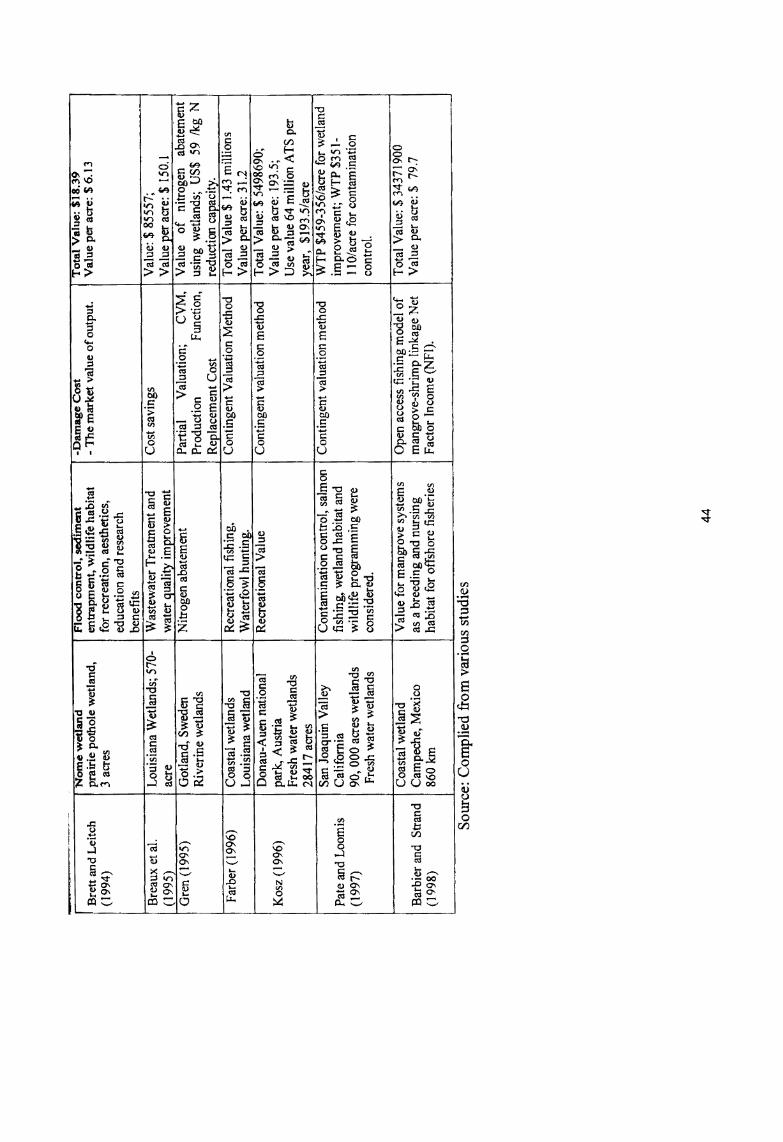
2.2 Wetland Valuation: A Review of Selected Case Studies
During the last two decades, a large number of empirical studies have been
undertaken by individual researchers to value wetlands. These studies can be
broadly divided into impact analysis, partial valuation and total valuationstudies”. Impact analyses studies are relatively few and are undertaken when
quick decisions are to be made. ln cases where an ecosystem study is notwarranted but only certain aspects need be valued, a partial valuation study is
done”. Total valuation studies aim to comprehend the economic values of
various direct and indirect benefits including ecosystem functions and services in
its entity.
3 The principle recommendations were as tbllows: (1.) A dichotomous choice format should be used; (2.) Aminimum response rate from the target sample [70 %] should be achieved; (3.) In-person interviews should beemployed with some role for telephone interviews in the piloting stages; (4.) WT P, not WTA, measures should besought; (5.) After excluding protest bids, a test should be made of whether WTP is sensitive to the level ofenvironmental damage; (6.) CVM results should be calibrated against experimental findings; otherwise a 50percent calibration factor should be applied to CVM results; (7.) Respondents should be reminded of their budgetconstraints; and (8.) Respondents should be given “adequate” information about the enviromnental change inquestion.
1‘ According to Barbier et al (1997), three broad categories of issues are most relevant to the economic analysis ofwetlands. Impact analysis is an assessment of the damage inflicted on the wetland from a specific externalenvironmental impact (Bann, i997; Dixon et a1., 1988). Partial valuation is used in the assessment of two or morealternative wetland use options. Here, choices involving diversion, allocation or conversions of wetland resourcescompare the net benefits generated by each of the wetland uses (Barbier, 1994; Hanley and Craig, I991). The thirdtype of wetland valuation is a T olal valuation of the total economic contribution, or net benefits, to society of thewetland system. lt is most appropriate where a full accounting of the costs and benefits associated with a particularwetland is required (Costanza ct al., 1989; Gren, I995).
n See annexure 2.2 for a summary of studies.
26
2.2.1 Partial Valuation Studies
According to Barbier et al., (1997), partial valuation studies involve assessment
of alternate options of two or more wetland uses. Those studies date back at
least to 1926, when Percy Viosca, Jr., a fisheries biologist, estimated the value of
fishing, trapping and collecting activities from wetlands in Louisiana (Vileisis,
1997). Economists entered the arena of estimating value of wetlands much later
(Boyer and Polasky, 2002). A landmark early valuation study on wetlands was by
Hammack and Brown (1974). They focused on wetlands as waterfowl habitat and
estimated the value in terms of hunting using market valuation. It was only later
on that attempts to value wetlands moved beyond estimates of direct benefits.
Studies estimating only direct benefits have used the market price methods sinoe
they are the easiest to compute, particularly when the commodity already has a
market (de Beer and McDermott, 1989). Majority of these studies opted for net
values - the gross value of a benefit less the costs that must be incurred to
receive that benefit measuring direct use values of wetlands.
Since these partial valuation studies estimated only direct benefits of wetlands
without considering the ecosystem functions that contributed to these values,
they did not generate much meaning. This failure was soon resolved with the
development of theoretical approaches and methods that meaningfullyincorporated the economic significance of various ecological functions into the
process of valuation. Such studies adopted methods like the marginal value
product, residual rent approach, production function approach or present value
generated per unit area approach to value various benefits of wetlands (Far'oer
and Constanza, 1987; Farber 1988; Barbier, et al., 1993; Gren 1995; Acharya
0998)“; Emerton et al., 1998; Seyam et al., 2001; King 2002).
Following these lines, attempts were made to quantify economic values of
various ecological functions of wetlands around the world. Thibodeau and Ostro.
27
(1981) attempted to value five different ecological benefits of the Massachusetts
wetland using replacement cost methods. The value of open space per capita
was calculated using a telephone survey of local appraisal. The value of the
marshes as nutrient sinks was calculated as the associated cost savings at
sewage treatment plants. The difference between the cost for wetlands wells and
the cost of providing water from the next best source was used to value the
supply of water. The value of recreation was estimated by the use of results from
other studies where travel expenditures and consumer surplus had beencalculated.
Bell (1997) used a non-linear bio-economic production function method to place
an economic value on the contribution of wetlands in supporting recreational
fishing in the Florida wetlands. The production function linked the recreational
catch to angler fishing effort and wetlands. Leschine et al., (1997) used the
replacement cost method to produce a proxy for values of the flood protection
sen/ioes of Western Washington wetlands. Cost estimates for engineeredhydrologic enhancements to wetlands that currently provided flood protection
was used to establish proxies for the dollar-per-acre value of the flood protection
these wetlands currently provide. Acharya (2000) also used the production
function approach to capture the value of hydrological services of the Hadejia
Nguru wetland ecosystem in northern Nigeria (i.e. agricultural production and
domestic water demand analysis). However the study itself points out that thesevalues were not an estimate of the total value of the environmental functions
performed by the wetlands nor did they fully capture the value of the recharging
function itself. It also emphasized the importance of integrating such values in
development and conservation policies.
Barbier (2000) used production functions to value wetland’s contributions to local
fishery in South Thailand and Mexico. Static and dynamic approaches were
28
adapted to value ecological functions. This study was different in that afterattempting an economic valuation, it concluded by pointing out the importance of
management regimes and institutional norms in determining long run benefits
generated from the system. Farber (2002) estimated the storm protection and
fishing values from wetland of south Louisiana using a ‘yield function’ that
established a statistical relation between fishery catch, effort, wetlands area and
fishers that reflect the annual marginal value product of wetlands. Recreational
values (hunting and fishing) of wetland preservation from the Barrier Island were
also estimated using survey information collected by Bergstrom et al., (1989).
Although valuation studies in developed countries began with direct benefits
valuation, they subsequently moved to indirect and non-use benefits consideringthem to be of more relevance.
Similar studies were also undertaken in developing countries. Eaton and Sarch,
(1997) conducted a study on the economic value and importance of wildresource production systems in agriculture and fishery of the floodplain ofHadejia-Nguru in northern Nigeria. Emerton et al., (1998) attempted to quantify
the benefits associated with different economic activities, of Nakivubo wetland in
Kampala, Uganda, with the aim of providing information on profits and returns
from reclamations and conversions of wetlands for industrial developments using
market valuation techniques. ln order to value wetlands services, the study used
indirect methods like replacement costs and mitigative expenditure. The study
called for greater internalization of externalities by modern users. Seyam et al.
(2001) attempted valuation of freshwater wetlands in the Zambezi Basin, Kenya
based on market prices. Direct use values of floodplain agriculture, fishproduction, wildlife services and goods, livestock grazing, eco-tourism,biodiversity, natural products and medicine were estimated using different
methodologies. Certain studies also employed various proxy methods to estimate
recreational values (Hanemann et al., 1987; Hodgson and Dixon, 1988; Edwards,
1992; Pendleton, 1995; Desvousges and Waters, 1995; Cesar, 1996; Dixon et
29
al., 1993; Driml, 1999). Studies in developing countries gave more importance to
valuation of direct benefits and the ecosystem functions that contributed to those
benefits. These studies either looked very briefly into or mentioned the role of
institutional norms and sharing mechanisms in determining value generated.
While some ecological economists were engaged in the valuation of various
direct and indirect benefits using ‘market valuation’ and ‘proxy methods’, several
others were involved in estimating direct benefits of wetland services using travel
cost methods” (Leeworthy, 1986; Bergstrom et al., 1990; Markandya, 1992;
Green, 1992;) or contingent valuation method (Titre et al., 1988; Bell, 1989; de
Groot, 1994). van Vuuren and Roy (1993) used the travel cost method toestimate the recreational benefits of bird hunting, angling and trapping in the
wetlands of the Canadian lake St. Claire. Similarly, Navrud and Mungatana
(1994) applied the travel cost and the contingent valuation methods to value the
recreational value of wildlife viewing, which was used as a valid, but very
conservative, estimate of the total economic value of the wildlife species.Estimating expenditure and consumer surplus associated with on-siterecreational uses of this coastal wetland, they pointed out the need for forming
more effective policies for wetland management.
Contingent valuation studies on the other hand concentrated on elicitingeconomic values of various wetland functions that have no market (Costanza and
Farber, 1985). Many studies also applied contingent valuation method to value
the direct benefits of wetlands (Farber and Costanza, 1987; Titre et al., 1988;
Hanley and Craig, 1991; Bergstrom and Stoll 1993). lt is interesting to note that
most of such studies focused on estimating recreational values of wetlands.
23Travel cost models have been used extensively to model recreational demand for other ecosystems such asnational parks (Beal,l998; Lansdell and Gangatharan, 2001; Mendelsohn et al., 1992), national forests (Englin andMendelsohn, 1991; Willis and Garrod, 1991), coral reefs (Dharmaratne, 1999; Dharmaratne and Braithwaite,1998), wildemess (Smith. 1975), improved water quality (Smith et al., 1991) and for recreational activities such asrecreational fishing, angling, railing and canoeing etc. (Amacher et al., 1988; Bell and Leeworthy, 1990; Farberand Costanza, 1987; Whitehead et a1., 2000).
30
Bergstrom et al. (1989) conducted a contingent valuation study to estimate
people's willingness to pay to maintain waterfowl hunting, freshwater andsaltwater fishing, recreational fishing and crabbing in Louisiana coastal wetlands.
Kosz (1996) used the contingent valuation method to estimate Austrians’willingness to pay over 14 years for the ‘Donau-Auen‘ national park as asubstitute to the ecological values provided by wetlands. Farber (1996) used the
contingent valuation method to estimate willingness to pay for recreational fishing
and waterfowl hunting in coastal Louisiana wetland. The main conclusion of
these studies was that economic valuation using contingent valuation methods
could contribute substantially to transparent decision making and environmental
policies. Pate and Loomis (1997) elicited people's willingness to pay to control
wetland contamination and maintain salmon fishing and wetland habitat in San
Joaquin Valley wetlands, California. Pyo et al., (2001) applied contingentvaluation method to estimate non-use values for conserving coastal wetlands of
Youngsan River in Korea. During the survey, respondents were asked for the
maximum amount of additional household taxes which they would be willing to
pay (WT P) monthly for a conservation programme designed to maintain current
levels of conservation quality at coastal areas instead of coastal development.
Studies that apply contingent valuation (CV) techniques using dichotomous
choice models were also popular (Loomis et al., 2000). Zhongmin et al., (2003)
applied the contingent valuation method to elicit consumer willingness-to-pay to
restore the ecosystem services of Ejina wetlands. The study used a payment
card format. The willingness to pay estimated was considerably less than the
estimated cost of restoration of the project. Most of these studies wereconcerned only with valuing the benefits of the wetlands and highlighting the
need to incorporate estimated values in any policy considerations for futuredevelopment of the wetlands.
Many researchers, of late, started using a combination of direct valuation, travel
costs and contingent valuation methods for providing better understanding of
31
economic values of wetlands. They argued that sinoe the benefits provided by
wetlands were very diverse, they could only be captures through a combination
of different methods. Such studies that used simple aggregation to estimate total
economic -value were severely criticized by many. However, for want of better
alternatives, this methodology was also reluctantly accepted by many. Farber
and Costanza (1987) estimated the value of the wetland ecosystems in monetary
terms using both conventional economic methods and biophysical methods
(energy analysis). Indirect methods were used to estimate the value ofcommercial fishing and trapping, recreation and storm protection. They used the
analysis of an earlier study by Lynne et al. (1981) to estimate the value of shrimp
harvest and oyster production for the Louisiana wetlands. The value of storm
protection was calculated by means of a wind damage distance decay function.
The travel cost method was applied to estimate the recreational value of thewetlands. Bateman and Turner (1993) used the contingent valuation method to
estimate willingness to pay for protection from saline flooding from the wetlands
of Norfolk Broads. The study used a combination of direct valuation andcontingent valuation methods. Lee (1998) looked at the productivity values of
coastal wetlands in Korea, including fisheries, habitat functions, waste treatmentservices and aesthetic functions and concluded that economic valuation had an
important role in contributing to well-informed policy decisions.
2.2.2 Total Valuation Studies
Studies attempting total valuation of wetlands assessed the total economiccontribution/net benefits to society (Barbier et al., 1997). Gren (1994) conducted
a total valuation study of the Danube River floodplains to determine the potential
benefits from improved water quality and over all management of the Danube.
The study used ecological-economic models and benefit transfer methods. ln a
highly controversial paper, Costanza et al., (1997) undertook a study on the
current economic value of 17 ecosystem services for 16 biomes, based on over
32
100 existing published studies and a few original calculations. Many of thevaluation techniques used in the studies were based, either directly or indirectly,
on ‘willing ness-to-pay’ estimates. They estimated the value per unit area of each
ecosystem service for different ecosystem types, using either the sum ofconsumer and producer surplus, the net rent (or producer surplus) or gross value
(using price multiplied by quantity produced as a proxy for the economic value of
the service). Majority of the value of services identified were outside the market
system (indirect services). It is to be noted that such studies claiming to estimate
total economic contribution/net benefits to society were relatively few and often
subject to controversy.
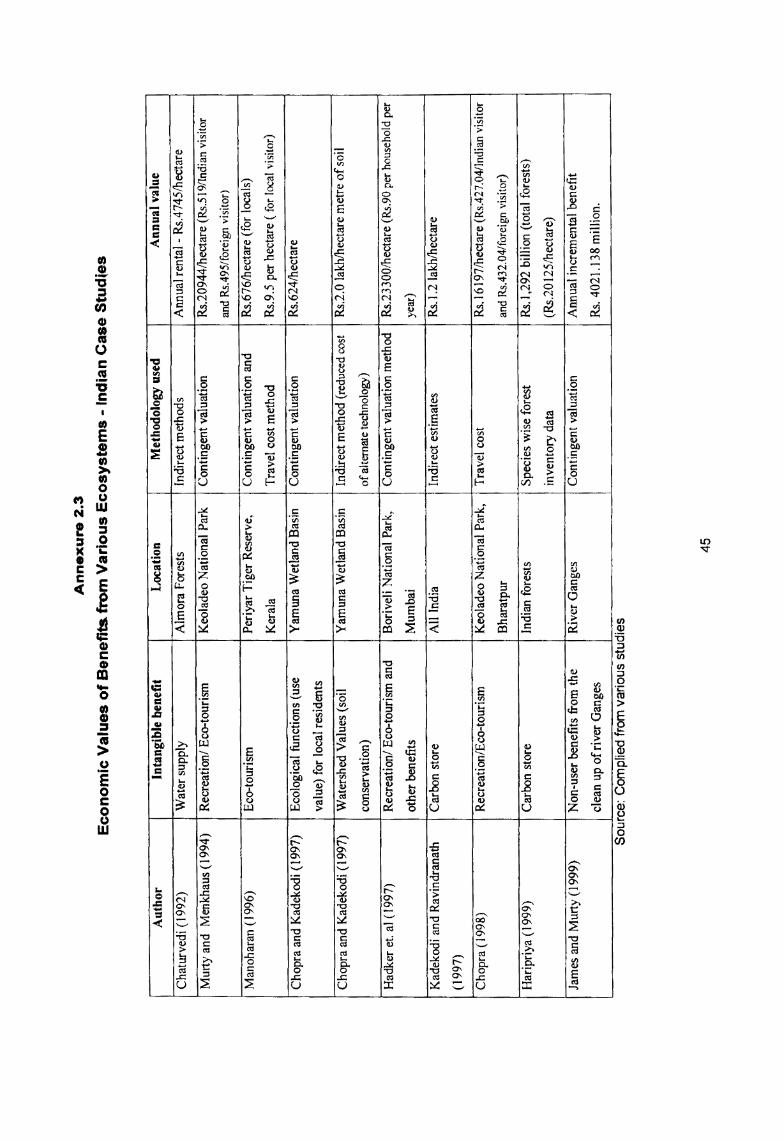
2.2.3 Indian Case Studies: A Brief Review
Systematic studies on the economic values of Indian wetland ecosystems started
way back in early Nineties“. These studies concentrated on identification of
wetlands of national importance, assessment, promotion of research anddevelopment activities and formulation and implementation of Management
Action Plans (MAP). Comprehensive wetland valuation studies in the country
were conducted later on. Very few studies are conducted on the economicsignificance of Indian wetlands. Chopra and Adhikari (1999) used a dynamic
simulation model in a ‘STELLA’ environment to understand linkages between
underlying ecological relationships and economic values emerging from them.
They pointed out that economic values focus on use values in short run, whether
within or outside the market, while ecological values provide an underlying long
run notion of value. Travel cost method” was then used to investigate the nature
2‘ Annexure 2.3 gives a summary of the major wetland studies in India
25 Survey-data collected on tourists travel and stay expenses, duration of stay, and various socio-economiccharacteristics, were used to build a semi-log demand fimction. The study indicated that travel cost was a validproxy variable for price in determining demand for tourism services. Due to the joint product nature of theservices provided by the park, it was considered more appropriate to estimate oonsumer’s surplus from local costestimates.
33
of link between these two types and to estimate the value of Keoladeo National
Park. In another remarkable study, James and Murty (1999) attempted toestimate non-user benefits from the cleaning up activities of river Ganges using
contingent valuation method. Households were asked to reveal their preferences
for three levels of water quality namely that before, during and after the clean up.
An open ended bidding game was used with a variant of a payment card.Respondents were also asked two closed-ended follow up questions. The
payment vehicle chosen was payment to a reputable charitable organization. The
Cobb Douglass form was used for econometric estimation.
Another serious attempt of wetland valuation was undertaken by Verma et al.,
(2001) on Bhoj Wetlands in Madhya Pradesh. Since there were multiplestakeholders, the study did not attempt to calculate a single value for all thebenefits. lnstead it used a combination of valuation techniques together. The
value of benefits accruing to various people whose livelihoods depended upon
wetland (fishermen, boatmen, trapa cultivation and road side vendors) was
estimated using the principle of market valuation. The value of supplying drinking
water to the city and the value of preventive measures that people used to avoid
water borne diseases was also estimated. The contingent valuation method was
used to estimate the willingness-to-pay for enjoying better recreational facilities
from Bhoj Wetland. In addition to this the effect of the presence of the wetland on
the value of properly prices was also estimated using hedonic pricing method.
This study did not attempt to add up individual values to arrive at annual Total
Economic Value (T EV) estimates as there could be possibility of overlapping of
wetland values. lnstead it only estimated various use values generated bystakeholder to reflect the economic importance of the Bhoj Wetland. Kumar
(2001) attempted an economic valuation of the ecological functions of wetland
along the Yamuna River corridors of Delhi. Four ecological benefits (hydrological
functions, biological productivity, nutrient storage and habitat for flora and fauna)
of the wetland were valued using a range of valuation techniques. The value of
34
hydrological functions (\Nater recharge benefit for agriculture and water supply to
households), livestock fodder and nutrient benefits were valued usingreplacement cost method. Fishery production and thatching grass production
were valued using the market price approach. Nutrient storage function was
valued using cost of procurement method and the habitat for biodiversityfunctions and recreational benefits were valued using the contingent valuation
method. Parikh and Datye (2003) used a multidisciplinary approach to address
the subject of wetland management. Based on a collection of multidisciplinary
wetland valuation studies, they argued that estimating economic benefits and
values must incorporate traditional knowledge of local users. In other words, the
institutional contexts are important in valuation exercises.
There have also been a few attempts to elicit values of wetlands in Kerala. Nayak
et al., (2000) attempted to look into the present mode of resource use and the
biophysical changes taking place in north Kerala. They reviewed major resource
use systems and subsistence patterns in the study area and also assessed the
ecological status of the resource base as perceived by the local community. This
study did not however, attempt an economic valuation. The first systematicattempt” to look at the various issues surrounding wetland resource use and the
causes for wetland biodiversity degradation in the Cochin estuary wasundertaken by Thomson (20023; 2002"). The study identified the major benefits
provided by the Cochin backwaters and the different stakeholders who had
appropriated the wetland resources over the year. The major causes for the
degradation of the backwaters were analyzed in detail. It also estimated the
value direct benefits provided by the backwaters. Santhakumar (2000) attempted
2° Manoharan (1996) undertook a contingent valuation and travel oost study in the Periyar Tiger Reserves to estimateits eootourism values. He estimated its value as Rs.676 per hectare for locals and Rs.9.5 per hectare for visitorsfrom Kerala. Similarly, Jyothis (2001) draws from the preference elicitation of the people living in and around thePeriyar Tiger Reserve in the Western Ghat Regions of Kerala State, using a contingent evaluation questionnaire tomeasure peoplc’s participation in the management of a protected area for biodiversity conservation. These studiesdo not pertain to wetlands; however, they are the first attempts in using the contingent valuation methodology inKama
35
valuation of the coastal wetlands in Cochin and Bangladesh, focusing on use
values arising from the four major functions of the coastal wetlands namely input
to fish production, recreation, protection of coastal land and carbon sequestration
using surrogate market prices and indirect methods such as the estimate of
avoidance cost, cost of substitutes etc. Jeena (2001) analyzed the economic and
institutional factors in the use and management of the Cochin wetlands,concentrating on the fishery sector particularly. Thomson (2003) undertook a
detailed study of the Cochin estuary in which the direct, indirect and non-use
benefits provided by the estuary were estimated. The study used market-based
techniques to estimate the direct benefits from the estuary, the travel costmethod to estimate recreational values of wetlands and the contingent valuation
method to estimate indirect and non-use benefits provided by the estuary. This
study however estimated gross vales and not net values.
A variety of valuation techniques have been reviewed above and some clear
patterns emerged. Most studies on temperate wetlands recognized recreation as
an important wetland use and applied either travel cost or contingent valuation
methods to obtain a measure for its value. ln contrast, tropical studies are more
concerned with the economic significance of these ecosystems on the livelihood
activities of local communities. An interesting issue concerns whether economic
valuation ensures prudent uses of these resources among different users and
across generations. The theory of economic valuation outlined in the survey of
studies does not claim this at all. In fact, right set of institutions and efficient
modes of governance are pre-conditions to achieve sustainable uses ofresources. The message conveyed in the survey, however, is that valuation
studies throw enough light into the manner in which resource specificities anduses are inter-related and are unavoidable if serious interventions have to be
made to enhance economic values.
36
2.3 Scope and Limitations
So far, the study explained various methodological approaches developed and
used by various analysts to estimate economic value of wetlands. Most of the
earlier studies on economic valuation however, emphasized the fact thatestimating economic values of wetlands is essential and the framework of total
economic value is probably the first step towards this direction as it captures
preferences of present and future generations and guide rational choices of
resource uses across generations. At the same time there are major drawbacks
in the ways of deducing value. For instance, it is often contested whether market
prices do reflect the full social costs of production. Second, most services of
wetlands are not presently traded in the market raising challenges for valuation.
Much more serious is the neglect of institutional contexts on which thepreferences and choices are determined. The role of institutional dynamics on
allocations and inter-temporal choices is crucial in the production of values. A
much more serious issue concerns the logic and assumptions involved in the
additive principle of total economic values. Most often the principle of simple
addition adopted for arriving social value is challenged for lack of sensitivity to
social differentiation among resource users and the weight they attribute to
various outcomes. Standardizing the weights especially in the process ofdeciding preferences and choices of people differentiated on the basis ofclasslcaste/ethnicity may cause serious errors. However, these limitations are
definitely not arguments for rejecting the use of total economic value framework
for eliciting economic values of wetland useslbenefits. ln fact total economic
value provide one of the most accepted starting points to account for the overall
benefits of these ecosystems to humanity.
37
2.4 Summary and Conclusion
The objective of this chapter was to survey the available literature on wetland
valuation. The study started out by a review of valuation theories and thenexamined the major findings of some selected case studies on wetland valuation
both from developed and developing countries. The survey reviewed a variety of
methodologies and techniques available for valuing wetlands. Differentmethodologies are useful for different types of environmental amenities orsituations. Valuation methodologies useful in all environmental contexts do not
exist. The commonly accepted procedure to estimate the total economic value ofwetlands is to select one or more valuation methods as the situation warrants.
The measurement of the value of various goods and services varies substantially
depending on geographical location, ecosystem specificities, flow of benefits,
resource appropriation mechanisms of different resource users, their perceptions
on economic values and the methods of valuation. In many cases, economic
analysis is made on the basis of limited insight into local level perspectives and
highly aggregated data.
Studies on wetland valuation rely on market values wherever markets areavailable for calculating net or gross values. Interestingly enough, such studies
do not analyse the ecological base of the benefits and non use values provided
by wetlands or the institutional contexts of various resource user groups.Contingent valuations and other supplementary tools are useful under suchcircumstances. The basis for economic valuation of wetlands is set under these
principles. The next chapters analyze these details and subsequently undertakevaluation of benefits derived from Cochin wetlands.
38
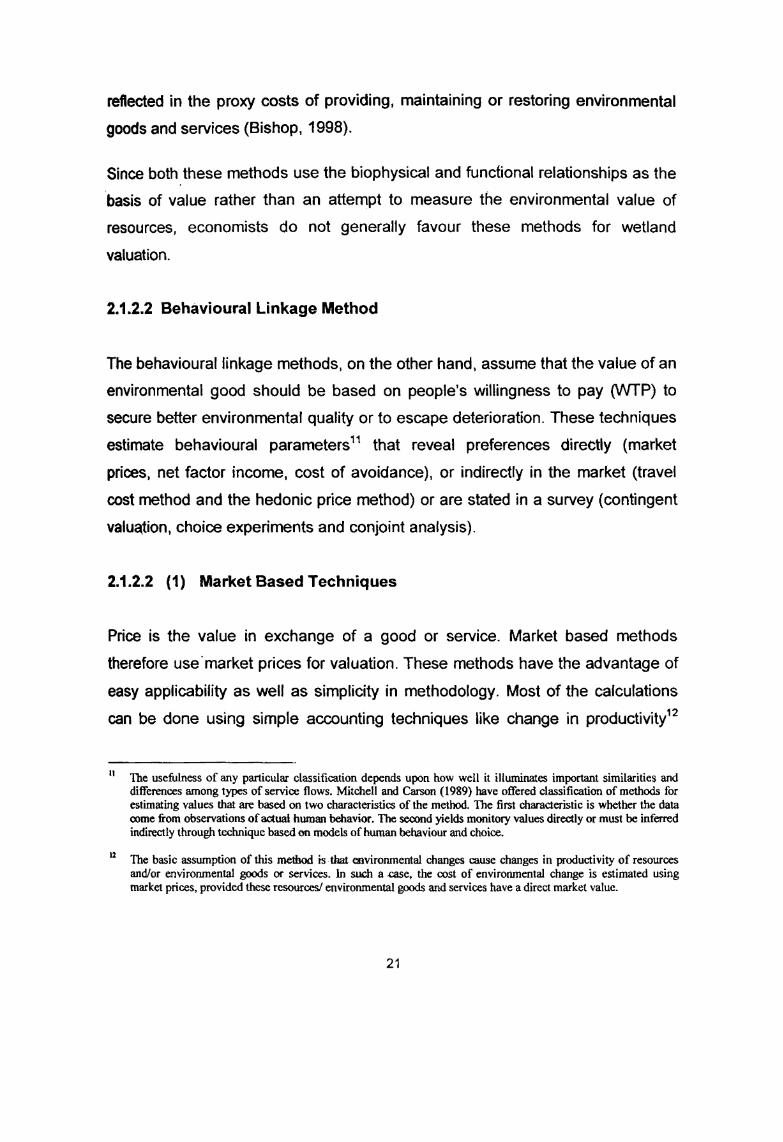
j ha E5003 8 B2 $5 m8g__mO $8 _U>_w__'___ %Q“Eb 2w£_m _w E Gagoa MOEQUBO m:oE>83560 mEh_O_O>%2__Om E %_§$_$ _MUEO_5 8 EEDOE86% ha OH mmUCmE_:3 gbwetg OH Em: B 2302 _8E§OU EQo_g% E mgm _gO€U__8__'8 83> O5 868:8 8 Bg b0_V_>>3 _uO§____d>0 “gm N got E“ 9 w£_O>_g VN 30% 25:0 gs bmgtonao F328 080%E fig Acotgoeasg ghfl $3 H8080% Co 5% Sta $5 38D _g_“______ ‘E “§:____§_ £__m°__h_mM;j dame 2: 023:0 8 ___2w2 at E %j 825% m_§>O__Q Eng mg%gxO__&_w 335 E8 jM mCOmH__aO tag gs 8 OUEC2 2: W2 8:65 Wmg Jmmxfl HO: 8% 8% Qghm U3Q=O__ =2?f AOm_< 5% 8 2n___Ew _%O£UE 8g%_w 2088 REQE8 5:3 “fig mm EOE§:g__ 8% 2;gag”; ‘B ggza gm %8m _§_EE M[%_8U_Eu Mo M0___W> 8g__ao%;8 gm: bgosvokntL _8____om2 j2“ ‘ho g_§ §_aE U5 62% sgggmmm 8538 Q5 wE§>§_ B @5083M us “WOO 2? "__U__O_____:__ 25¢ __“_____8”_j goo__ __EoE%_w E2558 Q Em; $803 cogaacooO5 gs 82:32 Uouoém O6 5:3 o_nm2_&m& g 8505 mg fiowdeuwo 2 “£285853 E 098:0 U5 “O 23> gem 05 ECO93 8 go? mmUPEOWPH at m__m_m“E_w___ _6 mgbgfi E 8%; MoH80 §§___On_n_O 05 figs __O 202200 wgém§§m_mn_g §__:5 m_E§O_$ Eé mEO__B woW Qw__a___O m§_w_8__8 ho“ U528 mm %8__&_w wmfi_g_§ E395 05 “Ow 8 %E_6Omm_u E8 jUOEQ OEMH £08 8“ B§3_8 mm A50001 Owgfi _sCDE__OHm>GO 2: _vo_bh_ 2% %2: $3 __2§6O__u E Owgfi MO gig H_3__< E5 __£ 3_“__2_M_U g_____> ___gQ__é_|"_i >__? 68%§_;E gE§_E8 “gag 8 bgfiaoagfl%_§‘m_%_w B _U__6___m_ 823 “£85 £385Egg ho 8&8 E E6 gomtgmzv HOVENE :W 83? OW: HUPEQ “Q U_£8m_&<_§EE Q5 gag figw O3flE__mGOQ M MO _GOm§_6O_a 05 CO Qmgfi _SCO__EHO__m>GO ‘*0Spa” U5 W85, “__Ug___:< __23____O__fl_ %5 3p___m_ 8 _£>_g__€__H_ E &___“__Uémbfiwg OWEOCO8 Eas mg 825 gag 5:3 UO_6Em:OO B 8 E2“GE GO mfibfl 6&0 fig mcO€E> _2_Om8mW825 “age 8 mcOEoE_v ~§_OQ Ofia 8% %__58g 2 “CUEHm______UN 88 5% Hg _w§_2%a H0E_§_8 6&2 A ~€$_OA “Bin \§_aE!__§H&5§_OO 820025M __O\_E_w 88233 gweummv OH spa E D822_A__@E__O'*E 8 _A_t_a 08 F_O___3 m8____UO__fi_ _u§_H9$O_ _§_&_W %_COEEOO m_ __Om§__§ _V8B_8tL_w_§toE_U SSOQ 0:95_~O\U§ msmaga Egqfigg ___O€E>7? _gom8w HO“ 358% 8 _\gm8OUc "_w_ 8Hm:__g _mbEa__8 gm mbO%2fi___ Us w%?_a E2“ 8% O5 "§_m___H _3_'_’§_ _i _3w_$__=__“§> E; Hw_wh__m _ I 1A % Y \__w_W_n___m___AA“'___“__%ém_\"é =__;m_°A”_1 ‘M _§__°E ___°_~g__“> _&w_:_“_$; m_______; he o_v°£°____ ‘N °____xg__<28 0?; &§>_w 220 cggg O68 W
Ow_§ 2 8gwE__§ mcgatg H8 bm%__fi_Qm_0__fig“ 50% “B58 2“ 805 an “=Om§E__O'*Egm§W__m_& wc_§_M_ 3 wgm mg _GF_\_mH__"_UE5 _V5_§$ DEEMED 8 was _A_U_u§ “Os EaEggbga 208 Us gpgfigu _A__OH_a§t£_GOuficQEU_QEmfig cmmmg 55¢ 5 85 Mo 82:8g20E2_ 8 O>Em__®m Mg mH_a3_ _83O__£mg 8:: _8_68Oa SEW Mm O_%m_2 882200>__p_U__Um 26 §__wEm_mM_ gggg EQwEEOO_g_H§__w> £8 E? §___gM__5 OH wggwEma 22? 8% B Q8 wEV___a__ HEwEHCOO_8%m_%H8 B bwws6&8 wugw Bgge 8 mV_£_ __O\_VEw E5 *2O_U 3% DOE ___Q____3 “Om mas? Ow_z§_ 085:8OH $3 UOHQUOOM %__§v_‘_0w 35 O6 mm E0dag EHQCOE E 6 @__v_F_g2&2 O>mH_w_U__ E $66 “wH@O___Dn_ “gagfig he m85__&0_a H_O__Q 2 mwagmQghw 5 mgggfig bogxgta 85%____a m__2_E w__§__§ ___&___H____OEgg “EH ‘HO m__wO_ Q5'6“ ___O%gaEOO E88 8 §&E___3 __O“egg N “OM QQ 8 m8__w£__§ _@S2>=UE_8m§_§5_ 86:0 2 ggam $6380ma: “_UOF=O_>_ __£__w___fl> EQNEEOUm_v°__:_>_ Q_O¢Q__a_O__%_‘_‘____0:am@5500QEZOU __O QEm_8€_2 OmEOCOU®___@Ummo_OUO0% MO GOm8UEUUQm|EgE Epc OWEN $5WEUBQE degww 85 2%__E_ SE _§8:QEOOEOE $Eo8n_ =5 magma Mg U_wEm __o 38O5 E E_§__Ot___w__Em “OE m_ ___O:@U=QQ< _§§O26208 QEOW E8 Egg NEE COWHUCQ8 8533 OE E023 aE§%_2 “%fl_OQ$__90? 2: MO wE_%OE Hszgfi mg_&3__0wq_EO25 850mg (*0 wsaam 2mw'tO Ea CO £8BQEHWO OH 8; mg $0505 A%mgam2_UmO?8 :§&DO|H__aC_ av cO€_62n_ E Owcgo_____8$$m\UOOw8§_aE G Mo 3&8 MO §_§ he _O>U__ Ea Egg $V___fiE|coC ‘*0 Ab__m_& av _O>U_H _‘_8§B C0222 __WU_m_£Q 2: co 9% $5W "_§3___£ ____Wt__ 8;gfizg \A__E2_Qw BC 0%aging 3&9? 5 82.5 _8£UU% %8tOOB HOVEE §ww9__5m O5 fig _ug__~> wfigEgg U6 E923 gmfig OE 85 M2570“évsmE2§_ he maacmgm H8___5E 320 6>2_£_38w___ B $8 ___UfiO__nE_w mgow 3__EB__m_| r _| I‘ 1 ‘_mE2_B BH8_sEéO__ gage8 wgsfimgm L6 823 QENE mg:_ gig“ 3_£§___m_I|‘ 11111‘ “ ‘1 r‘ J“ “'1_W___8to%2“ SOVEWE 223 _§mEm_ B >2: £gOa% 2;Qfibwe gwmogfi E 88%“: pa mgig 32:85 mggflh m_vg_§$ U6 m_HOm8fi_e _86E_’_O_§5at 8 wig OEO8___ MO :O€UmaQ<_28O& B50 8 Q>€_2 “DOEQ H385 coE289 fivfieéoc Q Mo gfiacg 2: OEOE 9H_o_v___° E £3 5% oAwA_a__Amo__m___uAo__ miotm om___£Vo__~‘ J_|_ 68% EE 5 Uggca DE an gowéé2%»; 2: E5 mégmg _mg_§ _U_a_ g1 sag :05 ‘B gag E Ewhggh aggngoa%’__o:U8oa Egg rmdv Mgmuoé wan”;W Gmdtoo N539’ 8% _§__o§_ Wm: m__$m__n_\2__°_vm_mb_GU§ E5 ECOh>fi _§eEE4 ég “_§_w_2 N LO _O>U_ 2“ 3 gwgfi8 U8“ _V28_HE Q Mo 8m__n_ O5 E cogtg8m_o_c8 8 80505 __§H£8m WQWD\ A [I _ u “mafia °_‘°fiQl
Q$2 ____W 3 _%__Nm __§ E88 Qm___ E0: _x____fl____8 Hggow_§wo_o8 S was gag: 2 @0508 WEF_w5Emm%mo:o0 £30 momuwmmlgl£3 $w8_F_: @382 8 E8 80 mm_wEO5AESCO g S26 85685 __§@EQ wagB5288 mm 226; 2: 06 OO§_EO_t& 2;ggmfi wE§Oo_aa_§_U fig 8 mége buggy 3 83$EBQA88 33> 8 wE_%OE __§wo_O8was 2508 “mi "_hm__;__:_< _a_§_H__m“O5OE :OEwD_Q> “mg‘Em go 22 Q8 m__O_§E: 8538 __o QED_wE2O>n£__o;2 Owfigg 065$ _AEU:n_E_ £023 _m2_O8a%UQQHBIHWOO £3) CQMEQEOU he HEM“:m O8 $80 Owflag 08850 8 $6508 figéha W_g_§ Mo 2388 Q mg wgfiezmu QwfiegEu __O€E__m£ O5 8 3:3 __gOa%mi: A206 _3_Vm__>_w 389 &_______a$3 8 §__w__m__€ MO m2_wE$mU goggm8 Q2 $8 mE2§_ “O mmO_ MO C2EO>Q_aE H=OEHmU>E Mo “E059 OE wCE8fiE__W__zd_%%>_WMg gugg MO aO§%E __§wEn_ 38 E ha 8m8__wE__§ Bfimga “NE g_%cOn_mON_ dggé___wEmm__O O5 MO D85 885 Hg 8 EUEUO_w_n_Q__Mo &$2_£ 3: $5 paws 8 H_:OE_QH____UE%__O%U:&_w 8__wE WCOEUCOO EBQQOUO m_6m>2fi_w_EO_§ “O b_8____n€ Ea mega mgsmgeamafia bejmcg ho HOUSUOHQ _gg_Ba mm22$ E %_EMUE=wm_m @5269 8_NE:mO__%____ ENE_mE2_B E§2U__283 8 380 EOE 8 _§m%__Q an 0303H2“ 052036 x DEE} Mo $3 go _%o5oE550 SE“ 036:8 $2 _U2%__m___8 %__§5D_o>_m5Em'o2d°m2 96 8%%mmo_ 52“ Wo:ow°an_<_m2wo_O______U8 gwfisaEm; mE2§_ 85 UOEUE wégés E _agD_w_uo£UE fig aa 5; Eggé &g_%m§_~E_§ ha Bfimga HOG pa 8% __§wO_O85:; &_'__2_OD as H8_%5 mEHfiEmHwD E __%mD_2Om§5“_ _S5E__em>5§_8Eg wgig E _eOg %__€_§Ofi_25 hows Q mm OE: wé8__8 E8 wgumgcg22? W623 DO__8mmB:m w£§__§O E E05_E2_B wag; '8 25 ‘Ag 2:? 8 ggs5? gg B $5 8___8O._&_W _3mg|“mO'uIndégg_s__6E___O_:>GQ Mo :OE€2wO_U 8 %g_%w__:E>2fi_ MO $80 EH 88 %__wOa%mi: "an: 9____=____2_: g_=_9$__A__82>_§ “O muoow _SEEcOb>8he mgacmgw _2OEtHw MO “WOO mg:E52: “EH “A206 :8 H__QEUQ_w_H_Q¢__w8Ea,6 goow ESQHOUO mE_8__§ Mo was 3%8508 25‘ “Agog as __O:_“__83”_.m“OOm _§8EE'CO£O __OE€OaE SO92 E 2_Owp_O’w 8mg? mg: @0508mg “Go: :8 §_____‘________v 8g_v____mQ2>sm Ea 260%“_Ug_63 Ogaa __O\_UEw Eggs 280m8 =83 $5306 we gs OE 8 8% 85_ ii _5 _5 “n°__O__8_=E< _:m_£'~m°U1|
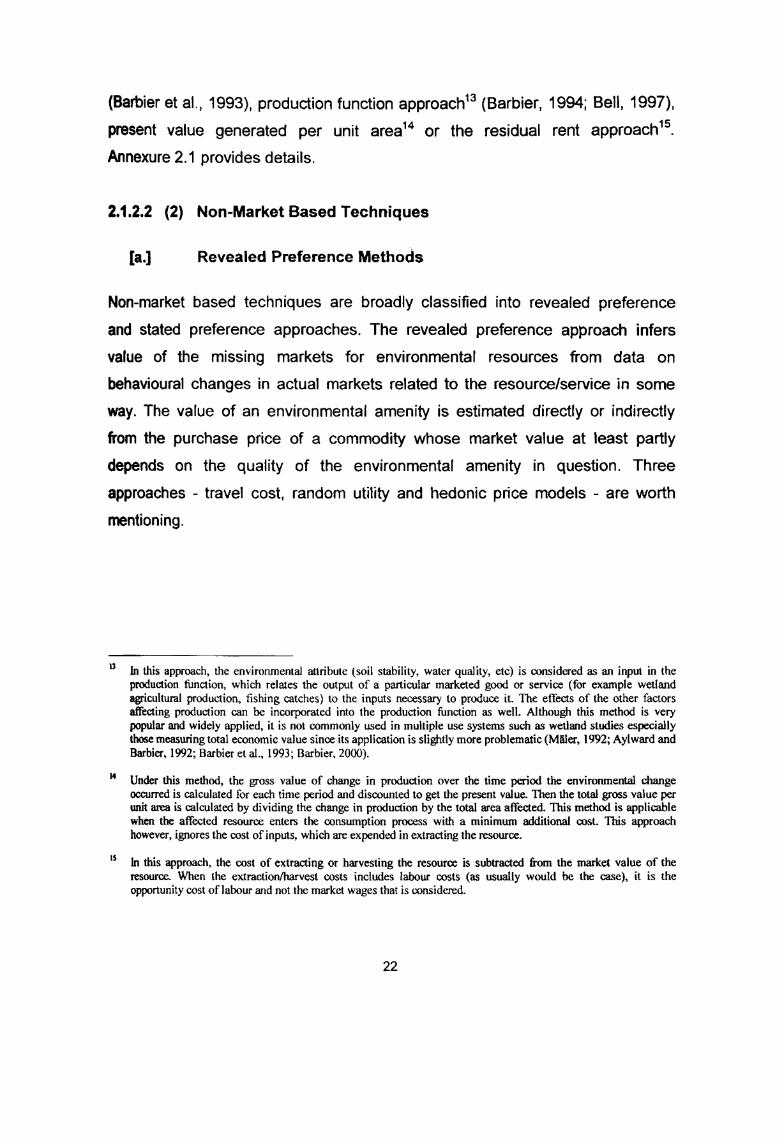
_ oooooog w H fig E3 Ezv 2:85 _o_o£ “Oz WEE __w_O_g_EoU _mE&§ _§mm£%gm&=oQ gem E seamNVT A‘ A M lg’ fi l wGEmWM_go:m0_wmH ii \Wm%A=o:_E an go: W7 égia saw H20“ ha o_%> t _ “magma howwafim Ea % gamgoq % fl__m Ho =_obmm$m_1 E I Ooomomhsm Ho___m> _A_w_Wmr 8502 mwm@_m> Haomgcoo M §m>EmME “madam: _____6tU_§> _ gag; E800 %_ 82 Q86 W gs _W pg “Hag Ha gig W W £06“ H wags HSMNOU i :02 fig sggmoooomwm m Ho3@> _So_H_ H AEZV oEoU__:o_o_wh:oz >6__9h he magma cogouoom 7 ENNEOME £20 ‘Hm 0&3 dggm gF_OmE< W{“ (‘I 1 % L ii! ||‘|“|||: ‘ ‘H _l %H‘ _‘ ‘ _T\_ “ |“q‘\ H1 mag C088 H82 w E8 SQ g__w> 7 8608 G8 _§_EL I j mugga OE_oDQbg 8:: “BE i682 8 W 6=H> Est U262 =2_§__W> EUwEEOU 7 O2? __§HOE3_60m fig Emgu _w§E__3M!‘ ‘ ‘ I 1‘ 111\ ‘HI, ‘ J‘ ‘ E ‘ \ IV‘ UH \\ __\1I] I illli‘ I ‘ ‘ III! I Aj meow cage ms Noi: w “EUR” SQ 38> M _Qg_§$ A503 §__§8 _7% H $8“ 5 gm _$6“ W “Dug Hog g__w> 7 $0608 @585 sgwmaz _ % E255 j gm: :8 *j wNm:wwN W Hg_d> EOE j éo£W§>:O:_uoa__N5wE2 w éogg EWEEEOO “flaw; A o=EE:o_EmBmm _%toE _ Ii AV‘HM % % I 2 A bgugokmaogooo W meg fig “Sm j“W26 neg ha _ SEE SEQ ga ' _EOHm%m age _ Egg“ Ogamo cg: ___w 3 BE:g_HW> 6 _&\_m_ E HOE_N> E8‘ Mo _£gO%oa DEW» _gm§ “M “O b_>W&__Uoa UMEOGAWMA lag: E32 ‘w_%.___oE W“M __wU_W\mN_©m wH_?d‘m U382 H: % 1 % \ 1 j_ 8U_w\mm_m;m_65E _3o’t2mB L L8O§G_:% mg: 256 % 886 an Ea: go AObgs: “wig $826; 36$ agm _ fig EWQ_UO£F_l jawde “EON Pa j g82_U8g2 7M g3’ ”N_gOHg W H02N> EHOP W @0506 gggg _6w___:__OU wagg _§_O%28m W “Ems 82¢ 3:20T % A A602 £3j cosm “Egg éaum 7_Ao6m\g_3 1 M2 C g_§_E:£oz ‘fiwom g_@> Aaoggzv f Goflogoa sag E A88“ E03 D6 scam 7 _Mw$_ ___w 3 0:5£ 228385602 A2Q_$©'_@ M082 _ 5&5 g Q mafia EEUEE8 _ A88“ gs Em“; &N ‘£0 $82 Aossmogfi Em; gfigoa $_m__oQ_pDoU & so Ego wgogoa Mo 7 av OE A88“ 23 _Hoax A0882 __@ @8002 “V ‘Z % EZN o___§ HGEE pU§_#%o$Wifi M H%@_§ ¥o_@oo< > A A% % E mwfi U____; _=__%2 %%__3_____m____m_NMAeA_v@_mg KW y~£<Ah__%__Hm L §__;< AW°___N=0>> E0: WH_:@CQm *0 Q03_fi> OMEOCOOMN_N O_=__xOc___<
Q“MCOEPEOON U§_§> OH “MOO bm__5tOQQOms: m “SUN ha 23> M 2; _UE_w_“_03 Mo GOEwD_N>883% m §___w> _8OF _g__£ 60% 33> $06_O_£ 5030305 Q96 “w______m_n___ “moaugc oooop 2gZ“E%_UOo_"_m_u§_$; HOE; swam_ __§_6Oa “V00; j 2% ____w____w_EV_E A$3 gramW w “£389 magma fig bumaeW dg__3m&£o g_M> EgO_£ 32 Q6 $2 EOm83N> Egg gag 30¢ Q6 __o:8O__< _ Fmugfia :_5wz__£V_Ufl_|__gfiqg MHgoom H swag 5% _u8EU=D 1meg: 3 H gm 68% £88_U%O_2_m “Q8; “BUM 2 g_fl> _ 8:38 as _0>W__‘_‘7 wing W? fig“ $_ __ figH “mgwé _ “wigs: Em _§§U gs gm 83Ag: gm5_5:> _8>HcUU=oQ_“flok\8g\AA_wZN I MW: $3 5m___255$ Em CO_H__$__UO__ Egg ?_MwE_VOOcEU“?2>OM=o%=_m>_mHoP Qczwm 1 got gommoga \E_m_H0BA\A“M€o5 V__ot°&z: %AMQQVBEFEa AgegnmU502 \_ W N W$25 H_8__aE éE_o%oa£20600: _8aO__pBhowm ZAg:__m H0 EfimmH5_Eon$2\ __2§§_Q $08“Om $3 Hmegg c§§§6_£ 8 __2_m$>=8 ho __g§__O$E_UO__§>_ COmHM:_M> _H5E8_N_%__ wévgfi j Ema “sqb wv2O_: Hag W EOwEEOU mg__g__~> _§__§ W Em “m$E%_§ 6'“ gag _ __v§_§$ $3; fi_m2h_ msuigfl @_§_|__w:%mmA%E%oz:8:J but 03$?“ _ gs? g_m> _8oF % M % A Ggwtomoa homgcoc UCWWDMD_§Q\oN_©Nw 35>“$2 Q E02“ 8 LP; E8‘ H M £__U_m_$ Ed 532 B23;MOhU_~\mNmN®m HmEOEgefi__E j _m__Eé =oE__wm A_m__:5ha 6;; _§orr "$2 neg ha xggm “:3 ' $83 fig @550“ bzgdT Hg_w> _‘8o\%4 to £38 co ____'N>l€0m___:COU C8 COWHNEmag O8 figm_ug_33 £E§__NUEg §%_ gm:8:“__m Ho £803_ M 38% MUNCQU E82:0“ M mv_U% E_w___wE fimv_g_u @003_E‘_O'* CO_§____“_ 2: CO wH__U5h_% W _g_O_§é 82____wo_ Ea he §5g_ fig ;_O%2U2N2 5&5 Ea o_g_§_% m H_§_EO EDGE SE HEm_wO]_ W 60230 €OE8§_EUL fig Ea UD_M> __m.£ “€O€_=E _\8>§m :22 _m__o:mgU W £3 B83 $202_ _ _ Qmeg O8 HaUE__w3:§ QQESN; 8mo£gDoE8o£o5_A2>UV E; ucsoaggnoa gag”! 8%: EggW Acotogt Eogdmpa CS2 inn‘ cgg_w>EomEHGoU in fimM@Dom&n“_obflmflAgO_&v%bj flgmzog vmfio H86 “H;_ _ _jM68 U8“ Ba 33> Hf Ag 3005 _ 8°“ vs“ _§_0F_m FE; W382“ U ‘gm C8202T % ww_NNN_ M "g_“> EOE ;_£ H558 ofiag ___mm:@flU > fig“ h°M§m£m£wgoE% W 5 $05 ofigm _“HmR~ ; \ 6%: coral _
A AEZV 0685 __8om“_ W 812$ gage 8% HEB“: M E O3 _ gag A3‘mguam mDOC§ gob gieoo H0O§Om‘II “ |“‘HI__ ‘ ' “‘ “"U‘\ ‘ ‘ll lq‘J‘|ll \|“ :Wn“\V‘kl\ \!\|| ‘ ll MP’ |‘!|:_ I ||iI__ Vfig Q “EON 2 83> 62 Owgé Q__E_Em'O>O__w____wE _ wfiga fig @5895 Q 3 0252 _g8n_E_w0 ggw Ea Eemwm __ 82 “mg w “02M> E8‘ “O E68 wczé $003 5&0 fl mggmbm gewgfi he g__w> _ WWHMAFHNW’ Emgu __[| é A “w;\\| é\A|V Am.‘ I yli Ni- A IV I 4 >"A __o§_8 __§O2m_6U ggga Ba; fl_m2h_ M_ COEEEECOU __£ O_§w\o: 29$ wfieeemea &:_v=>> _ %§_$$ 880 80 do Ago: AA Law “H3 €QEo>2n_Em W Em E52 _Em_HQ_> _m:E£ mmfiezmo A $884 Ea canmi _Ug_§> é owflgmmiomww aka W ©0566 ___o%__:_A_w> Emwécoo EOE?” Jobjoo flozncmemucoo [ _§_m> qE_umo_ gmL gm\§_m J__% W _ \ A ? 82 Eaha mix :o____E g 2___m> 05 W_E§o3 Em; 50$_ fig gm 2 3; W _w_§3< Jag GOO 3 NamA mo%wa_“m\mA%“o:_m> _8or_l A woswoa Co%_%>&A%_icowé:oU g_w>H_m_mo%oBoN_ [ ‘___;_|wHA_§‘_wFA_ 5=<l:goO A 1“ AA Ngmémg 2 0%? A \ A \ i_w_€_=£_3o‘_§m>? _ _u§_Ho; m_§m_=o]_ Am§_:E@__ wo____w>_mE 8502 =Oug_m>E0w_ECoU hwczé _m=o%WUO”_ m%_§H_§oU A ggtoefi _“T1 .b§_H_m_ guo“_Uo__ A _ H80 EDEoVud_n_o”_ mTiA\H\|Ah!L \ ; E _ 13 Ii _Z wé mm $3 Mmggoa mg? W 608%“ __o_Ho%en_ _ %§_§> 2_E>& A _A_ H5835“ cmmogc Po 0:\__m>_ “2>U Mé_Wm:_m> _mEfln_ % Hcwfimmpmnd comogz T Egam nwmgoo Amgcfiho%A__1_o£ mug __wu%>A Q N“ E080>oaE_bm_@:$o_g” % A gm Ago: AF ii A §£mg_m> A mw__$@moU A wgwmbgmgfimagmg ‘§M%_a_Hua€g:5 A ___§§~W_hm AA ‘ ‘ \ It A % ‘A A Z \ mamcop A A %E cuhmomoh gm C0885? A" _hmomsfimg _comH__§8__ he _ mos“ M A go:M _ 6 M HUB“ an 33> 39:0 “O Dag Heine 2; I _£3m__ o.:__U_§ JEEQE8 _2__w_8; goéoa OEEQ A €%_|_ U5 tam VA immfim “o:_“> _8°'H_ ‘ ‘A A ‘MOO ow___E“Q__ ll! I‘ ‘_°_U_wwA__vwo_h_ AW I wag; “£02 _M I A A;
QWQUBW w3O___fl> E0: 83800 6O____ow_§__mE mm _ _ _§ _£ W _“mucus _S__uAEP_g_ _ma_m_< W L‘ A_\_o:g_Am> Eowgapw! _ mugmo ho>_M_Lswgo 5,: Mo Q5 __8O_O iOE 80¢ WEDGE __OmD_____OZ_ i 8% C 552 Ea 852®g62§N_QN_mN_V _ 8% b25>E W % jT G328 EOHV C9 |NbN___§ F \ “flag 3; gsoaw W “ _1Mao‘_£ gag28¢ G280 Ago; §_§__E___5 _ _ _ {V I ‘ u I‘ ‘Vi _ ‘_ N _ ‘ ‘ I 1 _F NH ix V,‘U T9? :wg$o_§_m~_ E Eggm { W\ ii ATM H’ V A AW boHmmm>fi%:_\vO_%fl_mmV o_a6WmF@_o__& j A M8 _m>_W__H Nbamm _w6mmZ oo_vn_mWWr Emt__8'oom_\=o%8o0”_ Q8: “EEO QL NA U§Ow€§m_ N_ fig 1 Hwlgmemmo Huwgcfi “IV ‘I _~m_E_ _EL_ AbOo_Vf 88“ G380 5_w__8€E>$_ Ea __vOV_%_§TMQA % j M2852 %SW3 GB 6 £0N _og_o£Um_@vQO22%€OQmmN_&fi%o£vEm_o§m%€_oU ?J%%§_ _m@mZ m_2_omVM fig £fl___émEo$?mmho®m M SM? _“_E%I% QwO_OC__8_ Oa=__U“_N ‘HO:3 ‘B ob@EAoaH8___\_:w_\o_N_M”_ _ mgwgéub EEUE Hopéslw A :mmmm_‘_vfi_63 wgamyk€O%>$m=OOTI \ & ohm_o~__\vN©.mW___g%I ___£§m> EowcmlfiopA__o_E> E2 MO,“ V 2902 SQ mi; w _uO£UE as _§§[_\ %282 MO’: 9§8_€$_£ Ea r_§g__§ §w__m___8:5 mg__w> 8___m§§> Q 580$ :§_%mv_ fig N96 j““1‘HJ" M‘ t I i % \ \m_8_umwo__ _8o_ he Ag_fi> _cmmmmiwgzua _w§Em> _ $3 mg:Wm__M_[_mo_mO_oom LY Ago: mUOWEVmv_ U5 Macao b2&0! j W_o>$m§ __oAwmir_(Ah_§_hon_ div Em_S8|omm\i% \ 8%: __E£O€_2? ‘ AhoimmmvHoM\§_mml_%g é A _V_EnWM_W__o%z o%_w_8v_% % ¢F_M_:_8'moAm \m°%o_6om :5“: mzwifié E_m_€d2 Ahog; §_E_\@_m_§V gw62_\g8N_£ =§g_§ Eowgcou W_\E I 1‘ A _ A E ‘AA _ _ ‘A\ {M gamma _€_< %_&_:§ g_gW>€_U_ 0b%0£\W_v;_w”_ ' _$5___g§_< W %o€UEHoo€=_ L\ Ml‘ ‘N “ ;:“:||;_ 1| It | > _ ‘ 1' L I fA o____“_V_%g____<A *1 % j % mum__ §_@°__§_ E M____%8]_ ¢1j k_€_fi_ fl__%__w____H B__fi_EHOguaw QWNO __N__:__ __ OEQu@>OOOm W_3____w> E96 _fl______0COm B O0___G> U_EOCOOm6-" O__3KOCC<