Embed Size (px)
Citation preview
TRAINING MANUAL
ECONOMIC VALUATION
AND
ENVIRONMENTAL ASSESSMENT
John Mburu (editor)
Contributors:
Richard Abila, Iason Diafas, Paul Guthiga, Richard Hatfield,
Serah Kiragu and Cecilia Ritho
i
Acknowledgement
The preparation of this training manual has been funded by the German Ministry of Education and
Research (BMBF) through Subproject E13 of the BIOTA-East Africa Project and accomplished through
the cooperation of the Center for Development Research (ZEF) and IUCN - The World Conservation
Union-Eastern Africa Regional Office (IUCN-EARO)
About the Training Manual Authors
John Mburu is a Senior Research Fellow, Center for Development Research, University of Bonn
Richard Abila is Assistant Director, Kenya Marine and Fisheries Research Institute, Kisumu
Iason Diafas is PhD Fellow at the Center for Development Research, University of Bonn
Paul Guthiga is PhD Fellow at the Center for Development Research, University of Bonn.
Richard Hatfield is Senior Program Design Officer with African Wildlife Foundation
Serah Kiragu is Programme Officer with IUCN – The World Conservation Union.
Cecilia Ritho is a Lecturer with the University of Nairobi
ii
Preface
This training manual is aimed at policy-makers and practitioners involved in the
conservation and management of natural resources. It is meant to equip senior and mid-
level ministerial personnel, staff members of conservation state corporations and
representatives of NGOs and CBOs in Kenya with basic principles of environmental
economics and valuation techniques in order to endow them with the necessary skills for
assessing and justifying the importance of biodiversity conservation.
The manual is organized in three parts. Part A consists of the first three chapters and
provides an introduction to basic ecological and economic concepts that are relevant to
valuation and assessment of natural resources. Part B offers a detailed discussion of
valuation concepts and methods or techniques applied in economic valuation, while part
C delineates decision-making criteria that can be applied in environmental assessment.
These include environmental impact assessment (EIA), a number of cost-based methods
as well as cost-benefit analysis, which considers both benefit and cost streams.
The primary emphasis of this manual has been placed on natural resources (forests,
wildlife, wetlands, etc.) and the biodiversity within them, but it can also be applied to all
renewable and non-renewable resources as well as to environmental aspects such as
pollution control, water and sanitation, and general public health. Although the manual is
not exhaustive, it offers a catalogue of several important approaches to economic
valuation and practical decision-making, providing empirical examples that support the
theoretical discussions. It is hoped that the manual will positively contribute towards
understanding the economic value of natural resources and biodiversity and hence
promote their conservation and sustainable use.
iii
Table of Contents
Preface: ………………………………………………………………………….. ii Part A: Introduction to Ecological and Economical Concepts.......................... 1
1. Natural Resources and Biodiversity ............................................................ 1 1.1 Types and definitions of natural resource ..............................................1 1.2 The significance of differing resource characteristics ...........................2 1.3 Definition of biological diversity (biodiversity)......................................2 1.4 Ecological services and functions of biodiversity...................................4 1.5 Major threats and challenges to biodiversity conservation ..................9 1.6 Discussion questions: ..............................................................................10
2. Economic Theory and the Problem of Resource Allocation.................... 11 2.1 The rational of economic theory............................................................11 2.2 Why economics of natural resources.....................................................12 2.3 Natural resources as scarce resources...................................................13 2.4 Economic criteria for decision making in solving NR problems........15 2.5 Economic valuation and the demand curve .........................................19 2.6 Negative externalities as a source of natural resource problems. ......21 2.7 Discussion Questions...............................................................................23
3. Policy, Market and Institutional Failures in Natural Resources
Conservation ................................................................................................ 24 3.1 Introduction.............................................................................................24 3.2 The importance of non-market institutions..........................................25 3.3 Market failures........................................................................................27 3.4 Sources of market failures......................................................................28 3.5 Property rights regimes and emergence of different management
approaches of natural resources........................................................... 30 3.6 Political economy considerations...........................................................35 3.7 Discussion questions................................................................................35
PART B: Economic Valuation Concepts and Methods.................................... 36
4. Introduction to Economic Valuation of Natural Resources and
Biodiversity................................................................................................... 36 4.1 Definition of economic valuation and its importance ..........................36 4.2 Historical perspective of economic valuation.......................................39 4.3 Introduction to differents concepts of value.........................................40 4.4 Measurement of economic value............................................................42
iv
4.5 Choice of methods of economic valuation.............................................45 4.6 Discussion questions................................................................................47
5. Revealed Preference Methods .................................................................... 48 5.1 Market-price based approaches ............................................................48 5.2 Human capital approach........................................................................51 5.3 Production function/ Change in productivity method.........................53 5.4 Travel cost method..................................................................................55 5.5 Hedonic pricing method .........................................................................58 5.6 Preventive expenditure/ Damage avoided/ Replacement costs
approaches .............................................................................................. 61 5.7 Discussion questions................................................................................64
6. Stated or Expressed WTP Methods and Benefits Transfer..................... 65 6.1 Contingent Valuation..............................................................................65 6.2 Choice Experiments ................................................................................71 6.3 Choice modeling versus contingent valuation ......................................74 6.4 Benefits transfer method ........................................................................75 6.5 Dicussion questions .................................................................................76
7. Measuring Costs of Conserving Natural Resources and Biodiversity.... 78 7.1 Management costs ...................................................................................78 7.2 Opportunity costs of conservation.........................................................80 7.3 Other (external) costs .............................................................................81 7.4 Discussion questions: ..............................................................................81
Part C: Decision Criteria in Practice ................................................................. 83
8. Environmental Impact Assessment (EIA)................................................. 83 8.1 Introduction to Environmental Impact assessment (EIA)..................83 8.2 Overview of EIA Processes ....................................................................86 8.3 EIA Methods And Tools .........................................................................91 8.4 EIA and Biodiversity ..............................................................................94 8.5 Environmental Audits ..........................................................................100 8.6 Environmental Impact Assessment: Case Studies .............................100 8.7 Discussion questions..............................................................................103
9. Cost-Benefit Analysis (CBA) .................................................................... 104 9.1 Stages of conducting cost......................................................................104 9.2 Major challenges of conducting CBA .................................................107 9.3 Social or distributive analysis in CBA ................................................108 9.4 Examples of Application on CBA in natural resources.....................108
v
10. Other Decision-Making criteria ............................................................... 110 10.1 Cost-Effectiveness Analysis..................................................................110 10.2 Multi-criteria analysis ..........................................................................112 10.3 Precautionary approaches....................................................................113 10.4 Moral Approaches and Environmental Ethics in Decision Making 115 10.5 Discussion questions..............................................................................116
References ........................................................................................................... 117
Appendix 1: Evaluating the welfare effects of improved water quality using
the choice experiment method (Abou-Ali and Carlsson, 2004)............. 120
APPENDIX 2: A Financial and economic model for estimating annual use
values of forest resources. ......................................................................... 124
vi
TABLES
Table 1: Millennium Development Goal 7 ………………………………………………………13
Table 2: Summary of valuation approaches and techniques used ……………………………….46
Table 3: Calculating the gross value of crop production in Nakivubo Wetland, Uganda, using
Market prices (1993) ……………………………………………………………………50
Table 4: Examples of Elicitation formats ……………………………………………………….68
Table 5: Landowners’ and other stakeholders’ production and transaction costs of co-
management (per participating householda) …………………………………………….79
Table 6: Direct management costs and revenues of the four conservation areas in Kenya ……..79
FIGURES
Figure 1: The relationship between the economic system and the environment ……………….14
Figure 1: Production Possibility Curve (PPF) ………………………………………………….15
Figure 3: Production Possibility Frontier and Optimal Production …………………………….17
Figure 2: Producer and Consumer Surplus ……………………………………………………..19
Figure 3: Demand and WTP ……………………………………………………………………20
Figure 4: Marginal Costs of Production ………………………………………………………...23
Figure 5: Classification of values of natural resources and biodiversity ……………………….42
Figure 8: Classification of economic values (benefits) of natural resources …………………...45
Figure 9: A classification of decision approaches from the perspective of cost-effectiveness ...111
1
Part A: Introduction to Ecological and Economical Concepts
1. Natural Resources and Biodiversity
1.1 Types and definitions of natural resource
The resources of land, forests, savannahs and seas fall into several categories. Two main
types of natural resource can be distinguished
(a) Non-renewable natural resources
(b) Renewable natural resources
Non-renewable natural resources are those of fixed supply such as oil, coal, gold or iron –
that is, their continued use will inevitably result in exhaustion. Renewable natural
resources are those that have the capacity to regenerate themselves, and are therefore
potentially inexhaustible when used appropriately, e.g. fish, forests, solar energy, water,
and the atmosphere.
Economists think of the world as consisting of ‘goods’ (physical components) and
‘services’ (non-physical components). Both non-renewable and renewable natural
resources are ‘goods’ i.e. they are tangible and exist as physical ‘stock’ within a limited
area. As such, they can be privately, communally, or governmentally owned and/or
managed. And since they are tangible in nature, they are also generally recognised to
have market value, although the market values do not always reflect their true value to
society.
Environmental resources, on the other hand, are those that are of benefit to humankind
but are difficult, if not impossible, to own: what economists refer to as ‘public goods’.
Many of these are based on a functioning ecosystem. Examples include clean air,
flowing rivers, the existence of particularly plants and scenic beauty.
2
1.2 The significance of differing resource characteristics
The primary reason why economists distinguish between non-renewable, renewable and
environmental resources is that the overall management challenge of each differs. The
primary question for non-renewable resource management is: “at what rate should a
resource of fixed supply be depleted?”. By contrast, the main consideration in managing
renewable resources is that they have the potential to be inexhaustible. The primary
question then becomes: “what balance should be maintained between the rate of use and
the rate of resource regeneration?”. Whilst the primary question in managing
environmental resources becomes “what are the costs to society of diminished ecosystem
functions as a result of renewable and/or non-renewable resource depletion?” or,
alternatively, “what are the benefits to society of enhanced ecosystem functions as a
result of renewable and/or non-renewable resource increase or enrichment?”.
1.3 Definition of biological diversity (biodiversity)
In terms of the discussion so far, non-renewable, renewable, and environmental resources
combine to constitute ‘biological resources’ (the word biodiversity is a contraction of
biological diversity). These biological resources are simply the physical manifestation of
biological diversity. Biodiversity has varied definitions but this manual defines
biodiversity in accordance with the Convention on Biodiversity (CBD) and that is:
biological diversity is the variability among living organisms from all sources including
inter alia, terrestrial, marine, and other aquatic ecosystems and the ecological
complexities of which they are part; this includes diversity within species, between
species and of ecosystems1 (See other definitions in Box 1). These three are the levels of
biodiversity. The first one, genetic biodiversity, defines the adaptation capacities of the
species in the long term by way of evolution, thus species or groups of them with less
flexible genomics will tend to become extinct. At species level, this is basically
supported by a recognized structure (taxonomy), sampling, and derivation of statistical
operators; the number and types of species and changes on their populations are used to
1 See UN, 1992, The Convention on Biological Diversity
3
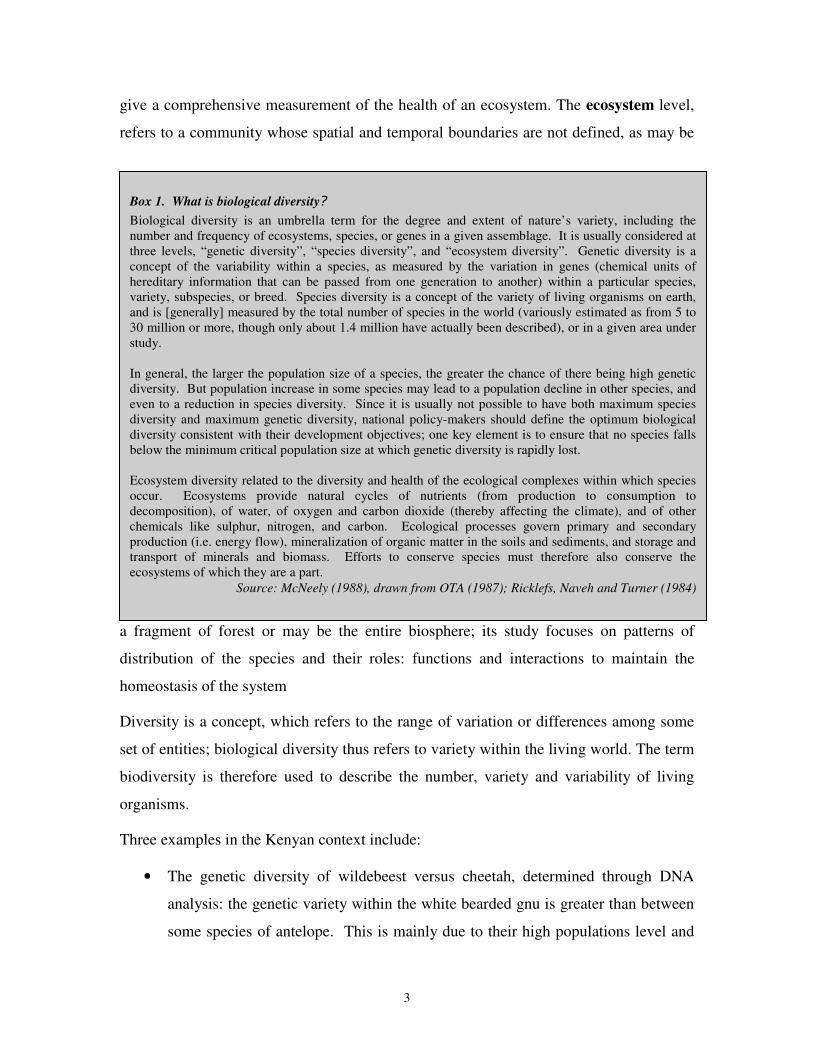
give a comprehensive measurement of the health of an ecosystem. The ecosystem level,
refers to a community whose spatial and temporal boundaries are not defined, as may be
a fragment of forest or may be the entire biosphere; its study focuses on patterns of
distribution of the species and their roles: functions and interactions to maintain the
homeostasis of the system
Diversity is a concept, which refers to the range of variation or differences among some
set of entities; biological diversity thus refers to variety within the living world. The term
biodiversity is therefore used to describe the number, variety and variability of living
organisms.
Three examples in the Kenyan context include:
• The genetic diversity of wildebeest versus cheetah, determined through DNA
analysis: the genetic variety within the white bearded gnu is greater than between
some species of antelope. This is mainly due to their high populations level and
Box 1. What is biological diversity?
Biological diversity is an umbrella term for the degree and extent of nature’s variety, including the number and frequency of ecosystems, species, or genes in a given assemblage. It is usually considered at three levels, “genetic diversity”, “species diversity”, and “ecosystem diversity”. Genetic diversity is a concept of the variability within a species, as measured by the variation in genes (chemical units of hereditary information that can be passed from one generation to another) within a particular species, variety, subspecies, or breed. Species diversity is a concept of the variety of living organisms on earth, and is [generally] measured by the total number of species in the world (variously estimated as from 5 to 30 million or more, though only about 1.4 million have actually been described), or in a given area under study. In general, the larger the population size of a species, the greater the chance of there being high genetic diversity. But population increase in some species may lead to a population decline in other species, and even to a reduction in species diversity. Since it is usually not possible to have both maximum species diversity and maximum genetic diversity, national policy-makers should define the optimum biological diversity consistent with their development objectives; one key element is to ensure that no species falls below the minimum critical population size at which genetic diversity is rapidly lost. Ecosystem diversity related to the diversity and health of the ecological complexes within which species occur. Ecosystems provide natural cycles of nutrients (from production to consumption to decomposition), of water, of oxygen and carbon dioxide (thereby affecting the climate), and of other chemicals like sulphur, nitrogen, and carbon. Ecological processes govern primary and secondary production (i.e. energy flow), mineralization of organic matter in the soils and sediments, and storage and transport of minerals and biomass. Efforts to conserve species must therefore also conserve the ecosystems of which they are a part.
Source: McNeely (1988), drawn from OTA (1987); Ricklefs, Naveh and Turner (1984)
4
wide distribution, split by the formation of the Rift Valley. By contrast, the
cheetah gene ‘pool’ is relatively narrow, a fact that is believed to have contributed
to their decline to a level that is considered to be approaching the ‘minimum
viable population’ threshold.
• The abundance of elephants versus other species: the growth and concentration of
elephants in and around Amboseli National Park is thought to have resulted in the
demise of many other species, due to the role they play in consuming tree and
bush re-growth, in particular. These include primarily the browser and species:
black rhino, eland, kudu, impala, duiker, dik-dik together with leopard, which rely
on browser species. A similar situation also occurred in Tsavo National Parks
during the peak elephant population of the 1970s.
• Local participation of communities in ecosystem diversity: from a biodiversity
perspective, the main rationale for the need to include local communities in
wildlife management is in order to maintain the functions and services that
ecosystems provide, recognising that the survival of most, if not all, Kenya’s
protected areas are ultimately dependent on the impact of forces outside the
protected area boundaries on ecosystem functions.
1.4 Ecological services and functions of biodiversity
The principal biodiversity goods and functions can be summarized as follows:
- Regulation of global processes: atmospheric flow of gases that affect global and local
climates and the breathing air;
- Conservation of soil and water: maintenance of the hydrologic cycle and erosion
control;
- Cycling of nutrients and energy: photosynthesis, soil renewal, nitrogen fixation,
organic matter decomposition, etc.;
- Saving of genetic information: that warrants the permanence of life on earth;
- Maintenance of plant reproduction through pollination and seed dispersal;
5
- Provision of raw material for sustaining human activities: agriculture, medicine,
manufacturing, industry, etc.; and
- Provision of recreation opportunities
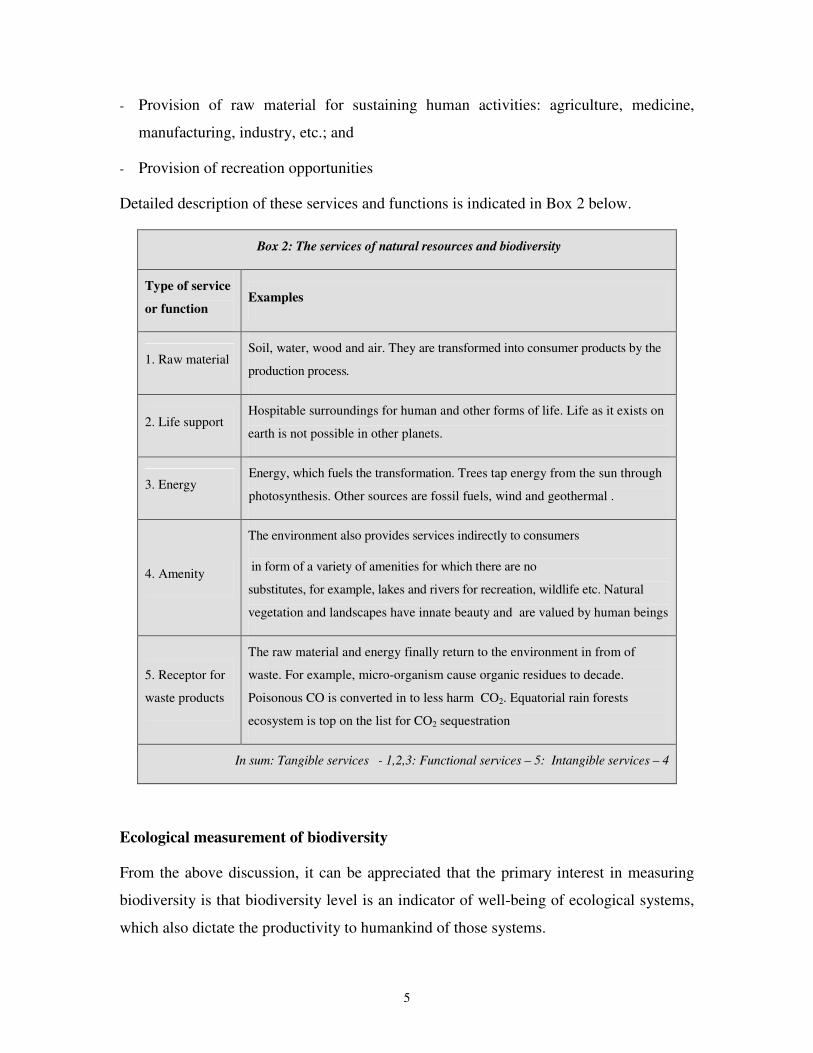
Detailed description of these services and functions is indicated in Box 2 below.
Box 2: The services of natural resources and biodiversity
Type of service
or function Examples
1. Raw material Soil, water, wood and air. They are transformed into consumer products by the
production process.
2. Life support Hospitable surroundings for human and other forms of life. Life as it exists on
earth is not possible in other planets.
3. Energy Energy, which fuels the transformation. Trees tap energy from the sun through
photosynthesis. Other sources are fossil fuels, wind and geothermal .
4. Amenity
The environment also provides services indirectly to consumers
in form of a variety of amenities for which there are no
substitutes, for example, lakes and rivers for recreation, wildlife etc. Natural
vegetation and landscapes have innate beauty and are valued by human beings
5. Receptor for
waste products
The raw material and energy finally return to the environment in from of
waste. For example, micro-organism cause organic residues to decade.
Poisonous CO is converted in to less harm CO2. Equatorial rain forests
ecosystem is top on the list for CO2 sequestration
In sum: Tangible services - 1,2,3: Functional services – 5: Intangible services – 4
Ecological measurement of biodiversity
From the above discussion, it can be appreciated that the primary interest in measuring
biodiversity is that biodiversity level is an indicator of well-being of ecological systems,
which also dictate the productivity to humankind of those systems.
6
Biodiversity has two dimensions: richness (variety) and abundance (number). Ecologists
typically utilise three types of biodiversity measure:
• Species richness indices – a measure of the number of species in a defined
sampling unit.
• Species abundance indices – compares the level of evenness amongst numbers of
each species versus unevenness (unequal). Usually some species are abundant
whereas most are not i.e. a few species dominate.
• Proportional abundance indices – which seek to summarise richness and evenness
into a single figure e.g. Shannon and Simpson indices.
Ecological and economic importance of biodiversity
As stated earlier, biodiversity is manifested in the form of biological resources.
However, the presence of biological resources is only the end result of a set of
interrelated ecosystem processes, or functions:
• Water cycle. The status of a water cycle in any given environment ranges from
‘ineffective’ to ‘effective’. An effective water cycle is one that retains and makes
available to the system the greatest percentage of rainfall received. One
characteristic tends to be higher and longer duration river/stream flows. High
levels of plant cover (whether grasses or otherwise) are usually required to
facilitate an effective water cycle, which in turn results in higher ecosystem
productivity; together with higher biodiversity levels.
• Mineral cycle. Productive systems are dependent on a varied and available
supply of minerals for regeneration. Greater biomass levels contribute healthy
mineral supplies, which in turn result in higher ecosystem productivity and higher
biodiversity levels.
• Energy flow. Energy flow is a measure of the productivity of the system, and is
determined by the system’s ability to convert sunlight into plant production
through photosynthesis, which in turn is dependent on plant cover.
7
• The three processes act in tandem, and therefore constitute a set of processes.
This set can move in three directions: ‘spiralling up’, resulting in greater
ecosystem productivity and manifested by greater biodiversity; ‘ spiralling down’,
manifested by decreased productivity and biodiversity; and ‘neutral’.
From an ecological perspective, the diversity increases the ecosystem's stability (capacity
to maintain itself into healthy margins of variation adapting recurrently to changes) and
resilience (ability to respond and recover to great stress events), which is an extraordinary
quality, because it means that biodiversity is able to maintain itself in the time, owing to
the called biogeochemical cycles:
1. Energy, using the photosynthesis by which green plants convert sunlight, water,
nutrients, and carbon dioxide into chemical fuel (carbohydrates), which is the
basis of all food webs, and is the foremost important source of energy (even
including the fossil one, that derives from it);
2. Water, activated by solar energy, the transpiration and evapo-transpiration of the
vegetation contribute to the water purification by catching, holding and recycling
rainwater; in addition, wetlands and estuaries purify water and prevent and control
flooding;
3. Carbon and oxygen cycles, the carbon dioxide produced by animal respiration,
plant decomposition and fuel burning is absorbed by green plants in the biosphere
and phytoplankton in the hydrosphere, which later release oxygen back to the
atmosphere, in order to get a gaseous equilibrium, that enable almost all forms of
life to exist.
4. Nitrogen cycle, nitrogen is a key component of all organisms (base of the amino-
acid molecules that integrate proteins), on its natural atmospheric form isn’t
accessible to most organisms, needs to be available being transformed by some
bacteria that live in the roots of legumes.
From economics perspective, biodiversity is important in terms of its use or potential use
value to society i.e. a ‘utilitarian’ view. These uses, which are discussed further in
Chapter 4, include:
8
Extractive use encompasses direct use of biological resources, for either production or
consumption:
• Fuelwood, timber, water, fish, ivory, medicinal plants, fodder, construction
material, dyes, etc.
• Employment
Non-extractive use entails use value without extracting the resource (‘indirect’ use),
either for production or consumption:
• Recreation/Tourism
• Education and Research
• Employment opportunities
• Ecosystem services (as opposed to ‘goods’) provided by ecosystem processes,
including:
o Plant production through photosynthesis
o Plant reproduction through pollination, cross-fertilization, gene flow, etc.
o Watershed protection, recharging ground water and buffering extreme
conditions (e.g. floods, drought)
o Production of soil and protection of soil from erosion
o Supply of essential nutrients
o Absorption and breakdown of pollutants and organic waste
Non-use values encompass value that is not derived from use:
• Spiritual, historical or cultural value is well-being derived from, for example, a
‘sense of belonging’.
• Existence value derived from knowing that a landscape, habitat or species exists,
even though an individual may have no intention of ever visiting that area.
• Option value is the value attached to retain the option, or possibility, of having
future access to a given landscape, habitat or species. This value reflects an
9
individual or society’s perception of uncertainty, both in terms of future needs or
desires; and future threats to the biological resource(s) in question.
• Bequest value is closely related to existence value, and is the value derived from
knowing that certain landscapes, habitat or species exist for the benefit of future
generations.
1.5 Major threats and challenges to biodiversity conservation
Three major threats are posed to biodiversity:
• Habitat alteration, usually from higher-diverse natural ecosystems to less
diverse (‘monoculture’ in the extreme case). This is perhaps the most
important threat to biodiversity and, by extension, system productivity. Two
important cases in Kenya concern conversion of forests to cultivation
(prevalent in all major forests); and conversion of rangeland to cropland –
which is often later abandoned.
• Over-harvesting, that is, an extraction rate that is higher than the regeneration
rate, leading to eventual exhaustion of the resource. Again, over-harvesting of
trees and grasses are particularly relevant issues in Kenya.
• Climatic change, often related to changing regional-level vegetation patterns,
and involving features such as carbon dioxide build-up (global warming) and
the El Nino and La Nina phenomena (climate regime reversal).
The importance of natural resource conservation cannot be denied, given that ecosystem
processes and services provide the foundation for our current existence, and that future
consumption depends, to a great extent, on stock of natural ‘capital’. Seen in this light,
conservation is a precondition for sustainable development.
A number of broad challenges exist, however:
10
• Challenge 1: The fundamental problem is that more people earn greater
immediate benefits from exploiting biological resources than they do from
conserving them.
• Challenge 2: Areas of the world with the greatest levels of biodiversity are often
those with fewest economic means to implement conservation. One of the
greatest challenges is to reconcile this situation.
• Challenge 3: Whilst over-harvesting and/or depletion of a renewable resource
may be a conscious choice, perhaps the greatest need is for resource harvesting to
be conducted under efficient management, rather than mismanagement, in order
that society can realise the greatest possible gains.
1.6 Discussion questions:
1. Why in essence can we say all natural resources can be termed as renewable and
as well as non-renewable?
2. Discuss, giving examples, the main forest functions and services that Kenyans
have been enjoying from their forest?
3. What do you consider the main issues underlying each of the challenges 1, 2 & 3
to be?
11
2. Economic Theory and the Problem of Resource Allocation
2.1 The rational of economic theory
Making CHOICES is an every day occurrence. Individuals, households, firms producing
goods and services, governments and even the international community make choices.
Choices have to be made for the simple reason that there is SCARCITY. The best-known
scarcity is that of money to buy all the things we desire as individuals, households, or
even governments. Time is scarce, therefore we have to make a choice on the way we
spend the twenty four hours in a day. Natural resources are scarce. For instance land in
the high potential areas of Kenya is only a certain area. Similarly the forest area in Kenya
is scarce in the sense we would want to have more forests, but forestland can also be
cultivated because food produced is scarce. Scarcity implies that a choice has to be made.
Economics is the science of choices. It can be defined as the social science that studies
the choices that we (human beings) make as we cope with scarcity (such as of natural
resources) and the institutions (such traditional norms of natural resource use and
management or government regulations (such as the pending forest bill) that have
evolved and continue to evolve to influence and reconcile our choices. Economic theory
is the body of knowledge that has been accumulated by observing human behaviour in
the process of making choices imposed by scarcity. This body of knowledge continues to
be generated. It is used as one way of analyzing some of the problems that face humanity
by identifying and organizing the facts pertaining to a specific problem with a view to
suggesting or alternative solutions and evaluating their possible.
Economics is divided into two broad areas: Micro- and Macroeconomics.
Microeconomics is the study of the choices the individuals (households) and businesses
(firms) in dealing with scarcity, the interaction of these decisions, and the effect of
government regulation on these decisions. The effect of individual, households, business
firms and government on the national and global economy constitutes the study of
Macroeconomics. For example, how will the maize market in Kenya be affected by free
trade among the three East African countries? How will reduction on the tax on paraffin
and gas?
12
2.2 Why economics of natural resources
As the twenty-first century begins it is clear that the welfare of humanity is closely linked
to the quantity and quality of the natural resources. Long ago, natural resources were a
free good but today they are a scarce good. The relationship is starkly demonstrated by
countries in Sub-Saharan Africa and elsewhere in developing countries, where the majority
of the people derive their livelihood directly from natural resources as farmers, livestock
keepers, fishermen or by harvesting products from forests ecosystems. However, poverty
and degradation of natural resources in these countries is on the increase. It is also
becoming increasingly clear that although there are natural resources issues that are
regional or even country specific, others are of global concern and impact, as clearly
demonstrated by the global warming, depletion of the ozone layer, and reduction of the
equatorial forests resulting in loss of their irreplaceable benefits and functions such as the
Kakamega forest.
It is also evident that governments in specific countries are increasingly being confronted
with natural resource linked conflicts. This is because without consideration of peoples’
interests, sustainable natural resources conservation is not possible. Kenya has a
wealth of these conflicts: cultivation in the Mau Escarpment after alleged land purchases;
fencing off of some sections of the Aberdare Range to minimize human-wildlife conflict;
seemingly idle individually owned prime land in high potential areas amidst many
landlessness and jobless people; contentious cultivation and grazing livestock in gazetted
forest areas; the pending forest bill; natural resources issues with a historical twist such as
treaties governing use of Lake Victoria waters and 99-year colonial land leases versus the
current claims of the communities who lost the land.
It is also recognized that natural resources just like other resources such as other capital
resources (other forms of capital include human capital, financial capital, social capital,
political capital) respond to policies and governance. Economic policies particularly
influence the nature of natural resources. It is now acknowledged that natural resources are
not merely biophysical entities but are also economic commodities essentially dynamic
13
and embedded in the social and political setting. Therefore, appropriate natural resource
management (NRM) systems can only be developed if natural, economic and governance
components are appreciated and integrated. This means that appropriated NRM systems are
derived by combining inputs from resource characteristics, policies, institutions,
technology, skills and economic signals.
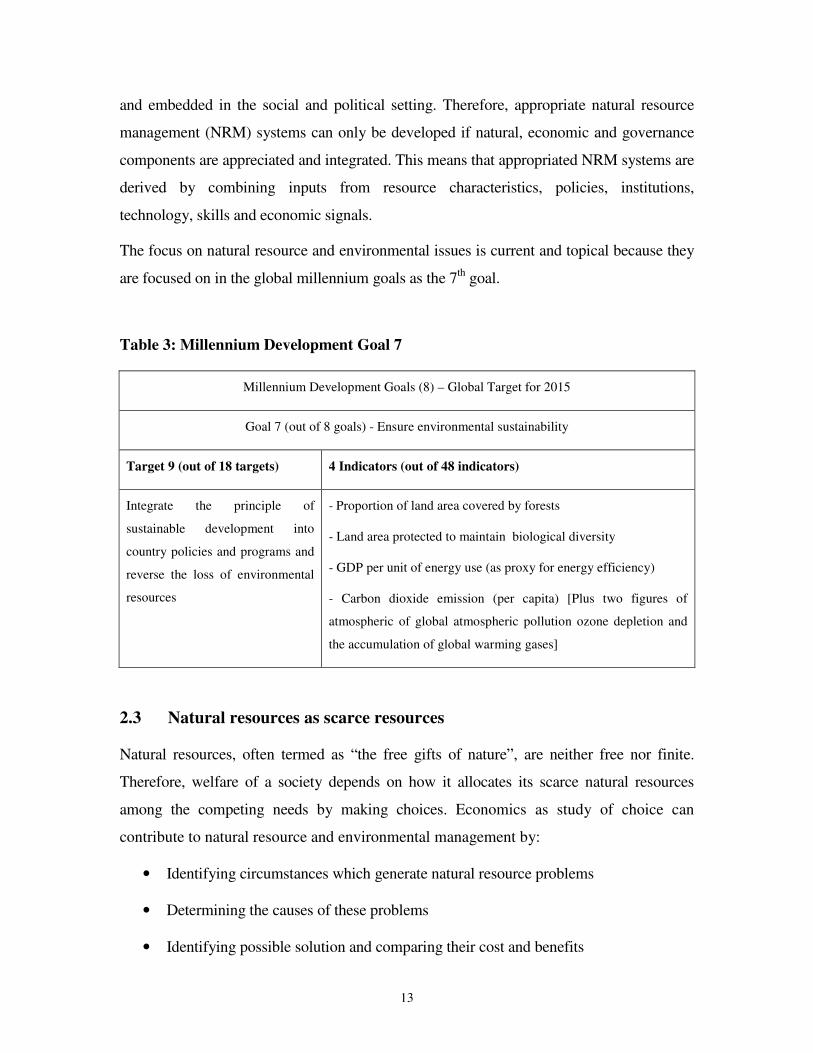
The focus on natural resource and environmental issues is current and topical because they
are focused on in the global millennium goals as the 7th goal.
Table 3: Millennium Development Goal 7
Millennium Development Goals (8) – Global Target for 2015
Goal 7 (out of 8 goals) - Ensure environmental sustainability
Target 9 (out of 18 targets) 4 Indicators (out of 48 indicators)
Integrate the principle of
sustainable development into
country policies and programs and
reverse the loss of environmental
resources
- Proportion of land area covered by forests
- Land area protected to maintain biological diversity
- GDP per unit of energy use (as proxy for energy efficiency)
- Carbon dioxide emission (per capita) [Plus two figures of
atmospheric of global atmospheric pollution ozone depletion and
the accumulation of global warming gases]
2.3 Natural resources as scarce resources
Natural resources, often termed as “the free gifts of nature”, are neither free nor finite.
Therefore, welfare of a society depends on how it allocates its scarce natural resources
among the competing needs by making choices. Economics as study of choice can
contribute to natural resource and environmental management by:
• Identifying circumstances which generate natural resource problems
• Determining the causes of these problems
• Identifying possible solution and comparing their cost and benefits
14
In making the choices, tradeoffs have to be made, that is giving up one thing in order to
get something else. Economists have three main areas where trade-offs are made: what is
produced with the available (natural) resources such as land, how much is produced (food
crops or forest products) and for whom goods and services are produce (who will enjoy
the food crops and the forest products produced from the land resource).
How do economists define the natural resources and the environment (NRE)? Economists
are interested in NRE as they affect mankind, directly or indirectly. Therefore their
definition and the changes they consider in NRE are human centered. That is, they include
not only short-run and direct effects on mankind but indirect and long run effects as well.
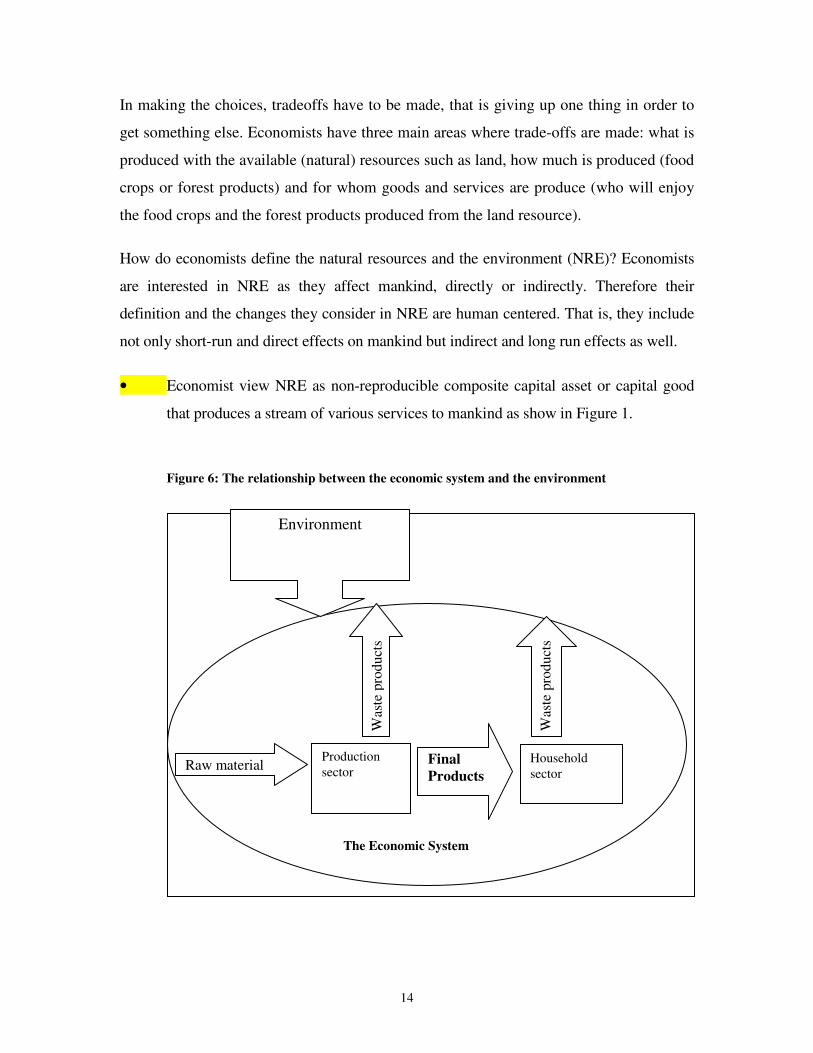
• Economist view NRE as non-reproducible composite capital asset or capital good
that produces a stream of various services to mankind as show in Figure 1.
Figure 6: The relationship between the economic system and the environment
Production sector
Household sector
Raw material
Was
te p
roduct
s
Final
Products
Environment
The Economic System
Was
te p
roduct
s
15
• The services produced by NRE are affected by the production and consumption
activities of mankind (extraction of resources) and the way they dispose their
residuals or wastes. These activities constitute the economic system.
As with all assets, preventing undue depreciation of the value of the asset, contributes to
its efficient use.
2.4 Economic criteria for decision making in solving NR problems
The amount of resource available to a country or a single producer defines the limit of
what can be produce given the available technology. Assume that the resource in question
is the amount of land and the alternative use is to cultivate food crop or retain forest
vegetation. The different combinations of the two alternatives possible can be presented
in a graphical model as in Figure 2.
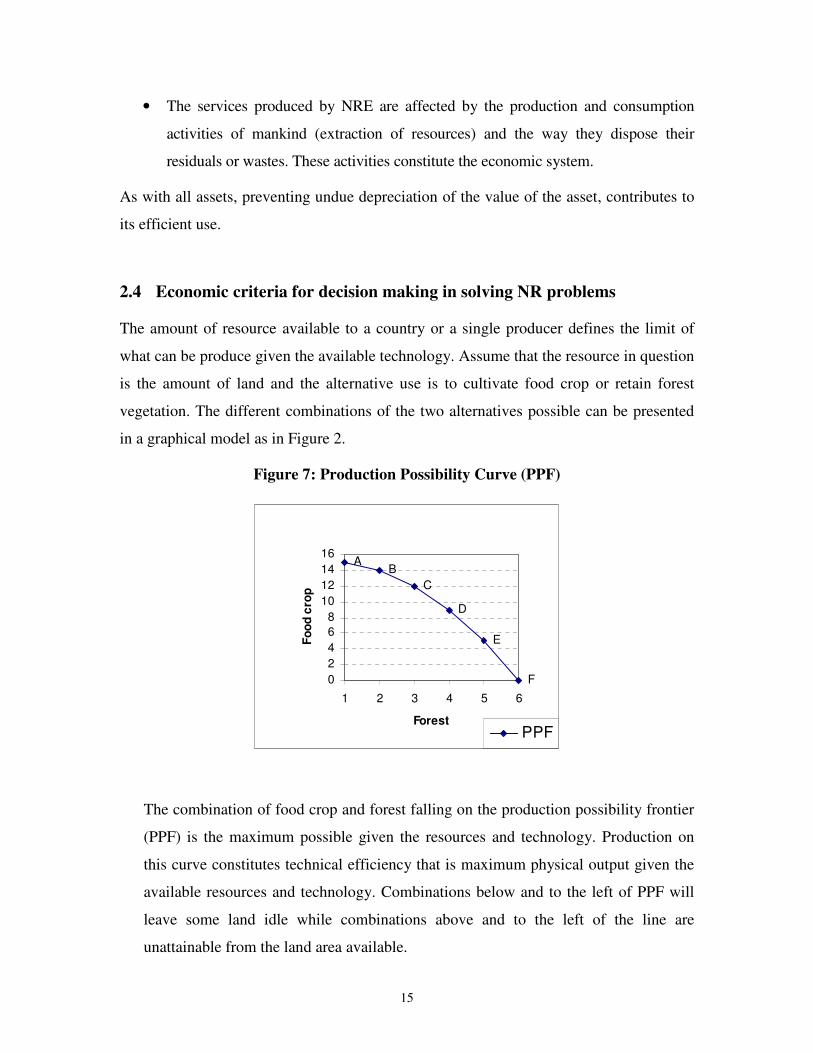
Figure 7: Production Possibility Curve (PPF)
F
C
AB
D
E
0
2
4
6
8
10
12
14
16
1 2 3 4 5 6
Forest
Fo
od
cro
p
PPF
The combination of food crop and forest falling on the production possibility frontier
(PPF) is the maximum possible given the resources and technology. Production on
this curve constitutes technical efficiency that is maximum physical output given the
available resources and technology. Combinations below and to the left of PPF will
leave some land idle while combinations above and to the left of the line are
unattainable from the land area available.
16
To produce more food crop we have to give up some forestland (opportunity cost).
All economic questions arise because we want more than we can get. We want to
keep our forests but we also want land for growing crops. We want an atmosphere
devoid of harmful ultraviolet rays and other gases from the sun filtered by the ozone
layer, but we also want the good and service whose production process emits gases
that destroy the ozone layer.
Every choice involves a cost. Opportunity cost is the highest-valued alternative that is
given up to get something. The opportunity cost for forest in terms of food crop
increases the less of the food crop we have. From combination A (Figure 2), to get
one more unit of forest and move to combination B, we need to give up one unit of
food crop. But to get one more unit of forest and move to C we need to give up two
units of food crop. This is the increasing marginal cost of production (MC) as shown
in Figure 3b. It explains why the supply curve of a commodity is upward sloping
increasing from left to right.
17
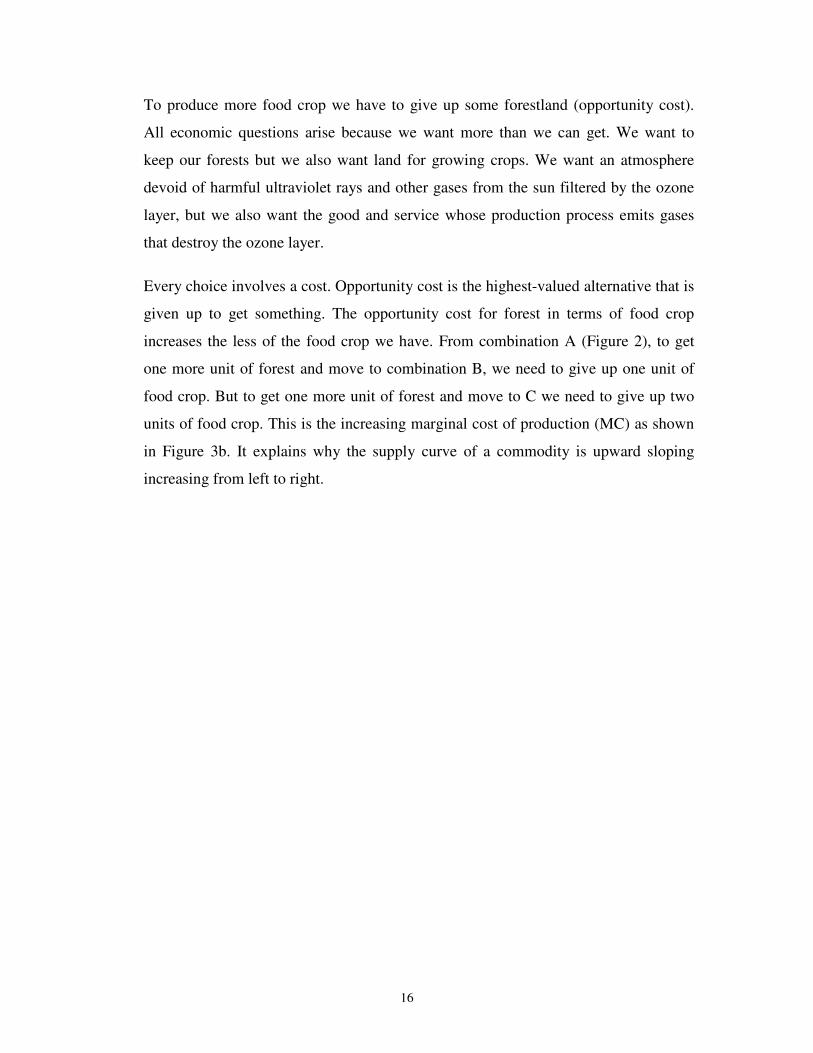
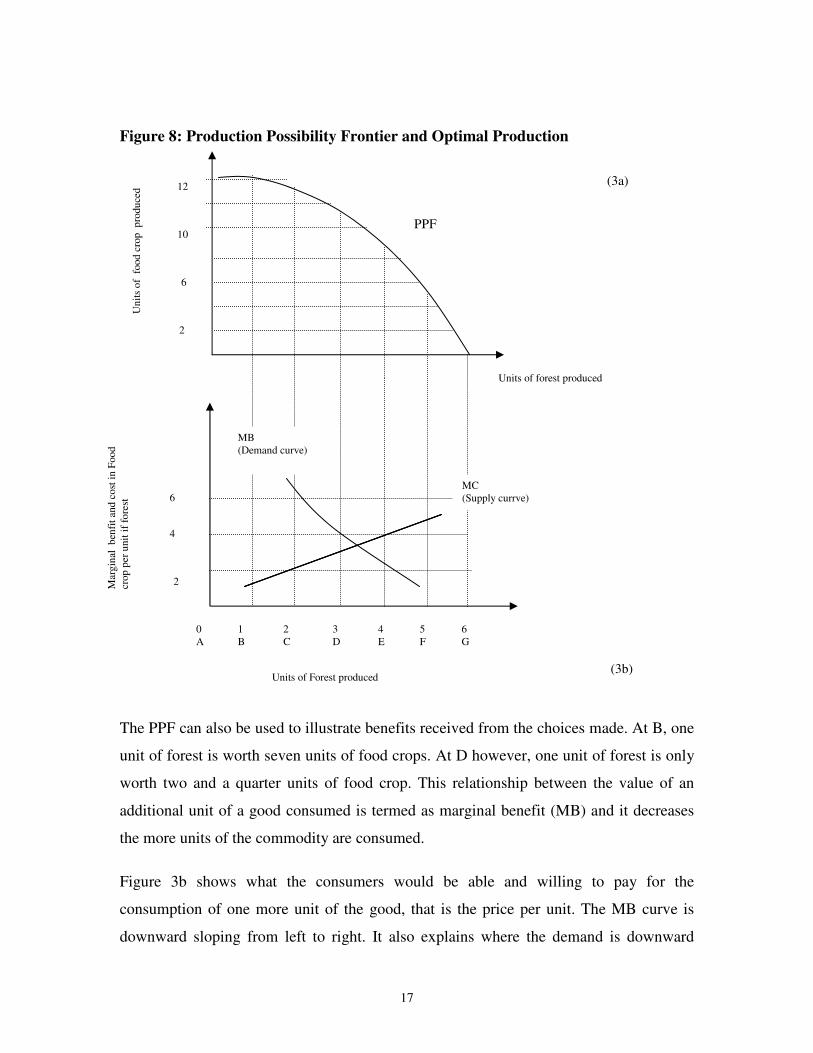
Figure 8: Production Possibility Frontier and Optimal Production
The PPF can also be used to illustrate benefits received from the choices made. At B, one
unit of forest is worth seven units of food crops. At D however, one unit of forest is only
worth two and a quarter units of food crop. This relationship between the value of an
additional unit of a good consumed is termed as marginal benefit (MB) and it decreases
the more units of the commodity are consumed.
Figure 3b shows what the consumers would be able and willing to pay for the
consumption of one more unit of the good, that is the price per unit. The MB curve is
downward sloping from left to right. It also explains where the demand is downward
2
6
10
12
0 A
1 B
2 C
4 E
3 D
5 F
6 G
MB (Demand curve)
MC (Supply currve)
2
4
6
Units of Forest produced
Units of forest produced
Mar
gin
al b
enfi
t an
d c
ost
in F
oo
d
crop
per
unit
if
fore
st
Un
its
of
food
cro
p p
rodu
ced
PPF
(3a)
(3b)
18
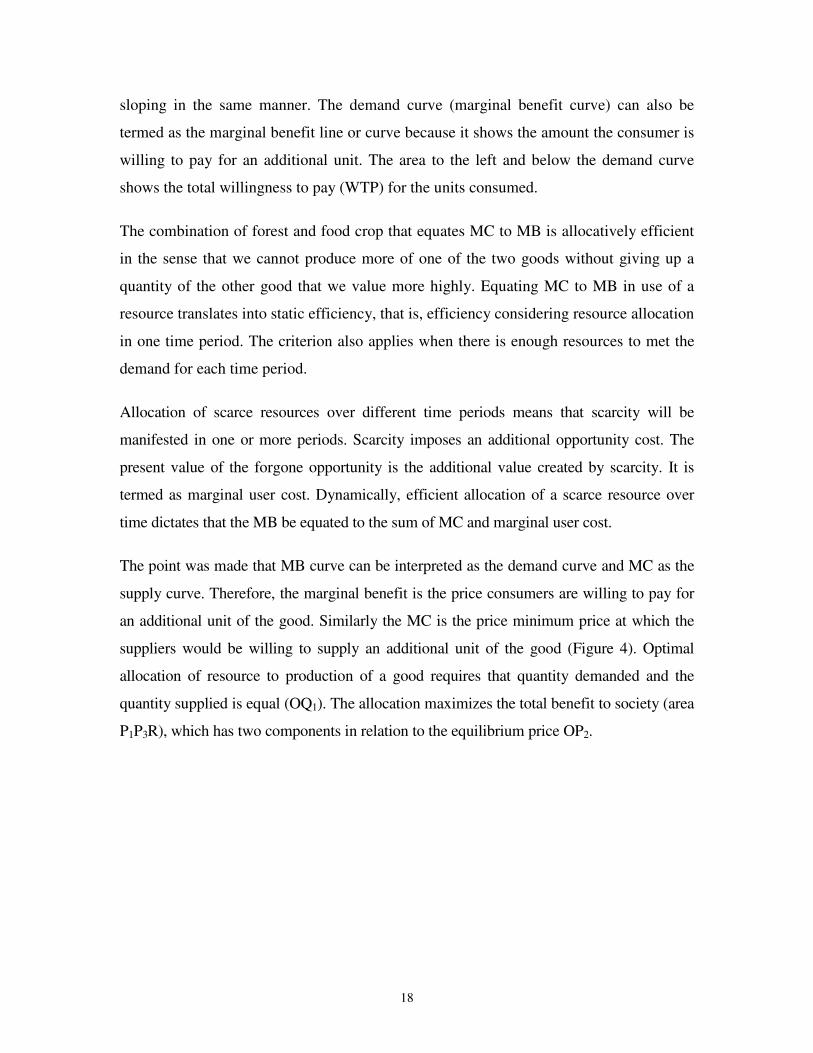
sloping in the same manner. The demand curve (marginal benefit curve) can also be
termed as the marginal benefit line or curve because it shows the amount the consumer is
willing to pay for an additional unit. The area to the left and below the demand curve
shows the total willingness to pay (WTP) for the units consumed.
The combination of forest and food crop that equates MC to MB is allocatively efficient
in the sense that we cannot produce more of one of the two goods without giving up a
quantity of the other good that we value more highly. Equating MC to MB in use of a
resource translates into static efficiency, that is, efficiency considering resource allocation
in one time period. The criterion also applies when there is enough resources to met the
demand for each time period.
Allocation of scarce resources over different time periods means that scarcity will be
manifested in one or more periods. Scarcity imposes an additional opportunity cost. The
present value of the forgone opportunity is the additional value created by scarcity. It is
termed as marginal user cost. Dynamically, efficient allocation of a scarce resource over
time dictates that the MB be equated to the sum of MC and marginal user cost.
The point was made that MB curve can be interpreted as the demand curve and MC as the
supply curve. Therefore, the marginal benefit is the price consumers are willing to pay for
an additional unit of the good. Similarly the MC is the price minimum price at which the
suppliers would be willing to supply an additional unit of the good (Figure 4). Optimal
allocation of resource to production of a good requires that quantity demanded and the
quantity supplied is equal (OQ1). The allocation maximizes the total benefit to society (area
P1P3R), which has two components in relation to the equilibrium price OP2.
19
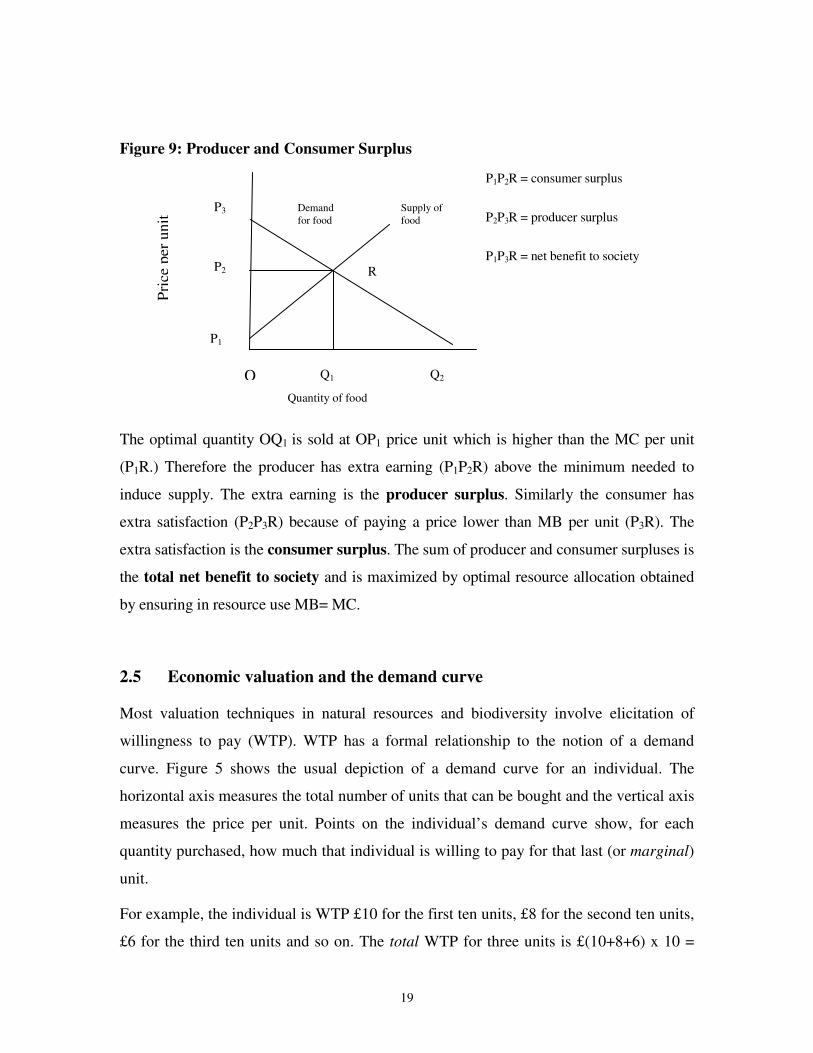
Figure 9: Producer and Consumer Surplus
The optimal quantity OQ1 is sold at OP1 price unit which is higher than the MC per unit
(P1R.) Therefore the producer has extra earning (P1P2R) above the minimum needed to
induce supply. The extra earning is the producer surplus. Similarly the consumer has
extra satisfaction (P2P3R) because of paying a price lower than MB per unit (P3R). The
extra satisfaction is the consumer surplus. The sum of producer and consumer surpluses is
the total net benefit to society and is maximized by optimal resource allocation obtained
by ensuring in resource use MB= MC.
2.5 Economic valuation and the demand curve
Most valuation techniques in natural resources and biodiversity involve elicitation of
willingness to pay (WTP). WTP has a formal relationship to the notion of a demand
curve. Figure 5 shows the usual depiction of a demand curve for an individual. The
horizontal axis measures the total number of units that can be bought and the vertical axis
measures the price per unit. Points on the individual’s demand curve show, for each
quantity purchased, how much that individual is willing to pay for that last (or marginal)
unit.
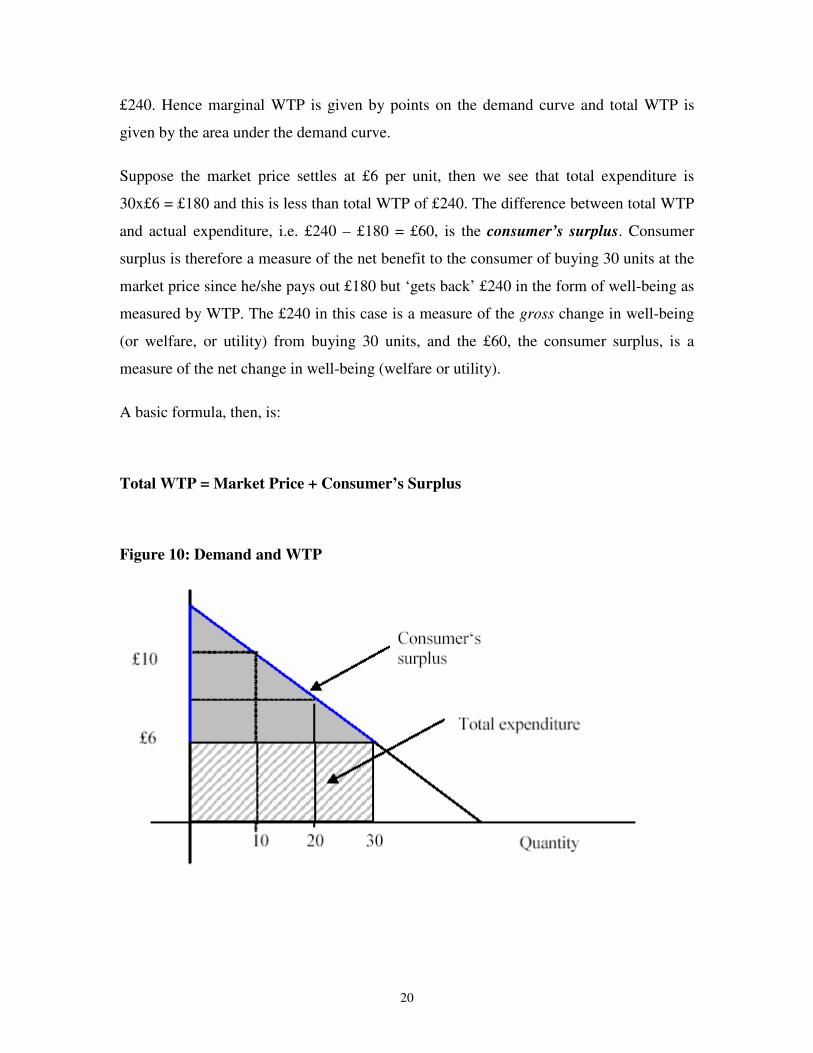
For example, the individual is WTP £10 for the first ten units, £8 for the second ten units,
£6 for the third ten units and so on. The total WTP for three units is £(10+8+6) x 10 =
P1P2R = consumer surplus
P2P3R = producer surplus
P1P3R = net benefit to society
Quantity of food
P
rice
per
unit
Q1 O
Supply of food
Demand for food
R P2
P3
P1
Q2
20
£240. Hence marginal WTP is given by points on the demand curve and total WTP is
given by the area under the demand curve.
Suppose the market price settles at £6 per unit, then we see that total expenditure is
30x£6 = £180 and this is less than total WTP of £240. The difference between total WTP
and actual expenditure, i.e. £240 – £180 = £60, is the consumer’s surplus. Consumer
surplus is therefore a measure of the net benefit to the consumer of buying 30 units at the
market price since he/she pays out £180 but ‘gets back’ £240 in the form of well-being as
measured by WTP. The £240 in this case is a measure of the gross change in well-being
(or welfare, or utility) from buying 30 units, and the £60, the consumer surplus, is a
measure of the net change in well-being (welfare or utility).
A basic formula, then, is:
Total WTP = Market Price + Consumer’s Surplus
Figure 10: Demand and WTP
21
Efficient resource allocation over different time periods
To compare the benefits received from allocating a quantity of resource to some future
period with those of the current period, the future benefits have to be discounted for time
to reflect time value of money (see the compounding /discounting formula). With scarce
resources involving allocation over different time periods, the marginal benefit (net of
cost) of the different time periods have to be discounted for time, to be comparable.
Resource allocation is dynamically efficient if the present value of marginal net benefits
of different time periods are equal. Allocation of resources across “n” time periods is
dynamically efficient if it maximizes the present value of net benefits that could be
received from all the possible ways of allocating those resources over the “n” periods.
Dynamic efficiency assumes the objective of society is to balance the current and future
use of a resource by maximizing the present value of the net benefits derived from the use
of the resource. The present value of a stream of benefits (B1,…………,Bn) received over
a period of “n” years is computed as
n
n
r
B
r
BPV
)1(....,..........
)1( 1
1
+
++
+
=
Where
PV = present value of a stream of net benefits (benefit less cost) from resource
allocation over “n” period of years
r = appropriate interest rate (usually social discount rate different from market
interest rate)
B1 = amount of net benefits received end of the first year
Bn = amount of net benefits received at the end of the furthest year
2.6 Negative externalities as a source of natural resource problems.
Profit is the incentive for the entrepreneur embarking on production of any goods and
services. Entrepreneurship is one of the factors of production. Other factors of production
are obtained from households through incentives to earn income. Capital earns interest,
22
labour earns wages and land (loosely referred to as “free gives of nature”) earns rent. The
income is used to buy the goods and services produced by the firms. Consumers vote by
the shilling to indicate the goods they want produced. In this way they reveal their
preferences for goods and services that are bought and sold. In doing so, they compare
the marginal benefit of each unit with the market price. The process works well for goods
and services which have a market and are consumed after paying a price for instance food
and clothes. The market price is an indication of the value (utility) consumers attach to
the commodity. For other such a clean air, they are not traded in the market and there is
no obvious market price. It is therefore more challenging for economist to device ways of
determining the value people attaché to clean air and other commodities not traded in the
market such as sequestration benefits of forests. The response of the producer to the
revealed preferences of the consumers is to compare the market price in relation to cost
of production to determine the quantity of the good to be supplied. It is assumed that
these costs are fully carried by the producer.
The function of a market is to facilitate buyers and sellers to be in contact to exchange
good and services. In an efficiently working market (competitive market) the market
price reflects the cost of production and the benefit derived from consumption of the
good leading to optimal allocation of resources. However for some types of production
the producer does not incur all the costs of production (Figure 6). Some of them are
borne by a second agent without compensation and are termed as marginal external costs
(MEC). For example when forests are cleared for food crop cultivation, soil erosion is
increased causing rapid siltation of water reservoir. The cost of generating hydroelectric
power is increased and passed on to consumer as higher prices. This cost is not reflected
in the price of food crop produced because it is external to the decision process of the
farmer. That process only takes into account private marginal cost (MPC). Siltation of
water reservoirs is a negative externality generated by food production but the cost is
carried by power consumers.
23
Mar
gin
al c
ost
& b
enef
it
Quantity of output
MS
MPC
ME
QS O Ed
=
MSB
P1
P2
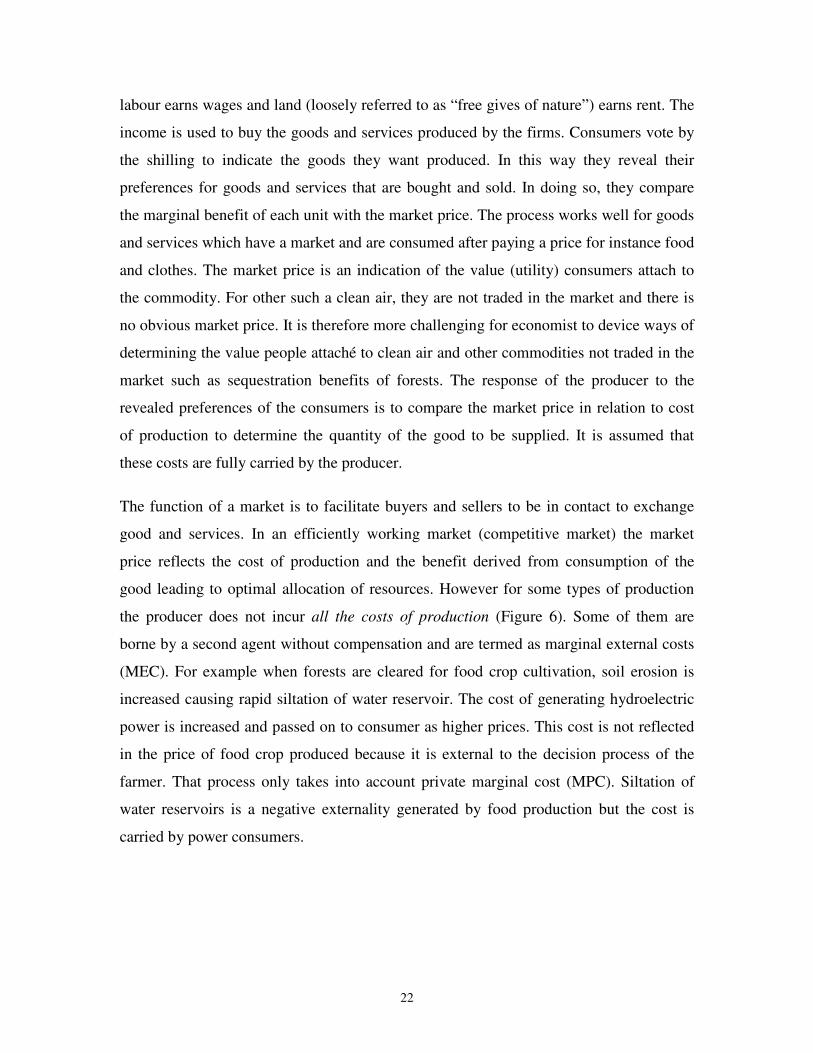
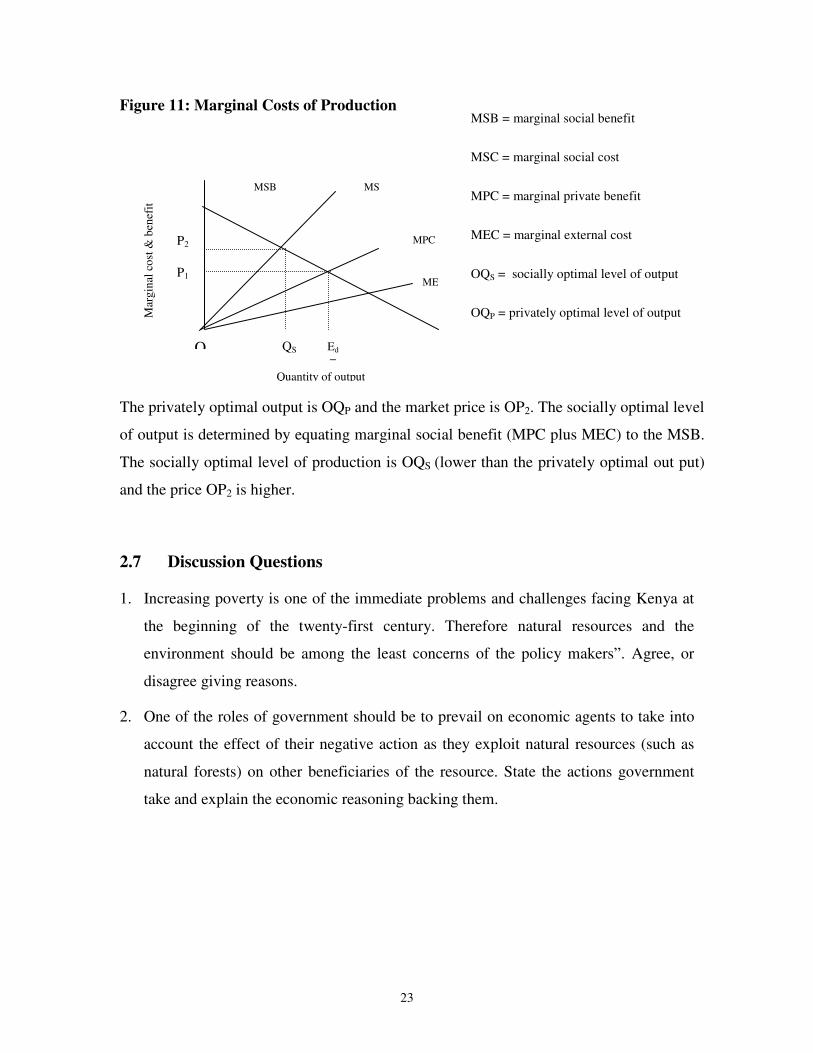
Figure 11: Marginal Costs of Production
The privately optimal output is OQP and the market price is OP2. The socially optimal level
of output is determined by equating marginal social benefit (MPC plus MEC) to the MSB.
The socially optimal level of production is OQS (lower than the privately optimal out put)
and the price OP2 is higher.
2.7 Discussion Questions
1. Increasing poverty is one of the immediate problems and challenges facing Kenya at
the beginning of the twenty-first century. Therefore natural resources and the
environment should be among the least concerns of the policy makers”. Agree, or
disagree giving reasons.
2. One of the roles of government should be to prevail on economic agents to take into
account the effect of their negative action as they exploit natural resources (such as
natural forests) on other beneficiaries of the resource. State the actions government
take and explain the economic reasoning backing them.
MSB = marginal social benefit
MSC = marginal social cost
MPC = marginal private benefit
MEC = marginal external cost
OQS = socially optimal level of output
OQP = privately optimal level of output
24
3. Policy, Market and Institutional Failures in Natural
Resources Conservation
3.1 Introduction
Policy, institutional and market failures are responsible for the difference between actual
outcomes and optimal resource use. Policy failure refers to situations where inappropriate
government policies, or absence of required policy results in market distortions for natural
resources use, aggravated market failures and natural resources degradation by private or
public users. Policy provides guidelines for society to act in certain ways or provides a
sense of direction to achieve certain goals. Therefore in respect to natural resources, policy
usually provides principles or direction as to how society uses the resources to achieve
certain national development goals. Resource degradation may result from policy failure in
three ways;
• Broad macro-economic and fiscal policies can influence how people use natural
resource production inputs. For example the budget allocated to catchment
management for specific sites is often used to meet recurrent expenditure. Tana
and Athi Rivers Development Authority (TARDA) and Kerio Valley
Development Authority (KVDA) for example, receive annually about Kshs. 55
million (US $ 0.69 million) and Ksh 45 million (US $ 0.56 million) for catchment
rehabilitation respectively from the Kenya Energy Generating Company
(KenGen). The allocations, nevertheless, are largely used to pay staff salaries
and/or meet recurrent costs that might not be related to catchment protection
(Mogaka et al., 2003).
• Regulatory policies governing natural resources may not be adequate to correct
market failure
• Conservation policies may be poorly designed and implemented
25
3.2 The importance of non-market institutions
Institutions (non-market institutions) are simply defined as rules of conduct that facilitate
coordination or govern relationships between individuals or groups in a society. Broadly,
they consist of cognitive, normative, and regulative structures and activities that provide
stability and meaning to social behaviour. North (1995), an institutional economist,
provides a rules-based definition that identifies institutions as the rules of the game of a
society, or more formally, as the humanly devised constraints that structure human
interaction. According to this definition institutions are composed of both formal rules
(constitutions, laws, property rights) and informal constraints (norms of behaviour,
sanctions, taboos, codes of conduct)’. To distinguish institutions from organizations,
North (1995) explains that the latter are the ‘players or groups of individuals (political
parties, a regulatory agency, etc) bound by a common purpose to achieve objectives’.
Institutions play an important part in effective natural resource and environmental
management. Institutional failure is more often than not a major contributor to natural
resources degradation and loss. Legislation usually defines broad issues, sets objectives
and definitions, and identifies the legal mandate of the government and other
stakeholders in conservation. Supporting regulations define how the legislation will be
implemented through specific rules, incentives, fees for users, penalties for non-
compliance and technical procedures.
Institutions are also important because they limit human actions in recurring or repeated
interaction, in that, particular behaviour is forbidden, encouraged or allowed. They enable
reliable expectations on other players and reduce the enforcement and monitoring costs of
economic transactions. They also allow development of particular behaviour, which,
because of high insecurity, would not otherwise be realized without institutions, e.g.
prevention of hunting in protected areas.
Some important formal institutions in natural resource management include legislative
measures and decrees – these measures may be in form of legislations (Acts of
Parliament) and Presidential Decrees which may have little do with the market forces.
Such provisions are adopted as a way of addressing threats to environmental and natural
26
resources caused by incomplete markets or market failure. In Kenya for example, there
are about 76 pieces of legislation that affect environmental and natural resources. Such
provisions define penalty levels; uses of specific ecosystems; access, use and control. The
Forest Act (CAP 365) for example defines the penalties imposed on illegal forest users,
types of forest exploitation while the Wildlife Act bans all extractive activities within
protected wildlife conservation areas.
Informal institutions include socio-cultural or traditional norms – within the context of
traditionally governed environmental and natural resources, socio-cultural measures on
conservation have been applied for several decades. In this context, traditionally accepted
norms, rules and standards have been adopted to regulate access and use of natural
resources. Resource allocation and value is hence based local norms. As means of
resource allocation, fairness and equity is evident in areas where the social fabric has
remained intact while erosion of the traditional system impacts negatively on resources
allocation.
Institutions may fail due to;
• Unsupported policy (policies not supported by legislation cannot be legally
enforced) – the case of the Forest Policy has been reversed severally since 1994
demonstrates a case in which there is a divergence between policy and the
supportive legal framework. The Forest Bill (2004) aimed at supporting the
current Forest Policy was rejected by Parliament in 2004 and is yet to be
reintroduced for debate in Parliament. The Environmental Management and
Coordination Act (EMCA, 1999) is yet to be fully enforced due to the absence of
other supporting regulations, standards and guidelines.
• Inadequate legal framework – in some cases, legislation and supporting
regulations can also be outdated. Patterns of natural resource use, pressures and
conflicts are always changing and it is important that legal instruments and
institutions also evolve. The case of the Forest Policy and Bill are still evident
cases. The current Forest Policy was under revision for over 10 years (1990 –
2004) while the Bill was last revised in 1982.
27
Box 3: Consequences of under-pricing
water supply
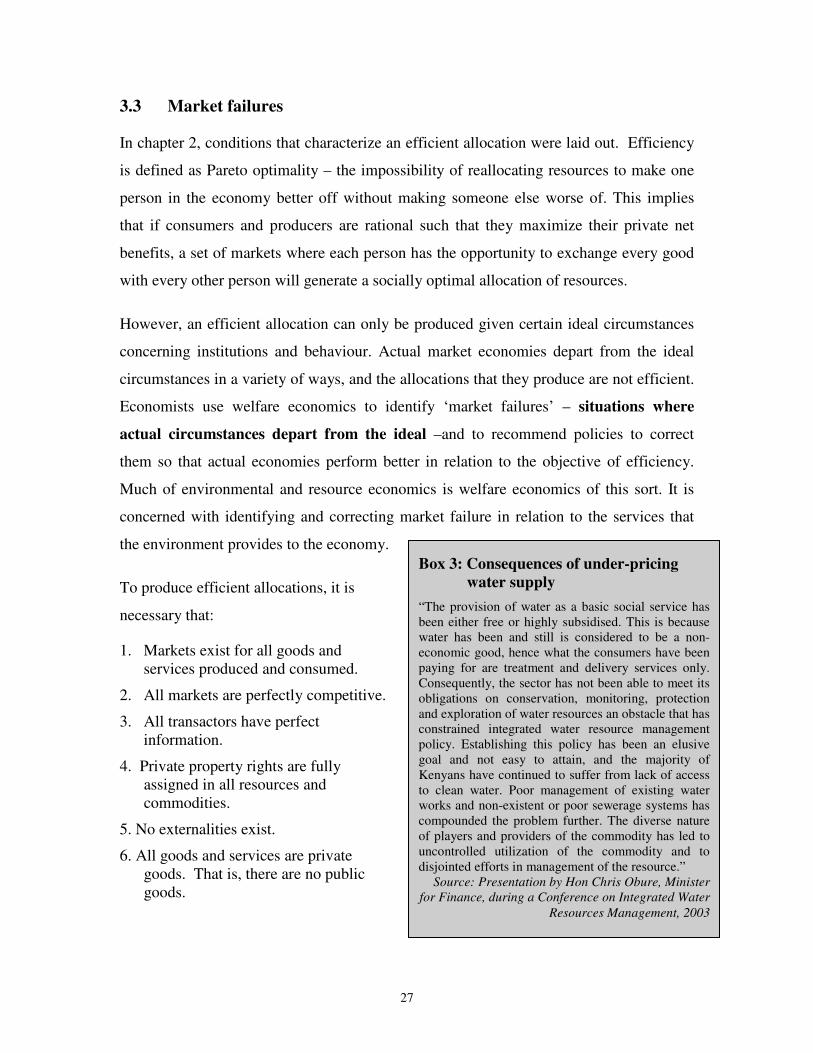
“The provision of water as a basic social service has been either free or highly subsidised. This is because water has been and still is considered to be a non-economic good, hence what the consumers have been paying for are treatment and delivery services only. Consequently, the sector has not been able to meet its obligations on conservation, monitoring, protection and exploration of water resources an obstacle that has constrained integrated water resource management policy. Establishing this policy has been an elusive goal and not easy to attain, and the majority of Kenyans have continued to suffer from lack of access to clean water. Poor management of existing water works and non-existent or poor sewerage systems has compounded the problem further. The diverse nature of players and providers of the commodity has led to uncontrolled utilization of the commodity and to disjointed efforts in management of the resource.”
Source: Presentation by Hon Chris Obure, Minister
for Finance, during a Conference on Integrated Water
Resources Management, 2003
3.3 Market failures
In chapter 2, conditions that characterize an efficient allocation were laid out. Efficiency
is defined as Pareto optimality – the impossibility of reallocating resources to make one
person in the economy better off without making someone else worse of. This implies
that if consumers and producers are rational such that they maximize their private net
benefits, a set of markets where each person has the opportunity to exchange every good
with every other person will generate a socially optimal allocation of resources.
However, an efficient allocation can only be produced given certain ideal circumstances
concerning institutions and behaviour. Actual market economies depart from the ideal
circumstances in a variety of ways, and the allocations that they produce are not efficient.
Economists use welfare economics to identify ‘market failures’ – situations where
actual circumstances depart from the ideal –and to recommend policies to correct
them so that actual economies perform better in relation to the objective of efficiency.
Much of environmental and resource economics is welfare economics of this sort. It is
concerned with identifying and correcting market failure in relation to the services that
the environment provides to the economy.
To produce efficient allocations, it is
necessary that:
1. Markets exist for all goods and services produced and consumed.
2. All markets are perfectly competitive.
3. All transactors have perfect information.
4. Private property rights are fully assigned in all resources and commodities.
5. No externalities exist.
6. All goods and services are private goods. That is, there are no public goods.
28
7. All utility and production functions are ‘well behaved’.
8. All agents are maximizers.
Clearly, condition 1 is fundamental in natural resources. If there are goods and services
for which markets do not exist, then the market system cannot produce an efficient
allocation, as that concept applies to all goods and services that are of interest to any
agent, either as utility or production function arguments. Further, condition 4 is necessary
for condition 1- a market in a resource or commodity can only exist where there are
private property rights in that resource or commodity.
3.4 Sources of market failures
Sources of market failure arise due to the absence of the conditions stated above. Some
examples are considered here below:
Externalities: An externality occurs when an agent making a decision does not bear all
of the consequences of his action. An example is when forest products processing
industries spew emissions into the air. In this case all the benefits are at private level
while the social cost is not fully internalised – the pollution brings direct costs to society.
Cases of increased respiratory ailments and reduced fisheries resources are evident within
and around Webuye and river Nzoia respectively in Western Kenya. Forest plantation
exploitation in many occasions exposes soils to erosion. Also, with alluvial gold panning
(although of limited quantities in and around Kakamega forest), the market price for gold
excludes the environmental costs of river siltation due to poor panning practices and
contamination through the use of mercury to separate gold. There are however also
positive externalities including; e. g. fishing and tourism benefits after the construction of
irrigation dams, bee keeping which impacts on pollination, reduced siltation from
woodlot establishment and forestry management. Experience shows that negative
externalities are more abundant than positive ones. The focus should be therefore on
negative externalities in natural resources planning and development.
Market imperfections: monopoly/oligopoly, lack of access to credit can prevent farmers
from conducting investments in soil conservation.
29
Improperly designed property rights regimes: Property rights are a bundle of
entitlements defining owner’s rights, privileges, and limitations for the use of a
resource.A structure of property rights produces efficient allocations in a well-
functioning market economy if it has the following four main characteristics:
1. Universality: All resources should be owned or ownable by someone (except resources
so plentiful that everyone can consume without reducing availability to others)
2. Exclusivity: All benefits and costs accrued as a result of owning and using the
resources should accrue to the owner, and only to the owner, either directly or
indirectly by sale to others.
3. Transferability: All property rights should be transferable from one owner to another
in a voluntary exchange.
4. Enforceability: Property rights should be secure from involuntary seizure or
encroachment by others.
An owner of a resource with such property rights has powerful incentives to manage the resource
efficiently because a decline in the value of the resource represents a personal loss.
Most of the natural resources are either open access resources or public goods. Open
Access Resources: defined as resources that are not managed or controlled by anyone.
Access is not restricted, and therefore, the resources can be exploited on a first-come,
first-served basis. Examples: water in rivers and oceans, grazing lands, fisheries, tropical
rainforests, migratory animal species, etc. This is common where land has no specific
property rights like for example communal grazing areas, overgrazing. Open access
situation should be distinguished from Common property resources. Many authors
confuse this with Hardin’s famous ‘Tragedy of the commons’. Common property
resources are resources owned collectively by a well-defined group of individuals, which
may then set up rules to control access to and use of the resource.
Public goods resources are resources which exhibit non-rivalry in consumption and are
fully accessible to all (non-excludability). Non-rivalry in consumption: defined as
person’s consumption of a good does not diminish the amount available to others. E.g.
30
beautiful landscapes, clean air, global climate, biological diversity in some cases there
may be private provision of a public good (e.g., Nature Conservancy, demand for eco-
labeled products), but this provision is likely to be less than the efficient amount.
Property rights have to be enforced. When property rights are not enforced this leads to
encroachment /illegal access, e.g. in Mau forests and Mount Kenya Forest
They have also to be transferable: lack of legalization of property rights precludes option of
selling the land. Incentives for investment are reduced due to ‘shorter time horizon’ than
“social planner”.
Divergence of social and private discount rates: Optimal social discount rate is object
of much discussion. Reasons why private discount rate may exceed social discount rate
include poverty, risks (e.g. if individuals are afraid of expropriation or other harmful
government actions), imperfect credit markets. Private discount rates are often higher,
leading to faster extraction of resources than socially optimal ones.
Lack of information/knowledge: environmental impacts, alternative technologies, costs
and benefits. Market failure occurs because there are no prices at all for natural resources
or environmental goods and services. Environmental services that are yet to be directly
priced include ecological services, flood control, carbon sequestration, influence on
microclimate and provision of genetic material or base.
3.5 Property rights regimes and emergence of different management
approaches of natural resources
Property rights systems or regimes comprise of two components: property rights as the
bundles of entitlements regarding resource use, and property rules as the rules under which
those entitlements are exercised. As we have seen, an important aspect of property rights is
whether they are appropriately assigned or are left either undefined or inappropriately
specified. Further, as have already seen in the previous section, property rights can only be
considered efficient if they satisfy some basic properties, including divisibility,
transferability and enforceability. Thus, depending on the assignment of property rights and
31
the incentives of compliance which induce users to cooperate in the management of natural
resources, four property systems or regimes can be distinguished. These systems, as drawn
from Bromley (1991: are:
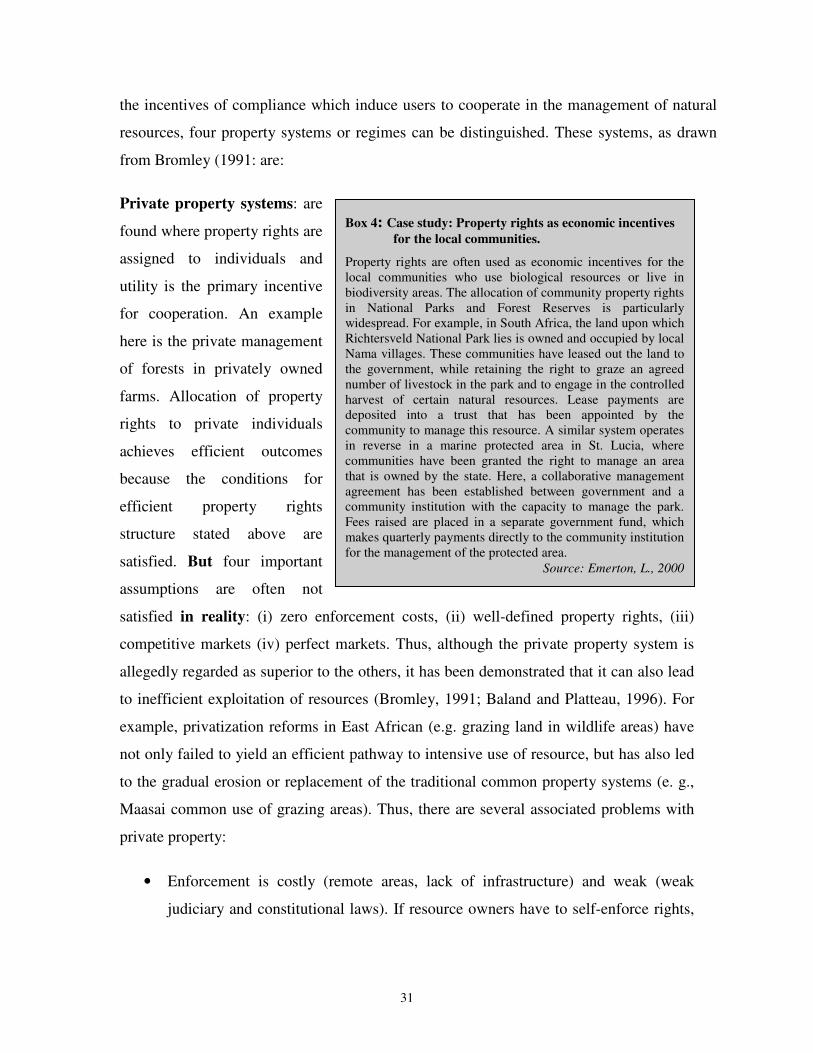
Private property systems: are
found where property rights are
assigned to individuals and
utility is the primary incentive
for cooperation. An example
here is the private management
of forests in privately owned
farms. Allocation of property
rights to private individuals
achieves efficient outcomes
because the conditions for
efficient property rights
structure stated above are
satisfied. But four important
assumptions are often not
satisfied in reality: (i) zero enforcement costs, (ii) well-defined property rights, (iii)
competitive markets (iv) perfect markets. Thus, although the private property system is
allegedly regarded as superior to the others, it has been demonstrated that it can also lead
to inefficient exploitation of resources (Bromley, 1991; Baland and Platteau, 1996). For
example, privatization reforms in East African (e.g. grazing land in wildlife areas) have
not only failed to yield an efficient pathway to intensive use of resource, but has also led
to the gradual erosion or replacement of the traditional common property systems (e. g.,
Maasai common use of grazing areas). Thus, there are several associated problems with
private property:
• Enforcement is costly (remote areas, lack of infrastructure) and weak (weak
judiciary and constitutional laws). If resource owners have to self-enforce rights,
Box 4: Case study: Property rights as economic incentives
for the local communities.
Property rights are often used as economic incentives for the local communities who use biological resources or live in biodiversity areas. The allocation of community property rights in National Parks and Forest Reserves is particularly widespread. For example, in South Africa, the land upon which Richtersveld National Park lies is owned and occupied by local Nama villages. These communities have leased out the land to the government, while retaining the right to graze an agreed number of livestock in the park and to engage in the controlled harvest of certain natural resources. Lease payments are deposited into a trust that has been appointed by the community to manage this resource. A similar system operates in reverse in a marine protected area in St. Lucia, where communities have been granted the right to manage an area that is owned by the state. Here, a collaborative management agreement has been established between government and a community institution with the capacity to manage the park. Fees raised are placed in a separate government fund, which makes quarterly payments directly to the community institution for the management of the protected area.
Source: Emerton, L., 2000
32
they may have an incentive to overexploit to reduce benefits to potential
encroachers and thus reduce enforcement costs.
• Privatization does not account for local, regional, or international externalities.
• Forests often need to be managed in their entirety in order to maintain their
ecological functioning.
• Common use of a forest may be preferable to reduce the individual users’ risks in
areas where the location of the most productive zones can vary from year to year
(e.g., woodlands in arid areas).
• Privatization usually implies that some former users are excluded, which may
have undesirable equity and poverty implications. Evidence in literature indicates
that land distribution under common and communal property regimes in several
African and Asian countries tended to be more equitable than in private property
regimes.
Common property: exist where property rights are assigned to groups or communities,
and collective action, based on voluntary or normative incentives is required for the
management of the resources. There is a recent trend towards devolution of rights and
responsibilities over common pool resources from state to local communities or user
groups, resulting in common property (full transfer of property rights).
This system has several advantages:
• Collective management rules, informal courts and sanctions established by user
groups can provide a cost-effective alternative to government control.
• Local communities may have better information about local conditions.
• Compared to private property, communities may be better able to deal with local
externalities, to exploit risk-sharing benefits from exploiting the forest resource
jointly, and to provide a more equitable distribution of benefits.
33
Problems:
• Community has no incentive to internalize regional and international externalities.
• Devolution is often incomplete in the sense that the state retains some rights over
the forest or share of the benefits, leaving communities with reduced or uncertain
incentives to consider the long-run effects of their actions.
• It is naïve to think of local communities as homogenous groups, automatically
acting in the interest of the whole. Achieving even a locally efficient level of
resource management requires collective action on part of individual community
members, i.e. their ability to agree on and enforce a cooperative and efficient set
of access and use rules (Ostrom, 1990). Otherwise, common property, similar to
open access, would result in over-exploitation as each individual does not
consider the impact of his action on resource availability to other users.
Conditions thought to be conducive to collective action: small group size, social
and cultural homogeneity, problem severity, high existing social capital,
consistent impacts2, low discount rates, and low transaction costs are widely seen
as conducive for collective action.
• Devolution may lead to rent-seeking activities by community elites and prevent
the state from exercising an important role in assuring the inclusion of
marginalized groups.
State property exists where property rights are assigned to the state and cooperation is
enforced, with sanctions and penalties as the primary incentives. Many forests and wildlife
areas in Kenya are traditionally under state property. This gives rise to protected areas.
Advantage:
• centralized management can account for local and regional externalities
• state may have better scientific knowledge about technologies, sustainable
management, etc. (controversial since traditional knowledge is also needed)
2 Consistent impacts refers to a situation where most individuals will be affected in similar ways by the proposed management changes.
34
Problems:
• Very high transaction costs and information problems associated with the design of
effective usage rules, monitoring and enforcement at the local level.
• Governments may optimally tolerate some illegal logging in the face of monitoring
and enforcement costs.
• State property often degenerates into de facto open access, particularly in frontier
areas that are located far from markets and government administrative centers.
• Forest-dependent communities often have customary rights to the forest which cannot
be ignored by the state. A lack of formalization of these rights under a state property
regime induces a strong degree of tenure insecurity on part of local forest users.
• The failure of governments to enforce property rights is, however, not only due to the
costliness associated with monitoring and enforcement, but also with political-
economy considerations and policy failure. This is highlighted by recent evidence
that illegal activities have not decreased (and may even have increased) in the
aftermath of decentralization reforms, although the transfer of forest management
responsibilities to local governments should have reduced monitoring and
enforcement costs. In general, reasons for policy failure to enforce property rights
include the desire to relieve social pressure through settlement policies, strong
lobbying potential of large logging companies, as well as rent-seeking and corruption
on part of government officials.
Open access system or non-property regime emerges if no property rights have been
assigned to the resources (see earlier discussion on open access resources).
It is important to note that the four systems do not exist as opposing types but rather as
combinations along a spectrum from open access to private ownership. Although the
outcome of open access has acceptably been acknowledged as the “tragedy of the commons”,
none of the other three systems can singly be prescribed as a remedy (in all situations) to the
problem of natural resource management. Thus there has been a tendency to combine the
common property and the state property to give raise of partnerships or collaborative
management (in short, co-management). Co-management emerges when various
35
stakeholders agree on sharing among themselves the management functions, rights and
responsibilities for a given territory, area, or a set of resources which may or may not have
protected area status. It is seen as an arrangement whereby a community, or a group of
resource users, and a conservation authority collaborate to jointly manage a resource or an
area that has conservation value. Examples in Kenya include the establishment of sanctuaries
through wildlife partnerships (e.g. Kimana sanctuary in on the dispersal areas of Amboseli
National Park).
3.6 Political economy considerations
Political approaches provide ways to come to grips with the fact that current issues of
economic reform are highly charged both politically and ideologically and that any
attempt to redesign economic systems must find ways to neutralize or incorporate
competing politcal forces. Thus political appraoches are in important since correcting
environmental problem has distributional impacts. Policy makers follow their own
individual objectives (e.g., own income maximization, re-election, power, survival) rather
than social welfare maximization. As a consequence there emerges lobbying by powerful
interest groups and rent-seeking/corruption.
3.7 Discussion questions
1. How do you think market failures from the discussed sources can be corrected?
2. Other than property rights’ attributes, what do you think would influence
achievement of an optimal property regime?
3. Discuss examples in Kenya where state property has often degenerates into de facto
open access.
36
PART B: Economic Valuation Concepts and Methods
4. Introduction to Economic Valuation of Natural Resources
and Biodiversity
4.1 Definition of economic valuation and its importance
Valuation can simply be defined “as an attempt to put monetary values or to
environmental goods and services or natural resources”. It is a key exercise in economic
analysis and its results provide important information about values of environmental
goods and services. This information can be used to influence decisions about wise use
and conservation of forests and other ecosystems. The basic aim of valuation is to
determine people’s preferences by gauging how much they are willing to pay (WTP) for
given benefits or certain environmental attributes e.g. keep a forest ecosystem intact. In
other words, valuation also tries to gauge how much worse off they would consider
themselves to be as a result of changes in the state of the environment such as
degradation of a forest.
Economic valuation never refers to a stock, but only the change in a stock. If one speaks
of the economic value of biodiversity, then one always means the economic value of a
change of biodiversity. It is not a question of determining the ‘true’ value of biodiversity
or ecosystems but valuing changes and comparing them with their alternatives, e.g.
with a golf course vs without a golf course. Thus it is non-sense to ask “how much are the
African National Parks worth?”. A plausible question in this case would be: ‘WWF has
proposed a new policy to prevent the huge losses of wildlife species from African
National Parks. What is the monetary value of the benefits of this policy (i.e., the
economic damages avoided)? Economists thus stress that the valuation should focus on
changes rather than levels of biodiversity or ecosystem. Non-economists have
frequently tried to value biodiversity levels, for instance, the recent example of value
assessment of ecosystem services and natural capital for the entire biosphere level
(Costanza et al., 1998). However, economic-theoretical support for such a valuation
37
approach is weak. The reasons are that willingness to pay (WTP), or willingness to
accept, are based on compensation or equivalence variations of a change, and that
change should be relatively small in comparison with income levels.
The policy relevance of valuation information is extensive, but might include:
• demonstrating the value of biodiversity: awareness raising;
• land use decisions: for conservation or other uses;
• setting priorities for biodiversity conservation (within a limited budget);
• limiting biodiversity invasions;
• assessing biodiversity impacts of non-biodiversity investments;
• determining damages for loss of biodiversity: liability regimes;
• limiting or banning trade in endangered species;
• revising the national economic accounts;
• choosing economic instruments for saving biodiversity (e.g. taxes, subsidies).
Valuation has an important role to play in environmental planning and management
activities because it helps to answer many questions including the following about any
given natural resource:
• What is the value of conserving a certain natural resource (e.g. forest)? (see for
example Box 5.
• To whom does the value accrue?
• How does degradation and loss of the natural resource lead to costs to different
segments of society?
• Who gains and who loses when a natural resource is conserved or degraded?
• How can natural resource conservation be efficiently and equitably financed?
• How can people be motivated to take into account natural resource benefits and costs
of its loss in the course of their economic activities
• How can policy, planning and decision making with regard to natural resources be
better influenced?
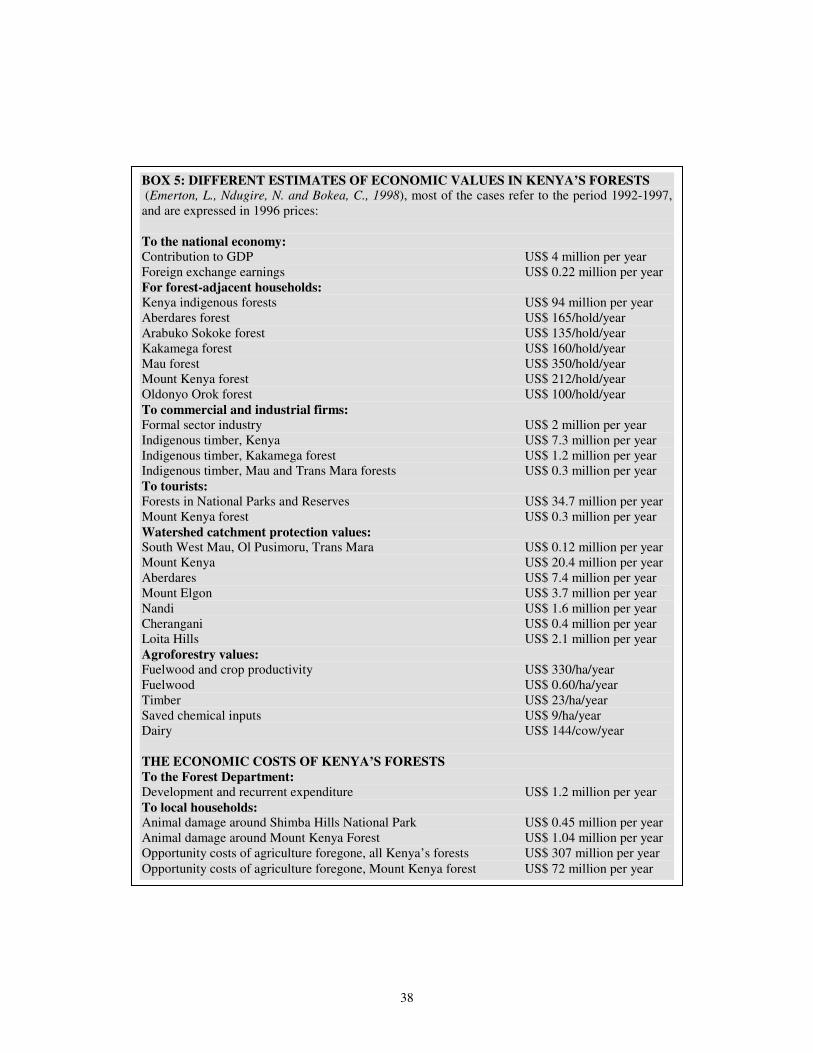
38
BOX 5: DIFFERENT ESTIMATES OF ECONOMIC VALUES IN KENYA’S FORESTS (Emerton, L., Ndugire, N. and Bokea, C., 1998), most of the cases refer to the period 1992-1997, and are expressed in 1996 prices:
To the national economy:
Contribution to GDP US$ 4 million per year Foreign exchange earnings US$ 0.22 million per year For forest-adjacent households:
Kenya indigenous forests US$ 94 million per year Aberdares forest US$ 165/hold/year Arabuko Sokoke forest US$ 135/hold/year Kakamega forest US$ 160/hold/year Mau forest US$ 350/hold/year Mount Kenya forest US$ 212/hold/year Oldonyo Orok forest US$ 100/hold/year To commercial and industrial firms:
Formal sector industry US$ 2 million per year Indigenous timber, Kenya US$ 7.3 million per year Indigenous timber, Kakamega forest US$ 1.2 million per year Indigenous timber, Mau and Trans Mara forests US$ 0.3 million per year To tourists:
Forests in National Parks and Reserves US$ 34.7 million per year Mount Kenya forest US$ 0.3 million per year Watershed catchment protection values: South West Mau, Ol Pusimoru, Trans Mara US$ 0.12 million per year Mount Kenya US$ 20.4 million per year Aberdares US$ 7.4 million per year Mount Elgon US$ 3.7 million per year Nandi US$ 1.6 million per year Cherangani US$ 0.4 million per year Loita Hills US$ 2.1 million per year Agroforestry values:
Fuelwood and crop productivity US$ 330/ha/year Fuelwood US$ 0.60/ha/year Timber US$ 23/ha/year Saved chemical inputs US$ 9/ha/year Dairy US$ 144/cow/year
THE ECONOMIC COSTS OF KENYA’S FORESTS
To the Forest Department:
Development and recurrent expenditure US$ 1.2 million per year To local households: Animal damage around Shimba Hills National Park US$ 0.45 million per year Animal damage around Mount Kenya Forest US$ 1.04 million per year Opportunity costs of agriculture foregone, all Kenya’s forests US$ 307 million per year Opportunity costs of agriculture foregone, Mount Kenya forest US$ 72 million per year
39
If a valuation exercise can provide acceptable answers to the above questions, then it
goes along way to becoming a useful tool into the environmental assessment and
planning for biodiversity conservation with forest ecosystems like Kakamega.
4.2 Historical perspective of economic valuation
Development of economic evaluation of natural resources came from politics and public
authorities. It started in US 60 years ago, when the National Resources Board decided in
its Flood Control Act of 1936 that intangible follow-up impacts of their projects have to
be considered as well .
The conceptual framework for evaluation of ‘non-market services’ was developed by
Ciriacy-Wantrup (1947). His idea of an estimation of social benefits by questioning the
public (referendum) (for example in contigent valuation method- CVM) was first put
into practice by Davis (1963). In 1950 a report published by the Federal Inter-Agency
River Basin Committee and known as the "Green Book" received widespread attention
(Hanemann, 1992). The Green Book became a guide for economic evaluation of the
effects of river basin projects. It recommends either the use of market prices or, if not
possible, the use of alternative methods like accounting the expenditures of a recreationist
or his willingness to pay for a further use of the recreation facilities (as developed by
Ciriacy-Wantrup (1947).
Interest on the valuation methods expanded from water recreation into other public goods
such as wildlife, air quality or human health. However, for the following decades the
centre of development of environmental evaluation remained in the USA (mainly due to
supportive American legislation). In 1981 the National Environmental Policy Act
(NEPA) was modified by the Presidential Executive Order (EO) 12291 which claimed
the use of cost-benefit analysis for new regulations. In addition the Comprehensive
Environmental Response, Compensation and Liability Act (1980) brought environmental
damage assessment to court (Hanley and Spash, 1993).
Guidelines of the US Department of Interior (DOI, 1986) suggested the restoration or
opportunity costs as a measure for compensation. A new dimension for this kind of
40
research was the recognition of the importance of non-use values. They had to be
considered in damage assessments according to a verdict from 1989 (State of Ohio).
The Exxon Valdez oil spill in 1989 was the first possibility for a large litigation. For the
compensation assessment a vast research project was financed dealing with the CVM,
whose funds provided by both the governmental as well as from Exxon. As a
consequence of this dispute the NOAA-Panel has developed guidelines for the use of
CVM in natural resource damage assessments.
Unlike in USA, environmental valuation is much less common in Europe and other
contentinents. For example in Europe, there is a smaller number of studies as well as less
political influence. In contrast to the USA where policy evaluations are commonplace the
EU has just started in the early 1990s to use formal appraisals to asses costs and benefits
of EU Directives (Pearce, 1998). Though much academic research has been done in the
last 20 years (Navrud, 1999 counted 457 studies in the period between 1992 and 1999),
hardly any results of environmental economic analyses have found their way into politics
(Hackel and Pruckner, 2000). What about in Africa in general and Kenya in particular
(see the discussion questions).
4.3 Introduction to differents concepts of value
The term ‘value’ causes much confusion because it is used in different ways by ecologists
and economists. The former consider values as ethical measures, while the latter consider
them as ‘equivalence measures’ (value measured in monetary terms). If we are looking
for a decision aid for biodiversity conservation (what should be conserved first and how
much?) we have to concentrate on the second concept. A value measured in monetary
terms will show the importance of a project in a given society and the society’s ability to
pay for it. It can be seen as the willingness to commit resources to biodiversity
conservation. Prices are in this case indicators for the importance of conservation
programs. This information is essential for policy evaluation. Dealing with biodiversity
or other natural resources, economists cannot rely on market prices, though. The products
and resources involved are public goods and therefore non-exclusive and non-rival in
consumption. In this case market prices are unreliable indicators of social costs, because
41
they may not capture all effects of biodiversity use. However, environmental economists
have developed methods to reveal values in the presence of market failure which
incorporate external effects.
4.3.1 A typology of values
Philosophers dispute the meaning of the word ‘value’ and whether, however defined,
value resides ‘in’ the objects of interest (objective value) or is conferred upon the object
by the entity engaging in the act of valuation (subjective value). Any attempt to classify
‘types’ of value will therefore be tendentious, but the following broad categories are often
found to be helpful:
a) Instrumental or functional value (anthropocentric).
b) Intrinsic or (eco-centric)
Instrumental value derives from some objective function, goal or purpose that is being
sought. As an example, economic value relates to the goal of maximizing human well-
being (or welfare, or utility), where well-being has a particular connotation, namely that
someone’s well-being is said to be higher in situation A than situation B if they prefer A
to B. It is immediately obvious that economic value is anthropocentric and it is
preference based. This value is found in the ‘functional’ forms and ‘aesthetic’ nature of
natural resources. An instrumental element is found in the aesthetic value of the natural
resources since appreciating beauty affords pressure and a sense of well-being.
Intrinsic value is mainly a non-instrumental value. This value can further be divided into
absolute and moral values (see Figure 7). Intrinsic value is often regarded as being a
value that resides ‘in’ the asset in question, and especially environmental assets, but
which is independent of human preferences.
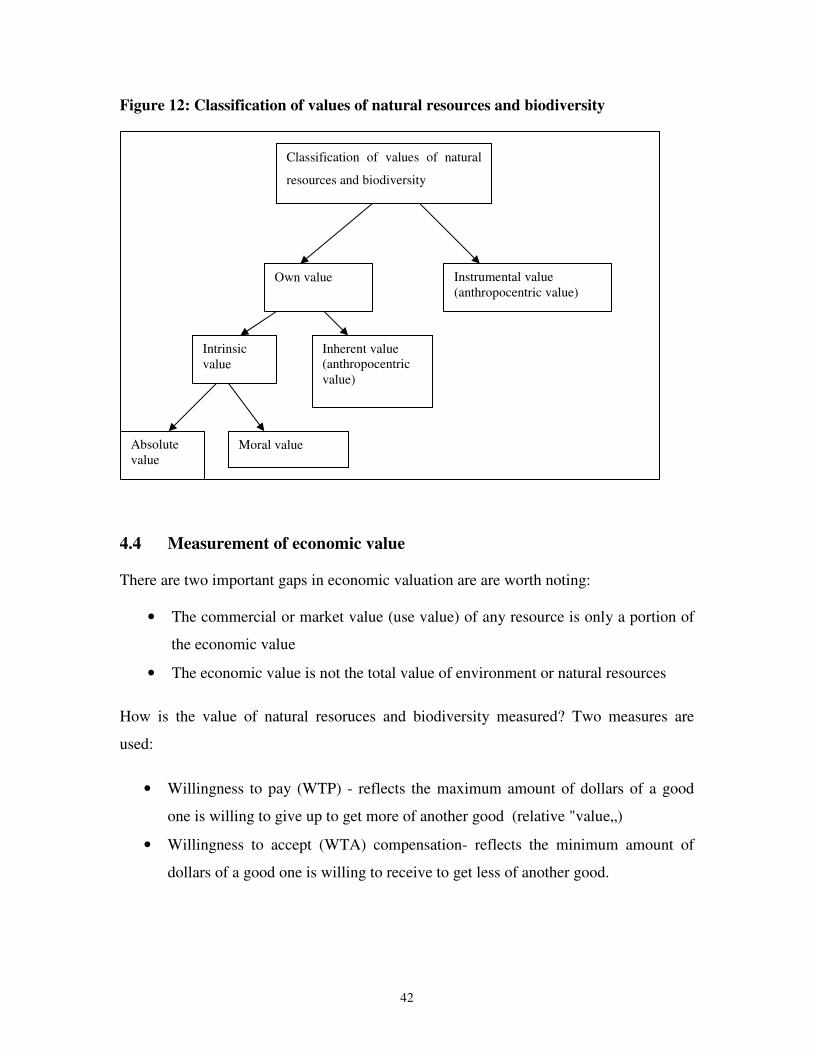
42
Figure 12: Classification of values of natural resources and biodiversity
4.4 Measurement of economic value
There are two important gaps in economic valuation are are worth noting:
• The commercial or market value (use value) of any resource is only a portion of
the economic value
• The economic value is not the total value of environment or natural resources
How is the value of natural resoruces and biodiversity measured? Two measures are
used:
• Willingness to pay (WTP) - reflects the maximum amount of dollars of a good
one is willing to give up to get more of another good (relative "value„)
• Willingness to accept (WTA) compensation- reflects the minimum amount of
dollars of a good one is willing to receive to get less of another good.
Instrumental value (anthropocentric value)
Own value
Intrinsic value
Inherent value (anthropocentric value)
Absolute value
Moral value
Classification of values of natural
resources and biodiversity
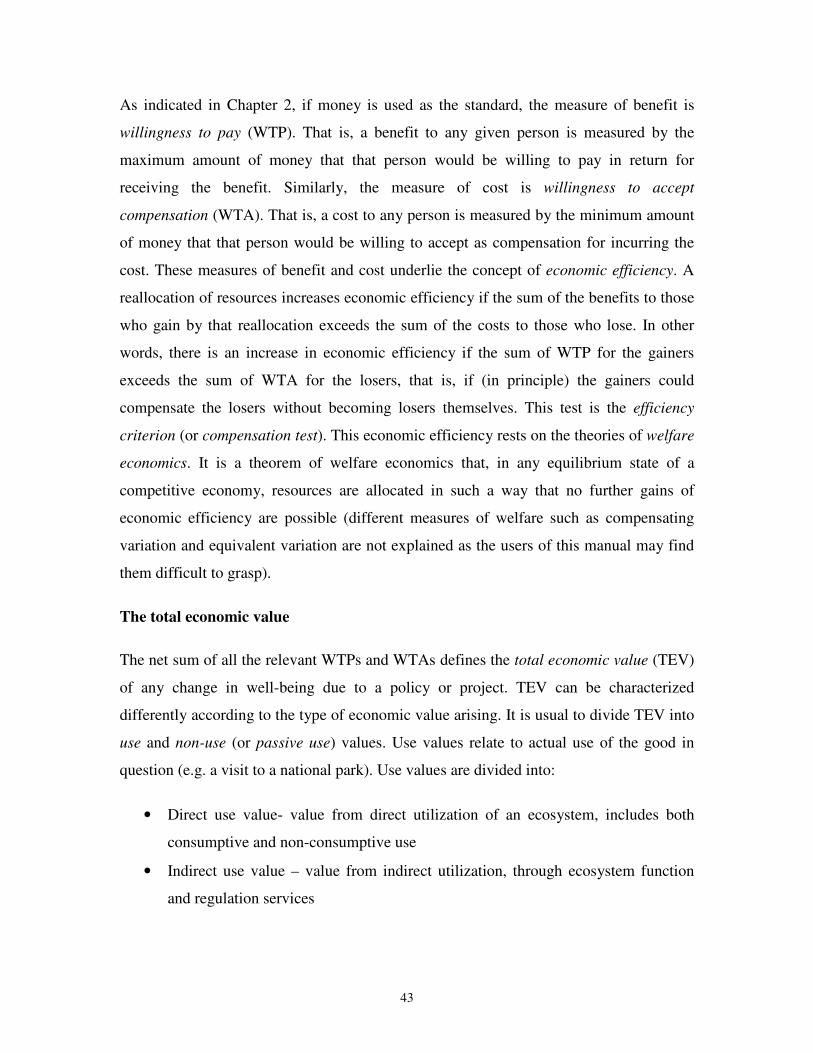
43
As indicated in Chapter 2, if money is used as the standard, the measure of benefit is
willingness to pay (WTP). That is, a benefit to any given person is measured by the
maximum amount of money that that person would be willing to pay in return for
receiving the benefit. Similarly, the measure of cost is willingness to accept
compensation (WTA). That is, a cost to any person is measured by the minimum amount
of money that that person would be willing to accept as compensation for incurring the
cost. These measures of benefit and cost underlie the concept of economic efficiency. A
reallocation of resources increases economic efficiency if the sum of the benefits to those
who gain by that reallocation exceeds the sum of the costs to those who lose. In other
words, there is an increase in economic efficiency if the sum of WTP for the gainers
exceeds the sum of WTA for the losers, that is, if (in principle) the gainers could
compensate the losers without becoming losers themselves. This test is the efficiency
criterion (or compensation test). This economic efficiency rests on the theories of welfare
economics. It is a theorem of welfare economics that, in any equilibrium state of a
competitive economy, resources are allocated in such a way that no further gains of
economic efficiency are possible (different measures of welfare such as compensating
variation and equivalent variation are not explained as the users of this manual may find
them difficult to grasp).
The total economic value
The net sum of all the relevant WTPs and WTAs defines the total economic value (TEV)
of any change in well-being due to a policy or project. TEV can be characterized
differently according to the type of economic value arising. It is usual to divide TEV into
use and non-use (or passive use) values. Use values relate to actual use of the good in
question (e.g. a visit to a national park). Use values are divided into:
• Direct use value- value from direct utilization of an ecosystem, includes both
consumptive and non-consumptive use
• Indirect use value – value from indirect utilization, through ecosystem function
and regulation services
44
Non-use value refers to willingness to pay to maintain some good in existence even
though there is no actual, planned or possible use. The types of non-use value could be
various, but a convenient classification is in terms of (a) existence value and (b) bequest
value.
• Existence value refers to the WTP to keep a good in existence in a context where
the individual expressing the value has no actual or planned use for his/herself or
for anyone else. Motivations here could vary and might include having a feeling
of concern for the asset itself (e.g. a threatened species) or a ‘stewardship’ motive
whereby the valuer feels some responsibility for the asset. Some people simply
want to know that something exists (Alaskan wilderness area), even if they will
never see it or use it.
• A bequest value refers to WTP to preserve the environment for the benefit of our
children and grandchildren (the next and future generations)
Between the two groups (use and non-use values) one can find the option value- people
are not sure about their future demand for a service and they would like to maintain the
environment in order to use it at a later time. This value will become a use value in the
future, e.g. new sorts or drugs derived form genetic information of wild species.
Thus, TEV =use value +non-use value + option value
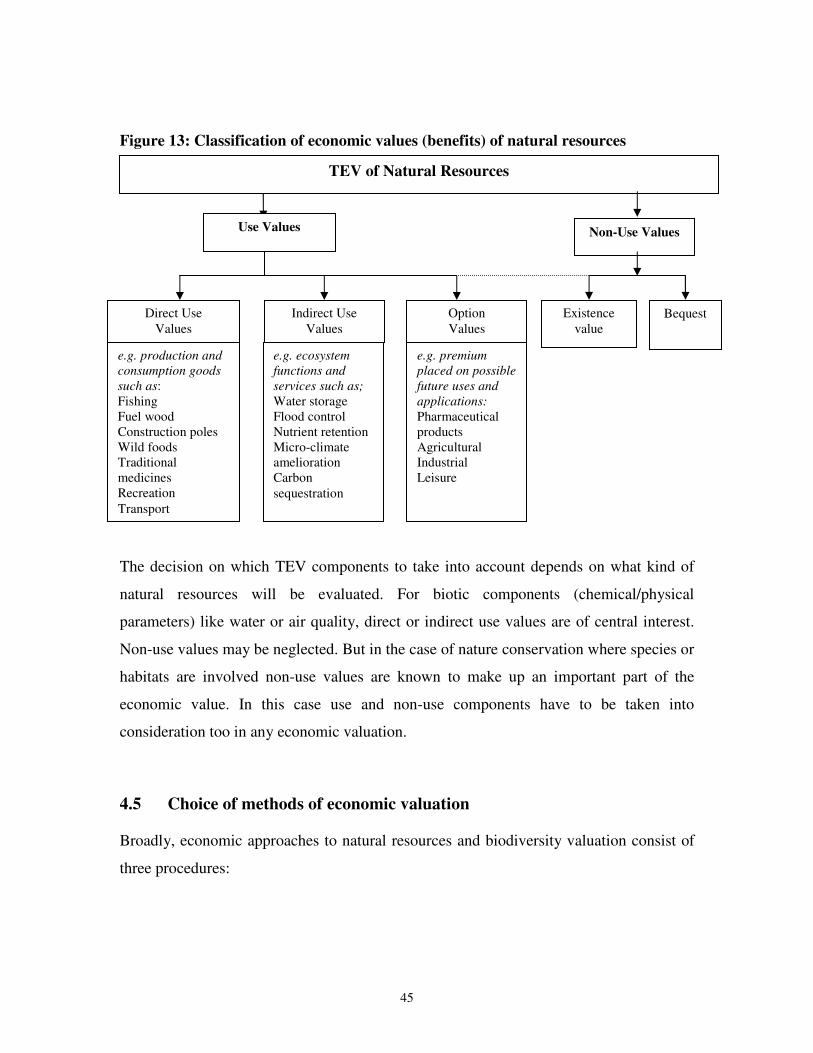
45
Figure 13: Classification of economic values (benefits) of natural resources
The decision on which TEV components to take into account depends on what kind of
natural resources will be evaluated. For biotic components (chemical/physical
parameters) like water or air quality, direct or indirect use values are of central interest.
Non-use values may be neglected. But in the case of nature conservation where species or
habitats are involved non-use values are known to make up an important part of the
economic value. In this case use and non-use components have to be taken into
consideration too in any economic valuation.
4.5 Choice of methods of economic valuation
Broadly, economic approaches to natural resources and biodiversity valuation consist of
three procedures:
Use Values
Existence value
TEV of Natural Resources
Direct Use Values
Option Values
Non-Use Values
e.g. production and
consumption goods
such as: Fishing Fuel wood Construction poles Wild foods Traditional medicines Recreation
Transport
e.g. ecosystem
functions and
services such as;
Water storage Flood control Nutrient retention Micro-climate amelioration Carbon sequestration
e.g. premium
placed on possible
future uses and
applications:
Pharmaceutical products Agricultural Industrial Leisure
Bequest Indirect Use Values
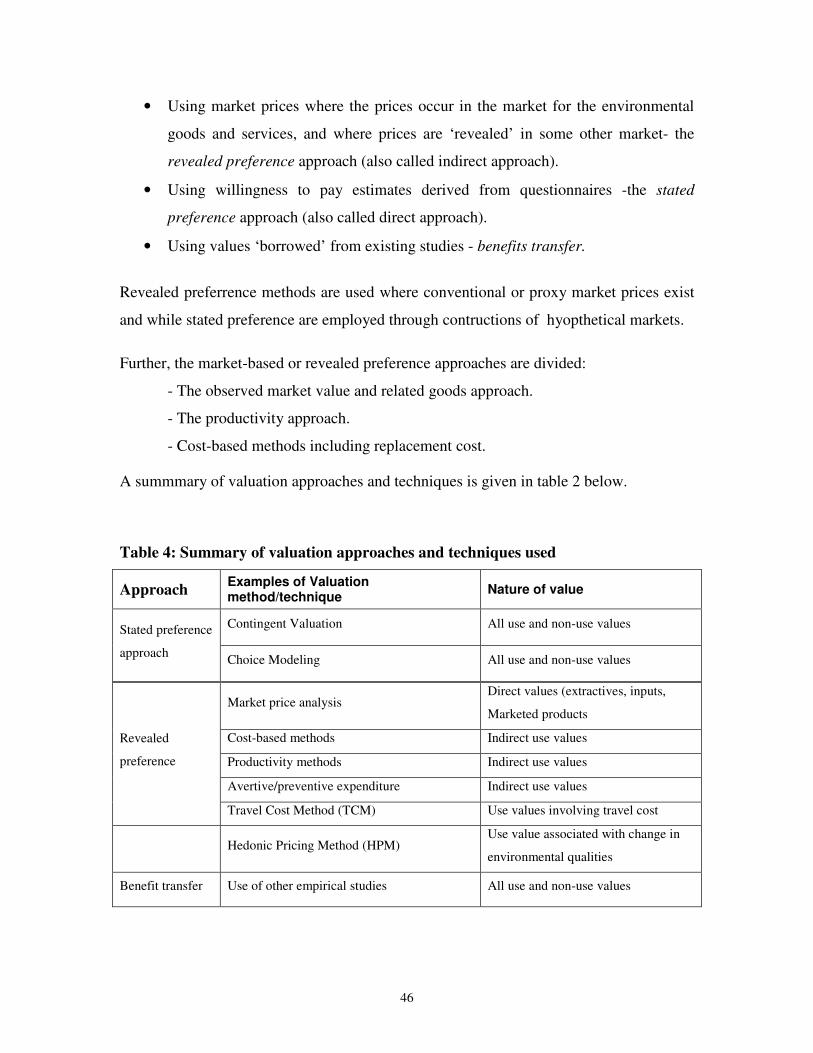
46
• Using market prices where the prices occur in the market for the environmental
goods and services, and where prices are ‘revealed’ in some other market- the
revealed preference approach (also called indirect approach).
• Using willingness to pay estimates derived from questionnaires -the stated
preference approach (also called direct approach).
• Using values ‘borrowed’ from existing studies - benefits transfer.
Revealed preferrence methods are used where conventional or proxy market prices exist
and while stated preference are employed through contructions of hyopthetical markets.
Further, the market-based or revealed preference approaches are divided:
- The observed market value and related goods approach.
- The productivity approach.
- Cost-based methods including replacement cost.
A summmary of valuation approaches and techniques is given in table 2 below.
Table 4: Summary of valuation approaches and techniques used
Approach Examples of Valuation method/technique
Nature of value
Contingent Valuation All use and non-use values Stated preference
approach Choice Modeling All use and non-use values
Market price analysis Direct values (extractives, inputs,
Marketed products
Cost-based methods Indirect use values
Productivity methods Indirect use values
Avertive/preventive expenditure Indirect use values
Revealed
preference
Travel Cost Method (TCM) Use values involving travel cost
Hedonic Pricing Method (HPM) Use value associated with change in
environmental qualities
Benefit transfer Use of other empirical studies All use and non-use values
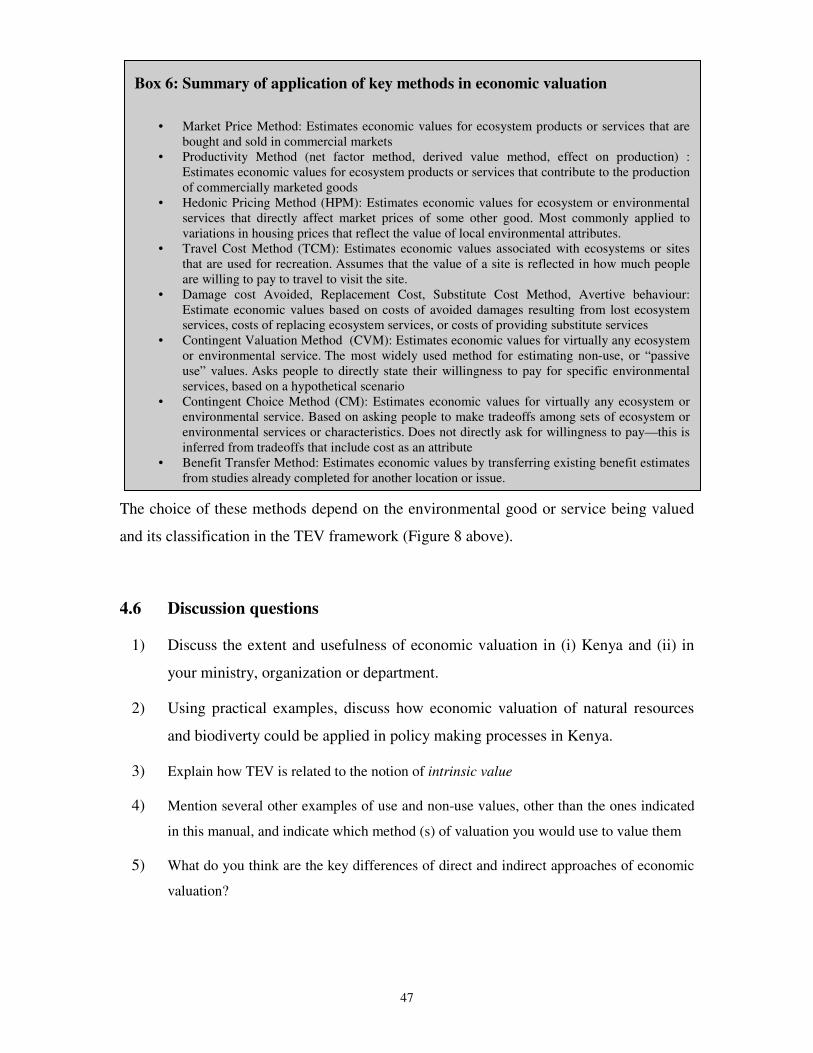
47
Box 6: Summary of application of key methods in economic valuation
• Market Price Method: Estimates economic values for ecosystem products or services that are bought and sold in commercial markets
• Productivity Method (net factor method, derived value method, effect on production) : Estimates economic values for ecosystem products or services that contribute to the production of commercially marketed goods
• Hedonic Pricing Method (HPM): Estimates economic values for ecosystem or environmental services that directly affect market prices of some other good. Most commonly applied to variations in housing prices that reflect the value of local environmental attributes.
• Travel Cost Method (TCM): Estimates economic values associated with ecosystems or sites that are used for recreation. Assumes that the value of a site is reflected in how much people are willing to pay to travel to visit the site.
• Damage cost Avoided, Replacement Cost, Substitute Cost Method, Avertive behaviour: Estimate economic values based on costs of avoided damages resulting from lost ecosystem services, costs of replacing ecosystem services, or costs of providing substitute services
• Contingent Valuation Method (CVM): Estimates economic values for virtually any ecosystem or environmental service. The most widely used method for estimating non-use, or “passive use” values. Asks people to directly state their willingness to pay for specific environmental services, based on a hypothetical scenario
• Contingent Choice Method (CM): Estimates economic values for virtually any ecosystem or environmental service. Based on asking people to make tradeoffs among sets of ecosystem or environmental services or characteristics. Does not directly ask for willingness to pay—this is inferred from tradeoffs that include cost as an attribute
• Benefit Transfer Method: Estimates economic values by transferring existing benefit estimates from studies already completed for another location or issue.
The choice of these methods depend on the environmental good or service being valued
and its classification in the TEV framework (Figure 8 above).
4.6 Discussion questions
1) Discuss the extent and usefulness of economic valuation in (i) Kenya and (ii) in
your ministry, organization or department.
2) Using practical examples, discuss how economic valuation of natural resources
and biodiverty could be applied in policy making processes in Kenya.
3) Explain how TEV is related to the notion of intrinsic value
4) Mention several other examples of use and non-use values, other than the ones indicated
in this manual, and indicate which method (s) of valuation you would use to value them
5) What do you think are the key differences of direct and indirect approaches of economic
valuation?
48
5. Revealed Preference Methods
This chapter provides training on the theory and practical applications of the following
revealed preference methods of valuation of environmental goods/ natural resources. The
methods discussed here include:
• Market-based methods
o Direct market prices
o Market prices of alternatives or substitutes
• Human capital
• Production function/ productivity method
• Travel cost method
• Hedonic pricing
• Cost based methods
o Damage avoided
o Replacement costs
o Preventive/ averting expenditure
5.1 Market-price based approaches
Introduction
Market prices are the result of interaction between consumers and producers with regards
to the demand and supply of goods and services. If this transaction is carried out using
currency, the value established within the market is the market price.
The market price method estimates the economic value of ecosystem products or services
that are bought and sold in commercial markets. When services are directly tradable in
normal markets, the price represents the exchange value. The market price method can be
49
used to value changes in either the quantity or quality of a good or service. It uses
standard economic techniques for measuring the economic benefits from marketed goods,
based on the quantity people purchase at different prices, and the quantity supplied at
different prices. Application of the market price method requires data to estimate
consumer surplus and producer surplus. To estimate consumer surplus, the demand
function must be estimated. This requires time series data on the quantity demanded at
different prices, plus data on other factors that might affect demand, such as income or
other demographic data. To estimate producer surplus, data on variable costs of
production and revenues received from the good are required.
a) Direct market prices
The most simple and straightforward way of finding out the value of environmental
resources is to look at their market prices – what they cost to buy or are worth to sell.
Market prices reflect what people are willing to pay for them – the value that they place
on them. All the costs and benefits associated with a proposed or alternative use option
can be determined by the prices that are paid, assuming there are no market distortions.
However, it is often difficult to apply to environmental resources since many
environmental goods have no market at all (e.g. those used for subsistence purposes).
Further, it is not always true that market prices reflect economic scarcity and, therefore,
are economic efficient prices. Market prices can be distorted because of taxes, subsidies,
monopolies, exchange rates or other interventions so they do not reflect the true value of
product (see Chapter 3).
Table 3 below shows an example of ccalculating the gross value of crop production in
Nakivubo Wetland, Uganda, using Market prices.
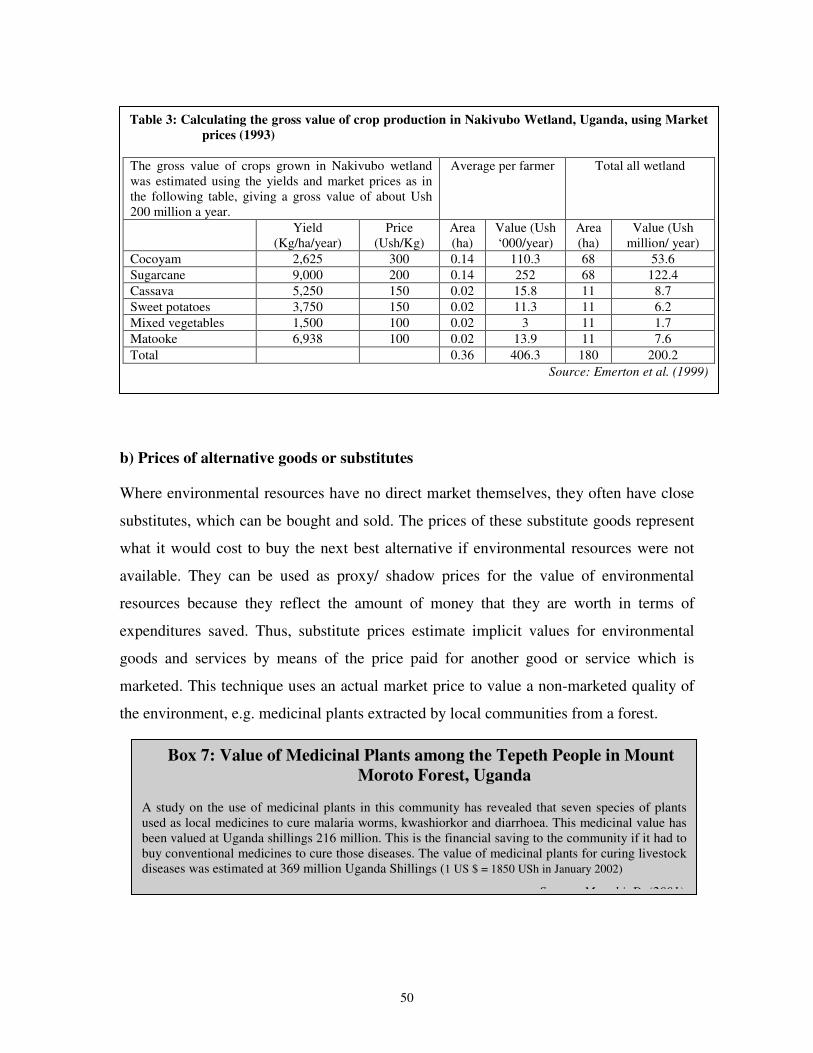
50
b) Prices of alternative goods or substitutes
Where environmental resources have no direct market themselves, they often have close
substitutes, which can be bought and sold. The prices of these substitute goods represent
what it would cost to buy the next best alternative if environmental resources were not
available. They can be used as proxy/ shadow prices for the value of environmental
resources because they reflect the amount of money that they are worth in terms of
expenditures saved. Thus, substitute prices estimate implicit values for environmental
goods and services by means of the price paid for another good or service which is
marketed. This technique uses an actual market price to value a non-marketed quality of
the environment, e.g. medicinal plants extracted by local communities from a forest.
Table 3: Calculating the gross value of crop production in Nakivubo Wetland, Uganda, using Market
prices (1993)
The gross value of crops grown in Nakivubo wetland was estimated using the yields and market prices as in the following table, giving a gross value of about Ush 200 million a year.
Average per farmer Total all wetland
Yield (Kg/ha/year)
Price (Ush/Kg)
Area (ha)
Value (Ush ‘000/year)
Area (ha)
Value (Ush million/ year)
Cocoyam 2,625 300 0.14 110.3 68 53.6
Sugarcane 9,000 200 0.14 252 68 122.4
Cassava 5,250 150 0.02 15.8 11 8.7
Sweet potatoes 3,750 150 0.02 11.3 11 6.2
Mixed vegetables 1,500 100 0.02 3 11 1.7
Matooke 6,938 100 0.02 13.9 11 7.6
Total 0.36 406.3 180 200.2
Source: Emerton et al. (1999)
Box 7: Value of Medicinal Plants among the Tepeth People in Mount
Moroto Forest, Uganda A study on the use of medicinal plants in this community has revealed that seven species of plants used as local medicines to cure malaria worms, kwashiorkor and diarrhoea. This medicinal value has been valued at Uganda shillings 216 million. This is the financial saving to the community if it had to buy conventional medicines to cure those diseases. The value of medicinal plants for curing livestock diseases was estimated at 369 million Uganda Shillings (1 US $ = 1850 USh in January 2002)
Source: Mugabi, D. (2001),
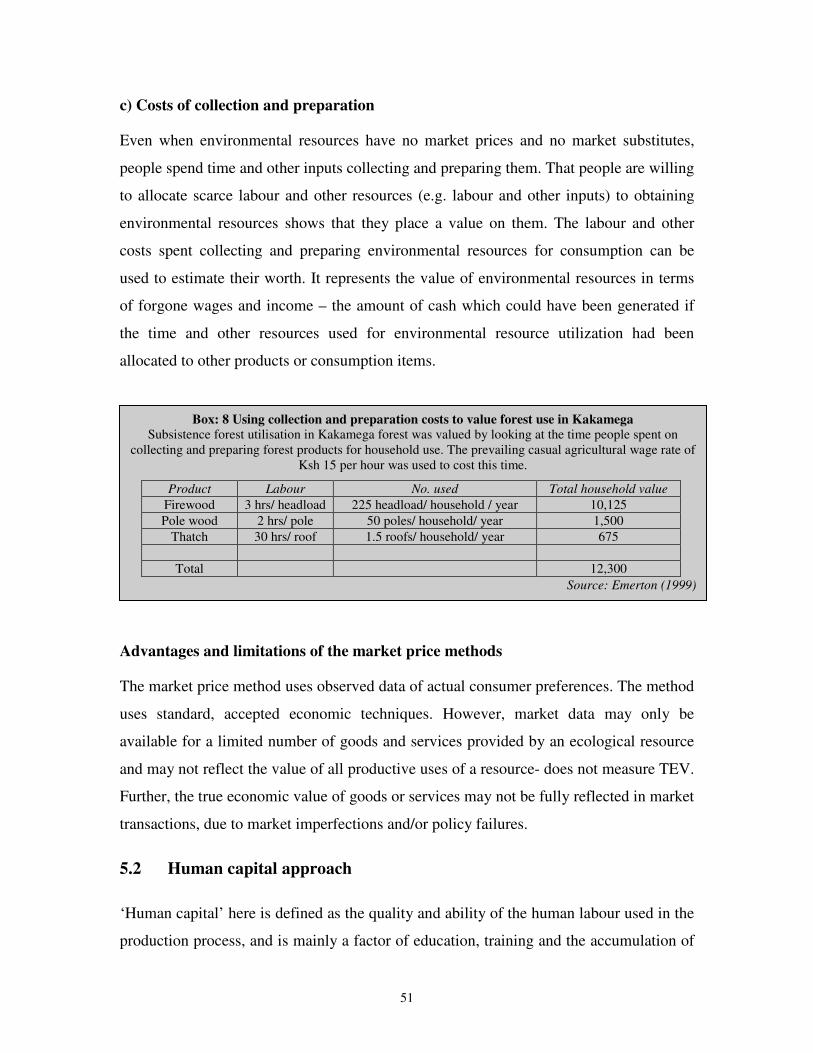
51
Box: 8 Using collection and preparation costs to value forest use in Kakamega
Subsistence forest utilisation in Kakamega forest was valued by looking at the time people spent on collecting and preparing forest products for household use. The prevailing casual agricultural wage rate of
Ksh 15 per hour was used to cost this time.
Product Labour No. used Total household value
Firewood 3 hrs/ headload 225 headload/ household / year 10,125
Pole wood 2 hrs/ pole 50 poles/ household/ year 1,500
Thatch 30 hrs/ roof 1.5 roofs/ household/ year 675
Total 12,300
Source: Emerton (1999)
c) Costs of collection and preparation
Even when environmental resources have no market prices and no market substitutes,
people spend time and other inputs collecting and preparing them. That people are willing
to allocate scarce labour and other resources (e.g. labour and other inputs) to obtaining
environmental resources shows that they place a value on them. The labour and other
costs spent collecting and preparing environmental resources for consumption can be
used to estimate their worth. It represents the value of environmental resources in terms
of forgone wages and income – the amount of cash which could have been generated if
the time and other resources used for environmental resource utilization had been
allocated to other products or consumption items.
Advantages and limitations of the market price methods
The market price method uses observed data of actual consumer preferences. The method
uses standard, accepted economic techniques. However, market data may only be
available for a limited number of goods and services provided by an ecological resource
and may not reflect the value of all productive uses of a resource- does not measure TEV.
Further, the true economic value of goods or services may not be fully reflected in market
transactions, due to market imperfections and/or policy failures.
5.2 Human capital approach
‘Human capital’ here is defined as the quality and ability of the human labour used in the
production process, and is mainly a factor of education, training and the accumulation of
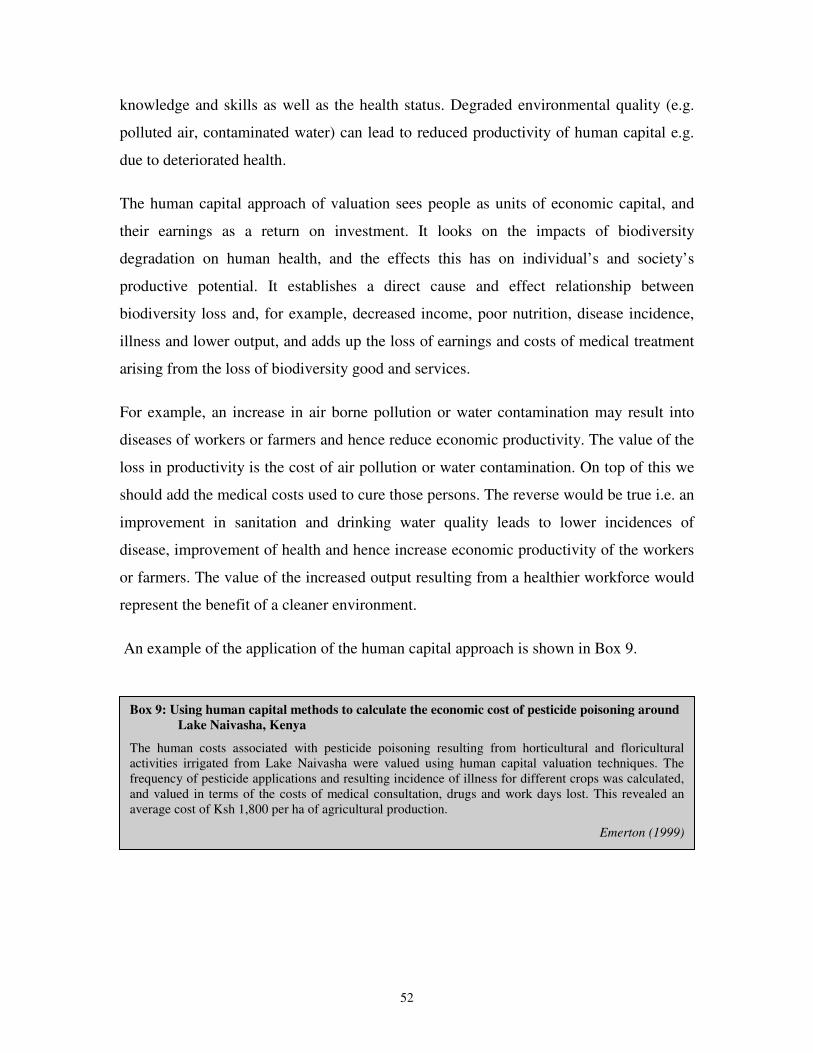
52
Box 9: Using human capital methods to calculate the economic cost of pesticide poisoning around
Lake Naivasha, Kenya
The human costs associated with pesticide poisoning resulting from horticultural and floricultural activities irrigated from Lake Naivasha were valued using human capital valuation techniques. The frequency of pesticide applications and resulting incidence of illness for different crops was calculated, and valued in terms of the costs of medical consultation, drugs and work days lost. This revealed an average cost of Ksh 1,800 per ha of agricultural production.
Emerton (1999)
knowledge and skills as well as the health status. Degraded environmental quality (e.g.
polluted air, contaminated water) can lead to reduced productivity of human capital e.g.
due to deteriorated health.
The human capital approach of valuation sees people as units of economic capital, and
their earnings as a return on investment. It looks on the impacts of biodiversity
degradation on human health, and the effects this has on individual’s and society’s
productive potential. It establishes a direct cause and effect relationship between
biodiversity loss and, for example, decreased income, poor nutrition, disease incidence,
illness and lower output, and adds up the loss of earnings and costs of medical treatment
arising from the loss of biodiversity good and services.
For example, an increase in air borne pollution or water contamination may result into
diseases of workers or farmers and hence reduce economic productivity. The value of the
loss in productivity is the cost of air pollution or water contamination. On top of this we
should add the medical costs used to cure those persons. The reverse would be true i.e. an
improvement in sanitation and drinking water quality leads to lower incidences of
disease, improvement of health and hence increase economic productivity of the workers
or farmers. The value of the increased output resulting from a healthier workforce would
represent the benefit of a cleaner environment.
An example of the application of the human capital approach is shown in Box 9.
53
5.3 Production function/ Change in productivity method
Introduction
The productivity method is used to estimate the economic value of ecosystem products or
services that contribute to the production of commercially marketed goods. It is applied
in cases where the products or services of an ecosystem are used, along with other inputs,
to produce a marketed good. The method traces impact of change in ecosystem services
on produced goods. Environmental services support other economic processes and
activities e.g soil fertility improves crop yield, rainforests increase rainfall and crop
output, mangrove forests enhance fish breeding etc. Where these other economic
activities have a market value, the changes in production and consumption may be used
to provide value for integrity of the environmental resource base. These effects on
production reflect the indirect contribution of environmental services to economic output.
For example, water quality affects the productivity of irrigated agricultural crops, or the
costs of purifying municipal drinking water. Thus, economic benefits of improved water
quality can be measured by increased revenues from greater agricultural productivity, or
by decreased costs of providing clean drinking water.
Environmental goods and services are also linked to other outcomes, for example, they
provide raw materials, support ecosystem services, generate income and employment.
Environmental goods and services that have no market but support consumption and
production processes can be valued by looking at the effect on their production functions.
Examples of effect on production include; loss of income, employment and foreign
exchange arising from loss of wildlife; flood damage and water shortage caused by loss
of forest watershed catchment protection etc.
If a natural resource is a factor of production, then changes in the quantity or quality of
the resource will result in changes in production costs, and/or productivity of other
inputs. This in turn may affect the price and/or quantity supplied of the final good. It
may also affect the economic returns to other inputs.
54
Applying the Productivity Method
This information needed for this method is used to link the effects of changes in the
quantity or quality of the resource to changes in consumer surplus and/or producer
surplus, and thus to estimate the economic benefits. There are three steps:
Step 1:
The first step is to specify the production function for the specified good or service. This
is the functional relationship between the inputs into producing the good/service and the
output (i.e. the physical effects of the environment on economic activity).
Step 2:
The second step is to estimate how the cost of production changes when the
environmental quality changes, using the production function estimated in the first step.
The researcher would calculate the quantities of inputs needed for different levels of
environmental quality, by plugging different levels of environmental quality variables
into the production function. These quantities would then be multiplied by their costs.
Physical changes in production are valued at market prices (or if necessary shadow
prices) for inputs and outputs (i.e. estimating the monetary value of ecological function).
Step 3:
The final step is to estimate the economic benefits of maintaining the environmental
quality. For example, where the integrity of the environment is maintained, the cost of
production of environmental goods/ services will be low. The difference in production
costs is an estimate of the benefits of maintaining environmental quality. The benefits of
different levels of improvement in environmental quality can be estimated.
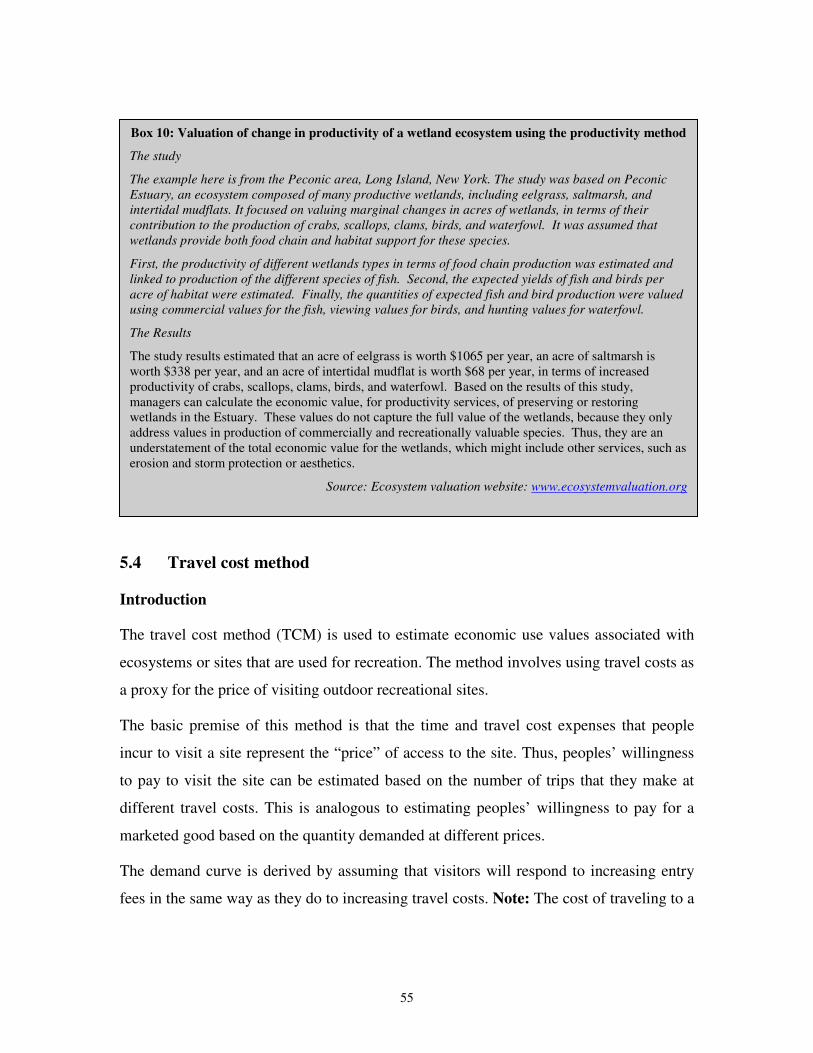
55
Box 10: Valuation of change in productivity of a wetland ecosystem using the productivity method
The study
The example here is from the Peconic area, Long Island, New York. The study was based on Peconic
Estuary, an ecosystem composed of many productive wetlands, including eelgrass, saltmarsh, and
intertidal mudflats. It focused on valuing marginal changes in acres of wetlands, in terms of their
contribution to the production of crabs, scallops, clams, birds, and waterfowl. It was assumed that
wetlands provide both food chain and habitat support for these species.
First, the productivity of different wetlands types in terms of food chain production was estimated and
linked to production of the different species of fish. Second, the expected yields of fish and birds per
acre of habitat were estimated. Finally, the quantities of expected fish and bird production were valued
using commercial values for the fish, viewing values for birds, and hunting values for waterfowl.
The Results
The study results estimated that an acre of eelgrass is worth $1065 per year, an acre of saltmarsh is worth $338 per year, and an acre of intertidal mudflat is worth $68 per year, in terms of increased productivity of crabs, scallops, clams, birds, and waterfowl. Based on the results of this study, managers can calculate the economic value, for productivity services, of preserving or restoring wetlands in the Estuary. These values do not capture the full value of the wetlands, because they only address values in production of commercially and recreationally valuable species. Thus, they are an understatement of the total economic value for the wetlands, which might include other services, such as erosion and storm protection or aesthetics.
Source: Ecosystem valuation website: www.ecosystemvaluation.org
5.4 Travel cost method
Introduction
The travel cost method (TCM) is used to estimate economic use values associated with
ecosystems or sites that are used for recreation. The method involves using travel costs as
a proxy for the price of visiting outdoor recreational sites.
The basic premise of this method is that the time and travel cost expenses that people
incur to visit a site represent the “price” of access to the site. Thus, peoples’ willingness
to pay to visit the site can be estimated based on the number of trips that they make at
different travel costs. This is analogous to estimating peoples’ willingness to pay for a
marketed good based on the quantity demanded at different prices.
The demand curve is derived by assuming that visitors will respond to increasing entry
fees in the same way as they do to increasing travel costs. Note: The cost of traveling to a
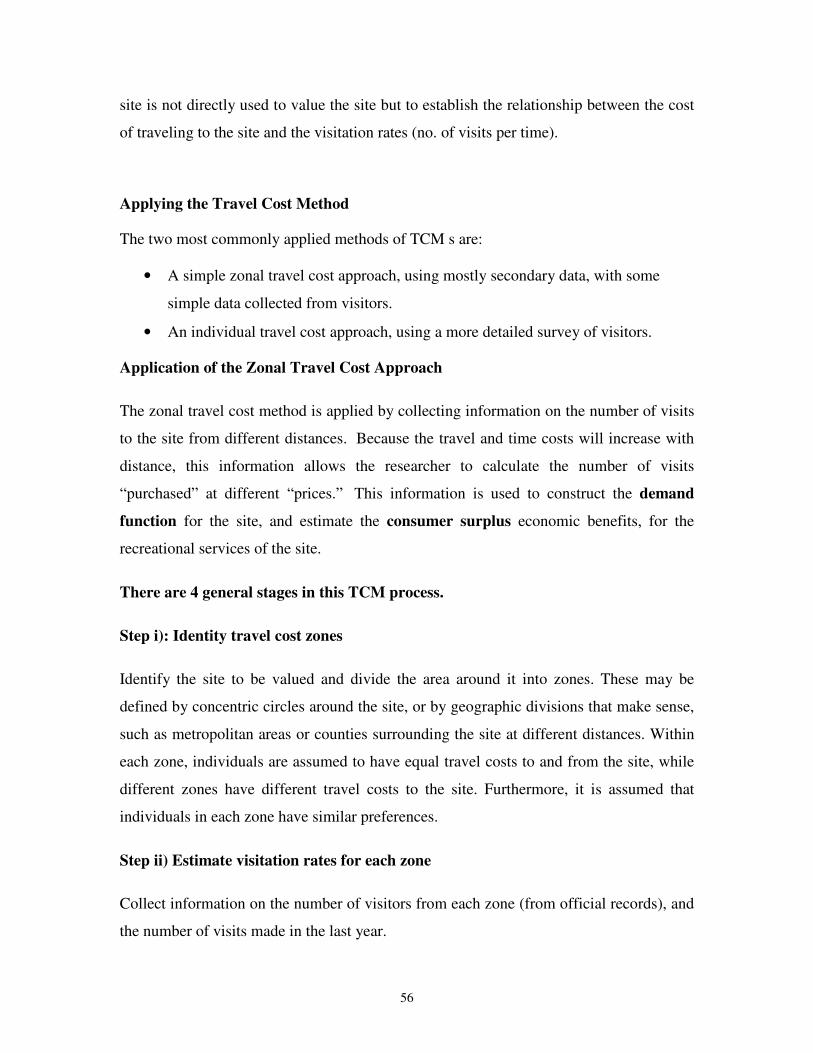
56
site is not directly used to value the site but to establish the relationship between the cost
of traveling to the site and the visitation rates (no. of visits per time).
Applying the Travel Cost Method
The two most commonly applied methods of TCM s are:
• A simple zonal travel cost approach, using mostly secondary data, with some
simple data collected from visitors.
• An individual travel cost approach, using a more detailed survey of visitors.
Application of the Zonal Travel Cost Approach
The zonal travel cost method is applied by collecting information on the number of visits
to the site from different distances. Because the travel and time costs will increase with
distance, this information allows the researcher to calculate the number of visits
“purchased” at different “prices.” This information is used to construct the demand
function for the site, and estimate the consumer surplus economic benefits, for the
recreational services of the site.
There are 4 general stages in this TCM process.
Step i): Identity travel cost zones
Identify the site to be valued and divide the area around it into zones. These may be
defined by concentric circles around the site, or by geographic divisions that make sense,
such as metropolitan areas or counties surrounding the site at different distances. Within
each zone, individuals are assumed to have equal travel costs to and from the site, while
different zones have different travel costs to the site. Furthermore, it is assumed that
individuals in each zone have similar preferences.
Step ii) Estimate visitation rates for each zone
Collect information on the number of visitors from each zone (from official records), and
the number of visits made in the last year.
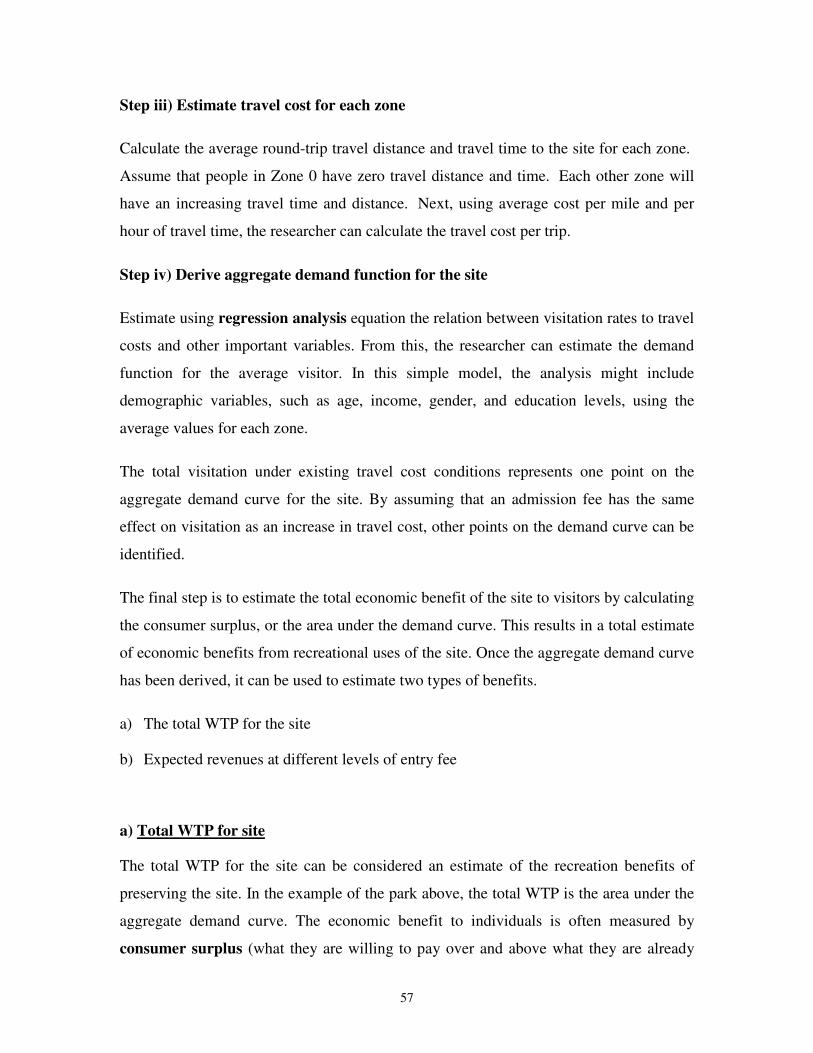
57
Step iii) Estimate travel cost for each zone
Calculate the average round-trip travel distance and travel time to the site for each zone.
Assume that people in Zone 0 have zero travel distance and time. Each other zone will
have an increasing travel time and distance. Next, using average cost per mile and per
hour of travel time, the researcher can calculate the travel cost per trip.
Step iv) Derive aggregate demand function for the site
Estimate using regression analysis equation the relation between visitation rates to travel
costs and other important variables. From this, the researcher can estimate the demand
function for the average visitor. In this simple model, the analysis might include
demographic variables, such as age, income, gender, and education levels, using the
average values for each zone.
The total visitation under existing travel cost conditions represents one point on the
aggregate demand curve for the site. By assuming that an admission fee has the same
effect on visitation as an increase in travel cost, other points on the demand curve can be
identified.
The final step is to estimate the total economic benefit of the site to visitors by calculating
the consumer surplus, or the area under the demand curve. This results in a total estimate
of economic benefits from recreational uses of the site. Once the aggregate demand curve
has been derived, it can be used to estimate two types of benefits.
a) The total WTP for the site
b) Expected revenues at different levels of entry fee
a) Total WTP for site
The total WTP for the site can be considered an estimate of the recreation benefits of
preserving the site. In the example of the park above, the total WTP is the area under the
aggregate demand curve. The economic benefit to individuals is often measured by
consumer surplus (what they are willing to pay over and above what they are already
58
Box 11: Using travel cost method to assess the recreational value of Lake Nakuru, Kenya
The study used travel cost method to determine the annual recreational value of wildlife viewing in Lake Nakuru. A travel cost survey of visitors elicited information about length of stay, travel costs, place of origin and visitation rates, distinguishing between resident and non-resident tourists. The results of these surveys demonstrated that the annual recreational value of wildlife viewing in Lake Nakuru National Park was about US$ 7.5-15 million, of which flamingos accounted for over a third.
Source: Navrud, S. and E. Mungatana (1994), cited in Emerton (1999)
paying). This is graphically represented by the area under the demand curve for a good,
above its price.
The economic benefit to individuals, or consumer surplus, received from a good will
change if its price or quality changes. For example, if the price of a good increases, but
people’s willingness to pay remains the same, the benefit received (maximum willingness
to pay minus price) will be less than before. If the quality of a good increases, but price
remains the same, people’s willingness to pay may increase and thus the benefit received
will also increase.
b) Expected revenue
TCM helps predict expected revenues at different levels of gate fee.
Expected revenue = Gate fee x Visitation rates x Population.
This is very important in helping park officials decide at what level to set park entry fee
and how well they can cover their costs.
5.5 Hedonic pricing method
Introduction
The method is used to estimate economic values for ecosystem or environmental services
that directly affect market prices. It is most commonly applied to variations in housing
prices that reflect the value of local environmental attributes. It can be used to estimate
economic benefits or costs associated with:
• environmental quality, including air pollution, water pollution, or noise
59
• environmental amenities, such as aesthetic/ scenic views or proximity to
recreational sites
The hedonic price approach is based on the theory that value of a commodity is a bundle
of valuable characteristics, one or more of which may be environmental. The basic
premise of the hedonic pricing method is that the price of a marketed good is related to its
characteristics, or the services it provides. It presupposes that goods and services are
defined by the attributes embodied in them, and the values of these goods and services
are the sum of the values of the attributes which they contain. When goods or services
contain an environmental characteristic, the market value of the environmental
characteristic is ‘’ embedded ‘’ in the market price of the good or service which contains
the characteristic.
Hedonic pricing approach commonly uses differentials in property values (property
value approach) and wages (wage differential approach) between locations, and
isolates the proportion of this difference, which may be attributed to environmental goods
and services. Property and land prices and wages are used to place implicit values on
environmental factors that are otherwise difficult to value. For example, differences in
property values are used to estimate peoples WTP to be near an environmental good,
such as a scenic view or parkland etc.
Applying hedonic pricing method
Hedonic pricing approach proceeds through the following stages:
1) Collect data on residential property sales in the region for a specific time period
(usually one year). The required data include:
• selling prices and locations of residential properties.
• property characteristics that affect selling prices, such as lot size, number and size of
rooms, and number of bathrooms.
• neighbourhood characteristics that affect selling prices, such as property taxes, crime
rates, and quality of schools.
60
• accessibility characteristics that affect prices, such as distances to work and shopping
centers, and availability of public transportation.
• environmental characteristics that affect prices
Thus property prices = f (property variables, neighbourhood variables,
accessibility variables, environmental variables)
("f" means "is a function of" or "is dependent upon")
2) Once the data are collected and compiled, the next step is to statistically estimate a
function that relates property values to the property characteristics. The resulting
function measures the portion of the property price that is attributable to each
characteristic. Thus, the researcher can estimate the value of a given attribute by looking
at how the value of the average home changes when the amount of the attribute changes.
The data are analyzed using regression analysis of housing or land prices on a group of
explanatory variables, such as house age, size, design, construction type etc. and a
number of location variables e.g. quiet neighbourhood, low population density etc. and
one or more environmental variables such as air quality or proximity to an environmental
amenity.
Advantages and Limitations of the Hedonic pricing method:
Data on property sales and characteristics are readily available through many sources,
and can be related to other secondary data sources to obtain descriptive variables for the
analysis. The method is versatile, and can be adapted to consider several possible
interactions between market goods and environmental quality. Choice of functional form
- it is not clear which non-linear function should be used for the hedonic pricing equation.
The choice of functional form will influence the values that implicit prices take. The
method is also relatively complex to implement and interpret, requiring a high degree of
statistical expertise. Moreover the results depend heavily on model specification.
61
5.6 Preventive expenditure/ Damage avoided/ Replacement costs
approaches
Introduction
The preventive expenditure, damage costs avoided, replacement cost etc. are related
methods that estimate values of ecosystem services based on either the costs of avoiding
damages due to lost services, the cost of replacing ecosystem services, or the cost of
providing substitute services. These methods assume that the costs of avoiding damages
or replacing ecosystems or their services provide useful estimates of the value of these
ecosystems or services.
This is based on the assumption that, if people incur costs to avoid damages caused by
lost ecosystem services, or to replace the services of ecosystems, then those services must
be worth at least what people paid to replace them. Thus, the methods are most
appropriately applied in cases where damage avoidance or replacement expenditures have
actually been, or will actually be, made. For example, they can be used for valuing the
water purification services of a wetland by measuring the cost of filtering and chemically
treating water.
Preventive expenditure approach
This method is also called the mitigative or defensive expenditure approach.
Environmental services can be valued by looking at how much it would cost to set in
place measures to prevent the damage arising from their loss. For example, flood control
barriers might be needed to offset or prevent negative impacts associated with the loss of
wetland flood control services; water treatment works might be needed to prevent
reservoir siltation associated with loss of wetlands silt-trapping functions etc.
Preventive expenditures imply the costs incurred to prevent the damage that would arise
if the environmental asset was not there. The preventative expenditure approach identifies
the cost or benefit value of environmental impacts by observing how much people,
communities, or nations are prepared to spend or pay to fix or avoid related forms of
environmental damage thus providing an indirect measure of the benefits derived from a
common property resource. This approach may hence be seen as a surrogate measure of
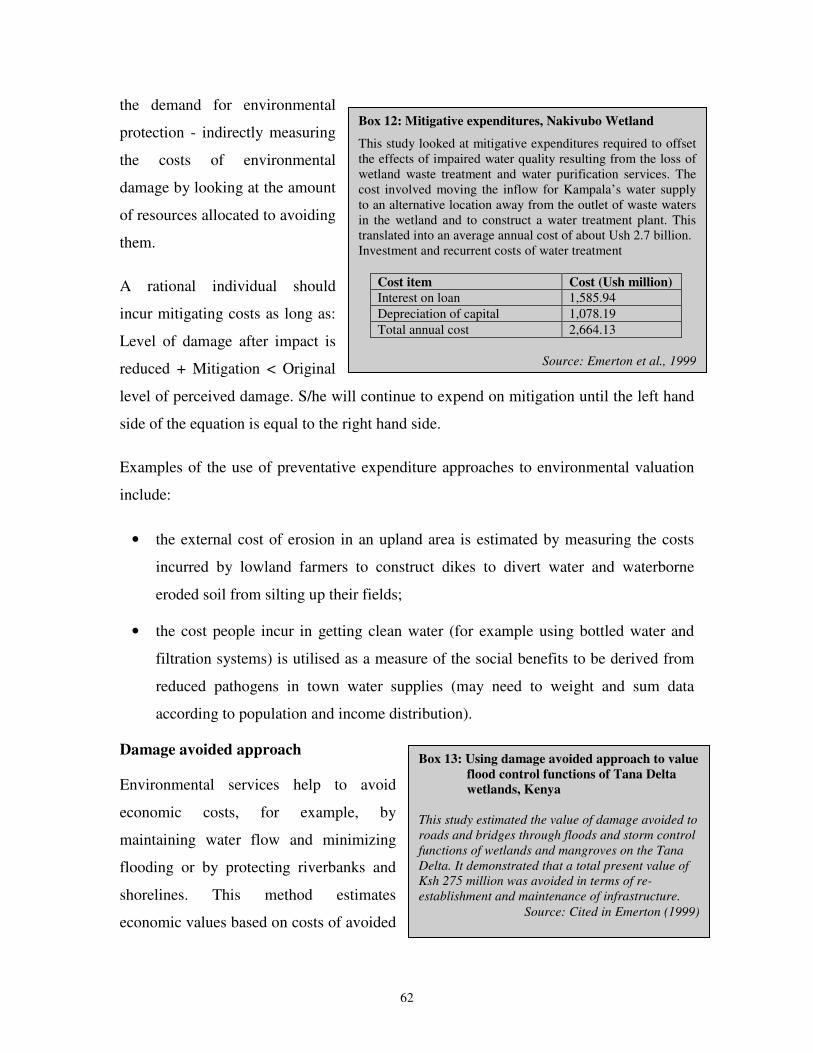
62
Box 12: Mitigative expenditures, Nakivubo Wetland
This study looked at mitigative expenditures required to offset the effects of impaired water quality resulting from the loss of wetland waste treatment and water purification services. The cost involved moving the inflow for Kampala’s water supply to an alternative location away from the outlet of waste waters in the wetland and to construct a water treatment plant. This translated into an average annual cost of about Ush 2.7 billion. Investment and recurrent costs of water treatment
Cost item Cost (Ush million)
Interest on loan 1,585.94
Depreciation of capital 1,078.19
Total annual cost 2,664.13
Source: Emerton et al., 1999
Box 13: Using damage avoided approach to value
flood control functions of Tana Delta
wetlands, Kenya
This study estimated the value of damage avoided to
roads and bridges through floods and storm control
functions of wetlands and mangroves on the Tana
Delta. It demonstrated that a total present value of
Ksh 275 million was avoided in terms of re-
establishment and maintenance of infrastructure.
Source: Cited in Emerton (1999)
the demand for environmental
protection - indirectly measuring
the costs of environmental
damage by looking at the amount
of resources allocated to avoiding
them.
A rational individual should
incur mitigating costs as long as:
Level of damage after impact is
reduced + Mitigation < Original
level of perceived damage. S/he will continue to expend on mitigation until the left hand
side of the equation is equal to the right hand side.
Examples of the use of preventative expenditure approaches to environmental valuation
include:
• the external cost of erosion in an upland area is estimated by measuring the costs
incurred by lowland farmers to construct dikes to divert water and waterborne
eroded soil from silting up their fields;
• the cost people incur in getting clean water (for example using bottled water and
filtration systems) is utilised as a measure of the social benefits to be derived from
reduced pathogens in town water supplies (may need to weight and sum data
according to population and income distribution).
Damage avoided approach
Environmental services help to avoid
economic costs, for example, by
maintaining water flow and minimizing
flooding or by protecting riverbanks and
shorelines. This method estimates
economic values based on costs of avoided
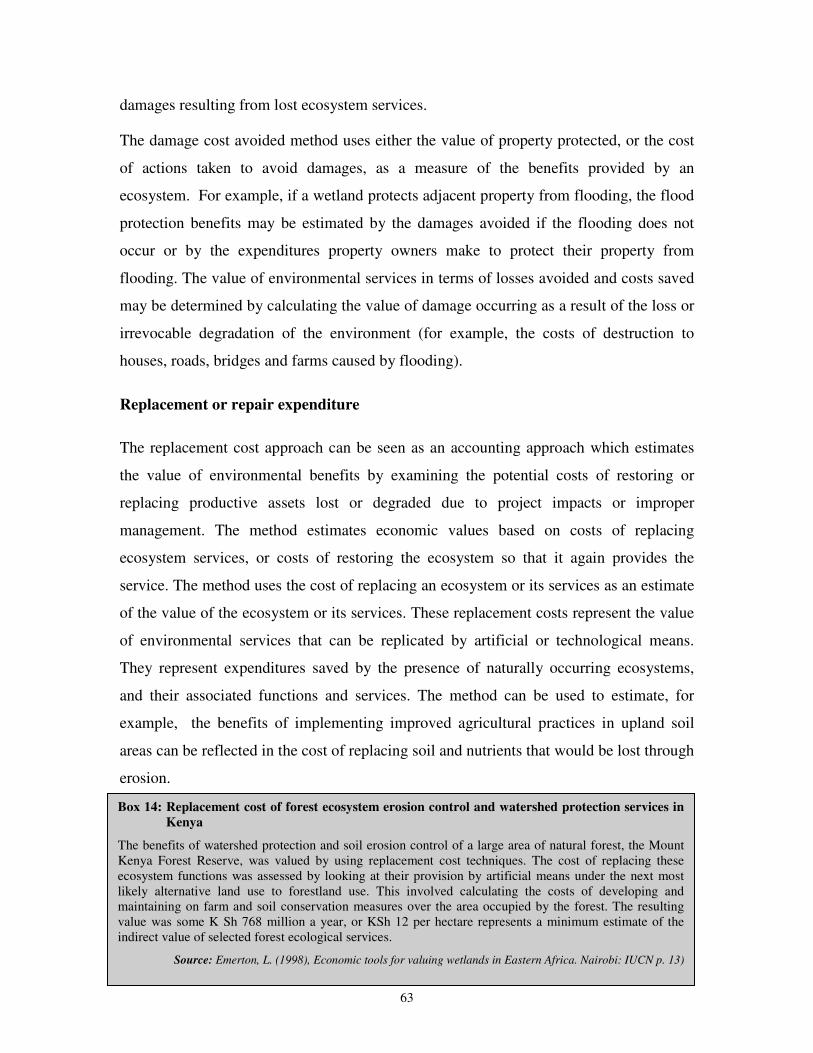
63
Box 14: Replacement cost of forest ecosystem erosion control and watershed protection services in
Kenya
The benefits of watershed protection and soil erosion control of a large area of natural forest, the Mount Kenya Forest Reserve, was valued by using replacement cost techniques. The cost of replacing these ecosystem functions was assessed by looking at their provision by artificial means under the next most likely alternative land use to forestland use. This involved calculating the costs of developing and maintaining on farm and soil conservation measures over the area occupied by the forest. The resulting value was some K Sh 768 million a year, or KSh 12 per hectare represents a minimum estimate of the indirect value of selected forest ecological services.
Source: Emerton, L. (1998), Economic tools for valuing wetlands in Eastern Africa. Nairobi: IUCN p. 13)
damages resulting from lost ecosystem services.
The damage cost avoided method uses either the value of property protected, or the cost
of actions taken to avoid damages, as a measure of the benefits provided by an
ecosystem. For example, if a wetland protects adjacent property from flooding, the flood
protection benefits may be estimated by the damages avoided if the flooding does not
occur or by the expenditures property owners make to protect their property from
flooding. The value of environmental services in terms of losses avoided and costs saved
may be determined by calculating the value of damage occurring as a result of the loss or
irrevocable degradation of the environment (for example, the costs of destruction to
houses, roads, bridges and farms caused by flooding).
Replacement or repair expenditure
The replacement cost approach can be seen as an accounting approach which estimates
the value of environmental benefits by examining the potential costs of restoring or
replacing productive assets lost or degraded due to project impacts or improper
management. The method estimates economic values based on costs of replacing
ecosystem services, or costs of restoring the ecosystem so that it again provides the
service. The method uses the cost of replacing an ecosystem or its services as an estimate
of the value of the ecosystem or its services. These replacement costs represent the value
of environmental services that can be replicated by artificial or technological means.
They represent expenditures saved by the presence of naturally occurring ecosystems,
and their associated functions and services. The method can be used to estimate, for
example, the benefits of implementing improved agricultural practices in upland soil
areas can be reflected in the cost of replacing soil and nutrients that would be lost through
erosion.
64
5.7 Discussion questions
Why would the use of labour and extraction costs of forest products fail to provide their
accurate market value?
1) Explain the difficulties one would be faced with when trying to apply the travel cost
method in Kenya.
2) Pick an evironment service that you have been dealing with in your organization or
department. Explain how it can be valued using any of the preventive expenditure,
damage avoided, replacement costs approaches disscussed in this mannual.
65
6. Stated or Expressed WTP Methods and Benefits Transfer
Stated preference methods/techniques can be divided into the contingent valuation
method (CVM or simply CV) and choice modeling or choice experiment. Both rely on a
'constructed market' - i.e. a hypothetical market which is presented to a respondent in a
questionnaire.
A big advantage of stated preference methods is that we can ask respondents for their
WTP regardless of whether they make use of the hypothetical commodity or not - in
other words we can obtain use and non-use values. When the respondent has property
rights over the resource we ask ‘what are you willing to pay’. Without such property
rights then we ask ‘what is the minimum compensation you would accept to put up with
this loss’ in contexts where the loser has the rights to the prior situation.
6.1 Contingent Valuation
The structure of the CV questionnaire
The contingent valuation (CV) methodology involves asking a random sample of
respondents for their WTP (or WTA) for a clearly defined good. CV involves a direct
elicitation by asking questions that take the form: ‘what is the maximum amount you are
willing to pay?’ or ‘are you willing to pay X?’
Design of a CVM study
In designing a CVM study, one has to answer a number of questions relevant to
contingent valuation research in general. These include:
• What change in environmental quality should respondents be asked to value, and
how should this change be described to them?
• What type of interview format should be used in the survey (i.e. face to face,
telephone, or mail)?
• What type of questions (elicitation procedure) should be used to elicit
respondents’ valuation of the change in environmental quality?
66
• Exactly how should respondents be told that they would have to pay for the
change in environmental quality?
• How can we increase our confidence that respondents in the contingent valuation
survey are actually valuing the specific change in environmental quality described
and not some other environmental quality change, and furthermore, that the
values found are correct?
Hypothetical market
The respondents presented with a hypothetical market which has the following
components
• The good itself or service flow (an improved view, better water quality, etc)
• Institutional context in which the good would be provided
• The way in which it would be financed-the bid vehicle (property taxes, income
tax, utility bills, entry fees, trust fund payments, etc.
The hypothetical market must as close as possible to a real market. Provide some
pictures, photos, info maps, etc to improve the description of the good or service.
Elicitation
Start by stating the purpose of the CVM questionnaire. Explain why the questionnaire is
being undertaken. The context should be as realistic as possible. Explain who the
interviewer is (e.g. conducting on behalf of what organization). Explain that answers are
confidential.
Start by eliciting respondents' attitudes to general issues concerning the good and then to
the good in question before presenting the hypothetical market and eliciting the WTP.
Box 15: Example
Which of the following problems do you regard as being most important for government to tackle?
Then:
Tell me with which of the following statements about Kakamega forest you strongly agree, agree,
disagree, or strongly disagree (scale may be shown, e.g. 1 for strongly disagree, 5 for strongly agree)
67
The respondent is asked questions to determine how much s/he would value a good or
service if confronted with the opportunity to obtain it under the specified terms and
conditions. Respondents are often reminded of the need to make compensating
adjustments in other types of expenditure to accommodate this additional financial
transaction. The respondent’s choice or preference can be elicited in a number of ways:
The simplest is to ask the respondent a direct question about how much s/he would be
willing to pay for the good or service - known as continuous or open-ended questions.
High rates of non-responses and zero responses can be a problem with this approach.
Alternatively, a respondent can be asked whether or not s/he would want to purchase the
service if it cost a specified amount. These are known as discrete, dichotomous choice,
or referendum questions, and receive favour because they give the respondent no
incentive not to answer truthfully, that is, the approach is incentive compatible.
The discrete choice approach can be extended to have multiple bounds, although a
double-bounded format has been found to have some efficient properties in terms of
minimising the tendency for the respondent to say yes continuously. Open-ended
questions, as well as single and double-bounded closed-ended questions are now the most
frequently used formats in contingent valuation. Payment cards and iterative bidding
formats used to be popular but are less so now since they are thought to introduce specific
biases.
Value elicitation question
• The formulation of the question designed to elicit WTP is also crucial to a CV
questionnaire.
• It is crucial to elicit the maximum WTP or the minimum WTA to be consistent
with the underlying economic theory of valuation. This requirement also helps to
determine the elicitation format. The most widely used elicitation formats are
shown in table 4 below:
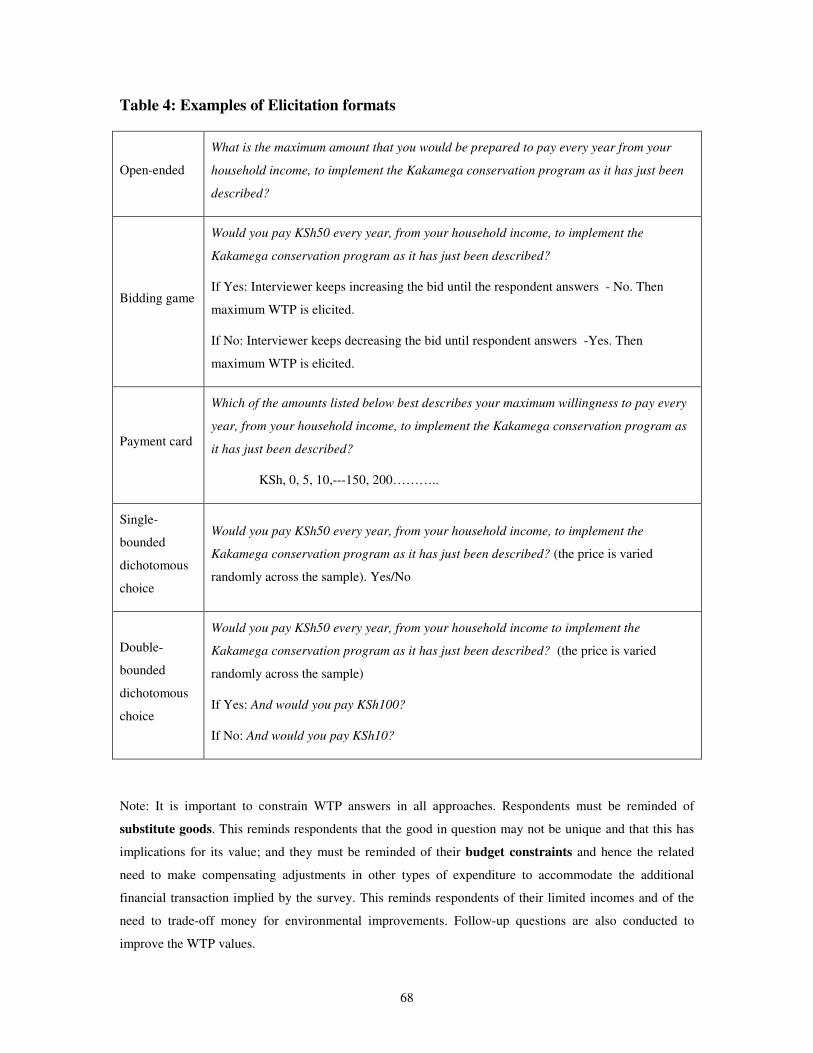
68
Table 4: Examples of Elicitation formats
Open-ended
What is the maximum amount that you would be prepared to pay every year from your
household income, to implement the Kakamega conservation program as it has just been
described?
Bidding game
Would you pay KSh50 every year, from your household income, to implement the
Kakamega conservation program as it has just been described?
If Yes: Interviewer keeps increasing the bid until the respondent answers - No. Then
maximum WTP is elicited.
If No: Interviewer keeps decreasing the bid until respondent answers -Yes. Then
maximum WTP is elicited.
Payment card
Which of the amounts listed below best describes your maximum willingness to pay every
year, from your household income, to implement the Kakamega conservation program as
it has just been described?
KSh, 0, 5, 10,---150, 200………..
Single-
bounded
dichotomous
choice
Would you pay KSh50 every year, from your household income, to implement the
Kakamega conservation program as it has just been described? (the price is varied
randomly across the sample). Yes/No
Double-
bounded
dichotomous
choice
Would you pay KSh50 every year, from your household income to implement the
Kakamega conservation program as it has just been described? (the price is varied
randomly across the sample)
If Yes: And would you pay KSh100?
If No: And would you pay KSh10?
Note: It is important to constrain WTP answers in all approaches. Respondents must be reminded of
substitute goods. This reminds respondents that the good in question may not be unique and that this has
implications for its value; and they must be reminded of their budget constraints and hence the related
need to make compensating adjustments in other types of expenditure to accommodate the additional
financial transaction implied by the survey. This reminds respondents of their limited incomes and of the
need to trade-off money for environmental improvements. Follow-up questions are also conducted to
improve the WTP values.
69
Tests of the reliability, bias and validity of the CVM.
Reliability concerns the degree to which the variance of WTP responses can be attributed
to random error. The greater is the degree of non-randomness, the less the reliability of
the study, such that mean WTP answers are of little significance. The variance arises as a
consequence of true random error, sampling procedure, and the questionnaire/interview
itself. The first of these is essential to the statistical process, while the second can be
minimized by ensuring a sufficiently large sample size. The third relates to the issue of
bias, they are considered in turn. Bias refers to non-randomness in the variance of
valuation responses.
Bias can be caused by a number of factors that introduce bias into respondent behavior.
Well-documented biases include:
o strategic bias - respondents deliberately misstate their WTP;
o payment vehicle bias - WTP varies with the instrument suggested for payment;
o hypothetical bias - WTP is over or understated relative to what would be paid in a
real market;
o starting point bias - WTP is ‘anchored’ on the first suggested bid price;
o insensitivity to scope - WTP is not affected by the scale of the good being offered;
o aggregation bias - aggregate WTP is sensitive to the number of people over which
WTPs are aggregated.
Mean or median WTP?
• The final summary statistic for WTP will be either a mean or a median, and often
both will be reported.
• The mean will be relevant if the context of the valuation exercise is cost-benefit
analysis.
• The median is relevant in the context of public choice since it corresponds to that
amount which would just receive a majority approval.
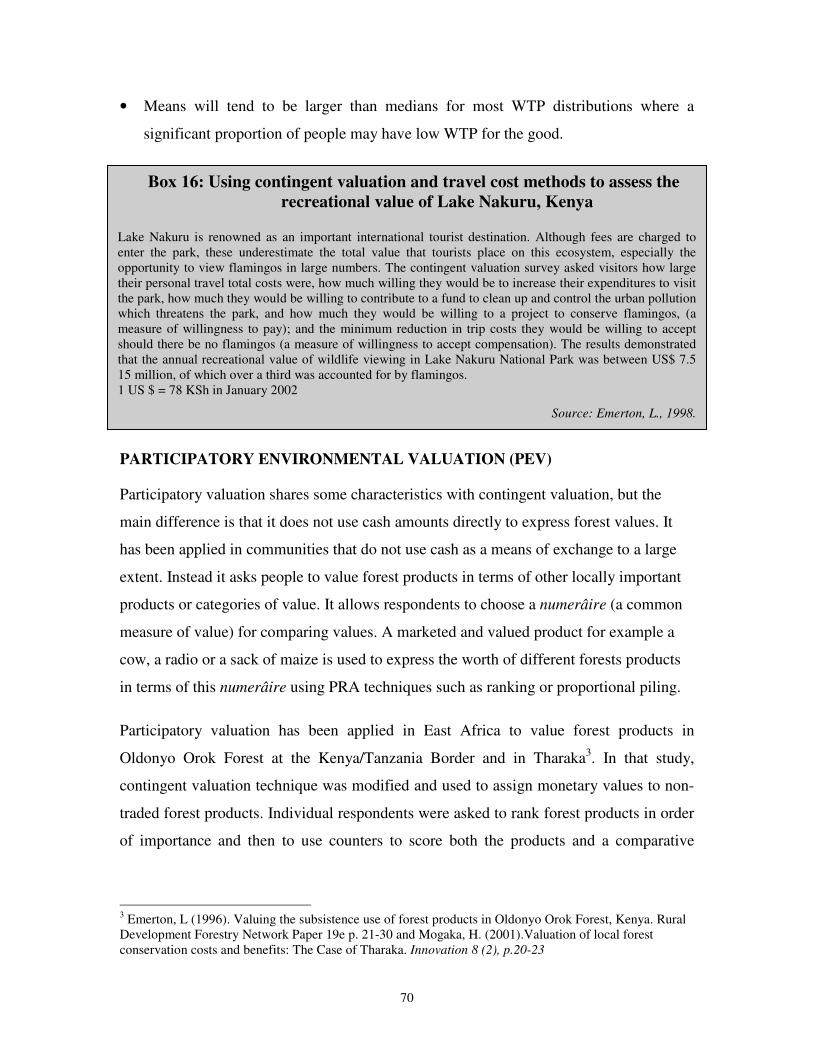
70
Box 16: Using contingent valuation and travel cost methods to assess the
recreational value of Lake Nakuru, Kenya Lake Nakuru is renowned as an important international tourist destination. Although fees are charged to enter the park, these underestimate the total value that tourists place on this ecosystem, especially the opportunity to view flamingos in large numbers. The contingent valuation survey asked visitors how large their personal travel total costs were, how much willing they would be to increase their expenditures to visit the park, how much they would be willing to contribute to a fund to clean up and control the urban pollution which threatens the park, and how much they would be willing to a project to conserve flamingos, (a measure of willingness to pay); and the minimum reduction in trip costs they would be willing to accept should there be no flamingos (a measure of willingness to accept compensation). The results demonstrated that the annual recreational value of wildlife viewing in Lake Nakuru National Park was between US$ 7.5 15 million, of which over a third was accounted for by flamingos. 1 US $ = 78 KSh in January 2002
Source: Emerton, L., 1998.
• Means will tend to be larger than medians for most WTP distributions where a
significant proportion of people may have low WTP for the good.
PARTICIPATORY ENVIRONMENTAL VALUATION (PEV)
Participatory valuation shares some characteristics with contingent valuation, but the
main difference is that it does not use cash amounts directly to express forest values. It
has been applied in communities that do not use cash as a means of exchange to a large
extent. Instead it asks people to value forest products in terms of other locally important
products or categories of value. It allows respondents to choose a numerâire (a common
measure of value) for comparing values. A marketed and valued product for example a
cow, a radio or a sack of maize is used to express the worth of different forests products
in terms of this numerâire using PRA techniques such as ranking or proportional piling.
Participatory valuation has been applied in East Africa to value forest products in
Oldonyo Orok Forest at the Kenya/Tanzania Border and in Tharaka3. In that study,
contingent valuation technique was modified and used to assign monetary values to non-
traded forest products. Individual respondents were asked to rank forest products in order
of importance and then to use counters to score both the products and a comparative
3 Emerton, L (1996). Valuing the subsistence use of forest products in Oldonyo Orok Forest, Kenya. Rural Development Forestry Network Paper 19e p. 21-30 and Mogaka, H. (2001).Valuation of local forest conservation costs and benefits: The Case of Tharaka. Innovation 8 (2), p.20-23
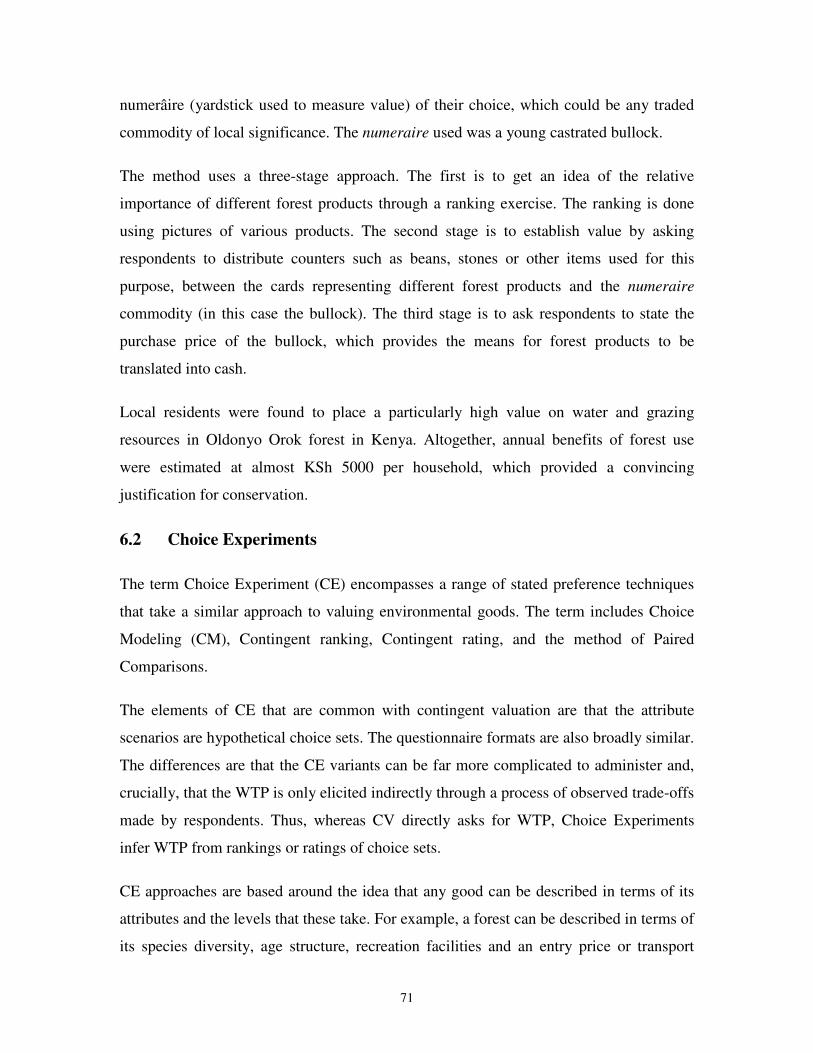
71
numerâire (yardstick used to measure value) of their choice, which could be any traded
commodity of local significance. The numeraire used was a young castrated bullock.
The method uses a three-stage approach. The first is to get an idea of the relative
importance of different forest products through a ranking exercise. The ranking is done
using pictures of various products. The second stage is to establish value by asking
respondents to distribute counters such as beans, stones or other items used for this
purpose, between the cards representing different forest products and the numeraire
commodity (in this case the bullock). The third stage is to ask respondents to state the
purchase price of the bullock, which provides the means for forest products to be
translated into cash.
Local residents were found to place a particularly high value on water and grazing
resources in Oldonyo Orok forest in Kenya. Altogether, annual benefits of forest use
were estimated at almost KSh 5000 per household, which provided a convincing
justification for conservation.
6.2 Choice Experiments
The term Choice Experiment (CE) encompasses a range of stated preference techniques
that take a similar approach to valuing environmental goods. The term includes Choice
Modeling (CM), Contingent ranking, Contingent rating, and the method of Paired
Comparisons.
The elements of CE that are common with contingent valuation are that the attribute
scenarios are hypothetical choice sets. The questionnaire formats are also broadly similar.
The differences are that the CE variants can be far more complicated to administer and,
crucially, that the WTP is only elicited indirectly through a process of observed trade-offs
made by respondents. Thus, whereas CV directly asks for WTP, Choice Experiments
infer WTP from rankings or ratings of choice sets.
CE approaches are based around the idea that any good can be described in terms of its
attributes and the levels that these take. For example, a forest can be described in terms of
its species diversity, age structure, recreation facilities and an entry price or transport
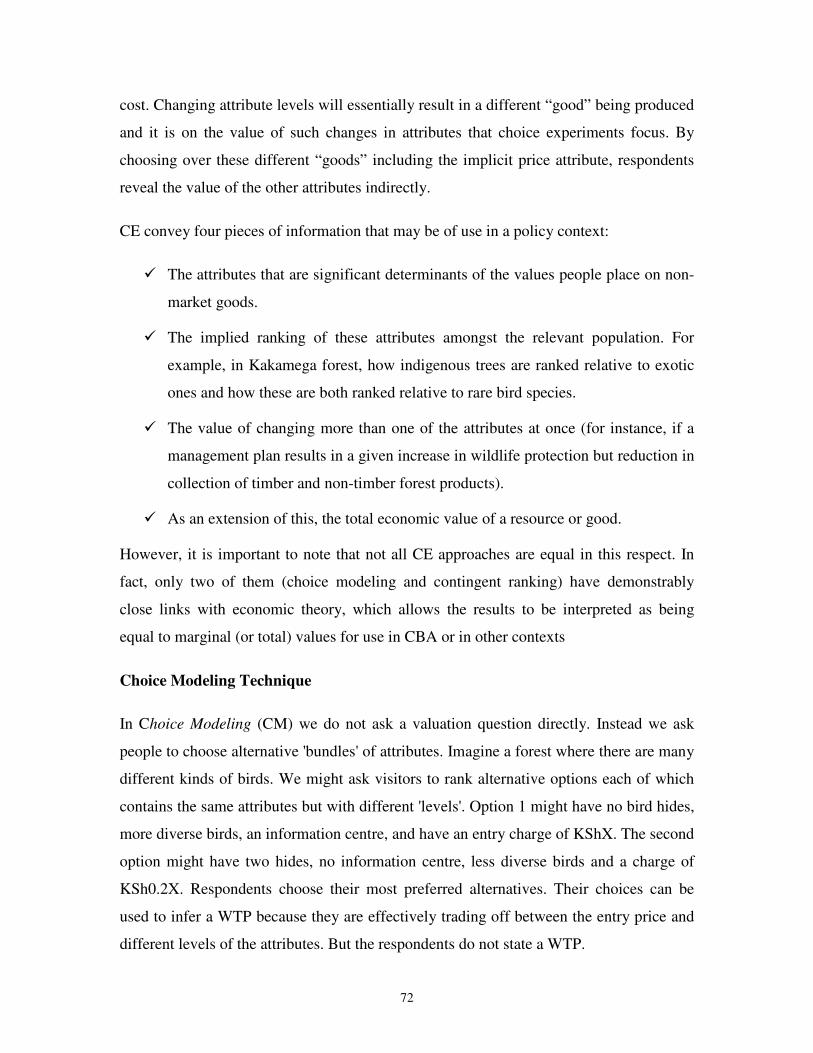
72
cost. Changing attribute levels will essentially result in a different “good” being produced
and it is on the value of such changes in attributes that choice experiments focus. By
choosing over these different “goods” including the implicit price attribute, respondents
reveal the value of the other attributes indirectly.
CE convey four pieces of information that may be of use in a policy context:
� The attributes that are significant determinants of the values people place on non-
market goods.
� The implied ranking of these attributes amongst the relevant population. For
example, in Kakamega forest, how indigenous trees are ranked relative to exotic
ones and how these are both ranked relative to rare bird species.
� The value of changing more than one of the attributes at once (for instance, if a
management plan results in a given increase in wildlife protection but reduction in
collection of timber and non-timber forest products).
� As an extension of this, the total economic value of a resource or good.
However, it is important to note that not all CE approaches are equal in this respect. In
fact, only two of them (choice modeling and contingent ranking) have demonstrably
close links with economic theory, which allows the results to be interpreted as being
equal to marginal (or total) values for use in CBA or in other contexts
Choice Modeling Technique
In Choice Modeling (CM) we do not ask a valuation question directly. Instead we ask
people to choose alternative 'bundles' of attributes. Imagine a forest where there are many
different kinds of birds. We might ask visitors to rank alternative options each of which
contains the same attributes but with different 'levels'. Option 1 might have no bird hides,
more diverse birds, an information centre, and have an entry charge of KShX. The second
option might have two hides, no information centre, less diverse birds and a charge of
KSh0.2X. Respondents choose their most preferred alternatives. Their choices can be
used to infer a WTP because they are effectively trading off between the entry price and
different levels of the attributes. But the respondents do not state a WTP.
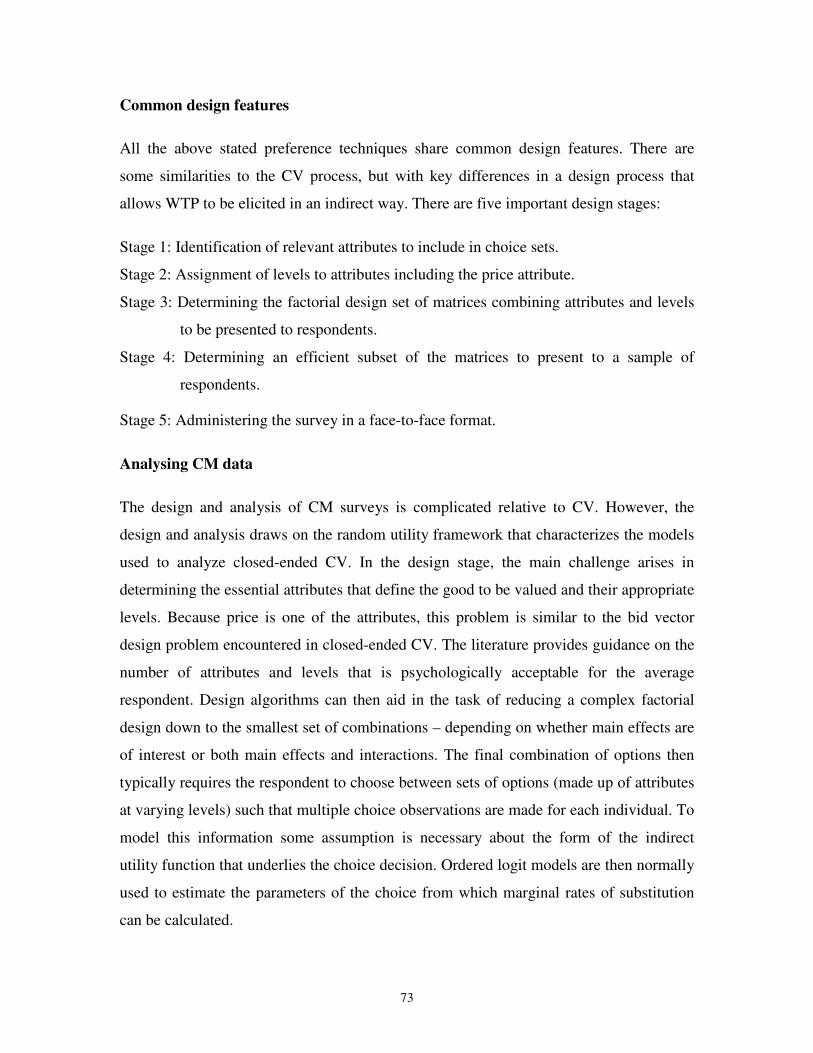
73
Common design features
All the above stated preference techniques share common design features. There are
some similarities to the CV process, but with key differences in a design process that
allows WTP to be elicited in an indirect way. There are five important design stages:
Stage 1: Identification of relevant attributes to include in choice sets.
Stage 2: Assignment of levels to attributes including the price attribute.
Stage 3: Determining the factorial design set of matrices combining attributes and levels
to be presented to respondents.
Stage 4: Determining an efficient subset of the matrices to present to a sample of
respondents.
Stage 5: Administering the survey in a face-to-face format.
Analysing CM data
The design and analysis of CM surveys is complicated relative to CV. However, the
design and analysis draws on the random utility framework that characterizes the models
used to analyze closed-ended CV. In the design stage, the main challenge arises in
determining the essential attributes that define the good to be valued and their appropriate
levels. Because price is one of the attributes, this problem is similar to the bid vector
design problem encountered in closed-ended CV. The literature provides guidance on the
number of attributes and levels that is psychologically acceptable for the average
respondent. Design algorithms can then aid in the task of reducing a complex factorial
design down to the smallest set of combinations – depending on whether main effects are
of interest or both main effects and interactions. The final combination of options then
typically requires the respondent to choose between sets of options (made up of attributes
at varying levels) such that multiple choice observations are made for each individual. To
model this information some assumption is necessary about the form of the indirect
utility function that underlies the choice decision. Ordered logit models are then normally
used to estimate the parameters of the choice from which marginal rates of substitution
can be calculated.
74
6.3 Choice modeling versus contingent valuation
CM places the respondent in much the same situation as a CV survey. The key difference
is that the cognitive process is somewhat circumscribed by the attributes and the levels a
respondent must choose between. For some goods, this may prevent the respondent
making default assumptions. However, this depends on the amount of background
information provided in what is already a cognitively burdensome task. There is a small
body of studies testing whether there is applicability of CM to biological resources. It can
be argued that the constrained attribute design requirement of CM is even more limiting
than CV. Moreover, the selection and representation of these attributes and their levels
simply adds to the design problems already associated with hypothetical surveys. A
strong advantage of the CM over CV is that the method can reveal something about the
sum of the parts of a resource rather than the total value. In many circumstances, the
policy question to be answered by a valuation study concerns the improvement of a
specific attribute. Other advantages of using CM are:
i. CM provides a richer description of the attribute trade offs that individuals are
willing to make.
ii. The welfare values from the CM generally have smaller variances (relative to
their means) than the CV estimates
iii. CM avoids compliance bias or “yeah saying” problem of dichotomous choice
surveys as respondents are not faced with the same “all or nothing” choice
iv. CM helps avoid the potential “embedding problem” present in CV when WTP
for a good varies depending on whether it is evaluated on its own or as part of a
more inclusive category
v. By allowing some attributes to take on levels both above and below the status
quo level, it is possible to estimate both WTP and WTA
If resources are sufficient, both CV and CM studies can be undertaken to permit some
form of convergent validity. Rarely, however, resources allow for the application of more
than one technique and a choice has to be made.
75
6.4 Benefits transfer method
Benefits transfer method refers to the use of valuation estimates in one context to
estimate values in a different context. Alternatively, the relationship used to estimate the
benefits in one case might be applied in another case. Thus, this method is used to
estimate economic values for ecosystem services by transferring available information
from studies already completed in another location and/or context. For example, an
estimate of the benefits obtained by tourists viewing wildlife in one park may be used to
estimate the benefits obtained from viewing wildlife in another park.
The simplest type of benefit transfer is the unit day approach, where existing values for
activity days are used to value the same activity at other sites. These estimates are based
on expert judgment in combining and averaging benefit estimates from a number of
existing studies. These “unit day values” may be adjusted for characteristics of the study
site when they are applied.
A more rigorous approach involves transferring a benefit function from another study.
The benefit function statistically relates peoples’ willingness to pay to characteristics of
the ecosystem and the people whose values were elicited. When a benefit function is
transferred, adjustments can be made for differences in these characteristics, thus
allowing for more precision in transferring benefit estimates between contexts.
Conditions for applying benefits transfer method
• The commodity or service being valued should be very similar at the site where the original
estimates were made and the new site where they are to be applied
• The populations affected should have very similar characteristics at the two sites
In Applying benefits transfer method, the following steps are necessary:
1. The first step is to identify existing studies or values that can be used for the transfer.
76
2. The second step is to decide whether the existing values are transferable. The existing
values or studies would be evaluated based on several criteria, e.g., service attributes, site
comparability, qualities of sites, population characteristics, etc.
3. The next step is to evaluate the quality of studies to be transferred. .
4. The final step is to adjust the existing values to better reflect the values for the site
under consideration, using whatever information is available and relevant.
Advantages and limitations of the benefits transfer Method
Benefit transfer is typically less costly than conducting an original valuation study.
Economic benefits can be estimated more quickly than when undertaking an original
valuation study. The method can be used as a screening technique to determine if a more
detailed, original valuation study should be conducted. The method can easily and
quickly be applied for making gross estimates of recreational values. The more similar
the sites and the recreational experiences, the fewer biases will result. However, benefit
transfer may not be accurate, except for making gross estimates of recreational values,
unless the sites share all of the site, location, and user specific characteristics. It may
there be unreliable for policy making.
6.5 Dicussion questions
1) In conducting telephone surveys, some respondents always refuse to participate,
saying they ‘don’t have time’ or ‘can’t be bothered’. If researchers accept these
inevitable non-responses and base their study on other households, those who
patiently answer each question, what biases are likely to be built into the sample? Can
you think of a way to deal with this type of problem?
2) Pierre is a software engineer, working in a heavily polluted part of Nairobi (probably
Eastlands). He does not like the pollution but the pay is good and housing is relatively
cheap. He is considering taking a job with a different software company in another
part of the city with very low pollution levels. Unfortunately, he discovers that
housing is very expensive there; many people wish to live there and this has bid up
the price of housing. Pierre tells his prospective employer that he will need a higher
77
wage to compensate for the higher cost of living. Is Pierre justified in making this
request? Why or why not?
3) The literature suggests that substitutability can affect demand for public goods and
bads in the same way that it does for private goods and bads. To be more concrete,
consider trying to estimate damages from an oil spill that caused the closure of
several beaches along a coastal area. Why is it important to consider whether other
local beaches where left uncontaminated and therefore did not close?
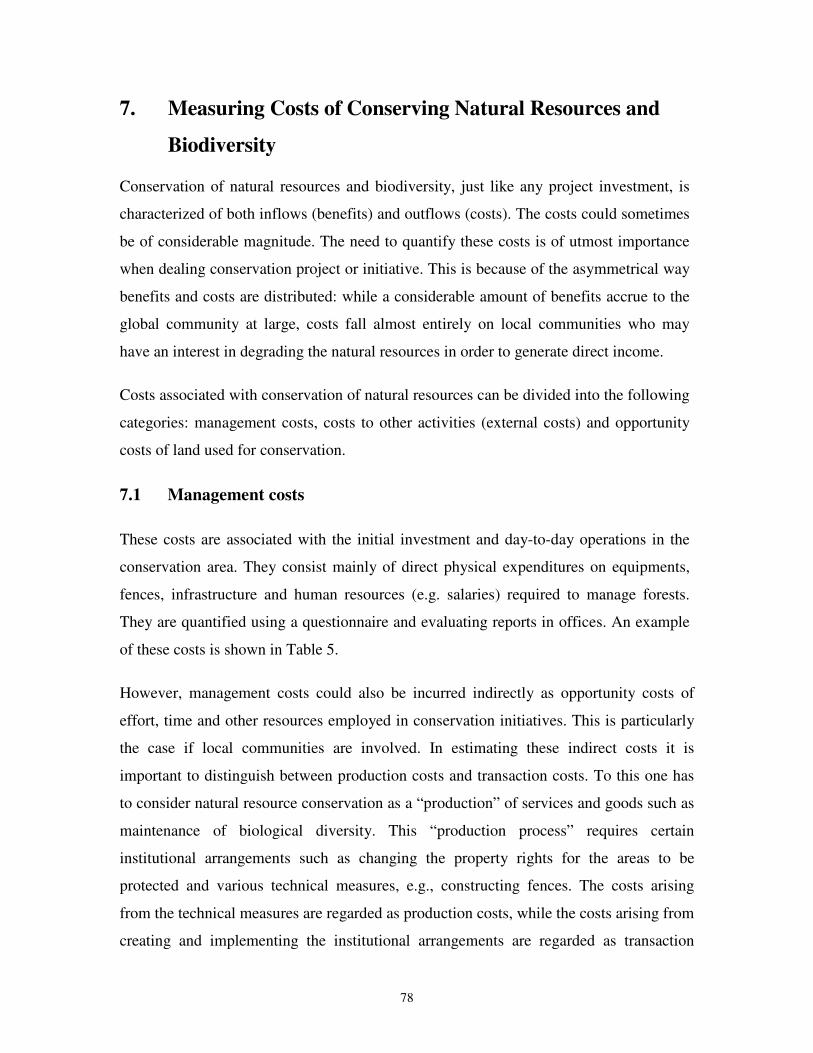
78
7. Measuring Costs of Conserving Natural Resources and
Biodiversity
Conservation of natural resources and biodiversity, just like any project investment, is
characterized of both inflows (benefits) and outflows (costs). The costs could sometimes
be of considerable magnitude. The need to quantify these costs is of utmost importance
when dealing conservation project or initiative. This is because of the asymmetrical way
benefits and costs are distributed: while a considerable amount of benefits accrue to the
global community at large, costs fall almost entirely on local communities who may
have an interest in degrading the natural resources in order to generate direct income.
Costs associated with conservation of natural resources can be divided into the following
categories: management costs, costs to other activities (external costs) and opportunity
costs of land used for conservation.
7.1 Management costs
These costs are associated with the initial investment and day-to-day operations in the
conservation area. They consist mainly of direct physical expenditures on equipments,
fences, infrastructure and human resources (e.g. salaries) required to manage forests.
They are quantified using a questionnaire and evaluating reports in offices. An example
of these costs is shown in Table 5.
However, management costs could also be incurred indirectly as opportunity costs of
effort, time and other resources employed in conservation initiatives. This is particularly
the case if local communities are involved. In estimating these indirect costs it is
important to distinguish between production costs and transaction costs. To this one has
to consider natural resource conservation as a “production” of services and goods such as
maintenance of biological diversity. This “production process” requires certain
institutional arrangements such as changing the property rights for the areas to be
protected and various technical measures, e.g., constructing fences. The costs arising
from the technical measures are regarded as production costs, while the costs arising from
creating and implementing the institutional arrangements are regarded as transaction
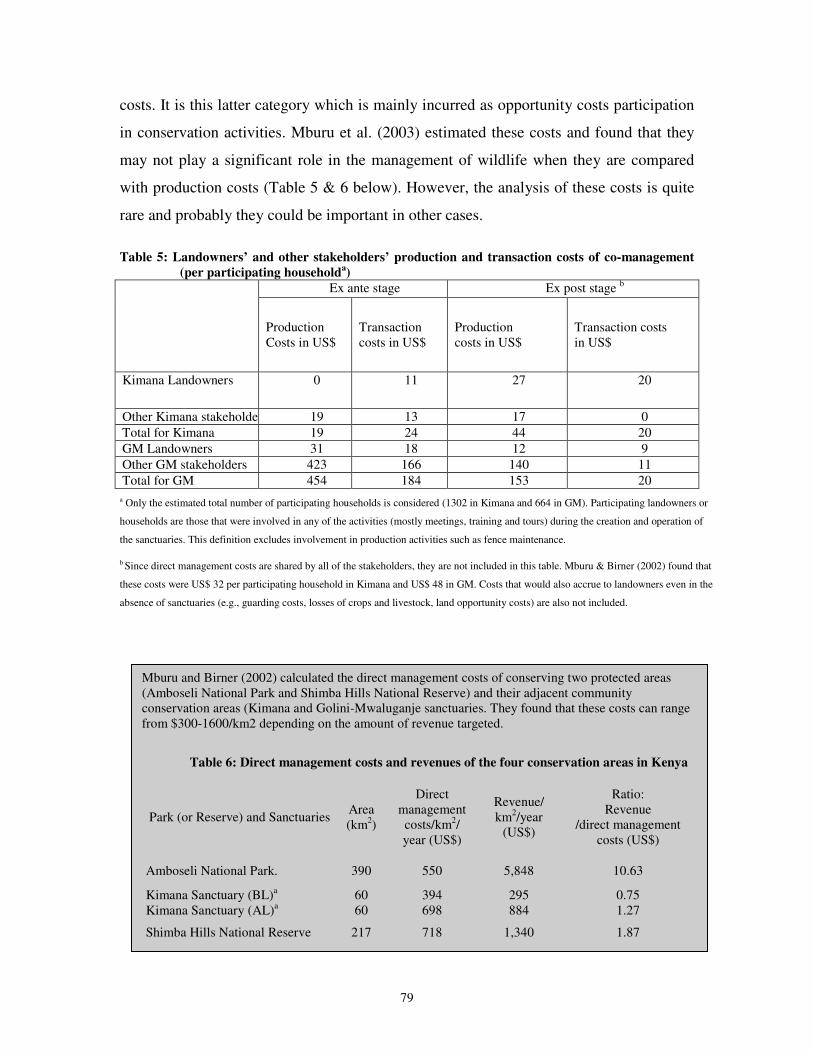
79
Mburu and Birner (2002) calculated the direct management costs of conserving two protected areas (Amboseli National Park and Shimba Hills National Reserve) and their adjacent community conservation areas (Kimana and Golini-Mwaluganje sanctuaries. They found that these costs can range from $300-1600/km2 depending on the amount of revenue targeted.
Table 6: Direct management costs and revenues of the four conservation areas in Kenya
Park (or Reserve) and Sanctuaries Area (km2)
Direct management costs/km2/ year (US$)
Revenue/ km2/year
(US$)
Ratio: Revenue
/direct management costs (US$)
Amboseli National Park. 390 550 5,848 10.63
Kimana Sanctuary (BL)a Kimana Sanctuary (AL)a
60 60
394 698
295 884
0.75 1.27
Shimba Hills National Reserve 217 718 1,340 1.87
costs. It is this latter category which is mainly incurred as opportunity costs participation
in conservation activities. Mburu et al. (2003) estimated these costs and found that they
may not play a significant role in the management of wildlife when they are compared
with production costs (Table 5 & 6 below). However, the analysis of these costs is quite
rare and probably they could be important in other cases.
Table 5: Landowners’ and other stakeholders’ production and transaction costs of co-management
(per participating householda)
Ex ante stage Ex post stage b
Production Costs in US$
Transaction costs in US$
Production costs in US$
Transaction costs in US$
Kimana Landowners 0 11 27 20
Other Kimana stakeholders 19 13 17 0
Total for Kimana 19 24 44 20
GM Landowners 31 18 12 9
Other GM stakeholders 423 166 140 11
Total for GM 454 184 153 20
a Only the estimated total number of participating households is considered (1302 in Kimana and 664 in GM). Participating landowners or
households are those that were involved in any of the activities (mostly meetings, training and tours) during the creation and operation of
the sanctuaries. This definition excludes involvement in production activities such as fence maintenance.
b Since direct management costs are shared by all of the stakeholders, they are not included in this table. Mburu & Birner (2002) found that
these costs were US$ 32 per participating household in Kimana and US$ 48 in GM. Costs that would also accrue to landowners even in the
absence of sanctuaries (e.g., guarding costs, losses of crops and livestock, land opportunity costs) are also not included.
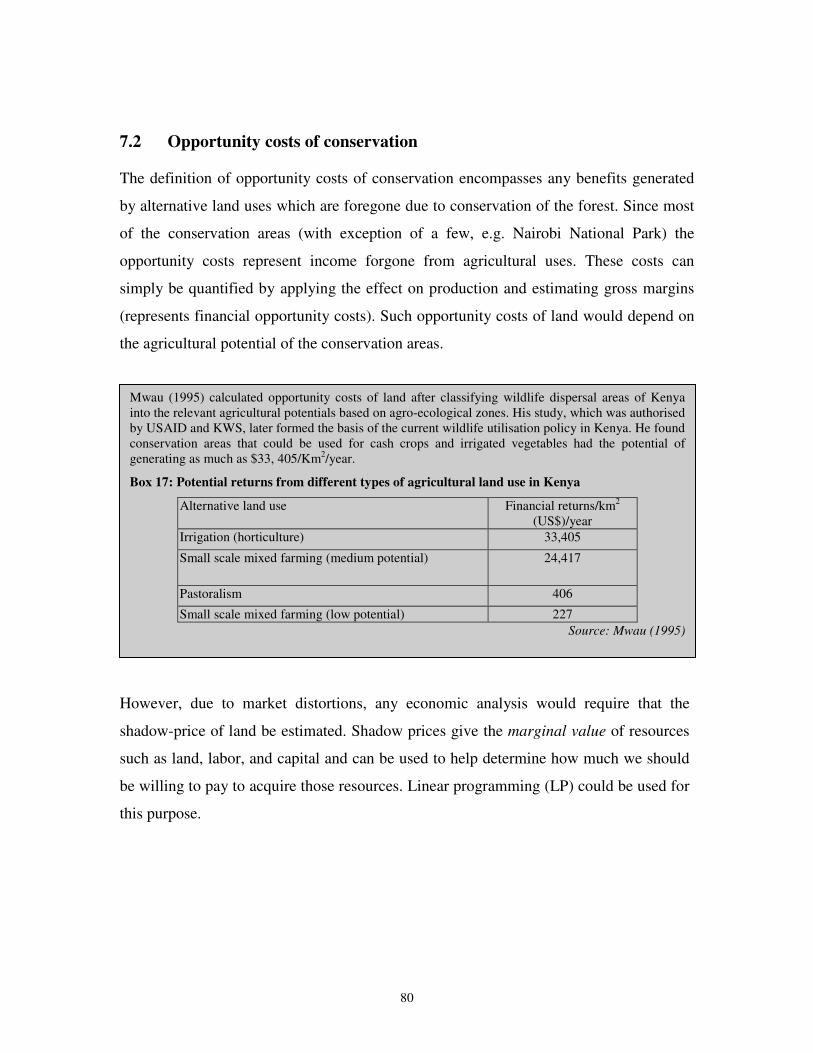
80
7.2 Opportunity costs of conservation
The definition of opportunity costs of conservation encompasses any benefits generated
by alternative land uses which are foregone due to conservation of the forest. Since most
of the conservation areas (with exception of a few, e.g. Nairobi National Park) the
opportunity costs represent income forgone from agricultural uses. These costs can
simply be quantified by applying the effect on production and estimating gross margins
(represents financial opportunity costs). Such opportunity costs of land would depend on
the agricultural potential of the conservation areas.
However, due to market distortions, any economic analysis would require that the
shadow-price of land be estimated. Shadow prices give the marginal value of resources
such as land, labor, and capital and can be used to help determine how much we should
be willing to pay to acquire those resources. Linear programming (LP) could be used for
this purpose.
Mwau (1995) calculated opportunity costs of land after classifying wildlife dispersal areas of Kenya into the relevant agricultural potentials based on agro-ecological zones. His study, which was authorised by USAID and KWS, later formed the basis of the current wildlife utilisation policy in Kenya. He found conservation areas that could be used for cash crops and irrigated vegetables had the potential of generating as much as $33, 405/Km2/year.
Box 17: Potential returns from different types of agricultural land use in Kenya
Alternative land use Financial returns/km2 (US$)/year
Irrigation (horticulture) 33,405
Small scale mixed farming (medium potential) 24,417
Pastoralism 406
Small scale mixed farming (low potential) 227
Source: Mwau (1995)
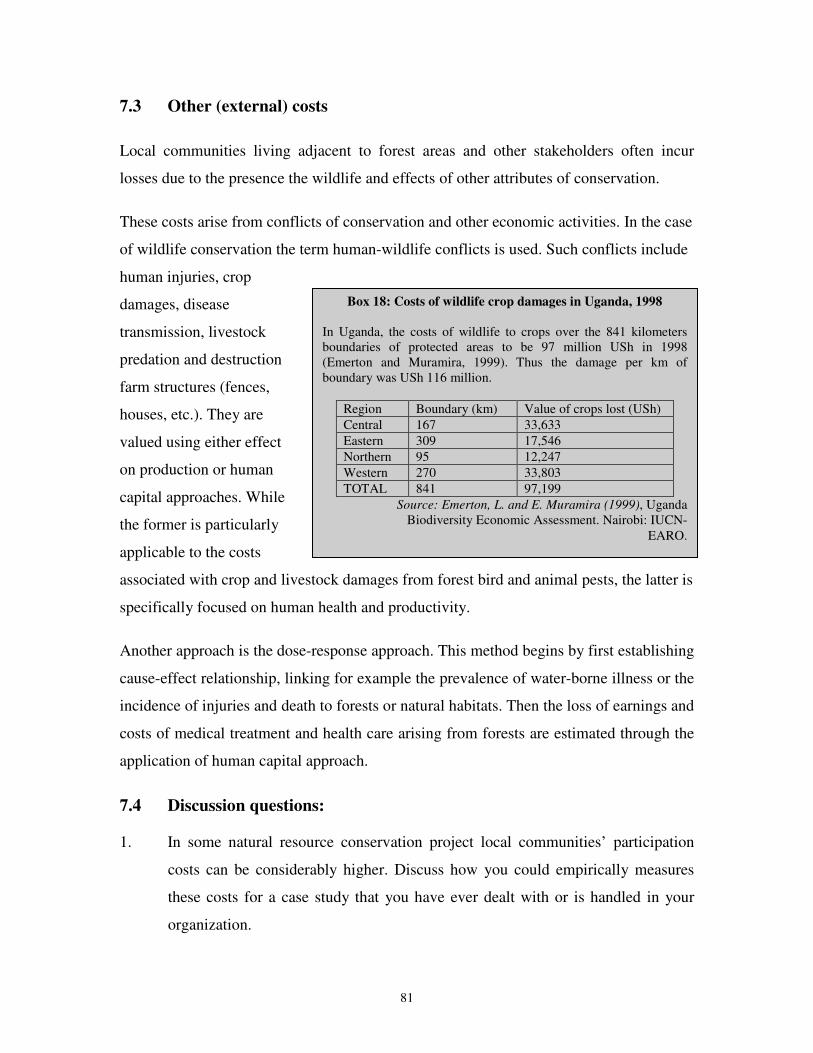
81
7.3 Other (external) costs
Local communities living adjacent to forest areas and other stakeholders often incur
losses due to the presence the wildlife and effects of other attributes of conservation.
These costs arise from conflicts of conservation and other economic activities. In the case
of wildlife conservation the term human-wildlife conflicts is used. Such conflicts include
human injuries, crop
damages, disease
transmission, livestock
predation and destruction
farm structures (fences,
houses, etc.). They are
valued using either effect
on production or human
capital approaches. While
the former is particularly
applicable to the costs
associated with crop and livestock damages from forest bird and animal pests, the latter is
specifically focused on human health and productivity.
Another approach is the dose-response approach. This method begins by first establishing
cause-effect relationship, linking for example the prevalence of water-borne illness or the
incidence of injuries and death to forests or natural habitats. Then the loss of earnings and
costs of medical treatment and health care arising from forests are estimated through the
application of human capital approach.
7.4 Discussion questions:
1. In some natural resource conservation project local communities’ participation
costs can be considerably higher. Discuss how you could empirically measures
these costs for a case study that you have ever dealt with or is handled in your
organization.
Box 18: Costs of wildlife crop damages in Uganda, 1998
In Uganda, the costs of wildlife to crops over the 841 kilometers boundaries of protected areas to be 97 million USh in 1998 (Emerton and Muramira, 1999). Thus the damage per km of boundary was USh 116 million.
Region Boundary (km) Value of crops lost (USh)
Central 167 33,633
Eastern 309 17,546
Northern 95 12,247
Western 270 33,803
TOTAL 841 97,199
Source: Emerton, L. and E. Muramira (1999), Uganda Biodiversity Economic Assessment. Nairobi: IUCN-
EARO.
82
2. What difficulties would you face in measuring direct management costs of
conservation initiatives in Kenya?
3. Why do you think opportunity costs of conservation are rarely considered in
policy making processes in Kenya?
4. Benefits from natural resources like the Kakamega Forest are enjoyed by
humanity well beyond the vicinity of the resource and national boundaries.
Should the cost of sustaining the resource be carried by the communities living
around the forest and the specific nation alone? If the answer is no, discuss the
options available and the problems likely to be experienced in implementing
them.
83
Part C: Decision Criteria in Practice
Introduction
Conservation of natural resources and biodiversity involves many stakeholders (for
example local communities, the local authorities, the central government, organizations
that are involved in conservation and others). Any conservation policy is likely to have
different impacts on different stakeholders. Therefore, it is important to identify and
weigh the different impacts of any given environmental policy and determine how it
impacts the different stakeholders (See Chapter 5). Later dollar or monetary values
should be attached to these impacts and gauge their effects in a financial or economic
analysis.
Regulation of conservation and environmental policies involves high magnitudes of costs
and therefore it’s important to weigh the costs incurred against benefits accrued to arrive
at an informed decision. Decision making process involves identifying the likely impacts
(positive & negative), weighing them in a standardized way (for example by attaching a
monetary value to them), and finally applying a certain decision criteria. In the following
sections tools available for decision making in a natural resource management setting are
described:
8. Environmental Impact Assessment (EIA)
8.1 Introduction to Environmental Impact assessment (EIA)
As indicted in Chapter 5, EIA involves description and quantification of impacts of given
policy options. However, EIA does not require full information about costs and benefits;
impacts are not expressed in monetary terms. The onus of decision-making is left with
policy makers to weigh different impacts against each other. EIA is a very important aid
to CBA.
84
Definition of EIA and its Importance
Environmental Impact Assessment (EIA) is a policy and management tool for both
planning and decision-making. It is a systematic process that assists to identify predict
and evaluate the foreseeable environmental consequences of proposed development
projects, plans and policies. The process is applied prior to major decisions and
commitments being done. The outcome of an EIA study assists the decision maker and
the general public to determine whether a project should be implemented and in what
form.
EIA involves description and quantification of impacts of given policy options. However,
it does not require full information about costs and benefits; impacts are not expressed in
monetary terms. The onus of decision-making is left with policy makers to weigh
different impacts against each other. EIA is a very important aid to CBA.
EIA is not restricted to or biased to the examination and mitigation of negative impacts
alone. EIA can also look into the possible positive issues due to the developmental
projects and explore or suggest ways of enhancing them further by carrying out
modifications in the project.
The purpose of EIA is to:
- Provide information for decision making on the environmental consequences of
proposed actions; and
- Promote environmentally sound and sustainable development through the
identification of appropriate enhancement and mitigation measures
Reducing the burden of environmental impacts is necessary if development is to become
sustainable. The role of EIA is formally recognized in Principle 17 of the Rio
Declaration on Environment and Development:
“Environmental Impact Assessment as a national instrument shall be undertaken for
proposed activities that are likely to have a significant adverse impact on the environment
and are subject to a decision of a competent national authority”
85
In practice, EIA is applied to prevent or minimize the adverse effects of major
development proposals.
The immediate aim of EIA is to inform the process of decision-making by identifying the
potentially significant environmental effects and risks of development proposals. The
ultimate or long term aim of EIA is to promote sustainable development by ensuring that
development proposals do not undermine critical resource and ecological function or the
well being, lifestyle and livelihood of the communities and people who depend on them.
Immediate objectives of EIA:
- improve the environmental design of the proposal
- ensure that resources are used appropriately and efficiently;
- identify appropriate measures for mitigating the potential impacts of the proposal;
- facilitate informed decision making including setting the environmental terms and
conditions for implementing the proposal
Long term objectives of EIA:
- protect human health and safety
- avoid irreversible changes and serious damage to the environment
- safeguard valued resources, natural areas and ecosystem components and
- enhance the social aspects of the proposal
The benefits of EIA can be direct, such as the improved design or location of a project, or
indirect such as better quality EIA work or raised environmental awareness of the
personnel involved in the project. Specific benefits may include:
- Better environmental planning and design of a proposal- carrying out an EIA
entails an analysis of alternatives in the design and location of projects. This can
result in the selection of an improved technology which lowers waste outputs or
an environmentally optimum location for a project. A well designed project can
minimize risks and impacts on the environment and people and thereby avoid
associated costs of remedial treatment or compensation for damage
86
- Ensuring compliance with environmental standards – compliance with
environmental standards reduces damage to the environment and disruption to
communities. It also avoids the likelihood of penalties, fines and loss of trust and
credibility
- Savings in capital and operating costs – EIA can avoid the undue costs of
unanticipated impacts. These can escalate if environmental problems have not
been considered from the start of proposal design and require rectification later
- Reduced time and costs of approval of development applications: if all
environmental concerns have been taken into account properly before submission
for project approval, then it is unlikely that delays will occur as a result of
decision makers asking for additional information or alterations to mitigation
measures
- Increased project acceptance by the public – this is achieved by an open and
transparent EIA process with provision of opportunities for public involvement
that are most directly affected by and interested in the proposal.
8.2 Overview of EIA Processes
EIA is generally conducted in tiers. In most cases, the process falls into four tiers, as
explained in the figure below. Conducting EIA in tiers helps optimize the resources as
well as to increase the effectiveness of the exercise by maintaining a better focus.
1. Screening
This is a process to decide whether the EIA process is applicable at all to the
development project. It aims to clear all those projects where there are no major negative
impact issues. Screening criteria generally involve the specification of the location, type
and size of the project. (In Kenya, the regulations set by EMCA 2000 also stipulate the
nature of projects that require EIA).
Screening thresholds are generally set considering the project type, size and location.
The project type and size are used to estimate the extent of the impacts while the
87
thresholds of the project size depend on the project type. Financial institutions also have
specific guidelines for screening projects to ascertain whether an EIA is required or not –
e.g. ADB, USAID, WB.
2. Scoping
If screening does not automatically clear a project, then the developer is asked to
undertake a scooping exercise. This step helps in understanding the extent of
environmental impacts and identifies significant environmental issues for further study.
It involves sufficient research and expert advice to identify the project’s key impacts on
the local environment in terms of impact issues and to evaluate briefly the importance of
the critical issues to the various stakeholders apart from the decision makers. Setting the
boundaries of the assessment is the most important step of the entire EIA. Too narrow a
scope will likely leave out an important factor or effect, but too broad a scope may make
the analysis unwieldy or take too long a time. Other aspects of scooping are to choose
the important issues to be resolved and to agree on responsibilities for performing the
EIA.
The scooping exercise should involve:
- review of all written materials on the purpose, need or prospectus for the
project
- perform field reconnaissance of the desired site or sites for the project
- interview local residents and affected communities that use resources;
- consult with other agencies that have expertise, jurisdiction, or influence on
the decision to approve, design, or site a project;
- consult with local or regional scientists at colleges, universities, institutes or
field stations;
- visit local political leaders where the project may be sited
3. The Initial Environmental Examination (IEE)
IEE is a process of further enquiry into the impact assessment, taking clues from the
exercise of scooping. IEE focuses on the assessment of impacts and identification of
obvious mitigation measures. This is done by conducting baseline information and by
88
collecting any available secondary data. This assessment aims to grade the impacts in
terms of significance. Significance of the impact is expressed in terms of “highly
significant” or “of minor significance” or in terms of additional descriptors such as
“reversible”, “irreversible” “short-term” or “long-term” etc. The idea of assessing the
significance of impacts is to identify suitable mitigation measures. The level of
mitigation measures suggested is based on the understanding o the severity of the
impacts.
The IEE results in:
- a brief description of the expected or predicted environmental changes due to the
project
- measures or procedures that could be implemented to avoid or reduce the impacts
on the environment;
- examination of alternatives, including the proposed action and no action;
- additional study requirements, regulatory requirements and other coordination
requirements for the detailed EIA, if required.
Alternatives should be feasible and substantially different from each other
4. Detailed or Comprehensive EIA
In this step, a detailed examination of impacts is carried out by conducting relevant
surveys along the lines of IEE.
All significant impacts are examined once again in the formal framework of
identification, prediction, and assessment and all issues previously dealt in the IEE level
are reassessed for adequacy. The final recommendations in the detailed EIA extend
beyond the mitigation measures to include the necessary institutional set up for the
support of the overall environmental management system.
Prediction scientifically characterizes the impact’s causes and effects, and its secondary
and synergetic consequences for the environment and the local community. Prediction
draws on physical, biological, socio-economic and anthropological data and techniques.
89
In quantifying impacts, it may employ mathematical models, photomontages, physical
models, socio-cultural models, economic models, experiments or expert judgments.
Assessment evaluates the predicted adverse impacts to determine whether they are
significant enough to need mitigation. The judgment of significance can be based on:
- Comparison with laws, regulations, or accepted standards;
- Consultation with the relevant decision makers;
- Reference to pre-set criteria such as protected sites, features or species
- Consistence with government policy objectives;
- Acceptability to the local community or the general public.
If the impacts matter, the next step is to answer what can be done about them. A range of
measures are proposed to prevent, reduce, remedy or compensate each of the adverse
impacts evaluated as significant. Possible mitigation measures may include:
- changing project site, routes, processes, raw materials, operating methods, waste
disposal routes or locations or engineering designs.
- Introducing pollution controls, monitoring, phased implementation, landscaping,
personnel training, involving social services or public education.
- Offering as compensation, restoration of damaged resources, money to affected
persons, concessions on other issues, or fit site programs to enhance some other
aspects of the environment or quality of life for the community.
At the end of a detailed EIA, an evaluation is performed considering all the project costs
and project benefits to establish an overall cost effectiveness of the modified project.
Mitigation measures are implemented as part of impact management. This process is
accompanied by monitoring to check that impacts are as predicted. When unforeseen
impacts or problems occur, they can require corrective action to keep them within
acceptable levels, thereby changing mitigation measures recommended in an EIA or set
out in an environmental management report.
90
5. Reporting
The EIA report or impact statement is a primary document for decision making. It
organizes the information obtained and synthesizes the results of the studies and
consultations undertaken. A full yet concise account of the likely environmental impacts
of a proposal are given as well as the recommended measures for mitigating and
managing them and their significance of any residual effects.
The audience of an EIA report includes the authorising and implementing agencies, other
interested parties and the affected public. Because of its importance as a communications
tool, the EIA report needs to be well organized and clearly written. An effective report
will be written both in plain language for non-experts but also to appropriate technical
standards.
Different names are used for the report that is prepared on the findings of the EIA
process. Some call it EIA Report, others Environmental Impact Statement (EIS) or
Environmental Statement (ES).
The proponent is responsible for the preparation of the EIA report. A successful EIA
report should be:
- Actionable – a document that can be applied by the proponent to achieve
environmentally sound planning and design;
- Decision-relevant – a document that organizes and presents the
information necessary for project authorization and if applicable,
permitting and licensing; and
- User-friendly – a document that communicates the technical issues to all
parties in a clear and comprehensible way.
6. Review of EIA Quality
The purpose of review is to assure the completeness and quality of the information
gathered in an EIA. The review marks the final check of quality of the EIA report
91
submitted to obtain a project authorization. The key objectives of the review are: to
assess the adequacy and quality of an EIA report; to take account of public comment; and
to identify as necessary, the deficiencies that must be addressed before the report can be
submitted.
In many EIA systems, the review stage is the major opportunity for public involvement.
They range from notification of a period for receiving written comments on the EIA
report to holding public hearings.
7. Decision Making
Decision-making is the process of choosing between alternative courses of action. The
process is essentially political in nature. It involves weighing the benefits and costs and
making trade-offs among a range of considerations. The views of interested parties are
presented directly and decisions are made through an incremental process of negotiation,
bargaining and compromise. The process culminates in a final decision on whether or
not a proposal is acceptable and under what conditions.
8. Implementation and Follow up
Without appropriate implementation and follow up to decision-making, EIA becomes a
paper exercise to secure an approval, rather than a practical exercise to achieve
environmental benefits. The purpose of EIA implementation and follow up is to ensure
that the condition attached to project approval are carried out and function effectively,
and to gain information that can be used to improve EIA practice.
When used systematically, EIA implementation and follow up help optimize
environmental benefits at each stage of project development.
8.3 EIA Methods And Tools
EIA methods are usually taken to include the means of gathering and analyzing data, the
sequence of steps in preparing a report and the procedure (who does what and when).
While the key components of the EIA process are universally agreed upon, EIA
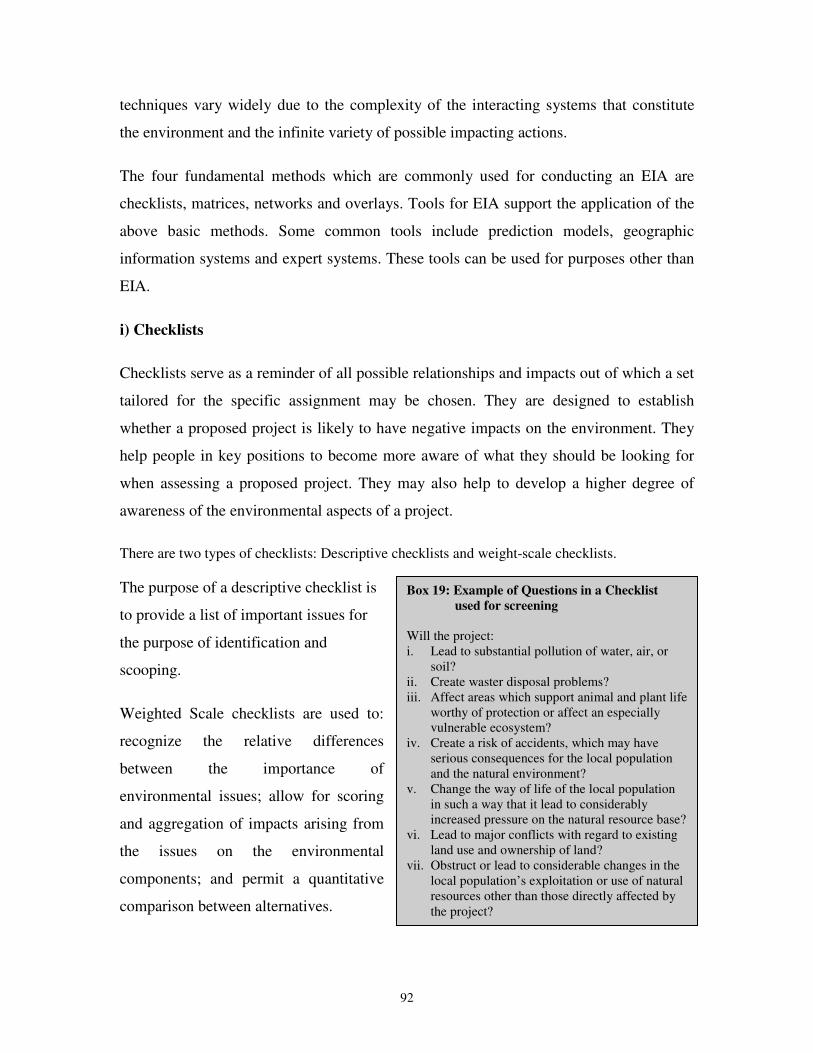
92
Box 19: Example of Questions in a Checklist
used for screening
Will the project: i. Lead to substantial pollution of water, air, or
soil? ii. Create waster disposal problems? iii. Affect areas which support animal and plant life
worthy of protection or affect an especially vulnerable ecosystem?
iv. Create a risk of accidents, which may have serious consequences for the local population and the natural environment?
v. Change the way of life of the local population in such a way that it lead to considerably increased pressure on the natural resource base?
vi. Lead to major conflicts with regard to existing land use and ownership of land?
vii. Obstruct or lead to considerable changes in the local population’s exploitation or use of natural resources other than those directly affected by the project?
techniques vary widely due to the complexity of the interacting systems that constitute
the environment and the infinite variety of possible impacting actions.
The four fundamental methods which are commonly used for conducting an EIA are
checklists, matrices, networks and overlays. Tools for EIA support the application of the
above basic methods. Some common tools include prediction models, geographic
information systems and expert systems. These tools can be used for purposes other than
EIA.
i) Checklists
Checklists serve as a reminder of all possible relationships and impacts out of which a set
tailored for the specific assignment may be chosen. They are designed to establish
whether a proposed project is likely to have negative impacts on the environment. They
help people in key positions to become more aware of what they should be looking for
when assessing a proposed project. They may also help to develop a higher degree of
awareness of the environmental aspects of a project.
There are two types of checklists: Descriptive checklists and weight-scale checklists.
The purpose of a descriptive checklist is
to provide a list of important issues for
the purpose of identification and
scooping.
Weighted Scale checklists are used to:
recognize the relative differences
between the importance of
environmental issues; allow for scoring
and aggregation of impacts arising from
the issues on the environmental
components; and permit a quantitative
comparison between alternatives.
93
ii) Matrix
Matrices relate activities to environmental components so that the box at each
intersection can be used to indicate a possible impact. The matrix is used to identify
impacts by systematically checking each development activity against each
environmental component. Matrix is therefore an extension of the basic checklist.
There are three commonly used types of matrices: Descriptive matrices; symbolic and
presentation matrices; and scaled/weighted or numeric matrices.
iii) Networks
Investigation of higher order linkages in two dimensions can be carried out by using
directional diagrams called networks. Networks are developed to explicitly consider the
secondary, tertiary and higher order impacts that can arise from an initial impact. The
objective of network approach is to display, in an easily understood format, the
intermediate link between a project and its ultimate impacts.
iv) Overlays
The overlay approach to impact assessment involves the use of a series of transparencies
to identify, predict, assign relation significance to and communicate impacts in a
geographical reference frame larger in scale than a localized action would require. A set
of transparent maps, each of which represents the spatial variation of an environmental
parameter are prepared. The maps are shaded to show three degrees of parameter
compatibility with the proposed project. A composite picture of the overall social cost of
affecting any particular area is approximated by superimposing all the transparent maps.
Any number of project alternatives can be located on the final map to investigate the
degree of associated impacts.
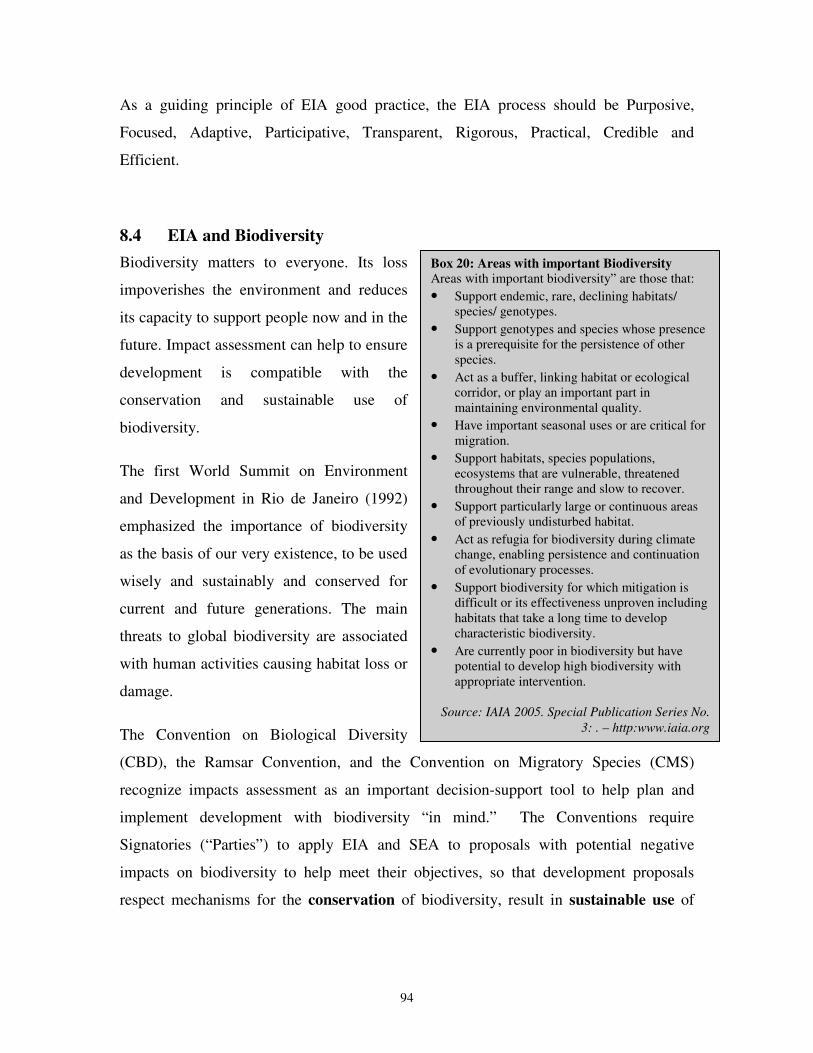
94
Box 20: Areas with important Biodiversity
Areas with important biodiversity” are those that:
• Support endemic, rare, declining habitats/ species/ genotypes.
• Support genotypes and species whose presence is a prerequisite for the persistence of other species.
• Act as a buffer, linking habitat or ecological corridor, or play an important part in maintaining environmental quality.
• Have important seasonal uses or are critical for migration.
• Support habitats, species populations, ecosystems that are vulnerable, threatened throughout their range and slow to recover.
• Support particularly large or continuous areas of previously undisturbed habitat.
• Act as refugia for biodiversity during climate change, enabling persistence and continuation of evolutionary processes.
• Support biodiversity for which mitigation is difficult or its effectiveness unproven including habitats that take a long time to develop characteristic biodiversity.
• Are currently poor in biodiversity but have potential to develop high biodiversity with appropriate intervention.
Source: IAIA 2005. Special Publication Series No.
3: . – http:www.iaia.org
As a guiding principle of EIA good practice, the EIA process should be Purposive,
Focused, Adaptive, Participative, Transparent, Rigorous, Practical, Credible and
Efficient.
8.4 EIA and Biodiversity
Biodiversity matters to everyone. Its loss
impoverishes the environment and reduces
its capacity to support people now and in the
future. Impact assessment can help to ensure
development is compatible with the
conservation and sustainable use of
biodiversity.
The first World Summit on Environment
and Development in Rio de Janeiro (1992)
emphasized the importance of biodiversity
as the basis of our very existence, to be used
wisely and sustainably and conserved for
current and future generations. The main
threats to global biodiversity are associated
with human activities causing habitat loss or
damage.
The Convention on Biological Diversity
(CBD), the Ramsar Convention, and the Convention on Migratory Species (CMS)
recognize impacts assessment as an important decision-support tool to help plan and
implement development with biodiversity “in mind.” The Conventions require
Signatories (“Parties”) to apply EIA and SEA to proposals with potential negative
impacts on biodiversity to help meet their objectives, so that development proposals
respect mechanisms for the conservation of biodiversity, result in sustainable use of
95
biodiversity resources, and ensure fair and equitable sharing of the benefits arising
from use of biodiversity.
Impact assessment provides opportunities to ensure that biodiversity values are
recognized and taken into account in decision-making. Importantly, this involves a
participatory approach with people who might be affected by a proposal.
Operating principles
1. Screening.
Use biodiversity inclusive screening criteria to determine whether important biodiversity
resources may be affected. Biodiversity screening “triggers” for EIA should include:
• Potential impacts on protected areas and areas supporting protected species.
• Impacts on other areas that are not protected but are important for
biodiversity
• Activities posing a particular threat to biodiversity (in terms of their type,
magnitude, location, duration, timing, reversibility).
• Areas that provide important biodiversity services including extractive
reserves, indigenous people’s territories, wetlands, fish breeding grounds,
soils prone to erosion, relatively undisturbed or characteristic habitat, flood
storage areas, groundwater recharge areas, etc.
Encourage development of a biodiversity screening map indicating important biodiversity
values and ecosystem services. If possible, integrate this activity with the development of
a National Biodiversity Strategy and Action Plan (NBSAP) and/or biodiversity planning
at sub-national levels (e.g., regions, local authorities, towns) to identify conservation
priorities and targets.
2. Scoping.
96
Use scoping as an opportunity to raise awareness of biodiversity concerns and discuss
alternatives to avoid or minimize negative impacts on biodiversity.
The scooping report should address the following issues (on the basis of existing
information and any preliminary surveys or discussions):
1. The type of project, program, plan or policy, possible alternatives and a summary
of activities likely to affect biodiversity;
2. An analysis of opportunities and constraints for biodiversity (include “no net
biodiversity loss” or “biodiversity restoration” alternatives)
3. Expected biophysical changes (in soil, water, air, flora, fauna) resulting from
proposed activities or induced by any socioeconomic changes;
4. Spatial and temporal scale of influence, identifying effects on connectivity
between ecosystems, and potential cumulative effects
5. Available information on baseline conditions and any anticipated trends in
biodiversity in the absence of the proposal
6. Likely biodiversity impacts associated with the proposal in terms of composition,
structure and function
7. Biodiversity services and values identified in consultation with stakeholders and
anticipated changes in these (highlight any irreversible impacts)
8. Possible measures to avoid, minimize, or compensate for significant biodiversity
damage or loss, making reference to any legal requirements
9. Information required to support decision making and summary of important gaps.
10. Proposed IA methodology and timescale
3. Impact study and preparation of EIA Report
Address biodiversity at al appropriate levels and allow for enough survey time to take
seasonal features into account. Focus on processes and services, which are critical to
97
human well-being and the integrity of ecosystems. Explain the main risks and
opportunities for biodiversity. Questions to ask include:
At the gene level, To what extent will the proposal have significant effects on:
• Genetic diversity of species, particularly rare and declining species and those with
identified as priorities in NBSAPs and/or sub-national biodiversity plans?
• Opportunities for species populations to interact, e.g., by increasing habitat
fragmentation and isolation?
• Risk of extinction?
• Persistence of locally-adapted populations?
At the species level,
To what extent will the proposal:
• Alter the species-richness or species-composition of habitats in the study area?
• Alter the species-composition of communities?
• Cause some species to be lost from the area?
• Affect species identified as priorities in NBSAPs and/or sub-national biodiversity
plans?
• Increase the risk of invasion by alien species?
At the ecosystem level,
To what extent will the proposal:
• Change the amount, quality or spatial organization of habitat?
• Affect plans to enhance habitat availability or quality?
• Damage ecosystem processes and services, particularly those on which local
communities rely?
Finally:
• If habitats will be lost or altered, is alternative habitat available to support
associated species populations?
• Are there opportunities to consolidate or connect habitats?
98
Take an ecosystem approach and involve relevant stakeholders (including local
communities). Consider the full range of factors affecting biodiversity. These include
direct drivers of change associated with a proposal (e.g., land conversion and vegetation
removal leading to loss of habitat—a key driver of biodiversity loss, emissions,
disturbance, introduction of alien and genetically modified species, etc.); and indirect
drivers of change which are harder to quantify, including demographic, economic, socio-
political, cultural and technological processes or interventions.
Evaluate impacts of alternatives with reference to the baseline situation. Compare
against thresholds and objectives for biodiversity. Use NBSAPs, sub-national
biodiversity plans and other conservation reports for information and objectives. Take
into account cumulative threats and impacts resulting either from repeated impacts of
projects of the same or different nature over space and time, and/or from proposed plans,
programs or policies.
Biodiversity is influenced by cultural, social, economic and biophysical factors.
Cooperation between different specialists in the IA team is thus essential, as is the
integration of findings which have bearing on biodiversity. Provide insight into cause-
effect chains. If possible, quantify the changes in quality and amount of biodiversity.
Explain the expected consequences of any biodiversity losses associated with the
proposal, including the costs of replacing biodiversity services if they will be damaged by
a proposal.
How do these relate to relevant biodiversity priorities and objectives or any legal
obligations? Indicate the legal issues that create the boundary conditions for decision-
making.
4. Mitigation.
Remedial action can take several forms, i.e., avoidance (or prevention), mitigation
(including restoration and rehabilitation of sites), and compensation. Apply the “positive
planning approach,” where avoidance has priority and compensation is used as a last
resort measure.
99
Avoid “excuse”-type compensation. Look for opportunities to positively enhance
biodiversity. Acknowledge that compensation will not always be possible; there will still
be cases where it is appropriate to say “no” to development proposals on grounds of
irreversible damage to biodiversity.
5. Review for decision-making.
Peer review of environmental reports with regard to biodiversity should be undertaken by
a specialist with appropriate expertise, where biodiversity impacts are significant.
Depending on the level of confidentiality of public decision-making, consideration
should be given to the involvement of affected groups and civil society.
6. Decision-making.
Avoid pitting conservation goals against development goals; balance conservation with
sustainable use for economically viable, and socially and ecologically sustainable
solutions. For important biodiversity issues, apply the precautionary principle where
information is insufficient and the no net loss principle in relation to irreversible losses
associated with the proposal.
7. Management, monitoring, evaluation and auditing.
It is important to recognize that all prediction of biodiversity response to perturbation is
uncertain, especially over long time frames. Management systems and programs,
including clear management targets (or Limits of Acceptable Change (LC)) and
appropriate monitoring, should be set in place to ensure that mitigation is effectively
implemented, unforeseen negative effects are detected and addressed, and any negative
trends are detected. Provision is made for regular auditing of impacts on biodiversity.
Provision should be made for emergency response measures and/or contingency plans
where upset or accident conditions could threaten biodiversity.
100
8.5 Environmental Audits
An environmental audit is a systematic, documented, periodic and objective evaluation of
activities and processes of an on-going project carried out to determine how gar these
activities and programs conform with the approved environmental management plan of
that specific project and sound environmental management practices.
A comprehensive EA promotes safe and healthy environment at all stages of a project
operations as well as decommissioning. The goal of EA is to establish if proponents of a
project are complying with the environmental requirements and enforcing legislation.
An EA seeks to appraise all project activities, including production of goods and services,
taking into consideration environmental regulatory frameworks, environmental standards,
environmental health and safety measures and sustainable use of natural resources.
In Kenya, EA is mandatory for all on-going projects commenced and or have been in
operation prior to the coming into force of the Environmental (Impact Assessment and
Audit) Regulations, 2003 as well as new projects undertaken after completion of an EIA
study report and a license issued.
8.6 Environmental Impact Assessment: Case Studies
Case One: Thai National Fertilizer Corporation Project.
Source: Modak P and Asit. K. B., 1999
Project background
This was an ammonia and phosphate fertilizer manufacturing complex. It would produce
nitrogen-phosphorus (NP) granules, nitrogen-phosphorus-potassiun (NPK) granules, urea
granules with small amounts of ammonia phosphoric acid, mono-ammonium phosphate
(MAP) and di-ammonium phosphate (DAP). The project complex would occupy an area
of approximately 1.6 km2 on the Gulf of Thailand and would require an additional area of
more than 1km2 to the east of the main plant location, for phosphogypsum storage. The
complex would employ a work force of about 3,000 workers during the construction
stage and approximately 700 during operation. Most of the complex output would be
101
shipped to domestic dealers for further distribution. Solid raw materials required by the
complex would be brought to the complex by ship. Products would be distributed by
barge and by truck, or rail. Wate would be supplied from Dok Krai reservoir. Power
would be available from the Provincial Electricity Authority.
Environmental Effects from the Project:
a) Adverse effects on physical resources
• Potential impacts to surface water quality during construction could arise from
dust emissions (from vehicles and disturbance of soil cover), high suspended
solids (from storm water run-off) and sanitary waster (from construction
personnel).
• Discharge of wastewater from the fertilizer complex, under all-flow conditions,
would increase the concentration of sea water contaminants in the area near the
discharge point. Sea water within a short distance from the discharge point will be
hazardous to marine life.
• The topography would be affected temporarily during the construction phase
• Construction and operation activities would generate localized sources of high
noise level.
b) Adverse effects on ecological resources
• Impacts on fresh water ecology in the two nearby streams due to increase in total
dissolved solids and turbidity of the water from erosion and run off.
Sedimentation from erosion and surface run of will also affect living conditions
such as respiratory processes and feeding habits of benthic organisms and some
fish.
c) Adverse effects on human use values
• The project complex would change the existing land use pattern in the project
area from agricultural areas, villages etc to the fertilizer plant and gymsum stack.
102
Houses and the crops in the plant site would be removed and the land owners will
have to find a new place to settle.
• Tow unpaved roads located in the plant site area and used b local commuters
would be eliminated by plant construction. Traffic volumes would generally
increase near the project area.
Some suggested measures for offsetting adverse effects
• Shifting the complex in an area where many of the existing environmental
resources/values are not of prime importance
• Procedures in the construction period to involve preferential use of local labour to
minimize the number of workers who migrate to the area; use of dust suppressant
spraying to minimize fugitive dust during construction activities; use of temporary
dams to control erosion and promote settling of particles from storm-water run-off
to prevent damage to surface waters and aquatic ecosystems; provision of sanitary
waste facilities for workers and cooperation with local and provincial public
health authorities.
• Plant operational procedures that utilize evaporation from the gypsum cooling
pond to minimize wastewater discharge.
• Application of noise criteria that will meet the standards for occupational noise
within the plant boundary.
• Commitment by the project to conduct environmental monitoring activities during
construction and operation of the complex so as to verify the protection of the
health and welfare of workers, nearby population and the surrounding
environment.
Case two: EIA of Common Salt Production on Mangrove Wetlands.
Mangrove wetlands are complex ecosystems comprising mangrove, other plants, animals,
micro-organisms, water and soils. They occur mainly in tropical climates and in some
warm temperate regions. As mangrove ecosystems are influenced by both fresh and sea
water, the main hydrographic factors areas river and water input and tides.
103
Mangrove wetlands provide habitat for fish and other animals. They protect the coast
from erosion, reduce siltation in corals, provide recreational, educational and scientific
research grounds, support biodiversity, control pollution, provide man with food, fuel and
medicinal products as well building materials. In order for these uses to be realized,
many complex physical, chemical and biological process take place in the wetlands.
Common salt is one of the most widespread minerals in the coast of East Africa. In
Kenya for instance, extensive salt works cover over 5,000 hectares of the Gongeni-
Fundisa and Kurawa areas. Mangrove wetlands cover about 4.2% of the land in Gongeni-
Fundisa and Kurawa areas.
Some reported environmental impacts of common salt production in Kenya:
• Displacement of local inhabitants and associate problems – inadequate
compensation, high cost of settling in new land; limited access to mangrove
wetland resources and other marine resources.
• Coastal erosion and ecosystems disturbance due to clearance of mangroves –
mainly due to vegetation clearance and hence exposure of the coastline to eroding
forces of the sea.
• Discharge of final water (after extraction of common salt) into ecosystems
without first reducing their high salinity – this has been observed to result in
drying up of some vegetation living only those tolerant to such hyper-saline
water;
• Abandonment of projects leaving behind an altered landscape
8.7 Discussion questions
a) What role can EIA play in the management of natural resources in Kenya?
b) What obstacles are hindering realization of this role?
c) What strategies can be formulated to promote use of EIA in the management of natural
resources in Kenya?
104
9. Cost-Benefit Analysis (CBA)
Cost-benefit analysis (CBA) is applied by economists to test the economic viability of an
existing or proposed activity, and/or compare two or more ways of carrying out the
activity. In a natural resource management context cost-benefit analysis involves
subtracting the discounted monetary cost of a given project/activity from the discounted
monetary value of all the benefits generated by the same development to obtain a net
benefit or cost streams for the proposed activity.
CBA can either be carried out ex ante (before the actual implementation of a project) or
ex post (after implementation of the project). CBA always involves with and without
project comparisons to calculate the net incremental benefits that accrue from a given
project. The final decision is based on one of the three possible criteria of maximum net
present value (NPV), benefit-cost ratio or positive net present value.
Carrying out a cost-benefit analysis involves the following stages:
9.1 Stages of conducting cost
Defining the project
The first step involves defining the project in terms of the resources being re-allocated,
for example, clearing of a given forest to create human settlement and secondly the
population that stands to gain or loose from the project over which costs and at which
level (local, national or global). This stage is important because a project cannot be
appraised unless what is to be appraised is known.
Identifying Project Impacts
Once the project is identified, the next step involves identifying all the impacts that result
from its implementation. From the example of settlement given in stage 1 above, this
stage would involve listing all resources used e.g. (labor costs, material costs, costs of
loss of forest), impacts on agricultural production, employment opportunities e.t.c. Two
concepts are important at this stage; additionality and displacement. Additionality refers
105
to the net impacts of the project, for example additional agricultural production arising
from cultivating the cleared forest. Displacement is often important when applied by
development authorities at regional level. A question arises of whether the project will
displace output from an already existing project in another region.
Identifying Impacts that are of Economic Relevance
This step involves identification of all impacts including the non-priced impacts (those
not traded in the market). The positive impacts are classified as benefits, these impacts
either increase the quantity or quality of goods that generate positive effects or reduce the
price at which they occur. Negative impacts are counted as costs will include any
decrease in the quantity or quality of such goods or increase their prices. The negative
effects also include the using-up of resources (inputs of production) in a project
(including the opportunity costs). The actual physical amounts of impacts and the time
when they occur in the project life are determined at this stage. All transfer payments
such as taxes or income transfers are excluded since they are not real impacts but merely
redistribution from one group in the economy to another.
Physical Quantification of Relevant Impacts
This stage involves determining the physical amounts of costs and benefit flows for a
project, and identifying when in time they will occur. In the forest settlement example,
likely future agricultural production, the disrupted ecological services arising from forest
clearing will be considered. The likely environmental impacts can be well captured by
using an environmental impact assessment (described in more details in the consequent
section). It is important to note that at this stage all calculations are carried out with
varying levels of uncertainty.
Monetary Valuation of Relevance Effects
The identified physical measures of impact must be valued in common units. The
common unit in CBA is money, whether in Kshs, dollars, pounds or any other
appropriate currency. Markets generate relative values of all traded goods and services as
relative prices. The other tasks of CBA at this stage include; predicting prices for value
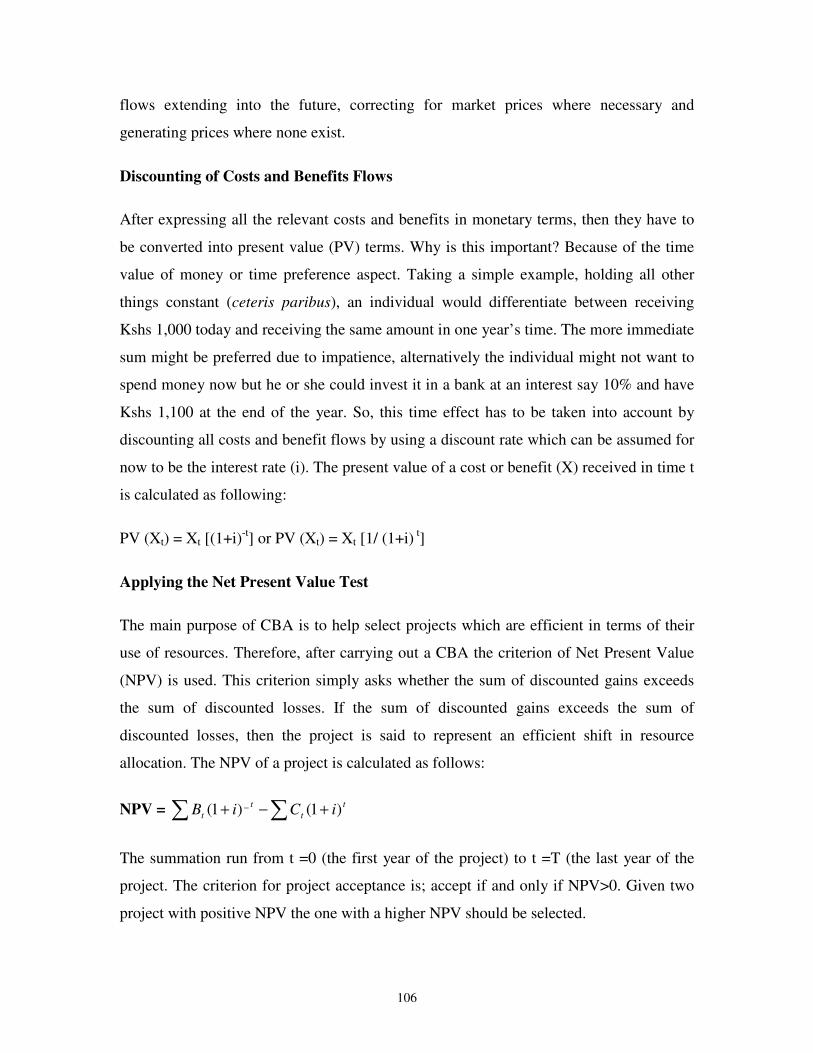
106
flows extending into the future, correcting for market prices where necessary and
generating prices where none exist.
Discounting of Costs and Benefits Flows
After expressing all the relevant costs and benefits in monetary terms, then they have to
be converted into present value (PV) terms. Why is this important? Because of the time
value of money or time preference aspect. Taking a simple example, holding all other
things constant (ceteris paribus), an individual would differentiate between receiving
Kshs 1,000 today and receiving the same amount in one year’s time. The more immediate
sum might be preferred due to impatience, alternatively the individual might not want to
spend money now but he or she could invest it in a bank at an interest say 10% and have
Kshs 1,100 at the end of the year. So, this time effect has to be taken into account by
discounting all costs and benefit flows by using a discount rate which can be assumed for
now to be the interest rate (i). The present value of a cost or benefit (X) received in time t
is calculated as following:
PV (Xt) = Xt [(1+i)-t] or PV (Xt) = Xt [1/ (1+i) t]
Applying the Net Present Value Test
The main purpose of CBA is to help select projects which are efficient in terms of their
use of resources. Therefore, after carrying out a CBA the criterion of Net Present Value
(NPV) is used. This criterion simply asks whether the sum of discounted gains exceeds
the sum of discounted losses. If the sum of discounted gains exceeds the sum of
discounted losses, then the project is said to represent an efficient shift in resource
allocation. The NPV of a project is calculated as follows:
NPV = t
t
t
t iCiB )1()1( _+−+ ∑∑
The summation run from t =0 (the first year of the project) to t =T (the last year of the
project. The criterion for project acceptance is; accept if and only if NPV>0. Given two
project with positive NPV the one with a higher NPV should be selected.
107
There are a number of alternatives to NPV, such as internal rate of return (IRR) and
benefit-cost ratio. IRR is a measure frequently applied in financial investment. It is the
rate of return if used as the discount rate of the project would yield a NPV of zero. It is
interpreted as the rate of return on the resources used up in the project, be compared with
the opportunity cost of funds (the prevailing interest rate). However, IRR is criticized as a
measure of resources allocation for two main reasons: first many projects can generate
multiple IRRs for the same data set hence the analyst does not know which criteria to
select as the decision-making criterion. Second IRR is unreliable when comparing
performances across many projects in a portfolio because it compares the returns on one
project to the opportunity cost of funds. Benefit-cost ratio is another way of presenting
NPV. The decision rule is; accept the project if the ratio is above unity.
Conduct sensitivity analysis
As noted in stage 4 above, calculations of physical quantification of impacts are carried
out with varying level of uncertainty. Therefore, it becomes necessary to conduct a
sensitivity analysis to capture the different likely future scenarios. In all ex ante cases of
CBA the analyst must make predictions concerning future physical flows (e.g.
agricultural production) and future relative values. None of these predictions can be mde
with perfect foresight. Therefore, NPV values must be recalculated when certain key
parameters are key parameters are changed. Such parameters include: discount rate,
physical quantities and qualities of inputs, shadow prices of these inputs, physical
quantities and qualities of outputs, shadow prices of these outputs and project life span.
9.2 Major challenges of conducting CBA
The following main problems arise in applying CBA to environmental issues:
a) Valuation of non-market goods such as wildlife and landscapes. How do we do it
and how much reliance should place on estimates generated? Are we acting
immorally by placing money value on such things (environmental ethic)?
b) Ecosystem complexity
108
c) Discounting and discount rate; should society discount? If yes, at what rate? Does
discounting jeopardize the rights of future generation?
d) Is CBA a truly objective way of making decision or can institutions capture it for
their own ends
e) Uncertainty and irreversibility. How can these important concepts be included in a
CBA
9.3 Social or distributive analysis in CBA
The distributive analysis of a conservation project should involve the following
questions: who will benefit from the project and by how much? Who will pay for the
project and how much will they pay? Project sustainability is heavily impacted by which
party in the project’s sphere of influence gains or loses. If an influential group is expected
to bear the burden of losses, then the successful implementation of the project may be
hindered. The risk of a strong political opposition to the project mobilized by the losing
party is a contingency that the project implementers should be prepared to tackle.
Another aspect of distributive analysis is concerned with cases in which projects will
facilitate or hinder the process of helping society address its basic needs. For example, a
road project may not only reduce transportation costs, but also increase the level of
security in a village or allow more children to attend school, both of which are viewed
positively by society. In such cases, society may want to credit a net social external
benefit to the project.
9.4 Examples of Application on CBA in natural resources
Collaborative wildlife management in Kenya
This study by Mburu and Birner (2002) applied CBA to compare interorganizational
efficiency of two different collaborative governance structures for wildlife management
both at landowner’s perspective (financial analysis) as well as at the society level
(economic analysis). The study used two collaborative wildlife management sanctuaries;
Kimana community wildlife sanctuary (of Amboseli national park) and Golini-
Mwaluganje community wildlife service (of Shimba hills national reserve). The results of
109
financial analysis showed that net present value of show that the net present value for the
local management committee arrangement (Kimana BL) is negative while that of the
lease arrangement (Kimana AL) is positive. The financial net present value for the local
management committee was estimated at $ -207,700 while that of lease arrangement was
estimated at $ 45, 600. The marked difference was attributed to the increased benefits
from tourism created by the new management. Economic analysis follows a somewhat
similar pattern. The Kimana BL, had a benefit-cost ratio of less than unity (0.83) while
the Kimana AL had a benefit-cost ratio of 1.52.
Deforestation in Brazil
A study by Andersen (1997), compares the total economic value of standing Amazonian
rain forest with net present value of alternative agricultural land uses. It is shown that, at
the current level of deforestation, the potential benefits of deforestation are higher than
the expected costs. However, as the current level of deforestation increases, the global
costs of deforestation will rise and eventually surpass the value of agricultural land. At
that point the international community will have to provide incentive to Brazil to
conserve the remaining forest. When a discount rate of 6% was applied costs of
deforestation was estimated at $ 3,059 per hectare while benefits were estimated at $
60,255 per hectare. At a lower discount rate of 2 %, a similar pattern was observed; costs
of deforestation were estimated at $ 9,230 per hectare while the benefits were estimated
at $ 121, 900 per hectare.
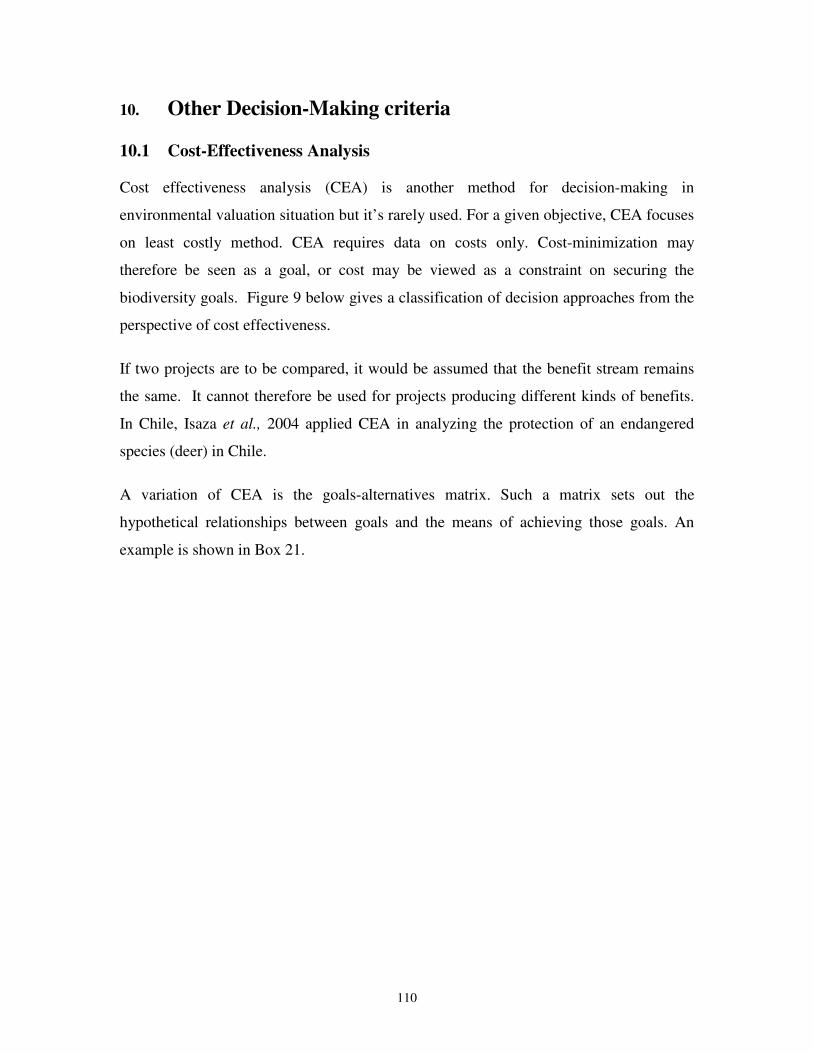
110
10. Other Decision-Making criteria
10.1 Cost-Effectiveness Analysis
Cost effectiveness analysis (CEA) is another method for decision-making in
environmental valuation situation but it’s rarely used. For a given objective, CEA focuses
on least costly method. CEA requires data on costs only. Cost-minimization may
therefore be seen as a goal, or cost may be viewed as a constraint on securing the
biodiversity goals. Figure 9 below gives a classification of decision approaches from the
perspective of cost effectiveness.
If two projects are to be compared, it would be assumed that the benefit stream remains
the same. It cannot therefore be used for projects producing different kinds of benefits.
In Chile, Isaza et al., 2004 applied CEA in analyzing the protection of an endangered
species (deer) in Chile.
A variation of CEA is the goals-alternatives matrix. Such a matrix sets out the
hypothetical relationships between goals and the means of achieving those goals. An
example is shown in Box 21.
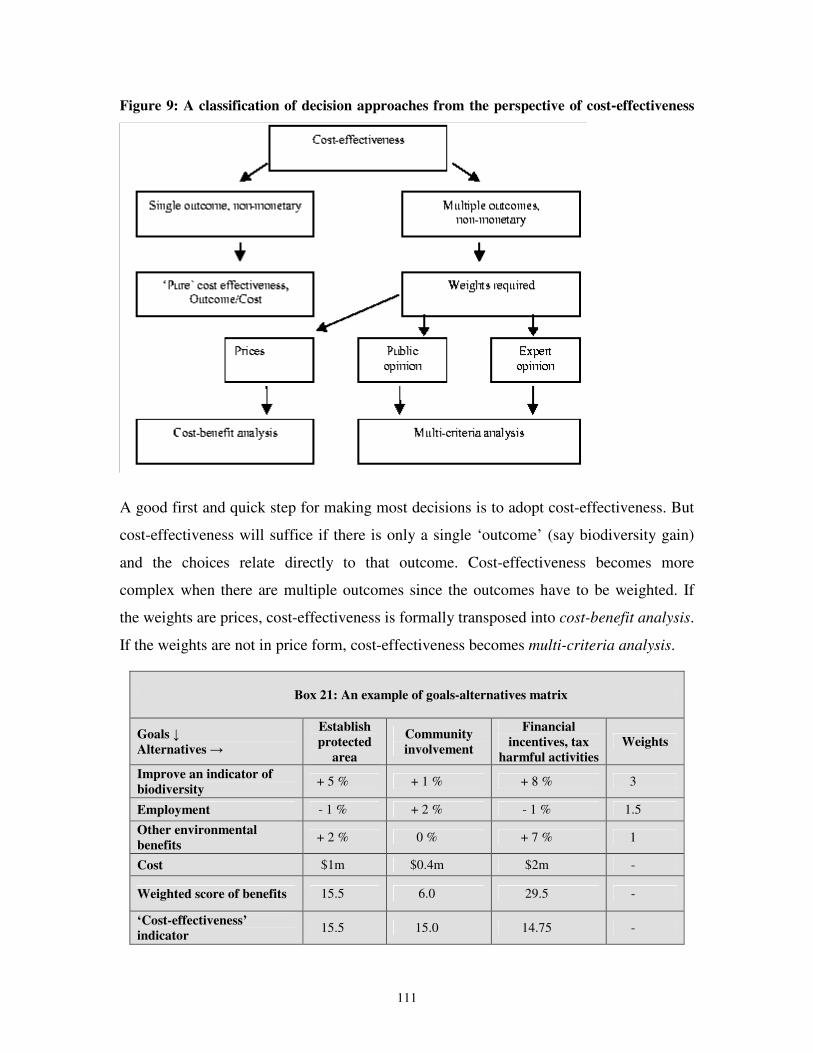
111
Figure 9: A classification of decision approaches from the perspective of cost-effectiveness
A good first and quick step for making most decisions is to adopt cost-effectiveness. But
cost-effectiveness will suffice if there is only a single ‘outcome’ (say biodiversity gain)
and the choices relate directly to that outcome. Cost-effectiveness becomes more
complex when there are multiple outcomes since the outcomes have to be weighted. If
the weights are prices, cost-effectiveness is formally transposed into cost-benefit analysis.
If the weights are not in price form, cost-effectiveness becomes multi-criteria analysis.
Box 21: An example of goals-alternatives matrix
Goals ↓
Alternatives →
Establish
protected
area
Community
involvement
Financial
incentives, tax
harmful activities
Weights
Improve an indicator of
biodiversity + 5 % + 1 % + 8 % 3
Employment - 1 % + 2 % - 1 % 1.5
Other environmental
benefits + 2 % 0 % + 7 % 1
Cost $1m $0.4m $2m -
Weighted score of benefits 15.5 6.0 29.5 -
‘Cost-effectiveness’
indicator 15.5 15.0 14.75 -
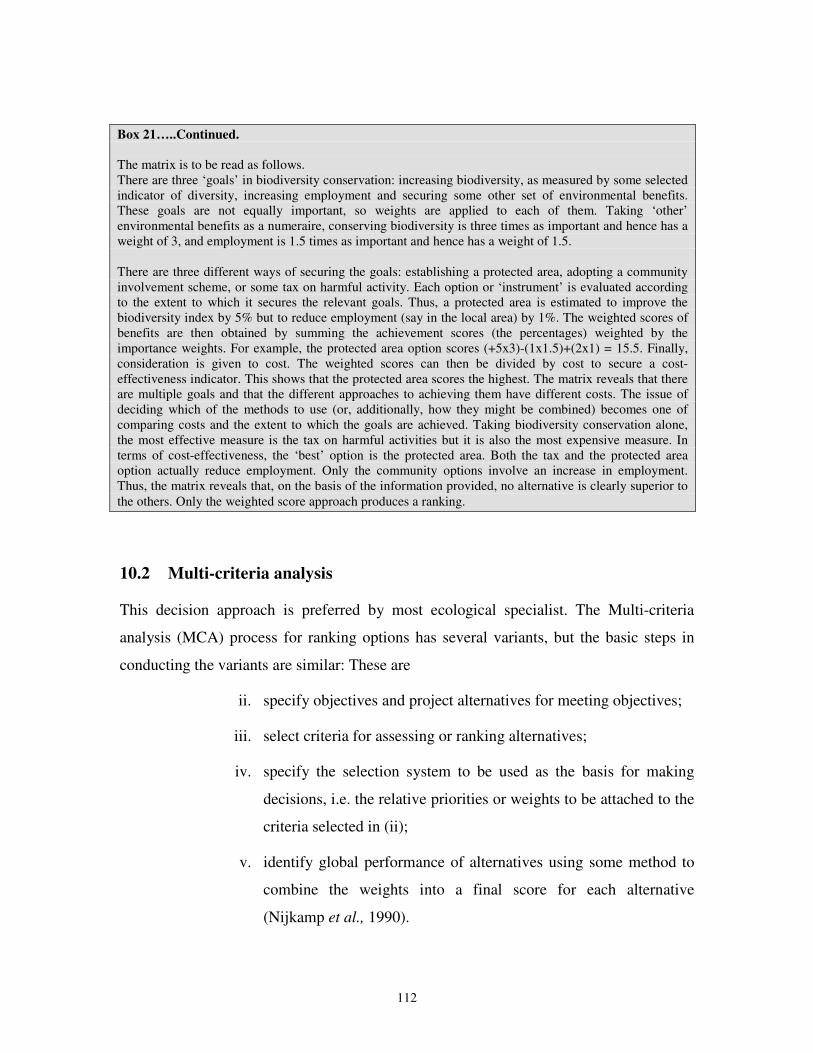
112
10.2 Multi-criteria analysis
This decision approach is preferred by most ecological specialist. The Multi-criteria
analysis (MCA) process for ranking options has several variants, but the basic steps in
conducting the variants are similar: These are
ii. specify objectives and project alternatives for meeting objectives;
iii. select criteria for assessing or ranking alternatives;
iv. specify the selection system to be used as the basis for making
decisions, i.e. the relative priorities or weights to be attached to the
criteria selected in (ii);
v. identify global performance of alternatives using some method to
combine the weights into a final score for each alternative
(Nijkamp et al., 1990).
Box 21…..Continued. The matrix is to be read as follows. There are three ‘goals’ in biodiversity conservation: increasing biodiversity, as measured by some selected indicator of diversity, increasing employment and securing some other set of environmental benefits. These goals are not equally important, so weights are applied to each of them. Taking ‘other’ environmental benefits as a numeraire, conserving biodiversity is three times as important and hence has a weight of 3, and employment is 1.5 times as important and hence has a weight of 1.5. There are three different ways of securing the goals: establishing a protected area, adopting a community involvement scheme, or some tax on harmful activity. Each option or ‘instrument’ is evaluated according to the extent to which it secures the relevant goals. Thus, a protected area is estimated to improve the biodiversity index by 5% but to reduce employment (say in the local area) by 1%. The weighted scores of benefits are then obtained by summing the achievement scores (the percentages) weighted by the importance weights. For example, the protected area option scores (+5x3)-(1x1.5)+(2x1) = 15.5. Finally, consideration is given to cost. The weighted scores can then be divided by cost to secure a cost-effectiveness indicator. This shows that the protected area scores the highest. The matrix reveals that there are multiple goals and that the different approaches to achieving them have different costs. The issue of deciding which of the methods to use (or, additionally, how they might be combined) becomes one of comparing costs and the extent to which the goals are achieved. Taking biodiversity conservation alone, the most effective measure is the tax on harmful activities but it is also the most expensive measure. In terms of cost-effectiveness, the ‘best’ option is the protected area. Both the tax and the protected area option actually reduce employment. Only the community options involve an increase in employment. Thus, the matrix reveals that, on the basis of the information provided, no alternative is clearly superior to the others. Only the weighted score approach produces a ranking.
113
Why would decision-makers prefer MCA?
i) Environmental changes are sometimes perceived as being too complex
and multidimensional to be reduced to single criteria such as economic
efficiency.
ii) The concept of economic efficiency itself can seem too abstract for
decision-makers. Third, the absence of valuation
iii) The absence of valuation information may necessitate an alternative
weighting approach.
10.3 Precautionary approaches
These are decision-making tools or processes that stress the uncertainty of decisions
about biodiversity, i.e. the difficulty of knowing what may be being lost. Namely the
precautionary principle (PP) and safe minimum standards (SMS) imply that biodiversity
has substantial value even if that value is not known in any precise form.
Neither approach produces a notion of the quantitative scale of conservation that is
justified, but both invert the usual notion that conservation and loss of biodiversity have
equal status, or that ‘development’ is superior to conservation. Both argue that the
presumption of policy should be that biodiversity should be conserved. In the case of the
SMS approach, this presumption should be relaxed if and only if the opportunity cost of
conservation is, in some sense, very large. The latter requires that, since we know so little
about the importance of biodiversity, this uncertainty should dictate a very cautious
attitude towards its destruction.
Safe minimum standards
Strictly, SMS refers to the minimum level of preservation that ensures survival. While the
full value of a species or an ecosystem function may not itself be measurable, it is known
to be positive on the grounds that species or functions previously thought to be ‘useless’
have proved to be ‘useful’. Hence something that has positive value should be sacrificed
only if the benefits of that sacrifice are considerable. The burden of proof thus falls on
114
those who wish to destroy biodiversity to demonstrate that the sacrifice is worthwhile.
The SMS principle states that biodiversity should be conserved unless the cost of
conservation is, in some sense, ‘too high’. Thus, the SMS principle is not quite a ‘cost-
free’ notion since it does acknowledge the trade-off context. The implicit value
judgement, however, is that biodiversity has very large values, even if they are not
currently known. Along with strong risk aversion, the SMS approach would make risk
increasing activities more difficult to accept.
The precautionary principle
The precautionary principle, like the SMS approach, offers a different perspective but not
one that deals with the scale of conservation. The exact nature of the principle is unclear,
however. It emphasises prevention rather than cure, and it implies a significant degree of
risk aversion, especially to change that is irreversible. Waiting for better information is
also widely regarded in the precautionary principle literature as not a reason for tolerating
risks. In these formulations, cost plays no role. Risk should be avoided whatever the cost
of doing so. In other formulations, the principle comes closer to a risk-benefit assessment,
i.e. risks are reduced if the costs of reducing them are tolerable or acceptable.
The PP itself is defined very differently in different contexts. In its strictest interpretation
it suggests that no action should be taken if there is any likelihood at all, however small,
that significant biodiversity loss could occur. This likelihood may be independent of the
scientific evidence. That is, unless there is certainty that there are no losses, actions
should not be taken which, for example, release harmful pollutants into the environment.
Perhaps the closest form of the strict PP in practice is the German Vorsorgeprinzip –
widely translated as the precautionary principle - which is designed to secure
Umweltschutz, environmental protection.
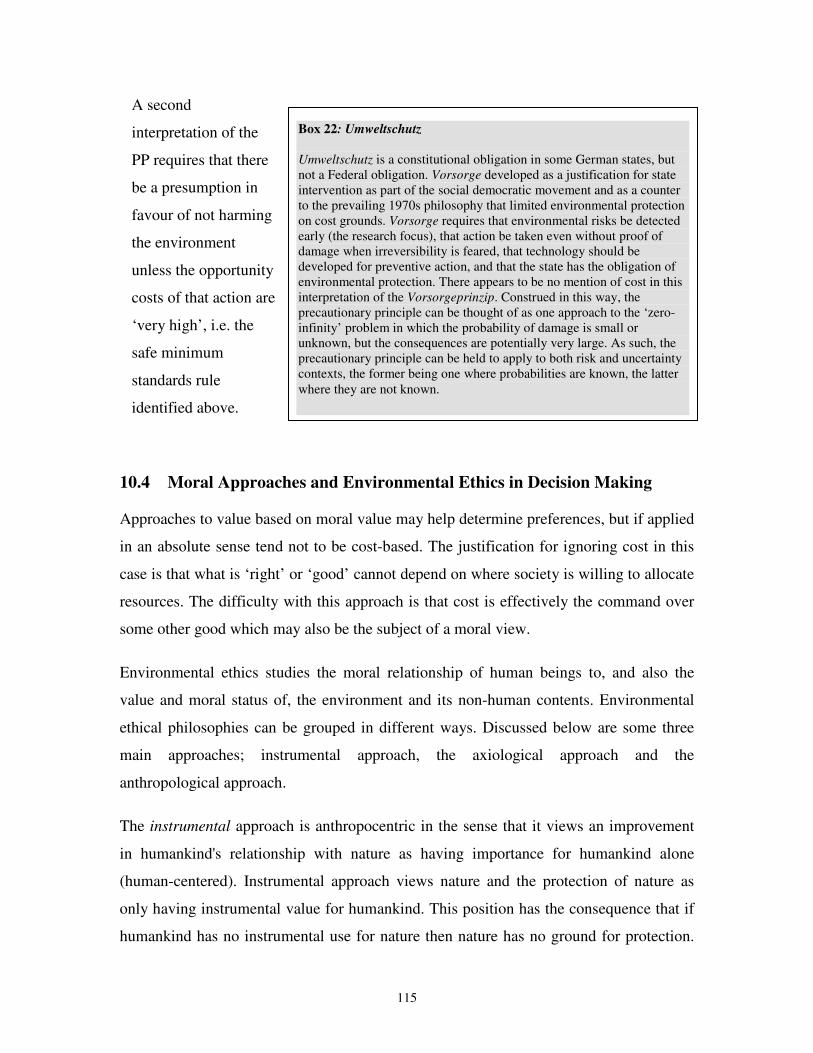
115
A second
interpretation of the
PP requires that there
be a presumption in
favour of not harming
the environment
unless the opportunity
costs of that action are
‘very high’, i.e. the
safe minimum
standards rule
identified above.
10.4 Moral Approaches and Environmental Ethics in Decision Making
Approaches to value based on moral value may help determine preferences, but if applied
in an absolute sense tend not to be cost-based. The justification for ignoring cost in this
case is that what is ‘right’ or ‘good’ cannot depend on where society is willing to allocate
resources. The difficulty with this approach is that cost is effectively the command over
some other good which may also be the subject of a moral view.
Environmental ethics studies the moral relationship of human beings to, and also the
value and moral status of, the environment and its non-human contents. Environmental
ethical philosophies can be grouped in different ways. Discussed below are some three
main approaches; instrumental approach, the axiological approach and the
anthropological approach.
The instrumental approach is anthropocentric in the sense that it views an improvement
in humankind's relationship with nature as having importance for humankind alone
(human-centered). Instrumental approach views nature and the protection of nature as
only having instrumental value for humankind. This position has the consequence that if
humankind has no instrumental use for nature then nature has no ground for protection.
Box 22: Umweltschutz
Umweltschutz is a constitutional obligation in some German states, but not a Federal obligation. Vorsorge developed as a justification for state intervention as part of the social democratic movement and as a counter to the prevailing 1970s philosophy that limited environmental protection on cost grounds. Vorsorge requires that environmental risks be detected early (the research focus), that action be taken even without proof of damage when irreversibility is feared, that technology should be developed for preventive action, and that the state has the obligation of environmental protection. There appears to be no mention of cost in this interpretation of the Vorsorgeprinzip. Construed in this way, the precautionary principle can be thought of as one approach to the ‘zero-infinity’ problem in which the probability of damage is small or unknown, but the consequences are potentially very large. As such, the precautionary principle can be held to apply to both risk and uncertainty contexts, the former being one where probabilities are known, the latter where they are not known.
116
In contrast, the axiological approach argues that nature has intrinsic value and that we
should protect nature because of its intrinsic value. Hence this approach has to establish
what this intrinsic value consists in and where it comes from. The anthropological
approach is primarily concerned with what being human is or what being human ought to
be, and it links this understanding of the nature of humanity to what the relationship
between the human self and nature ought to be. This approach argues that humankind
will engage in a relationship of respect with nature if humankind feels that nature has
intrinsic value. This approach does not require the self's feeling or sense of nature's
intrinsic value to have the epistemic status of knowledge.
10.5 Discussion questions
1. How should we generate the discount rate for discounting net benefits for different stakeholders in environmental valuation?
2. a) Has CBA been applied in any environmental problems in your institution?
b) How can we avoid institutions using the results of CBA for their own
ends?
3. Monetary values should be attached to natural resources in decision-making:
Agree or disagree
117
References
1. Alpizar F., F. Carlsson and P. Martinsson (2001). ‘Using Choice Experiments for Non-market
Valuation’. Economic Issues Vol. 8. Part 1, 2001.
2. Andersen L.E., 1997. A Cost-Benefit Analysis of Deforestation in the Brazilian Amazon. Discussion
Paper No. 445. Institudo de Pesquisa Economica Aplicada (IPEA)
3. Bromley, 1991
4. Canadian Handbook on Health Impact Assessment. ‘The Contribution of Economics to the
Environmental Valuation Process’. http://www.hc-sc.gc.ca/hecsesc/ehas/publications/
canadian_handbook/volume3/chapter_1_part2.htm
5. Canter L.W., 1996 (2nd Ed). Environmental Impact Assessment. McGraw-Hill Inc. Boston
6. Cato, J.C. (1998). ‘Economic Values Associated with Seafood Safety and Implementation of
Seafood Hazard Analysis Critical Control Point (HACCP) Programs’. FAO Fisheries
Technical Paper no. 381. Rome, FAO.
7. Ecosystem valuation website: www.ecosystemvaluation.org
8. Emerton, L. (1999). ‘Economic Tools for Environmental Planning and Management in
Eastern Africa’. Economics and Biodiversity Program, IUCN Eastern Africa Program
9. Emerton, L. and E. Muramira (1999), Uganda Biodiversity Economic Assessment. Nairobi:
IUCN-EARO.
10. Emerton, L., L. Iyango, P. Luwum, A. Malinga (1999). The Present Economic Value of
Nakivubo Urban Wetland. Economics and Biodiversity Program, IUCN Eastern Africa
Program.
11. Emerton, L. (1998). Using Economics for Biodiversity Strategies and Action Plans in Eastern
Africa. Economics and Biodiversity Program, IUCN Eastern Africa Program
12. Emerton 1996. Valuing the subsistence use of forest products in Oldonyo Orok Forest,
Kenya. Rural Development Forestry Network Paper 19e p. 21-30 and Mogaka, H.
(2001).Valuation of local forest conservation costs and benefits: The Case of Tharaka.
Innovation 8 (2), p.20-23
13. Farber S.C., R. Constanza and M.A. Wilson (2002). ‘Economic and Ecological Concepts for
Valuing Ecosystem Services’ Ecological Economics no. 41 (2002). 375-392.
118
14. Groot R.S. de (1992). Functions of Nature: Evaluation of Nature in Environmental Planning,
Management and Decision Making. Wolters-Noordhoff, Groningen, the Netherlands.
15. Hanley N. and Spash C.L., 1993. Cost-Benefit Analysis and the Environment. MPG Book, Bodmin,
Cornwall
16. IAIA 2005. Special Publication Series No. 3: Biodiversity in Impact Assessment. – http:www.iaia.org
17. Isaza C.A. S., Cabrera H.S. and Gomez W.B., 2004. Cost-Effectiveness Analysis in the Protection of
an Endangered Species: The case of Huemul (Hippcamelus bisulcus), in Chile. A Paper Presented in
the Workshop of the First School in Ecological Economics held on March 22-26, 2004.Trieste Italy
18. Kniivila M., Ovaskein V. and Saastamoinen O., 2002. Costs and Benefits of Forest Conservation:
Regional and Local Comparisons in Eastern Finland. Journal of Forest Economics Vol. 8 pp 131-150
19. Lette H., H de Boo (2002). Economic Valuation of Forests and Nature: a Support Tool for
Effective Decision-Making. International Agricultural Centre, Wageningen.
20. Magurran, A. E. (1988) Ecological Diversity and its Measurement, Croom Helm Ltd., London
21. Marriott B. B. 1997. Environmental Impact Assessment – A practical Guide. McGraw-Hill, New York
22. Mburu J. and Birner R., 2002. Analyzing the Efficiency of Collaborative Wildlife Management: The
Case of two Wildlife Sanctuaries in Kenya. International Journal of Organization Theory and
Behavior. Vol. 5, No. 3 & 4 pp259-298
23. McNeely, J. A. (1988) Economic and Biological Diversity: Developing and Using Economic
Incentives to Conserve Biological Resources, IUCN, Gland.
24. Modak P and Asit. K. B., 1999. Conducting Environmental Impact Assessment in Developing
Countries. United Nations University Press, Tokyo
25. Mogaka, H. R. S. Gichere, R. Davies and R. Hirji 2003. Impacts and costs of climate variability and
water resources degradation in Kenya: Rational for promoting improved water resources development
and management. World Bank Publication, Washington D.C.
26. Mugabi, D. (2001), Medicinal plants and the Tepeth Community in Moroto Forest Reserve:
Distribution, Abundance and Economic value. Paper presented at Moroto/Turakana Crossborders
Project Workshop, Moroto, Uganda, 20 November 2001.
27. Nijkamp et al., 1990). Multicriteria
28. North, 1995
119
29. Nsingwire, S. (1995). A Monetary Estimate of the Human Uses of Papyrus. In: Emerton, L.
(1999). ‘Economic Tools for Environmental Planning and Management in Eastern Africa’.
Economics and Biodiversity Program, IUCN Eastern Africa Program.
30. Nunes, P.A., J.C.M van der Bergh (2001). ‘Economic Valuation of Biodiversity: Sense or
Nonsense’. Ecological Economics no. 39 (2001). 203-222.
31. Olewiler, N (2004). The Value of Natural Capital in Settled areas of Canada. Ducks Limited
Canada/ Nature Conversancy of Canada.
32. Pagiola S., K. von Ritter and J. Bishop (2004). Assessing the Economic Value of Ecosystem
Conservation. The World Bank Environment Department Paper no. 101. The World Bank,
Washington DC.
33. Polyakov M.O. (1999). ‘Valuation of Forests in Ukraine’. Thesis. Stockholm.
34. Sadler B and McCabe M. 2002. Environmental Impact Assessment Training Resource Manual,
UNEP: http://www.environment.gov.au/net/eianet/html
35. Woodward R.T. and Y. Wui (2001). ‘The Economic Value of Wetland Services: a Meta
Analysis’. Ecological Economics no. 37 (2001) 257-27
36. USAID/RESO et al, 2002. Participants Sourcebook : African Regional Course in Environmental
Assessment and Environmentally Sound Design for Small-Scale Activities
120
Appendix 1: Evaluating the welfare effects of improved water quality
using the choice experiment method (Abou-Ali and Carlsson, 2004)
The purpose of this study was to estimate the benefits of water quality improvement
programs related to health in metropolitan Cairo, Egypt. This was deemed important in
order to compare these benefits to the cost of water management programs and for policy
makers to design tariff schemes. The focus of the study is on the magnitude and socio-
economic determinants of the willingness to pay (WTP) to improve health through
enhanced water quality.
In January of 2002, an in-person survey concerning waterborne illness and the value of
clean water was administered to about 750 households in metropolitan Cairo. The
questionnaire contained a number of sections, other than the choice experiment, including
questions about the socio-economic characteristics of the household and questions about
the water quality and health status of the household.
Three attributes were identified: (1) Short run health effect. This was described as the
number of ill days caused by waterborne diseases during the year, e.g. diarrhoea. This
attribute was related to the current level of the household’s health status, so the actual
levels varied among the households. (2) Long run health effect. This was related to the
risk of contracting a dangerous disease in the future. (3) The cost attribute was
formulated as an increase in the water bill due to the program. The attributes and their
levels are presented in the following table.
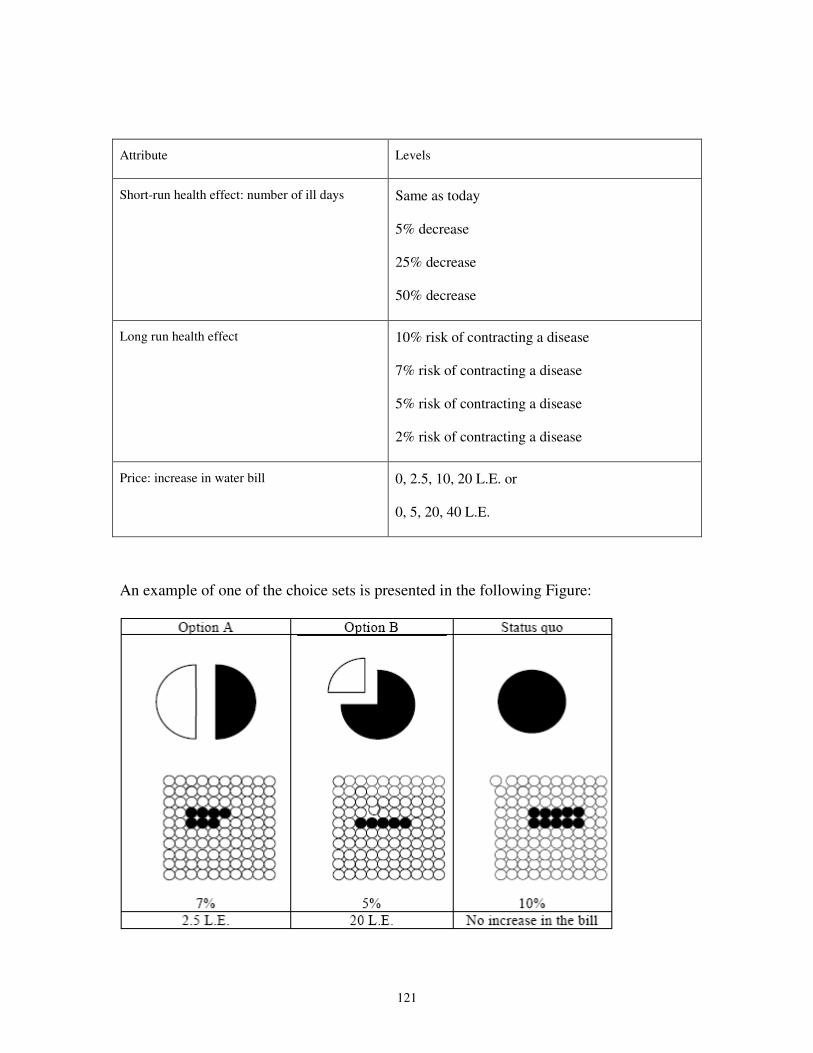
121
Attribute Levels
Short-run health effect: number of ill days Same as today
5% decrease
25% decrease
50% decrease
Long run health effect 10% risk of contracting a disease
7% risk of contracting a disease
5% risk of contracting a disease
2% risk of contracting a disease
Price: increase in water bill 0, 2.5, 10, 20 L.E. or
0, 5, 20, 40 L.E.
An example of one of the choice sets is presented in the following Figure:
122
Due to the big illiteracy rate among the respondents it was considered necessary to use
visual aids. Together with the use of focus groups and pilot testing, the authors chose to
describe the short run health effect by means of pie charts where the black circles indicate
the number of ill days per year. The offered improvement was illustrated by the white
part of the pie chart. The long run risk was represented by the aid of an array of dots,
where black dots indicated the risk of contracting a disease.
Results
The econometric analysis showed that households in metropolitan Cairo have a positive
WTP to reduce health risks related to water quality. The mean WTP concerning a 50%
decrease in the short run health effect due to poor water quality, and a reduction in the
probability of contracting waterborne diseases in the long run to 2% was found to be
almost 15 Egyptian pounds per every second month. This corresponds to around 2.6% of
the mean monthly income. The study also finds significant heterogeneity among the
households, both in terms of observed characteristics such as whether they had contracted
diarrhea in the last year or not, educational level, whether the household is female headed
or not, but also in terms of unobserved characteristics.
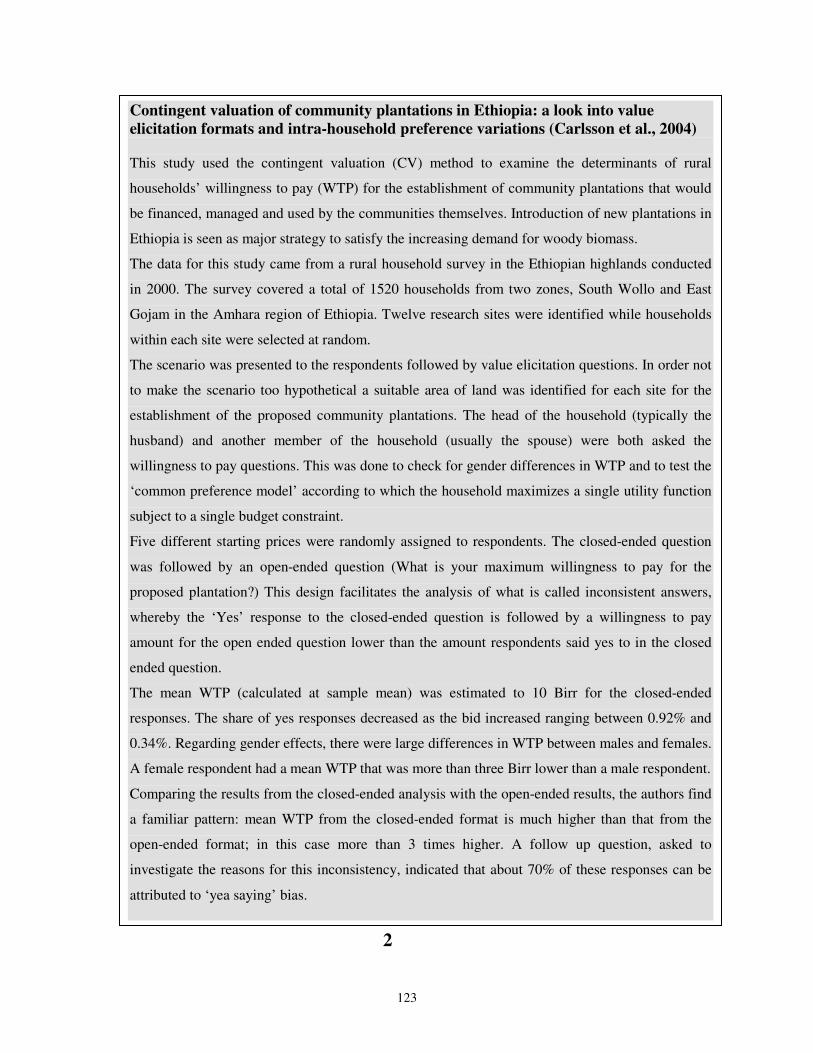
123
Contingent valuation of community plantations in Ethiopia: a look into value
elicitation formats and intra-household preference variations (Carlsson et al., 2004) This study used the contingent valuation (CV) method to examine the determinants of rural
households’ willingness to pay (WTP) for the establishment of community plantations that would
be financed, managed and used by the communities themselves. Introduction of new plantations in
Ethiopia is seen as major strategy to satisfy the increasing demand for woody biomass.
The data for this study came from a rural household survey in the Ethiopian highlands conducted
in 2000. The survey covered a total of 1520 households from two zones, South Wollo and East
Gojam in the Amhara region of Ethiopia. Twelve research sites were identified while households
within each site were selected at random.
The scenario was presented to the respondents followed by value elicitation questions. In order not
to make the scenario too hypothetical a suitable area of land was identified for each site for the
establishment of the proposed community plantations. The head of the household (typically the
husband) and another member of the household (usually the spouse) were both asked the
willingness to pay questions. This was done to check for gender differences in WTP and to test the
‘common preference model’ according to which the household maximizes a single utility function
subject to a single budget constraint.
Five different starting prices were randomly assigned to respondents. The closed-ended question
was followed by an open-ended question (What is your maximum willingness to pay for the
proposed plantation?) This design facilitates the analysis of what is called inconsistent answers,
whereby the ‘Yes’ response to the closed-ended question is followed by a willingness to pay
amount for the open ended question lower than the amount respondents said yes to in the closed
ended question.
The mean WTP (calculated at sample mean) was estimated to 10 Birr for the closed-ended
responses. The share of yes responses decreased as the bid increased ranging between 0.92% and
0.34%. Regarding gender effects, there were large differences in WTP between males and females.
A female respondent had a mean WTP that was more than three Birr lower than a male respondent.
Comparing the results from the closed-ended analysis with the open-ended results, the authors find
a familiar pattern: mean WTP from the closed-ended format is much higher than that from the
open-ended format; in this case more than 3 times higher. A follow up question, asked to
investigate the reasons for this inconsistency, indicated that about 70% of these responses can be
attributed to ‘yea saying’ bias.
2
124
APPENDIX 2: A Financial and economic model for estimating annual
use values of forest resources.
A study on the use and value of natural resources on the Rufiji Plain and Delta in
Tanzania is summarised here as an example of practical application of valuation4.
A combination of Participatory Rural Appraisal and regular household questionnaires
was used to elicit information on the uses, types and quantities of various resources in
each eco-region the study area. The data were then fitted into the following model for
analytical purposes. Underlined items are the final values required by the model from the
data.
1. Total production and gross income:
Annual production was estimated on the basis of the percentage of households involved
in the activity and average output per producer household. The annual production was
multiplied by the average price per unit of output to yield annual gross financial value
of production.
2. Estimate of the cash income:
Cash income was calculated as the average amount sold multiplied by the average price.
3. Capital input costs
Capital costs were estimated for each enterprise. This included domestic items such as
canoes and tradable items such as nets. Annual costs of capital were calculated on the
basis of price and durability of each item, as well as how may other purposes the item is
used for. Where one input e.g. a canoe, was used for more than one activity (e.g. fishing
and collection of reeds), then the value was divided among the different activities
4 For details see Turpie, Jane K. (2000), The use and value of natural resources of the Rufiji flood plain and Delta, Tanzania. A consultancy report submitted to the Rufiji environmental Management Project and IUCN- Eastern Africa Office. November.
125
accordingly. The annual cost of capital assets was estimated using the straight-line
method of depreciation, based on the average durability of the item.
4. Variable input costs
These include tradable items such as seed and domestic items such as bundles of
firewood. Labour costs were estimated on the basis of average time taken to produce a
unit of output.
5. Calculation of financial and economic returns
In the financial model, annual net financial value is calculated as gross income less
fixed and variable costs. Labour time is not included as a cost. Thus net financial value
reflects the net private or household benefit of the activity and includes both cash returns
and consumption.
In the economic model, annual net economic value reflects the net value added to
national income. This economic measure is mostly derived from financial data, to which
shadow prices or the real scarcity values of the resources are applied to determine social
costs and benefits at the national level. Here labour costs are included. The net
economic value is obtained by taking gross income, less economic costs (all at shadow
prices) and this provides a measure of economic efficiency. In this case interest, taxes and
subsidies are ignored as transfers, while labour prices are adjusted to take account of
unemployment (20 % of minimum is taken as the shadow price of labour in Tanzania,
estimated at 2000 TSh per day), a foreign exchange premium (20%) is applied to tradable
items to reflect the excess demand for foreign exchange, foreign inflows and outflows are
treated as benefits and costs, respectively, and the costs of land and government sectoral
expenditures and working capital are excluded.