Embed Size (px)
Citation preview

A Greenleaf Trust Newsletter
William D. JohnstonPresident, Greenleaf Trust
The Euro and Sovereign Debt Crisis 5
A Costless Strategy to Provide Downside Protection 6
The Truth about Non-Qualified Plans 8
Living with Market Volatility 10
Economic Update & Structural DeficitThe third quarter is now behind us, and our conference call for Greenleaf Trust clients will be held this afternoon. Each quarter our research team gathers together to provide a live broadcast of economic equity and fixed income news and data. Our purpose is to paint the current and forward period of time with a brush of accurate data, as well as provide our best analysis of where we think the future cycle is headed.
Last week we held a series of seminars, mirroring our quarterly conference call format, before nearly 200 clients and friends of Greenleaf Trust in Holland, Traverse City and Petoskey. The seminars were well received, and the questions and answers vigorous and lively. During the individual conversations that I had with seminar attendees, common themes began to develop. There was a natural curiosity about the economic data that we examine, as well as its implications for analysis and resulting meaning for our future.
Beginning with January of 2009 we have regularly (at first monthly, and then quarterly) published a table of data points so that we all could see progress, or lack thereof, in our economic recovery. Recall that we are now over 40 months into the recovery from our nation’s second worst economic collapse. It is also helpful to remind ourselves that the recession of 2008/2009 was not a typical cyclical recession and that the recovery from the recession would be different in many ways from normal cyclical recessions.
At the onset of the recovery phase we offered the following:1. Recovery would take from early 2009 through 2014. 2. GDP growth would be modest and range from the low 2% to mid 3.5%
range. 3. Modest growth would not be sufficient to bring employment relief and
that robust employment would not reoccur until 2014 or 2015. 4. Our significant oversupply of housing would deflate home values to 1998
levels and would handcuff the residential construction industry, further delaying our economic recovery.
5. All of the above would make our economy very sensitive and vulnerable to global and domestic political actions which would likely create interruptions to our growth.
o c t o b e r 2 0 1 1 v o l u m e 2 0 , i s s u e 1 0
page 2 211 south rose street, kalamazoo, mi 49007 269.388.9800
“It is of little comfort to say we are where we thought we would be, but we are—and the data confirm it.”
Structural Deficit, continued 6. Lastly, our recovery would be incremental over a long duration and not inspire confidence in a rapidly deleveraging consumer.
There are times when economists and market analysts don’t enjoy, and in fact dread, the results of their analysis. While everyone can form opinions, analysis based upon data and historical facts can lead to ominous forecasts. It is of little comfort to say we are where we thought we would be, but we are—and the data confirm it.
Before we examine the data table, let’s explore the context of the data. A common question put to us is “Bill, you often speak of ‘50 economic data points,’ what exactly are those pieces of data?” It’s a great question, and can be answered as follows. We separate data into five large categories:1. Leading2. Lagging3. Coincidental 4. Coincidental to Leading5. Coincidental to Lagging
Leading indicators generally tell us what is likely to happen going forward while, conversely, lagging indicators tend to tell us what has happened in the recent past. Employment is a number that people focus on, but really tells us the condition of our current, not future, economy. The change and rate of change in employment can be, and often is, an indication of what will happen in the future.
Coincidental indicators are those that don’t describe a forward or historical period of time, but are rather real time indicators of current data.
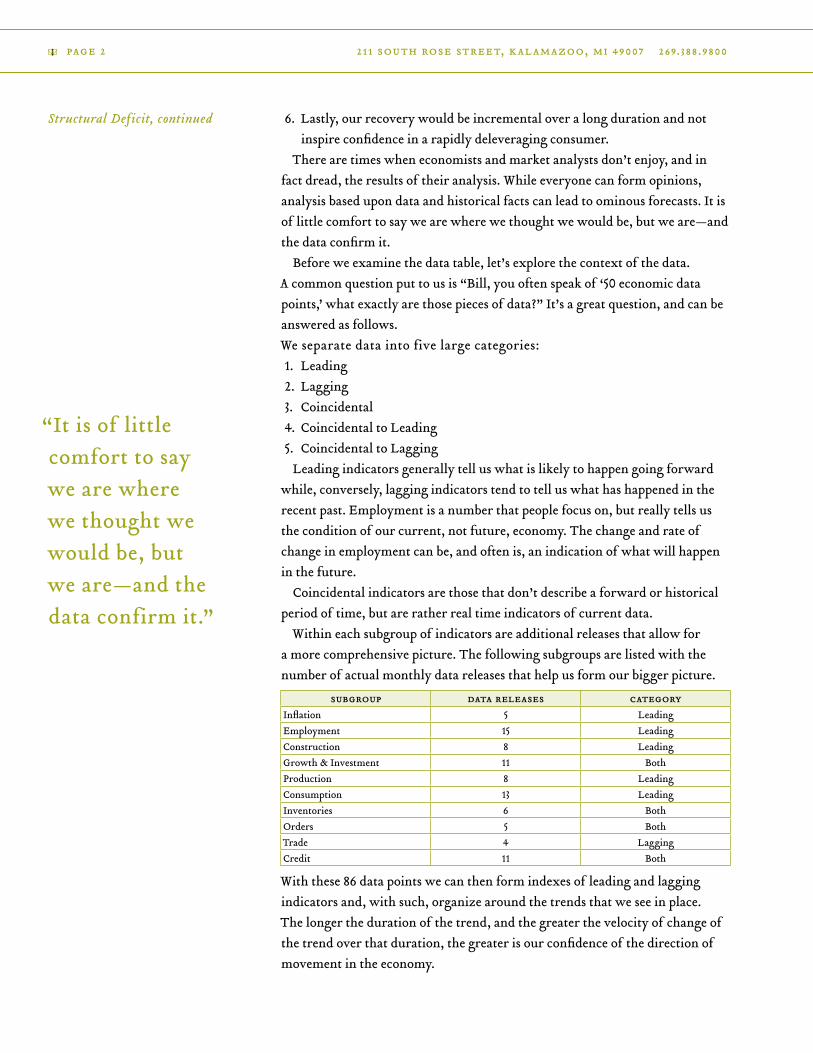
Within each subgroup of indicators are additional releases that allow for a more comprehensive picture. The following subgroups are listed with the number of actual monthly data releases that help us form our bigger picture.
subgroup data releases categoryInflation 5 LeadingEmployment 15 LeadingConstruction 8 LeadingGrowth & Investment 11 BothProduction 8 LeadingConsumption 13 LeadingInventories 6 BothOrders 5 BothTrade 4 LaggingCredit 11 Both
With these 86 data points we can then form indexes of leading and lagging indicators and, with such, organize around the trends that we see in place. The longer the duration of the trend, and the greater the velocity of change of the trend over that duration, the greater is our confidence of the direction of movement in the economy.
p e r s p e c t i v e s . o c to b e r 2 0 1 1 . w w w. g r e e n l e a f t ru st. c o m pag e 3
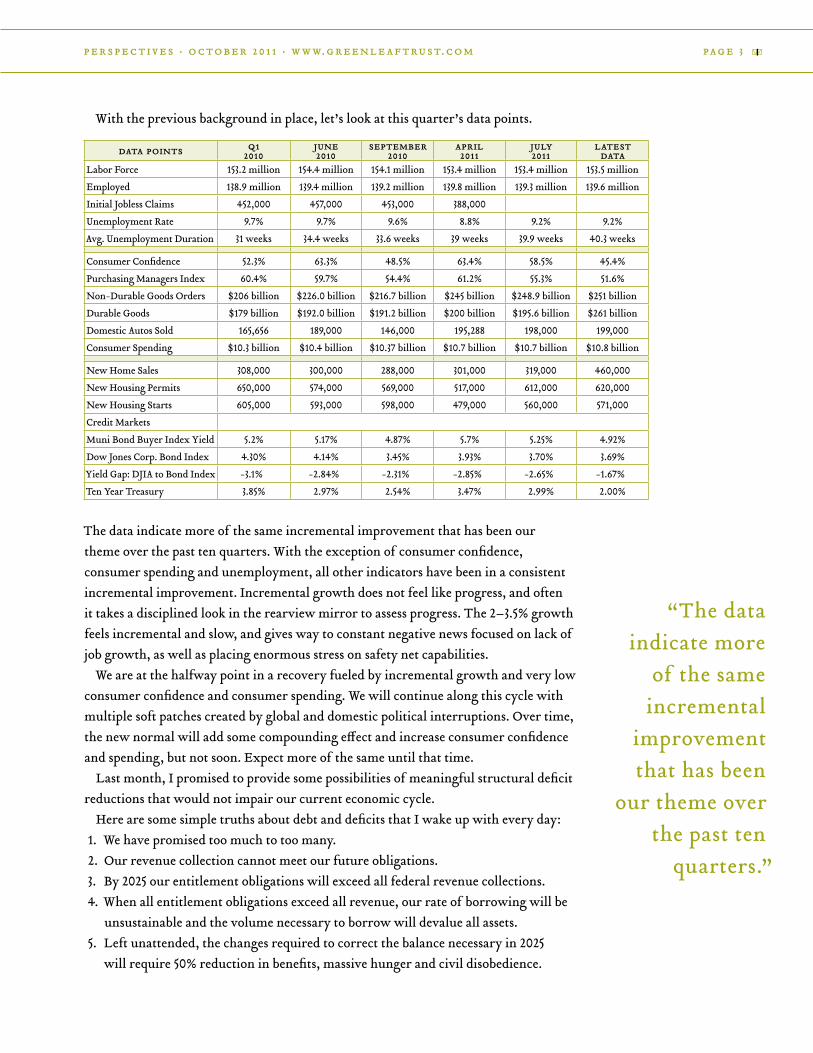
With the previous background in place, let’s look at this quarter’s data points.
data points q12010
june 2010
september 2010
april2011
july 2011
latestdata
Labor Force 153.2 million 154.4 million 154.1 million 153.4 million 153.4 million 153.5 million
Employed 138.9 million 139.4 million 139.2 million 139.8 million 139.3 million 139.6 million
Initial Jobless Claims 452,000 457,000 453,000 388,000
Unemployment Rate 9.7% 9.7% 9.6% 8.8% 9.2% 9.2%
Avg. Unemployment Duration 31 weeks 34.4 weeks 33.6 weeks 39 weeks 39.9 weeks 40.3 weeks
Consumer Confidence 52.3% 63.3% 48.5% 63.4% 58.5% 45.4%
Purchasing Managers Index 60.4% 59.7% 54.4% 61.2% 55.3% 51.6%
Non-Durable Goods Orders $206 billion $226.0 billion $216.7 billion $245 billion $248.9 billion $251 billion
Durable Goods $179 billion $192.0 billion $191.2 billion $200 billion $195.6 billion $261 billion
Domestic Autos Sold 165,656 189,000 146,000 195,288 198,000 199,000
Consumer Spending $10.3 billion $10.4 billion $10.37 billion $10.7 billion $10.7 billion $10.8 billion
New Home Sales 308,000 300,000 288,000 301,000 319,000 460,000
New Housing Permits 650,000 574,000 569,000 517,000 612,000 620,000
New Housing Starts 605,000 593,000 598,000 479,000 560,000 571,000
Credit Markets
Muni Bond Buyer Index Yield 5.2% 5.17% 4.87% 5.7% 5.25% 4.92%
Dow Jones Corp. Bond Index 4.30% 4.14% 3.45% 3.93% 3.70% 3.69%
Yield Gap: DJIA to Bond Index -3.1% -2.84% -2.31% -2.85% -2.65% -1.67%
Ten Year Treasury 3.85% 2.97% 2.54% 3.47% 2.99% 2.00%
The data indicate more of the same incremental improvement that has been our theme over the past ten quarters. With the exception of consumer confidence, consumer spending and unemployment, all other indicators have been in a consistent incremental improvement. Incremental growth does not feel like progress, and often it takes a disciplined look in the rearview mirror to assess progress. The 2–3.5% growth feels incremental and slow, and gives way to constant negative news focused on lack of job growth, as well as placing enormous stress on safety net capabilities.
We are at the halfway point in a recovery fueled by incremental growth and very low consumer confidence and consumer spending. We will continue along this cycle with multiple soft patches created by global and domestic political interruptions. Over time, the new normal will add some compounding effect and increase consumer confidence and spending, but not soon. Expect more of the same until that time.
Last month, I promised to provide some possibilities of meaningful structural deficit reductions that would not impair our current economic cycle.
Here are some simple truths about debt and deficits that I wake up with every day: 1. We have promised too much to too many.2. Our revenue collection cannot meet our future obligations. 3. By 2025 our entitlement obligations will exceed all federal revenue collections. 4. When all entitlement obligations exceed all revenue, our rate of borrowing will be
unsustainable and the volume necessary to borrow will devalue all assets. 5. Left unattended, the changes required to correct the balance necessary in 2025
will require 50% reduction in benefits, massive hunger and civil disobedience.
“The data indicate more
of the same incremental
improvement that has been
our theme over the past ten
quarters.”

page 4 211 south rose street, kalamazoo, mi 49007 269.388.9800
Before I offer some alternatives, here is what our elected Congressmen and Senators go to work with every day: • 79% of Americans do not want to change Medicare • 69% of Americans do not want to change Medicaid • 71% of Americans want no change to Social Security We have ignored for four decades what actuarial economists have warned
us about, and we have largely done so because those we elect know we are not, as a nation or collective electorate, serious about addressing our demise. In a true national sense, shared sacrifice means, to most, that others must sacrifice.
Given all we have written about debt and deficits, what must be done?1. Reinstall control over US budget operations similar to the previous
Gramm-Rudman legislation that was allowed to expire in 2000. This bill capped spending at inflation unless a super-majority of Congress authorized spending in excess of it.
2. 5% GDP growth and Gramm-Rudman restrictions were the single largest reason for the surplus creation in the late 1990s.
3. Reduce eligibility for entitlement. In 1950, 1 in 50 Americans received entitlement benefits. Today, 1 in 6 Americans receives benefits. Under current legislation, a family of four with 4.5 times the poverty rate of annual income ($22,000) can receive subsidies for entitlement premiums.
4. Properly cost social security and Medicare benefits, and adjust premiums to account for future liabilities. We are smart enough to calculate this cost. Each American has a contingent liability for a retirement safety net and healthcare. Not only can we calculate it, we can account for it, collect it and reserve for it.
5. Be honest with ourselves that entitlement benefits must be paid for. They are not free, and have always been paid for by federal revenue (tax) collections. We must admit that a population with an age of mortality approaching 80 years of age cannot expect to retire on full social security benefits unless they have worked 45 years and have invested in the entitlement benefit system.
6. We must have differentiated payroll tax rates based upon age. Future, not current, liabilities are the issue, and will require appropriate funding based upon age and income.
We have delayed our actions for so long that our solutions are becoming limited. Cost containment, while necessary, is not a solution. Eligibility restriction will be a part of the solution, as will be cost accounting and accrual of both benefit and payment for it. There are no magic wands or silver bullets—deferred action and responsibility now forces shared sacrifice. This is a truth some elected leaders will want to tell us, but only if we let them.
Structural Deficit, continued
“There are no magic wands or silver bullets—deferred action and responsibility now forces shared sacrifice. This is a truth some elected leaders will want to tell us, but only if we let them.”

p e r s p e c t i v e s . o c to b e r 2 0 1 1 . w w w. g r e e n l e a f t ru st. c o m pag e 5
Michael F. Odar, CFAExecutive Vice President
Director, Wealth Management Division
The Euro and Sovereign Debt CrisisThe sovereign debt crisis in Europe has drawn a lot of attention to the euro, the second largest reserve currency in the world behind the US dollar. With the potential default of Greece on some of its obligations to other nations, the viability of the euro has come back into question by critics. There are two sides to this argument—and the truth lies somewhere in the middle. In order to understand the debate, we first need some background perspective on the main topic.
The euro, first created with the passage of the Treaty on European Union in 1992, began circulation in 2002 after serving as an accounting currency for three years. It is the official currency of the “euro-zone,” the group of 17 (out of 27) European Union member states that use the euro—Austria, Belgium, Cyprus, Estonia, Finland, France, Germany, Greece, Ireland, Italy, Luxembourg, Malta, the Netherlands, Portugal, Slovakia, Slovenia, and Spain. The European Central Bank (ECB) oversees the euro — much like our Federal Reserve oversees the US dollar — and has sole authority to set monetary policy. In order to become a euro-zone member, participating countries had to adhere to criteria set forth in the European stability and growth
pact. Most notably, they had to limit budget deficits to no more than 3% of GDP.
Of course, during times of economic duress, the problems associated with a single currency shared amongst very distinct countries with different economies, languages, and demographics seem obvious. The mere fact that it had never been done before, and there was no model to follow, would be first and foremost. Also, by adhering to the stability and growth pact, members of the euro-zone essentially lost the effective use of fiscal tools that could be used to combat recession. For instance, member nations gave up monetary policy control to the ECB, and may no longer simply devalue their currency to boost exports. Considering the fact that some of the member nations have economies in different cycles and stages of growth, can one entity really control inflation for all 17 members?
On the other hand, the euro creates currency stability for member nations by enhancing credibility with its large currency zone and by fixing the exchange rate for the euro-zone members. Greater stability facilitates greater export trade. The euro also reduces transaction costs associated with currency exchanges amongst
member nations. This facilitates transactions amongst member nations and benefits tourism. With a single currency, hedging costs for companies doing business across the borders of member nations are eliminated. Finally, adherence to the stability and growth pact, with its fiscal responsibility requirements, should lower interest rates.
In economics, an optimal currency area is a geographical region that could maximize economic efficiency by sharing a single currency, and the preference for the size of the area is that bigger is better. The euro will soon enter its tenth year as a functioning currency. During that time, the world has become much more globally integrated. In the whole scheme of things, that is not a long period of time to determine the success or failure of an economic theory. The success of the euro certainly has economics on its side; however, will that be enough in the real world?

page 6 211 south rose street, kalamazoo, mi 49007 269.388.9800
A Costless Strategy to Provide Downside ProtectionDuring times of significant market volatility, we are reminded of the importance of risk mitigation strategies. The most obvious way to help reduce volatility in a portfolio is diversification. Diversification may involve asset classes (having a mix of equities, fixed income, cash, and alternative assets), market capitalization weighting (having a portfolio comprised of companies of various sizes), and market sectors (having exposure to various economic sectors rather than concentrated sector exposure).
In addition to the these strategies, Greenleaf Trust employs a variety of customized client-specific risk mitigation strategies. One such strategy, called a protective collar, can be especially helpful during the recent market downturn. This strategy, which uses options, is most often used when an investor has a low cost basis concentrated position (typically defined as more than 10% of a portfolio) in a single company stock. Because of the low cost basis, the investor may be reluctant to sell the stock. However, because the position is a concentration, it significantly increases the risk profile of the portfolio. By implementing a protective collar, losses can be limited if the stock goes down without forfeiting all upside potential.
To illustrate, let’s assume that we are an investor with a $5,000,000 stock portfolio that contains 23,600 shares of DuPont, a multinational conglomerate and member of the Dow Jones Industrial Average, with a cost basis of $10 per share. At today’s price of $42.50 this position would be worth approximately $1,003,000 and would account for 20% of the portfolio. For adequate diversification, we believe a single company stock should not account for more than 5% of an individual portfolio. Reducing the position to 5% of the portfolio would involve selling $900,000 worth of the stock, resulting in a large capital gains tax bill (given the low cost basis) in a single year. However, not selling the stock means that any decline in DuPont would have a substantial negative impact on the portfolio. In this example, we could employ an options collar to protect downside risk without selling the stock.
Let’s suppose we want to protect 90% of our shares for the next six months, and assume we are not comfortable with more than a 10% decline on these shares. To execute an options collar, two steps would need to take place. 1. Purchase insurance (downside protection) by buying put option
contracts (“puts”). This gives us, the buyer, the right, but not the obligation, to sell a stock at a predetermined price (referred to as the strike price), on or before a predetermined date (referred to as the expiration date). As the buyer, we need to pay someone else for this right. This payment is called a premium.
Andrew L. Riker CFP®Wealth Management Advisor
“One such [risk management] strategy, called a protective collar, can be especially helpful…”

p e r s p e c t i v e s . o c to b e r 2 0 1 1 . w w w. g r e e n l e a f t ru st. c o m pag e 7
In our scenario, we would purchase 212 puts (1 option contract equates to 100 shares, therefore 212 contracts would equate to 21,200 shares, or approximately 90% of the 23,600 shares we own). Currently, the April 2012 DuPont put option contracts with a $38.00 strike price (which represents a 10% decline from the current DuPont share price of $42.50) are trading for $3.15 per contract. 212 contracts would cost $66,780 [(212 x 100) x $3.15].
2. Finance the insurance by selling call option contracts (“calls”). This gives the buyer the right, but not the obligation, to buy a stock from us at a predetermined price (referred to as the strike price), on or before a predetermined date (referred to as the expiration date). For selling this contract we would collect a premium. We do this in order to finance our purchase of the puts, so that we don’t have to pay for them “out of pocket.” Currently, the April 2012 calls with a $46.00 strike price are trading at $3.10 per contract. To finance the purchase of our puts, we would need to sell 215 call options, which would generate $66,780 of income [(215 x $ 3.10) x 100]. The disadvantage of selling these calls is that our upside potential on 21,500 shares is limited to $3.50 per share [($46 (strike price) - $42.50 (current price)] .
The table below shows what would happen to the approximate $1,003,000 DuPont position with various share price changes if: 1). No options collar strategy is implemented. 2.) The options collar is implemented. As illustrated, the options collar provides significant savings if the share price declines (we would be better off by about $222,000 if the share price declined to $27.50). However, upside potential is forfeited (although to a lesser extent) if the shares move higher.
if dupont shares decline in value to:
no change in dupont’s share price
if dupont shares increase in value to:
$27.50 $30.00 $42.50 $52.50 $55.00
Total Value without Options Collar
$649,000 $708,000 $1,003,000 $1,239,000 $1,298,000
Total Value with Options Collar in place
$871,600 $877,600 $1,003,000 $1,099,250 $1,104,500
Difference $222,600 $169,600 $0 -$139,750 -$193,500
In summary, a protective collar can act as a “costless” strategy to provide downside protection on a concentrated stock position without forfeiting all upside potential. There are many different ways to structure collars and other diversification plans for concentrated stock positions, and many complex factors to consider. These plans should be customized to meet investor-specific needs and desires, and investors should work with an experienced professional before executing such strategies.
“In summary, a protective collar
can act as a ‘costless’ strategy
to provide downside
protection on a concentrated stock position
without forfeiting all
upside potential.”

page 8 211 south rose street, kalamazoo, mi 49007 269.388.9800
Chris A. Middleton, CTFAVice PresidentAsst. Director, Retirement Plan Div.
The Truth about Non-Qualified PlansWith the constant warnings about the wobbly future of Social Security and other entitlement programs, it is wise for everyone to think about how they are saving for their own future. As a result, terms like “profit sharing” and
“401(k)” have become household words over the last couple of decades. Although these types of qualified plans (QP) serve as a cornerstone of personal savings, they are not the only answer to ensuring one has built up a sufficiently sized nest egg. A powerful yet lesser-known tool for retirement savings is the non-qualified plan (NQP). Regardless of how you decide to save for retirement, it is important to understand the benefits and limitations for each plan type.
Most can appreciate the benefit of having access to a QP. The term
“qualified” simply indicates that these plans qualify for certain tax advantages for the employer and employee. The IRS limits the amount that can be deposited into qualified accounts and also imposes discrimination testing rules, making it difficult for highly compensated employees to maximize their retirement saving desires. For instance, an executive who desires to defer the annual
statutory maximum (currently $16,500) into a QP may be forced to defer far less if the average deferral rate of the non-highly compensated employees is too low. To the extent steps are taken to remedy discrimination testing restrictions, an executive may still desire to defer amounts higher than the statutory maximum.
One way to overcome the QP restrictions is to participate in a NQP. There are different types of NQP’s, such as deferred compensation arrangements (allowing employees to defer their own pay), and supplemental executive retirement plans (allowing employers to contribute on behalf of employees). Since NQP’s do not enjoy as many tax benefits as QP’s, employees and employers are not bound by many of the rules that limit contribution levels and restrict executive benefit levels. As a result, an organization can adopt an NQP to provide benefits to officers, executives, and other highly compensated employees at almost any level they desire. Most notably, benefits offered are not contingent upon like benefits being offered to non-highly compensated employees.
Since employers are allowed to invite select highly paid worker(s)
“Regardless of how you decide to save for retirement, it is important to understand the benefits and limitations for each plan type.”

p e r s p e c t i v e s . o c to b e r 2 0 1 1 . w w w. g r e e n l e a f t ru st. c o m pag e 9
“…careful consideration
must be given to the selection of a plan which is
right for both the business and the
employees.”
to participate, they generally use NQP’s as an executive attraction and retention tool. There is no legal limit on how much a participating employee can defer or how much an employer can contribute into a worker(s) account. Similar to QP’s and IRA’s, the tax man shows up only when money is taken out, at which point taxes are paid at the worker’s income tax rate at that point in time. Employees can decide between a lump sum withdrawal or splitting the future distributions into installments; however, special regulations suggest that this decision should be made at the time the funds are being deferred as opposed to when they are being withdrawn.
Of course, there are some drawbacks to NQPs. Sponsoring companies do not receive a tax deduction on the dollars ushered into the NQP until the year a recipient actually “recognizes” the income. Income taxes can be deferred, but FICA taxes are generally still owed on the NQP contributions, creating a situation where an employee is responsible for taxes against income they have yet to receive. Most importantly, all NQP assets technically remain an asset of the company, and are
thereby subject to any corporate liability, including insolvency. That is to say, an employee could have a large deferred compensation balance built up only to have a corporate bankruptcy leave the account depleted. Much has been written about the perils of those who have built up NQP benefits within teetering companies. For example, executives with untapped NQP benefits at Lehman Brothers probably lost sleep right before the company went bankrupt in 2008—almost a guarantee that their NQP balances would go down with the company.
Whether one participates in a QP or would like to utilize the benefits of a NQP, careful consideration must be given to the selection of a plan which is right for both the business and the employees. There are certainly instances when a QP is sufficient to meet the needs of all benefiting parties. NQP’s can prove to be a solution for key employees whose service merits enhanced benefits. Before implementing such a plan, one would want to talk with trusted advisors to determine all of the implications of adopting such a plan. Greenleaf Trust stands ready to help clients learn whether NQPs would be right for them.

page 10 211 south rose street, kalamazoo, mi 49007 269.388.9800
Daniel L. Baker, JD, CFTAVice PresidentDirector of Business Development Asst. Director, Personal Trust Division
Living with Market VolatilityOver the last two months, financial markets have taken a wild ride. This volatility, and the accompanying down days, reminds many investors of the anxiety and sense of powerlessness they experienced in the October 2007 to March 2009 market swoon. Certainly, the third quarter has been a tough one for most equity investors. Virtually every major index worldwide is down double digits since June 30. News accounts warn us daily of the threat of a
“double dip recession” and ongoing economic woes. If we are all feeling a bit anxious, it is probably not entirely within our control.
What we can control is how we deal with these feelings. When faced with significant market and portfolio losses, and fear and emotion have crept in, our reaction is often to do something to escape the pain. We are hard-wired to protect ourselves. We run from things that hurt us and take shelter in things that we find safe. What we do not want to do in these situations is make rash and potentially damaging investment decisions.
A recent example: in early September, many investors “escaped the pain” of the stock markets in favor of the perceived safety of gold. Those who did so on September 6 bought gold at its peak and sold stocks near their recent bottom. At the time of this writing, their investment in gold is down about
14% while the S&P 500 has lost less than 1%.
No one knows what the stock markets will do tomorrow, or next quarter, but if our risk tolerance, objectives and time horizon has not changed over the last two months, why would our investments?
Let’s look at some things upon which we can focus to help keep emotions in check, make living with market volatility more bearable, and keep our long-term plan in place. Focus on the Plan. As investors, we are supposed to establish a long-term plan based on our risk tolerance, time horizon, need for income and tax bracket. The long-term plan should not be subject to the vagaries of the market on a quarterly or other short-term basis. Having made a well-reasoned plan based on individualized needs, and having created an asset allocation appropriate to meet those needs, we have to be disciplined around those decisions. Remember that most of us are running a marathon, not a sprint. Turn off the Television. We are bombarded with financial news 24 hours a day, 7 days a week. News travels at breakneck speed, and the media is compelled to bring in “experts” to recommend a reaction to every action. Portfolio managers, eager for the spotlight, offer recommendations on what to buy or sell at any point in time—without regard to individual investors’ objectives, risk tolerance
“Let’s look at some things upon which we can focus to help keep emotions in check, make living with market volatility more bearable, and keep our long-term plan in place.”

p e r s p e c t i v e s . o c to b e r 2 0 1 1 . w w w. g r e e n l e a f t ru st. c o m pag e 1 1
or time horizon. To follow such recommendations would, in almost every instance, be lunacy. It is the news media’s job to drive ratings. Whatever is in the financial news is exaggerated to attract more viewers. As investors, we must not let short-term events materially impact our long-term planning. Market Timing is a Losing Strategy. The market’s ups and downs are impossible to predict. Trying to time the market by moving in and out of investments is a losing strategy over the long term. Numerous studies have shown that most investors buy and sell at the wrong times, performing worse than if they had remained fully invested in the market. As in the gold-buying example above, when we try to time the market we usually wind up chasing performance. We buy when an asset has already gone up and tend to sell after an asset has gone down. Obviously, such moves can destroy long-term performance. Market timing is easy, with the benefit of hindsight; however, it is impossible without it. Some may say “I will sit it out until….” The question is “until what?” Getting in and getting out is not an investment strategy—it is a bet on a moment in time. Effective market timing (an oxymoron, really) requires you to accurately predict market movements twice. You have to be right on the way out and right on the way back in. Most of us are not that good! It is interesting to note that the biggest rallies in stock market history have
come during cyclical bear markets—not bull markets. Historically, “time in the market” has proven to be much more beneficial than “timing the market.”Remember 2008-2009. The lesson from the bear market of late 2007 through March 2009 should be that investors who sold near the bottom of the market in 2009 locked in steep losses, while those who stayed the course recovered most of their account value over time. The S&P 500 lost over 56% from peak to trough during this period, but then almost doubled from March 2009 through April 2011. The S&P 500, at the time of this writing, is down about 17% from its April 2011 high. If recent history is any predictor of future performance, staying the course (and not reacting to short-term market shifts), will benefit prudent investors.Periodic Rebalancing. Rebalancing is a valuable tool which forces investors to essentially sell assets which have run up in value and use those proceeds to buy asset classes that have fallen. It helps maintain our pre-determined percentages of stocks, bonds, cash, and alternative investments. It also helps reduce risk. Market volatility can change the desired proportions of investments in our portfolios rather quickly, but can also provide us with an opportunity to buy assets “on sale.” When managing clients’ portfolios at Greenleaf Trust, we rebalance as warranted to take advantage of market cycles
and to maintain discipline around our previously agreed upon asset allocation decisions. Check your asset allocation. As we stated at the outset, this latest market decline, coming on the heels of the sizeable declines just over two years ago, is unsettling to many. It does, however, provide an opportunity to reassess whether or not you have the right mix of investments (or asset allocation) in your portfolio to meet your goals and objectives while tolerating the market’s ups and downs. You should ask yourself, “What kind of risk can I withstand?” The answer should take into effect not only your long and short-term objectives, but also what level of volatility you can handle from a psychological perspective. Your asset allocation must match your ability to tolerate risk. For a long-term investment strategy to work, you must be able to stay with it. If the market volatility is causing you to want out of the market or is keeping you awake at night, it is probably time to reassess how your assets are allocated. It might be time to adjust your asset allocation for a better balance of risk and return.
Our Trust Relationship Officers and Wealth Management Advisors at Greenleaf Trust are always ready and willing to discuss your concerns about the market, and whether or not your asset allocation is in line with your time horizon, goals, objectives and risk tolerance.
page 12 211 south rose street, kalamazoo, mi 49007 269.388.9800
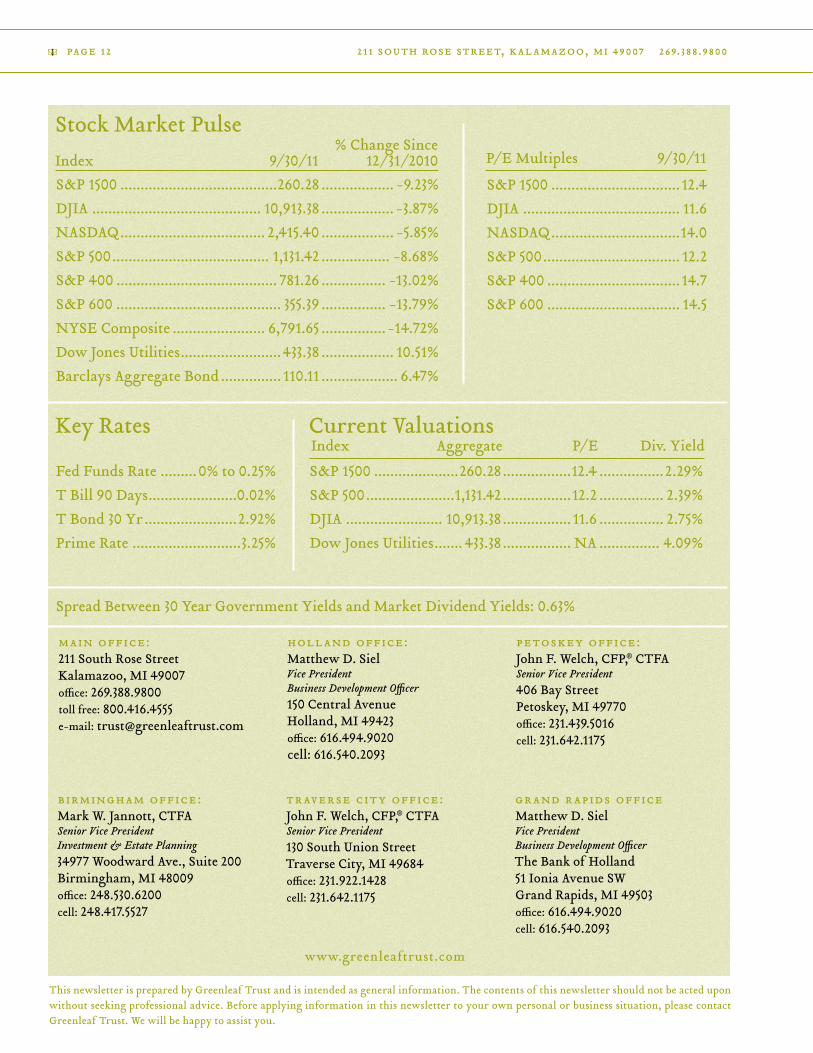
Stock Market Pulse
Key Rates Current Valuations
This newsletter is prepared by Greenleaf Trust and is intended as general information. The contents of this newsletter should not be acted upon without seeking professional advice. Before applying information in this newsletter to your own personal or business situation, please contact Greenleaf Trust. We will be happy to assist you.
Index Aggregate P/E Div. Yield
S&P 1500 .......................................260.28 .................. -9.23%DJIA .......................................... 10,913.38 .................. -3.87%NASDAQ .................................... 2,415.40 .................. -5.85%S&P 500 ....................................... 1,131.42 ................. -8.68%S&P 400 ........................................ 781.26 ................ -13.02%S&P 600 ......................................... 355.39 ................ -13.79%NYSE Composite ....................... 6,791.65 ................ -14.72%Dow Jones Utilities .........................433.38 .................. 10.51%Barclays Aggregate Bond ............... 110.11 ................... 6.47%
Fed Funds Rate .........0% to 0.25%T Bill 90 Days ......................0.02%T Bond 30 Yr .......................2.92%Prime Rate ...........................3.25%
S&P 1500 .....................260.28 .................12.4 ................2.29%S&P 500 ......................1,131.42 .................12.2 ................ 2.39%DJIA ........................ 10,913.38 ................. 11.6 ................ 2.75%Dow Jones Utilities ....... 433.38 ................. NA ............... 4.09%
S&P 1500 ................................ 12.4DJIA ....................................... 11.6NASDAQ ................................14.0S&P 500 .................................. 12.2S&P 400 ................................. 14.7S&P 600 ................................. 14.5
% Change SinceIndex 9/30/11 12/31/2010 P/E Multiples 9/30/11
Spread Between 30 Year Government Yields and Market Dividend Yields: 0.63%
main office:211 South Rose StreetKalamazoo, MI 49007office: 269.388.9800toll free: 800.416.4555e-mail: [email protected]
holland office:Matthew D. SielVice PresidentBusiness Development Officer150 Central AvenueHolland, MI 49423office: 616.494.9020cell: 616.540.2093
petoskey office:John F. Welch, CFP,® CTFASenior Vice President406 Bay StreetPetoskey, MI 49770office: 231.439.5016cell: 231.642.1175
birmingham office:Mark W. Jannott, CTFASenior Vice PresidentInvestment & Estate Planning34977 Woodward Ave., Suite 200Birmingham, MI 48009office: 248.530.6200cell: 248.417.5527
traverse city office:John F. Welch, CFP,® CTFASenior Vice President130 South Union StreetTraverse City, MI 49684office: 231.922.1428cell: 231.642.1175
grand rapids officeMatthew D. SielVice PresidentBusiness Development OfficerThe Bank of Holland51 Ionia Avenue SWGrand Rapids, MI 49503office: 616.494.9020cell: 616.540.2093
www.greenleaftrust.com