Embed Size (px)
Citation preview
___________________________________________________________________________
2015/AMM/006 Session 1
APEC Economic Trends Analysis: Growth Softens As Challenges Intensify, November 2015
Purpose: Information
Submitted by: Policy Support Unit, APEC Secretariat Forum Doc. No.: 2015/CSOM/011
27th APEC Ministerial MeetingManila, Philippines
16-17 November 2015
APEC Economic Trends Analysis: Growth Softens as Challenges Intensify
APEC Policy Support Unit November 2015
Prepared by: Rhea C. Hernando Asia-Pacific Economic Cooperation Policy Support Unit Asia-Pacific Economic Cooperation Secretariat 35 Heng Mui Keng Terrace Tel: (65) 6891-9600 │ Fax: (65) 6891-9690 Email: [email protected] Website: www.apec.org Produced for: APEC Economic Committee Asia-Pacific Economic Cooperation APEC#215-SE-01.21
This work is licensed under the Creative Commons Attribution-NonCommercial-ShareAlike 3.0 Singapore License. To view a copy of this license, visit http://creativecommons.org/licenses/by-nc-sa/3.0/sg/.
The views expressed in this paper are those of the author and do not necessarily represent those of APEC Member Economies.
1
Key Messages1
• The second quarter of 2015 saw continued growth among APEC economies as GDP levels remained positive, albeit at a moderated pace.
• The weighted GDP growth for APEC as a whole settled at 3.1 percent in Q2 2015, lower than the 3.4 percent growth posted a year ago and the 3.2 percent expansion in Q1 2015. This development reflected the prolonged weakness in global economic activity as the modest recovery in advanced economies was matched by a general slowdown in emerging market economies.
• Among APEC economies, the moderation in GDP levels could be attributed to declining investments and lacklustre exports.
• The protracted decline in both oil and non-oil commodity prices due to the combined effects of ample supply and weak demand has slowed down investments, particularly in the oil and mining sectors.
• The downturn in exports was due to a host of factors: sluggish global demand; twin declines in export prices and overall commodity prices; and China’s economic rebalancing from an export- and investment-led growth towards a more domestic-driven growth.
• Industrial production yielded mixed results for APEC economies, mirroring the uneven strength in demand across the region as well as the significant decline in investment growth.
• Household spending remained the major driver of growth in the APEC region, buoyed by the decline in commodity prices, particularly oil; relatively steady employment levels and its consequent positive income expectations; and the prevailing low-interest rate environment as credit and financial conditions remained accommodative.
• As of October 2015, the majority of APEC economies decided to maintain their accommodative monetary policy stance to support domestic demand as global economic outlook remained uncertain.
• The maintenance of accommodative monetary policy among APEC economies has not triggered inflationary pressures as inflation in the APEC region was lower at 2.2 percent during the period January-September 2015 from the 2.8 percent recorded in January-September 2014, generally moving in tandem with world commodity prices.
• Growth is expected to soften in 2015 and recover in 2016. The APEC region is projected to grow by 3.1 percent in 2015, at par with the world, but below its 2014 GDP expansion of 3.4 percent. In 2016, the APEC region is expected to post a stronger GDP growth rate of 3.4 percent, although lower than the world GDP forecast of 3.6 percent.
1 This report covers data on GDP growth as of the first half of 2015, and other available information, including policy measures and economic forecasts, as of 31 October 2015.
• Going forward, three major factors will determine growth prospects during the period 2015-2016: i) persistence of the downward trend of oil and non-oil commodity prices; ii) strength of China’s economy and the stability of its markets; and iii) normalization of US monetary policy and its attendant risks.
• The softening of growth prospects as challenges intensify with the protracted weakness in the global economy require a concerted response to be able to raise current and potential growth. Economic resilience, therefore, demands that all available policy tools are utilized.
• Thus, in 2015 and beyond, as economies rebalance economic growth towards strengthening domestic demand, they will need to consider implementing an appropriate mix of monetary and fiscal policies together with structural reforms to raise productivity and strengthen private consumption, especially towards a more sustainable, resilient and inclusive growth.
3
I. Recent Economic Developments
Real GDP Growth: Drivers and Contributors
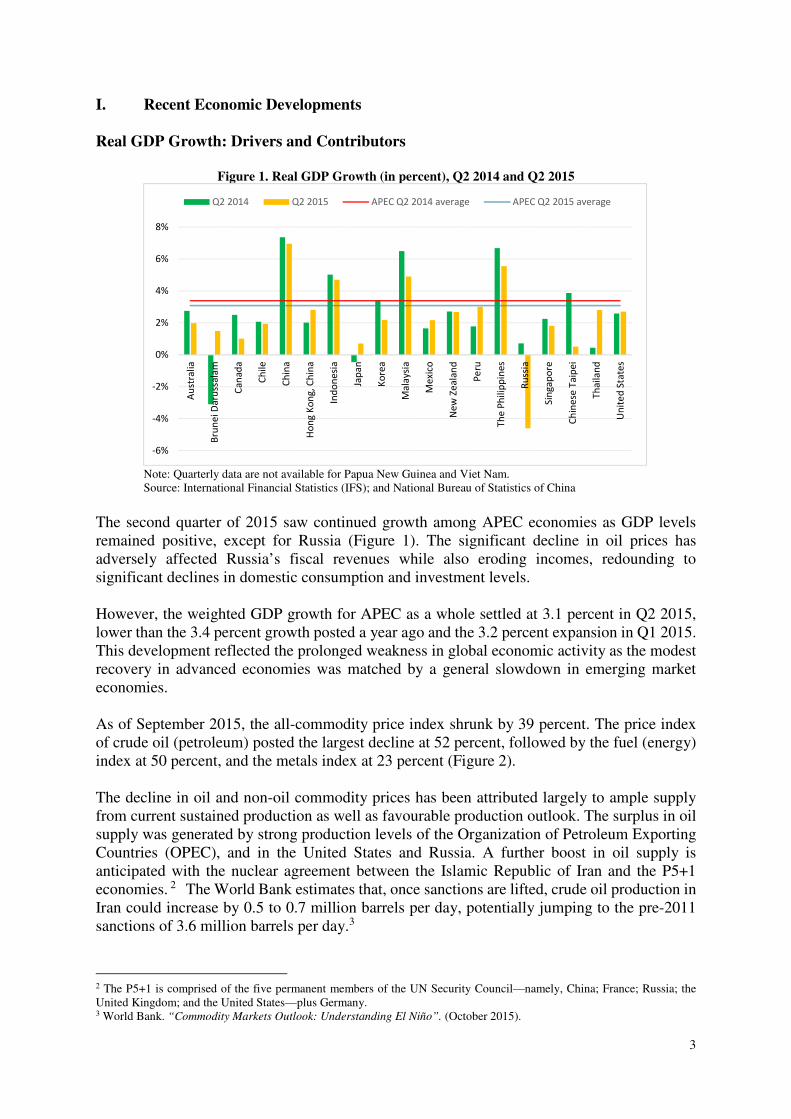
Figure 1. Real GDP Growth (in percent), Q2 2014 and Q2 2015
Note: Quarterly data are not available for Papua New Guinea and Viet Nam. Source: International Financial Statistics (IFS); and National Bureau of Statistics of China
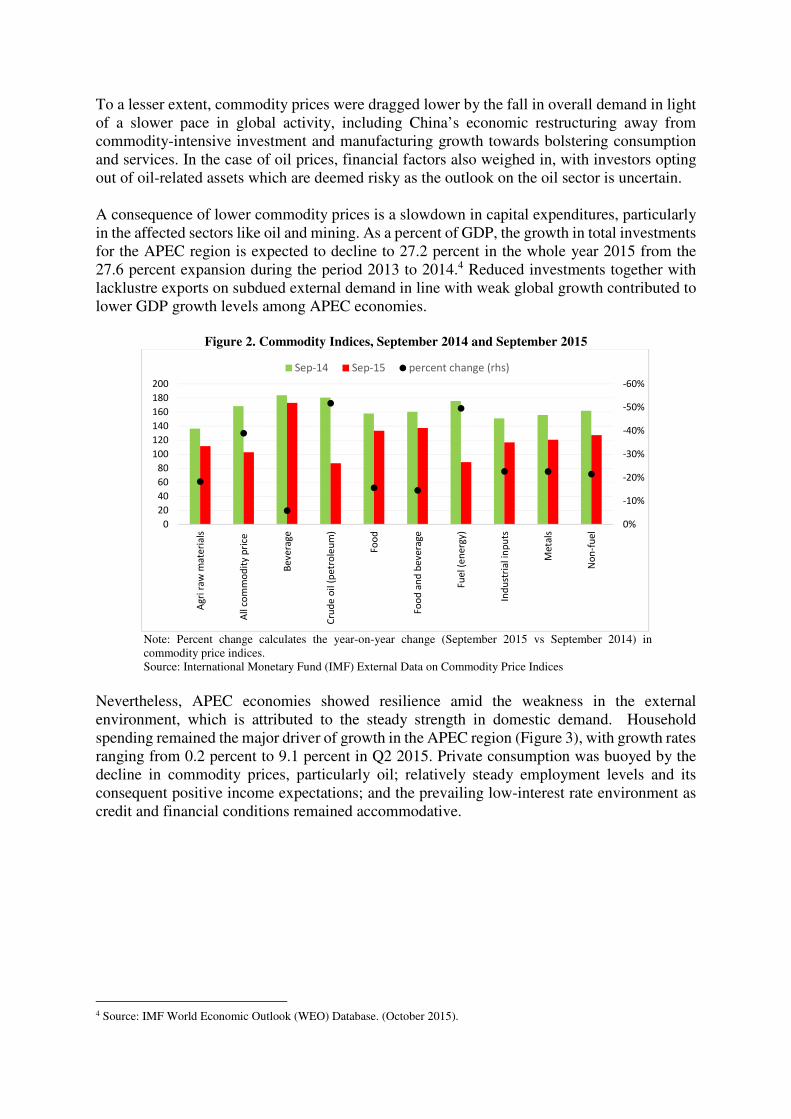
The second quarter of 2015 saw continued growth among APEC economies as GDP levels remained positive, except for Russia (Figure 1). The significant decline in oil prices has adversely affected Russia’s fiscal revenues while also eroding incomes, redounding to significant declines in domestic consumption and investment levels. However, the weighted GDP growth for APEC as a whole settled at 3.1 percent in Q2 2015, lower than the 3.4 percent growth posted a year ago and the 3.2 percent expansion in Q1 2015. This development reflected the prolonged weakness in global economic activity as the modest recovery in advanced economies was matched by a general slowdown in emerging market economies. As of September 2015, the all-commodity price index shrunk by 39 percent. The price index of crude oil (petroleum) posted the largest decline at 52 percent, followed by the fuel (energy) index at 50 percent, and the metals index at 23 percent (Figure 2). The decline in oil and non-oil commodity prices has been attributed largely to ample supply from current sustained production as well as favourable production outlook. The surplus in oil supply was generated by strong production levels of the Organization of Petroleum Exporting Countries (OPEC), and in the United States and Russia. A further boost in oil supply is anticipated with the nuclear agreement between the Islamic Republic of Iran and the P5+1 economies. 2 The World Bank estimates that, once sanctions are lifted, crude oil production in Iran could increase by 0.5 to 0.7 million barrels per day, potentially jumping to the pre-2011 sanctions of 3.6 million barrels per day.3
2 The P5+1 is comprised of the five permanent members of the UN Security Council—namely, China; France; Russia; the United Kingdom; and the United States—plus Germany. 3 World Bank. “Commodity Markets Outlook: Understanding El Niño”. (October 2015).
-6%
-4%
-2%
0%
2%
4%
6%
8%
Au
stra
lia
Bru
ne
i D
aru
ssa
lam
Ca
na
da
Ch
ile
Ch
ina
Ho
ng
Ko
ng
, C
hin
a
Ind
on
esi
a
Jap
an
Ko
rea
Ma
laysi
a
Me
xico
Ne
w Z
ea
lan
d
Pe
ru
Th
e P
hil
ipp
ine
s
Ru
ssia
Sin
ga
po
re
Ch
ine
se T
aip
ei
Th
ail
an
d
Un
ite
d S
tate
s
Q2 2014 Q2 2015 APEC Q2 2014 average APEC Q2 2015 average
To a lesser extent, commodity prices were dragged lower by the fall in overall demand in light of a slower pace in global activity, including China’s economic restructuring away from commodity-intensive investment and manufacturing growth towards bolstering consumption and services. In the case of oil prices, financial factors also weighed in, with investors opting out of oil-related assets which are deemed risky as the outlook on the oil sector is uncertain. A consequence of lower commodity prices is a slowdown in capital expenditures, particularly in the affected sectors like oil and mining. As a percent of GDP, the growth in total investments for the APEC region is expected to decline to 27.2 percent in the whole year 2015 from the 27.6 percent expansion during the period 2013 to 2014.4 Reduced investments together with lacklustre exports on subdued external demand in line with weak global growth contributed to lower GDP growth levels among APEC economies.
Figure 2. Commodity Indices, September 2014 and September 2015
Note: Percent change calculates the year-on-year change (September 2015 vs September 2014) in commodity price indices. Source: International Monetary Fund (IMF) External Data on Commodity Price Indices
Nevertheless, APEC economies showed resilience amid the weakness in the external environment, which is attributed to the steady strength in domestic demand. Household spending remained the major driver of growth in the APEC region (Figure 3), with growth rates ranging from 0.2 percent to 9.1 percent in Q2 2015. Private consumption was buoyed by the decline in commodity prices, particularly oil; relatively steady employment levels and its consequent positive income expectations; and the prevailing low-interest rate environment as credit and financial conditions remained accommodative.
4 Source: IMF World Economic Outlook (WEO) Database. (October 2015).
-60%
-50%
-40%
-30%
-20%
-10%
0%0
20
40
60
80
100
120
140
160
180
200
Ag
ri r
aw
ma
teri
als
All c
om
mo
dit
y p
rice
Be
ve
rag
e
Cru
de
oil
(p
etr
ole
um
)
Fo
od
Fo
od
an
d b
ev
era
ge
Fu
el (e
ne
rgy
)
Ind
ust
ria
l in
pu
ts
Me
tals
No
n-f
ue
l
Sep-14 Sep-15 percent change (rhs)
5
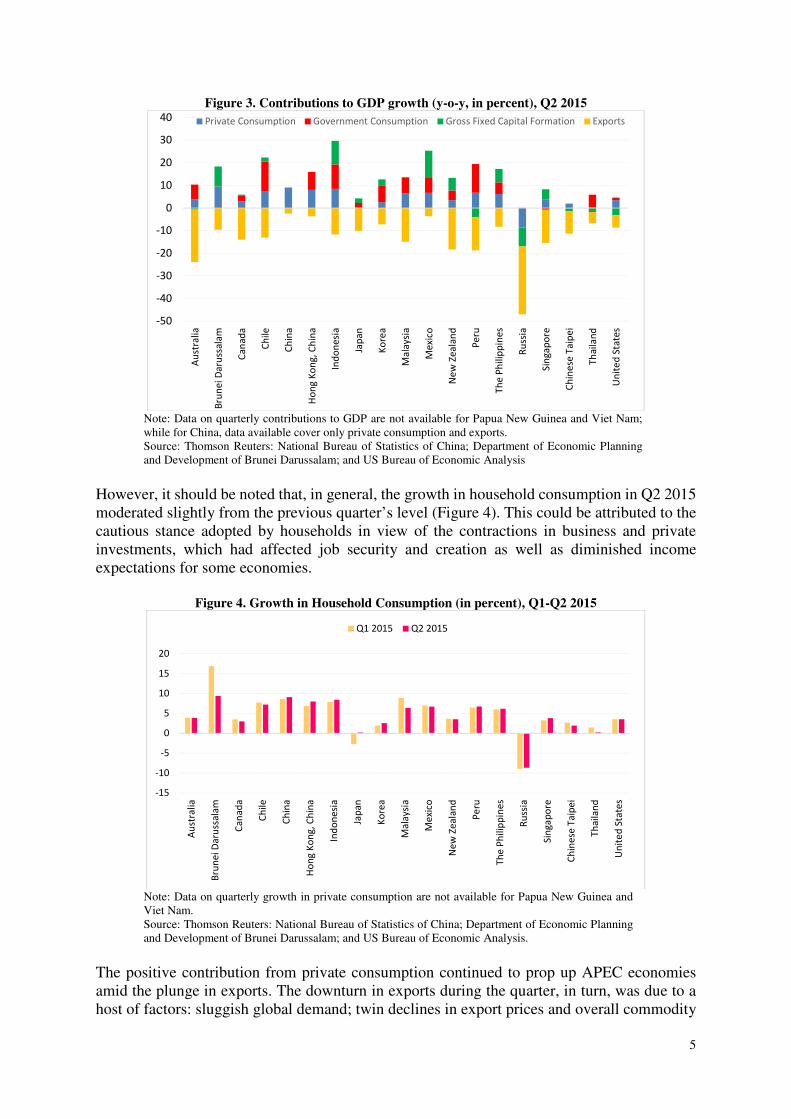
Figure 3. Contributions to GDP growth (y-o-y, in percent), Q2 2015
Note: Data on quarterly contributions to GDP are not available for Papua New Guinea and Viet Nam; while for China, data available cover only private consumption and exports. Source: Thomson Reuters: National Bureau of Statistics of China; Department of Economic Planning and Development of Brunei Darussalam; and US Bureau of Economic Analysis
However, it should be noted that, in general, the growth in household consumption in Q2 2015 moderated slightly from the previous quarter’s level (Figure 4). This could be attributed to the cautious stance adopted by households in view of the contractions in business and private investments, which had affected job security and creation as well as diminished income expectations for some economies.
Figure 4. Growth in Household Consumption (in percent), Q1-Q2 2015
Note: Data on quarterly growth in private consumption are not available for Papua New Guinea and Viet Nam. Source: Thomson Reuters: National Bureau of Statistics of China; Department of Economic Planning and Development of Brunei Darussalam; and US Bureau of Economic Analysis.
The positive contribution from private consumption continued to prop up APEC economies amid the plunge in exports. The downturn in exports during the quarter, in turn, was due to a host of factors: sluggish global demand; twin declines in export prices and overall commodity
-50
-40
-30
-20
-10
0
10
20
30
40
Au
stra
lia
Bru
ne
i D
aru
ssa
lam
Ca
na
da
Ch
ile
Ch
ina
Ho
ng
Ko
ng
, C
hin
a
Ind
on
esi
a
Jap
an
Ko
rea
Ma
laysi
a
Me
xico
Ne
w Z
ea
lan
d
Pe
ru
Th
e P
hil
ipp
ine
s
Ru
ssia
Sin
ga
po
re
Ch
ine
se T
aip
ei
Th
ail
an
d
Un
ite
d S
tate
s
Private Consumption Government Consumption Gross Fixed Capital Formation Exports
-15
-10
-5
0
5
10
15
20
Au
stra
lia
Bru
ne
i D
aru
ssa
lam
Ca
na
da
Ch
ile
Ch
ina
Ho
ng
Ko
ng
, C
hin
a
Ind
on
esi
a
Jap
an
Ko
rea
Ma
laysi
a
Me
xico
Ne
w Z
ea
lan
d
Pe
ru
Th
e P
hil
ipp
ine
s
Ru
ssia
Sin
ga
po
re
Ch
ine
se T
aip
ei
Th
ail
an
d
Un
ite
d S
tate
sQ1 2015 Q2 2015
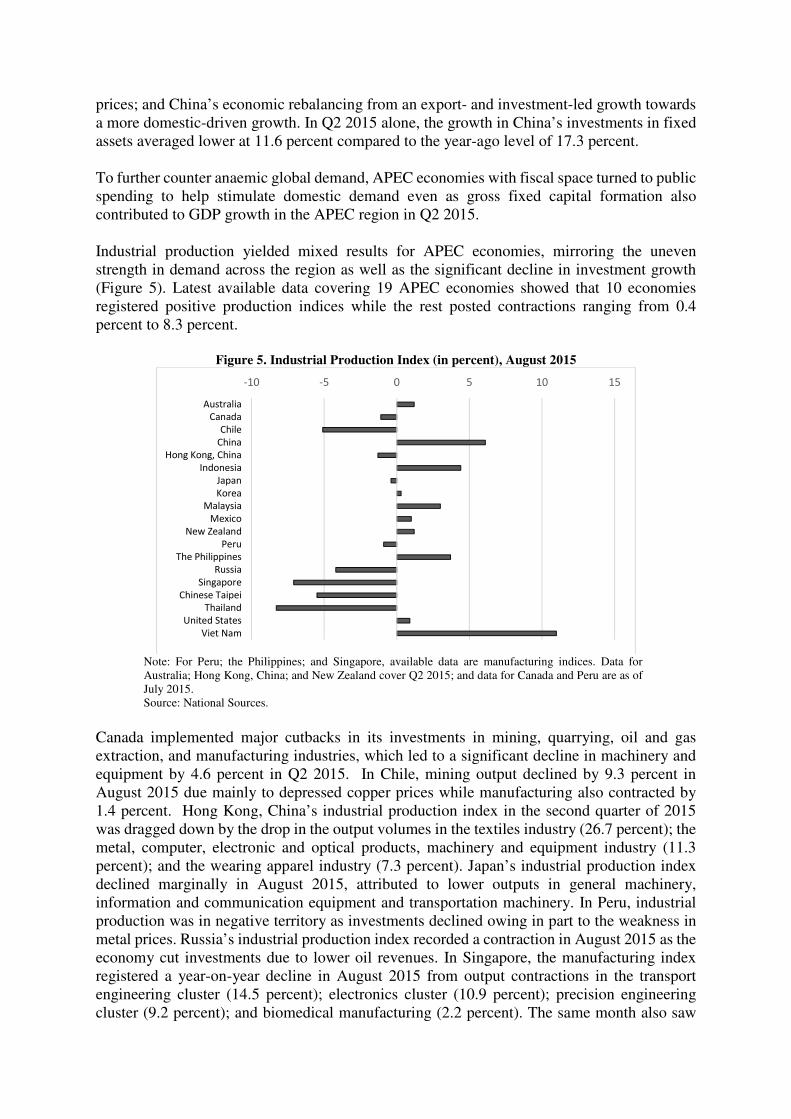
prices; and China’s economic rebalancing from an export- and investment-led growth towards a more domestic-driven growth. In Q2 2015 alone, the growth in China’s investments in fixed assets averaged lower at 11.6 percent compared to the year-ago level of 17.3 percent. To further counter anaemic global demand, APEC economies with fiscal space turned to public spending to help stimulate domestic demand even as gross fixed capital formation also contributed to GDP growth in the APEC region in Q2 2015. Industrial production yielded mixed results for APEC economies, mirroring the uneven strength in demand across the region as well as the significant decline in investment growth (Figure 5). Latest available data covering 19 APEC economies showed that 10 economies registered positive production indices while the rest posted contractions ranging from 0.4 percent to 8.3 percent.
Figure 5. Industrial Production Index (in percent), August 2015
Note: For Peru; the Philippines; and Singapore, available data are manufacturing indices. Data for Australia; Hong Kong, China; and New Zealand cover Q2 2015; and data for Canada and Peru are as of July 2015. Source: National Sources.
Canada implemented major cutbacks in its investments in mining, quarrying, oil and gas extraction, and manufacturing industries, which led to a significant decline in machinery and equipment by 4.6 percent in Q2 2015. In Chile, mining output declined by 9.3 percent in August 2015 due mainly to depressed copper prices while manufacturing also contracted by 1.4 percent. Hong Kong, China’s industrial production index in the second quarter of 2015 was dragged down by the drop in the output volumes in the textiles industry (26.7 percent); the metal, computer, electronic and optical products, machinery and equipment industry (11.3 percent); and the wearing apparel industry (7.3 percent). Japan’s industrial production index declined marginally in August 2015, attributed to lower outputs in general machinery, information and communication equipment and transportation machinery. In Peru, industrial production was in negative territory as investments declined owing in part to the weakness in metal prices. Russia’s industrial production index recorded a contraction in August 2015 as the economy cut investments due to lower oil revenues. In Singapore, the manufacturing index registered a year-on-year decline in August 2015 from output contractions in the transport engineering cluster (14.5 percent); electronics cluster (10.9 percent); precision engineering cluster (9.2 percent); and biomedical manufacturing (2.2 percent). The same month also saw
-10 -5 0 5 10 15
Australia
Canada
Chile
China
Hong Kong, China
Indonesia
Japan
Korea
Malaysia
Mexico
New Zealand
Peru
The Philippines
Russia
Singapore
Chinese Taipei
Thailand
United States
Viet Nam
7
Chinese Taipei posting a negative industrial production index as electricity and manufacturing production levels declined with the uncertainty in external demand. In Thailand, the decline in production index in August 2015 is due largely to contractions in finished goods (6.5 percent); and shipment-related manufacturing output (5.5 percent), particularly of motor vehicles, refined petroleum products, and electronic valves and tubes and other electronic components. It is worthwhile to note that Viet Nam bucked the trend with an 11 percent increase in its industrial production index resulting from significant growth in the quarrying of stone, sand and clay (22.1 percent); electricity and gas (15.1 percent); and manufacturing (11.8 percent).
Box 1. The Trans-Pacific Partnership (TPP) Trade Agreement and APEC
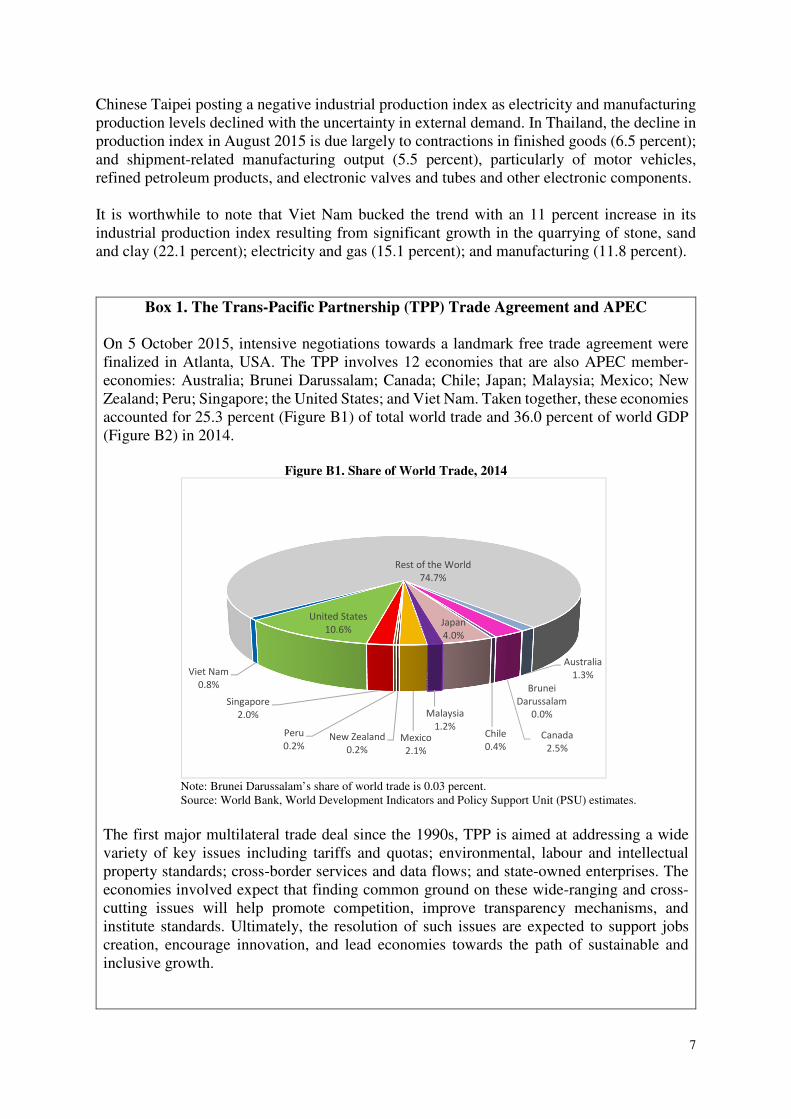
On 5 October 2015, intensive negotiations towards a landmark free trade agreement were finalized in Atlanta, USA. The TPP involves 12 economies that are also APEC member-economies: Australia; Brunei Darussalam; Canada; Chile; Japan; Malaysia; Mexico; New Zealand; Peru; Singapore; the United States; and Viet Nam. Taken together, these economies accounted for 25.3 percent (Figure B1) of total world trade and 36.0 percent of world GDP (Figure B2) in 2014.
Figure B1. Share of World Trade, 2014
Note: Brunei Darussalam’s share of world trade is 0.03 percent. Source: World Bank, World Development Indicators and Policy Support Unit (PSU) estimates.
The first major multilateral trade deal since the 1990s, TPP is aimed at addressing a wide variety of key issues including tariffs and quotas; environmental, labour and intellectual property standards; cross-border services and data flows; and state-owned enterprises. The economies involved expect that finding common ground on these wide-ranging and cross-cutting issues will help promote competition, improve transparency mechanisms, and institute standards. Ultimately, the resolution of such issues are expected to support jobs creation, encourage innovation, and lead economies towards the path of sustainable and inclusive growth.
Australia
1.3%
Brunei
Darussalam
0.0%
Canada
2.5%
Chile
0.4%
Japan
4.0%
Malaysia
1.2%Mexico
2.1%
New Zealand
0.2%
Peru
0.2%
Singapore
2.0%
United States
10.6%
Viet Nam
0.8%
Rest of the World
74.7%
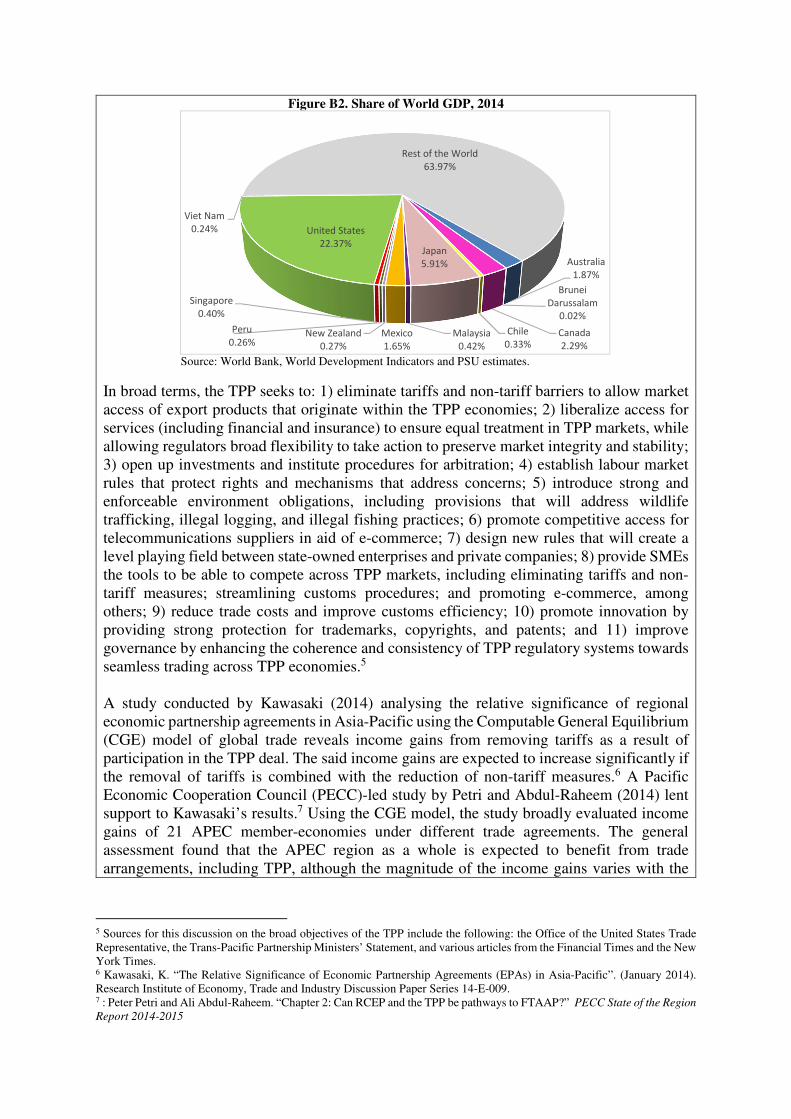
Figure B2. Share of World GDP, 2014
Source: World Bank, World Development Indicators and PSU estimates.
In broad terms, the TPP seeks to: 1) eliminate tariffs and non-tariff barriers to allow market access of export products that originate within the TPP economies; 2) liberalize access for services (including financial and insurance) to ensure equal treatment in TPP markets, while allowing regulators broad flexibility to take action to preserve market integrity and stability; 3) open up investments and institute procedures for arbitration; 4) establish labour market rules that protect rights and mechanisms that address concerns; 5) introduce strong and enforceable environment obligations, including provisions that will address wildlife trafficking, illegal logging, and illegal fishing practices; 6) promote competitive access for telecommunications suppliers in aid of e-commerce; 7) design new rules that will create a level playing field between state-owned enterprises and private companies; 8) provide SMEs the tools to be able to compete across TPP markets, including eliminating tariffs and non-tariff measures; streamlining customs procedures; and promoting e-commerce, among others; 9) reduce trade costs and improve customs efficiency; 10) promote innovation by providing strong protection for trademarks, copyrights, and patents; and 11) improve governance by enhancing the coherence and consistency of TPP regulatory systems towards seamless trading across TPP economies.5 A study conducted by Kawasaki (2014) analysing the relative significance of regional economic partnership agreements in Asia-Pacific using the Computable General Equilibrium (CGE) model of global trade reveals income gains from removing tariffs as a result of participation in the TPP deal. The said income gains are expected to increase significantly if the removal of tariffs is combined with the reduction of non-tariff measures.6 A Pacific Economic Cooperation Council (PECC)-led study by Petri and Abdul-Raheem (2014) lent support to Kawasaki’s results.7 Using the CGE model, the study broadly evaluated income gains of 21 APEC member-economies under different trade agreements. The general assessment found that the APEC region as a whole is expected to benefit from trade arrangements, including TPP, although the magnitude of the income gains varies with the
5 Sources for this discussion on the broad objectives of the TPP include the following: the Office of the United States Trade Representative, the Trans-Pacific Partnership Ministers’ Statement, and various articles from the Financial Times and the New York Times. 6 Kawasaki, K. “The Relative Significance of Economic Partnership Agreements (EPAs) in Asia-Pacific”. (January 2014). Research Institute of Economy, Trade and Industry Discussion Paper Series 14-E-009. 7 : Peter Petri and Ali Abdul-Raheem. “Chapter 2: Can RCEP and the TPP be pathways to FTAAP?” PECC State of the Region
Report 2014-2015
Australia
1.87%
Brunei
Darussalam
0.02%
Canada
2.29%
Chile
0.33%
Japan
5.91%
Malaysia
0.42%
Mexico
1.65%
New Zealand
0.27%
Peru
0.26%
Singapore
0.40%
United States
22.37%
Viet Nam
0.24%
Rest of the World
63.97%
9
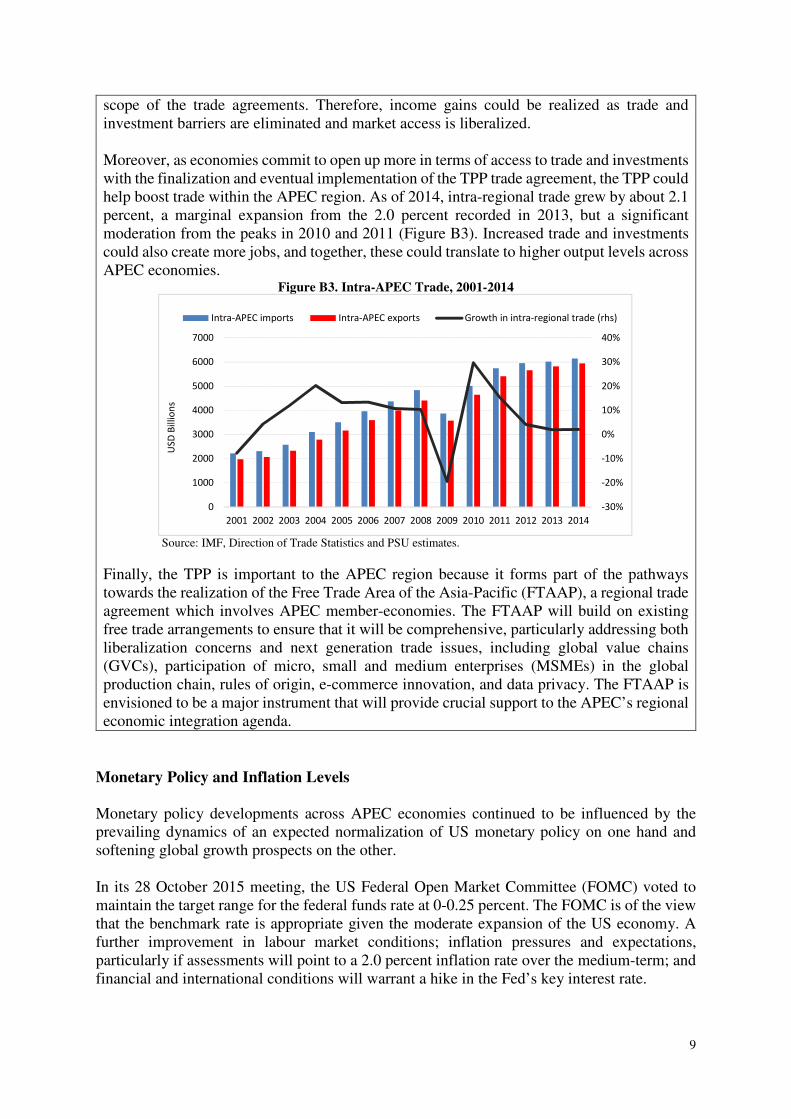
scope of the trade agreements. Therefore, income gains could be realized as trade and investment barriers are eliminated and market access is liberalized. Moreover, as economies commit to open up more in terms of access to trade and investments with the finalization and eventual implementation of the TPP trade agreement, the TPP could help boost trade within the APEC region. As of 2014, intra-regional trade grew by about 2.1 percent, a marginal expansion from the 2.0 percent recorded in 2013, but a significant moderation from the peaks in 2010 and 2011 (Figure B3). Increased trade and investments could also create more jobs, and together, these could translate to higher output levels across APEC economies.
Figure B3. Intra-APEC Trade, 2001-2014
Source: IMF, Direction of Trade Statistics and PSU estimates.
Finally, the TPP is important to the APEC region because it forms part of the pathways towards the realization of the Free Trade Area of the Asia-Pacific (FTAAP), a regional trade agreement which involves APEC member-economies. The FTAAP will build on existing free trade arrangements to ensure that it will be comprehensive, particularly addressing both liberalization concerns and next generation trade issues, including global value chains (GVCs), participation of micro, small and medium enterprises (MSMEs) in the global production chain, rules of origin, e-commerce innovation, and data privacy. The FTAAP is envisioned to be a major instrument that will provide crucial support to the APEC’s regional economic integration agenda.
Monetary Policy and Inflation Levels
Monetary policy developments across APEC economies continued to be influenced by the prevailing dynamics of an expected normalization of US monetary policy on one hand and softening global growth prospects on the other. In its 28 October 2015 meeting, the US Federal Open Market Committee (FOMC) voted to maintain the target range for the federal funds rate at 0-0.25 percent. The FOMC is of the view that the benchmark rate is appropriate given the moderate expansion of the US economy. A further improvement in labour market conditions; inflation pressures and expectations, particularly if assessments will point to a 2.0 percent inflation rate over the medium-term; and financial and international conditions will warrant a hike in the Fed’s key interest rate.
-30%
-20%
-10%
0%
10%
20%
30%
40%
0
1000
2000
3000
4000
5000
6000
7000
2001 2002 2003 2004 2005 2006 2007 2008 2009 2010 2011 2012 2013 2014
US
D B
illio
ns
Intra-APEC imports Intra-APEC exports Growth in intra-regional trade (rhs)
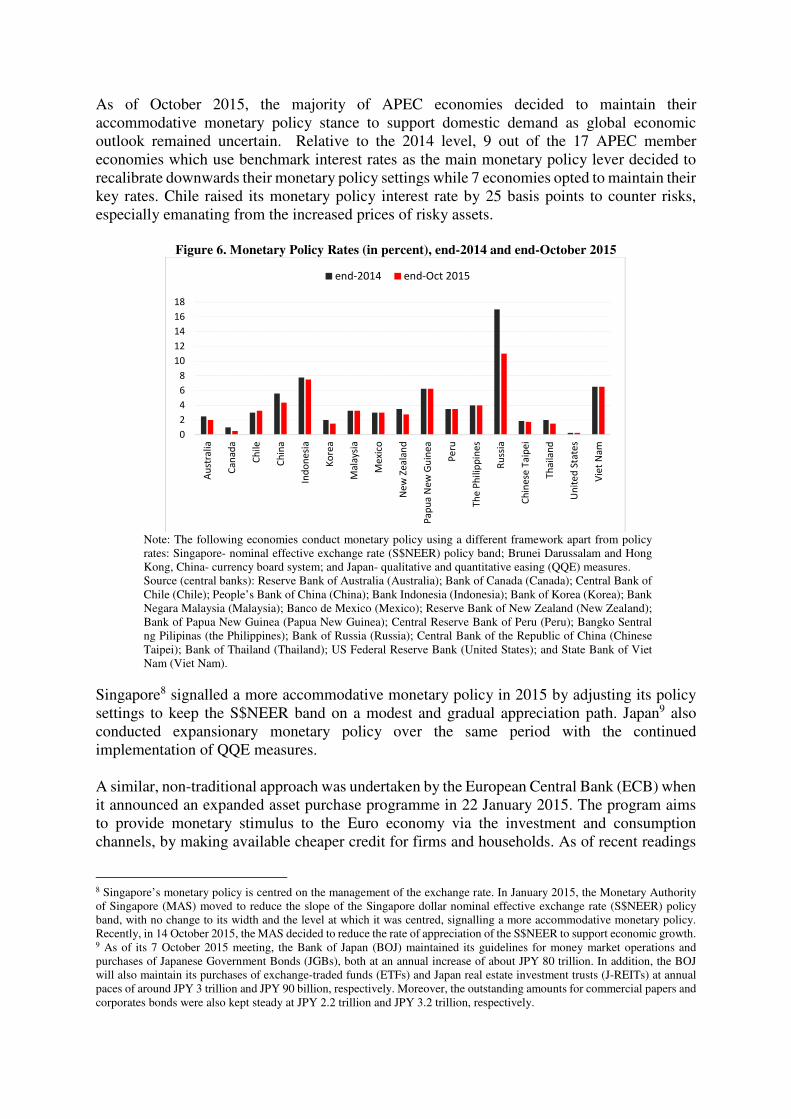
As of October 2015, the majority of APEC economies decided to maintain their accommodative monetary policy stance to support domestic demand as global economic outlook remained uncertain. Relative to the 2014 level, 9 out of the 17 APEC member economies which use benchmark interest rates as the main monetary policy lever decided to recalibrate downwards their monetary policy settings while 7 economies opted to maintain their key rates. Chile raised its monetary policy interest rate by 25 basis points to counter risks, especially emanating from the increased prices of risky assets.
Figure 6. Monetary Policy Rates (in percent), end-2014 and end-October 2015
Note: The following economies conduct monetary policy using a different framework apart from policy rates: Singapore- nominal effective exchange rate (S$NEER) policy band; Brunei Darussalam and Hong Kong, China- currency board system; and Japan- qualitative and quantitative easing (QQE) measures. Source (central banks): Reserve Bank of Australia (Australia); Bank of Canada (Canada); Central Bank of Chile (Chile); People’s Bank of China (China); Bank Indonesia (Indonesia); Bank of Korea (Korea); Bank Negara Malaysia (Malaysia); Banco de Mexico (Mexico); Reserve Bank of New Zealand (New Zealand); Bank of Papua New Guinea (Papua New Guinea); Central Reserve Bank of Peru (Peru); Bangko Sentral ng Pilipinas (the Philippines); Bank of Russia (Russia); Central Bank of the Republic of China (Chinese Taipei); Bank of Thailand (Thailand); US Federal Reserve Bank (United States); and State Bank of Viet Nam (Viet Nam).
Singapore8 signalled a more accommodative monetary policy in 2015 by adjusting its policy settings to keep the S$NEER band on a modest and gradual appreciation path. Japan9 also conducted expansionary monetary policy over the same period with the continued implementation of QQE measures. A similar, non-traditional approach was undertaken by the European Central Bank (ECB) when it announced an expanded asset purchase programme in 22 January 2015. The program aims to provide monetary stimulus to the Euro economy via the investment and consumption channels, by making available cheaper credit for firms and households. As of recent readings
8 Singapore’s monetary policy is centred on the management of the exchange rate. In January 2015, the Monetary Authority of Singapore (MAS) moved to reduce the slope of the Singapore dollar nominal effective exchange rate (S$NEER) policy band, with no change to its width and the level at which it was centred, signalling a more accommodative monetary policy. Recently, in 14 October 2015, the MAS decided to reduce the rate of appreciation of the S$NEER to support economic growth. 9 As of its 7 October 2015 meeting, the Bank of Japan (BOJ) maintained its guidelines for money market operations and purchases of Japanese Government Bonds (JGBs), both at an annual increase of about JPY 80 trillion. In addition, the BOJ will also maintain its purchases of exchange-traded funds (ETFs) and Japan real estate investment trusts (J-REITs) at annual paces of around JPY 3 trillion and JPY 90 billion, respectively. Moreover, the outstanding amounts for commercial papers and corporates bonds were also kept steady at JPY 2.2 trillion and JPY 3.2 trillion, respectively.
0
2
4
6
8
10
12
14
16
18
Au
stra
lia
Ca
na
da
Ch
ile
Ch
ina
Ind
on
esi
a
Ko
rea
Ma
laysi
a
Me
xico
Ne
w Z
ea
lan
d
Pa
pu
a N
ew
Gu
ine
a
Pe
ru
Th
e P
hil
ipp
ine
s
Ru
ssia
Ch
ine
se T
aip
ei
Th
ail
an
d
Un
ite
d S
tate
s
Vie
t N
am
end-2014 end-Oct 2015
11
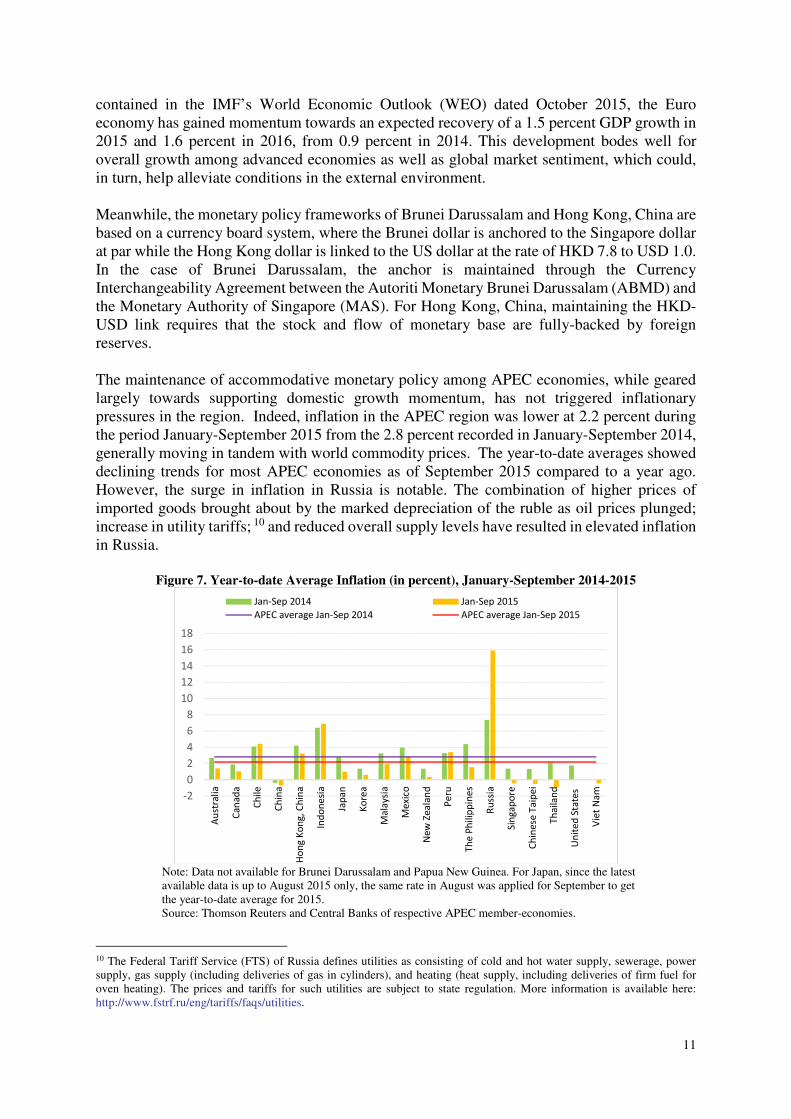
contained in the IMF’s World Economic Outlook (WEO) dated October 2015, the Euro economy has gained momentum towards an expected recovery of a 1.5 percent GDP growth in 2015 and 1.6 percent in 2016, from 0.9 percent in 2014. This development bodes well for overall growth among advanced economies as well as global market sentiment, which could, in turn, help alleviate conditions in the external environment. Meanwhile, the monetary policy frameworks of Brunei Darussalam and Hong Kong, China are based on a currency board system, where the Brunei dollar is anchored to the Singapore dollar at par while the Hong Kong dollar is linked to the US dollar at the rate of HKD 7.8 to USD 1.0. In the case of Brunei Darussalam, the anchor is maintained through the Currency Interchangeability Agreement between the Autoriti Monetary Brunei Darussalam (ABMD) and the Monetary Authority of Singapore (MAS). For Hong Kong, China, maintaining the HKD-USD link requires that the stock and flow of monetary base are fully-backed by foreign reserves. The maintenance of accommodative monetary policy among APEC economies, while geared largely towards supporting domestic growth momentum, has not triggered inflationary pressures in the region. Indeed, inflation in the APEC region was lower at 2.2 percent during the period January-September 2015 from the 2.8 percent recorded in January-September 2014, generally moving in tandem with world commodity prices. The year-to-date averages showed declining trends for most APEC economies as of September 2015 compared to a year ago. However, the surge in inflation in Russia is notable. The combination of higher prices of imported goods brought about by the marked depreciation of the ruble as oil prices plunged; increase in utility tariffs; 10 and reduced overall supply levels have resulted in elevated inflation in Russia.
Figure 7. Year-to-date Average Inflation (in percent), January-September 2014-2015
Note: Data not available for Brunei Darussalam and Papua New Guinea. For Japan, since the latest available data is up to August 2015 only, the same rate in August was applied for September to get the year-to-date average for 2015. Source: Thomson Reuters and Central Banks of respective APEC member-economies.
10 The Federal Tariff Service (FTS) of Russia defines utilities as consisting of cold and hot water supply, sewerage, power supply, gas supply (including deliveries of gas in cylinders), and heating (heat supply, including deliveries of firm fuel for oven heating). The prices and tariffs for such utilities are subject to state regulation. More information is available here: http://www.fstrf.ru/eng/tariffs/faqs/utilities.
-2
0
2
4
6
8
10
12
14
16
18
Au
stra
lia
Ca
na
da
Ch
ile
Ch
ina
Ho
ng
Ko
ng
, C
hin
a
Ind
on
esi
a
Jap
an
Ko
rea
Ma
laysi
a
Me
xico
Ne
w Z
ea
lan
d
Pe
ru
Th
e P
hil
ipp
ine
s
Ru
ssia
Sin
ga
po
re
Ch
ine
se T
aip
ei
Th
ail
an
d
Un
ite
d S
tate
s
Vie
t N
am
Jan-Sep 2014 Jan-Sep 2015
APEC average Jan-Sep 2014 APEC average Jan-Sep 2015
II. Economic Outlook and Policy Directions
Expectations in the Near-term
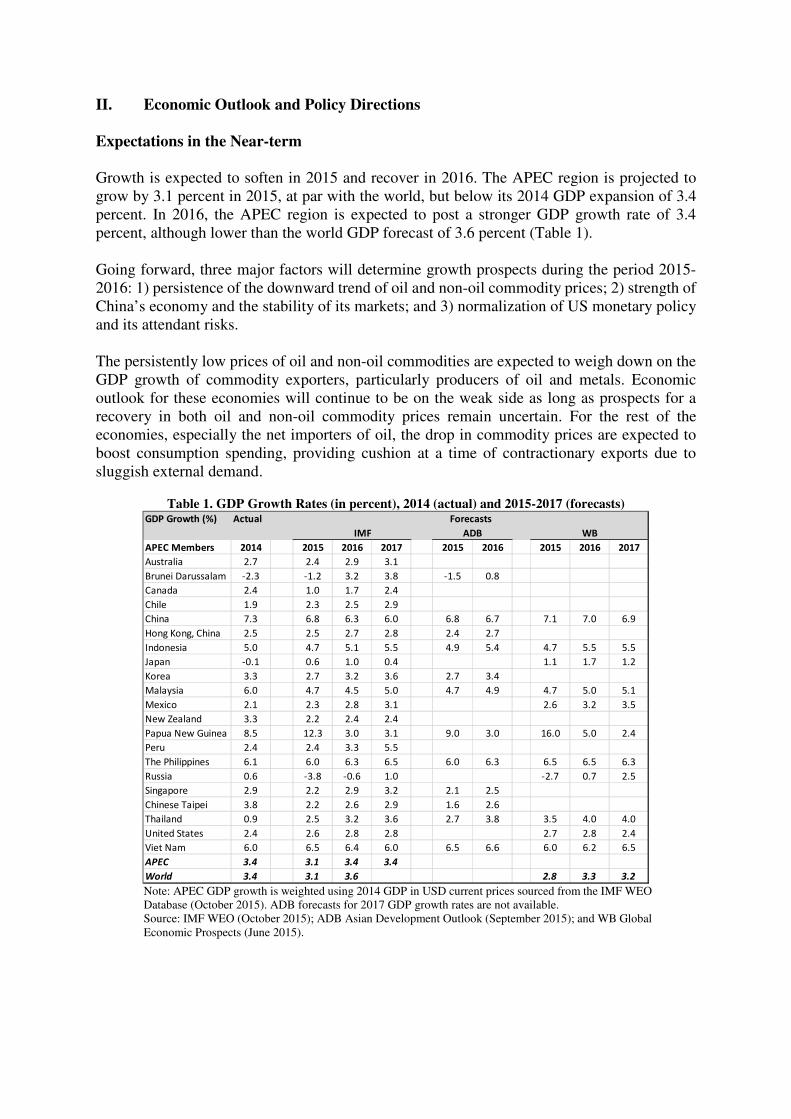
Growth is expected to soften in 2015 and recover in 2016. The APEC region is projected to grow by 3.1 percent in 2015, at par with the world, but below its 2014 GDP expansion of 3.4 percent. In 2016, the APEC region is expected to post a stronger GDP growth rate of 3.4 percent, although lower than the world GDP forecast of 3.6 percent (Table 1). Going forward, three major factors will determine growth prospects during the period 2015-2016: 1) persistence of the downward trend of oil and non-oil commodity prices; 2) strength of China’s economy and the stability of its markets; and 3) normalization of US monetary policy and its attendant risks. The persistently low prices of oil and non-oil commodities are expected to weigh down on the GDP growth of commodity exporters, particularly producers of oil and metals. Economic outlook for these economies will continue to be on the weak side as long as prospects for a recovery in both oil and non-oil commodity prices remain uncertain. For the rest of the economies, especially the net importers of oil, the drop in commodity prices are expected to boost consumption spending, providing cushion at a time of contractionary exports due to sluggish external demand.
Table 1. GDP Growth Rates (in percent), 2014 (actual) and 2015-2017 (forecasts)
Note: APEC GDP growth is weighted using 2014 GDP in USD current prices sourced from the IMF WEO Database (October 2015). ADB forecasts for 2017 GDP growth rates are not available. Source: IMF WEO (October 2015); ADB Asian Development Outlook (September 2015); and WB Global Economic Prospects (June 2015).
GDP Growth (%) Actual Forecasts
IMF ADB WB
APEC Members 2014 2015 2016 2017 2015 2016 2015 2016 2017
Australia 2.7 2.4 2.9 3.1
Brunei Darussalam -2.3 -1.2 3.2 3.8 -1.5 0.8
Canada 2.4 1.0 1.7 2.4
Chile 1.9 2.3 2.5 2.9
China 7.3 6.8 6.3 6.0 6.8 6.7 7.1 7.0 6.9
Hong Kong, China 2.5 2.5 2.7 2.8 2.4 2.7
Indonesia 5.0 4.7 5.1 5.5 4.9 5.4 4.7 5.5 5.5
Japan -0.1 0.6 1.0 0.4 1.1 1.7 1.2
Korea 3.3 2.7 3.2 3.6 2.7 3.4
Malaysia 6.0 4.7 4.5 5.0 4.7 4.9 4.7 5.0 5.1
Mexico 2.1 2.3 2.8 3.1 2.6 3.2 3.5
New Zealand 3.3 2.2 2.4 2.4
Papua New Guinea 8.5 12.3 3.0 3.1 9.0 3.0 16.0 5.0 2.4
Peru 2.4 2.4 3.3 5.5
The Philippines 6.1 6.0 6.3 6.5 6.0 6.3 6.5 6.5 6.3
Russia 0.6 -3.8 -0.6 1.0 -2.7 0.7 2.5
Singapore 2.9 2.2 2.9 3.2 2.1 2.5
Chinese Taipei 3.8 2.2 2.6 2.9 1.6 2.6
Thailand 0.9 2.5 3.2 3.6 2.7 3.8 3.5 4.0 4.0
United States 2.4 2.6 2.8 2.8 2.7 2.8 2.4
Viet Nam 6.0 6.5 6.4 6.0 6.5 6.6 6.0 6.2 6.5
APEC 3.4 3.1 3.4 3.4
World 3.4 3.1 3.6 2.8 3.3 3.2
13
As of September 2015, the IMF reports11 that the likelihood of per-barrel prices for WTI crude oil dropping below USD 30 has increased by 3 percentage points to 11 percent from August, while the probability of prices rising above USD 60 fell by 2 percentage points to 11 percent. During the same month-on-month review, expectations that copper prices could settle below USD 1.5 per pound were unchanged at 6 percent, while the likelihood of higher copper prices at above USD 3 fell slightly to 10 percent from 11 percent. One-year-ahead projections for agricultural products are mixed, with prices of bushel corn, soybean and soybean meal more likely to decline due to adequate supply and upbeat production outlook; while prices of meat and coffee are expected to be marginally higher. Second, the ongoing rebalancing in China, which necessitates a moderation in growth as the economy transitions towards a consumption- and services-led growth from an investment- and manufacturing-intensive growth, is expected to have important implications on the economic activity of its trade partners as well as neighbouring economies. It should be noted that China’s growth is expected to moderate in 2015 to the range of 6.8 percent to 7.1 percent from the 7.3 percent GDP growth in 2014 as it institutes reforms to put the economy on a more sustainable footing. A further moderation in China’s economic growth from its official target of 7.0 percent for 2015 could translate into a further decline in overall demand from China, which will exert increased downward pressure on world commodity prices (e.g., for iron ore and copper). Currently, China’s share in the global metals consumption is estimated at 50 percent, reflecting the infrastructure investment and construction boom experienced by the Chinese economy during the period 2009-2013.12 Moreover, the export revenues of China’s trading partners will also be affected with China’s moderation. Lower demand from China together with the prevailing weakness in global demand, will pull down the prices and export levels of metals, in particular. These, in turn, imply adverse growth effects for economies that are reliant on China. The impact of the twin episodes in China’s equity and foreign exchange markets are expected to be unwound without significant macroeconomic repercussions. On 8 July 2015, the Shanghai Composite Index dropped by 32 percent from a peak of 5,166.35 index points in 12 June 2015 to 3,507.3 index points. Nonetheless, this sharp technical correction in China’s equity index has not dampened domestic consumption since the number of urban households in China with stock holdings is not sizeable. As of 13 October 2015, the Shanghai composite index stood at 3,293.2 index points, albeit still lower than the peak, but an improvement from the end-2014 level of 3,234.68 index points. Meanwhile, on 11 August 2015, the Chinese yuan depreciated by 1.8 percent against the US dollar, and further to almost 4 percent in 12 August 2015. The People’s Bank of China is of the view that such adjustment is expected to improve the central parity of the yuan to be consistent with market fundamentals.13 The IMF estimates that, taking into account this 4 percent adjustment, the yuan is still stronger by around 10 percent compared to its 2014 average in real effective terms.14 As of 25 October 2015, the yuan was trading at CNY 6.32 to USD 1, which constitutes a recovery from the low of CNY 6.44 to USD 1 recorded in August 2015. Third, the eventual normalization of US monetary policy—which means an increase in the benchmark US interest rate from its near-zero level coupled with a reduction in the amount of
11 IMF Research Department, Commodities Team. “Commodity Price Outlook and Risks,” IMF Monthly Report. (16 September 2015). Available at http://www.imf.org/external/np/res/commod/pdf/cpor/2015/cpor0915.pdf. 12 IMF. “World Economic Outlook: Adjusting to Lower Commodity Prices,” IMF World Economic Outlook. (October 2015). 13 Remarks by the Spokesman of the People’s Bank of China in the Q&A with the Press, available here http://www.chinamission.be/eng/fyrjh/t1288276.htm 14 Ibid.
liquidity circulating in the market—is expected to translate into tighter credit and financial conditions with wide-ranging effects. The foremost priority is to ensure that the US monetary policy lift-off and unwinding of quantitative easing will be done in a smooth and orderly manner, factoring market expectations as to the timing and magnitude of the hike in interest rate. Nonetheless, higher interest rates in the US will signal the end of a regime of easy monetary conditions. For one, increasing rates exert appreciating pressures on the US dollar. This, in turn, will introduce balance sheet risks and funding strains for dollar debtors, which could offset the trade gains from weaker domestic currencies vis-à-vis the US dollar. In addition, an increase in US interest rates combined with slower growth among emerging and developing economies could heighten the risk of capital flow reversals. APEC economies have implemented measures to fortify their resilience against external shocks and capital flights with more flexible exchange rates, build-up in foreign exchanges, and stronger macroeconomic fundamentals. However, over the past decade, increased financial integration and exposure to foreign currency-denominated debt have also made economies more vulnerable to economic downturns and episodes of global financial market volatility. This vulnerability, if left unchecked, could build up into complicated layers of risks and diminish market confidence, affecting financial stability and economic growth objectives. Monetary Policy Accommodation, Fiscal Spending and Structural Reforms
The softening of growth prospects as challenges intensify with the protracted weakness in the global economy require a concerted response to be able to raise current and potential growth. Economic resilience, therefore, demands that all available policy tools are utilized. Thus, in 2015 and beyond, as economies rebalance towards a domestic-driven growth, they will need to consider implementing an appropriate mix of monetary and fiscal policies together with structural reforms to raise productivity and strengthen private consumption, especially towards a more sustainable, resilient and inclusive growth.15 Maintaining a low-interest rate environment with accommodative monetary policy settings combined with quantitative easing measures remain important to fuel credit growth and household consumption. However, it is worthwhile to note that, even with historically low interest rates and generally benign inflation levels with the continuous decline in commodity prices, global economic activity has remained muted. In the case of the APEC region, monetary policies have been adjusted to support domestic economic growth requirements, but more needs to be done. For economies with fiscal space, spending on infrastructure and social programmes aimed at increasing labour productivity and improving growth inclusiveness towards economic sustainability could be a priority in the next crucial years. Therefore, fiscal spending could focus on programs that upgrade education and skills, improve infrastructure, implement labour market reforms that increase the participation of women and vulnerable groups, and strengthen institutions. IMF estimates show that fiscal expenditures in APEC economies are poised to increase in 2015 and 2016 compared to 2014 levels. Using weighted averages, total expenditures as share of
15 Cf. Hernando, R. and E. San Andres (2015). Structural Reform for Resilient and Inclusive Growth. PSU Policy Brief 13. http://publications.apec.org/publication-detail.php?pub_id=1646
15
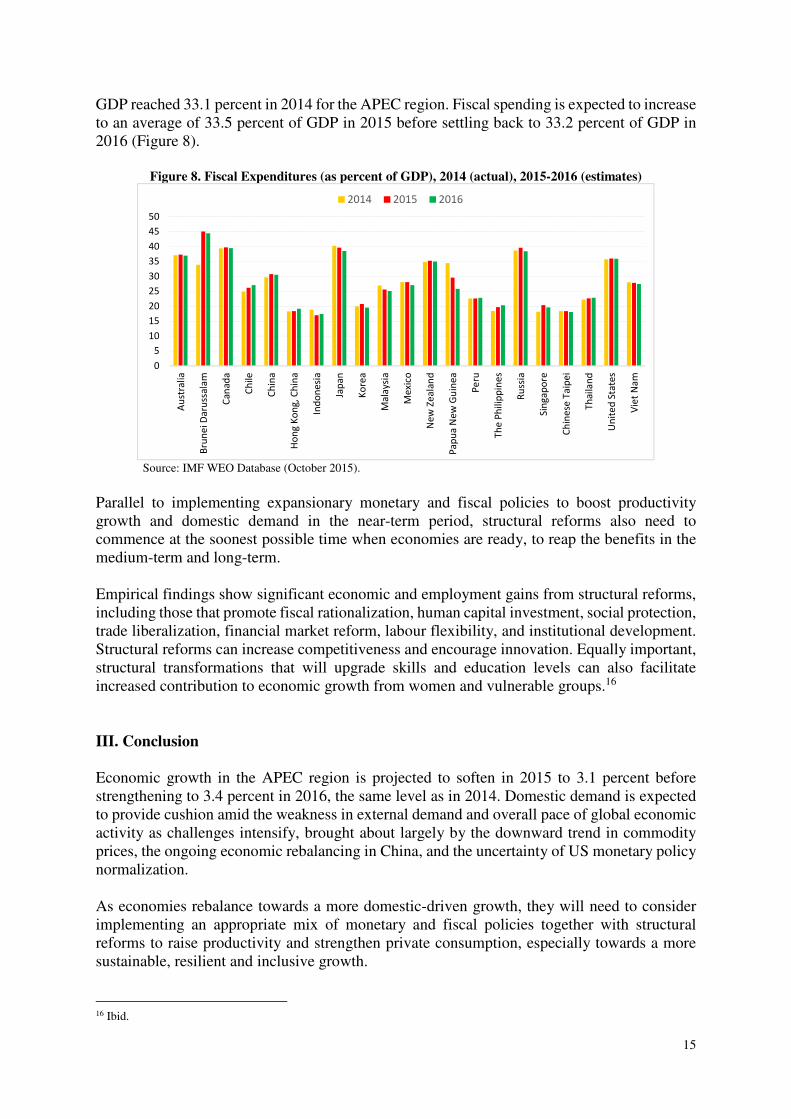
GDP reached 33.1 percent in 2014 for the APEC region. Fiscal spending is expected to increase to an average of 33.5 percent of GDP in 2015 before settling back to 33.2 percent of GDP in 2016 (Figure 8).
Figure 8. Fiscal Expenditures (as percent of GDP), 2014 (actual), 2015-2016 (estimates)
Source: IMF WEO Database (October 2015).
Parallel to implementing expansionary monetary and fiscal policies to boost productivity growth and domestic demand in the near-term period, structural reforms also need to commence at the soonest possible time when economies are ready, to reap the benefits in the medium-term and long-term. Empirical findings show significant economic and employment gains from structural reforms, including those that promote fiscal rationalization, human capital investment, social protection, trade liberalization, financial market reform, labour flexibility, and institutional development. Structural reforms can increase competitiveness and encourage innovation. Equally important, structural transformations that will upgrade skills and education levels can also facilitate increased contribution to economic growth from women and vulnerable groups.16
III. Conclusion
Economic growth in the APEC region is projected to soften in 2015 to 3.1 percent before strengthening to 3.4 percent in 2016, the same level as in 2014. Domestic demand is expected to provide cushion amid the weakness in external demand and overall pace of global economic activity as challenges intensify, brought about largely by the downward trend in commodity prices, the ongoing economic rebalancing in China, and the uncertainty of US monetary policy normalization. As economies rebalance towards a more domestic-driven growth, they will need to consider implementing an appropriate mix of monetary and fiscal policies together with structural reforms to raise productivity and strengthen private consumption, especially towards a more sustainable, resilient and inclusive growth.
16 Ibid.
0
5
10
15
20
25
30
35
40
45
50
Au
stra
lia
Bru
ne
i D
aru
ssa
lam
Ca
na
da
Ch
ile
Ch
ina
Ho
ng
Ko
ng
, C
hin
a
Ind
on
esi
a
Jap
an
Ko
rea
Ma
laysi
a
Me
xico
Ne
w Z
ea
lan
d
Pa
pu
a N
ew
Gu
ine
a
Pe
ru
Th
e P
hil
ipp
ine
s
Ru
ssia
Sin
ga
po
re
Ch
ine
se T
aip
ei
Th
ail
an
d
Un
ite
d S
tate
s
Vie
t N
am
2014 2015 2016
The APEC region has strengthened its commitment to implement structural reforms that will contribute to raising potential growth and ensuring inclusiveness by increasing productivity, enhancing living standards, and reducing inequality. During the Structural Reform Ministerial Meeting held on 7-8 September 2015, APEC economies agreed that a stronger focus on promoting economic growth through structural reforms is needed. Towards this end, APEC has identified its structural reform priorities with the Renewed APEC Agenda for Structural Reforms (RAASR, 2016-2020) following the earlier Leaders’ Agenda to Implement Structural Reform (LAISR, 2004-2010) and the APEC New Strategy for Structural Reform (ANSSR, 2011-2015). Specifically, the RAASR aims to contribute to APEC’s overarching goal of promoting a balanced, inclusive, sustainable, innovative, and secure growth through the implementation of measures that are in line with the following three pillars:
1. more open, well-functioning, transparent and competitive markets; 2. deeper participation in those markets by all segments of society, including MSMEs,
women, youth, older workers and people with disabilities; and 3. sustainable social policies that promote social development objectives (mentioned
above), enhance economic resiliency, and are well-targeted, effective, and non-discriminatory.
To provide support to APEC economies that are undergoing structural transformation, targeted capacity-building initiatives will continue to be conducted. Thus, APEC-wide support will be geared towards assisting economies in the structural reform process, including the development of objectives as well as the design and implementation of reform measures. APEC is thus working towards advancing its structural reform agenda by developing the necessary policy frameworks that will help implement structural reforms that are relevant and appropriate. In particular, these structural reforms should promote inclusive growth by addressing income disparity and providing more opportunities for all sectors to participate in a growing economy; encourage innovation by creating an environment that sets and enforces a level playing field and protects intellectual property rights; and unleash the potential of the services sector to contribute to productivity growth by liberalizing market access and addressing discriminatory practices.