Embed Size (px)
Citation preview
Economic Trends in IsraelEconomic Trends in IsraelMacroeconomic ReviewMacroeconomic Review
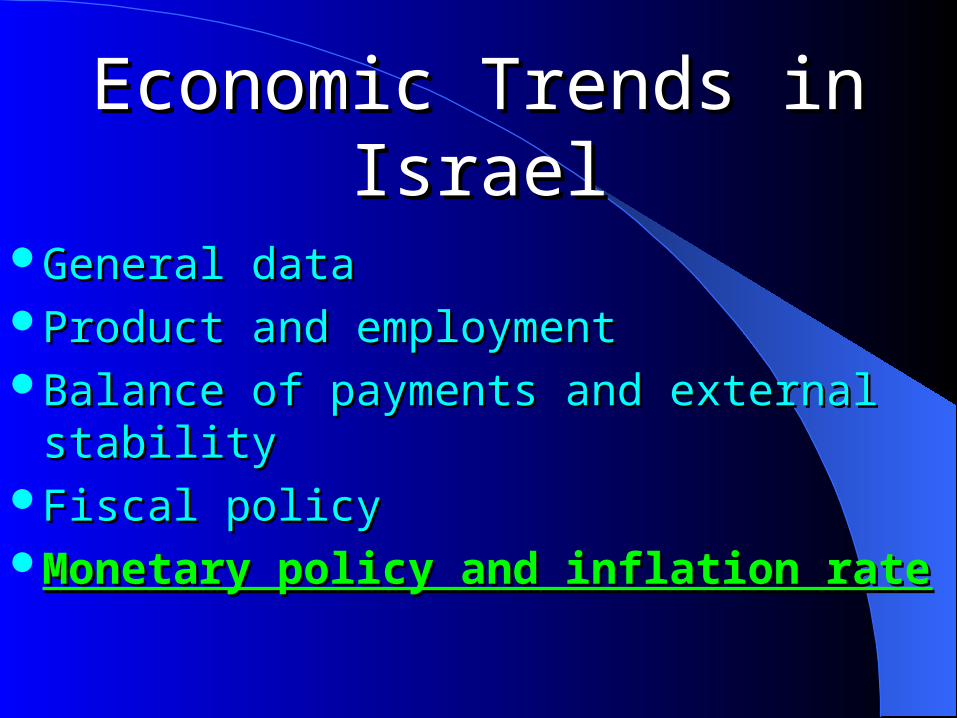
General dataProduct and employmentBalance of payments and external stabilityFiscal policyMonetary policy and inflation rate
Economics and Research Department / Ministry of FinanceJanuary 2007
contacts for comments and questionscontacts for comments and questions : :[email protected]
Economic Trends in IsraelEconomic Trends in Israel
General dataGeneral dataProduct and employmentProduct and employmentBalance of payments and external stabilityBalance of payments and external stabilityFiscal policyFiscal policyMonetary policy and inflation rateMonetary policy and inflation rate

General dataGeneral data
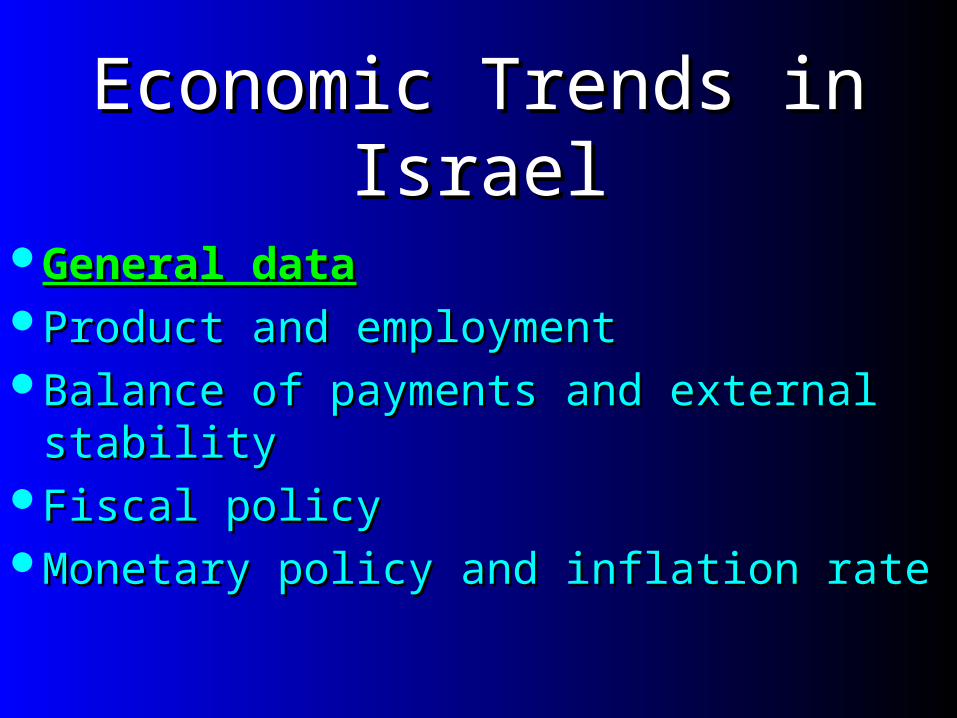
1. Level of technology
2. Level of education

General dataGeneral data
1. Level of technology
2. Level of education
Expenditure on Civilian R&D as percent of the GDP in Israel and in OECD Countries, 2003
Israel ranks first in R&D investment (as percent of GDP).
4.74.5
3.73.5
3.12.9
2.62.6 2.52.2 2.2 2.2
2.0 2.0 1.9 1.9 1.91.7 1.7 1.7 1.6 1.61.6
1.31.1 1.1 1.01.0 0.9 0.8 0.7 0.60.6 0.6
0.4
0
1
2
3
4
5
Isra
el (2
005)
Isra
el (2
003)
Sweden
Finla
nd
Japan
Icela
nd
Korea
Switzer
land (2
000)
Germ
any
United
Sta
tes
Denm
ark (2
002)
Austri
a
Total
OECD
EU15
Belgiu
m
France
EU25
Luxem
bourg
(200
0)
United
Kin
gdom
Nether
land
s (20
02)
Austra
lia (2
002)
Canad
a
Norway
Czech
Rep
ublic
Irela
nd (200
2)Ita
ly
New Z
eala
nd
Hungary
Spain
Portu
gal (2
002)
Turkey
(200
2)
Greec
e (20
01)
Slovak
Rep
ublic
Poland
Mex
ico (2
001)
* Average of 30 OECD countries.
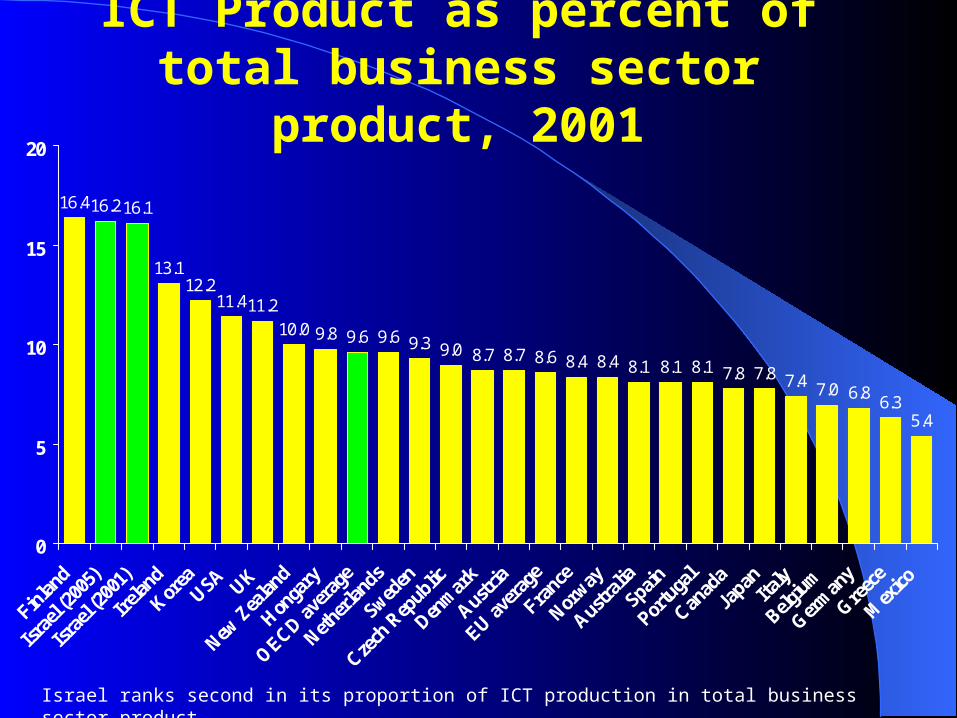
ICT Product as percent of total business sector product, 2001
16.416.2 16.1
13.112.2
11.411.210.0 9.8 9.6 9.6 9.3 9.0 8.7 8.7 8.6 8.4 8.4 8.1 8.1 8.1 7.8 7.8 7.4 7.0 6.8
6.35.4
0
5
10
15
20
Finlan
d
Israe
l (20
05)
Israe
l (20
01)
Irela
nd
Korea
USA UK
New Z
ealan
d
Honga
ry
OECD aver
age
Nether
lands
Sweden
Czech
Rep
ublic
Denm
ark
Austria
EU aver
age
France
Norway
Australi
a
Spain
Portu
gal
Canad
a
Japan
Italy
Belgiu
m
Germ
any
Greec
e
Mex
ico
Israel ranks second in its proportion of ICT production in total business sector product.

General dataGeneral data
1. Level of technology
2. Level of education
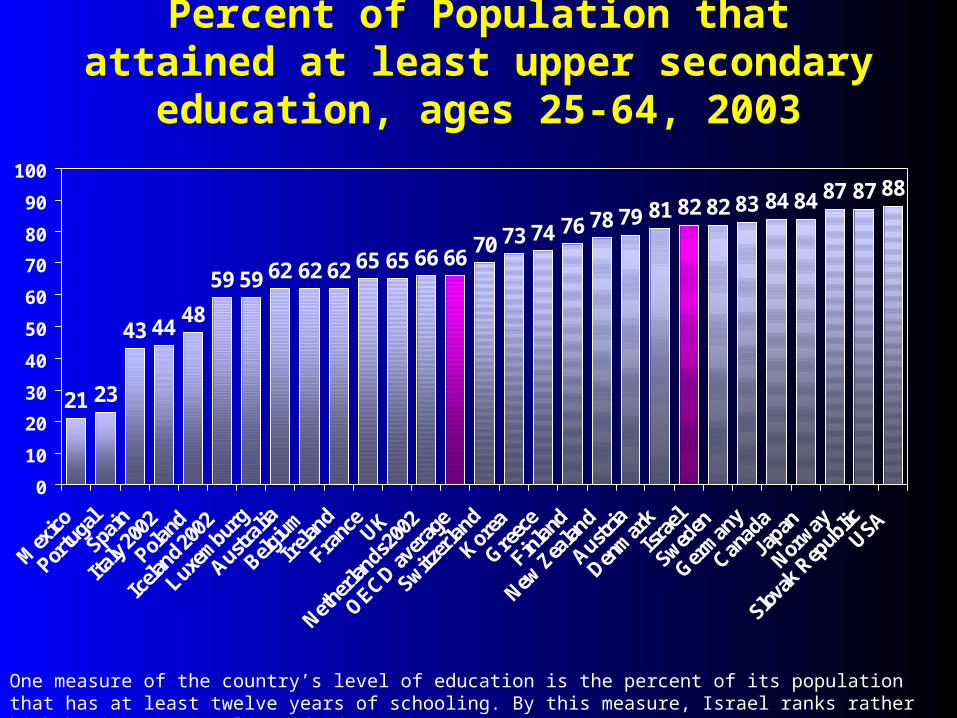
Percent of Population that attained at least upper secondary education, ages 25-64, 2003
One measure of the country’s level of education is the percent of its population that has at least twelve years of schooling. By this measure, Israel ranks rather high by international standards.
21 23
43 4448
59 59 62 62 62 65 65 66 6670 73 74 76 78 79 81 82 82 83 84 84 87 87 88
0
10
20
30
40
50
60
70
80
90
100
Mex
ico
Portu
gal
Spain
Italy
2002
Poland
Icela
nd 2002
Luxem
burg
Austral
ia
Belgiu
m
Irela
nd
Franc
eUK
Nethe
rlands 2
002
OECD aver
age
Switzer
land
Korea
Greec
e
Finla
nd
New Z
ealan
d
Austria
Denm
arkIsr
ael
Sweden
Germ
any
Canad
a
Japan
Norway
Slovak
Rep
ublicUSA
Economic Trends in IsraelEconomic Trends in Israel
General dataGeneral dataProduct and employmentProduct and employmentBalance of payments and external stabilityBalance of payments and external stabilityFiscal policyFiscal policyMonetary policy and inflation rateMonetary policy and inflation rate

Product and EmploymentProduct and Employment
1. GDP Growth Rate2. GDP per-capita – international comparison3. Factors affecting growth4. Characteristics of growth5. Unemployment and the labor market
Product and EmploymentProduct and Employment
1. GDP Growth Rate2. GDP per-capita – international comparison3. Factors affecting growth4. Characteristics of growth5. Unemployment and the labor market
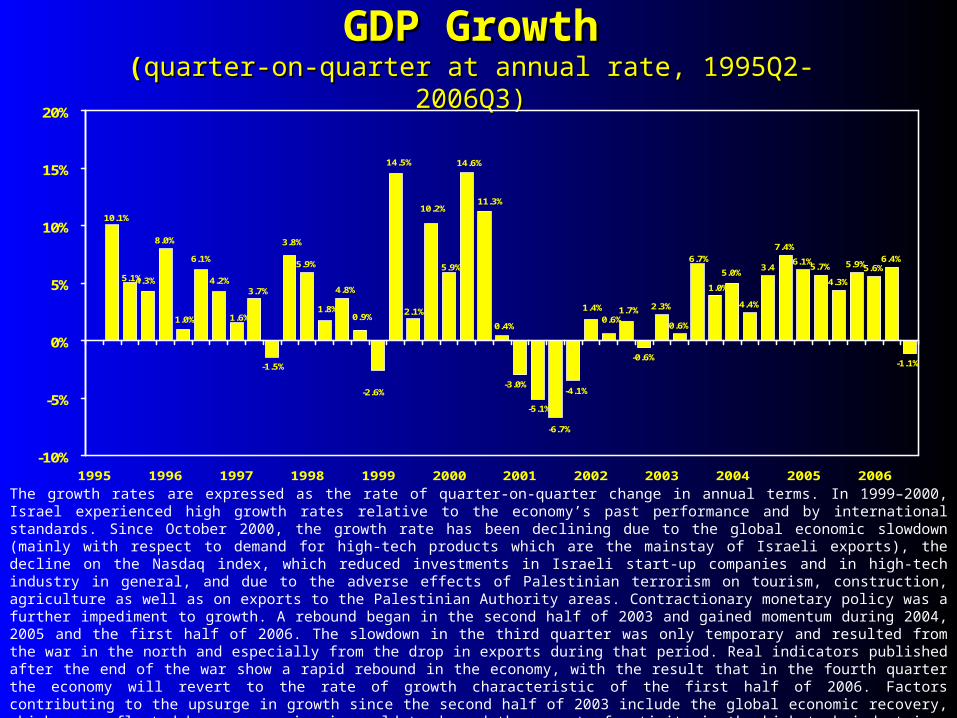
GDP GrowthGDP Growth((quarter-on-quarter at annual rate, 1995Q2-2006Q3quarter-on-quarter at annual rate, 1995Q2-2006Q3))
The growth rates are expressed as the rate of quarter-on-quarter change in annual terms. In 1999–2000, Israel experienced high growth rates relative to the economy’s past performance and by international standards. Since October 2000, the growth rate has been declining due to the global economic slowdown (mainly with respect to demand for high-tech products which are the mainstay of Israeli exports), the decline on the Nasdaq index, which reduced investments in Israeli start-up companies and in high-tech industry in general, and due to the adverse effects of Palestinian terrorism on tourism, construction, agriculture as well as on exports to the Palestinian Authority areas. Contractionary monetary policy was a further impediment to growth. A rebound began in the second half of 2003 and gained momentum during 2004, 2005 and the first half of 2006. The slowdown in the third quarter was only temporary and resulted from the war in the north and especially from the drop in exports during that period. Real indicators published after the end of the war show a rapid rebound in the economy, with the result that in the fourth quarter the economy will revert to the rate of growth characteristic of the first half of 2006. Factors contributing to the upsurge in growth since the second half of 2003 include the global economic recovery, which was reflected by an expansion in world trade and the amount of activity in the high-tech industries, the structural reforms that were implemented in the Israeli economy, reduced uncertainty and the increased confidence resulting from the adoption of a decisive fiscal policy, a relatively calm security situation (excepting the period of the war in the north) and a less restrictive monetary policy.
8.0%
5.9%
-0.6%
2.3%
0.6%
7.4%
6.1%5.7%
4.3%
5.9%5.6%6.4%
-1.1%
3.4
4.4%
5.0%
-3.0%
1.7%
1.0%
0.6%
6.7%5.9%
10.2%
2.1%
-2.6%
1.0%
3.8%
-1.5%
10.1%
6.1%
5.1%
1.8%
4.8%
11.3%
0.4%
4.3%
0.9%
14.5%
-4.1%
-6.7%
4.2%
14.6%
1.6%1.4%
-5.1%
3.7%
-10%
-5%
0%
5%
10%
15%
20%
1995 1996 1997 1998 1999 2000 2001 2002 2003 2004 2005 2006
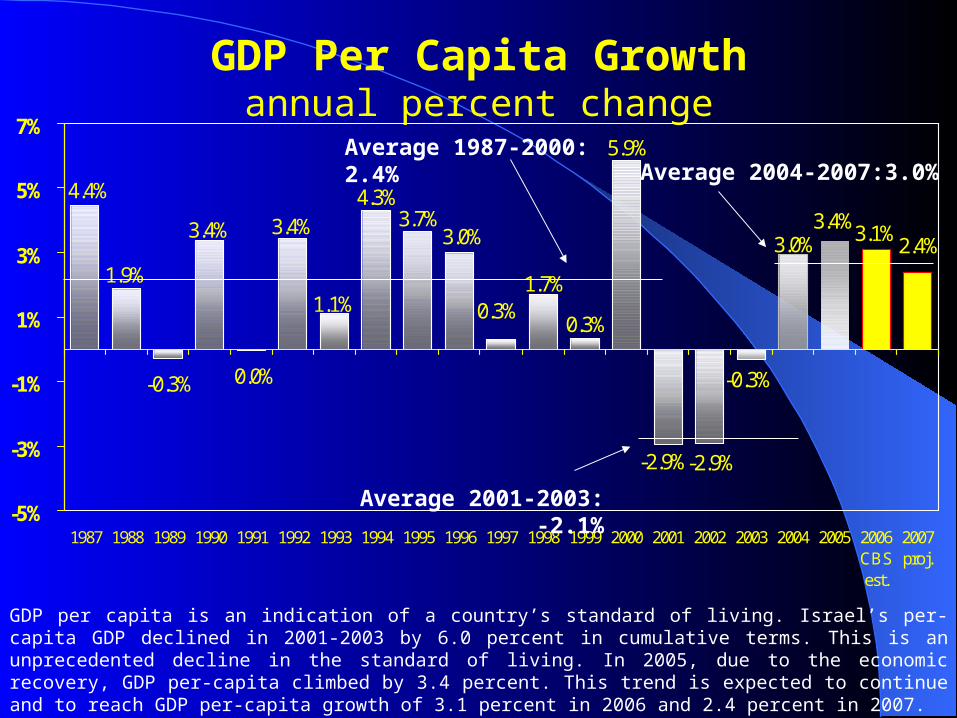
GDP Per Capita Growthannual percent change
GDP per capita is an indication of a country’s standard of living. Israel’s per-capita GDP declined in 2001-2003 by 6.0 percent in cumulative terms. This is an unprecedented decline in the standard of living. In 2005, due to the economic recovery, GDP per-capita climbed by 3.4 percent. This trend is expected to continue and to reach GDP per-capita growth of 3.1 percent in 2006 and 2.4 percent in 2007.
2.4%3.1%
3.4%3.0%
-0.3%
-2.9%-2.9%
4.4%
1.9%
-0.3%
3.4%
0.0%
3.4%
1.1%
4.3%3.7%
3.0%
0.3%1.7%
0.3%
5.9%
-5%
-3%
-1%
1%
3%
5%
7%
1987 1988 1989 1990 1991 1992 1993 1994 1995 1996 1997 1998 1999 2000 2001 2002 2003 2004 2005 2006CBSest.
2007proj.
Average 1987-2000: 2.4%
Average 2001-2003: -2.1%
Average 2004-2007:3.0%
Product and EmploymentProduct and Employment
1. Domestic growth rate2. GDP per-capita – international comparison3. Factors affecting growth4. Characteristics of growth5. Unemployment and the labor market
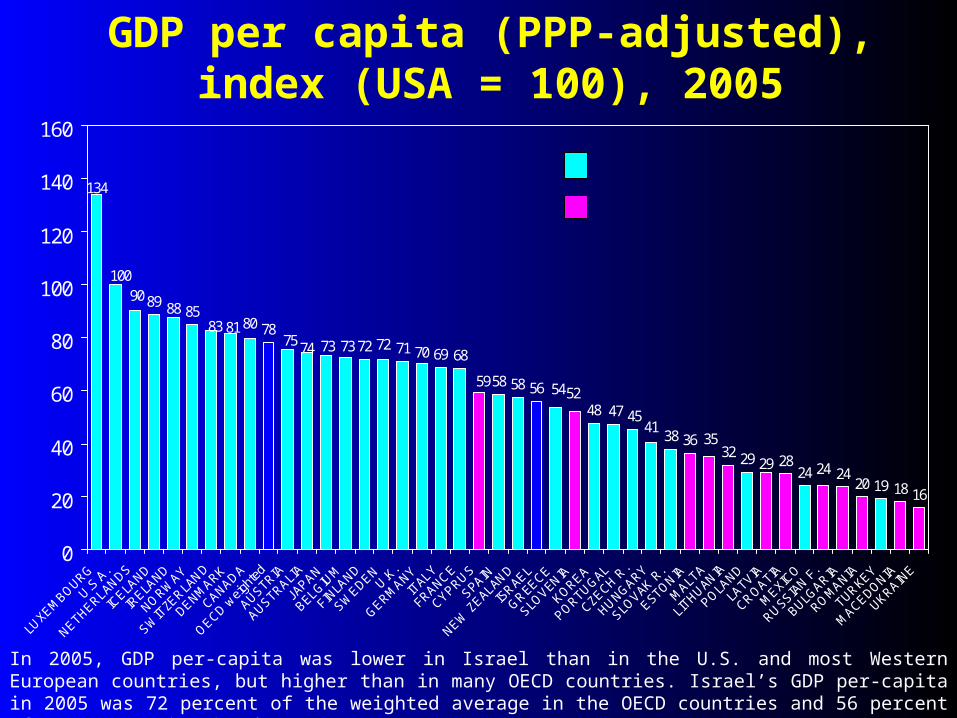
GDP per capita (PPP-adjusted), index (USA = 100), 2005
In 2005, GDP per-capita was lower in Israel than in the U.S. and most Western European countries, but higher than in many OECD countries. Israel’s GDP per-capita in 2005 was 72 percent of the weighted average in the OECD countries and 56 percent of GDP per-capita in the U.S.
8985
7872 71 69 68
58 58 56
48
38 3632 29 28
24 2420 19 18 16
134
10090
8881
75 73 70727383 80
595254
47
35
29
4541
24
74
0
20
40
60
80
100
120
140
160
OECD other countries

Product and EmploymentProduct and Employment
1. Domestic growth rate2. GDP per-capita – international comparison3. Factors affecting growth4. Characteristics of growth5. Unemployment and the labor market
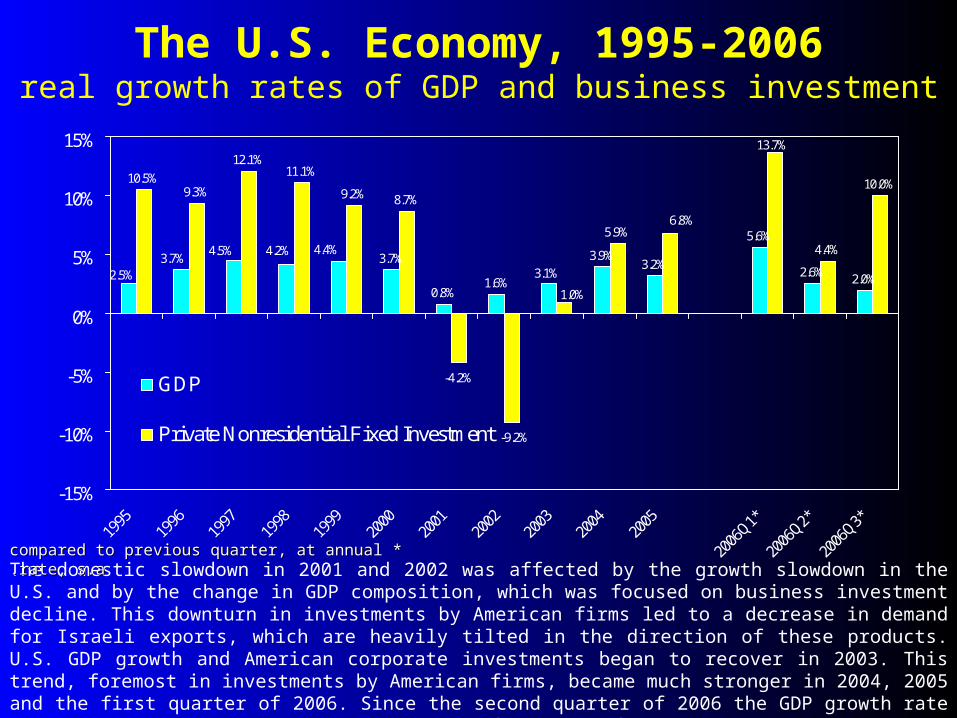
The U.S. Economy, 1995-2006real growth rates of GDP and business investment
The domestic slowdown in 2001 and 2002 was affected by the growth slowdown in the U.S. and by the change in GDP composition, which was focused on business investment decline. This downturn in investments by American firms led to a decrease in demand for Israeli exports, which are heavily tilted in the direction of these products. U.S. GDP growth and American corporate investments began to recover in 2003. This trend, foremost in investments by American firms, became much stronger in 2004, 2005 and the first quarter of 2006. Since the second quarter of 2006 the GDP growth rate in the USA has slowed, although the level of American firms’ investment in the third quarter was relatively high.
3.7%
0.8%1.6%
3.9%3.2%
5.6%
2.6% 2.0%
9.3%
12.1%11.1%
9.2% 8.7%
-4.2%
5.9%4.4%
10.0%
3.1%
4.4%4.2%4.5%3.7%
2.5%
13.7%
-9.2%
1.0%
10.5%
6.8%
-15%
-10%
-5%
0%
5%
10%
15%
GDP
Private Nonresidential Fixed Investment
* *compared to previous quarter, at annual rate, s.acompared to previous quarter, at annual rate, s.a..
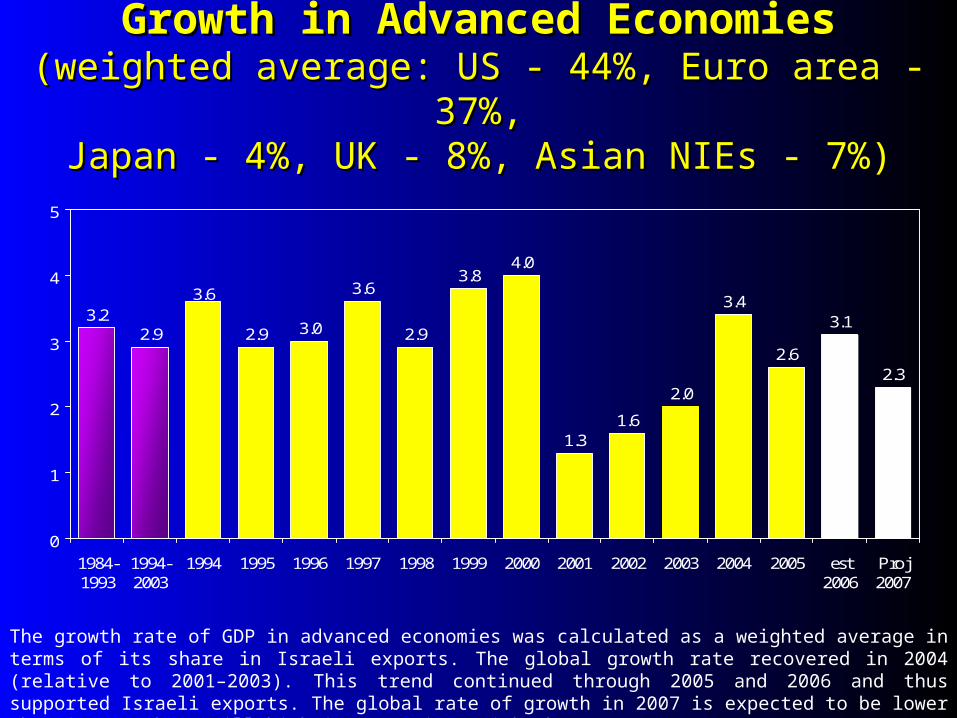
Growth in Advanced EconomiesGrowth in Advanced Economies(weighted average: US - 44%, Euro area - 37%,(weighted average: US - 44%, Euro area - 37%,
Japan - 4%, UK - 8%, Asian NIEs - 7%)Japan - 4%, UK - 8%, Asian NIEs - 7%)
The growth rate of GDP in advanced economies was calculated as a weighted average in terms of its share in Israeli exports. The global growth rate recovered in 2004 (relative to 2001–2003). This trend continued through 2005 and 2006 and thus supported Israeli exports. The global rate of growth in 2007 is expected to be lower than in 2006 but still high in comparison with the years 2001-2003.
3.22.9 2.9 3.0
3.6
2.9
3.84.0
1.31.6
2.0
3.4
2.6
3.1
2.3
3.6
0
1
2
3
4
5
1984-1993
1994-2003
1994 1995 1996 1997 1998 1999 2000 2001 2002 2003 2004 2005 est2006
Proj2007
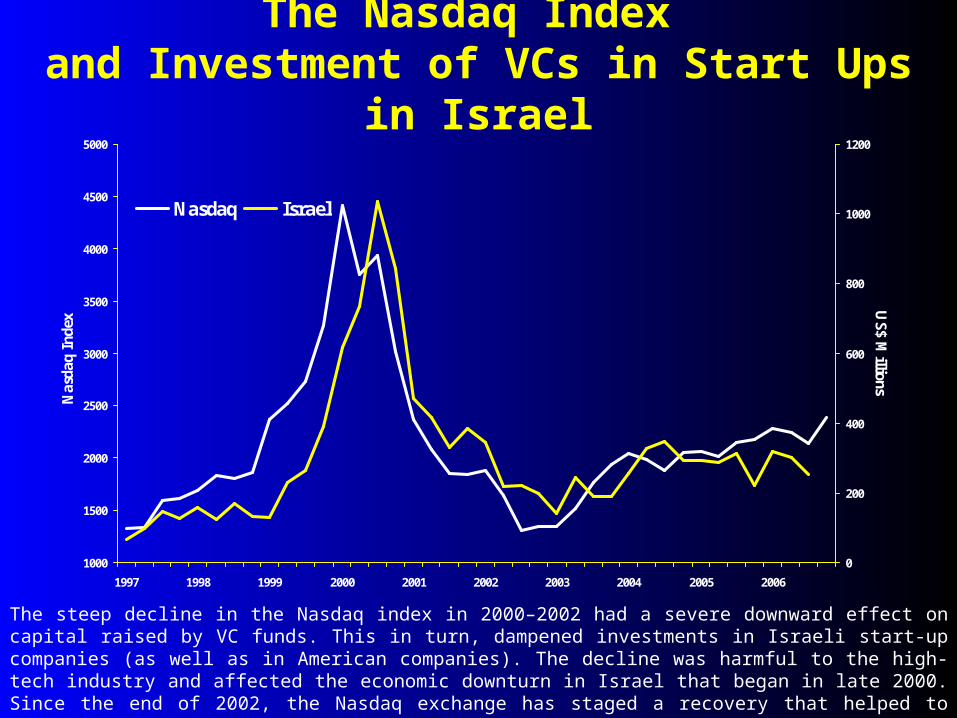
The Nasdaq Index and Investment of VCs in Start Ups in Israel
The steep decline in the Nasdaq index in 2000–2002 had a severe downward effect on capital raised by VC funds. This in turn, dampened investments in Israeli start-up companies (as well as in American companies). The decline was harmful to the high-tech industry and affected the economic downturn in Israel that began in late 2000. Since the end of 2002, the Nasdaq exchange has staged a recovery that helped to increase investments in Israeli start-up companies during 2003-2005, although the level is still lower than the peak of 2000.
1000
1500
2000
2500
3000
3500
4000
4500
5000
1997 1998 1999 2000 2001 2002 2003 2004 2005 2006
Nas
daq
Inde
x
0
200
400
600
800
1000
1200
US$ M
illions
Nasdaq Israel
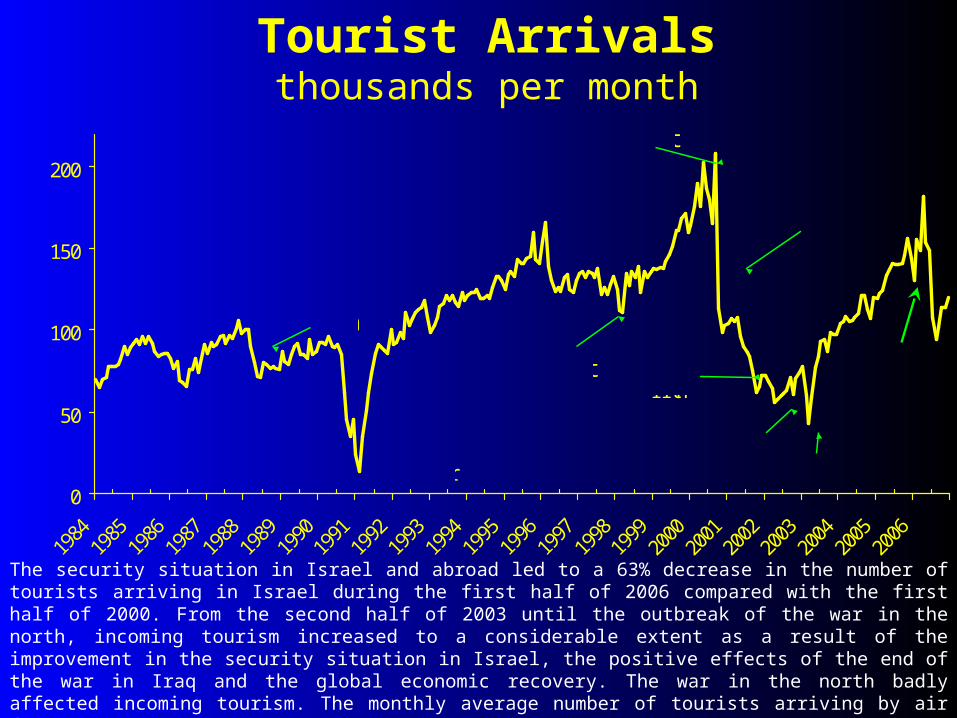
Tourist Arrivalsthousands per month
The security situation in Israel and abroad led to a 63% decrease in the number of tourists arriving in Israel during the first half of 2006 compared with the first half of 2000. From the second half of 2003 until the outbreak of the war in the north, incoming tourism increased to a considerable extent as a result of the improvement in the security situation in Israel, the positive effects of the end of the war in Iraq and the global economic recovery. The war in the north badly affected incoming tourism. The monthly average number of tourists arriving by air from the time the war started (during July-December 2006) was 33% less than the monthly average for the second quarter of 2006.
0
50
100
150
200
1984
1985
1986
1987
1988
1989
1990
1991
1992
1993
1994
1995
1996
1997
1998
1999
2000
2001
2002
2003
2004
2005
2006
Attack on the Achille Lauro
Intifada
Gulf War
Terrorist Attacks
War in Iraq
Pope visit
Sep 11th
Terrorist attack in Netanya, March 2002
Start OfPalestinianTerrorist Attacks, Sep 2000
War in Lebanon
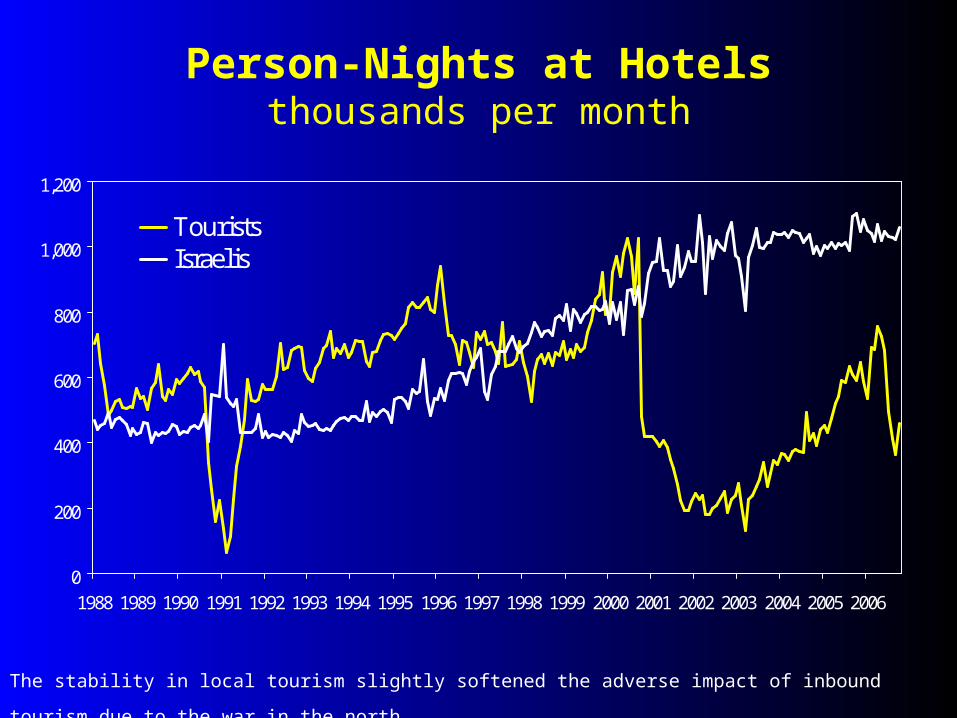
Person-Nights at Hotelsthousands per month
The stability in local tourism slightly softened the adverse impact of inbound tourism due to the war in the north.
0
200
400
600
800
1,000
1,200
1988 1989 1990 1991 1992 1993 1994 1995 1996 1997 1998 1999 2000 2001 2002 2003 2004 2005 2006
TouristsIsraelis
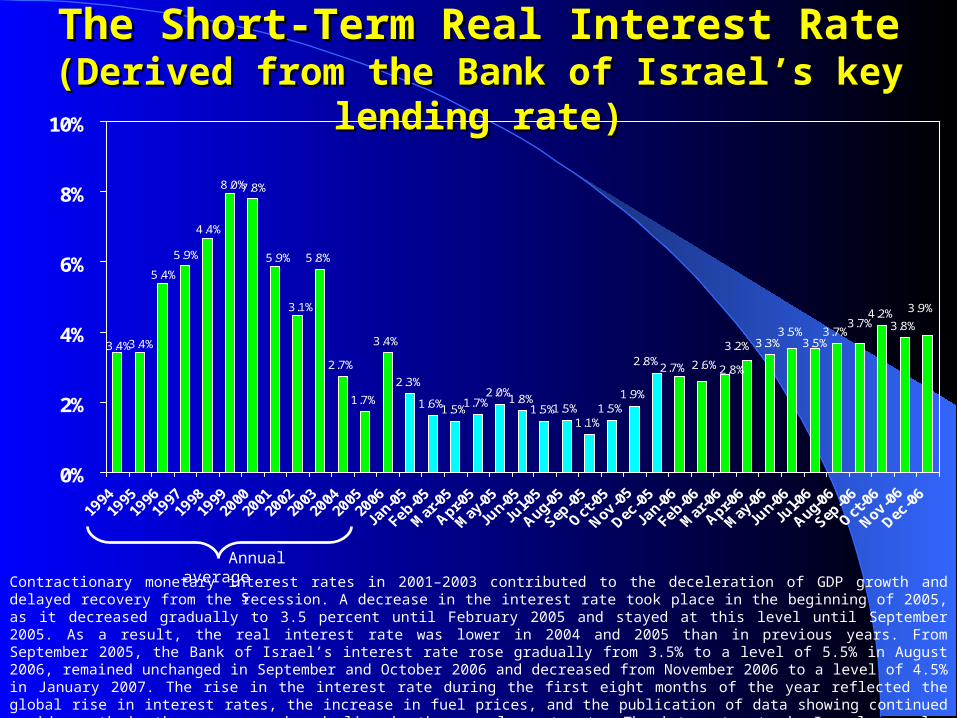
The Short-Term Real Interest RateThe Short-Term Real Interest Rate(Derived from the Bank of Israel’s key lending rate)(Derived from the Bank of Israel’s key lending rate)
5.8%
2.7%
1.7%
3.4%
2.3%
1.6%1.5%1.7%
2.0%1.8%
1.5%1.5%1.1%
1.5%1.9%
3.3%3.7%
4.2%3.8%
3.9%
2.7% 2.6%2.8%2.8%
3.2%
3.7%
3.5%3.5%
5.9%
7.8%8.0%
3.1%
4.4%
5.9%
5.4%
3.4%3.4%
0%
2%
4%
6%
8%
10%
Annual averages
Contractionary monetary interest rates in 2001–2003 contributed to the deceleration of GDP growth and delayed recovery from the recession. A decrease in the interest rate took place in the beginning of 2005, as it decreased gradually to 3.5 percent until February 2005 and stayed at this level until September 2005. As a result, the real interest rate was lower in 2004 and 2005 than in previous years. From September 2005, the Bank of Israel’s interest rate rose gradually from 3.5% to a level of 5.5% in August 2006, remained unchanged in September and October 2006 and decreased from November 2006 to a level of 4.5% in January 2007. The rise in the interest rate during the first eight months of the year reflected the global rise in interest rates, the increase in fuel prices, and the publication of data showing continued rapid growth in the economy and a decline in the unemployment rate. The interest rate in Israel was also raised because o BOI concern over the adverse impact on stability of the war in the north. The reduction in the interest rate during recent months reflects mainly the strength of the NIS and the decrease in fuel prices.
3
4
5
6
long term (11 years, excluding first year)
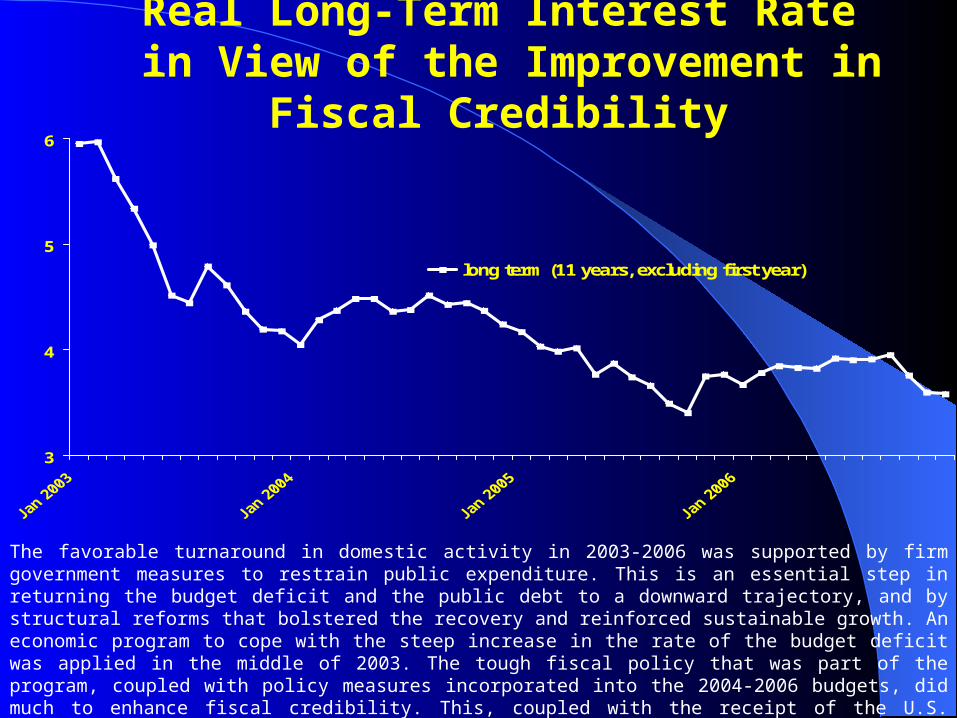
Real Long-Term Interest Rate in View of the Improvement in Fiscal Credibility
The favorable turnaround in domestic activity in 2003-2006 was supported by firm government measures to restrain public expenditure. This is an essential step in returning the budget deficit and the public debt to a downward trajectory, and by structural reforms that bolstered the recovery and reinforced sustainable growth. An economic program to cope with the steep increase in the rate of the budget deficit was applied in the middle of 2003. The tough fiscal policy that was part of the program, coupled with policy measures incorporated into the 2004-2006 budgets, did much to enhance fiscal credibility. This, coupled with the receipt of the U.S. Government guarantees, made the financial markets more confident and brought down the real interest rate on long-term indexed bonds.
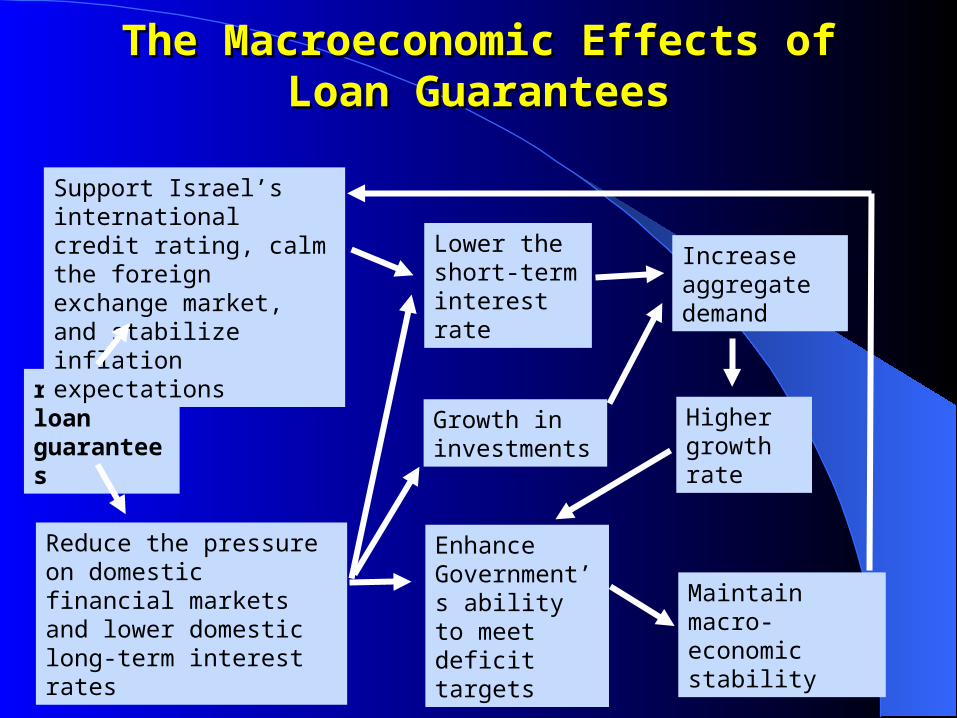
receiving loan guarantees
Support Israel’s international credit rating, calm the foreign exchange market, and stabilize inflation expectations
Reduce the pressure on domestic financial markets and lower domestic long-term interest rates
Lower the short-term interest rate
Increase aggregate demand
Higher growth rate
Growth in investments
Enhance Government’s ability to meet deficit targets
Maintain macro-economic stability
The Macroeconomic Effects ofThe Macroeconomic Effects ofLoan GuaranteesLoan Guarantees

Product and EmploymentProduct and Employment
1. Domestic growth rate2. GDP per-capita – international comparison3. Factors affecting growth4. Characteristics of growth5. Unemployment and the labor market
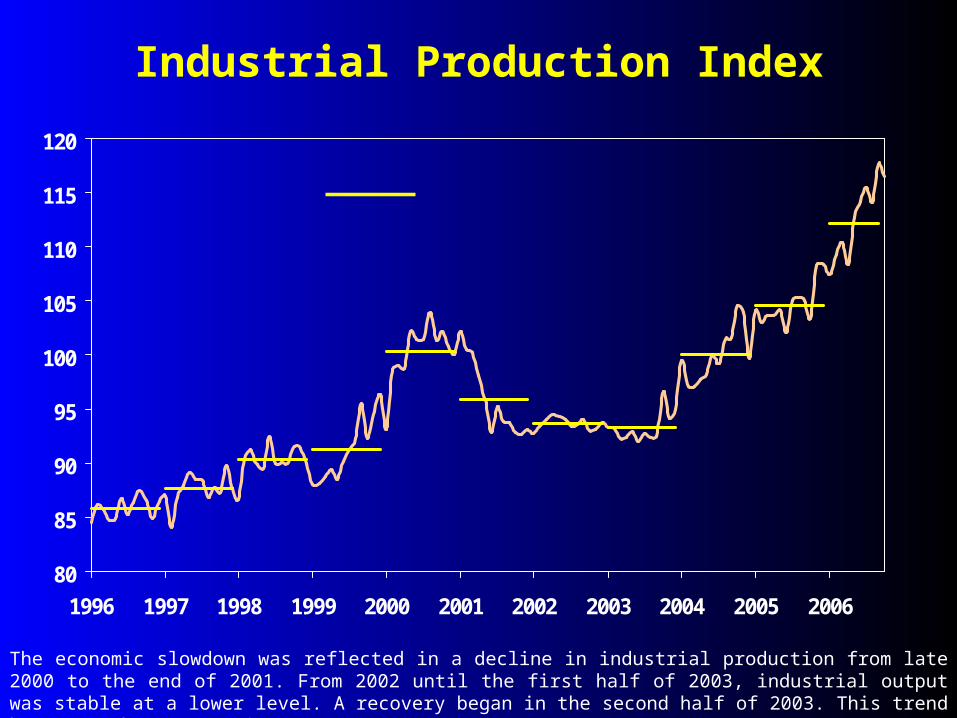
Industrial Production Index
The economic slowdown was reflected in a decline in industrial production from late 2000 to the end of 2001. From 2002 until the first half of 2003, industrial output was stable at a lower level. A recovery began in the second half of 2003. This trend became much stronger in 2006.
80
85
90
95
100
105
110
115
120
1996 1997 1998 1999 2000 2001 2002 2003 2004 2005 2006
annual averages
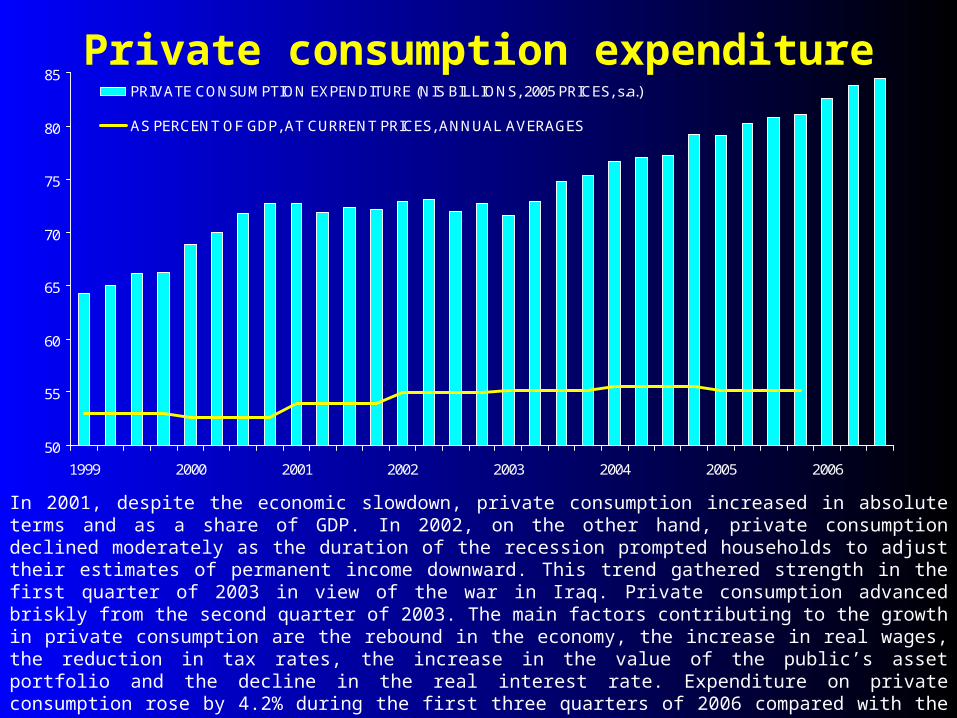
Private consumption expenditure
In 2001, despite the economic slowdown, private consumption increased in absolute terms and as a share of GDP. In 2002, on the other hand, private consumption declined moderately as the duration of the recession prompted households to adjust their estimates of permanent income downward. This trend gathered strength in the first quarter of 2003 in view of the war in Iraq. Private consumption advanced briskly from the second quarter of 2003. The main factors contributing to the growth in private consumption are the rebound in the economy, the increase in real wages, the reduction in tax rates, the increase in the value of the public’s asset portfolio and the decline in the real interest rate. Expenditure on private consumption rose by 4.2% during the first three quarters of 2006 compared with the same period of 2005.
50
55
60
65
70
75
80
85
1999 2000 2001 2002 2003 2004 2005 2006
PRIVATE CONSUMPTION EXPENDITURE (NIS BILLIONS, 2005 PRICES, s.a.)
AS PERCENT OF GDP, AT CURRENT PRICES, ANNUAL AVERAGES
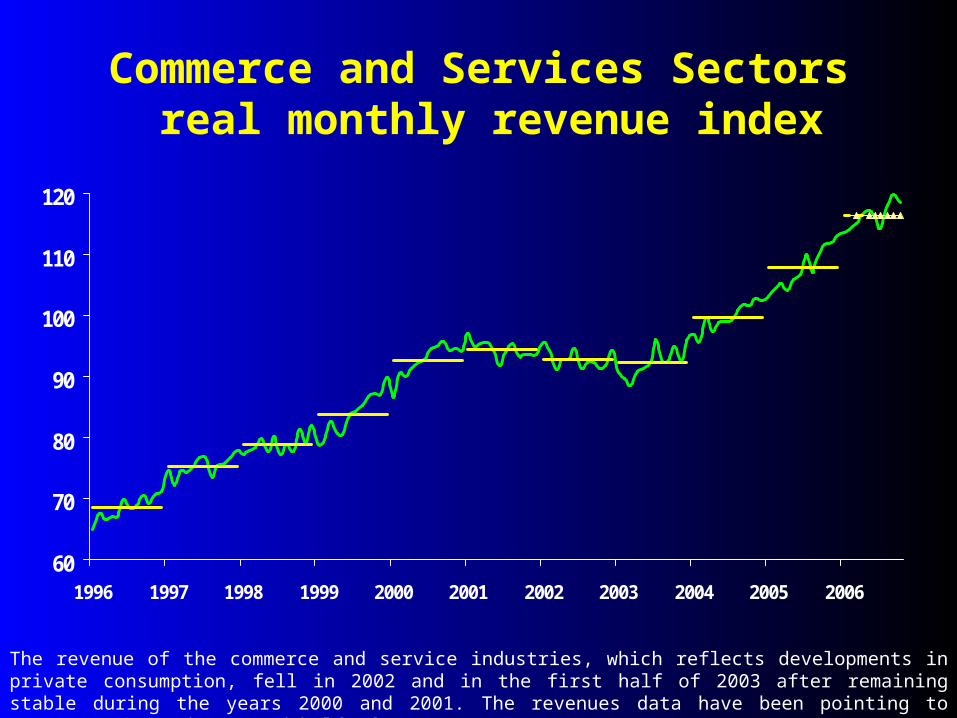
The revenue of the commerce and service industries, which reflects developments in private consumption, fell in 2002 and in the first half of 2003 after remaining stable during the years 2000 and 2001. The revenues data have been pointing to recovery since the second half of 2003.
Commerce and Services Sectors real monthly revenue index
60
70
80
90
100
110
120
1996 1997 1998 1999 2000 2001 2002 2003 2004 2005 2006
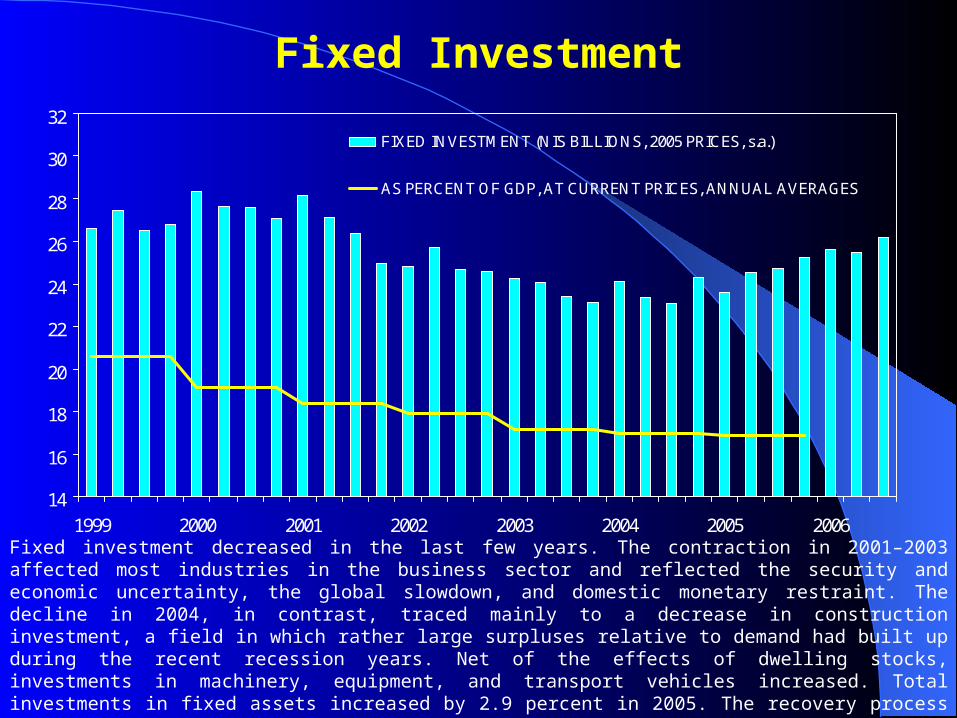
Fixed Investment
Fixed investment decreased in the last few years. The contraction in 2001–2003 affected most industries in the business sector and reflected the security and economic uncertainty, the global slowdown, and domestic monetary restraint. The decline in 2004, in contrast, traced mainly to a decrease in construction investment, a field in which rather large surpluses relative to demand had built up during the recent recession years. Net of the effects of dwelling stocks, investments in machinery, equipment, and transport vehicles increased. Total investments in fixed assets increased by 2.9 percent in 2005. The recovery process continued and even gained strength in the first three quarters of 2006. During that period, investment in fixed assets expanded by 5.1% compared with the same period of 2005.
14
16
18
20
22
24
26
28
30
32
1999 2000 2001 2002 2003 2004 2005 2006
FIXED INVESTMENT (NIS BILLIONS, 2005 PRICES, s.a.)
AS PERCENT OF GDP, AT CURRENT PRICES, ANNUAL AVERAGES
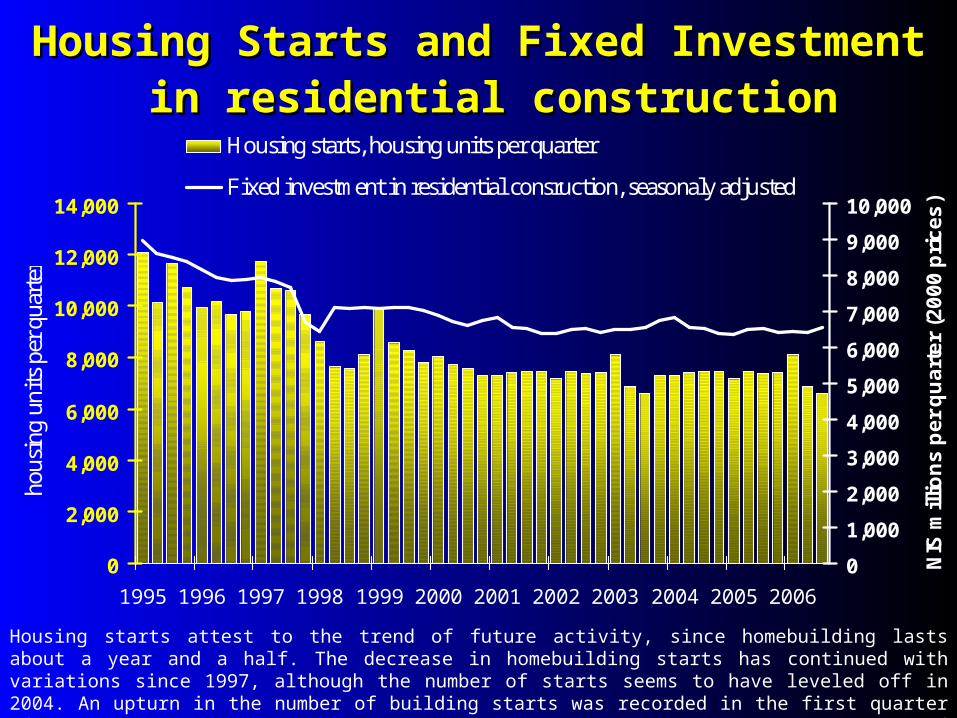
Housing Starts and Fixed InvestmentHousing Starts and Fixed Investmentin residential constructionin residential construction
Housing starts attest to the trend of future activity, since homebuilding lasts about a year and a half. The decrease in homebuilding starts has continued with variations since 1997, although the number of starts seems to have leveled off in 2004. An upturn in the number of building starts was recorded in the first quarter of 2006, although this trend was not maintained in the second and third quarters of the year.
0
2,000
4,000
6,000
8,000
10,000
12,000
14,000
1995 1996 1997 1998 1999 2000 2001 2002 2003 2004 2005 2006
hous
ing
unit
s pe
r qu
arte
r
0
1,000
2,000
3,000
4,000
5,000
6,000
7,000
8,000
9,000
10,000
NIS
mill
ion
s p
er
qu
art
er
(20
00
pri
ce
s)
Housing starts, housing units per quarter
Fixed investment in residential consruction, seasonaly adjusted
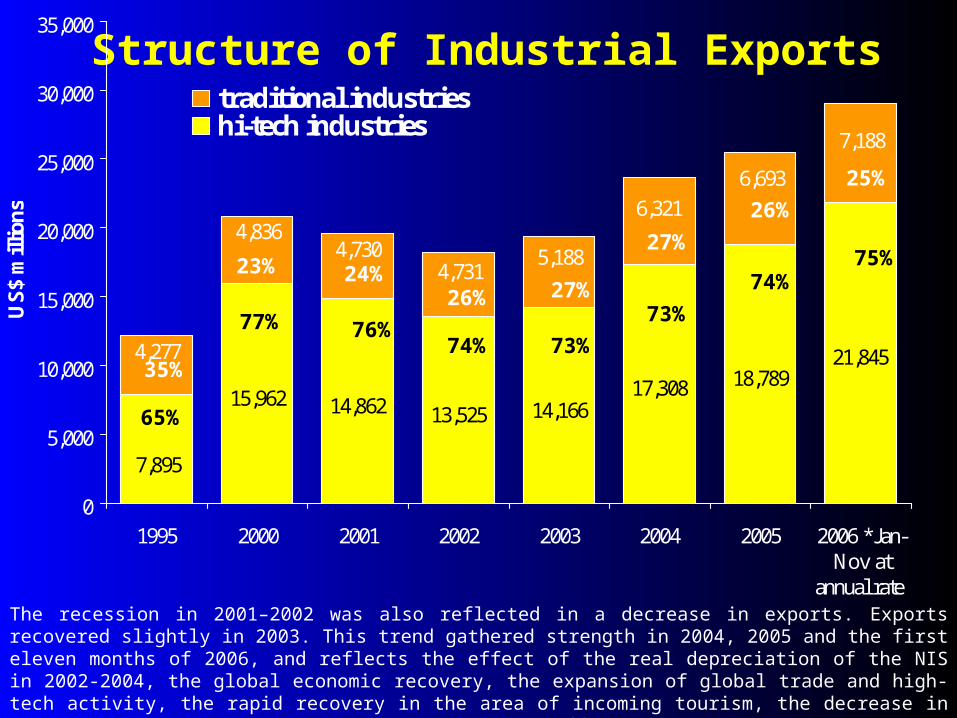
Structure of Industrial Exports
The recession in 2001–2002 was also reflected in a decrease in exports. Exports recovered slightly in 2003. This trend gathered strength in 2004, 2005 and the first eleven months of 2006, and reflects the effect of the real depreciation of the NIS in 2002-2004, the global economic recovery, the expansion of global trade and high-tech activity, the rapid recovery in the area of incoming tourism, the decrease in real domestic wages in 2002-2003, and corporate efficiency measures. Both high-tech and traditional industries took part in the upturn in exports.
15,962 14,862 13,525 14,16617,308 18,789
21,845
7,895
5,1884,731
4,7304,836
4,277
6,321
6,693
7,188
0
5,000
10,000
15,000
20,000
25,000
30,000
35,000
1995 2000 2001 2002 2003 2004 2005 2006 *Jan-Nov at
annual rate
US
$ m
illio
ns
traditional industrieshi-tech industries
35%
65%
23% 24%
76%77%27%
74%
26%27%
75%74%
26%
73%
25%
73%
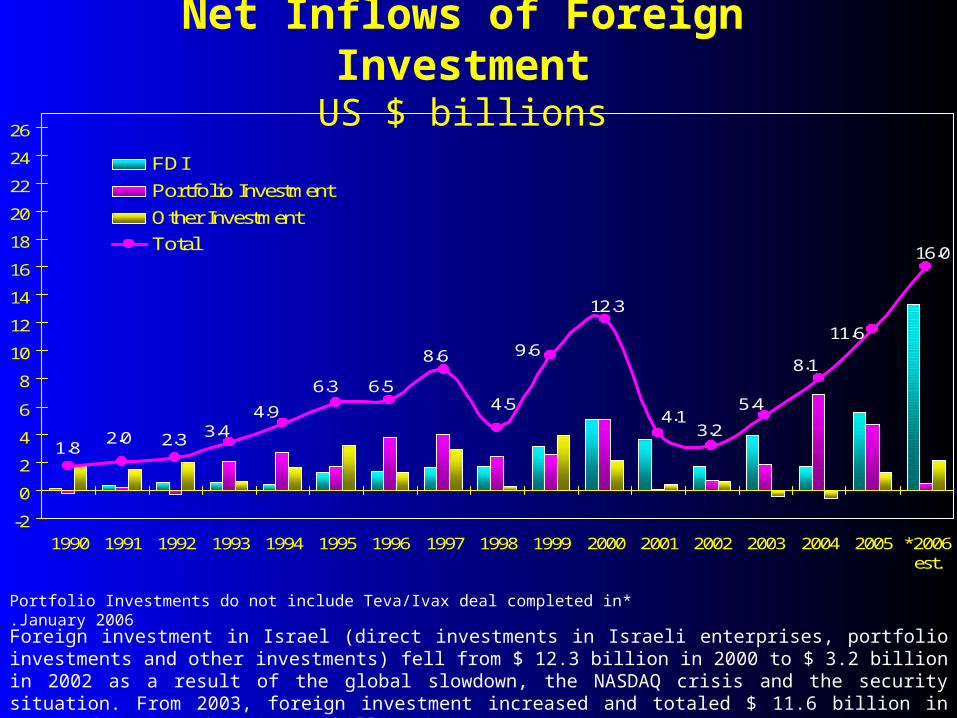
Net Inflows of Foreign InvestmentUS $ billions
Foreign investment in Israel (direct investments in Israeli enterprises, portfolio investments and other investments) fell from $ 12.3 billion in 2000 to $ 3.2 billion in 2002 as a result of the global slowdown, the NASDAQ crisis and the security situation. From 2003, foreign investment increased and totaled $ 11.6 billion in 2005 and estimated at $ 16.0 billion in 2006 .
16.0
12.3
5.4
3.21.8
2.0 2.3
6.3
4.9
6.5
8.6
4.5
9.6
4.1
8.1
3.4
11.6
-2
0
2
4
6
8
10
12
14
16
18
20
22
24
26
1990 1991 1992 1993 1994 1995 1996 1997 1998 1999 2000 2001 2002 2003 2004 2005 *2006est.
FDI
Portfolio Investment
Other Investment
Total
*Portfolio Investments do not include Teva/Ivax deal completed in January 2006.

Product and EmploymentProduct and Employment
1. Domestic growth rate2. GDP per-capita – international comparison3. Factors affecting growth4. Characteristics of growth5. Unemployment and the labor market
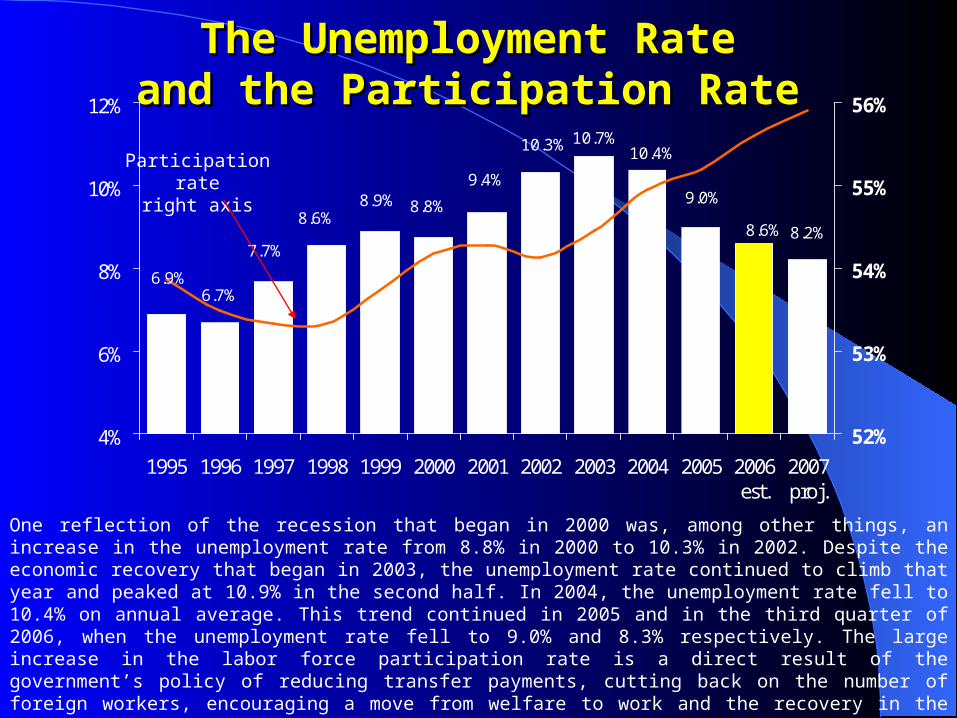
The Unemployment RateThe Unemployment Rateand the Participation Rateand the Participation Rate
One reflection of the recession that began in 2000 was, among other things, an increase in the unemployment rate from 8.8% in 2000 to 10.3% in 2002. Despite the economic recovery that began in 2003, the unemployment rate continued to climb that year and peaked at 10.9% in the second half. In 2004, the unemployment rate fell to 10.4% on annual average. This trend continued in 2005 and in the third quarter of 2006, when the unemployment rate fell to 9.0% and 8.3% respectively. The large increase in the labor force participation rate is a direct result of the government’s policy of reducing transfer payments, cutting back on the number of foreign workers, encouraging a move from welfare to work and the recovery in the economy. The growth in the participation rate (which is low in Israel by international comparison), although it delays a more rapid decline in the unemployment rate in the short run, improves the economic situation.
6.9%6.7%
7.7%
8.6%8.9% 8.8%
9.4%
10.3% 10.4%10.7%
9.0%
8.6% 8.2%
4%
6%
8%
10%
12%
1995 1996 1997 1998 1999 2000 2001 2002 2003 2004 2005 2006est.
2007proj.
52%
53%
54%
55%
56%
Participation rateright axis
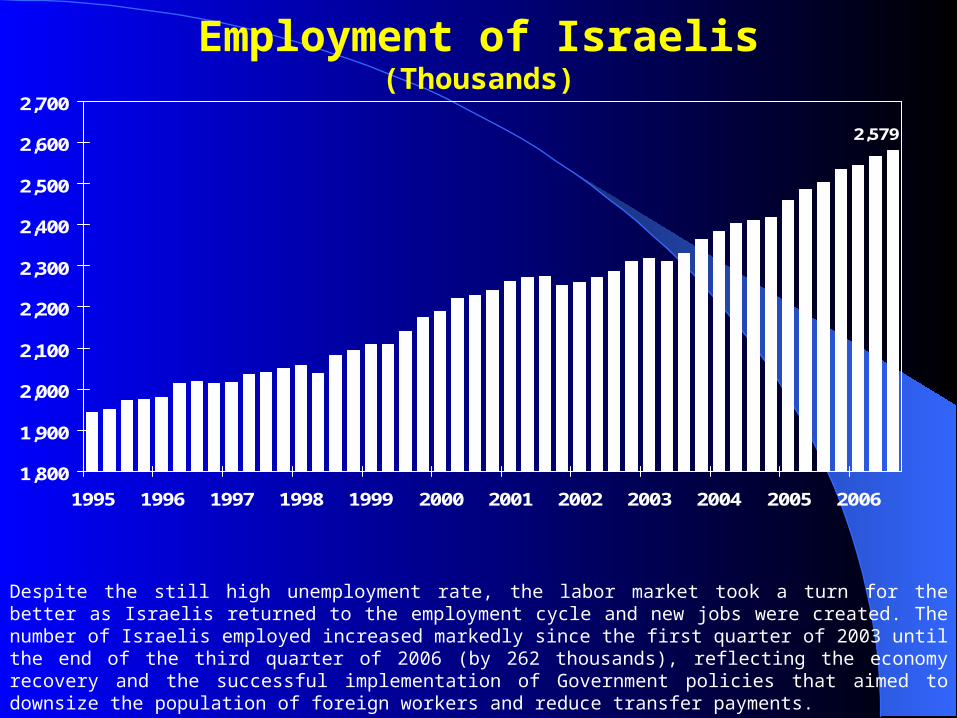
Employment of Israelis(Thousands)
Despite the still high unemployment rate, the labor market took a turn for the better as Israelis returned to the employment cycle and new jobs were created. The number of Israelis employed increased markedly since the first quarter of 2003 until the end of the third quarter of 2006 (by 262 thousands), reflecting the economy recovery and the successful implementation of Government policies that aimed to downsize the population of foreign workers and reduce transfer payments.
2,579
1,800
1,900
2,000
2,100
2,200
2,300
2,400
2,500
2,600
2,700
1995 1996 1997 1998 1999 2000 2001 2002 2003 2004 2005 2006
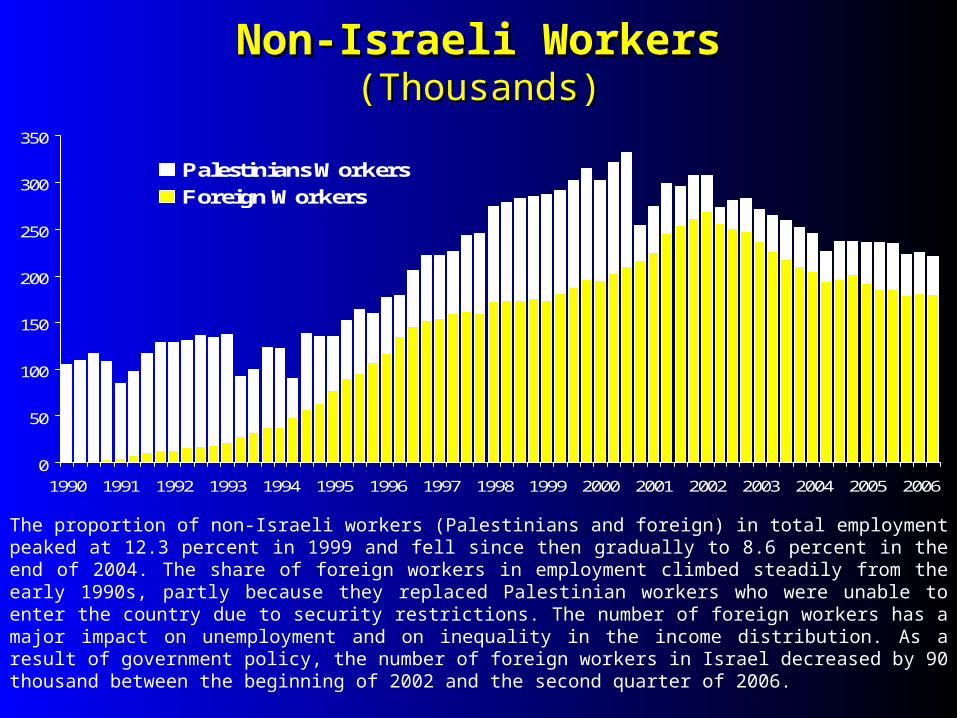
The proportion of non-Israeli workers (Palestinians and foreign) in total employment peaked at 12.3 percent in 1999 and fell since then gradually to 8.6 percent in the end of 2004. The share of foreign workers in employment climbed steadily from the early 1990s, partly because they replaced Palestinian workers who were unable to enter the country due to security restrictions. The number of foreign workers has a major impact on unemployment and on inequality in the income distribution. As a result of government policy, the number of foreign workers in Israel decreased by 90 thousand between the beginning of 2002 and the second quarter of 2006.
Non-Israeli WorkersNon-Israeli Workers(Thousands)(Thousands)
0
50
100
150
200
250
300
350
1990 1991 1992 1993 1994 1995 1996 1997 1998 1999 2000 2001 2002 2003 2004 2005 2006
Palestinians Workers
Foreign Workers
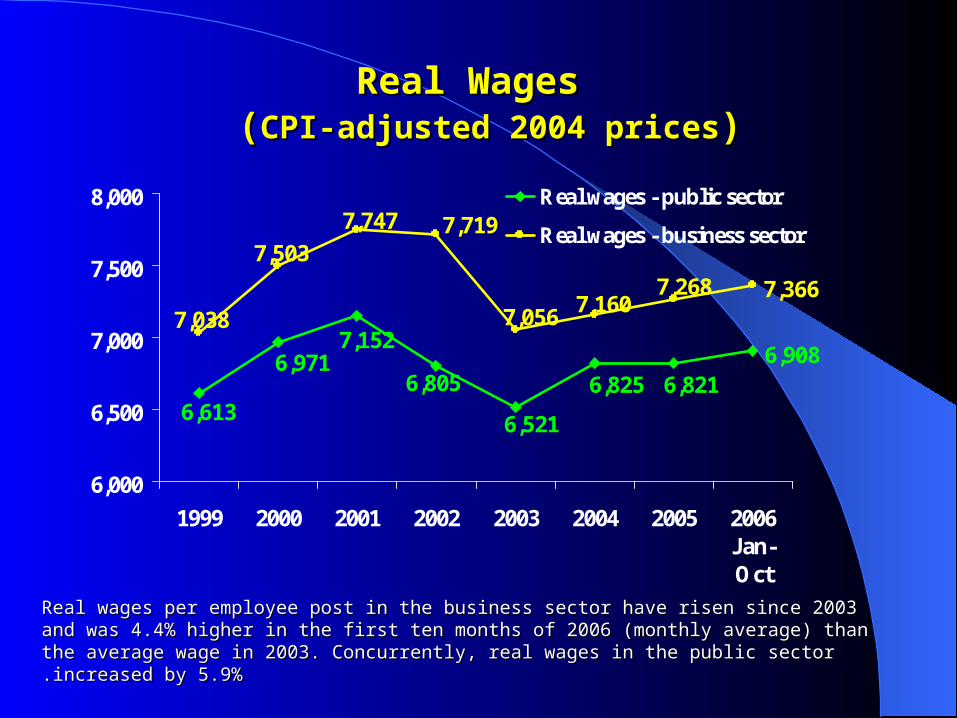
Real Wages Real Wages ((CPI-adjusted 2004 pricesCPI-adjusted 2004 prices))
6,908
7,366
6,805
7,1526,971
6,613 6,521
6,825 6,821
7,7197,747
7,503
7,038 7,0567,160
7,268
6,000
6,500
7,000
7,500
8,000
1999 2000 2001 2002 2003 2004 2005 2006Jan-Oct
Real wages - public sector
Real wages - business sector
Real wages per employee post in the business sector have risen since 2003 and was 4.4% higher in Real wages per employee post in the business sector have risen since 2003 and was 4.4% higher in the first ten months of 2006 (monthly average) than the average wage in 2003. Concurrently, real the first ten months of 2006 (monthly average) than the average wage in 2003. Concurrently, real wages in the public sector increased by 5.9%wages in the public sector increased by 5.9%..
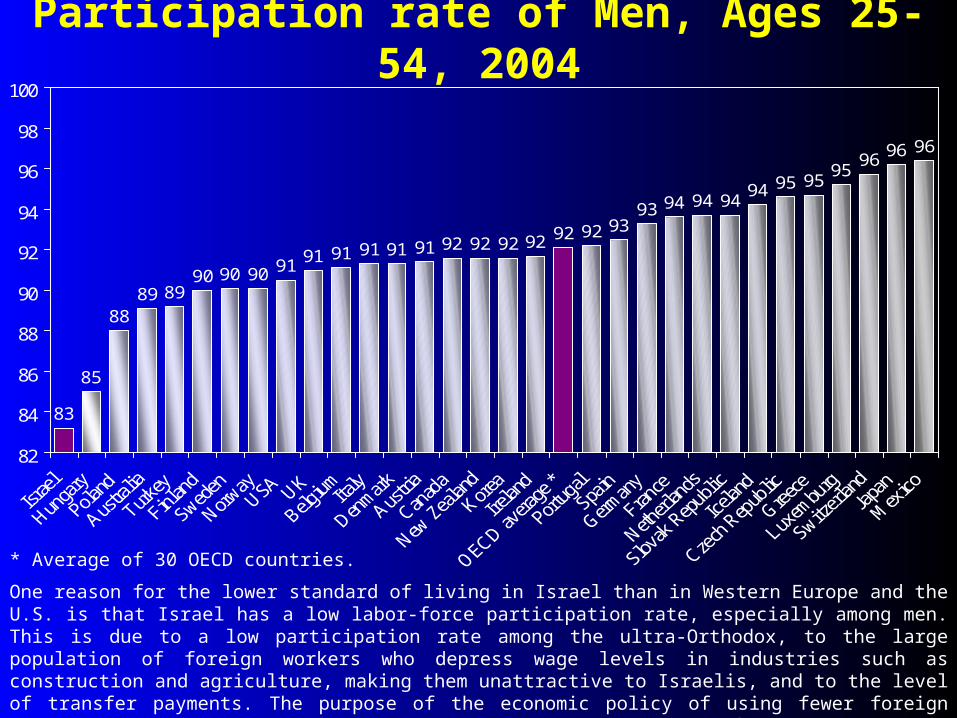
Participation rate of Men, Ages 25-54, 2004
83
85
8889 89
90 90 90 91 91 91 91 91 91 92 92 92 92 92 92 9393 94 94 94
94 95 9595
96 96 96
82
84
86
88
90
92
94
96
98
100
One reason for the lower standard of living in Israel than in Western Europe and the U.S. is that Israel has a low labor-force participation rate, especially among men. This is due to a low participation rate among the ultra-Orthodox, to the large population of foreign workers who depress wage levels in industries such as construction and agriculture, making them unattractive to Israelis, and to the level of transfer payments. The purpose of the economic policy of using fewer foreign workers and reducing transfer payments is to boost the labor-force participation rate.
* Average of 30 OECD countries.
Economic Trends in IsraelEconomic Trends in Israel
General dataGeneral dataProduct and employmentProduct and employmentBalance of payments and external stabilityBalance of payments and external stabilityFiscal policyFiscal policyMonetary policy and inflation rateMonetary policy and inflation rate
Balance of Payments and External Balance of Payments and External StabilityStability
1. Balance-of-payments2. Foreign reserves3. External Debt
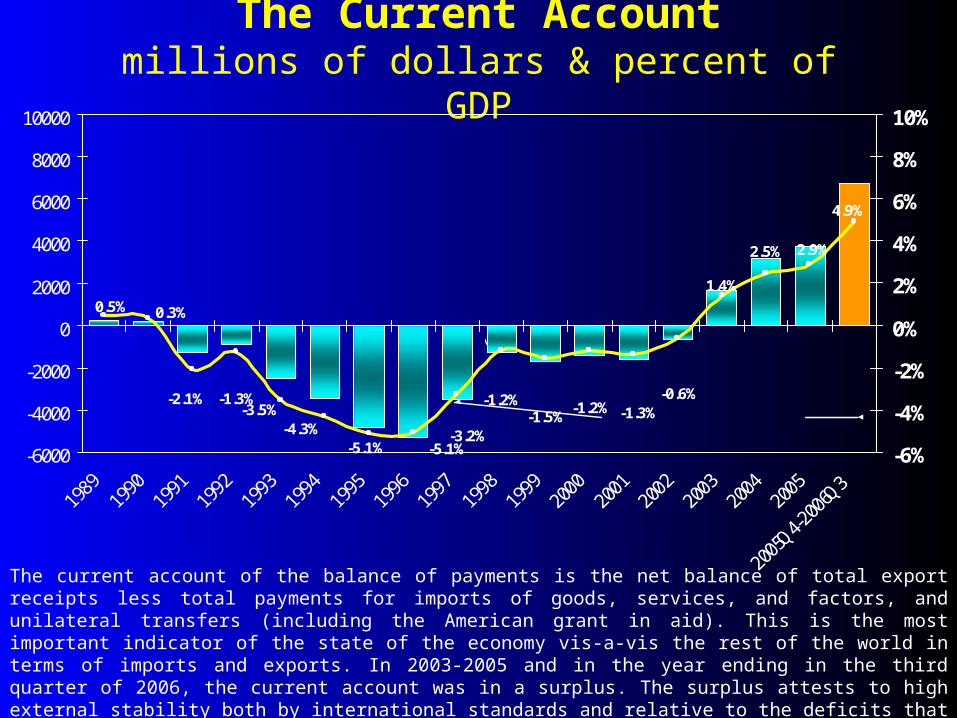
The Current Accountmillions of dollars & percent of GDP
The current account of the balance of payments is the net balance of total export receipts less total payments for imports of goods, services, and factors, and unilateral transfers (including the American grant in aid). This is the most important indicator of the state of the economy vis-a-vis the rest of the world in terms of imports and exports. In 2003-2005 and in the year ending in the third quarter of 2006, the current account was in a surplus. The surplus attests to high external stability both by international standards and relative to the deficits that were observed in the mid-1990s.
4.9%
2.9%
0.5%
-2.1%
-4.3%-5.1% -5.1%
-3.2%
-1.2%-1.5%
-1.2% -1.3%-0.6%
1.4%
2.5%
-3.5%-1.3%
0.3%
-6000
-4000
-2000
0
2000
4000
6000
8000
10000
-6%
-4%
-2%
0%
2%
4%
6%
8%
10%
Percent of GDP
\
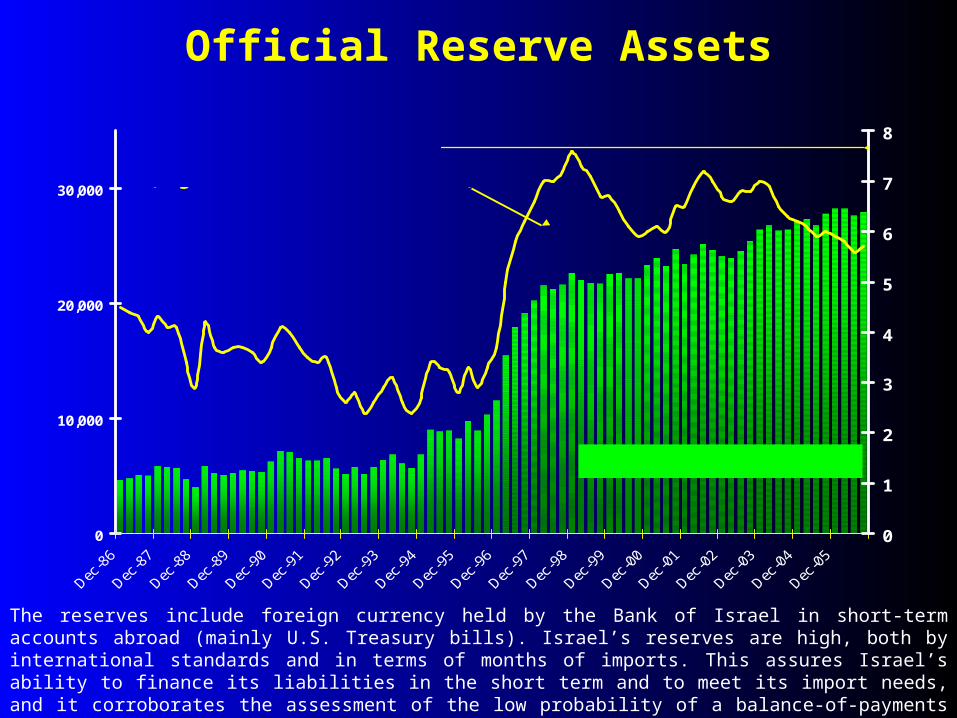
Official Reserve Assets
The reserves include foreign currency held by the Bank of Israel in short-term accounts abroad (mainly U.S. Treasury bills). Israel’s reserves are high, both by international standards and in terms of months of imports. This assures Israel’s ability to finance its liabilities in the short term and to meet its import needs, and it corroborates the assessment of the low probability of a balance-of-payments crisis.
0
10,000
20,000
30,000
0
1
2
3
4
5
6
7
8
In Millions of US Dollars
In Months of Imports(of goods and nonfactor services)
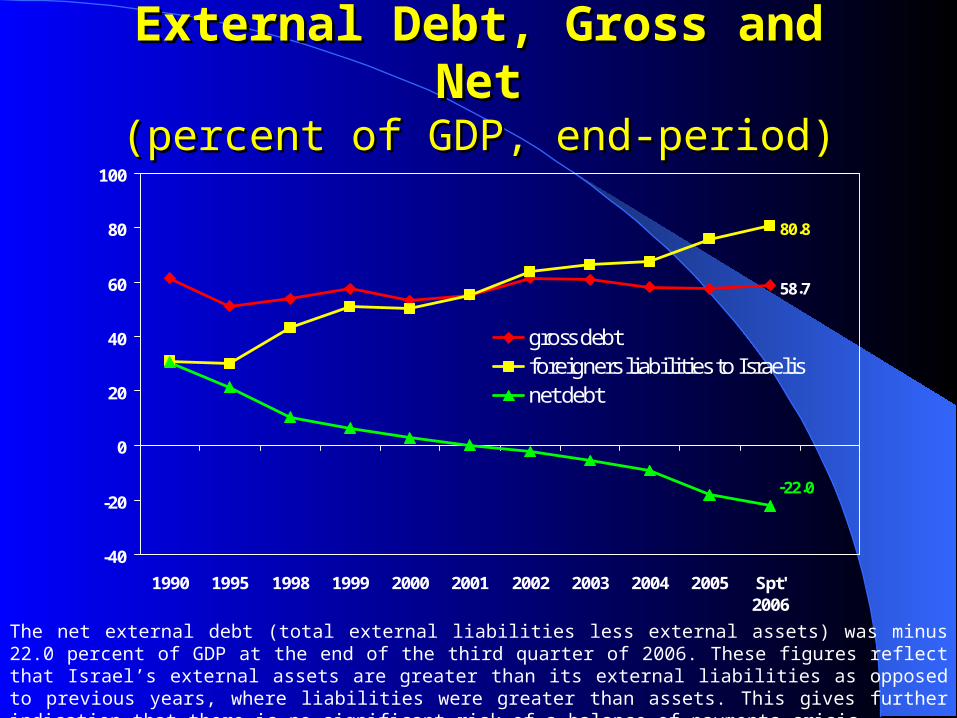
External Debt, Gross and NetExternal Debt, Gross and Net(percent of GDP, end-period)(percent of GDP, end-period)
80.8
58.7
-22.0
-40
-20
0
20
40
60
80
100
1990 1995 1998 1999 2000 2001 2002 2003 2004 2005 Spt'2006
gross debtforeigners liabilities to Israelisnet debt
The net external debt (total external liabilities less external assets) was minus 22.0 percent of GDP at the end of the third quarter of 2006. These figures reflect that Israel’s external assets are greater than its external liabilities as opposed to previous years, where liabilities were greater than assets. This gives further indication that there is no significant risk of a balance-of-payments crisis.
Economic Trends in IsraelEconomic Trends in Israel
General dataGeneral dataProduct and employmentProduct and employmentBalance of payments and external stabilityBalance of payments and external stabilityFiscal policyFiscal policyMonetary policy and inflation rateMonetary policy and inflation rate
Fiscal PolicyFiscal Policy1. Public expenditure
2. Public expenditure – international comparison
3. The public sector burden
4. Budget deficit
5. Public debt
6. Public debt – international comparison
7. Tax burden
8. Tax reform
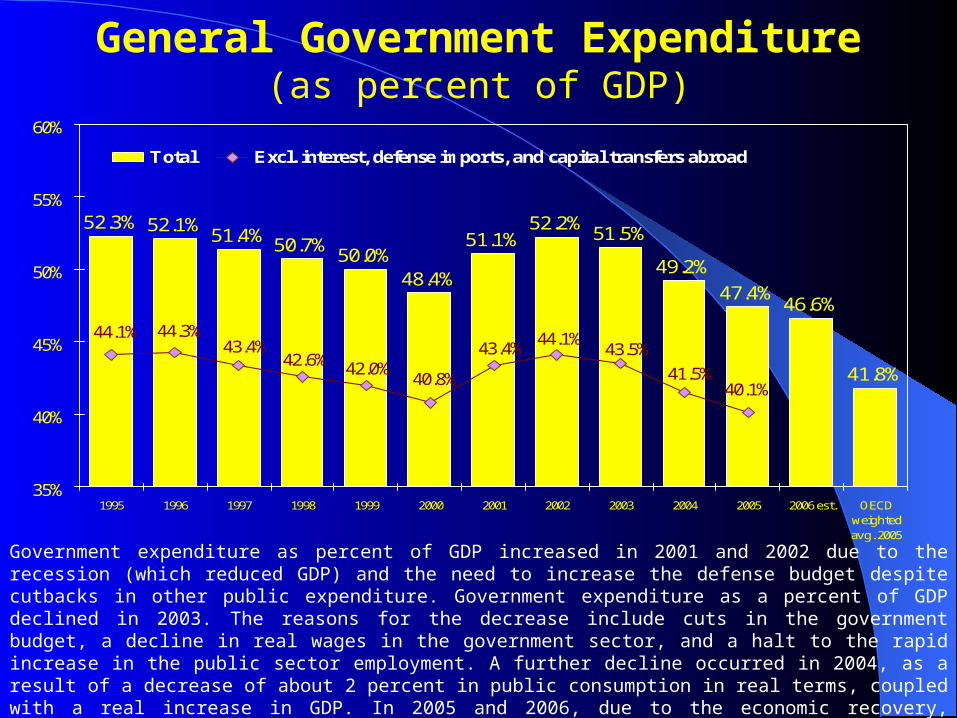
General Government Expenditure(as percent of GDP)
Government expenditure as percent of GDP increased in 2001 and 2002 due to the recession (which reduced GDP) and the need to increase the defense budget despite cutbacks in other public expenditure. Government expenditure as a percent of GDP declined in 2003. The reasons for the decrease include cuts in the government budget, a decline in real wages in the government sector, and a halt to the rapid increase in the public sector employment. A further decline occurred in 2004, as a result of a decrease of about 2 percent in public consumption in real terms, coupled with a real increase in GDP. In 2005 and 2006, due to the economic recovery, governmental expenditure as a percent of GDP declined and is estimated at 46.4% in 2006, despite a real growth in public consumption.
52.3% 52.1%51.4% 50.7%
50.0%48.4%
51.1%52.2%
51.5%
49.2%
47.4%46.6%
41.8%41.5%
43.5%44.1%
43.4%
40.8%42.0%42.6%
43.4%44.3%44.1%
40.1%
35%
40%
45%
50%
55%
60%
1995 1996 1997 1998 1999 2000 2001 2002 2003 2004 2005 2006 est. OECDweightedavg. 2005
Total Excl. interest, defense imports, and capital transfers abroad
Fiscal PolicyFiscal Policy1. Public expenditure
2. Public expenditure – international comparison
3. The public sector burden
4. Budget deficit
5. Public debt
6. Public debt – international comparison
7. Tax burden
8. Tax reform
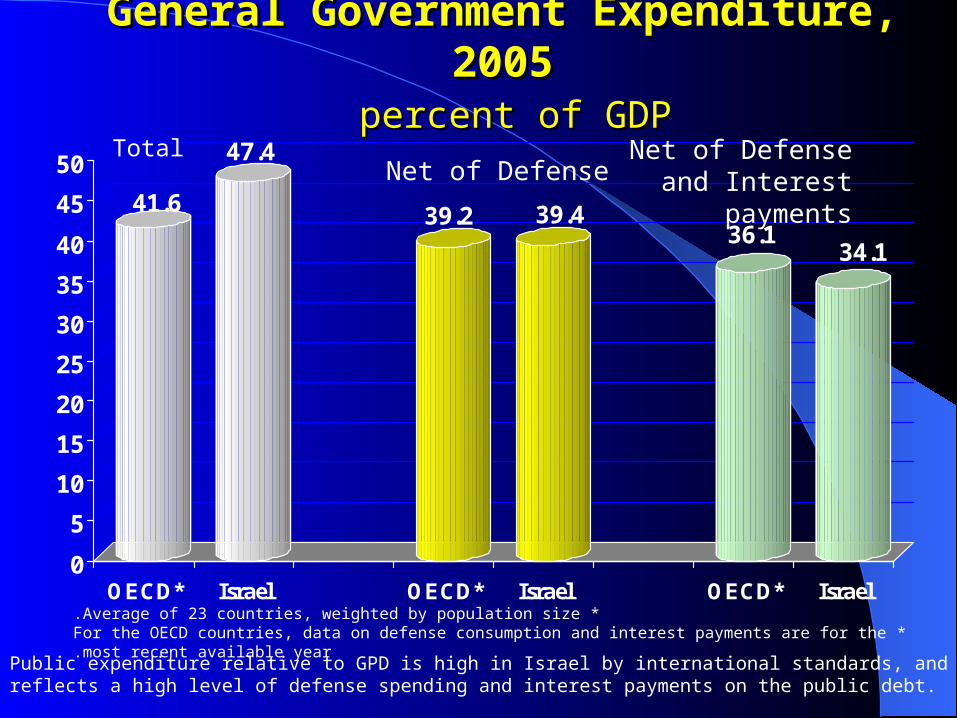
General Government Expenditure, 2005General Government Expenditure, 2005 percent of GDPpercent of GDP
41.6
47.4
39.2 39.436.1
34.1
0
5
10
15
20
25
30
35
40
45
50
OECD* Israel OECD* Israel OECD* Israel *Average of 23 countries, weighted by population size.
*For the OECD countries, data on defense consumption and interest payments are for the most recent available year.
Total Net of Defense and Interest payments
Public expenditure relative to GPD is high in Israel by international standards, and reflects a high level of defense spending and interest payments on the public debt.
Net of Defense
General Government ExpenditureGeneral Government Expenditurepercent of GDP, 2005percent of GDP, 2005
Although public spending as a ratio of GDP fell from 2004 to 2005, it is still high by international standards.
*Average of 23 countries, weighted by population.
5754
49 48 48 48 48 4745
4239 38 37 37 36 36
49.443
55
41.7
51 49
4141
51
20
25
30
35
40
45
50
55
60
Fiscal PolicyFiscal Policy1. Public expenditure
2. Public expenditure – international comparison
3. The public sector burden
4. Budget deficit
5. Public debt
6. Public debt – international comparison
7. Tax burden
8. Tax reform
Average Growth Rate of OECD Economies (percent per year)During 1998-2007, based on the World Economic Outlook of the IMF, April 2006
2.5 2.6
3.3
0
5
The ten OECD countrieswith the higher public
expenditure
The ten OECD countrieswith the medium public
expenditure
The ten OECD countrieswith the lower public
expenditureMost empirical studies point to a negative correlation between the level of government expenditure and the rate of economic growth. This negative relationship reflects the effect of an increase in government expenditure on the interest rate and, accordingly, the downward effect on investments, the creation of pressure in the labor market that pushes wages up and reduces corporate profits, and the increase in the tax burden, which is adverse to growth. Furthermore, companies in the public sector sometimes operate less efficiently than those in the private sector.

Fiscal PolicyFiscal Policy1. Public expenditure
2. Public expenditure – international comparison
3. The public sector burden
4. Budget deficit
5. Public debt
6. Public debt – international comparison
7. Tax burden
8. Tax reform
Budget DeficitBudget Deficit(as percent of GDP)(as percent of GDP)
The large deficit in 2003 reflected the effects of the recession on economic activity, which was accompanied by a large decrease in government spending. The reduction in government expenditure in 2004 and a moderate increase in spending during 2005 and 2006 concurrent with a higher rate of growth contributed to a reduction in the rate of the fiscal deficit. The deficit in 2006 is estimated at 0.9% of GDP.
3.1% 3.2%
5.4%
4.2%
0.7%
3.6%
1.9%
2.9%
0.9%
3.7%4.0%
3.2%
4.2%
0.00%1995 1996 1997 1998 1999 2000 2001 2002 2003 2004 2005 2006
est.2007
BudgetProposa
l
Fiscal PolicyFiscal Policy1. Public expenditure
2. Public expenditure – international comparison
3. The public sector burden
4. Budget deficit
5. Public debt
6. Public debt – international comparison
7. Tax burden
8. Tax reform
Gross Public Debtas percent of GDP, 1986-2006
The public debt is a result of budget deficits in the past. After the mid-1980s, when the Economic Stabilization Program was applied, the public debt as a percent of GDP declined steadily and came to 87 percent of GDP in 2000. In 2001–2003, due to the deceleration in the economy and the decline in revenue taxes on one hand, and the difficulty to decrease government expenditure on the other hand, the gross public debt rose to 102 percent of GDP in 2003. As a result of the economy recovery and the withstanding of the deficit target, the gross public debt decreased to 96.9 percent of GDP in 2005 and is estimated to reach 88 percent of GDP in 2006.
159.8
141.6146.2 148.1
138.8
123.4119.0 118.3
110.5104.5
101.6 100.0102.3
86.791.9
99.6 102.0 100.796.9
88.0
100.7
50
70
90
110
130
150
170
1986 1987 1988 1989 1990 1991 1992 1993 1994 1995 1996 1997 1998 1999 2000 2001 2002 2003 2004 2005 2006est.
Fiscal PolicyFiscal Policy1. Public expenditure
2. Public expenditure – international comparison
3. The public sector burden
4. Budget deficit
5. Public debt
6. Public debt – international comparison
7. Tax burden
8. Tax reform
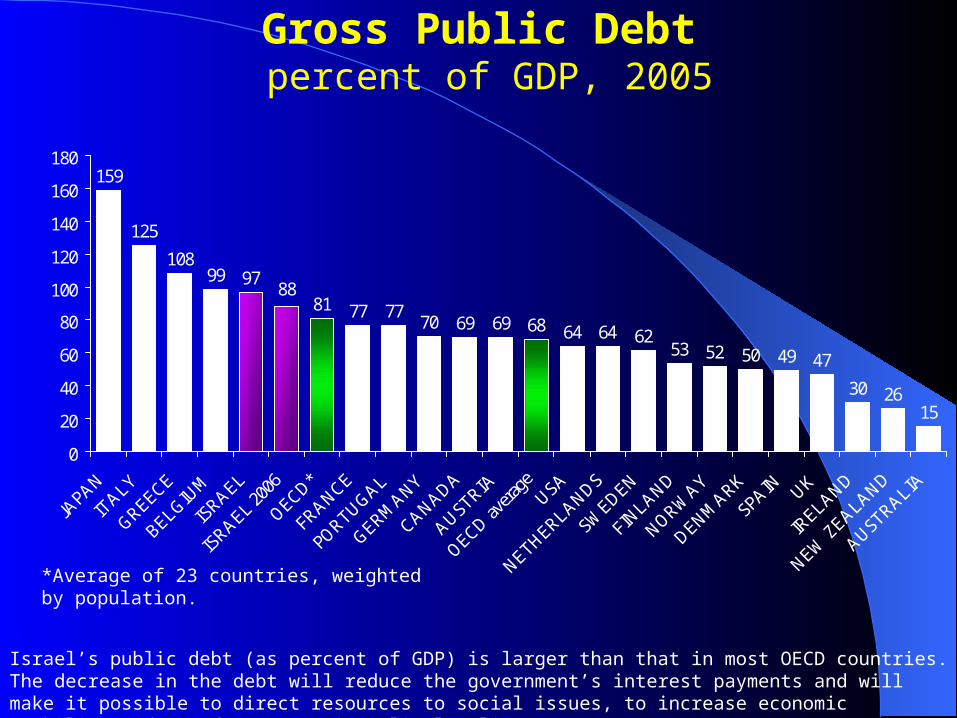
Gross Public Debtpercent of GDP, 2005
159
125
81 77 7769 69 68 64 62
53 52 50 49 47
30 2615
108
64
99
70
9788
0
20
40
60
80
100
120
140
160
180
JAPAN
ITALY
GREECE
BELGIUM
ISRAEL
ISRAEL 20
06
OECD*
FRANCE
PORTUGAL
GERMANY
CANADA
AUSTRIA
OECD avera
geUSA
NETHERLANDS
SWEDEN
FINLAND
NORWAY
DENMARK
SPAIN UK
IRELAND
NEW Z
EALAND
AUSTRALIA
8
Israel’s public debt (as percent of GDP) is larger than that in most OECD countries. The decrease in the debt will reduce the government’s interest payments and will make it possible to direct resources to social issues, to increase economic stability and to adopt an anti-cyclical policy.
*Average of 23 countries, weighted by population.

Fiscal PolicyFiscal Policy1. Public expenditure
2. Public expenditure – international comparison
3. The public sector burden
4. Budget deficit
5. Public debt
6. Public debt – international comparison
7. Tax burden
8. Tax reform
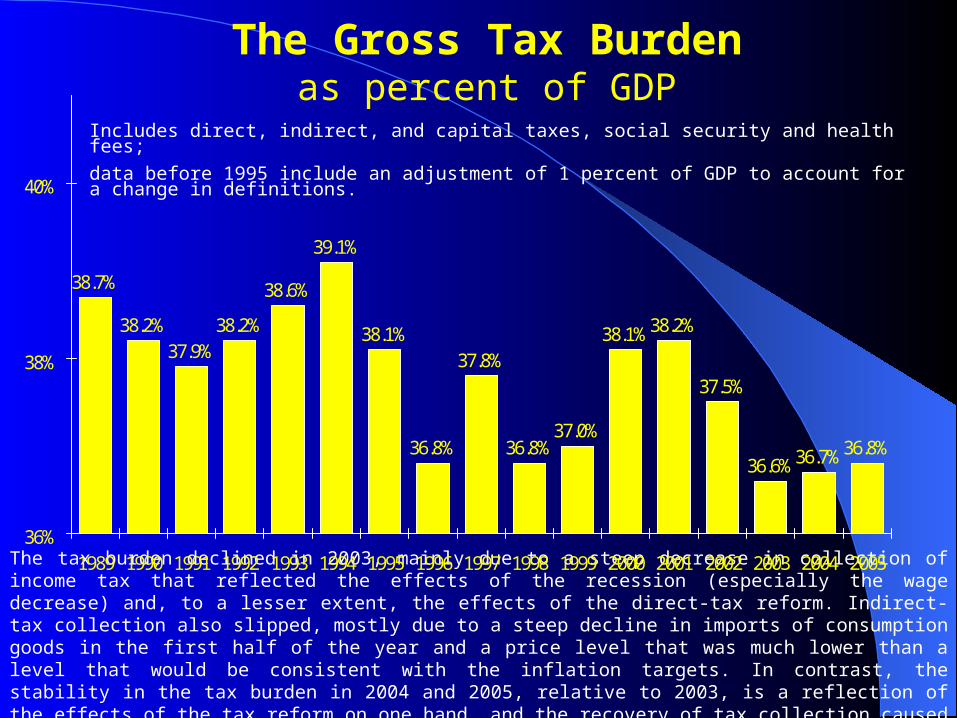
The Gross Tax Burdenas percent of GDP
The tax burden declined in 2003, mainly due to a steep decrease in collection of income tax that reflected the effects of the recession (especially the wage decrease) and, to a lesser extent, the effects of the direct-tax reform. Indirect-tax collection also slipped, mostly due to a steep decline in imports of consumption goods in the first half of the year and a price level that was much lower than a level that would be consistent with the inflation targets. In contrast, the stability in the tax burden in 2004 and 2005, relative to 2003, is a reflection of the effects of the tax reform on one hand, and the recovery of tax collection caused by the economic growth on the other hand.
Includes direct, indirect, and capital taxes, social security and health fees;
data before 1995 include an adjustment of 1 percent of GDP to account for a change in definitions.
38.7%
38.2%37.9%
38.2%
38.6%
39.1%
38.1%
36.8%
37.8%
36.8%37.0%
38.1%38.2%
37.5%
36.6%36.7%36.8%
36%
38%
40%
1989 1990 1991 1992 1993 1994 1995 1996 1997 1998 1999 2000 2001 2002 2003 2004 2005
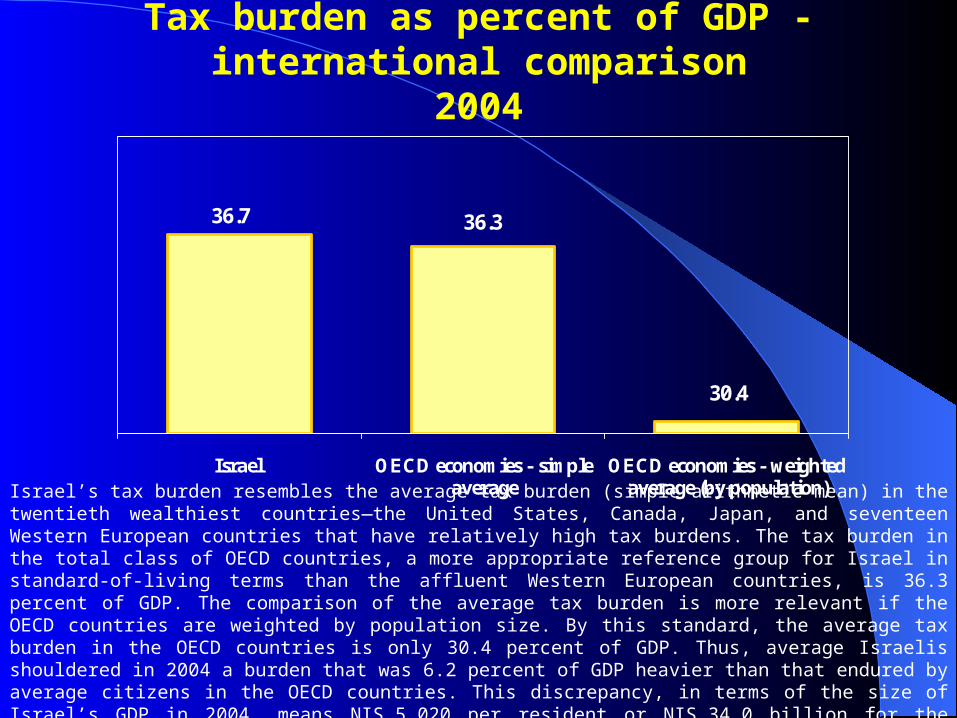
36.7 36.3
30.4
Israel OECD economies - simpleaverage
OECD economies - weightedaverage (by population)
Tax burden as percent of GDP - international comparison2004
Israel’s tax burden resembles the average tax burden (simple arithmetic mean) in the twentieth wealthiest countries—the United States, Canada, Japan, and seventeen Western European countries that have relatively high tax burdens. The tax burden in the total class of OECD countries, a more appropriate reference group for Israel in standard-of-living terms than the affluent Western European countries, is 36.3 percent of GDP. The comparison of the average tax burden is more relevant if the OECD countries are weighted by population size. By this standard, the average tax burden in the OECD countries is only 30.4 percent of GDP. Thus, average Israelis shouldered in 2004 a burden that was 6.2 percent of GDP heavier than that endured by average citizens in the OECD countries. This discrepancy, in terms of the size of Israel’s GDP in 2004, means NIS 5,020 per resident or NIS 34.0 billion for the public at large.
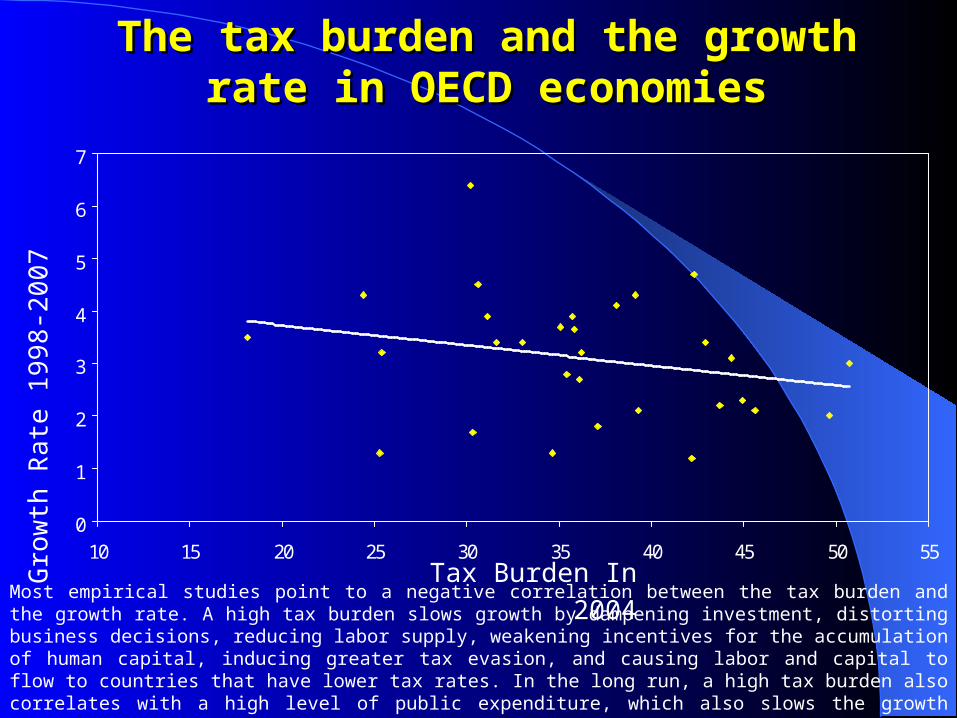
The tax burden and the growth rate in The tax burden and the growth rate in OECD economiesOECD economies
Tax Burden In 2004
0
1
2
3
4
5
6
7
10 15 20 25 30 35 40 45 50 55
Gro
wth
Rat
e 19
98-2
007
Most empirical studies point to a negative correlation between the tax burden and the growth rate. A high tax burden slows growth by dampening investment, distorting business decisions, reducing labor supply, weakening incentives for the accumulation of human capital, inducing greater tax evasion, and causing labor and capital to flow to countries that have lower tax rates. In the long run, a high tax burden also correlates with a high level of public expenditure, which also slows the growth rate.
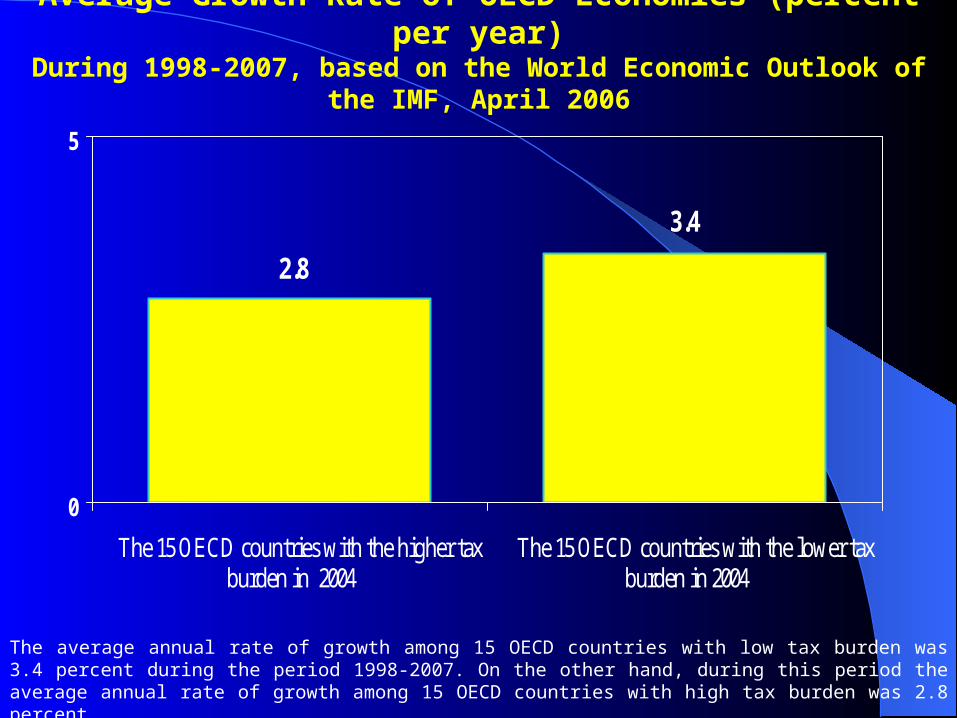
Average Growth Rate of OECD Economies (percent per year)During 1998-2007, based on the World Economic Outlook of the IMF, April 2006
2.8
3.4
0
5
The 15 OECD countries with the higher taxburden in 2004
The 15 OECD countries with the lower taxburden in 2004
The average annual rate of growth among 15 OECD countries with low tax burden was 3.4 percent during the period 1998-2007. On the other hand, during this period the average annual rate of growth among 15 OECD countries with high tax burden was 2.8 percent.
Fiscal PolicyFiscal Policy1. Public expenditure
2. Public expenditure – international comparison
3. The public sector burden
4. Budget deficit
5. Public debt
6. Public debt – international comparison
7. Tax burden
8. Tax reform
0%
10%
20%
30%
40%
50%
60%
70%
Monthly income, NIS, constant 2007 prices
2010
20072002
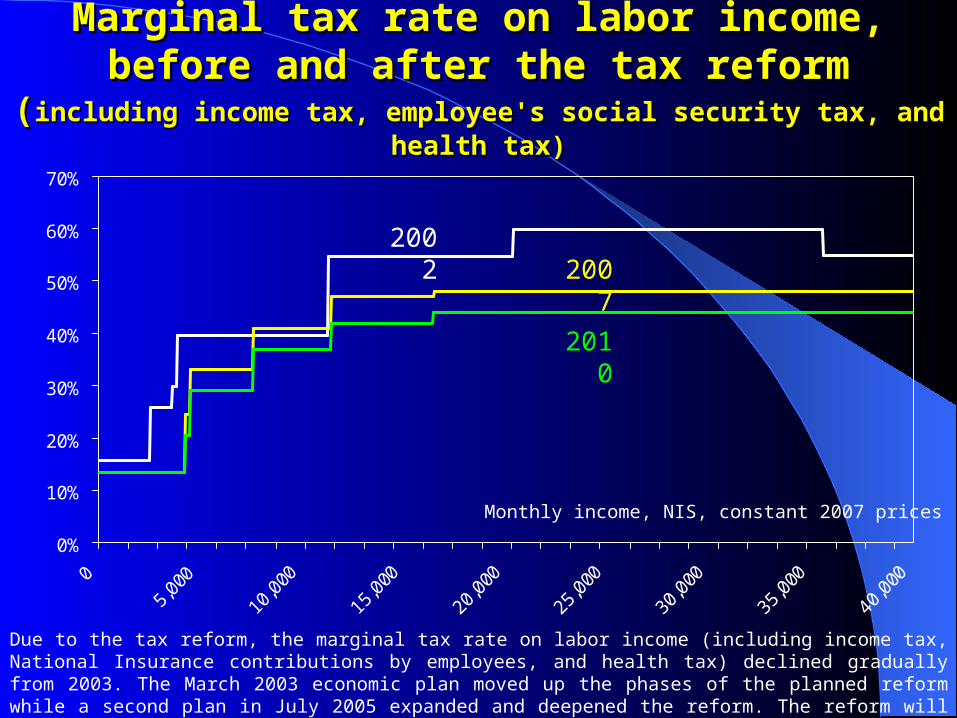
Marginal tax rate on labor income, before and after Marginal tax rate on labor income, before and after the tax reformthe tax reform
((including income tax, employee's social security tax, and health taxincluding income tax, employee's social security tax, and health tax))
Due to the tax reform, the marginal tax rate on labor income (including income tax, National Insurance contributions by employees, and health tax) declined gradually from 2003. The March 2003 economic plan moved up the phases of the planned reform while a second plan in July 2005 expanded and deepened the reform. The reform will come to an end in 2010, when the marginal tax rate on employee’s income be 44 percent.
Economic Trends in IsraelEconomic Trends in Israel
General dataGeneral dataProduct and employmentProduct and employmentBalance of payments and external stabilityBalance of payments and external stabilityFiscal policyFiscal policyMonetary policy and inflation rateMonetary policy and inflation rate
Monetary Policy and Inflation RateMonetary Policy and Inflation Rate
1. Inflation process2. Inflation targets3. BOI real interest rate4. Real effective exchange rate
Monetary Policy and Inflation RateMonetary Policy and Inflation Rate
1. Inflation process2. Inflation targets3. BOI real interest rate4. Real effective exchange rate
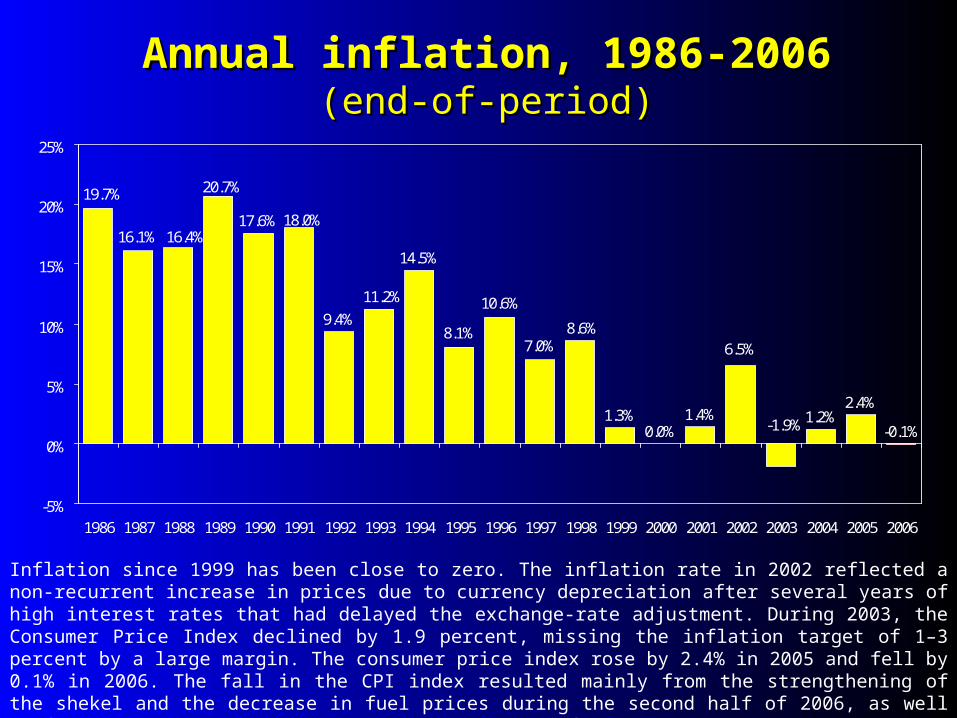
Annual inflation, 1986-2006Annual inflation, 1986-2006(end-of-period)(end-of-period)
Inflation since 1999 has been close to zero. The inflation rate in 2002 reflected a non-recurrent increase in prices due to currency depreciation after several years of high interest rates that had delayed the exchange-rate adjustment. During 2003, the Consumer Price Index declined by 1.9 percent, missing the inflation target of 1–3 percent by a large margin. The consumer price index rose by 2.4% in 2005 and fell by 0.1% in 2006. The fall in the CPI index resulted mainly from the strengthening of the shekel and the decrease in fuel prices during the second half of 2006, as well as from the contractionary policy which the Bank of Israel adopted during the period of the war in the north due to concern over the adverse impact on stability.
17.6%
14.5%
1.3%0.0%
1.4% 1.2%2.4%
-0.1%
20.7%
-1.9%
6.5%
9.4%
16.4%16.1%
8.1%7.0%
8.6%
10.6%11.2%
18.0%
19.7%
-5%
0%
5%
10%
15%
20%
25%
1986 1987 1988 1989 1990 1991 1992 1993 1994 1995 1996 1997 1998 1999 2000 2001 2002 2003 2004 2005 2006
Monetary Policy and Inflation RateMonetary Policy and Inflation Rate
1. Inflation process2. Inflation targets3. BOI real interest rate4. Real effective exchange rate
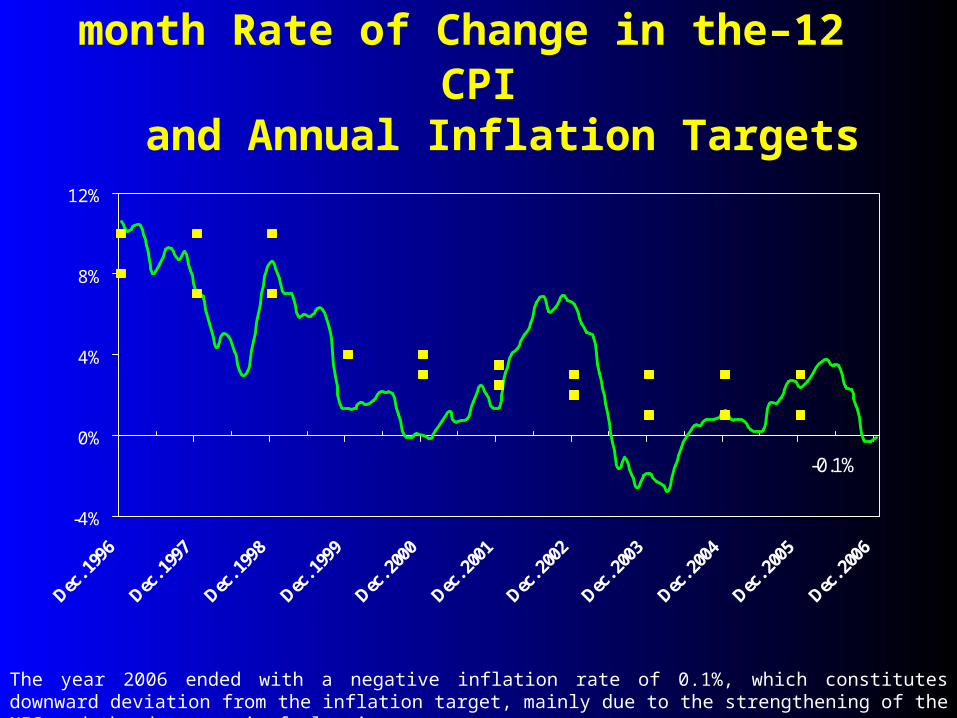
12–month Rate of Change in the CPI and Annual Inflation Targets
The year 2006 ended with a negative inflation rate of 0.1%, which constitutes downward deviation from the inflation target, mainly due to the strengthening of the NIS and the decrease in fuel prices.
-0.1%
-4%
0%
4%
8%
12%
Dec. 1
996
Dec. 1
997
Dec. 1
998
Dec. 1
999
Dec. 2
000
Dec. 2
001
Dec. 2
002
Dec. 2
003
Dec. 2
004
Dec. 2
005
Dec. 2
006
Monetary Policy and Inflation RateMonetary Policy and Inflation Rate
1. Inflation process2. Inflation targets3. BOI real interest rate4. Real effective exchange rate
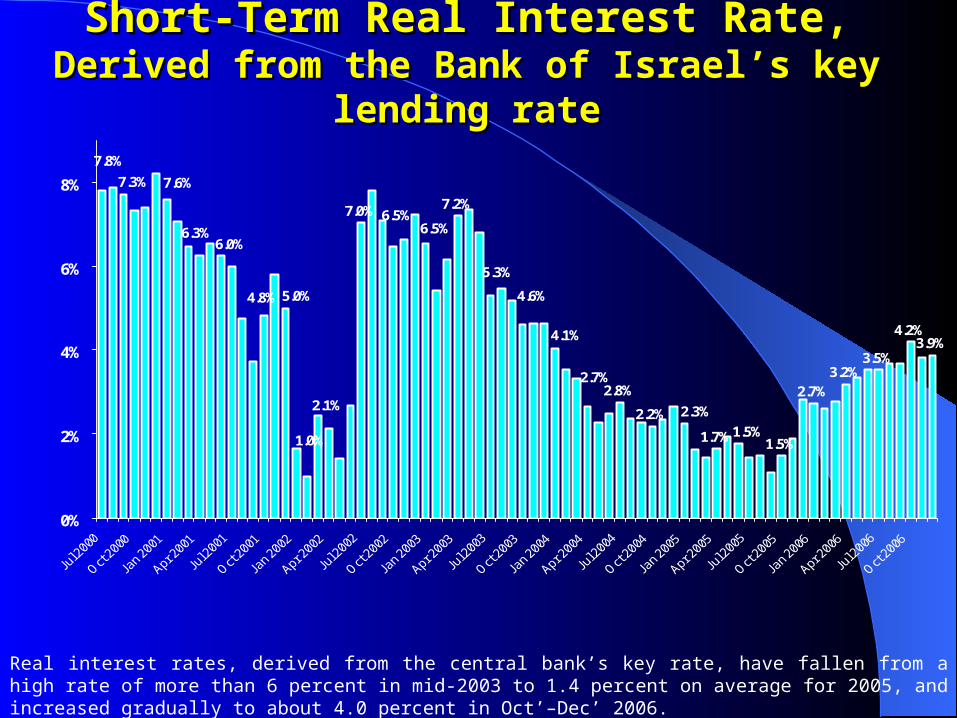
Short-Term Real Interest Rate,Short-Term Real Interest Rate,Derived from the Bank of Israel’s key lending rateDerived from the Bank of Israel’s key lending rate
2.8%
1.7% 1.5%
2.7%3.2%
3.5%
4.2%3.9%
1.5%
7.3%
7.8%
6.3%
1.0%
2.1%
7.0%
6.0%
4.8%5.0%
2.7%
4.1%
4.6%
5.3%
7.2%
6.5%6.5%
7.6%
2.3%2.2%
0%
2%
4%
6%
8%
Real interest rates, derived from the central bank’s key rate, have fallen from a high rate of more than 6 percent in mid-2003 to 1.4 percent on average for 2005, and increased gradually to about 4.0 percent in Oct’–Dec’ 2006.
Monetary Policy and Inflation RateMonetary Policy and Inflation Rate
1. Inflation process2. Inflation targets3. BOI real interest rate4. Real effective exchange rate
Real Effective Exchange RateReal Effective Exchange Rate(index, Jan. 1990 = 100)(index, Jan. 1990 = 100)
Basket: US 50%, Euro 25%, UK 5%, Japan 5%, others 15% Basket: US 50%, Euro 25%, UK 5%, Japan 5%, others 15% increase means real appreciation, decrease means real depreciationincrease means real appreciation, decrease means real depreciation
The real depreciation during 2002-2004 reflected an adjustment of the exchange rate due to real shocks that struck the economy from October 2000. The adjustment was delayed because the Bank of Israel kept real interest rates high in 1999–2001. The adjustment became possible only after a steep interest rate cut in late 2001 that led to steep depreciation in the first half of 2002. Real depreciation continued in 2003–2004, as Israel had lower inflation rates than the other advanced countries. The real depreciation helped to make export industries more competitive and supported the economic-recovery process. During 2005 and the first half of 2006, there was almost no change in real effective exchange rate. However during 2006, the real effective exchange rate appreciated by about 5.0%.
96.998.3
100.6
104.5
107.7
104.1
98.9
102.8101.1
91.7
88.4
84.082.2 82.7 83.1
84.4 84.3
81.681.280.5 81.580.6
79.8
82.3
98.999.4
101.2
75
85
95
105
115
![Split System Cooling Product Data - Trane · 22-1843-14 3 Contents Features and Benefits 2 General Data 4 Product Specifications 4 A-weighted Sound Power Level [dB(A)] 4 Accessory](https://img.pdfslide.us/doc/110x75/5b032fcd7f8b9a4e538bf8e4/split-system-cooling-product-data-trane-3-contents-features-and-benefits-2-general.jpg)