Embed Size (px)
Citation preview
India and the GlobalEconomy CHAPTER
14
The big story of the last decade for India has been its arrival on the global
scene. The Indian economy had broken free of the low-growth trap from the
early 1980s. By the mid-1990s, following the economic reforms of 1991-3, India
began to appear as a player of some significance in the global economy. Then,
following the East Asian crisis of the late 1990s, and from the first years of the
first decade of the 21st century there was no looking back. India’s exports began
to climb, its foreign exchange reserves, which for decades had hovered around
5 billion dollars, rose exponentially after the economic reforms and in little
more than a decade had risen to 300 billion dollars. Indian corporations that
rarely ventured out of India were suddenly investing all over the world and
even in some industrialized countries. When, in 2009, the Group of 20 (G-20)
was raised to the level of a forum for leaders, India was a significant member of
this global policy group.
14.2 The globalization of India has given rise tonew opportunities but it has also brought with itnew challenges and responsibilities. It means thatthe global economy can no longer be viewed froma spectator’s standpoint. What happens there haslarge implications for India. Every time there is amajor financial crisis anywhere in the world, thereis need to take brace position. And, in turn, therise and fall of India’s growth rate has an impacton global growth and there is need for India to takethis responsibility seriously. This chapter, a newaddition to the Economic Survey, is a recognitionof this fact. It examines the state of the globaleconomy and India’s position therein. It analysesthe current global slowdown and eurozone crisis,what this means for India and the policy challengesthat these international matters give rise to ondomestic soil. The chapter also discusses G-20imperatives and India’s role as a constructive playerin the evolving global order.
STATE OF THE GLOBAL ECONOMY
14.3 The developments over the last year in majoreconomies of the world have not been encouraging.There is an apprehension that the process of globaleconomic recovery that began after the financial crisisof the 2008 is beginning to stall and the sovereigndebt crisis in the eurozone area may persist for awhile. There is an effort to build firewalls around thesedanger zones, but the world has little experiencewith this; so we need to be prepared for breaches inthe walls. The US economy has shown someimprovement but economic growth remains sluggish.The global economy is expected to grow by 3.3 percent in 2012 compared to 3.8 per cent in 2011 asper the International Monetary Fund’s (IMF) January2012 update of the World Economic Outlook (WEO).Gross domestic product (GDP) growth in advancedeconomies declined to 1.6 per cent in 2011 comparedto 3.2 per cent in 2010 and is expected to be evenlower at 1.2 per cent in 2012. Growth in emerging
http://indiabudget.nic.in
338 Economic Survey 2011-12
economies slowed to 6.2 per cent in 2011 comparedto 7.3 per cent in 2010 and is projected to be 5.4 percent in 2012.The US economy seems to have revivedsomewhat and is projected to maintain its growthrate at 1.8 per cent for 2012. Even so, economicgrowth in the US remains sluggish despite extensiveuse of both fiscal and monetary policy tools. Theeurozone is expected to contract by 0.5 per cent in2012 (Table 14. 1).
14.4 The predominant reason for the subduedgrowth in advanced economies at this junctureremains the sovereign debt crisis that started in theperipheral economies of the eurozone, but from thelatter half of 2011, started to adversely affect themajor economies there, as well (see Box 14.1).Issues relating to medium-term fiscal consolidation,the exposure of European banks to public and privatedebt, and recurring differences in the ways to resolvethe crisis have continued to weigh on the globaleconomic outlook as the eurozone accounts forclose to one-fifths of global GDP.
14.5 Volatility in capital flows resulting from thespillover effects of monetary policy choices and otheruncertainties in the advanced financial marketsfurther impacted exchange rates and made the taskof macroeconomic management difficult in many
emerging economies. This has brought out a newdimension of globalization in the post financial crisisworld, where easy monetary policy in one set ofcountries may result in inflation elsewhere due tocross-border capital flows.
14.6 Unemployment situation in advancedeconomies in general, and the peripheral economiesof the eurozone in particular, which had deterioratedin the wake of global crisis has not improved. TheOECD Employment Outlook 2011 observed that withthe recovery stalling, OECD unemploymentremained high, with close to 44.5 million personsunemployed. The extent of unemployment has beenvaried across OECD countries, with Spain exhibitingthe highest unemployment rate (21.7 per cent). Asper the OECD report, the main losers have beenyouth and temporary workers, some of whom havebeen getting out of the job market. Theunemployment rate in the US has shown someimprovement (8.7 per cent in Q4 2011 compared to9.1 per cent in Q3 2011), but nevertheless remainshigh. The persistently high rates of unemploymentin advanced countries, especially in the crisis-affected countries of the eurozone, the inherentcontradiction of fiscal consolidation (withoutworsening the contractionary tendencies) is havinga social fallout in the peripheral economies and has
Table 14.1 : Growth of the GDP (%) (Y-o-y)World Advanced US EU UK Eurozone Germany Japan B R I*# C* S
economies
2010 5.2 3.2 3.0 2.0 2.1 1.8 3.6 4.4 7.5 4.0 9.9 10.4 2.9
Q1 2.2 1.0 1.2 1.0 2.4 5.0 9.3 3.0 9.4 11.9 1.6
Q2 3.3 2.2 2.5 2.1 4.1 4.5 8.7 5.2 8.8 10.3 3.0
Q3 3.5 2.4 3.0 2.1 4.0 5.2 7.0 3.4 8.9 9.6 3.3
Q4 3.1 2.2 1.7 2.0 3.8 3.2 5.3 4.4 8.3 9.7 3.6
2011 3.8 1.6 1.8 1.6 0.9 1.5 3.0 -0.9 2.9 4.1 7.4 9.2 3.1
Q1 2.2 2.4 1.6 2.4 4.6 0.1 4.2 3.8 7.8 9.7 3.7
Q2 1.6 1.7 0.5 1.6 2.9 -1.7 3.3 3.5 7.7 9.5 3.3
Q3 1.5 1.4 0.4 1.3 2.6 -0.6 2.2 4.9 6.9 9.1 2.9
Q4 1.6 0.9 0.7 0.7 2.0 -1.0 na na 6.1 8.9 na
2012 (P) 3.3 1.2 1.8 -0.1 0.6 -0.5 0.3 1.7 3.0 3.3 7.0 8.2 2.5
Source : Organization for Economic Cooperation and Development (OECD) Principal Global indicators andIMF WEO.Notes : P Projection from IMF World Economic outlook January 2012 update.
na: not available. Growth rates may not necessarily correspond to country sources.* Country website. Y-o- y is year-on-year. EU is European Union. B,R,I,C,S stand for the separate
countries of the BRICS grouping, i.e. Brazil, Russia, India, China, and South Africa. Q1, Q2, Q3,and Q4 stand for the first, second, third, and fourth quartersAggregations for World and Advanced Economies use purchasing power parity weights.
# India’s GDP growth is in terms of factor cost whereas for other countries it is in terms ofmarket prices.
http://indiabudget.nic.in
339India and Global Economy
Box 14.1 : The Eurozone : A Crisis after a CrisisThe eurozone crisis: The eurozone (a currency union of 17 European countries) has been going through a major crisiswhich started with Greece but spread rapidly to Ireland, Portugal, and Spain and subsequently Italy. While it got sparkedoff by fear over the sovereign debt crisis in Greece, it went on to impact the peripheral economies as well, especially thosewith over-leveraged financial institutions. These economies (especially Greece) have witnessed downgrades in the ratings oftheir sovereign debt due to fears of default and a rise in borrowing costs.The sovereign debt crisis has made it very difficultfor some of these countries to re-finance government debt. The banking sector in these countries also stands adverselyaffected.
Good times: After the launch of the euro, the eurozone witnessed not only a decline in long-term interest rates (especiallyfrom 2002 to 2006), but an increasing degree of convergence in the interest rates of member countries. A common currency,similar interest rates, and relatively strong growth provided a basis for a rise in public and private borrowing with cross-border holdings of sovereign and private debt by banks.
Trigger: In the aftermath of the global financial crisis in 2008, sovereign debt levels started to mount. The revelation thatthe fiscal deficit in Greece was much higher than stated earlier set off serious concerns in early 2010 about the sustainabilityof the debt. The downgrade of ratings led to a spiral of rising bond yields and further downgrade of government debt ofother peripheral eurozone economies as well, that had high public debt or a build-up of bank lending or both.
How it spread: Concerns intensified in early 2010 as cross-border holdings of sovereign debt and exposure of banks cameto light. The financial markets quickly transmitted the shocks which not only led to a sharp rise in credit default swap (CDS)spreads but later impacted capital flows elsewhere.
Underlying weaknesses: The crisis has been difficult to resolve due to certain specificities:
The eurozone lacks a single fiscal authority capable of strict enforcement;
Economies with different levels of competitiveness (and fiscal positions) have a single currency;
These economies cannot adjust through a depreciation of the currency;
There is no lender of last resort, i.e. a full-fledged central bank.
Steps to resolve it: In May 2010, the European finance ministers agreed on a rescue package worth •750 billion to ensurefinancial stability by creating the European Financial Stability Facility (EFSF). In October 2011, the eurozone leaders agreedto a package of measures that included an agreement whereby banks would accept a 50 per cent write-off of Greek debtowed to private creditors, an increase in the EFSF to about •1 trillion, and requiring European banks to achieve 9 per centcapitalization. The date for starting the European Stability Mechanism was brought forward to July 2012. To restoreconfidence in Europe, EU leaders also agreed to a fiscal compact with a commitment that participating countries wouldintroduce a balanced budget amendment. In December 2011, the European Central Bank (ECB) took the step of offering athree-year long-term refinancing operation (LTRO) at highly favourable rates to alleviate funding stress which helped bringdown the yields somewhat during January and February 2012. But overall uncertainty about the effectiveness of all thesemeasures and how further resources would be raised, their adequacy, and doubts about sovereign debt levels coming downand the ability of Greece and other economies to undertake further fiscal austerity remain, especially due to the low-growthscenario.
The Euro zone and India: The eurozone, though distinct from the European Union (EU) is a major subset of the EU. Theeurozone and EU account for about 19 and 25 per cent respectively of global GDP. The EU is a major trade partner for Indiaaccounting for about 20 per cent of India’s exports and is an important source of foreign direct investment (FDI). The IMFhas forecast that the eurozone is likely to go through a mild recession in 2012. A slowdown in the eurozone is likely toimpact the EU and the world economy as well as India.
sharply polarized public debate on the appropriateeconomic policies to be adopted.
14.7 The petering out of the revival of global growthin 2011 came on top of disruptions in supply-chainnetworks resulting from the devastating earthquakeand tsunami in Japan (in March 2011). Later in theyear (October and November), severe flooding in
Thailand also disrupted some supply chains. Politicaluncertainties in some Middle East and North Africancountries have been another source of uncertaintyapart from their obvious implications for oil prices.The severe uncertainty in the eurozone impactedthe global financial markets leading to capitalreversals to safe havens in December 2011.
http://indiabudget.nic.in
340 Economic Survey 2011-12
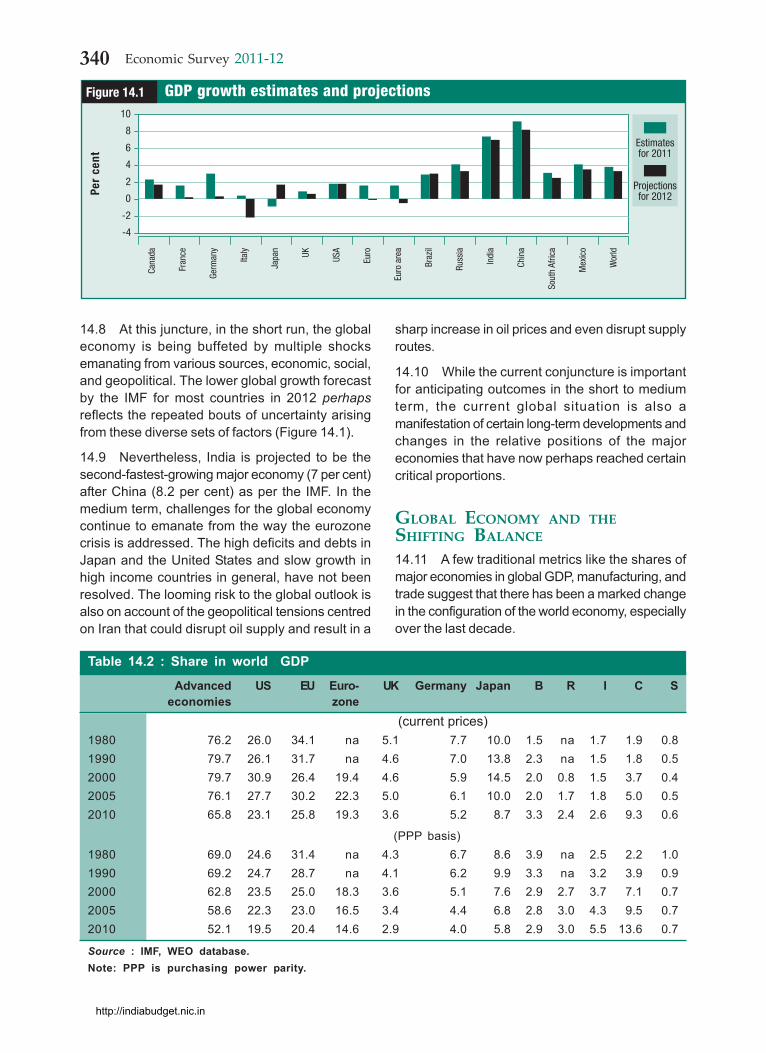
14.8 At this juncture, in the short run, the globaleconomy is being buffeted by multiple shocksemanating from various sources, economic, social,and geopolitical. The lower global growth forecastby the IMF for most countries in 2012 perhapsreflects the repeated bouts of uncertainty arisingfrom these diverse sets of factors (Figure 14.1).
14.9 Nevertheless, India is projected to be thesecond-fastest-growing major economy (7 per cent)after China (8.2 per cent) as per the IMF. In themedium term, challenges for the global economycontinue to emanate from the way the eurozonecrisis is addressed. The high deficits and debts inJapan and the United States and slow growth inhigh income countries in general, have not beenresolved. The looming risk to the global outlook isalso on account of the geopolitical tensions centredon Iran that could disrupt oil supply and result in a
sharp increase in oil prices and even disrupt supplyroutes.
14.10 While the current conjuncture is importantfor anticipating outcomes in the short to mediumterm, the current global situation is also amanifestation of certain long-term developments andchanges in the relative positions of the majoreconomies that have now perhaps reached certaincritical proportions.
GLOBAL ECONOMY AND THESHIFTING BALANCE
14.11 A few traditional metrics like the shares ofmajor economies in global GDP, manufacturing, andtrade suggest that there has been a marked changein the configuration of the world economy, especiallyover the last decade.
-4
0
4
8Estimatesfor 2011
Figure 14.1Pe
r ce
ntGDP growth estimates and projections
Cana
da
Fran
ce
Germ
any
Italy
Japa
n UK USA
Euro
Euro
are
a
Braz
il
Russ
ia
Indi
a
Chin
a
Sout
h Af
rica
Mex
ico
Wor
ld
-2
2
6
Projectionsfor 2012
10
Table 14.2 : Share in world GDP
Advanced US EU Euro- UK Germany Japan B R I C Seconomies zone
(current prices)1980 76.2 26.0 34.1 na 5.1 7.7 10.0 1.5 na 1.7 1.9 0.81990 79.7 26.1 31.7 na 4.6 7.0 13.8 2.3 na 1.5 1.8 0.52000 79.7 30.9 26.4 19.4 4.6 5.9 14.5 2.0 0.8 1.5 3.7 0.42005 76.1 27.7 30.2 22.3 5.0 6.1 10.0 2.0 1.7 1.8 5.0 0.52010 65.8 23.1 25.8 19.3 3.6 5.2 8.7 3.3 2.4 2.6 9.3 0.6
(PPP basis)1980 69.0 24.6 31.4 na 4.3 6.7 8.6 3.9 na 2.5 2.2 1.01990 69.2 24.7 28.7 na 4.1 6.2 9.9 3.3 na 3.2 3.9 0.92000 62.8 23.5 25.0 18.3 3.6 5.1 7.6 2.9 2.7 3.7 7.1 0.72005 58.6 22.3 23.0 16.5 3.4 4.4 6.8 2.8 3.0 4.3 9.5 0.72010 52.1 19.5 20.4 14.6 2.9 4.0 5.8 2.9 3.0 5.5 13.6 0.7
Source : IMF, WEO database.Note: PPP is purchasing power parity.
http://indiabudget.nic.in
341India and Global Economy
14.12 Over the last 20 years sustained growth ofa number of large emerging economies, especiallythe BRICS economies, has resulted in an increasein their share in the global GDP as seen from Table14.2. As a consequence, the value addition in theworld economy has been moving away fromadvanced countries towards what have been termedemerging economies. The decline in share isparticularly marked in the case of the EU. The shifttowards Asia has been significant and, within Asia,away from Japan to China and India. The fivefoldincrease in share of China in the global GDP hasplaced it as the second largest economy in theworld. The increase in share of India, though lessdramatic, is nevertheless of an order that placesher as the fourth largest economy in PPP terms(Table 14.2).
14.13 The reduction in share of advancedeconomies, particularly from 2005, has beenaccentuated by the slowdown that followed thesubprime crisis in the United States, the crisis inthe eurozone in 2010, and the near stagnation inJapan for nearly two decades on the one side andthe significantly higher rate of growth in low andmiddle income countries (particularly the largecountries like India and China) on the other.
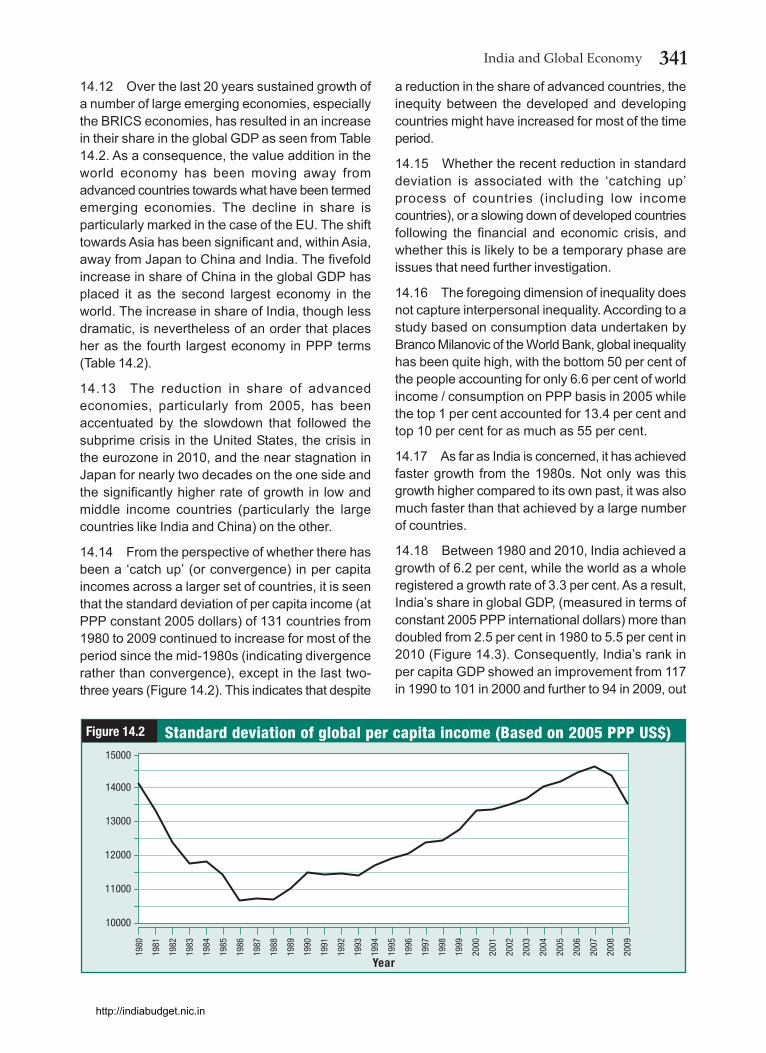
14.14 From the perspective of whether there hasbeen a ‘catch up’ (or convergence) in per capitaincomes across a larger set of countries, it is seenthat the standard deviation of per capita income (atPPP constant 2005 dollars) of 131 countries from1980 to 2009 continued to increase for most of theperiod since the mid-1980s (indicating divergencerather than convergence), except in the last two-three years (Figure 14.2). This indicates that despite
a reduction in the share of advanced countries, theinequity between the developed and developingcountries might have increased for most of the timeperiod.
14.15 Whether the recent reduction in standarddeviation is associated with the ‘catching up’process of countries (including low incomecountries), or a slowing down of developed countriesfollowing the financial and economic crisis, andwhether this is likely to be a temporary phase areissues that need further investigation.
14.16 The foregoing dimension of inequality doesnot capture interpersonal inequality. According to astudy based on consumption data undertaken byBranco Milanovic of the World Bank, global inequalityhas been quite high, with the bottom 50 per cent ofthe people accounting for only 6.6 per cent of worldincome / consumption on PPP basis in 2005 whilethe top 1 per cent accounted for 13.4 per cent andtop 10 per cent for as much as 55 per cent.
14.17 As far as India is concerned, it has achievedfaster growth from the 1980s. Not only was thisgrowth higher compared to its own past, it was alsomuch faster than that achieved by a large numberof countries.
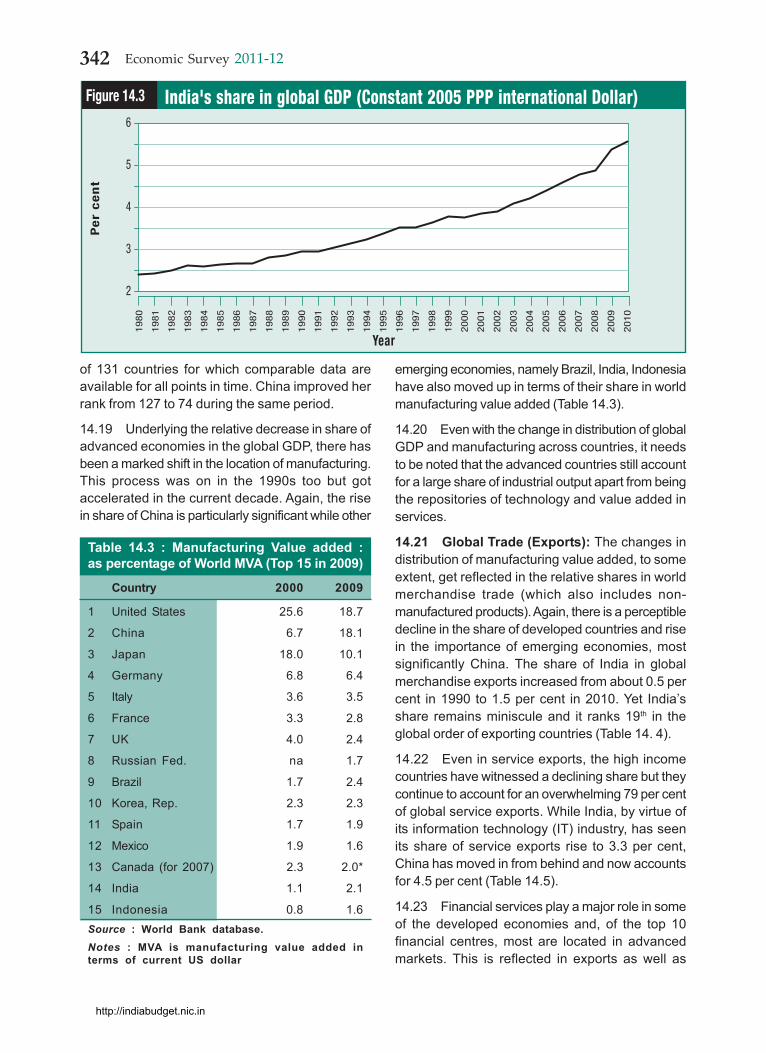
14.18 Between 1980 and 2010, India achieved agrowth of 6.2 per cent, while the world as a wholeregistered a growth rate of 3.3 per cent. As a result,India’s share in global GDP, (measured in terms ofconstant 2005 PPP international dollars) more thandoubled from 2.5 per cent in 1980 to 5.5 per cent in2010 (Figure 14.3). Consequently, India’s rank inper capita GDP showed an improvement from 117in 1990 to 101 in 2000 and further to 94 in 2009, out
10000
11000
12000
13000
1980
1981
1982
1983
1984
1985
1986
1987
1988
1989
1990
1991
1992
1993
1994
1995
1996
1997
1998
1999
2000
2001
2002
2003
2004
2005
2006
2007
2008
2009
Year
14000
Figure 14.2 Standard deviation of global per capita income (Based on 2005 PPP US$)15000
http://indiabudget.nic.in
342 Economic Survey 2011-12
of 131 countries for which comparable data areavailable for all points in time. China improved herrank from 127 to 74 during the same period.
14.19 Underlying the relative decrease in share ofadvanced economies in the global GDP, there hasbeen a marked shift in the location of manufacturing.This process was on in the 1990s too but gotaccelerated in the current decade. Again, the risein share of China is particularly significant while other
emerging economies, namely Brazil, India, Indonesiahave also moved up in terms of their share in worldmanufacturing value added (Table 14.3).
14.20 Even with the change in distribution of globalGDP and manufacturing across countries, it needsto be noted that the advanced countries still accountfor a large share of industrial output apart from beingthe repositories of technology and value added inservices.
14.21 Global Trade (Exports): The changes indistribution of manufacturing value added, to someextent, get reflected in the relative shares in worldmerchandise trade (which also includes non-manufactured products). Again, there is a perceptibledecline in the share of developed countries and risein the importance of emerging economies, mostsignificantly China. The share of India in globalmerchandise exports increased from about 0.5 percent in 1990 to 1.5 per cent in 2010. Yet India’sshare remains miniscule and it ranks 19th in theglobal order of exporting countries (Table 14. 4).
14.22 Even in service exports, the high incomecountries have witnessed a declining share but theycontinue to account for an overwhelming 79 per centof global service exports. While India, by virtue ofits information technology (IT) industry, has seenits share of service exports rise to 3.3 per cent,China has moved in from behind and now accountsfor 4.5 per cent (Table 14.5).
14.23 Financial services play a major role in someof the developed economies and, of the top 10financial centres, most are located in advancedmarkets. This is reflected in exports as well as
Table 14.3 : Manufacturing Value added :as percentage of World MVA (Top 15 in 2009)
Country 2000 2009
1 United States 25.6 18.7
2 China 6.7 18.1
3 Japan 18.0 10.1
4 Germany 6.8 6.4
5 Italy 3.6 3.5
6 France 3.3 2.8
7 UK 4.0 2.4
8 Russian Fed. na 1.7
9 Brazil 1.7 2.4
10 Korea, Rep. 2.3 2.3
11 Spain 1.7 1.9
12 Mexico 1.9 1.6
13 Canada (for 2007) 2.3 2.0*
14 India 1.1 2.1
15 Indonesia 0.8 1.6Source : World Bank database.Notes : MVA is manufacturing value added interms of current US dollar
2
3
4
5
Pe
r c
en
t
19
80
19
81
19
82
19
83
19
84
19
85
19
86
19
87
19
88
19
89
19
90
19
91
19
92
19
93
19
94
19
95
19
96
19
97
19
98
19
99
20
00
20
01
20
02
20
03
20
04
20
05
20
06
20
07
20
08
20
09
20
10
Year
6
Figure 14.3 India's share in global GDP (Constant 2005 PPP international Dollar)
http://indiabudget.nic.in
343India and Global Economy
Table 14.4 : Share in World Merchandise Exports (%)Share in Developed US EU UK Euro Germany Japan B R I C Sglobal economies zoneexports1980 66.3 11.1 41.5 5.4 30.8 _ 6.4 1.0 _ 0.4 0.9 1.31990 72.4 11.3 44.5 5.3 35.2 11.8 8.3 0.9 _ 0.5 1.8 0.72000 65.7 12.1 38.0 4.4 29.7 8.5 7.4 0.9 1.6 0.7 3.9 0.52005 60.4 8.6 38.7 3.7 30.3 9.2 5.7 1.1 2.3 0.9 7.3 0.52010 54.2 8.4 33.9 2.7 26.4 8.4 5.1 1.3 2.6 1.5 10.4 0.6
Source : United Nations Conference on Trade and Development (UNCTAD).
Table 14.5 : Share in World Service Exports (%)Country High US EU UK Euro Germany Japan B R I C S
income area
1980 86.9 11.7 56.0 9.0 41.6 8.1 5.0 0.4 na 0.7 0.0 0.6
1990 87.8 17.0 50.7 6.6 39.7 7.3 4.8 0.4 na 0.5 0.7 0.4
2000 84.8 18.4 44.1 7.8 31.0 5.4 4.5 0.6 0.2 1.1 2.0 0.3
2010 78.8 14.3 42.9 6.3 30.5 6.3 3.7 0.8 0.6 3.3 4.5 0.4
Source : Computed from World Bank database.
imports and India figures in the top ten both as anexporter of financial services with a share of 2.4 percent and an importer with a share of 6.7 per cent(see Table 14.6). In general, the foregoing distributionof economic activities and trade has a bearing onwhere nations stand in terms of their position onvarious issues that get discussed in majoreconomies global forums.
Table 14.6 : Top 10 Exporters and Importersof Financial Services in 2010 and theirShares
Exporters Importers
EU (27) 53.0 EU(27) 60.0
US 23.6 US 15.6
Switzerland 6.4 India 6.7
Hong Kong 5.1 Canada 3.6
Singapore 4.9 Hong Kong 3.5
Japan 1.5 Japan 3.1
India 2.4 Singapore 2.3
Canada 1.3 Switzerland 1.7
Korea 1.2 Brazil 1.7
Norway 0.6 Russia 1.7
Top 10 100.0 Top 10 100.0
Source : World Trade Organization (WTO).
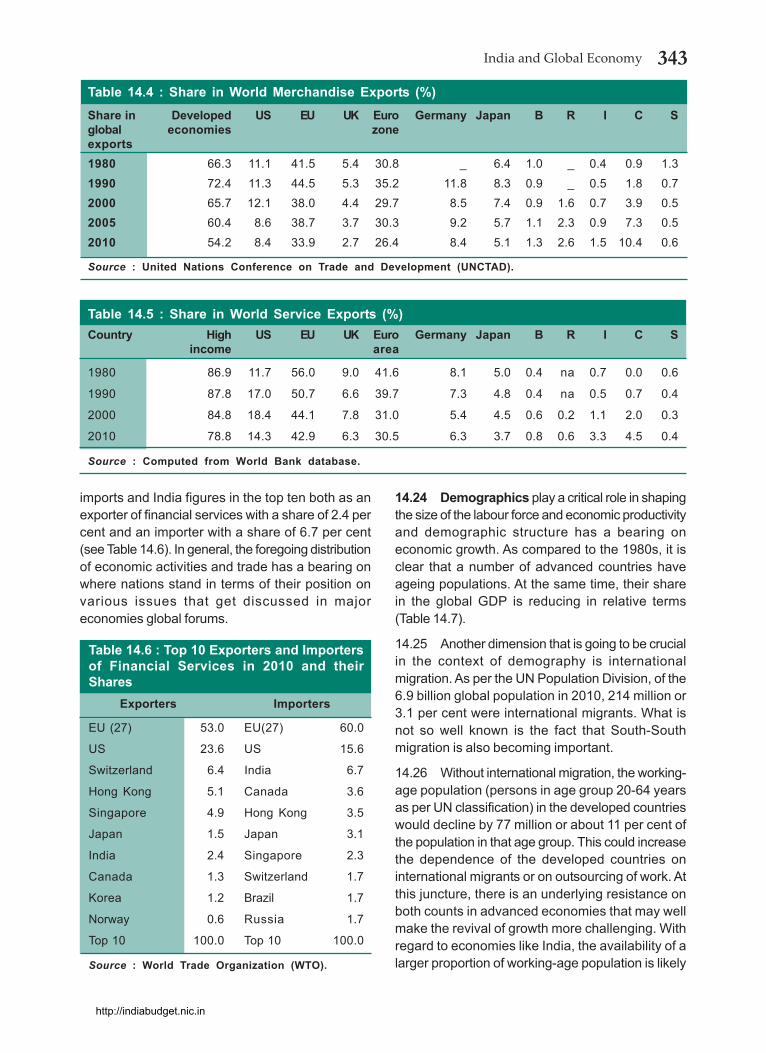
14.24 Demographics play a critical role in shapingthe size of the labour force and economic productivityand demographic structure has a bearing oneconomic growth. As compared to the 1980s, it isclear that a number of advanced countries haveageing populations. At the same time, their sharein the global GDP is reducing in relative terms(Table 14.7).
14.25 Another dimension that is going to be crucialin the context of demography is internationalmigration. As per the UN Population Division, of the6.9 billion global population in 2010, 214 million or3.1 per cent were international migrants. What isnot so well known is the fact that South-Southmigration is also becoming important.
14.26 Without international migration, the working-age population (persons in age group 20-64 yearsas per UN classification) in the developed countrieswould decline by 77 million or about 11 per cent ofthe population in that age group. This could increasethe dependence of the developed countries oninternational migrants or on outsourcing of work. Atthis juncture, there is an underlying resistance onboth counts in advanced economies that may wellmake the revival of growth more challenging. Withregard to economies like India, the availability of alarger proportion of working-age population is likely
http://indiabudget.nic.in
344 Economic Survey 2011-12
Table 14.7 : Share of World Population
OECD US Europe UK Germany Japan B R I C S
1980 22.2 5.1 10.4 1.3 1.8 2.6 2.7 3.1 15.5 22.1 0.6
1990 20.2 4.7 9.0 1.1 1.5 2.3 2.8 2.8 16.1 21.5 0.7
2000 19.0 4.6 8.0 1.0 1.4 2.1 2.9 2.4 16.7 20.8 0.7
2005 18.5 4.6 7.6 0.9 1.3 2.0 2.9 2.2 16.9 20.2 0.7
2010 18.1 4.5 7.3 0.9 1.2 1.9 2.8 2.1 17.1 19.6 0.7
Total dependency ratio (ratio of population aged 0-14 and 65+ per 100 population 15-64)
WORLD US Europe UK Germany Japan B R I C S
1980 70.3 51.2 52.8 56.1 51.7 48.4 72.4 46.8 75.9 68.5 80.7
1990 63.8 52.0 49.7 53.2 44.7 43.4 65.6 49.6 71.7 51.4 72.8
2000 59.0 51.0 47.8 53.4 47.0 46.6 54.0 44.1 63.8 48.1 59.6
2005 55.0 48.9 46.6 51.3 49.9 50.7 51.0 40.5 59.1 41.7 55.8
2010 52.4 49.6 46.2 51.4 51.2 56.4 48.0 38.6 55.1 38.2 53.3
Old-age dependency ratio (ratio of population aged 65+ per 100 population 15-64)
WORLD US Europe UK Germany Japan B R I C S
1980 10.1 17.1 18.9 23.3 23.7 13.4 6.9 15.0 6.3 8.7 5.6
1990 10.2 19.0 19.1 24.1 21.5 17.1 7.4 15.3 6.5 9.0 5.5
2000 10.9 18.7 21.8 24.3 24.0 25.2 8.5 17.9 6.9 10.4 5.9
2005 11.3 18.4 23.3 24.2 28.6 29.9 9.5 19.3 7.3 10.7 6.4
2010 11.6 19.5 23.7 25.1 30.8 35.5 10.4 17.7 7.6 11.3 7.1
Source : United Nations Population Division, World Population Prospects 2010.
to play a central role in driving economic growth. Asthe dependency falls, opportunities for economicgrowth tend to rise, creating what is termed as a‘demographic dividend’.
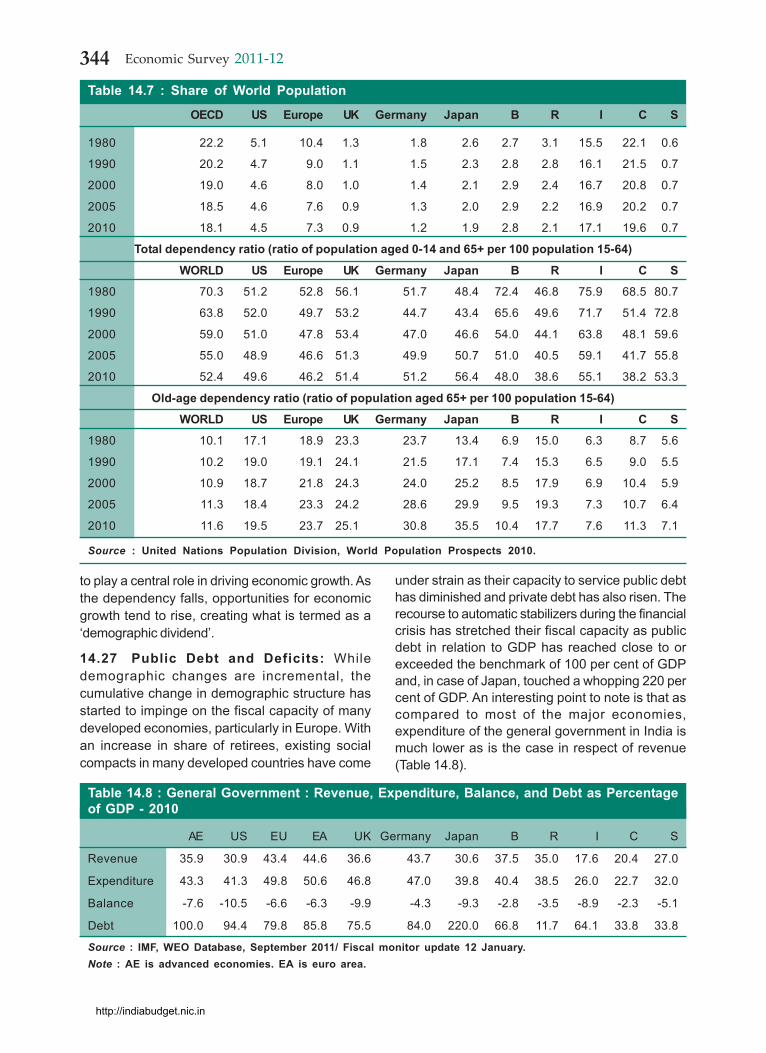
14.27 Public Debt and Deficits: Whiledemographic changes are incremental, thecumulative change in demographic structure hasstarted to impinge on the fiscal capacity of manydeveloped economies, particularly in Europe. Withan increase in share of retirees, existing socialcompacts in many developed countries have come
under strain as their capacity to service public debthas diminished and private debt has also risen. Therecourse to automatic stabilizers during the financialcrisis has stretched their fiscal capacity as publicdebt in relation to GDP has reached close to orexceeded the benchmark of 100 per cent of GDPand, in case of Japan, touched a whopping 220 percent of GDP. An interesting point to note is that ascompared to most of the major economies,expenditure of the general government in India ismuch lower as is the case in respect of revenue(Table 14.8).
Table 14.8 : General Government : Revenue, Expenditure, Balance, and Debt as Percentageof GDP - 2010
AE US EU EA UK Germany Japan B R I C S
Revenue 35.9 30.9 43.4 44.6 36.6 43.7 30.6 37.5 35.0 17.6 20.4 27.0
Expenditure 43.3 41.3 49.8 50.6 46.8 47.0 39.8 40.4 38.5 26.0 22.7 32.0
Balance -7.6 -10.5 -6.6 -6.3 -9.9 -4.3 -9.3 -2.8 -3.5 -8.9 -2.3 -5.1
Debt 100.0 94.4 79.8 85.8 75.5 84.0 220.0 66.8 11.7 64.1 33.8 33.8
Source : IMF, WEO Database, September 2011/ Fiscal monitor update 12 January.Note : AE is advanced economies. EA is euro area.
http://indiabudget.nic.in
345India and Global Economy
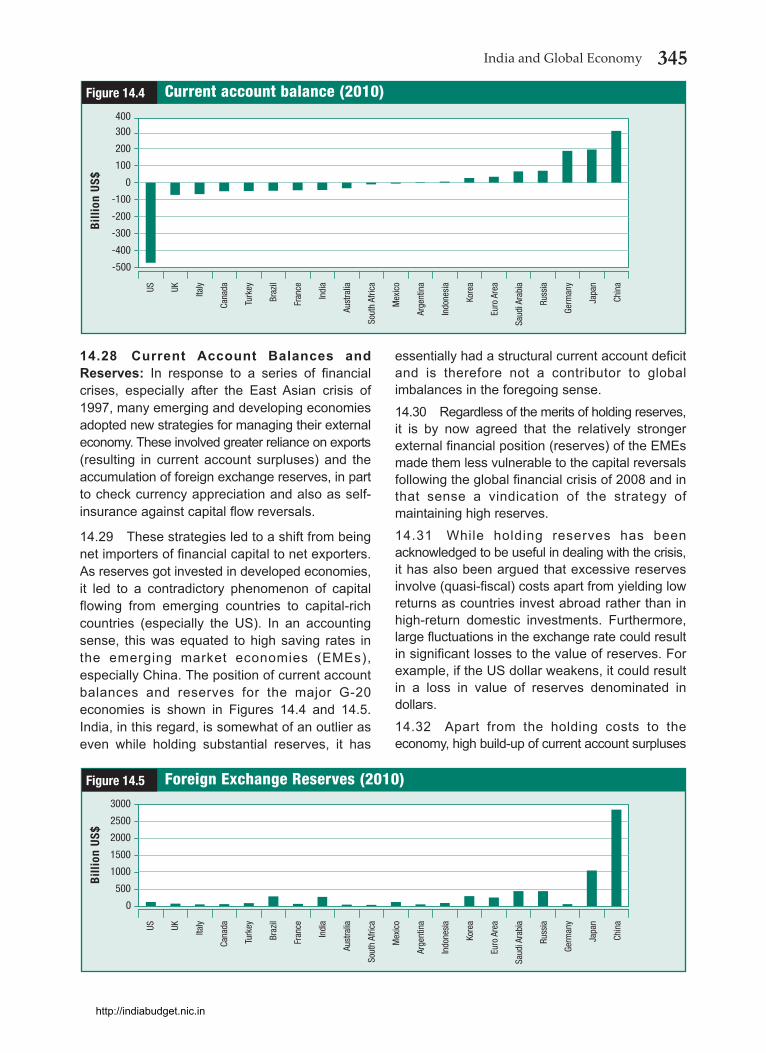
14.28 Current Account Balances andReserves: In response to a series of financialcrises, especially after the East Asian crisis of1997, many emerging and developing economiesadopted new strategies for managing their externaleconomy. These involved greater reliance on exports(resulting in current account surpluses) and theaccumulation of foreign exchange reserves, in partto check currency appreciation and also as self-insurance against capital flow reversals.
14.29 These strategies led to a shift from beingnet importers of financial capital to net exporters.As reserves got invested in developed economies,it led to a contradictory phenomenon of capitalflowing from emerging countries to capital-richcountries (especially the US). In an accountingsense, this was equated to high saving rates inthe emerging market economies (EMEs),especially China. The position of current accountbalances and reserves for the major G-20economies is shown in Figures 14.4 and 14.5.India, in this regard, is somewhat of an outlier aseven while holding substantial reserves, it has
essentially had a structural current account deficitand is therefore not a contributor to globalimbalances in the foregoing sense.
14.30 Regardless of the merits of holding reserves,it is by now agreed that the relatively strongerexternal financial position (reserves) of the EMEsmade them less vulnerable to the capital reversalsfollowing the global financial crisis of 2008 and inthat sense a vindication of the strategy ofmaintaining high reserves.
14.31 While holding reserves has beenacknowledged to be useful in dealing with the crisis,it has also been argued that excessive reservesinvolve (quasi-fiscal) costs apart from yielding lowreturns as countries invest abroad rather than inhigh-return domestic investments. Furthermore,large fluctuations in the exchange rate could resultin significant losses to the value of reserves. Forexample, if the US dollar weakens, it could resultin a loss in value of reserves denominated indollars.
14.32 Apart from the holding costs to theeconomy, high build-up of current account surpluses
-500
-300
-100
100
Figure 14.4B
illio
n US
$Current account balance (2010)
US UK Italy
Cana
da
Turk
ey
Braz
il
Fran
ce
Indi
a
Aust
ralia
Sout
h Af
rica
Mex
ico
Arge
ntin
a
Indo
nesi
a
Kore
a
Euro
Are
a
Saud
i Ara
bia
Russ
ia
Germ
any
Japa
n
Chin
a
300
-400
-200
0
200
400
0
1000
2000
3000
Figure 14.5
Bill
ion
US$
Foreign Exchange Reserves (2010)
US UK Italy
Cana
da
Turk
ey
Braz
il
Fran
ce
Indi
a
Aust
ralia
Sout
h Af
rica
Mex
ico
Arge
ntin
a
Indo
nesi
a
Kore
a
Euro
Are
a
Saud
i Ara
bia
Russ
ia
Germ
any
Japa
n
Chin
a
500
1500
2500
http://indiabudget.nic.in
346 Economic Survey 2011-12
and reserves has been seen as a major indicatorof global imbalances and potential source ofinstability in the international monetary system. Inthe global context, it has been argued that reserveaccumulation was an outcome of resisting currencyappreciation and an attempt to stimulate export-oriented production at the expense of domesticdemand. The reserve accumulation by keyemerging current account surplus economies,mostly held as dollar assets, supported a strongUS dollar in spite of a growing current accountdeficit in the US. By thwarting exchange rateadjustment, this practice has been contributing toglobal economic imbalances.
14.33 On the other hand, it has also been arguedthat the build-up of reserves is a consequence ofloose monetary policies followed by reservecurrency-issuing countries. Be that as it may, thefact remains that the issue of exchange ratemanagement, build-up of current account surplusesand of reserves cannot be viewed in isolation andthese issues are embedded in a wider ongoingdebate on the deficiencies of the internationalmonetary and financial system. For the present,the asymmetry in the balances in terms of currentaccount surplus and reserves is there for the globaleconomy to contend with.
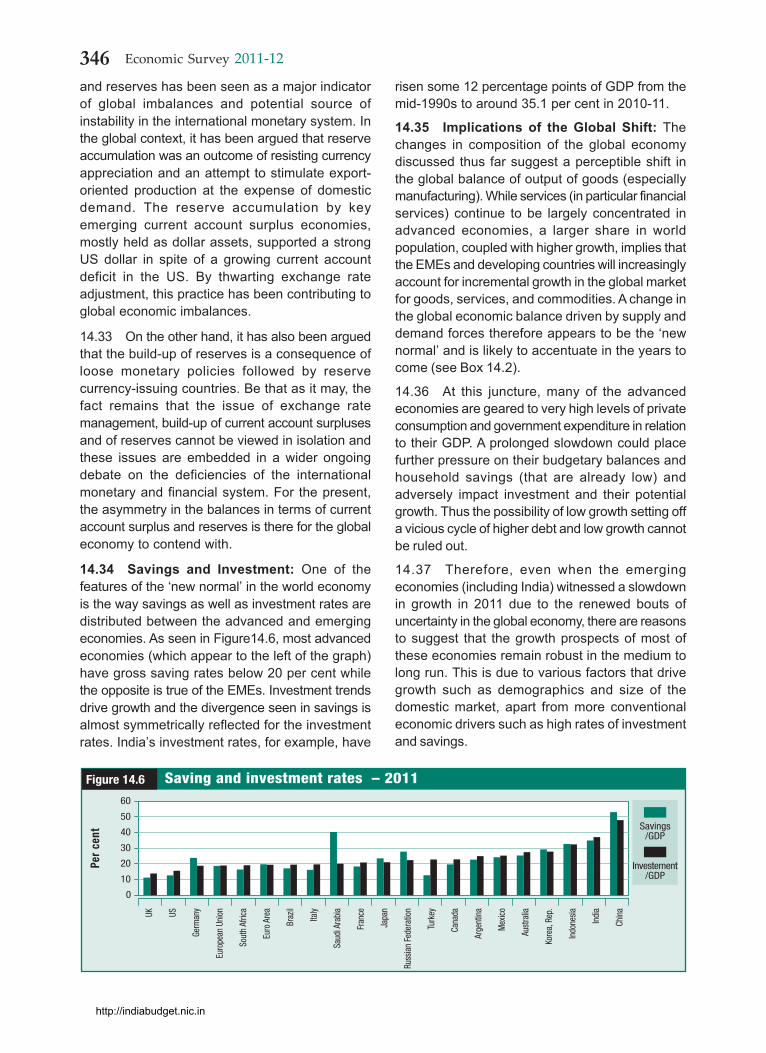
14.34 Savings and Investment: One of thefeatures of the ‘new normal’ in the world economyis the way savings as well as investment rates aredistributed between the advanced and emergingeconomies. As seen in Figure14.6, most advancedeconomies (which appear to the left of the graph)have gross saving rates below 20 per cent whilethe opposite is true of the EMEs. Investment trendsdrive growth and the divergence seen in savings isalmost symmetrically reflected for the investmentrates. India’s investment rates, for example, have
risen some 12 percentage points of GDP from themid-1990s to around 35.1 per cent in 2010-11.
14.35 Implications of the Global Shift: Thechanges in composition of the global economydiscussed thus far suggest a perceptible shift inthe global balance of output of goods (especiallymanufacturing). While services (in particular financialservices) continue to be largely concentrated inadvanced economies, a larger share in worldpopulation, coupled with higher growth, implies thatthe EMEs and developing countries will increasinglyaccount for incremental growth in the global marketfor goods, services, and commodities. A change inthe global economic balance driven by supply anddemand forces therefore appears to be the ‘newnormal’ and is likely to accentuate in the years tocome (see Box 14.2).
14.36 At this juncture, many of the advancedeconomies are geared to very high levels of privateconsumption and government expenditure in relationto their GDP. A prolonged slowdown could placefurther pressure on their budgetary balances andhousehold savings (that are already low) andadversely impact investment and their potentialgrowth. Thus the possibility of low growth setting offa vicious cycle of higher debt and low growth cannotbe ruled out.
14.37 Therefore, even when the emergingeconomies (including India) witnessed a slowdownin growth in 2011 due to the renewed bouts ofuncertainty in the global economy, there are reasonsto suggest that the growth prospects of most ofthese economies remain robust in the medium tolong run. This is due to various factors that drivegrowth such as demographics and size of thedomestic market, apart from more conventionaleconomic drivers such as high rates of investmentand savings.
0
20
40
60
Savings/GDP
Figure 14.6
Per
cent
Saving and investment rates – 2011
UK US
Germ
any
Euro
pean
Uni
on
Sout
h Af
rica
Euro
Are
a
Braz
il
Italy
Saud
i Ara
bia
Fran
ce
Japa
n
Russ
ian
Fede
ratio
n
Turk
ey
Cana
da
Arge
ntin
a
Mex
ico
Aust
ralia
Kore
a, R
ep.
Indo
nesia
Indi
a
Chin
a
10
30
50
Investement/GDP
http://indiabudget.nic.in
347India and Global Economy
Box 14.2 : Tectonic ShiftsWhen small economic crises crop up repeatedly over a relatively short period of time, policymakers in each country may treateach such episode as an independent event requiring independent action but, in reality, such ‘cluster crises’ may be a sign ofsome fundamental shift taking place in the global economy. Hence, faced with cluster crises, it is important to occasionallystep back and take a more holistic view of the situation. There has been some research trying to do precisely that.
At one level, it is not difficult to see what is happening. With rapid globalization since the end of World War II, goods andservices and also capital have begun moving much more freely across nations. In addition, and maybe even more importantly,the advance of IT has meant that it is possible for people with a modicum of skills to sit in one country and do work foranother country. In brief, one of the most precious resources for economic progress, namely skilled labour, which earlier satwalled in within the boundaries of their respective nations, has suddenly become available to needs arising in distant partsof the world.
What this has meant is that all emerging economies with a little ability to organize their workspace and impart skills to theirworkers are now capable of taking advantage of this windfall. As a consequence, the bottom end of the skilled-labourspectrum in the US and Europe is now coming under competition from the top end of the skilled labour band of India, China,the Philippines, Indonesia, and several other emerging economies. This has energized large corporations in rich and poorcountries and caused booms in various regions, like Silicon Valley in the United States. But this is also causing inequality torise in both industrialized nations and emerging economies.
In a recent paper, Spence [1] highlights how this process is one of the causes of growth and employment trends, within theUS economy, diverging and inequality rising. And ‘the major emerging economies are becoming more competitive in areas inwhich the U.S. economy has historically been dominant, such as the design and manufacture of semi-conductors,pharmaceuticals, and information technology services’. ([1], p. 29). By the same argument, the skilled end of the labourmarkets in India and China is competing with its counterparts in industrialized nations and, as a consequence, its salaries arerising, resulting in growing inequality in these countries.
There are other domains where these kinds of inter-country tensions have been building up. Disparities in savings rates acrossnations have often led to acrimonious debate and search for first cause. It has been suggested (see for instance [2]) thatChina’s huge savings rate may not be entirely because of domestic structural factors in China but a response to the fact thatthe savings rate in the U S dropped sharply between 1960 and 2010.
These adjustments give rise to economic turmoil and crisis and, in addition, are politically sensitive matters that can lead toprotectionism, which can do more harm than good. It is important for us to recognize that none of these structural shifts arecaused by the actions of any one individual or nation. Millions of little actions and thousands of scientific discoveries overdecades and human inventiveness in general have given rise to globalization and we have inherited the world we have. It isfor us to take the givens as given and use collective bodies such as the G-20 to ensure that we do not fall victim toprotectionism. It is important to remember that through all this turmoil the global pie is expanding. Hence, by havingeffective coordinated action, it is possible to convert what appears at first as adversity into advantage.
Source : [1] Spence, A. M. (2011), ‘The Impact of Globalization on Income and Employment: The Downside of IntegratingMarkets’, Foreign Affairs, vol. 90. [2] Zagha, R., ‘Global Imbalance: Policies, Structure and Finance’, in S. Kochhar (ed.)Policymaking for Indian Planning, New Delhi, Academic Foundation.
14.38 In 2011, out of 184 countries listed in theIMF’s WEO, there were only 26 with a population ofat least 10 million and growth rate of over 6 percent. Most, if not all, are the so called emergingmarkets. Quite understandably, the dim view aboutthe growth prospects of advanced economies hasput the spotlight on emerging and developingeconomies as the new growth drivers of the globaleconomy.
14.39 The underlying shift in global economicsetting raises the question as to whether futurechanges in the world economy would unravel in asmooth manner, or be disruptive. Needless to sayIndia, even while carefully responding to theimmediate economic challenges emanating fromdomestic and global sources, will also have to craftand calibrate its policies keeping both outcomes inview.
http://indiabudget.nic.in
348 Economic Survey 2011-12
14.40 As for the present, the global situation ismarked by volatility in world financial markets,uncertain growth in the advanced economies, andpossible disruptions in supplies of energy apart fromother geopolitical tensions. There is contradictionbetween the short-term need for growth andmaintaining demand and the need for fiscalconsolidation that marks the current policyenvironment. But even as the world economy, threeyears after the global financial crisis of 2008,continues to move from one uncertainty to another,there have been continuing efforts in multilateral forasuch as the G-20 to bring about greaterunderstanding and coordination in dealing with globalimbalances and addressing the weaknesses thatmight have led to the global crisis, to arrive atmeasures to revive global growth. Before turning tothis it is however, worth while locating India in theglobal economy.
LOCATING INDIA IN THE NEWGLOBAL ECONOMY
14.41 India has over the years become a moreopen economy. The total share of imports andexports accounts for close to 50 per cent of GDPwhile that of capital inflows and outflows measuresup to 54 per cent of GDP. Yet economic outcomesand their impact on growth and development arisingfrom the interaction between the domestic andexternal economies are contingent on a large numberof factors. Though economic outcomes are to someextent contingent on choosing policies appropriateto the conditions characterizing an economy, therelative position of an economy vis-à-vis othercountries in a global setting could facilitate (or evenconstrain) policy choices. This section flags a fewfeatures that characterize India that may be relevantin its further engagement with the global economyas also for its future development.
14.42 India has moved up the Ranks but is stillthe poorest among the G-20: India has emergedas the fourth largest economy globally with a highgrowth rate and has also improved its global rankingin terms of per capita income (as mentioned earlier).Yet the fact remains that its per capita incomecontinues to be quite low (at current US $ 1527 in2011). Addressing this is perhaps the most visiblechallenge. Nevertheless, India has a diverse set offactors, domestic as well as external, that coulddrive growth well into the future.
14.43 Demographics: With over 1.2 billionpeople, India accounts for nearly one-sixth of globalpopulation. While the rate of growth of populationhas consistently declined, India’s populationincreased by nearly 180 million persons during2001-11 (the highest in the world in absolute terms).However, India is also passing through a phasewhen its dependency ratio will decline from anestimated 74.8 in 2001 to 55.6 in 2026 with acorresponding increase in the share of persons inworking-age group. With labour being a key factorof production, a demographic dividend is a clearpositive for growth. It has, however, been pointedout that much of the growth in population will occurin states that are currently poor. Therefore, for thisdividend to accrue, it will be necessary to buildhuman capital in adequate measure.
14.44 On this count, India has shown someimprovement in terms of its human developmentindex (HDI). The UNDP’s HDI, which captures theprogress of a country in terms of economicindicators as well as education and healthindicators increased from 0.344 in 1980 to 0.547in 2011. India moved up from a rank of 82 in 1980to 72 in 2011 (in a group of 100 countries for whichHDI is available for these points of time. Eventhough India’s score has improved, her HDI rankhas not moved very significantly. A possible reasoncould be that some other countries may haveregistered faster improvement in these indices.India therefore needs to benchmark herachievements (on various fronts) not only inabsolute terms but also in relation to othercountries.
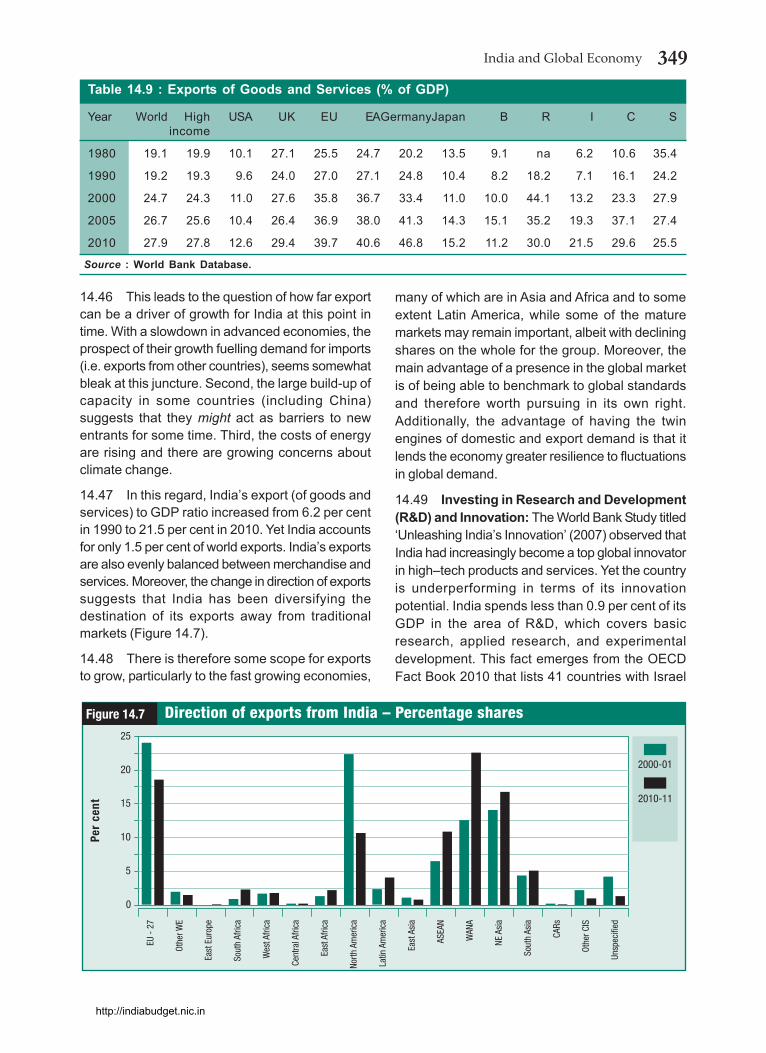
14.45 Exports and External Demand: Theprocess of globalization has been marked by arising share of exports (as also imports) thatreached 27.9 per cent for the world as a whole in2010, with some countries showing much higherdependence of exports. A stylized fact of the socalled East Asian miracle economies was that anexport-led, investment-fuelled strategy propelledgrowth and helped them acquire manufacturingcapabilities. This strategy was supported by afavourable exchange rate, cheap credit, andrelatively low wages which helped to gaincompetitive advantage. Global demand for goods,particularly in the advanced markets, lent supportto this growth strategy. As a result, theseeconomies moved up the value chain inmanufacturing (Table 14.9).
http://indiabudget.nic.in
349India and Global Economy
14.46 This leads to the question of how far exportcan be a driver of growth for India at this point intime. With a slowdown in advanced economies, theprospect of their growth fuelling demand for imports(i.e. exports from other countries), seems somewhatbleak at this juncture. Second, the large build-up ofcapacity in some countries (including China)suggests that they might act as barriers to newentrants for some time. Third, the costs of energyare rising and there are growing concerns aboutclimate change.
14.47 In this regard, India’s export (of goods andservices) to GDP ratio increased from 6.2 per centin 1990 to 21.5 per cent in 2010. Yet India accountsfor only 1.5 per cent of world exports. India’s exportsare also evenly balanced between merchandise andservices. Moreover, the change in direction of exportssuggests that India has been diversifying thedestination of its exports away from traditionalmarkets (Figure 14.7).
14.48 There is therefore some scope for exportsto grow, particularly to the fast growing economies,
many of which are in Asia and Africa and to someextent Latin America, while some of the maturemarkets may remain important, albeit with decliningshares on the whole for the group. Moreover, themain advantage of a presence in the global marketis of being able to benchmark to global standardsand therefore worth pursuing in its own right.Additionally, the advantage of having the twinengines of domestic and export demand is that itlends the economy greater resilience to fluctuationsin global demand.
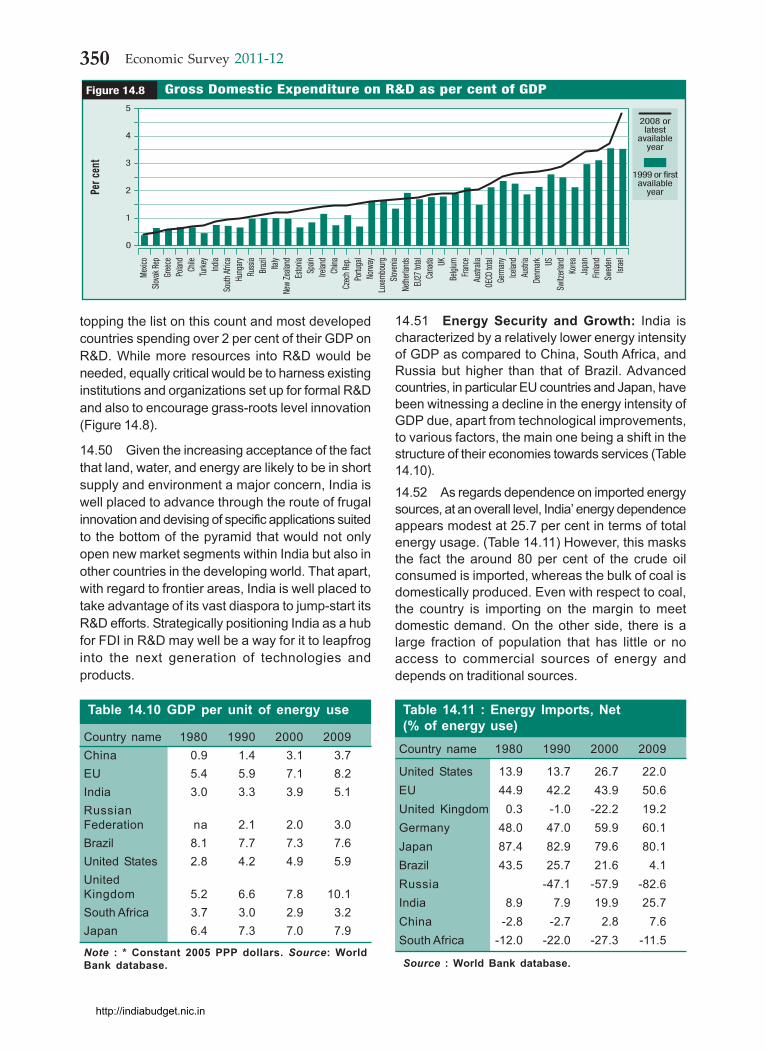
14.49 Investing in Research and Development(R&D) and Innovation: The World Bank Study titled‘Unleashing India’s Innovation’ (2007) observed thatIndia had increasingly become a top global innovatorin high–tech products and services. Yet the countryis underperforming in terms of its innovationpotential. India spends less than 0.9 per cent of itsGDP in the area of R&D, which covers basicresearch, applied research, and experimentaldevelopment. This fact emerges from the OECDFact Book 2010 that lists 41 countries with Israel
0
5
10
15
2000-01
Figure 14.7
2010-11
Per
cent
Direction of exports from India – Percentage shares
EU -
27
Othe
r WE
East
Eur
ope
Sout
h Af
rica
Wes
t Afri
ca
Cent
ral A
frica
East
Afri
ca
North
Am
eric
a
Latin
Am
eric
a
East
Asi
a
ASEA
N
WAN
A
NE A
sia
Sout
h As
ia
CARs
Othe
r CIS
Unsp
ecifi
ed
20
25
Table 14.9 : Exports of Goods and Services (% of GDP)
Year World High USA UK EU EAGermanyJapan B R I C Sincome
1980 19.1 19.9 10.1 27.1 25.5 24.7 20.2 13.5 9.1 na 6.2 10.6 35.4
1990 19.2 19.3 9.6 24.0 27.0 27.1 24.8 10.4 8.2 18.2 7.1 16.1 24.2
2000 24.7 24.3 11.0 27.6 35.8 36.7 33.4 11.0 10.0 44.1 13.2 23.3 27.9
2005 26.7 25.6 10.4 26.4 36.9 38.0 41.3 14.3 15.1 35.2 19.3 37.1 27.4
2010 27.9 27.8 12.6 29.4 39.7 40.6 46.8 15.2 11.2 30.0 21.5 29.6 25.5
Source : World Bank Database.
http://indiabudget.nic.in
350 Economic Survey 2011-12
topping the list on this count and most developedcountries spending over 2 per cent of their GDP onR&D. While more resources into R&D would beneeded, equally critical would be to harness existinginstitutions and organizations set up for formal R&Dand also to encourage grass-roots level innovation(Figure 14.8).
14.50 Given the increasing acceptance of the factthat land, water, and energy are likely to be in shortsupply and environment a major concern, India iswell placed to advance through the route of frugalinnovation and devising of specific applications suitedto the bottom of the pyramid that would not onlyopen new market segments within India but also inother countries in the developing world. That apart,with regard to frontier areas, India is well placed totake advantage of its vast diaspora to jump-start itsR&D efforts. Strategically positioning India as a hubfor FDI in R&D may well be a way for it to leapfroginto the next generation of technologies andproducts.
14.51 Energy Security and Growth: India ischaracterized by a relatively lower energy intensityof GDP as compared to China, South Africa, andRussia but higher than that of Brazil. Advancedcountries, in particular EU countries and Japan, havebeen witnessing a decline in the energy intensity ofGDP due, apart from technological improvements,to various factors, the main one being a shift in thestructure of their economies towards services (Table14.10).14.52 As regards dependence on imported energysources, at an overall level, India’ energy dependenceappears modest at 25.7 per cent in terms of totalenergy usage. (Table 14.11) However, this masksthe fact the around 80 per cent of the crude oilconsumed is imported, whereas the bulk of coal isdomestically produced. Even with respect to coal,the country is importing on the margin to meetdomestic demand. On the other side, there is alarge fraction of population that has little or noaccess to commercial sources of energy anddepends on traditional sources.
0
1
2
31999 or first
availableyear
Figure 14.8Pe
r cen
tGross Domestic Expenditure on R&D as per cent of GDP
Mexic
oSlo
vakR
epGr
eece
Polan
dCh
ileTu
rkey
India
Sout
hAfri
caHu
ngar
yRu
ssia
Braz
ilIta
lyNe
wZe
aland
Eston
iaSp
ainIre
land
China
Czec
hRep
.Po
rtuga
lNo
rway
Luxe
mbo
urg
Slove
niaNe
ther
lands
EU27
total
Cana
da UKBe
lgium
Fran
ceAu
strali
aOE
CDtot
alGe
rman
yIce
land
Austr
iaDe
nmar
k USSw
itzer
land
Kore
aJa
pan
Finlan
dSw
eden
Israe
l
4
5
2008 orlatest
availableyear
Table 14.10 GDP per unit of energy use
Country name 1980 1990 2000 2009China 0.9 1.4 3.1 3.7EU 5.4 5.9 7.1 8.2India 3.0 3.3 3.9 5.1RussianFederation na 2.1 2.0 3.0Brazil 8.1 7.7 7.3 7.6United States 2.8 4.2 4.9 5.9UnitedKingdom 5.2 6.6 7.8 10.1South Africa 3.7 3.0 2.9 3.2Japan 6.4 7.3 7.0 7.9
Note : * Constant 2005 PPP dollars. Source: WorldBank database.
Table 14.11 : Energy Imports, Net(% of energy use)
Country name 1980 1990 2000 2009
United States 13.9 13.7 26.7 22.0EU 44.9 42.2 43.9 50.6United Kingdom 0.3 -1.0 -22.2 19.2Germany 48.0 47.0 59.9 60.1Japan 87.4 82.9 79.6 80.1Brazil 43.5 25.7 21.6 4.1Russia -47.1 -57.9 -82.6India 8.9 7.9 19.9 25.7China -2.8 -2.7 2.8 7.6South Africa -12.0 -22.0 -27.3 -11.5
Source : World Bank database.
http://indiabudget.nic.in
351India and Global Economy
14.53 A rise in the price of oil in internationalmarkets has mostly been a source of vulnerabilityfor the macroeconomy of India on account of itsimpact on the current account deficit. Highinternational prices of fossil fuels also result in ahigher import bill, which either gets passed on tothe consumers or results in higher subsidy therebyaffecting fiscal health. That apart, the growingtensions in many oil- producing economies are asource of vulnerability for the energy security of India.In this one area, the strategic advantage for Indiawould lie in diversifying its energy sources.
14.54 Food Security: Food security in the Indiancontext would imply meeting minimum energy andprotein norms along with requisite micro-nutrientsfor all at affordable prices. With the increase inincome, the demand for food in India is bound tofurther rise. It has also been observed that evenmarginal shortages in specific food items in Indiatend to have a disproportionately large impact onthe relevant prices even in the international market.Even though India, for most food products, is not animporter in most years, dependence on globalmarkets could imply greater vulnerability both interms of prices and availability. The link betweenfinancialization of commodities and its impact oncommodity prices and their volatility has been anissue of international concern, even though therehas been no clear consensus on the cause-effectrelationship.
14.55 Resources for Development and theAvailability of Capital: A case is often made forthe virtues of a minimalist state and the need todisengage from a number of activities. The actualfacts speak otherwise. India’s general governmentexpenditure in relation to GDP is actually lower evenin comparison to many market economies by a factorof at least half. More importantly, the ratio of generalgovernment revenues to GDP at 17.6 per cent (referto Table 14.8 ) is one of the lowest in emergingeconomies and certainly very low vis-à-vis theadvanced economies. Therefore, even if fiscalconsolidation is needed, the priority has to be onraising resources. Recent developments in thedeveloped economies reveal how important it is tomaintain the revenue base and keep governmentfinances in shape. As India becomes more exposedto the external economy, its fiscal strength basedon a large revenue base would become even morecritical.
14.56 FDI—Playing Strategically: Many of theadvanced economies, with deep technologicalstrengths, are now aging societies and need to investoverseas and rely on factor incomes. At the stageat which India is placed, the need for sustainedinvestment has already been stressed elsewhere inthe survey. There is an inherent complementaryrelationship between India’s requirement for more‘real’ investment and the need for some of theadvanced economies, including some of the Asianindustrialized economies, to invest in productionfacilities in friendly countries overseas in order todiversify their supply chains.
14.57 Remittances are an important source offinancial flows and, as per World Bank estimates,remittance flows into developing countries in 2011were to the tune of US $ 351 billion. Remittanceflows into India are estimated to be of the order ofUS $ 58 billion. In 2010, remittances into the countryaccounted for 3 per cent of GDP. One of the reasonsfor such high inflows could be higher oil prices thathelped the Gulf countries and other oil exporters,where a large number of Indian workers areemployed. The depreciation of the Indian rupee inthe latter half of 2011 might also have helped.
14.58 An Economy in a DemocraticFramework: The global economic crisis openedafresh the debate on the relative role of the marketand the state as also the relative advantages ofdemocratic vis-à-vis state-led economies. Thechallenge of managing a mixed economy within ademocratic and federal system is a complex task.However, the challenge of transiting from a state-led monolith to a more representative system maybe even more daunting. In either case, for a systemto thrive, economic outcomes need to be tangible.The critical question is therefore not of state versusmarkets but, rather, of how to maximize marketoutcomes (minimize market failures) and haveeffective governance (i.e. minimize governmentfailure) with a democratic system as the politicalbasis for governance.
14.59 As already discussed, India enjoys at thisjuncture the unique advantage of having multipledrivers of growth—demographic, investment(backed by domestic savings), domesticconsumption, as well as exports and ample scopefor FDI – all within a pluralistic and democraticsystem. This unique combination more or lessassures it of strong and sustained growth with the
http://indiabudget.nic.in
352 Economic Survey 2011-12
caveat that at every stage and for every section ofsociety, positive economic outcomes in a tangibleway will be required.
REVIVING THE GLOBAL ECONOMY
14.60 The explanations for the global financialcrisis (that reached a flash point in October 2008with the collapse of Lehman Brothers) have been allencompassing. At macro level, they have held theloose monetary policies adopted by reservecurrency-issuing advanced economies (particularlythe US) in the run up to the crisis responsible onthe one side and the mercantilist policies adoptedby export-led economies leading to accumulationof large current account surpluses and reserves onthe other. These policies were facilitated byweaknesses in the international monetary system(IMS), particularly the absence of alternative reserveassets to the dollar. Weak regulation of financialmarkets and intermediaries and excessive financialinnovation and risk taking by finance and bankingintermediaries at micro level have also figured asproximate causes of the crisis.
14.61 The debates and discussions in the G 20(and other fora involving international organizationsand financial institutions) have therefore been onwide-ranging issues. The question of how policiesfor reviving growth of individual countries impinge onthe global economy and its imbalances and whetherthey could somehow be better coordinated has beenat the centre of these discussions. Thesediscussions are of some importance as they may,in the years to come, shape the style andsubstance of governance of the global economy. Itis critical that the outcomes, if any, address theconcerns of emerging economies (such as India)that are major drivers of global economic growth.
14.62 The following section therefore examinesonly a few selected issues that have been the subjectof international deliberations (mainly in the G 20)and how they are relevant to India. However, thiswould not necessarily present a formal view of theproceedings or the official stand of India on specificissues, many of which are still evolving.
14.63 The G-20 in 2011: The G-20, formed in 1999in the aftermath of the East Asian Crisis as a forumfor Finance Ministers and central bank Governors,came to centrestage following the Leaders’ Summitin Washington DC in November 2008. It focused on
coordinated measures to address the challengesfaced in the immediate aftermath of the globalfinancial crisis. A declaration in the G-20 Summit atPittsburgh, USA, in 2009 formally raised the forumto the level of leaders and transformed it into thepremier forum for international economiccooperation.
14.64 The agenda for the latest (sixth) summit heldat Cannes, France, on 3-4 November 2011 followedthe priorities laid out by the French Presidency. Thisagenda got deliberated in 2011 in two channels. Thefirst was the finance channel, which largely focusedon the framework for strong, sustainable andbalanced growth, reform of the International MonetarySystem (IMS), strengthening financial regulation,and other issues relating to commodity pricevolatility. The second set of issues in the Sherpa’schannel focused on development-related issues.
14.65 The Framework Exercise: During theglobal financial crisis, collective and coordinatedpolicy action by the G-20 through macroeconomicstimulus (fiscal and monetary) and financial-sectorintervention helped avoid a catastrophic meltdown.Building on this, G-20 Leaders launched the‘Framework for Strong, Sustainable, and BalancedGrowth’ with India and Canada as the co-chairs ofthe Working Group in 2009. In this signature effortof the G-20, the Mutual Assessment Process (MAP)forms a medium-term exercise to ensure thatcollective policy actions benefit all and policies arecollectively consistent with the G-20’s growthobjectives.
14.66 At the 2010 summit in Seoul, the G-20committed to working to address key imbalancesthat could jeopardize growth and to enhance theMAP with indicative guidelines for key imbalances.In February 2011, the G-20 agreed to include i) publicdebt and fiscal deficits, ii) private saving and privatedebt, and iii) the external position—trade balanceand net investment income flows and transfers—asthe key indicators for assessing external and internalimbalances. Subsequently, it was agreed that theindicative guidelines would be used to identifysystemically important countries and assess eachother’s economic policies, suggest policy remedies,address potentially destabilizing imbalances, andset the stage for assessing the progress towardexternal sustainability.
14.67 In this regard, measured in terms of sharein global GDP, India has been identified as
http://indiabudget.nic.in
353India and Global Economy
systemically important economy. But it is clearly anet contributor to global demand as evidenced fromits current account deficit. While India’s exchangerate is largely market determined, its domesticsavings are largely oriented to financing domesticinvestment appropriate at a stage of high growthbut not at the cost of curbing consumption. Even ifIndia is not a contributor to global imbalances, itsinterest clearly lies in smooth resolution of theseissues and towards measures that could help reviveglobal growth.
14.68 Reform of the International MonetarySystem: It has been argued that the IMS has nomechanism to prevent a build-up of imbalances onthe external account and the burden of adjustmentfalls on deficit nations. In the run up to the crisis of2008, it was felt that countries like the US couldsomehow sustain fiscal and current account deficitsby virtue of the privilege of issuing a reservecurrency. But this trend instead accentuated the socalled external imbalances, even if it was not theprimary cause of the crisis that turned global.
14.69 The French Presidency constituted a G 20Working group on reform of the IMS which focused,among others, on capital flows and theirmanagement (CFM), the measurement of globalliquidity, holding of international reserves, and futurerole and composition of the special drawing rights(SDR). While the latter two issues remain areas ofcontinuing work, drawing on the work of the IMSgroup, the Cannes Summit communiqué mentionsthat the ‘Coherent Conclusions for the Managementof Capital Flows’ would guide the G-20 in order toreap the benefits of financial globalization, whilepreventing and managing risks that could underminefinancial stability and sustainable growth at nationaland global levels.
14.70 The issue of volatility in capital flows hasbeen of concern for several emerging markets(including India). The management of capital flowsis tempered by two considerations. First, achallenge, common to most developing countriesand EMEs at this juncture, arises from theuncertainties in global capital flows and monetarypolicies pursued in advanced countries. Emergingmarkets face sudden stops or reversals (witnessedin December of 2011) for reasons not necessarilylinked to developments in their own economies butto serious difficulties faced by financial institutionsin advanced economies. Quantitative easing
pursued by monetary authorities in advancedcountries (while understandable in the context ofliquidity needed to repair adverse private and publicbalance sheets) is a relatively new phenomenon thathas altered the composition of capital flows and madetheir management by recipients more difficult.
14.71 The second consideration arises from India’sspecific situation. Notwithstanding the stability ofIndia’s balance of payments after an episode in 1991,India’s current account deficit has widened over thelast year. The dependence on private capital inflowsto finance the same has widened. It is by now knownthat the burden of adjustment in the current IMSfalls predominantly on non-reserve-issuing currentaccount deficit countries (like India). On that count,the Indian economy has moved towards greateropenness to capital flows, albeit following a cautiousand calibrated approach keeping both domestic andinternational factors and risks in view and throughjudicious use of multiple instruments.
14.72 In view of the shift in external vulnerabilityindicators and India’s currently high dependence onimported oil, there is need to reinforce managementof the capital account (which has served India well)and also encourage more stable capital flows ratherthan short-term flows. Countries like India may wellneed to rely on a matrix of choices comprisingmacroeconomic and macro prudential tools andother measures as policy instruments without beingbound by a prescribed sequence. Under thecircumstances, the fact that the ‘CoherentConclusions on Management of Capital Flows’ (asendorsed by the G-20) are ‘non-binding’ needs tobe taken note of.
14.73 An issue related to trends in global liquidityis dealing with the build-up of international reservesby some countries. It has been argued that theaccumulation of reserves has negative externalitiesand also entails avoidable costs to the holdingcountries. The issue is when the holding of reservescan be deemed excessive or rather what the optimallevel could be, if any, and whether some kind of‘reserve metrics’ could be adopted. While the optimalsize and the utility of using reserves to intervene incurrency markets may be debatable, the experience,especially in the case of economies like India, hasbeen that reserves have helped graduate to a moreopen economy and smoothen investment andconsumption during periods of external uncertaintiescaused by extraneous factors. In this context, a
http://indiabudget.nic.in
354 Economic Survey 2011-12
distinction needs to be drawn between holding ofreserves by countries running a current accountdeficit (such as India) and reserves accumulated bycountries with persistent current account surplusesin addition to large sovereign wealth funds. A relatedset of issues on which deliberations have been goingon in the G 20 concern strengthening of globalfinancial safety nets, cooperation between the IMFand Regional Financial Agreements to help countriesdeal with exogenous shocks (and accessemergency assistance) and the adequacy of IMF’sresources to play systemic role for the benefit of itswhole membership.
14.74 Financial Regulation: The Group of 7 (G-7) countries along with a few more advancedeconomies with large financial sectors were the mostimportant participants in a grouping that establishedthe Basel Committee on Banking Supervision 1974,whose primary function was to act as a forum forcoordination of supervision of the financial sector,particularly large banks, in these economies. In thewake of the major 2007-9 global financial crisis, themost severe since the 1930s, the effectiveness offinancial regulation was called into question. Sincethen, quite significant reforms of financial regulationhave taken place both within countries andinternationally in terms of international regulatorystandards and organizations.
14.75 Financial Regulation Reforms: In general,regulating financial markets and intermediaries andstriking a balance between the need for maintainingfinancial stability and good market conduct withoutstifling innovation have always been a challenge.The global crisis brought home the inherent difficultyin doing that especially where financial institutionshave had cross-border operations and exposures.This was because, with financial globalization, manybanks and other financial market participants hadcross-border operations but were mostly subject tonational regulations.
14.76 The weaknesses in financial regulation (apartfrom global imbalances) were perceived as a majorcause of the global crisis. The Cannes Summitcommuniqué 2011 reiterated the commitment thatfinancial markets, products, and participants beregulated or subject to oversight appropriate to theircircumstances in an internationally consistent andnon-discriminatory way. The declaration spells outthe initiatives taken that include the regulation ofbanks, over-the-counter (OTC) derivatives,
compensation practices, and credit-rating agencies.The Cannes action plan commits to taking theseinitiatives further based on the work done by theBank of International Settlements (BIS) and theFinancial Stability Board (FSB) on new standardsfor financial regulation.
14.77 The commitment to implementing the BaselIII standards for banks is of particular significanceto the global economy. The implementation ofBasel III capital and liquidity standards starts in2013 with full implementation envisaged by 2019.Tomake sure that no financial firm is ‘too big to fail’and taxpayers do not bear the costs of resolution,the FSB framework comprising new internationalstandards for resolution, supervision, cross-bordercooperation, recovery, and resolution planning from2016 was endorsed. The FSB has also publishedan initial list of Globally Systemically ImportantFinancial Institutions (G-SIFI) and a five-prongedwork plan to develop guidelines on shadow banking.In order to prevent excessive risk taking anddiscourage excessive pay and bonuses, the FSBhas developed principles and standards oncompensation.
14.78 India is a member of the Basel Committeeon Banking Supervision (BCBS) and FSB and isactively participating in post crisis reforms of theinternational regulatory and supervisory framework.The Indian financial sector is well regulated andIndia remains committed to adopting internationalstandards and best practices calibrated to itsconditions. As such, banks in India are wellcapitalized and it is expected that the Basel IIInorms are unlikely to put undue pressure on thebanking system on aggregate. India had even earlierimplemented some countercyclical policies likeprovisioning norms and differential risk weights (forexample for the real estate sector, capital markets,and personal loans) to control build-up of risks evenbefore these were internationally proposed.
14.79 There are, however, some caveats on theimplementation of the emerging regulatory standardsacross countries. Given that the financial sector inmany countries has its specificities, and there islikely to be resistance to change from several marketparticipants, it is yet to be seen whether all thesereforms will get carried out in all the countries andnot diluted. While all G-20 countries have committedto implementing Basel III, major jurisdictions haveseparately come out with their own regulatory
http://indiabudget.nic.in
355India and Global Economy
standards: the Dodd Frank Act in the United Statesand the Vickers Commission recommendations inthe United Kingdom (see Box 14.3) with the EU toohaving its own rules. A concern that arises is that ifsame standards are not implemented in alljurisdictions simultaneously, there could be scopefor regulatory arbitrage that could result in financialactivity migrating to less-regulated jurisdictions, aswell as into shadow banking. In the short run, thereare also concerns that tightening of regulatorystandards, even while recovery in advancedeconomies from the past and continuing crisis isnot over, may make banks risk averse and adverselyimpact financial intermediation and lending to thereal sector.
14.80 Development Issues: The G-20Development Agenda comprised a Multi-Year Action
Plan based on nine pillars announced at the SeoulSummit, of which the French Presidency focusedon infrastructure and food security for the CannesSummit. The other pillars are human resourcedevelopment; trade; private investment and jobcreation; financial inclusion; growth with resilience;knowledge sharing; and domestic resourcemobilization. Many of these issues have been inthe subject domain of a number of developmentalagencies.
14.81 While India has assigned high priority toissues relating to development appropriate tocountry-specific conditions, an issue deservingpriority is of recycling global savings for infrastructureinvestment. Enhancing infrastructure investment inemerging economies and developing countries wouldhave positive implications for rebalancing global
Box 14.3 : Financial Regulation: New initiatives – the US and UKUS—The Dodd-Frank Act: The financial crisis of 2007–10 led to calls for changes in the regulatory system. In June 2009, aproposal for a ‘sweeping overhaul of the financial regulatory system’ was introduced in the US that culminated in alegislation called The Wall Street Reform and Consumer Protection Act (also called the Dodd-Frank Act) in July 2010. Thisis a voluminous and overarching Act (1601 sections) with provisions for comprehensive regulation of financial markets(including the derivatives markets), consolidation of regulatory agencies, and establishing of a new oversight council calledthe ‘Financial Stability Oversight Council’ to evaluate systemic risk. The provisions also aim to address the ‘too big to bailout’ problem and bring in the requirement of large complex financial companies submitting plans for their orderly shutdown.The intent is that the cost arising from liquidation of large interconnected financial companies will not fall on the taxpayers.The Act incorporates what has been termed the ‘Volcker rule’, whereby depository banks would be prohibited from proprietarytrading (similar to the prohibition of combined investment and commercial banking in the Glass–Steagall Act). The Actincludes improved standards for regulation of hedge funds and credit-rating agencies, improved accounting standards,investor protection, and norms of executive compensation. As suggested in the title of the Act, it has provisions for consumerprotection reforms and the establishment of a new consumer protection bureau and also a new Office of Minority andWomen Inclusion as Federal banking and securities regulatory agencies.
UK—Vickers Commission report: The Independent Commission on Banking under Sir John Vickers submitted its report tothe UK government in September 2011. The report starts with the argument that one of the main reasons for bank failureduring the global crisis was that they had too little equity in relation to risk. There were few restrictions on leverage. Theweights assigned in the ‘risk-weighted’ assets turned out unreliable. The erosion of equity led to concerns of solvency andcontagion. Though risks in banking have to rest somewhere, they should not fall on the taxpayer. Structural separation andRing fencing: The main recommendation is that there should be a structural separation between retail banking and wholesale/investment banking. There should be a ring fence to isolate banking activities where continuous provision of service is vital tothe economy and to bank customers. Domestic retail banking should be inside the ring fence. Services should not be providedfrom within the ring fence if they are not integral to the provision of payments services to customers in the European economicarea. Banks with both retail and investment activities will need to keep these activities at arm’s length but they could shareinformation, infrastructure, etc. Structural separation would help sustain the UK’s position as a pre-eminent internationalfinancial centre, while UK banking is made more resilient.Loss absorbency: The report is in broad agreement with the directionof Basel III but notes that it does not go far enough since the leverage cap is too lax for systemically important banks and hasrecommended that retail banks should have equity capital of at least 10 per cent of risk- weighted assets. The Commissionhas also recommended the introduction of a redirection service for personal and Small and Medium Enterprises (SME)current accounts which, among other things, would transfers accounts within seven working days.
Note: The text in the box is aimed at giving only a very brief overview of these documents and is neither exhaustive nor aninterpretation.
http://indiabudget.nic.in
356 Economic Survey 2011-12
demand as also for reviving and sustaining growth.At the same time, high savings would find productiveuse.
14.82 The Cannes Summit: By November 2011,just before the G-20 Summit in Cannes, the globaleconomy found itself in a difficult phase withweakened recovery and intensifying financialstability risks. The eurozone sovereign debt crisiscame to loom large just before the G-20deliberations. Problems in relatively smalleconomies (like Greece) had got transmitted tothe global financial markets resulting in a flight tosafety. The resolution of the eurozone crisis thatsimmered through 2011 came to occupy centrestage in the global economic agenda, even thoughthe G-20, as such, did not have a direct role in thematter. Also reflecting the lack of growth and highunemployment, ‘growth and jobs’ came to be thefocus of the Cannes Action Plan
14.83 The Cannes Action Plan for Growth andJobs: The Action Plan announced at the Summitreiterated the leaders’ commitment to the spirit ofmultilateral cooperation that lies at the heart ofthe MAP. Key policy actions outlined included near-term actions of expeditiously implementingmeasures announced by euro-zone leaders on 26October 2011. The G-20 also committed to takingsignificant strides towards a more stable andresilient IMS and agreed to continue strengtheningfinancial regulation. Under medium-term policyimperatives, the G-20 leaders endorsed policyactions by members that aim to correct imbalancesover the medium term and ensure progress towardstrong, sustainable, and balanced growth. Theyalso committed to working with greater resolve onpressing social issues, including highunemployment and inadequate social safety nets.The Cannes Action Plan also stresses on the needfor further efforts to support capacity building andchannelling of surplus savings for growth-enhancinginvestments in developing countries, includinginfrastructure development and welcomed therecommendations of the High Level Panel oninfrastructure set up by the G 20.
14.84 G-20 Agenda in 2012: Mexico has sincetaken over presidency of the G-20 after the CannesSummit and released a strategic vision of the G-20 agenda spelling out the following priorities.
1) Economic stabilization and structural reformsas foundation of growth and employment.
2) Strengthening the financial system andfostering financial inclusion to promotegrowth.
3) Improving the international financialarchitecture in an interconnected world.
4) Enhancing food security and addressingcommodity price volatility.
5) Promoting sustainable development andgreen growth in the fight against climatechange.
14.85 Role of Finance in Development: Whileon one side global forums like the G-20 andinternational regulatory bodies continued todeliberate on issues relating to financial regulation,the year 2011 was also marked by rising concernacross the world that ‘finance’ had somehow gotde-linked from serving the interests of the realeconomy and that various regulatory andcompensation practices are out of sync with theneeds of the rest of the economy.
14.86 The issue of compensation in the financialsector has been a major area of debate not justin the G-20 but also in the media in general.Similarly, the issue of financialization ofcommodities and speculation leading to volatilityin commodity prices and the idea of implementinga tax on financial transactions have beencontentious issues on which no clear consensushas emerged. Of late, an area of concern evenamong serious academic researchers has beenwhether the financial sector has become just toobig in some advanced economies and whetherits value addition is really genuine and correctlymeasured.
14.87 Regardless of whether these views andperceptions are correct or misplaced, thesedebates and the ongoing work need to be takennote of in policy. Fortunately, the Indian financialsector and its banks have thus far been wellregulated and to ensure that it serves the realsector has been an abiding policy concern.Nevertheless, given the criticality of the role offinance in development, the Indian regulatorysystem would also need to maintain andstrengthen its vigil to ensure that growth in thefinancial sector and the intermediation processgo towards furthering economic development andfinancial inclusion.
http://indiabudget.nic.in
357India and Global Economy
ENGAGING THE WORLD
14.88 A recently published book notes that Indiahas entered a ‘critical decade’. It has emerged as alarge and systemically important economy on theglobal stage. It enjoys the unique advantage of havingmany economic indicators in its favour, particularlya large domestic market, robust investment-to-GDPratio, and demographic advantage. However, all ofthese will need to be leveraged to get the fulladvantage out of them. Undoubtedly this requiresIndia to address its internal challenges, whichinclude the long-standing problem of poverty andthe development of its social and physicalinfrastructure.
14.89 Given its size and its profile in the globaleconomy, India will inevitably need to play an active
role at global level, not just in debates about how toresolve the continuing crisis and prevent therecurrence of similar crises in the future, but ininfluencing the rules for the global economy onoverarching macroeconomic issues such as trade,capital flows, financial regulation, climate change,and governance of global financial institutions.
14.90 It may be argued, and in some ways it mayseem the easy option, that India should take apassive stance in the current global debate and justwait out the period of crisis. But that option is nolonger realistically feasible. India is already too mucha part of the global economy and polity;developments in the world will affect India deeplyand what India does will affect the world. There is,therefore, a need for India to engage with the worldin terms of action and ideas.
http://indiabudget.nic.in