Embed Size (px)
Citation preview
December 12, 2016
MEMORANDUM TO: The Honorable John R. Kasich, GovernorThe Honorable Mary Taylor, Lt. Governor
FROM: Timothy S. Keen, Director
SUBJECT: Monthly Financial Report
ECONOMIC SUMMARY
Economic Performance OverviewThird-quarter economic growth was revised upward to 3.2%, following 1.0% growthduring the previous three quarters.U.S. employment increased by 178,000 jobs in November for a 3-month average of176,000 jobs. The unemployment rate decreased 0.3 points to 4.6% – a new low forthe expansion.Ohio nonfarm payroll employment decreased by 2,800 jobs in October, and is up21,200 jobs since last December. The unemployment rate increased 0.1 points to4.9%.Leading indicators point toward continued U.S. growth at a modest pace, fueled by ahealthy household sector but restrained by weak manufacturing.In the wake of the strong dollar and weak manufacturing sector, Ohio’s economy hashit a rough patch. Growth has been slowing throughout calendar year 2016 and taxrevenue growth – particularly sales and income – has slowed as a result.
Economic Growth
Real GDP growth in the third quarter was revised up to3.2% – the best since the third quarter of 2014. Theacceleration in activity marked a significant change fromthe growth rate of 1.4% in the second quarter and only1.0% on average during the previous three quarters.Compared with a year earlier, real GDP was higher by1.6%.
The increase in third-quarter real GDP primarilyreflected positive contributions from personalconsumption expenditures, exports, private inventoryinvestment, and federal government spending. Thesefactors together lifted GDP by 3.7%. Residential fixedinvestment and state and local government spending 1716151413
6
4
2
0
-2
Source: Survey of Professional Forecasters
Real GDPPercent Change, Annual Rate
Bars: 1-QtrLines: 4-Qtr
- 2 -
subtracted from growth. Imports, which are automatically included in these individual categoriesand then subtracted as a separate category, increased. Those three categories combinedsubtracted 0.6% from GDP growth.
The acceleration during the third quarter from 1.4% growth to 3.2% growth reflected anupswing in inventory investment, faster growth in exports, an upturn in federal governmentspending, and smaller decreases in state and local government spending and residential fixedinvestment. Acting in the opposite direction were slower growth in personal consumptionexpenditures, a pickup in imports, and a slowdown in nonresidential fixed investment.
Forecasters project economic growth of 2% to 2.5% or so during the fourth quarter. For example,the GDPNow projection by the Federal Reserve Bank of Atlanta was 2.6% as of December 6,while similar estimates from other sources are tracking closer to 2%. The Blue Chip consensus,which is an average of forecasts from a group of professional forecasters, is 2.3%, with a rangeof 1.8% to 2.8% from the average of the lowest ten to the highest ten. The median projection forfourth-quarter real GDP growth from the November 14 Survey of Professional Forecasters,conducted by the Philadelphia Federal Reserve Bank,was 2.2%.
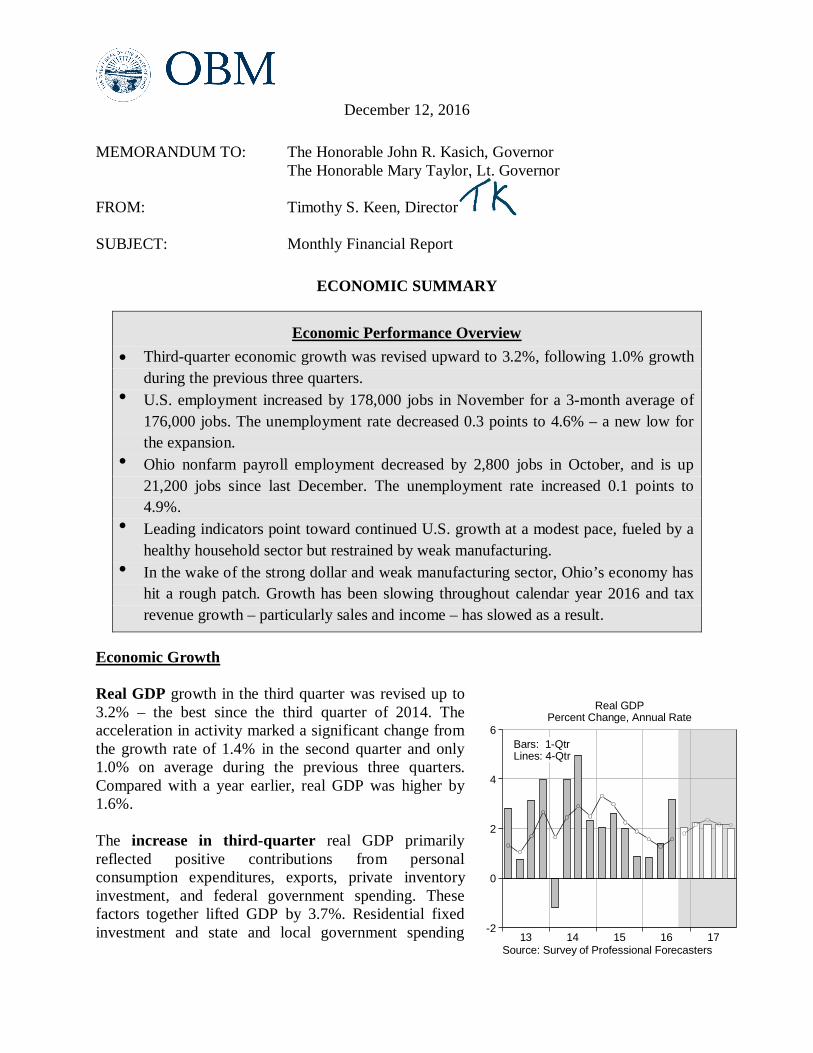
Business activity in and around Ohio grew slightlyfrom early October through mid-November, accordingto a regular survey of businesses conducted by theFederal Reserve Bank of Cleveland. In contrast, theOhio coincident economic index compiled by thePhiladelphia Federal Reserve decreased 0.1% inOctober after a marginal retreat in September – theweakest two-month showing since the beginning ofthe expansion in 2009. The year-over-year rate ofchange fell to 2.2%, which is the slowest since 2010.The index is composed of four labor market indicatorsand has represented business conditions accuratelyover time.
National leading economic indicators improved in October and remain consistent with amoderate pace of growth into early next year. The Leading Economic Index (LEI) from theConference Board increased 0.1%, as six of the ten components made positive contributions. Theinterest rate spread made the largest contribution, followed closely by the average length of theworkweek of private sector production workers.
Compared with a year earlier, the LEI was up 1.1% – down from 1.5% the month before but upfrom the expansion-low of 0.7% reached last June. In contrast, the rate of change in the indexregularly has turned negative in advance of recessions in the past. The recent lull appears to berelated to manufacturing activity, which has been negatively affected by the strengthening of thedollar since 2011, weaker demand growth overseas, and the sharp pullback in the energyindustry. Strength in labor markets and benefits from lower energy costs have continued tosupport consumer income and spending.
2016201520142013
0.60
0.40
0.20
0.00
-0.20
Source: Philadelphia Federal Reserve
Ohio Coincident Economic Index1-Month Percent Change
- 3 -
The message from state-level coincident andleading composite indexes improved in October totheir best since May. This is a key positivedevelopment, because deterioration in recentmonths had begun to approach that of pastinflection points. The Coincident Economic Index(CEI) declined for only five states and the priormonth number was revised down from eleven tonine. The number of states with declining CEIs hasbeen notably higher prior to each of the most recentfive recessions.
The improvement in state coincident indexes wasalso reflected in the diffusion of state leadingindexes. The Leading Economic Index (LEI) forfive states declined in October, and the prior monthnumber was revised down from ten to seven. Incontrast, the number of states with negative LEIs has reached fourteen on average three monthsbefore the last three recessions and twenty-three on average during the initial month of recession.
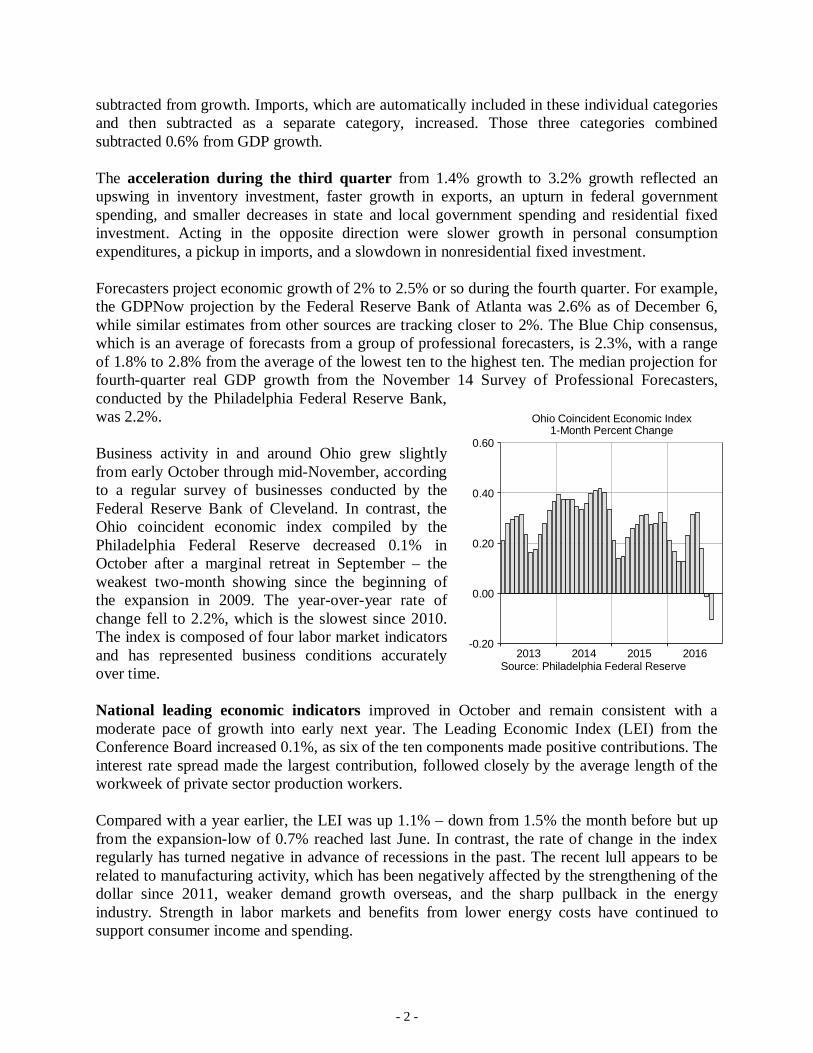
Closer to home, the Ohio Leading Economic Index from the Philadelphia Federal Reserve wasnegative in August, September, and October. The index is designed to predict the rate of changein the coincident index during the next six months, but can be volatile from month to month andis often revised significantly. The trio of negative Ohio readings was the first since 2009, whenthe national economy was emerging from recession.
Employment
U.S. nonfarm payrolls increased by 178,000 jobs in November, and the two previous month’schanges were revised upward by a net 2,000 jobs. Growth averaged 176,000 jobs in the mostrecent three months, down from 233,000 per month during the previous three-month period.During the most recent twelve months, job growth has averaged 188,000 per month – a pace thathas been strong enough to push the unemployment rate lower.
Employment increases were led by professional and business services (+63,000), health care(+28,000), government (+22,000), and construction (+19,000). The rise in constructionemployment was the third notable increase in a row after a lull from spring through mid-summer.Employment declined in information (-10,000), retail (-8,000), and manufacturing (-4,000). Thedecline in manufacturing employment was the fourth in a row. Mining employment increased by2,000 jobs in November, but is essentially unchanged during the most recent three months after anearly two-year slide linked to the decrease in the price of oil.
The unemployment rate decreased by a statistically significant 0.3 points to 4.6%, its lowestlevel since well before the 2007-09 recession, in May 2007. With the exception of a one-monthdip to 4.7% in May 2016, the unemployment rate had been within 0.1 point of 5.0% sinceAugust 2015.
16151413121110090807
6
4
2
0
-2
-4
-6
-8
Source: Philadelphia Federal Reserve Bank
Ohio Leading Economic IndexProjected 6-Month Rate of Change, %
- 4 -
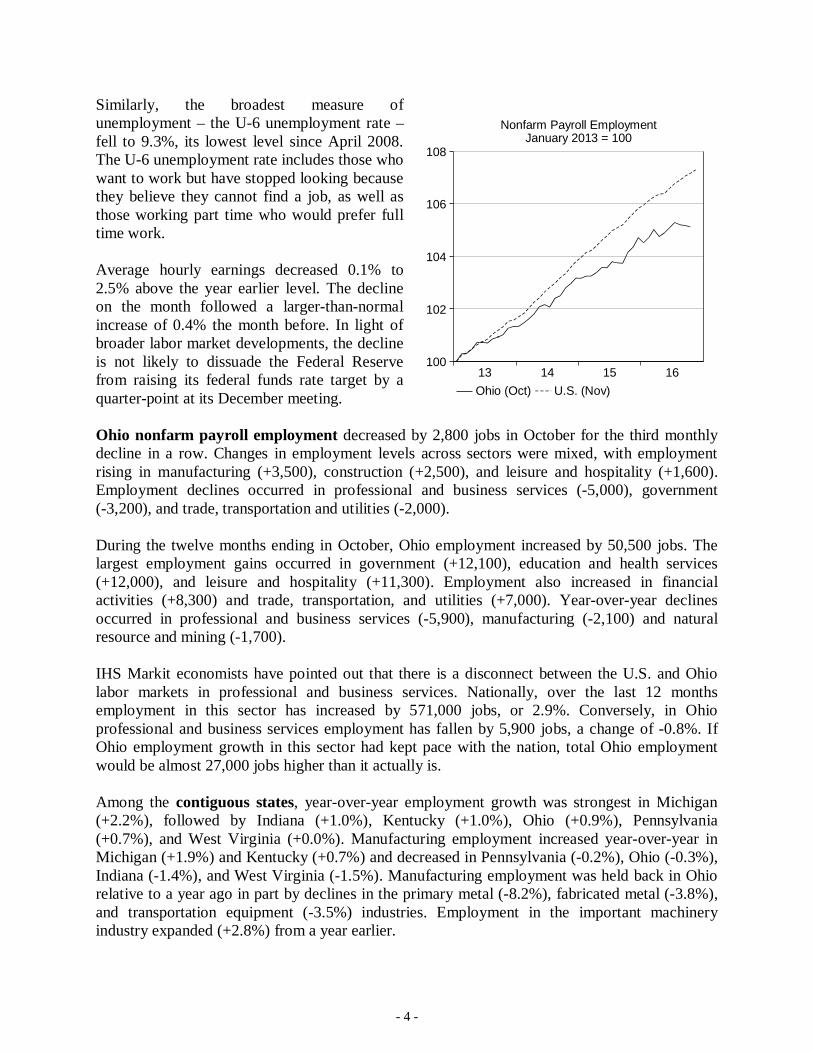
Similarly, the broadest measure ofunemployment – the U-6 unemployment rate –fell to 9.3%, its lowest level since April 2008.The U-6 unemployment rate includes those whowant to work but have stopped looking becausethey believe they cannot find a job, as well asthose working part time who would prefer fulltime work.
Average hourly earnings decreased 0.1% to2.5% above the year earlier level. The declineon the month followed a larger-than-normalincrease of 0.4% the month before. In light ofbroader labor market developments, the declineis not likely to dissuade the Federal Reservefrom raising its federal funds rate target by aquarter-point at its December meeting.
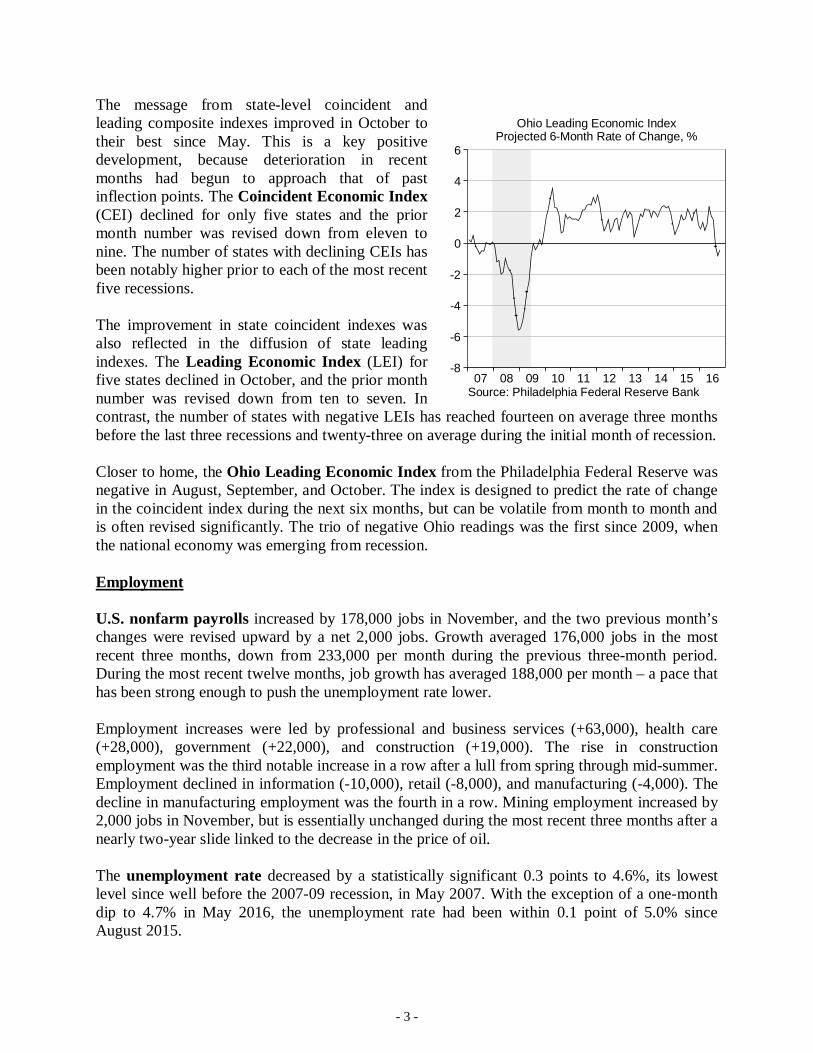
Ohio nonfarm payroll employment decreased by 2,800 jobs in October for the third monthlydecline in a row. Changes in employment levels across sectors were mixed, with employmentrising in manufacturing (+3,500), construction (+2,500), and leisure and hospitality (+1,600).Employment declines occurred in professional and business services (-5,000), government(-3,200), and trade, transportation and utilities (-2,000).
During the twelve months ending in October, Ohio employment increased by 50,500 jobs. Thelargest employment gains occurred in government (+12,100), education and health services(+12,000), and leisure and hospitality (+11,300). Employment also increased in financialactivities (+8,300) and trade, transportation, and utilities (+7,000). Year-over-year declinesoccurred in professional and business services (-5,900), manufacturing (-2,100) and naturalresource and mining (-1,700).
IHS Markit economists have pointed out that there is a disconnect between the U.S. and Ohiolabor markets in professional and business services. Nationally, over the last 12 monthsemployment in this sector has increased by 571,000 jobs, or 2.9%. Conversely, in Ohioprofessional and business services employment has fallen by 5,900 jobs, a change of -0.8%. IfOhio employment growth in this sector had kept pace with the nation, total Ohio employmentwould be almost 27,000 jobs higher than it actually is.
Among the contiguous states, year-over-year employment growth was strongest in Michigan(+2.2%), followed by Indiana (+1.0%), Kentucky (+1.0%), Ohio (+0.9%), Pennsylvania(+0.7%), and West Virginia (+0.0%). Manufacturing employment increased year-over-year inMichigan (+1.9%) and Kentucky (+0.7%) and decreased in Pennsylvania (-0.2%), Ohio (-0.3%),Indiana (-1.4%), and West Virginia (-1.5%). Manufacturing employment was held back in Ohiorelative to a year ago in part by declines in the primary metal (-8.2%), fabricated metal (-3.8%),and transportation equipment (-3.5%) industries. Employment in the important machineryindustry expanded (+2.8%) from a year earlier.
16151413
108
106
104
102
100
Nonfarm Payroll EmploymentJanuary 2013 = 100
Ohio (Oct) U.S. (Nov)
- 5 -
The Ohio unemployment rate increased 0.1 percentage point to 4.9%, but remained below5.0% for the fourth straight month. The rate is up 0.3 points from the cyclical low of 4.6%reached in September 2015. The increase during that period resulted from a larger increase in theOhio labor force (+42,000) than in total employment (+27,300). The unemployment rate hasmoved in a narrow range since the end of 2014.
Across the country in September, the unemployment rate decreased by a statistically significantamount in seven states, increased in two states, and was not statistically different from the monthbefore in the other states. The unemployment rate was lower than a year earlier by a statisticallysignificant margin in seven states and meaningfully higher in five states, including neighboringPennsylvania.
Consumer Income and Consumption
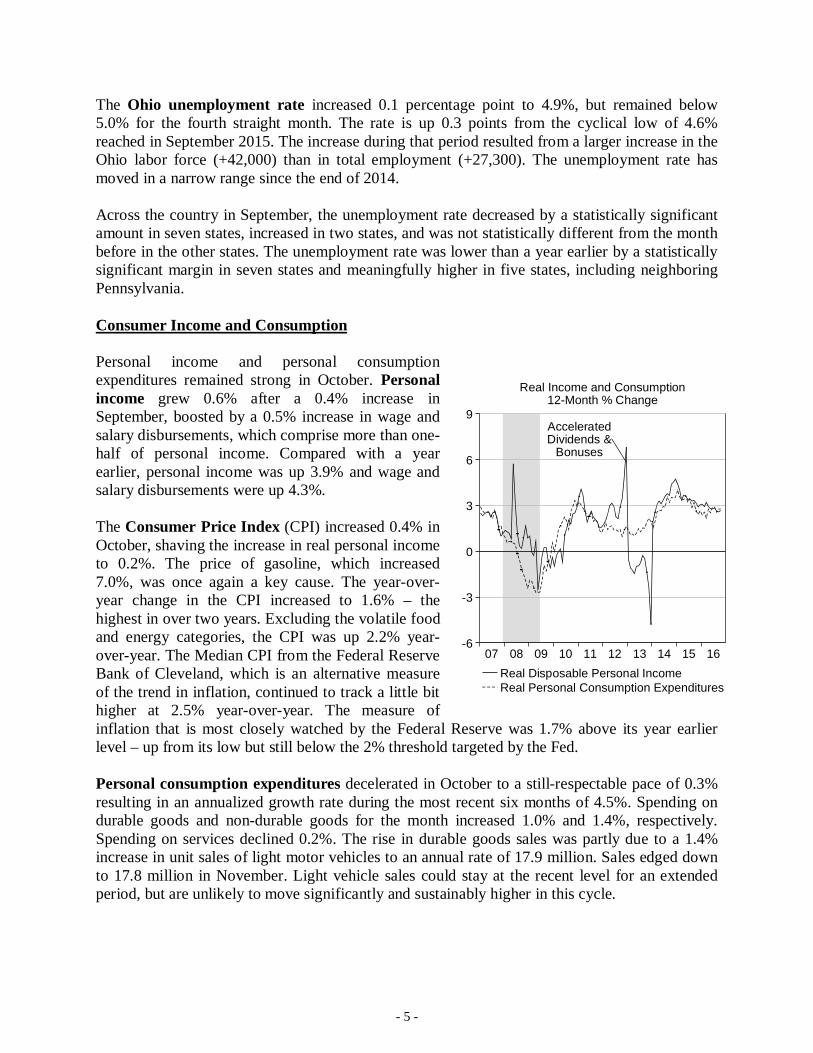
Personal income and personal consumptionexpenditures remained strong in October. Personalincome grew 0.6% after a 0.4% increase inSeptember, boosted by a 0.5% increase in wage andsalary disbursements, which comprise more than one-half of personal income. Compared with a yearearlier, personal income was up 3.9% and wage andsalary disbursements were up 4.3%.
The Consumer Price Index (CPI) increased 0.4% inOctober, shaving the increase in real personal incometo 0.2%. The price of gasoline, which increased7.0%, was once again a key cause. The year-over-year change in the CPI increased to 1.6% – thehighest in over two years. Excluding the volatile foodand energy categories, the CPI was up 2.2% year-over-year. The Median CPI from the Federal ReserveBank of Cleveland, which is an alternative measureof the trend in inflation, continued to track a little bithigher at 2.5% year-over-year. The measure ofinflation that is most closely watched by the Federal Reserve was 1.7% above its year earlierlevel – up from its low but still below the 2% threshold targeted by the Fed.
Personal consumption expenditures decelerated in October to a still-respectable pace of 0.3%resulting in an annualized growth rate during the most recent six months of 4.5%. Spending ondurable goods and non-durable goods for the month increased 1.0% and 1.4%, respectively.Spending on services declined 0.2%. The rise in durable goods sales was partly due to a 1.4%increase in unit sales of light motor vehicles to an annual rate of 17.9 million. Sales edged downto 17.8 million in November. Light vehicle sales could stay at the recent level for an extendedperiod, but are unlikely to move significantly and sustainably higher in this cycle.
16151413121110090807
9
6
3
0
-3
-6
Real Income and Consumption12-Month % Change
AcceleratedDividends &
Bonuses
Real Disposable Personal IncomeReal Personal Consumption Expenditures
- 6 -
Consumer attitudes improved markedly in November. Consumer confidence jumped 6.3%,according to the Conference Board, due to better assessments of both the current and futureconditions. The overall index was the highest since July 2007 and was 16.7% above the averageduring economic expansions during the last half-century. The University of Michigan/Reutersindex also improved, reflecting brighter assessments of both current and future conditions.
Manufacturing
Continuing the pattern in place for more than a year, industrial activity remained weak inOctober. Industrial production increased just 0.2% for the second month in a row after a 0.5%decline in August. The index was still slightly below its year earlier level. Mining outputincreased 2.1% – its best showing since October 2011 – but remained 7.0% below its year earlierlevel. Manufacturing production increased 0.1% for the second month in a row but was lower by0.9% from a year ago.
The industrial sector continues to be affected by the ongoing headwinds from the strengtheningof the dollar since 2011 – including a renewed increase since August – and the fallout from thebig decline in the price of oil. The dollar has appreciated an additional 7% since August, nearlyback to its peak early in the year, putting renewed pressure on exports. The price of oil recentlyrallied substantially to a new high for the year on expected output cuts by OPEC but remains atapproximately one-half of its level a couple of years ago.
Among industries of special importance to Ohio, primary metals production increased 1.6%,while production of fabricated metal products increased 0.6% and output of machinery inchedhigher by 0.1%. All were lower than a year earlier despite these increases. Production of motorvehicles and parts increased 0.9% to 5.0% above its year earlier level.
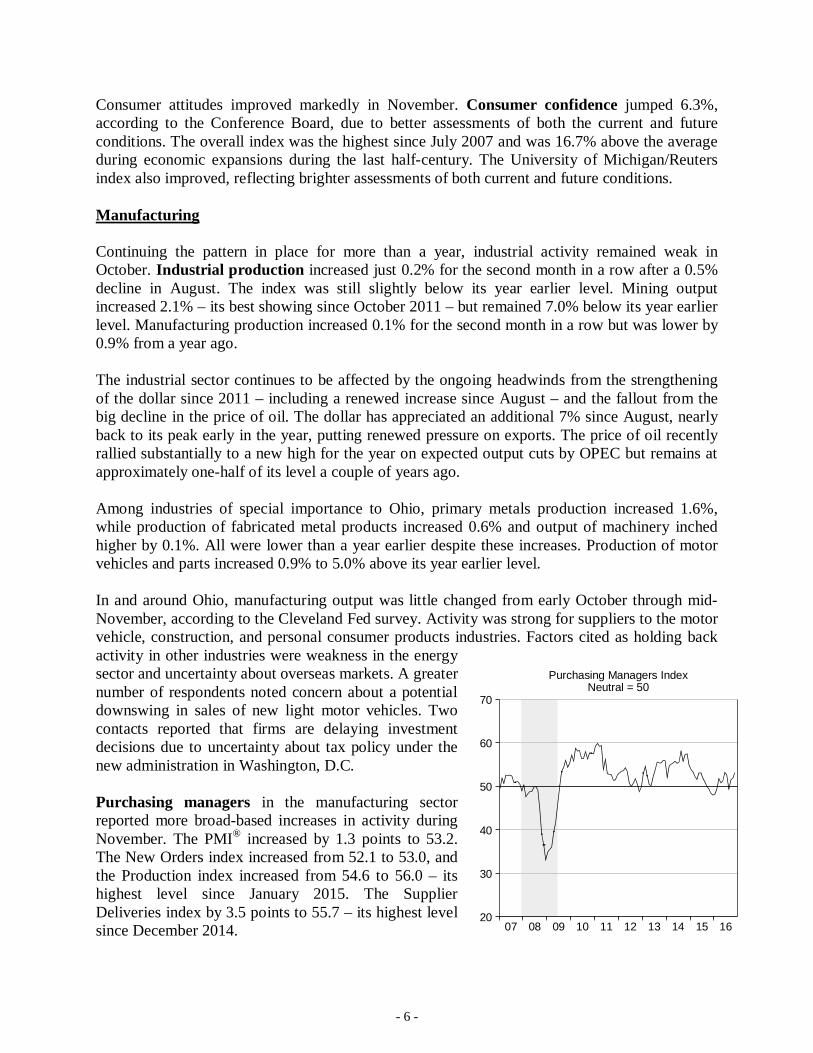
In and around Ohio, manufacturing output was little changed from early October through mid-November, according to the Cleveland Fed survey. Activity was strong for suppliers to the motorvehicle, construction, and personal consumer products industries. Factors cited as holding backactivity in other industries were weakness in the energysector and uncertainty about overseas markets. A greaternumber of respondents noted concern about a potentialdownswing in sales of new light motor vehicles. Twocontacts reported that firms are delaying investmentdecisions due to uncertainty about tax policy under thenew administration in Washington, D.C.
Purchasing managers in the manufacturing sectorreported more broad-based increases in activity duringNovember. The PMI® increased by 1.3 points to 53.2.The New Orders index increased from 52.1 to 53.0, andthe Production index increased from 54.6 to 56.0 – itshighest level since January 2015. The SupplierDeliveries index by 3.5 points to 55.7 – its highest levelsince December 2014. 16151413121110090807
70
60
50
40
30
20
Purchasing Managers IndexNeutral = 50
- 7 -
Of the eighteen industries tracked by the Manufacturing ISM® Report on Business, elevenreported growth in the latest month. Among the industries with a disproportionate effect on Ohiomanufacturing employment, machinery, primary metals, and fabricated metal products reportedexpansion in November, whereas the transportation equipment industry reported contraction.One respondent in the primary metals industry reported that 2017 business levels “look prettyconsistent compared to 2016,” while one in the fabricated metal products industry said, “2017 islooking to be a very busy year.” A respondent in the machinery industry noted that “companiesare adding additional production space,” with positive implications for hiring.
Construction
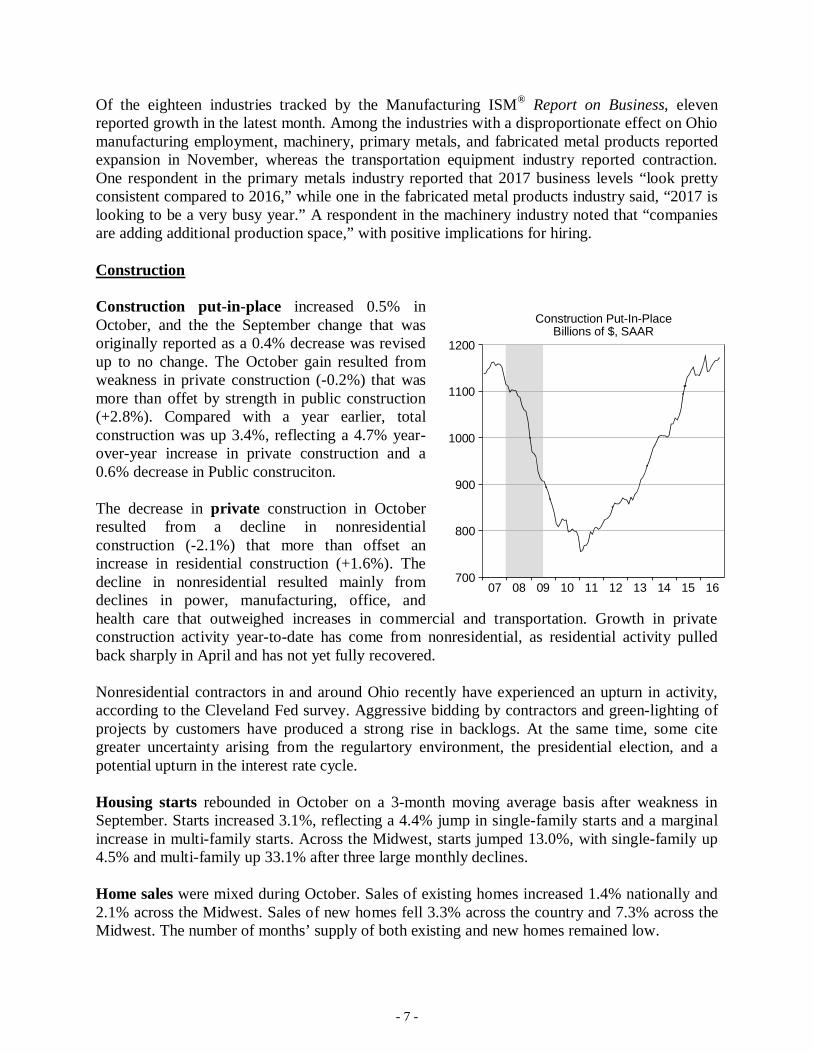
Construction put-in-place increased 0.5% inOctober, and the the September change that wasoriginally reported as a 0.4% decrease was revisedup to no change. The October gain resulted fromweakness in private construction (-0.2%) that wasmore than offet by strength in public construction(+2.8%). Compared with a year earlier, totalconstruction was up 3.4%, reflecting a 4.7% year-over-year increase in private construction and a0.6% decrease in Public construciton.
The decrease in private construction in Octoberresulted from a decline in nonresidentialconstruction (-2.1%) that more than offset anincrease in residential construction (+1.6%). Thedecline in nonresidential resulted mainly fromdeclines in power, manufacturing, office, andhealth care that outweighed increases in commercial and transportation. Growth in privateconstruction activity year-to-date has come from nonresidential, as residential activity pulledback sharply in April and has not yet fully recovered.
Nonresidential contractors in and around Ohio recently have experienced an upturn in activity,according to the Cleveland Fed survey. Aggressive bidding by contractors and green-lighting ofprojects by customers have produced a strong rise in backlogs. At the same time, some citegreater uncertainty arising from the regulartory environment, the presidential election, and apotential upturn in the interest rate cycle.
Housing starts rebounded in October on a 3-month moving average basis after weakness inSeptember. Starts increased 3.1%, reflecting a 4.4% jump in single-family starts and a marginalincrease in multi-family starts. Across the Midwest, starts jumped 13.0%, with single-family up4.5% and multi-family up 33.1% after three large monthly declines.
Home sales were mixed during October. Sales of existing homes increased 1.4% nationally and2.1% across the Midwest. Sales of new homes fell 3.3% across the country and 7.3% across theMidwest. The number of months’ supply of both existing and new homes remained low.
16151413121110090807
1200
1100
1000
900
800
700
Construction Put-In-PlaceBillions of $, SAAR
- 8 -
In and around Ohio, sales of new and existing homes through August were about 5% above theyear earlier level and the average sales price rose almost 4%, according to the Cleveland Fedsurvey. Real estate agents pointed to low existing-home inventory as a key factor behind higherprices. Builders and real estate agents believe that the presidential election temporarilydampened housing activity.
Home prices across the country posted their 56th consecutive increase in September, rising by0.6% to 5.5% above the year earlier level, according to the Case-Shiller index. According to theFreddie Mac index, home prices increased 1.6% in the third quarter to 6.2% above the yearearlier level. In comparison, prices across Ohio increased 2.1% in the quarter and 5.6% from ayear ago. In major metro areas in Ohio, prices increased 2.0% in the quarter and 4.9% from ayear ago in Cleveland, 2.6% in the quarter and 7.5% from a year ago in Columbus, and 2.1% onin the quarter and 6.3% from a year ago in Cincinnati after seasonal adjustment.
- 9 -
REVENUES
NOTE: The revenue tables in this report contain OBM’s July 2016 revised estimates of fiscalyear 2017 tax revenues, non-tax revenues, and transfers. These revisions incorporate bothchanges to the baseline and law changes enacted since January, 2016.
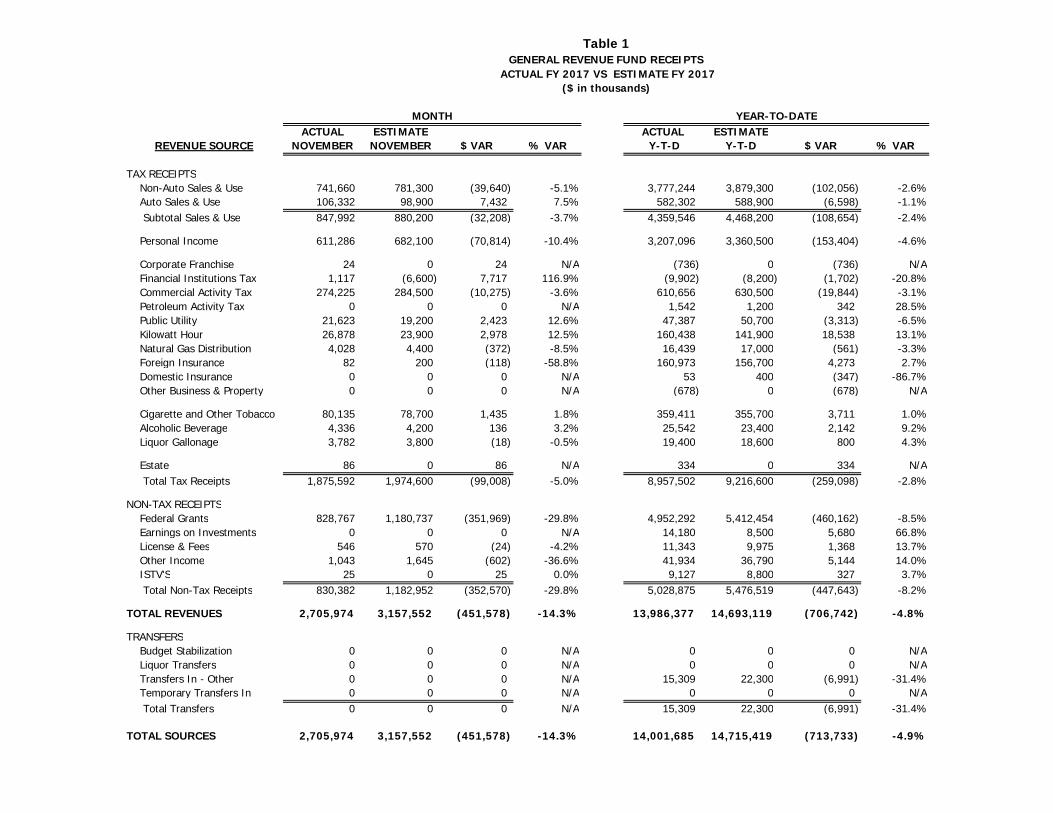
November GRF receipts totaled $2,706.0 million and were $451.6 million (14.3%) below theestimate. Monthly tax receipts totaled $1,875.6 million and were $99.0 million (5.0%) below theestimate, while non-tax receipts totaled $830.4 million and were $352.6 million (29.8%) belowthe estimate.
As one might expect, such a large variance in non-tax receipts is due to federal grants, whichwere $352.0 million (29.8%) below estimate. A negative variance of some amount was expectedin November following October’s overage. In October, GRF funds had to be used, and federalreimbursement was thus drawn, to cover Medicaid expenses that were originally expected to becovered by non-GRF sources such as the hospital assessment. In November, the hospitalassessment revenue was received and used to offset GRF expenditure, leading to lower Medicaidspending and lower federal grants. In addition to this offset for October, federal grants had twoother factors pushing them below estimate as well. First, Medicaid spending was simply belowestimate. Second, $66.7 million in federal revenue for November Medicaid spending was notreceived until December 1.
The November tax revenue shortfall was the result of a $70.8 million shortfall in the income taxand a $39.6 million shortfall in the non-auto sales tax. These two taxes combined thus had anegative variance of $110.4 million, more than the total tax variance. The CAT was also belowestimate by $10.3 million, but overages in the auto sales tax, financial institutions tax, and othersmaller taxes partly offset the sales and income shortfalls.
For the fiscal year, GRF receipts were $713.7 million (4.9%) below estimate. After theNovember, tax receipts are $259.1 million (2.8%) below estimate. About 60% of the total taxrevenue variance is from the income tax, which is $153.4 million (4.6%) below estimate. Thesales tax is $108.7 million (2.4%) below estimate, with almost all of that variance coming fromthe non-auto sales tax, which is $102.1 million below estimate. Sales tax and income taxcollections together are $262.1 million below estimate, while all other tax sources combined are$3.0 million above estimate.
For the year, non-tax receipts are $447.6 million (8.2%) below estimate, with federal grantsaccounting for more than all of the category variance, falling $460.2 million (8.5%) belowestimate. Non-tax revenues other than federal grants are $12.5 million over estimate, with allcategories having small overages.
Finally, transfers are $7.0 million (31.4%) below estimate for the year.
- 10 -
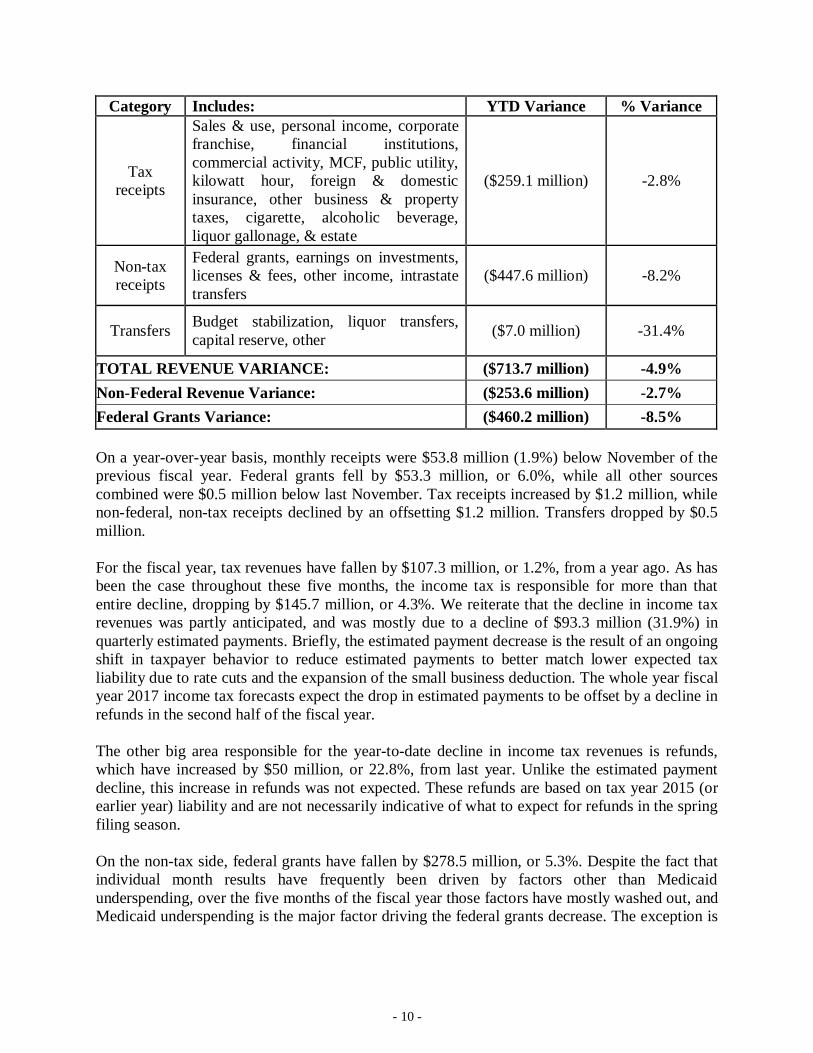
Category Includes: YTD Variance % Variance
Taxreceipts
Sales & use, personal income, corporatefranchise, financial institutions,commercial activity, MCF, public utility,kilowatt hour, foreign & domesticinsurance, other business & propertytaxes, cigarette, alcoholic beverage,liquor gallonage, & estate
($259.1 million) -2.8%
Non-taxreceipts
Federal grants, earnings on investments,licenses & fees, other income, intrastatetransfers
($447.6 million) -8.2%
Transfers Budget stabilization, liquor transfers,capital reserve, other ($7.0 million) -31.4%
TOTAL REVENUE VARIANCE: ($713.7 million) -4.9%Non-Federal Revenue Variance: ($253.6 million) -2.7%Federal Grants Variance: ($460.2 million) -8.5%
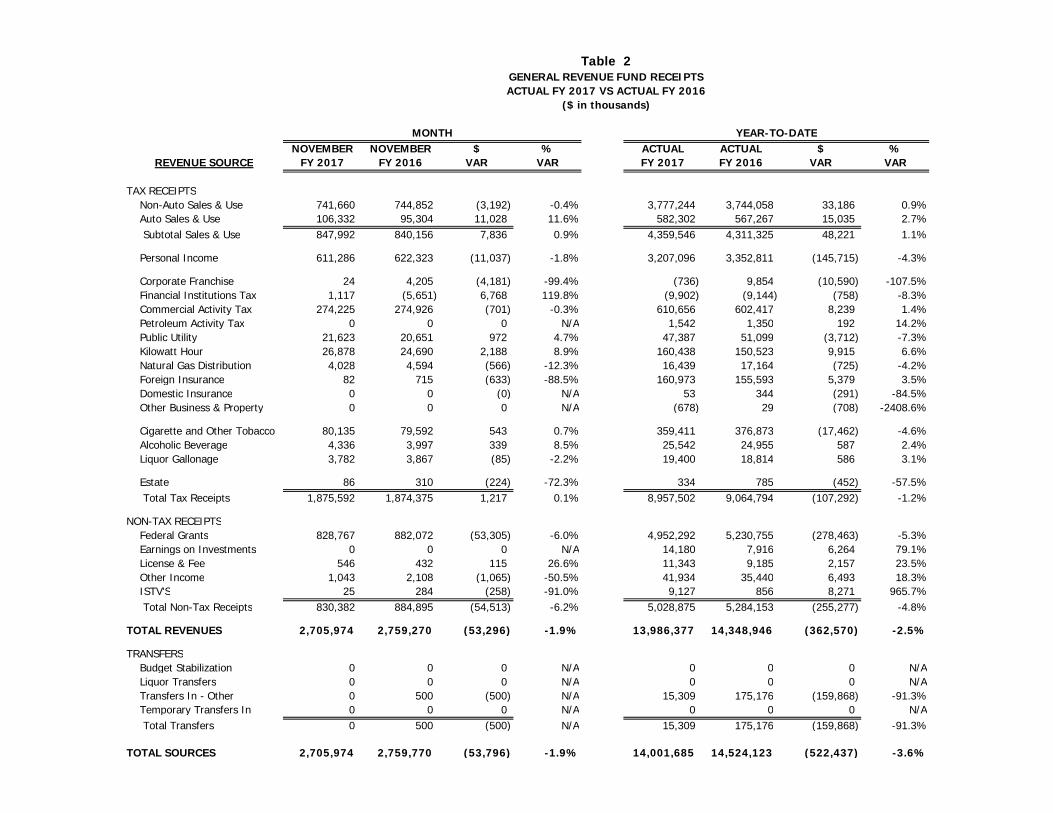
On a year-over-year basis, monthly receipts were $53.8 million (1.9%) below November of theprevious fiscal year. Federal grants fell by $53.3 million, or 6.0%, while all other sourcescombined were $0.5 million below last November. Tax receipts increased by $1.2 million, whilenon-federal, non-tax receipts declined by an offsetting $1.2 million. Transfers dropped by $0.5million.
For the fiscal year, tax revenues have fallen by $107.3 million, or 1.2%, from a year ago. As hasbeen the case throughout these five months, the income tax is responsible for more than thatentire decline, dropping by $145.7 million, or 4.3%. We reiterate that the decline in income taxrevenues was partly anticipated, and was mostly due to a decline of $93.3 million (31.9%) inquarterly estimated payments. Briefly, the estimated payment decrease is the result of an ongoingshift in taxpayer behavior to reduce estimated payments to better match lower expected taxliability due to rate cuts and the expansion of the small business deduction. The whole year fiscalyear 2017 income tax forecasts expect the drop in estimated payments to be offset by a decline inrefunds in the second half of the fiscal year.
The other big area responsible for the year-to-date decline in income tax revenues is refunds,which have increased by $50 million, or 22.8%, from last year. Unlike the estimated paymentdecline, this increase in refunds was not expected. These refunds are based on tax year 2015 (orearlier year) liability and are not necessarily indicative of what to expect for refunds in the springfiling season.
On the non-tax side, federal grants have fallen by $278.5 million, or 5.3%. Despite the fact thatindividual month results have frequently been driven by factors other than Medicaidunderspending, over the five months of the fiscal year those factors have mostly washed out, andMedicaid underspending is the major factor driving the federal grants decrease. The exception is
- 11 -
the factor mentioned earlier, namely that almost $67 million in federal reimbursement forNovember spending was not received until December 1.
GRF Revenue Sources Relative to Monthly Estimates – November 2016($ in millions)
Individual Revenue Sources Above Estimate Individual Revenue Sources Below Estimate
Financial Institutions Tax $7.7 Federal Grants ($352.0)Auto Sales and Use Tax $7.4 Personal Income Tax ($70.8)
Kilowatt Hour Tax $3.0 Non-Auto Sales and Use Tax ($39.6)
Public Utility Excise Tax $2.4 Commercial Activity Tax ($10.3)Other Sources Above Estimate $1.7 Other Sources Below Estimate ($1.1)
Total above $22.2 Total below ($473.8) Net ($451.6)
(Note: Due to rounding of individual sources, the combined sum of sources above and below estimate may differ slightly from the totalvariance.)
Non-Auto Sales and Use Tax
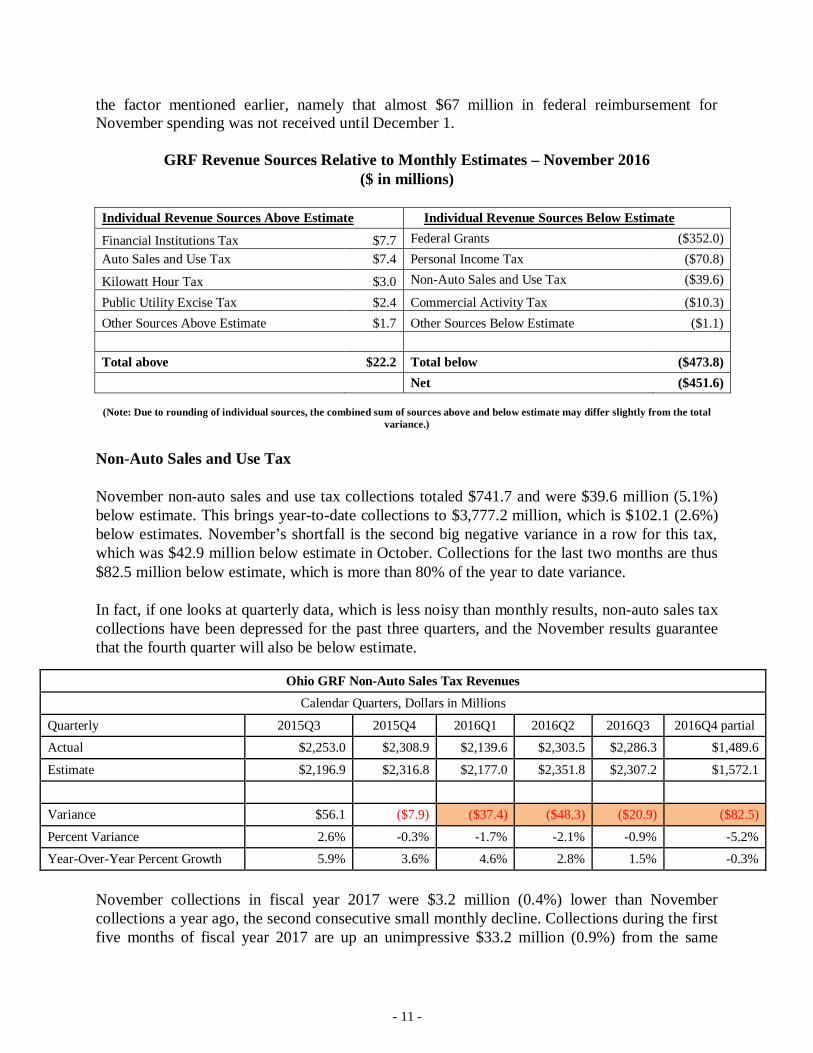
November non-auto sales and use tax collections totaled $741.7 and were $39.6 million (5.1%)below estimate. This brings year-to-date collections to $3,777.2 million, which is $102.1 (2.6%)below estimates. November’s shortfall is the second big negative variance in a row for this tax,which was $42.9 million below estimate in October. Collections for the last two months are thus$82.5 million below estimate, which is more than 80% of the year to date variance.
In fact, if one looks at quarterly data, which is less noisy than monthly results, non-auto sales taxcollections have been depressed for the past three quarters, and the November results guaranteethat the fourth quarter will also be below estimate.
November collections in fiscal year 2017 were $3.2 million (0.4%) lower than Novembercollections a year ago, the second consecutive small monthly decline. Collections during the firstfive months of fiscal year 2017 are up an unimpressive $33.2 million (0.9%) from the same
Ohio GRF Non-Auto Sales Tax RevenuesCalendar Quarters, Dollars in Millions
Quarterly 2015Q3 2015Q4 2016Q1 2016Q2 2016Q3 2016Q4 partial
Actual $2,253.0 $2,308.9 $2,139.6 $2,303.5 $2,286.3 $1,489.6
Estimate $2,196.9 $2,316.8 $2,177.0 $2,351.8 $2,307.2 $1,572.1
Variance $56.1 ($7.9) ($37.4) ($48.3) ($20.9) ($82.5)
Percent Variance 2.6% -0.3% -1.7% -2.1% -0.9% -5.2%
Year-Over-Year Percent Growth 5.9% 3.6% 4.6% 2.8% 1.5% -0.3%
- 12 -
period a year ago. Together, these figures suggest the non-auto sales and use tax may beoverestimated for fiscal year 2017. How large the year-end shortfall might be is still unknown.OBM will release updated fiscal year 2017 forecasts along with the Governor’s fiscal year 2018-2019 budget.
National data provides insights into the underperformance of the non-auto sales and use tax inOhio. First, growth in national retail sales, which can be decomposed into real retail sales andprice changes, has been weak. As reported by the Census Bureau, total retail sales (excludingmotor vehicle dealers) for the July-September quarter, not adjusted for seasonal variation andholiday and trading-day differences (just as actual tax collections are not adjusted), increased byjust 1.7% from the July-September quarter a year ago. This weak national sales growth showsthat Ohio is not alone in weak retail results.
Ohio is also not alone in having weak sales tax collections. The Federation of TaxAdministrators (FTA) has reported sales tax data for the states that show a profound growthslowdown. The FTA reported that over the past 12 months, median growth in state sales taxcollections has slowed from 4.0% to 2.4%. Through October, median growth has slowed furtherto only 2.2% in fiscal year 2017.
As mentioned in last month’s issue of this report, the Bureau of Economic Analysis (BEA) hasreported that national prices (based off a chain-type price index methodology) for retail tradeother than motor vehicles and parts dealers experienced a 2.9% year-over-year decrease in thethird quarter of 2016, the ninth consecutive quarterly decline in that measure of retail prices.Although declining retail prices were also an issue in 2015, stronger year-over-year wage growth(particularly in the later three quarters of 2015) may have dampened its effects on collections atthe time. Reversal of that decline in retail prices would probably require a weaker dollar andhigher energy prices, which forecasters believe will occur eventually, but the timing is uncertain.
Auto Sales Tax
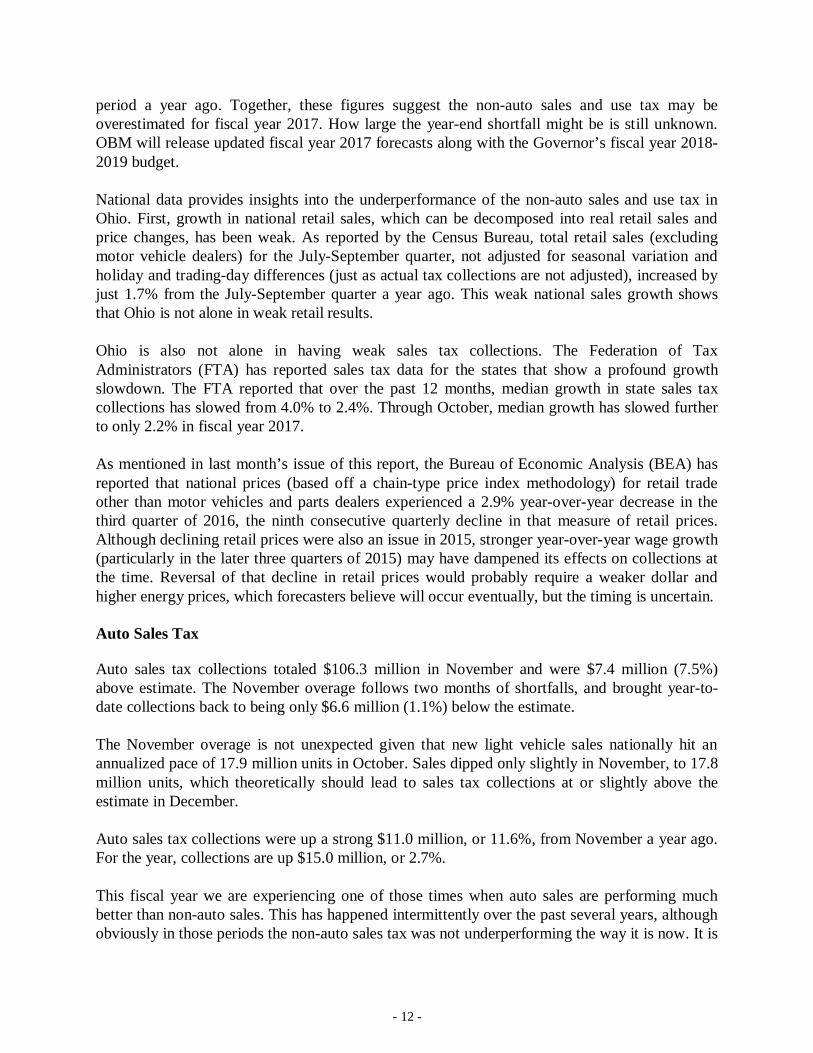
Auto sales tax collections totaled $106.3 million in November and were $7.4 million (7.5%)above estimate. The November overage follows two months of shortfalls, and brought year-to-date collections back to being only $6.6 million (1.1%) below the estimate.
The November overage is not unexpected given that new light vehicle sales nationally hit anannualized pace of 17.9 million units in October. Sales dipped only slightly in November, to 17.8million units, which theoretically should lead to sales tax collections at or slightly above theestimate in December.
Auto sales tax collections were up a strong $11.0 million, or 11.6%, from November a year ago.For the year, collections are up $15.0 million, or 2.7%.
This fiscal year we are experiencing one of those times when auto sales are performing muchbetter than non-auto sales. This has happened intermittently over the past several years, althoughobviously in those periods the non-auto sales tax was not underperforming the way it is now. It is
- 13 -
unclear why consumers are continuing to spend on autos but not on non-automotive goods. OBMhas heard a hypothesis from a retail sector economist that consumers may have shifted asignificant portion of their spending to services in satisfying a post-recession pent-up demand forsuch services. If so, this would help to explain why relatively strong growth in consumerspending in the GDP measures is being accompanied by such weak state sales tax growth.
Personal Income Tax
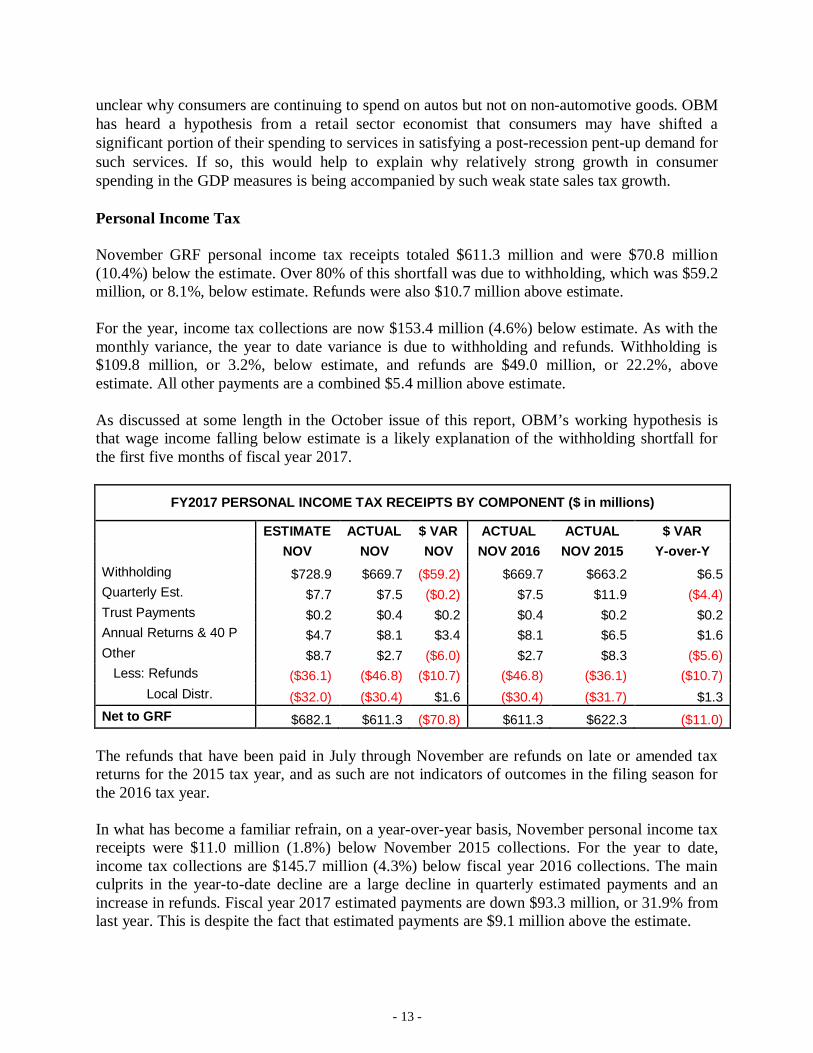
November GRF personal income tax receipts totaled $611.3 million and were $70.8 million(10.4%) below the estimate. Over 80% of this shortfall was due to withholding, which was $59.2million, or 8.1%, below estimate. Refunds were also $10.7 million above estimate.
For the year, income tax collections are now $153.4 million (4.6%) below estimate. As with themonthly variance, the year to date variance is due to withholding and refunds. Withholding is$109.8 million, or 3.2%, below estimate, and refunds are $49.0 million, or 22.2%, aboveestimate. All other payments are a combined $5.4 million above estimate.
As discussed at some length in the October issue of this report, OBM’s working hypothesis isthat wage income falling below estimate is a likely explanation of the withholding shortfall forthe first five months of fiscal year 2017.
FY2017 PERSONAL INCOME TAX RECEIPTS BY COMPONENT ($ in millions)
ESTIMATE ACTUAL $ VAR ACTUAL ACTUAL $ VARNOV NOV NOV NOV 2016 NOV 2015 Y-over-Y
Withholding $728.9 $669.7 ($59.2) $669.7 $663.2 $6.5Quarterly Est. $7.7 $7.5 ($0.2) $7.5 $11.9 ($4.4)Trust Payments $0.2 $0.4 $0.2 $0.4 $0.2 $0.2Annual Returns & 40 P $4.7 $8.1 $3.4 $8.1 $6.5 $1.6Other $8.7 $2.7 ($6.0) $2.7 $8.3 ($5.6) Less: Refunds ($36.1) ($46.8) ($10.7) ($46.8) ($36.1) ($10.7) Local Distr. ($32.0) ($30.4) $1.6 ($30.4) ($31.7) $1.3Net to GRF $682.1 $611.3 ($70.8) $611.3 $622.3 ($11.0)
The refunds that have been paid in July through November are refunds on late or amended taxreturns for the 2015 tax year, and as such are not indicators of outcomes in the filing season forthe 2016 tax year.
In what has become a familiar refrain, on a year-over-year basis, November personal income taxreceipts were $11.0 million (1.8%) below November 2015 collections. For the year to date,income tax collections are $145.7 million (4.3%) below fiscal year 2016 collections. The mainculprits in the year-to-date decline are a large decline in quarterly estimated payments and anincrease in refunds. Fiscal year 2017 estimated payments are down $93.3 million, or 31.9% fromlast year. This is despite the fact that estimated payments are $9.1 million above the estimate.
- 14 -
The explanation for this is that the fiscal year 2017 estimates assumed a large drop in estimatedpayments, and there has in fact been a large decrease, just not quite as large as expected in theestimates. The decrease in estimated payments is a result of taxpayers adjusting their behavior tothe tax rate cuts and especially to the increased small business deduction, so that rather thanmaking overly large estimated payments and then filing for very large refunds in the January-June filing season, they have instead cut back on their estimated payments by more than 30%.All else constant, this should be offset by smaller refunds paid out in January through June. So,income tax revenues are expected to be lower than last fiscal year all the way through January,before finally turning positive in February as lower expected refunds finally outweigh lowerestimated payments. If income tax revenues continue to run below estimate, which is now whatOBM expects, the turning point may come in March rather than February.
Commercial Activity Tax
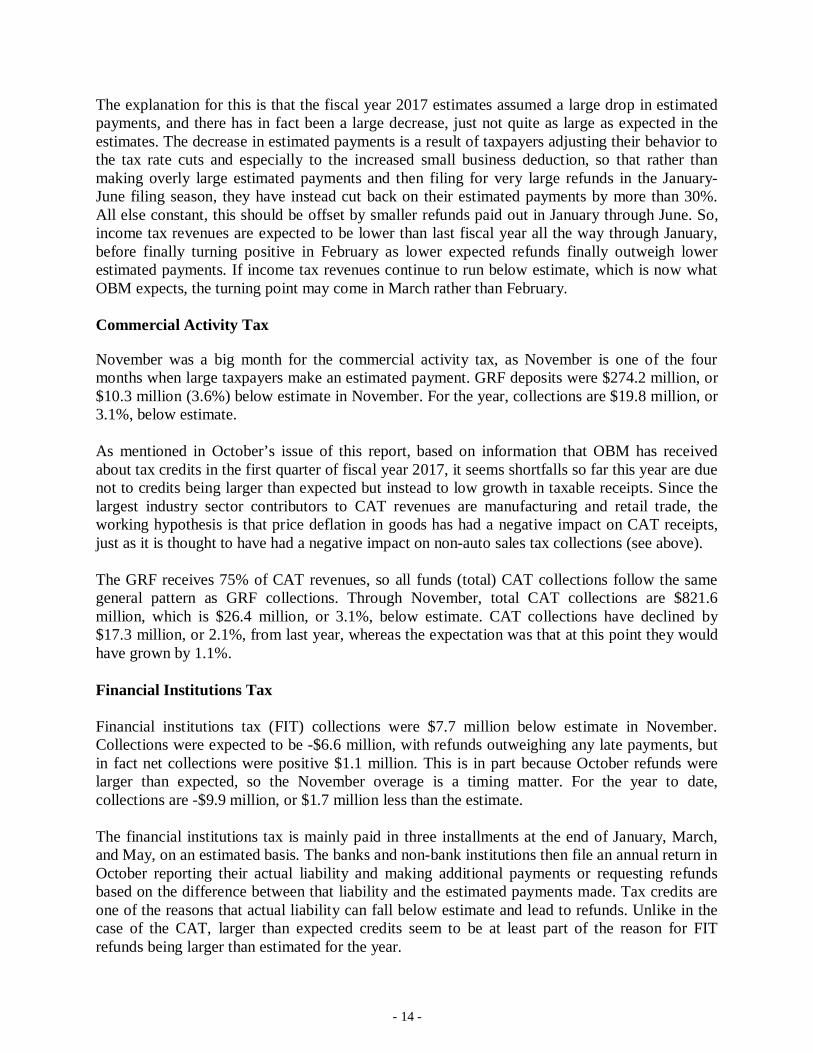
November was a big month for the commercial activity tax, as November is one of the fourmonths when large taxpayers make an estimated payment. GRF deposits were $274.2 million, or$10.3 million (3.6%) below estimate in November. For the year, collections are $19.8 million, or3.1%, below estimate.
As mentioned in October’s issue of this report, based on information that OBM has receivedabout tax credits in the first quarter of fiscal year 2017, it seems shortfalls so far this year are duenot to credits being larger than expected but instead to low growth in taxable receipts. Since thelargest industry sector contributors to CAT revenues are manufacturing and retail trade, theworking hypothesis is that price deflation in goods has had a negative impact on CAT receipts,just as it is thought to have had a negative impact on non-auto sales tax collections (see above).
The GRF receives 75% of CAT revenues, so all funds (total) CAT collections follow the samegeneral pattern as GRF collections. Through November, total CAT collections are $821.6million, which is $26.4 million, or 3.1%, below estimate. CAT collections have declined by$17.3 million, or 2.1%, from last year, whereas the expectation was that at this point they wouldhave grown by 1.1%.
Financial Institutions Tax
Financial institutions tax (FIT) collections were $7.7 million below estimate in November.Collections were expected to be -$6.6 million, with refunds outweighing any late payments, butin fact net collections were positive $1.1 million. This is in part because October refunds werelarger than expected, so the November overage is a timing matter. For the year to date,collections are -$9.9 million, or $1.7 million less than the estimate.
The financial institutions tax is mainly paid in three installments at the end of January, March,and May, on an estimated basis. The banks and non-bank institutions then file an annual return inOctober reporting their actual liability and making additional payments or requesting refundsbased on the difference between that liability and the estimated payments made. Tax credits areone of the reasons that actual liability can fall below estimate and lead to refunds. Unlike in thecase of the CAT, larger than expected credits seem to be at least part of the reason for FITrefunds being larger than estimated for the year.
- 15 -
FIT collections are expected to remain about where they are now until late January when the firstestimated payment against tax year 2017 liability will be due.
GRF Non-Tax Receipts
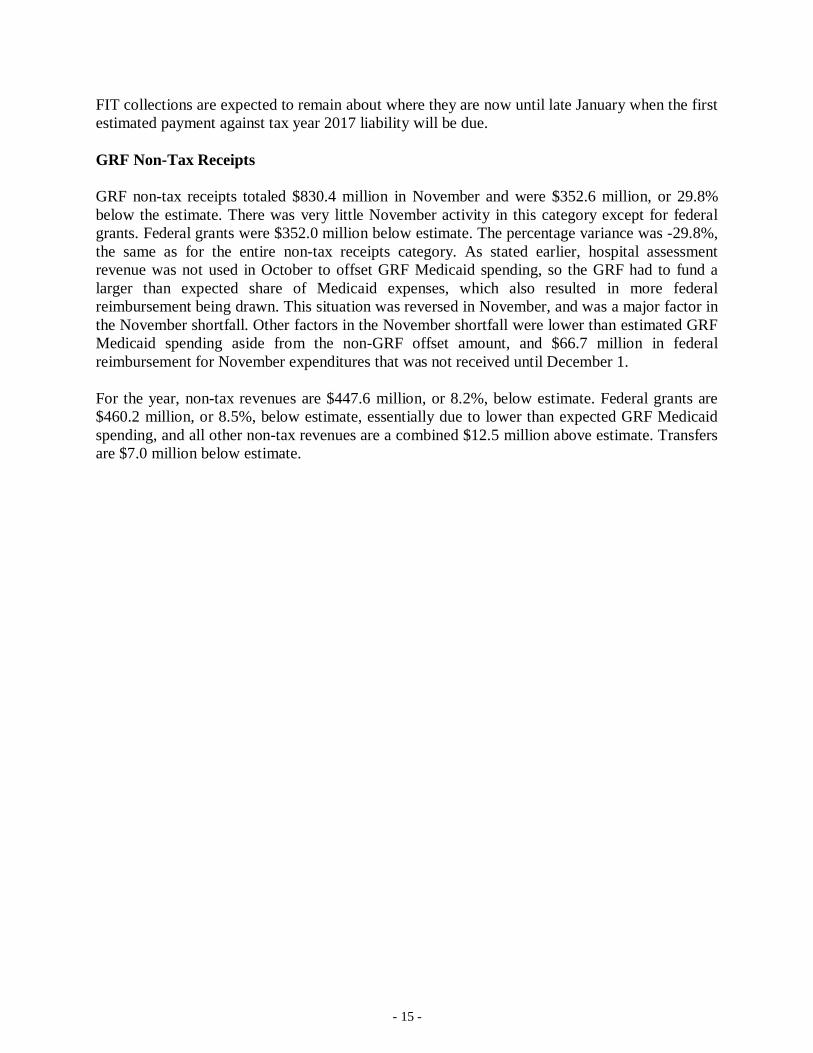
GRF non-tax receipts totaled $830.4 million in November and were $352.6 million, or 29.8%below the estimate. There was very little November activity in this category except for federalgrants. Federal grants were $352.0 million below estimate. The percentage variance was -29.8%,the same as for the entire non-tax receipts category. As stated earlier, hospital assessmentrevenue was not used in October to offset GRF Medicaid spending, so the GRF had to fund alarger than expected share of Medicaid expenses, which also resulted in more federalreimbursement being drawn. This situation was reversed in November, and was a major factor inthe November shortfall. Other factors in the November shortfall were lower than estimated GRFMedicaid spending aside from the non-GRF offset amount, and $66.7 million in federalreimbursement for November expenditures that was not received until December 1.
For the year, non-tax revenues are $447.6 million, or 8.2%, below estimate. Federal grants are$460.2 million, or 8.5%, below estimate, essentially due to lower than expected GRF Medicaidspending, and all other non-tax revenues are a combined $12.5 million above estimate. Transfersare $7.0 million below estimate.
GENERAL REVENUE FUND RECEIPTS ACTUAL FY 2017 VS ESTIMATE FY 2017
($ in thousands)
MONTH YEAR-TO-DATEACTUAL ESTIMATE ACTUAL ESTIMATE
REVENUE SOURCE NOVEMBER NOVEMBER $ VAR % VAR Y-T-D Y-T-D $ VAR % VAR
TAX RECEIPTS Non-Auto Sales & Use 741,660 781,300 (39,640) -5.1% 3,777,244 3,879,300 (102,056) -2.6% Auto Sales & Use 106,332 98,900 7,432 7.5% 582,302 588,900 (6,598) -1.1% Subtotal Sales & Use 847,992 880,200 (32,208) -3.7% 4,359,546 4,468,200 (108,654) -2.4%
Personal Income 611,286 682,100 (70,814) -10.4% 3,207,096 3,360,500 (153,404) -4.6%
Corporate Franchise 24 0 24 N/A (736) 0 (736) N/A Financial Institutions Tax 1,117 (6,600) 7,717 116.9% (9,902) (8,200) (1,702) -20.8% Commercial Activity Tax 274,225 284,500 (10,275) -3.6% 610,656 630,500 (19,844) -3.1% Petroleum Activity Tax 0 0 0 N/A 1,542 1,200 342 28.5% Public Utility 21,623 19,200 2,423 12.6% 47,387 50,700 (3,313) -6.5% Kilowatt Hour 26,878 23,900 2,978 12.5% 160,438 141,900 18,538 13.1% Natural Gas Distribution 4,028 4,400 (372) -8.5% 16,439 17,000 (561) -3.3% Foreign Insurance 82 200 (118) -58.8% 160,973 156,700 4,273 2.7% Domestic Insurance 0 0 0 N/A 53 400 (347) -86.7% Other Business & Property 0 0 0 N/A (678) 0 (678) N/A
Cigarette and Other Tobacco 80,135 78,700 1,435 1.8% 359,411 355,700 3,711 1.0% Alcoholic Beverage 4,336 4,200 136 3.2% 25,542 23,400 2,142 9.2% Liquor Gallonage 3,782 3,800 (18) -0.5% 19,400 18,600 800 4.3%
Estate 86 0 86 N/A 334 0 334 N/A Total Tax Receipts 1,875,592 1,974,600 (99,008) -5.0% 8,957,502 9,216,600 (259,098) -2.8%
NON-TAX RECEIPTS Federal Grants 828,767 1,180,737 (351,969) -29.8% 4,952,292 5,412,454 (460,162) -8.5% Earnings on Investments 0 0 0 N/A 14,180 8,500 5,680 66.8% License & Fees 546 570 (24) -4.2% 11,343 9,975 1,368 13.7% Other Income 1,043 1,645 (602) -36.6% 41,934 36,790 5,144 14.0% ISTV'S 25 0 25 0.0% 9,127 8,800 327 3.7% Total Non-Tax Receipts 830,382 1,182,952 (352,570) -29.8% 5,028,875 5,476,519 (447,643) -8.2%
TOTAL REVENUES 2,705,974 3,157,552 (451,578) -14.3% 13,986,377 14,693,119 (706,742) -4.8%
TRANSFERS Budget Stabilization 0 0 0 N/A 0 0 0 N/A Liquor Transfers 0 0 0 N/A 0 0 0 N/A Transfers In - Other 0 0 0 N/A 15,309 22,300 (6,991) -31.4% Temporary Transfers In 0 0 0 N/A 0 0 0 N/A Total Transfers 0 0 0 N/A 15,309 22,300 (6,991) -31.4%
TOTAL SOURCES 2,705,974 3,157,552 (451,578) -14.3% 14,001,685 14,715,419 (713,733) -4.9%
Table 1
GENERAL REVENUE FUND RECEIPTSACTUAL FY 2017 VS ACTUAL FY 2016
($ in thousands)
MONTH YEAR-TO-DATENOVEMBER NOVEMBER $ % ACTUAL ACTUAL $ %
REVENUE SOURCE FY 2017 FY 2016 VAR VAR FY 2017 FY 2016 VAR VAR
TAX RECEIPTS Non-Auto Sales & Use 741,660 744,852 (3,192) -0.4% 3,777,244 3,744,058 33,186 0.9% Auto Sales & Use 106,332 95,304 11,028 11.6% 582,302 567,267 15,035 2.7% Subtotal Sales & Use 847,992 840,156 7,836 0.9% 4,359,546 4,311,325 48,221 1.1%
Personal Income 611,286 622,323 (11,037) -1.8% 3,207,096 3,352,811 (145,715) -4.3%
Corporate Franchise 24 4,205 (4,181) -99.4% (736) 9,854 (10,590) -107.5% Financial Institutions Tax 1,117 (5,651) 6,768 119.8% (9,902) (9,144) (758) -8.3% Commercial Activity Tax 274,225 274,926 (701) -0.3% 610,656 602,417 8,239 1.4% Petroleum Activity Tax 0 0 0 N/A 1,542 1,350 192 14.2% Public Utility 21,623 20,651 972 4.7% 47,387 51,099 (3,712) -7.3% Kilowatt Hour 26,878 24,690 2,188 8.9% 160,438 150,523 9,915 6.6% Natural Gas Distribution 4,028 4,594 (566) -12.3% 16,439 17,164 (725) -4.2% Foreign Insurance 82 715 (633) -88.5% 160,973 155,593 5,379 3.5% Domestic Insurance 0 0 (0) N/A 53 344 (291) -84.5% Other Business & Property 0 0 0 N/A (678) 29 (708) -2408.6%
Cigarette and Other Tobacco 80,135 79,592 543 0.7% 359,411 376,873 (17,462) -4.6% Alcoholic Beverage 4,336 3,997 339 8.5% 25,542 24,955 587 2.4% Liquor Gallonage 3,782 3,867 (85) -2.2% 19,400 18,814 586 3.1%
Estate 86 310 (224) -72.3% 334 785 (452) -57.5% Total Tax Receipts 1,875,592 1,874,375 1,217 0.1% 8,957,502 9,064,794 (107,292) -1.2%
NON-TAX RECEIPTS Federal Grants 828,767 882,072 (53,305) -6.0% 4,952,292 5,230,755 (278,463) -5.3% Earnings on Investments 0 0 0 N/A 14,180 7,916 6,264 79.1% License & Fee 546 432 115 26.6% 11,343 9,185 2,157 23.5% Other Income 1,043 2,108 (1,065) -50.5% 41,934 35,440 6,493 18.3% ISTV'S 25 284 (258) -91.0% 9,127 856 8,271 965.7% Total Non-Tax Receipts 830,382 884,895 (54,513) -6.2% 5,028,875 5,284,153 (255,277) -4.8%
TOTAL REVENUES 2,705,974 2,759,270 (53,296) -1.9% 13,986,377 14,348,946 (362,570) -2.5%
TRANSFERS Budget Stabilization 0 0 0 N/A 0 0 0 N/A Liquor Transfers 0 0 0 N/A 0 0 0 N/A Transfers In - Other 0 500 (500) N/A 15,309 175,176 (159,868) -91.3% Temporary Transfers In 0 0 0 N/A 0 0 0 N/A Total Transfers 0 500 (500) N/A 15,309 175,176 (159,868) -91.3%
TOTAL SOURCES 2,705,974 2,759,770 (53,796) -1.9% 14,001,685 14,524,123 (522,437) -3.6%
Table 2
- 16 -
DISBURSEMENTS
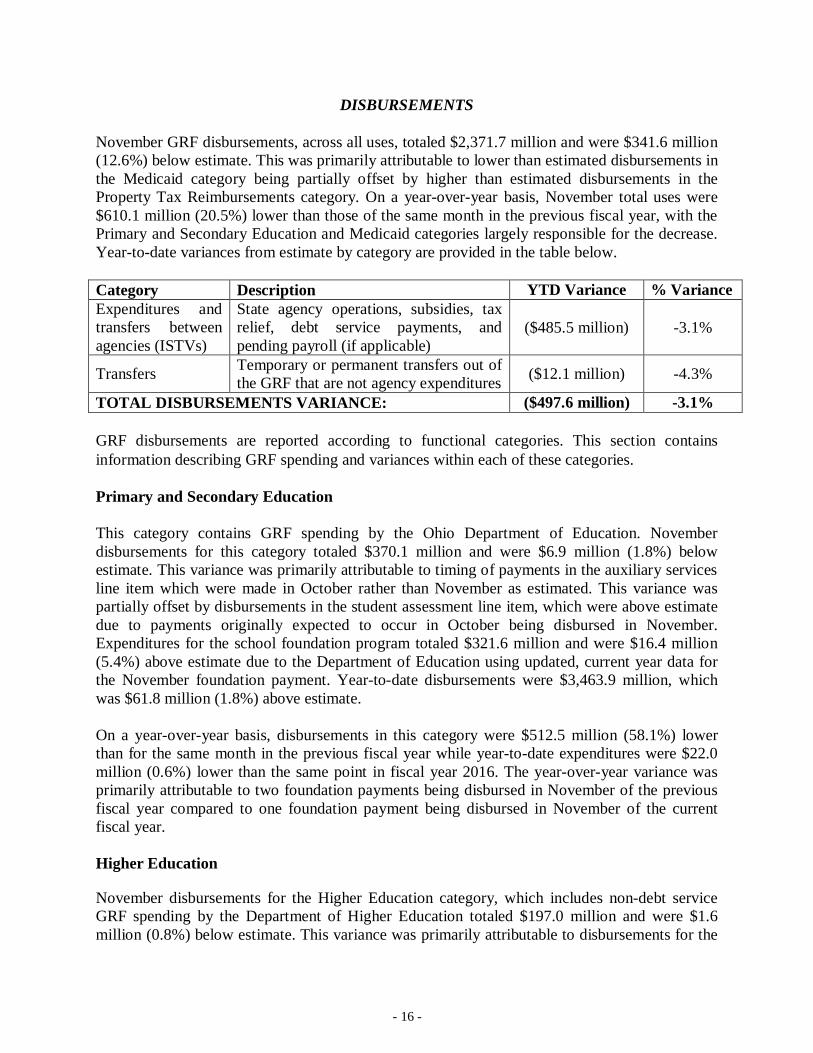
November GRF disbursements, across all uses, totaled $2,371.7 million and were $341.6 million(12.6%) below estimate. This was primarily attributable to lower than estimated disbursements inthe Medicaid category being partially offset by higher than estimated disbursements in theProperty Tax Reimbursements category. On a year-over-year basis, November total uses were$610.1 million (20.5%) lower than those of the same month in the previous fiscal year, with thePrimary and Secondary Education and Medicaid categories largely responsible for the decrease.Year-to-date variances from estimate by category are provided in the table below.
Category Description YTD Variance % VarianceExpenditures andtransfers betweenagencies (ISTVs)
State agency operations, subsidies, taxrelief, debt service payments, andpending payroll (if applicable)
($485.5 million) -3.1%
Transfers Temporary or permanent transfers out ofthe GRF that are not agency expenditures ($12.1 million) -4.3%
TOTAL DISBURSEMENTS VARIANCE: ($497.6 million) -3.1%
GRF disbursements are reported according to functional categories. This section containsinformation describing GRF spending and variances within each of these categories.
Primary and Secondary Education
This category contains GRF spending by the Ohio Department of Education. Novemberdisbursements for this category totaled $370.1 million and were $6.9 million (1.8%) belowestimate. This variance was primarily attributable to timing of payments in the auxiliary servicesline item which were made in October rather than November as estimated. This variance waspartially offset by disbursements in the student assessment line item, which were above estimatedue to payments originally expected to occur in October being disbursed in November.Expenditures for the school foundation program totaled $321.6 million and were $16.4 million(5.4%) above estimate due to the Department of Education using updated, current year data forthe November foundation payment. Year-to-date disbursements were $3,463.9 million, whichwas $61.8 million (1.8%) above estimate.
On a year-over-year basis, disbursements in this category were $512.5 million (58.1%) lowerthan for the same month in the previous fiscal year while year-to-date expenditures were $22.0million (0.6%) lower than the same point in fiscal year 2016. The year-over-year variance wasprimarily attributable to two foundation payments being disbursed in November of the previousfiscal year compared to one foundation payment being disbursed in November of the currentfiscal year.
Higher Education
November disbursements for the Higher Education category, which includes non-debt serviceGRF spending by the Department of Higher Education totaled $197.0 million and were $1.6million (0.8%) below estimate. This variance was primarily attributable to disbursements for the
- 17 -
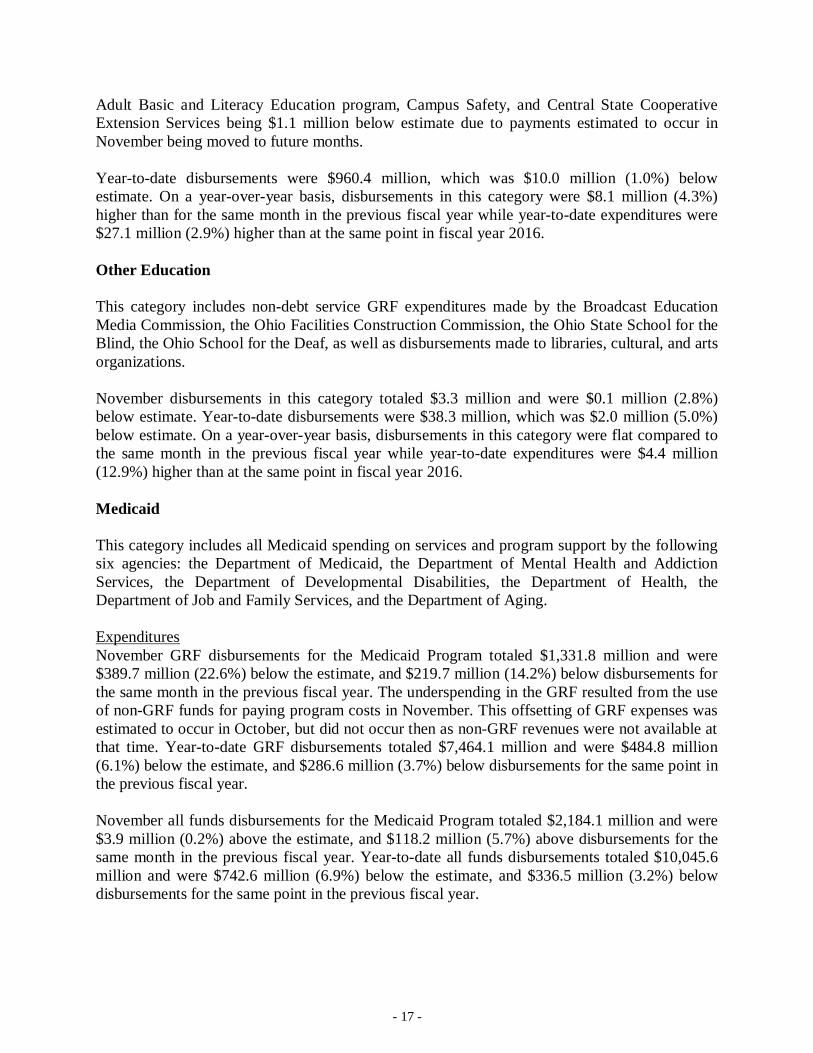
Adult Basic and Literacy Education program, Campus Safety, and Central State CooperativeExtension Services being $1.1 million below estimate due to payments estimated to occur inNovember being moved to future months.
Year-to-date disbursements were $960.4 million, which was $10.0 million (1.0%) belowestimate. On a year-over-year basis, disbursements in this category were $8.1 million (4.3%)higher than for the same month in the previous fiscal year while year-to-date expenditures were$27.1 million (2.9%) higher than at the same point in fiscal year 2016.
Other Education
This category includes non-debt service GRF expenditures made by the Broadcast EducationMedia Commission, the Ohio Facilities Construction Commission, the Ohio State School for theBlind, the Ohio School for the Deaf, as well as disbursements made to libraries, cultural, and artsorganizations.
November disbursements in this category totaled $3.3 million and were $0.1 million (2.8%)below estimate. Year-to-date disbursements were $38.3 million, which was $2.0 million (5.0%)below estimate. On a year-over-year basis, disbursements in this category were flat compared tothe same month in the previous fiscal year while year-to-date expenditures were $4.4 million(12.9%) higher than at the same point in fiscal year 2016.
Medicaid
This category includes all Medicaid spending on services and program support by the followingsix agencies: the Department of Medicaid, the Department of Mental Health and AddictionServices, the Department of Developmental Disabilities, the Department of Health, theDepartment of Job and Family Services, and the Department of Aging.
ExpendituresNovember GRF disbursements for the Medicaid Program totaled $1,331.8 million and were$389.7 million (22.6%) below the estimate, and $219.7 million (14.2%) below disbursements forthe same month in the previous fiscal year. The underspending in the GRF resulted from the useof non-GRF funds for paying program costs in November. This offsetting of GRF expenses wasestimated to occur in October, but did not occur then as non-GRF revenues were not available atthat time. Year-to-date GRF disbursements totaled $7,464.1 million and were $484.8 million(6.1%) below the estimate, and $286.6 million (3.7%) below disbursements for the same point inthe previous fiscal year.
November all funds disbursements for the Medicaid Program totaled $2,184.1 million and were$3.9 million (0.2%) above the estimate, and $118.2 million (5.7%) above disbursements for thesame month in the previous fiscal year. Year-to-date all funds disbursements totaled $10,045.6million and were $742.6 million (6.9%) below the estimate, and $336.5 million (3.2%) belowdisbursements for the same point in the previous fiscal year.
- 18 -
The November all funds variance included underspending in the managed care program due tothe delay of an administrative payment to the managed care firms, and lower monthly capitationrates which began in January 2016. The administrative payment will be completed in December.Fee-for-service program costs were below estimate due to enrollment in this program being 1.4%below estimate for the month. Other underspending in November resulted from less thananticipated administrative costs due to lower costs for information technology projects, volume-based contracts, and reimbursement requests from county departments of job and familyservices.
These savings were more than offset by greater than estimated net spending in the UpperPayment Limit (UPL) program. This program provides additional payments to hospitals andhospital-based physicians for allowable costs that are not fully covered by Medicaid payments;the combination of Medicaid payments and UPL payments may not exceed the amount that theMedicare program would have paid for such services (i.e. the upper payment limit). InNovember a UPL payment to hospital, which had been estimated to occur in September, wascompleted; while a payment to hospital-based physicians, which had been planned forNovember, was delayed until next month
The year-to-date all funds variance included the managed care program savings described above,along with previously reported savings from lower than estimated managed care enrollment inthe Aged, Blind and Disabled (ABD) groups and lower than estimated managed care pay forperformance expenses. Fee-for-service program costs have been below estimate due toenrollment in this program being an average of 6.9% below estimate each month so far this fiscalyear. Less than anticipated administrative costs, described above, also contributed to the year-to-date underspending. Finally, the Upper Payment Limit (UPL) program contributed to the year-to-date all funds variance due to the delay in payments to hospital-based physicians, describedabove, along with overall savings to date in payments to hospitals under this program.
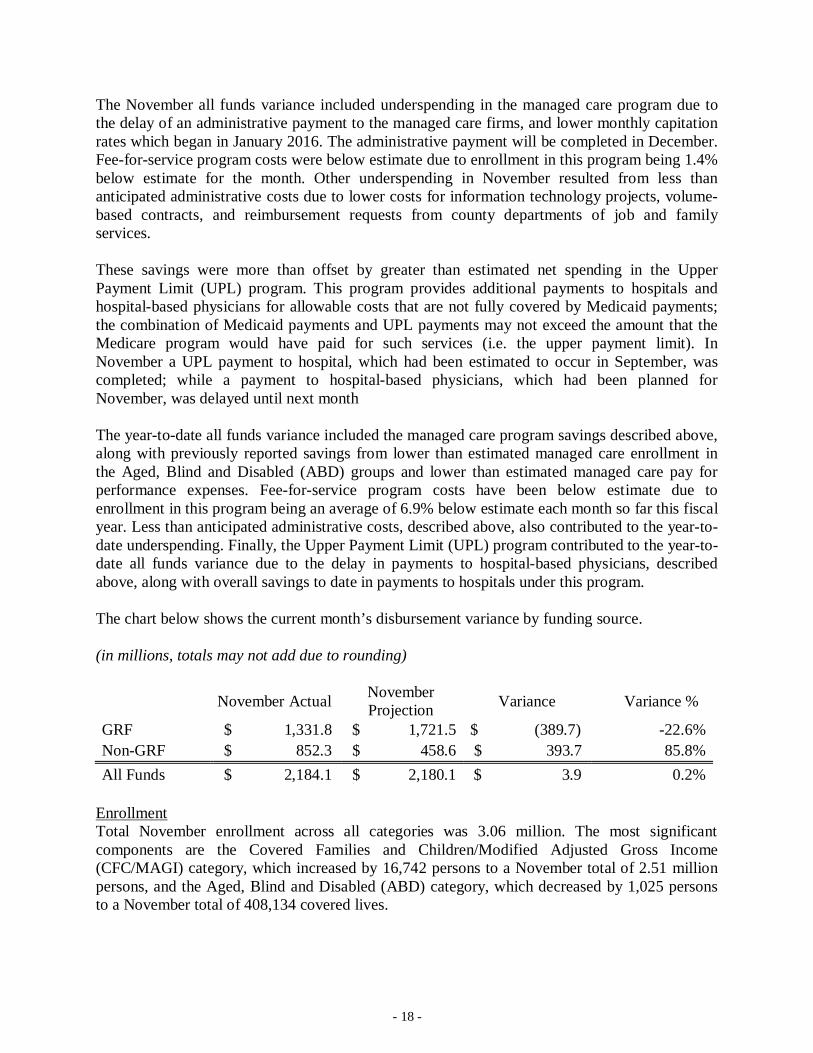
The chart below shows the current month’s disbursement variance by funding source.
(in millions, totals may not add due to rounding)
November Actual NovemberProjection Variance Variance %
GRF $ 1,331.8 $ 1,721.5 $ (389.7) -22.6%Non-GRF $ 852.3 $ 458.6 $ 393.7 85.8%All Funds $ 2,184.1 $ 2,180.1 $ 3.9 0.2%
EnrollmentTotal November enrollment across all categories was 3.06 million. The most significantcomponents are the Covered Families and Children/Modified Adjusted Gross Income(CFC/MAGI) category, which increased by 16,742 persons to a November total of 2.51 millionpersons, and the Aged, Blind and Disabled (ABD) category, which decreased by 1,025 personsto a November total of 408,134 covered lives.
- 19 -
Total enrollment across all categories for the same period last year was 3.03 million coveredpersons, including 2.47 million persons in the CFC/MAGI category and 387,723 people in theABD category.
Please note that these data are subject to revision.
Health and Human Services
This category includes non-debt service GRF expenditures by the following state agencies: Joband Family Services, Health, Aging, Developmental Disabilities, Mental Health and AddictionServices, and others. Examples of expenditures in this category include: child care, TANF,administration of the state’s psychiatric hospitals, operating subsidies to county boards ofdevelopmental disabilities, various immunization programs, and Ohio’s long term careombudsman program. To the extent that these agencies spend GRF to support Medicaid services,that spending is reflected in the Medicaid category.
November disbursements in this category totaled $110.1 million and were $9.8 million (9.8%)above estimate. Year-to-date disbursements were $568.4 million, which was $38.1 million(6.3%) below estimate. On a year-over-year basis, disbursements in this category were $26.0million (30.8%) higher than for the same month in the previous fiscal year while year-to-dateexpenditures were $16.5 million (3.0%) higher than at the same point in fiscal year 2016.
Department of Job and Family ServicesNovember disbursements for the Department of Job and Family Services totaled $60.3 millionand were $3.0 million (4.8%) below estimate. This variance was primarily attributable todisbursements for Information Technology Projects being $2.8 million (43.6%) below estimatedue to the timing of payments, and disbursements for TANF State/Maintenance of Effort being$1.0 million (6.5%) below estimate due to a decrease in Ohio Works First caseloads. Thesevariances were partially offset by higher than estimated disbursements for Child CareState/Maintenance of Effort, which were $1.4 million (8.6%) above estimate due increased ratespaid to providers, and disbursements for Family Assistance – Local, which were $1.1 million(30.6%) above estimate due to larger than estimated county draws.
Department of Mental Health and Addiction ServicesNovember disbursements for the Department of Mental Health and Addiction Services totaled$35.5 million and were $11.6 million (48.5%) above estimate. This variance was primarilyattributable to Continuum of Care Services disbursements being $10.0 million above estimate assubsidy payments originally scheduled for earlier months were made in November. Alsocontributing to the variance, Hospital Services disbursements were $2.0 million (11.9%) aboveestimate as a quarterly drug payment originally scheduled for October was made in November.
Department of HealthNovember disbursements for the Department of Health totaled $5.5 million and were $0.1million (1.8%) below estimate. A notable positive variance occurred in the payments for theFederally Qualified Health Centers Primary Care Workforce Initiative, which were $1.3 million
- 20 -
above estimate due to the timing of payments. This positive variance was offset byunderspending in several other line items.
Opportunities for Ohioans with DisabilitiesNovember disbursements for Opportunities for Ohioans with Disabilities totaled $4.0 million andwere $1.5 million (62.5%) above estimate. The variance was due to the timing of payments forServices for Individuals with Disabilities, which were $1.7 million (75.2%) above estimate as aresult of payments occurring in November instead of October as estimated.
Justice and Public Protection
This category includes non-debt service GRF expenditures by the Department of Rehabilitation& Correction, the Department of Youth Services, the Attorney General, judicial agencies, andother justice-related entities.
November disbursements in this category totaled $148.3 million and were $9.1 million (6.6%)above estimate. Year-to-date disbursements were $895.1 million, which was $15.7 million(1.7%) below estimate. On a year-over-year basis, disbursements in this category were $16.8million (12.8%) higher than for the same month in the previous fiscal year while year-to-dateexpenditures were $29.2 million (3.4%) higher than at the same point in fiscal year 2016.
Department of Rehabilitation and CorrectionNovember disbursements for the Department of Rehabilitation and Correction totaled $110.7million and were $0.7 million (0.7%) above estimate. This variance was primarily attributable tohigher than estimated disbursements for Institutional Operations and Community NonresidentialPrograms due to the timing of payments. These variances were partially offset by lower thanestimated disbursements for Institutional Medical Services.
Department of Youth ServicesNovember disbursements for the Department of Youth Services totaled $11.2 million and were$1.8 million (19.1%) above estimate. This variance was primarily attributable to the timing ofCommunity Corrections Facility payments which occurred in November instead of October asestimated.
Public Defender CommissionNovember disbursements for the Public Defender Commission totaled $5.8 million and were$5.2 million (863.1%) above estimate. This variance was primarily attributable to the timing ofcounty reimbursement payments which occurred in November instead of December as estimated.
General Government
This category includes non-debt service GRF expenditures by the Department of NaturalResources, Development Services Agency, Department of Agriculture, Department of Taxation,Office of Budget and Management, non-judicial statewide elected officials, legislative agencies,and others.
- 21 -
November disbursements in this category totaled $32.3 million and were $0.6 million (1.9%)below estimate. Year-to-date disbursements were $166.5 million, which was $11.4 million(6.4%) below estimate. On a year-over-year basis, disbursements in this category were $8.1million (33.6%) higher than for the same month in the previous fiscal year while year-to-dateexpenditures were $4.8 million (3.0%) higher than at the same point in fiscal year 2016.
Department of Administrative ServicesNovember disbursements for the Department of Administrative Services totaled $6.7 million andwere $1.8 million (37.1%) above estimate. This variance was attributable to the timing of atransfer for future building upgrades, which occurred in November instead of October asestimated.
Department of AgricultureNovember disbursements for the Department of Agriculture totaled $1.4 million and were $1.5million (50.9%) below estimate. This variance was primarily attributable to disbursements forSoil and Water Conservation Districts being $1.5 million (99.2%) below estimate due topayments occurring in October instead of November as estimated.
Property Tax Reimbursements
Payments from the property tax reimbursement category are made to local governments andschool districts to reimburse these entities for revenues foregone as a result of the 10.0 percentand 2.5 percent rollback, as well as the homestead exemption. November property taxreimbursements totaled $144.6 million and were $23.7 million (19.6%) above estimate. Year-to-date disbursements totaled $898.9 million and were $15.3 million (1.7%) above estimate. Themonthly and year-to-date variances are wholly timing related due to reimbursement requestsbeing received from counties earlier than anticipated.
Debt Service
November payments for debt service totaled $19.5 million and were $0.1 million (0.6%) belowestimate. Year-to-date debt service payments were $890.4 million and were $0.7 million (0.1%)below estimate.
Transfers Out
November transfers out totaled $14.7 million and were $14.7 million above estimate. Thisvariance was timing related as transfers originally planned for October occurred in November.Year-to-date transfers out were $268.0 million and were $12.1 million (4.3%) below estimate.
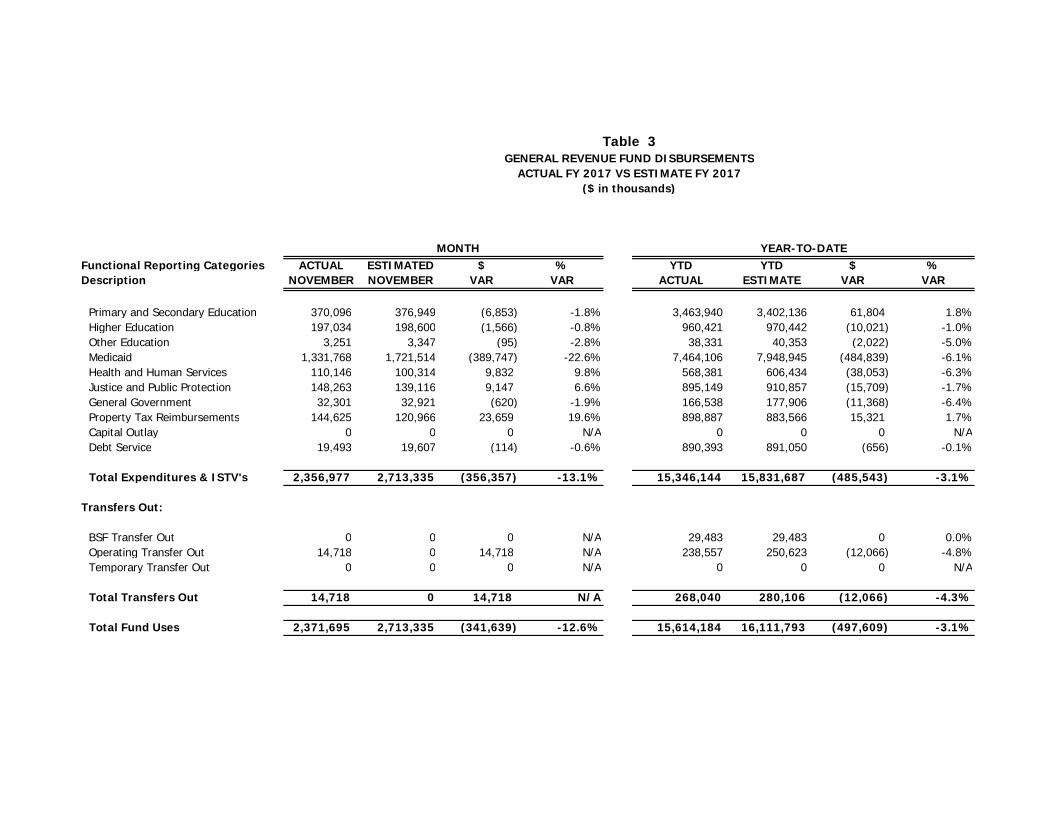
MONTH YEAR-TO-DATEFunctional Reporting Categories ACTUAL ESTIMATED $ % YTD YTD $ %Description NOVEMBER NOVEMBER VAR VAR ACTUAL ESTIMATE VAR VAR
Primary and Secondary Education 370,096 376,949 (6,853) -1.8% 3,463,940 3,402,136 61,804 1.8%Higher Education 197,034 198,600 (1,566) -0.8% 960,421 970,442 (10,021) -1.0%Other Education 3,251 3,347 (95) -2.8% 38,331 40,353 (2,022) -5.0%Medicaid 1,331,768 1,721,514 (389,747) -22.6% 7,464,106 7,948,945 (484,839) -6.1%Health and Human Services 110,146 100,314 9,832 9.8% 568,381 606,434 (38,053) -6.3%Justice and Public Protection 148,263 139,116 9,147 6.6% 895,149 910,857 (15,709) -1.7%General Government 32,301 32,921 (620) -1.9% 166,538 177,906 (11,368) -6.4%Property Tax Reimbursements 144,625 120,966 23,659 19.6% 898,887 883,566 15,321 1.7%Capital Outlay 0 0 0 N/A 0 0 0 N/ADebt Service 19,493 19,607 (114) -0.6% 890,393 891,050 (656) -0.1%
Total Expenditures & ISTV's 2,356,977 2,713,335 (356,357) -13.1% 15,346,144 15,831,687 (485,543) -3.1%
Transfers Out:
BSF Transfer Out 0 0 0 N/A 29,483 29,483 0 0.0%Operating Transfer Out 14,718 0 14,718 N/A 238,557 250,623 (12,066) -4.8%Temporary Transfer Out 0 0 0 N/A 0 0 0 N/A
Total Transfers Out 14,718 0 14,718 N/A 268,040 280,106 (12,066) -4.3%
Total Fund Uses 2,371,695 2,713,335 (341,639) -12.6% 15,614,184 16,111,793 (497,609) -3.1%
Table 3GENERAL REVENUE FUND DISBURSEMENTS
ACTUAL FY 2017 VS ESTIMATE FY 2017($ in thousands)
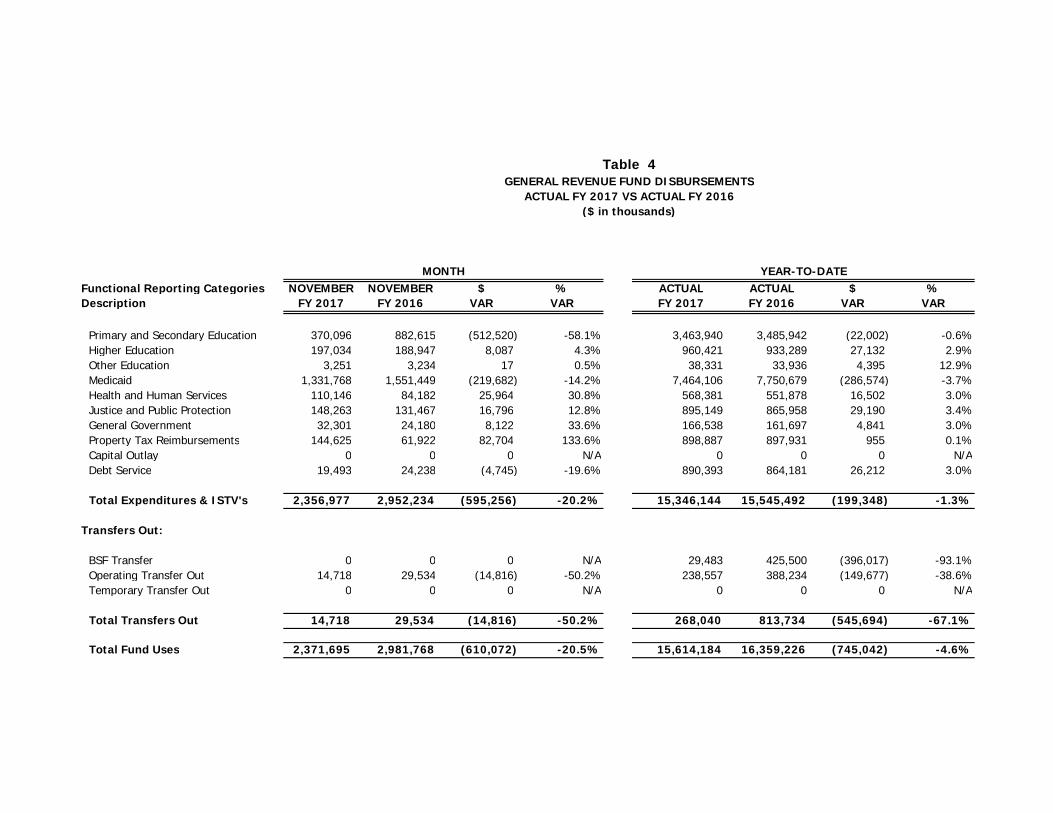
YEAR-TO-DATEFunctional Reporting Categories NOVEMBER NOVEMBER $ % ACTUAL ACTUAL $ %Description FY 2017 FY 2016 VAR VAR FY 2017 FY 2016 VAR VAR
Primary and Secondary Education 370,096 882,615 (512,520) -58.1% 3,463,940 3,485,942 (22,002) -0.6%Higher Education 197,034 188,947 8,087 4.3% 960,421 933,289 27,132 2.9%Other Education 3,251 3,234 17 0.5% 38,331 33,936 4,395 12.9%Medicaid 1,331,768 1,551,449 (219,682) -14.2% 7,464,106 7,750,679 (286,574) -3.7%Health and Human Services 110,146 84,182 25,964 30.8% 568,381 551,878 16,502 3.0%Justice and Public Protection 148,263 131,467 16,796 12.8% 895,149 865,958 29,190 3.4%General Government 32,301 24,180 8,122 33.6% 166,538 161,697 4,841 3.0%Property Tax Reimbursements 144,625 61,922 82,704 133.6% 898,887 897,931 955 0.1%Capital Outlay 0 0 0 N/A 0 0 0 N/ADebt Service 19,493 24,238 (4,745) -19.6% 890,393 864,181 26,212 3.0%
Total Expenditures & ISTV's 2,356,977 2,952,234 (595,256) -20.2% 15,346,144 15,545,492 (199,348) -1.3%
Transfers Out:
BSF Transfer 0 0 0 N/A 29,483 425,500 (396,017) -93.1%Operating Transfer Out 14,718 29,534 (14,816) -50.2% 238,557 388,234 (149,677) -38.6%Temporary Transfer Out 0 0 0 N/A 0 0 0 N/A
Total Transfers Out 14,718 29,534 (14,816) -50.2% 268,040 813,734 (545,694) -67.1%
Total Fund Uses 2,371,695 2,981,768 (610,072) -20.5% 15,614,184 16,359,226 (745,042) -4.6%
MONTH
Table 4
($ in thousands)
GENERAL REVENUE FUND DISBURSEMENTSACTUAL FY 2017 VS ACTUAL FY 2016
- 22 -
FUND BALANCE
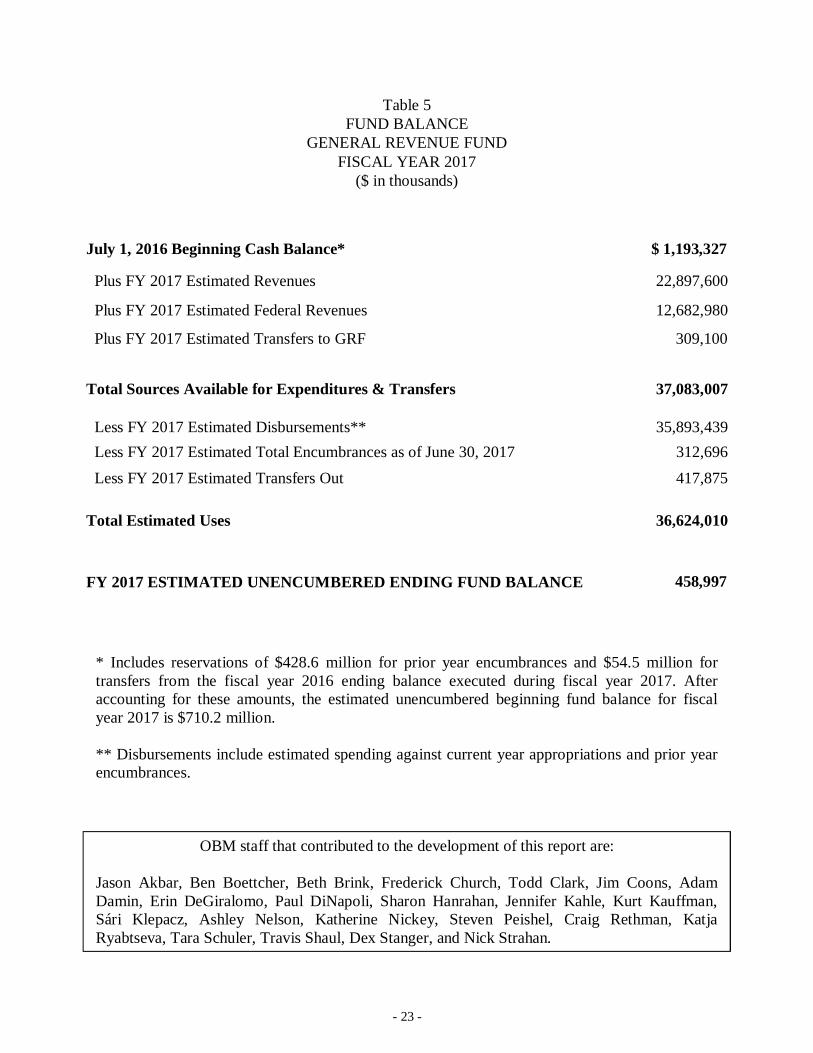
Table 5 describes the estimated General Revenue Fund (GRF) unencumbered ending fundbalance for FY 2017. Based on the estimated revenue sources for FY 2017 and the estimated FY2017 disbursements, transfers, and encumbrances, the GRF unencumbered ending fund balancefor FY 2017 is an estimated $459.0 million.
The GRF unencumbered ending fund balance should not be considered as a balance available forexpenditure in FY 2017 nor should it be considered as equivalent to the FY 2017 surpluscalculation as defined in Section 131.44 of the Ohio Revised Code.
It is important to note that the GRF unencumbered ending fund balance will be impacted by anyGRF expenditures or transfers that may be authorized by the General Assembly or by theControlling Board during the course of the fiscal year.
- 23 -
Table 5FUND BALANCE
GENERAL REVENUE FUNDFISCAL YEAR 2017
($ in thousands)
* Includes reservations of $428.6 million for prior year encumbrances and $54.5 million fortransfers from the fiscal year 2016 ending balance executed during fiscal year 2017. Afteraccounting for these amounts, the estimated unencumbered beginning fund balance for fiscalyear 2017 is $710.2 million.
** Disbursements include estimated spending against current year appropriations and prior yearencumbrances.
OBM staff that contributed to the development of this report are:
Jason Akbar, Ben Boettcher, Beth Brink, Frederick Church, Todd Clark, Jim Coons, AdamDamin, Erin DeGiralomo, Paul DiNapoli, Sharon Hanrahan, Jennifer Kahle, Kurt Kauffman,Sári Klepacz, Ashley Nelson, Katherine Nickey, Steven Peishel, Craig Rethman, KatjaRyabtseva, Tara Schuler, Travis Shaul, Dex Stanger, and Nick Strahan.
July 1, 2016 Beginning Cash Balance* $ 1,193,327
Plus FY 2017 Estimated Revenues 22,897,600
Plus FY 2017 Estimated Federal Revenues 12,682,980
Plus FY 2017 Estimated Transfers to GRF 309,100
Total Sources Available for Expenditures & Transfers 37,083,007
Less FY 2017 Estimated Disbursements** 35,893,439 Less FY 2017 Estimated Total Encumbrances as of June 30, 2017 312,696 Less FY 2017 Estimated Transfers Out 417,875
Total Estimated Uses 36,624,010
FY 2017 ESTIMATED UNENCUMBERED ENDING FUND BALANCE 458,997