Embed Size (px)
Citation preview
ECONOMIC STATISTICS OF SRI LANKA
2017
DEPARTMENT OF CENSUS AND STATISTICS

ISBN 978-955-702-060-0
ECONOMIC STATISTICS OF SRI LANKA 2017
i
ECONOMIC STATISTICS OF SRI LANKA
2017
‘Sankyana Mandiraya’Department of Census and Statistics
No. 306/71, Polduwa Road,Battaramulla
Sri LankaWebsite:www.statistics.gov.lk
E-mail:[email protected]
September2017
ii ii
ECONOMIC STATISTICS OF SRI LANKA
2017
Preface
The Department of Census & Statistics (DCS) publish this bulletin on “Economic Statistics of Sri Lanka
2017” for the fi rst time. This bulletin presents comparative data on economic indicators of the country.
Since Sri Lanka is moving towards a rapid development phase, timely data on economic indicators are
required for many purposes including policy making and planning development programmes.
This bulletin was compiled under the guidance of Dr. A.J. Satharasinghe, Director General and
Ms. I. R. Bandara, Additional Director General of DCS.
Under the supervision of Ms. U. Maheshwaran, Director of publications division of the DCS, Statistician,
Ms. H.M.D. Sepalika complied relevant data and statistics from various sources. Statistical Assistant,
Ms. Sumudu Opanayaka assisted in organizing the publication.
This bulletin will be a useful resource for policy makers, development partners and many others intersted
in the economy and development process of Sri Lanka.
iii
TableofContents Page
1. Employment 1
1.1 Labourforcestatusofthehouseholdpopulation,2006-2016(Age15yearsandabove).......................................................... 1
1.2 Employedpopulationbygender,2011-2016.................................................................................................................................................. 2
1.3 Percentagedistributionofemployedpopulationbyemploymentstatus&gender,2011-2016................................................ 3
1.4 Employedpopulationbymajoreconomicsector,2011-2016................................................................................................................... 5
1.5 Employedpopulationbynumberofhoursworkedperweek(percentage),2011-2016............................................................ 6
1.6 Percentagedistributionofemployedpopulationbymajoreconomicsector,2016..................................................................... 7
1.7 Labourforceparticipationratebygender,2011-2016(Age15yearsandabove)......................................................................... 8
1.8 Labourforceparticipationratebyresidencialsector,2011-2016(Age15yearsandabove)................................................... 8
1.9 Unemploymentratebyselectedagegroupsandgender,2011-2016.................................................................................................... 9
1.10 Unemploymentratebylevelofeducation&gender,2011-2016...........................................................................................................10
1.11 Unemploymentratebygender,2011-2016.....................................................................................................................................................12
1.12 Unemploymentratebydistricts,2011-2016.................................................................................................................................................13
iv
2. Poverty 14
2.1 Povertyincidence(headcountindex)inSriLankabyprovince..............................................................................................................14
2.2 NumberofpoorpersonsinSriLankabyprovince.......................................................................................................................................15
2.3 Percentageofpoorhouseholdsbydistrict.......................................................................................................................................................16
3. NationalAccounts 17
3.1 Grossdomesticproductandgrossnationalincome,2010-2016...........................................................................................................17
3.2 Per-capitaGDPandGNI,2010-2016...................................................................................................................................................................19
3.3 Percentageshareofgrossdomesticproductbymajorsectors,2010-2016......................................................................................21
3.4 Quartelygrossdomesticproductandeconomicgrowth,2010-2016..................................................................................................22
3.5 PercentageshareofexpenditureonGDPatcurrentprices,2010-2016.............................................................................................23
3.6 Grossdomesticproductbyindustrialoriginatconstant(2010)prices,2010-2016....................................................................24
3.7 Grossdomesticproductbyindustrialoriginatcurrentmarketprices,2010-2016......................................................................25
3.8 Reconcilationofkeyaggregatesatcurrentprices,2010-2016...............................................................................................................26
4. Tourism 27
4.1 Trendsintheeconomicindicatorsoftourismsector,2012-2016.........................................................................................................27
4.2 Departuresforforeignemploymentbymanpowerlevelandsex,2008-2016.................................................................................28
v
4.3 Arrivalsbyregion,2012-2016...............................................................................................................................................................................29
4.4 Foreignemployees’remittences,2012-2016..................................................................................................................................................30
5. Industry 31
5.1 Distributionofindustrialestablishmentbyprovince,2014...................................................................................................................31
5.2 Principleindicatorsofindustrialactivity,2007-2014(Establishmentswith25ormorepersonsengaged).....................32
5.3 Principleindicatorsofindustrialactivity,2014(Establishmentswith5ormorepersonsengaged)....................................33
5.4 Principleindicatorsofindustrialactivity,2014(Establishmentswith25ormorepersonsengaged)................................34
5.5 Principleindicatorsofindustrialactivity,2014(Establishmentswithlessthan25personsengaged)..............................35
6. ForeignTrade 36
6.1 Trendsinforeigntrade,2004-2016....................................................................................................................................................................36
6.2 Valueofexportsbycountry,2008-2016..........................................................................................................................................................37
6.3 Valueofimportsbycountry,2008-2016.........................................................................................................................................................38
6.4 Valueofexportsbyprincipalcommodity,2013-2016................................................................................................................................39
6.5 Valueofimportsbyprincipalcommodity,2013-2016...............................................................................................................................40
6.6 Endofperiodexchangerates,2012-2016................................................................................................................................................ 41-42
vi
7. Agriculture 43
7.1 Paddystatistics,2004-2016...................................................................................................................................................................................43
7.2 Livestockandproductionofmilkandeggs,2007-2016............................................................................................................................44
7.3 Fishproductionby�ishingsubsectors,1960-2016.....................................................................................................................................46
7.4 Productionandcultivatedextentofselectedcrops......................................................................................................................................47
7.5 Productionandcultivatedextentofselectedcrops......................................................................................................................................48
7.6 Productionandcultivatedextentofselectedvegitables............................................................................................................................49
7.7 Productionofminorexportcrops........................................................................................................................................................................50
7.8 Productionandcultivatedextentofotherselectedfoodcrops...............................................................................................................51
7.9 Productionandcultivatedextentofmajorcrops,2013-2016.................................................................................................52
8. Prices 53
8.1 MovementsoftheNCPI2016(Base:2013=100)........................................................................................................................................53
8.2 MovementsoftheCCPI,2016(Base:2013=100).......................................................................................................................................54
8.3 Movementsofproducer’spriceindexbymajoractivity,2016...............................................................................................................55
8.4 Openmarketmonthlyaverageretailpricesofselectedfooditems,2016................................................................................. 57-61
vii
9. Publicutility 62
9.1 Telecommunicationperformances,2014-2016...........................................................................................................................................62
9.2 Electricitygenerationandnumberofconsumers,2014-2016.............................................................................................................63
9.3 Purposeofelectricitysale,2014-2016............................................................................................................................................................64
9.4 Performanceofportservices,2014-2016......................................................................................................................................................65
10. Government�inance 66
10.1 Reserveassets,2014-2016...................................................................................................................................................................................66
10.2 Foreignassets,2010-2016....................................................................................................................................................................................67
10.3 Outstandingexternaldebt,2013-2016............................................................................................................................................................68
10.4 Moneysupplyandmoneymultiplierbyendperiod,2010-2016...........................................................................................................69
10.5 Compositionofgovernmentdebt,2010-2016...............................................................................................................................................70
10.6 Consolidatedbudget,2010-2016.......................................................................................................................................................................71
viii
TableofFiguresFigure1 EmployedpopulationbyGender2016........................................................................................................................................................ 2
Figure2 Percentagedistributionofemployedpopulationbyemploymentstatus.................................................................................... 4
Figure3 Employedpopulationbynumberofhoursworkedperweek........................................................................................................... 6
Figure4 Employedpopulationbyeconomicsector-2016................................................................................................................................... 7
Figure5 Unemploymentratebylevelofeducation,2011-2016......................................................................................................................11
Figure6 Unemploymentratebygender,2011-2016.............................................................................................................................................12
Figure7 Grossdomesticproductatcurrentandconstant(2010)prices,2010-2016...........................................................................18
Figure8 Per-capitaGDPandGNI,2010-2016..........................................................................................................................................................20
Figure9 PercentageshareofGDPatcurrentmarketprices...............................................................................................................................21
Figure10 Distributionofindustrialestablishmentbyprovince,2014............................................................................................................31
Figure11 Trendsinforeigntrade,2004-2016............................................................................................................................................................36
Figure12 Valueofexportsbyprincipalcommodity(Rs.Mn),2016..................................................................................................................39
Figure13 Valueofimportsbyprincipalcommodity(Rs.Mn),2016..................................................................................................................40
Figure14 Livestockstatistics.............................................................................................................................................................................................45
Figure15 Productionofmajorcrops,2013-2016........................................................................................................................................52
Figure16 MovementsoftheNCPI(Base:2013=100)andyearonyearin�lationin2016....................................................................53
Figure17 Colomboconsumerspriceindexandyearonyearin�lation............................................................................................................54
Figure18 Movementsofproducer’spriceindex........................................................................................................................................................56
Source: Department of Census and Statistics Page 1
1.Employment
YearHousehold population
(15 years & over)
Labour force Not in labour force
number
Employment rate (% to total
labour force)
Unemployment rate (% to total
labour force)
labour force participation
rate (%)Total number
of labour force Employed
numberunemployed
number
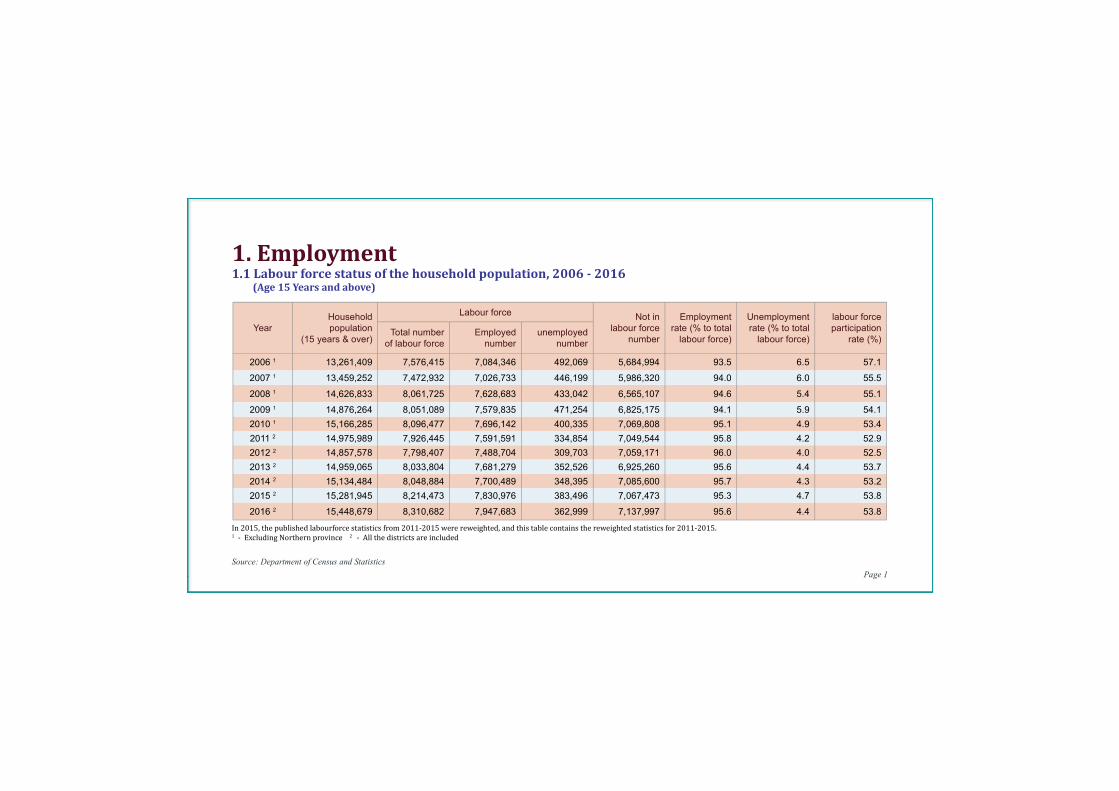
2006 1 13,261,409 7,576,415 7,084,346 492,069 5,684,994 93.5 6.5 57.1
2007 1 13,459,252 7,472,932 7,026,733 446,199 5,986,320 94.0 6.0 55.5
2008 1 14,626,833 8,061,725 7,628,683 433,042 6,565,107 94.6 5.4 55.1
2009 1 14,876,264 8,051,089 7,579,835 471,254 6,825,175 94.1 5.9 54.1
2010 1 15,166,285 8,096,477 7,696,142 400,335 7,069,808 95.1 4.9 53.4
2011 2 14,975,989 7,926,445 7,591,591 334,854 7,049,544 95.8 4.2 52.9
2012 2 14,857,578 7,798,407 7,488,704 309,703 7,059,171 96.0 4.0 52.5
2013 2 14,959,065 8,033,804 7,681,279 352,526 6,925,260 95.6 4.4 53.7
2014 2 15,134,484 8,048,884 7,700,489 348,395 7,085,600 95.7 4.3 53.2
2015 2 15,281,945 8,214,473 7,830,976 383,496 7,067,473 95.3 4.7 53.8
2016 2 15,448,679 8,310,682 7,947,683 362,999 7,137,997 95.6 4.4 53.8
1.1Labourforcestatusofthehouseholdpopulation,2006-2016(Age15Yearsandabove)
In2015,thepublishedlabourforcestatisticsfrom2011-2015werereweighted,andthistablecontainsthereweightedstatisticsfor2011-2015.1-ExcludingNorthernprovince2-Allthedistrictsareincluded
Source: Department of Census and Statistics Page 2
Employed population 2011 2012 2013 2014 2015 2016
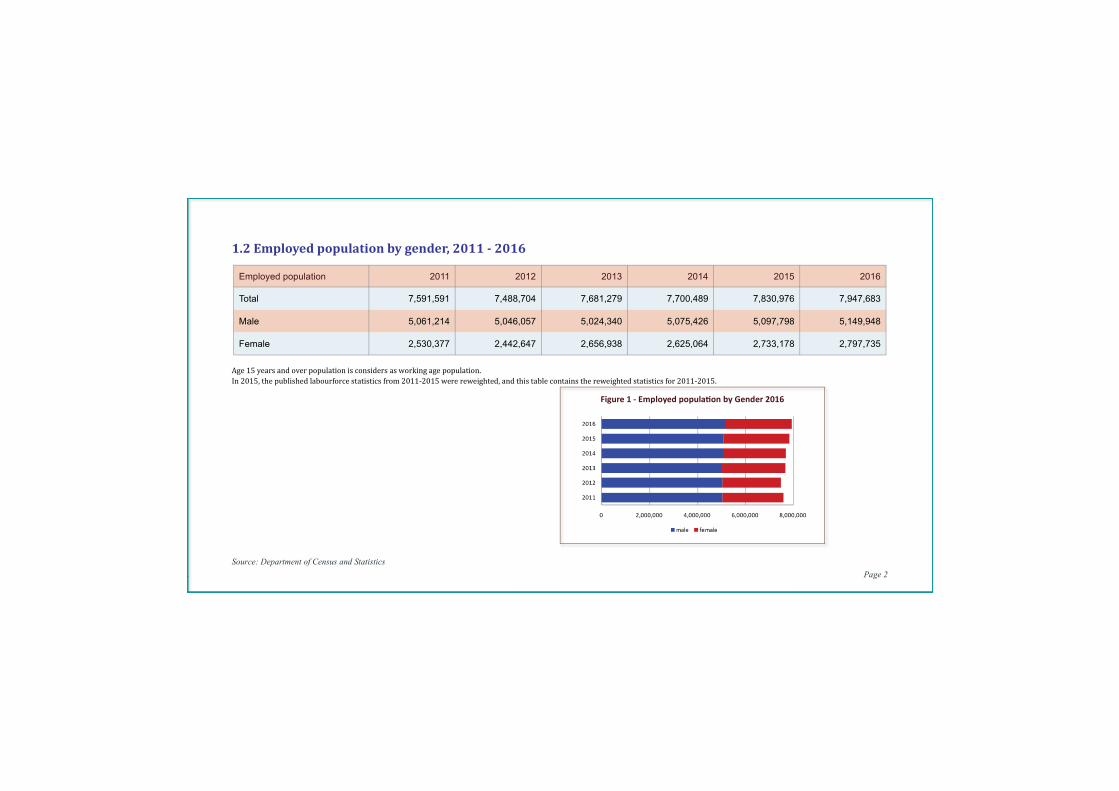
Total 7,591,591 7,488,704 7,681,279 7,700,489 7,830,976 7,947,683
Male 5,061,214 5,046,057 5,024,340 5,075,426 5,097,798 5,149,948
Female 2,530,377 2,442,647 2,656,938 2,625,064 2,733,178 2,797,735
1.2Employedpopulationbygender,2011-2016
Age15yearsandoverpopulationisconsidersasworkingagepopulation.
In2015,thepublishedlabourforcestatisticsfrom2011-2015werereweighted,andthistablecontainsthereweightedstatisticsfor2011-2015.
Figure 1 - Employed popula� on by Gender 2016
Source: Department of Census and Statistics Page 3
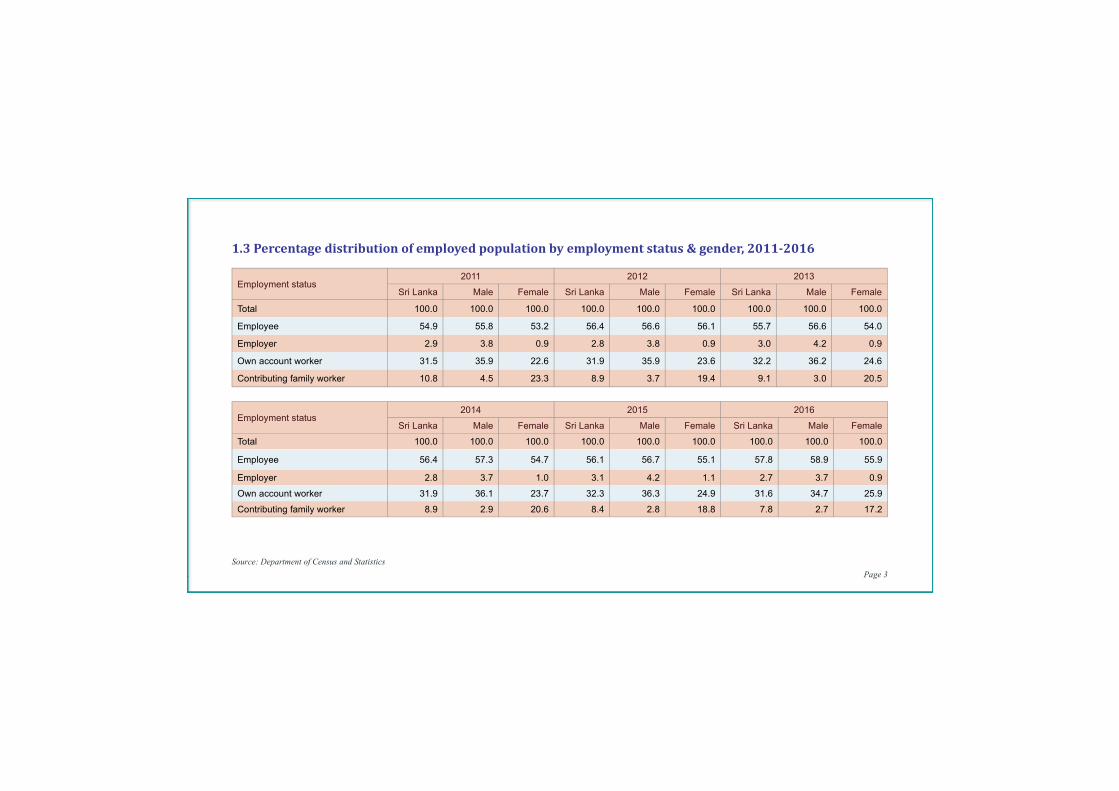
1.3Percentagedistributionofemployedpopulationbyemploymentstatus&gender,2011-2016
Employment status2011 2012 2013
Sri Lanka Male Female Sri Lanka Male Female Sri Lanka Male Female
Total 100.0 100.0 100.0 100.0 100.0 100.0 100.0 100.0 100.0
Employee 54.9 55.8 53.2 56.4 56.6 56.1 55.7 56.6 54.0
Employer 2.9 3.8 0.9 2.8 3.8 0.9 3.0 4.2 0.9
Own account worker 31.5 35.9 22.6 31.9 35.9 23.6 32.2 36.2 24.6
Contributing family worker 10.8 4.5 23.3 8.9 3.7 19.4 9.1 3.0 20.5
Employment status2014 2015 2016
Sri Lanka Male Female Sri Lanka Male Female Sri Lanka Male Female
Total 100.0 100.0 100.0 100.0 100.0 100.0 100.0 100.0 100.0
Employee 56.4 57.3 54.7 56.1 56.7 55.1 57.8 58.9 55.9
Employer 2.8 3.7 1.0 3.1 4.2 1.1 2.7 3.7 0.9
Own account worker 31.9 36.1 23.7 32.3 36.3 24.9 31.6 34.7 25.9
Contributing family worker 8.9 2.9 20.6 8.4 2.8 18.8 7.8 2.7 17.2
Source: Department of Census and Statistics Page 4
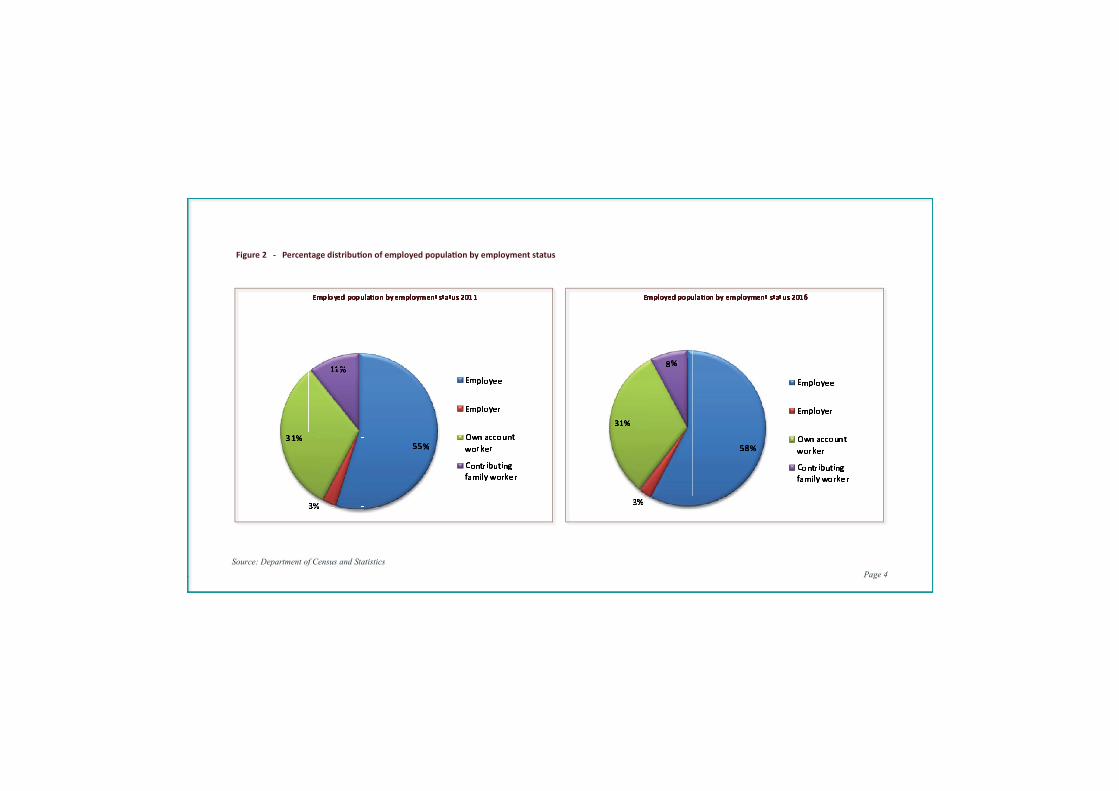
Figure 2 - Percentage distribu� on of employed popula� on by employment status
Employed popula� on by employment status 2011 Employed popula� on by employment status 2016
Source: Department of Census and Statistics Page 5
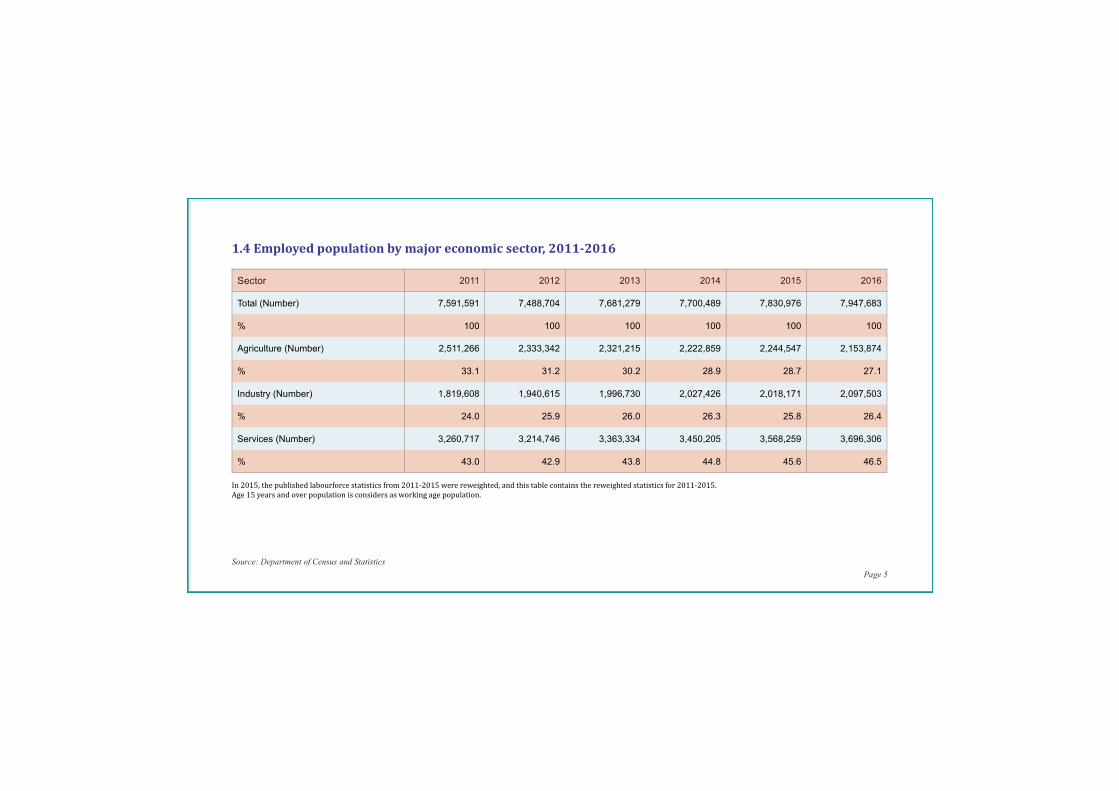
Sector 2011 2012 2013 2014 2015 2016
Total (Number) 7,591,591 7,488,704 7,681,279 7,700,489 7,830,976 7,947,683
% 100 100 100 100 100 100
Agriculture (Number) 2,511,266 2,333,342 2,321,215 2,222,859 2,244,547 2,153,874
% 33.1 31.2 30.2 28.9 28.7 27.1
Industry (Number) 1,819,608 1,940,615 1,996,730 2,027,426 2,018,171 2,097,503
% 24.0 25.9 26.0 26.3 25.8 26.4
Services (Number) 3,260,717 3,214,746 3,363,334 3,450,205 3,568,259 3,696,306
% 43.0 42.9 43.8 44.8 45.6 46.5
1.4Employedpopulationbymajoreconomicsector,2011-2016
In2015,thepublishedlabourforcestatisticsfrom2011-2015werereweighted,andthistablecontainsthereweightedstatisticsfor2011-2015.Age15yearsandoverpopulationisconsidersasworkingagepopulation.
Source: Department of Census and Statistics Page 6
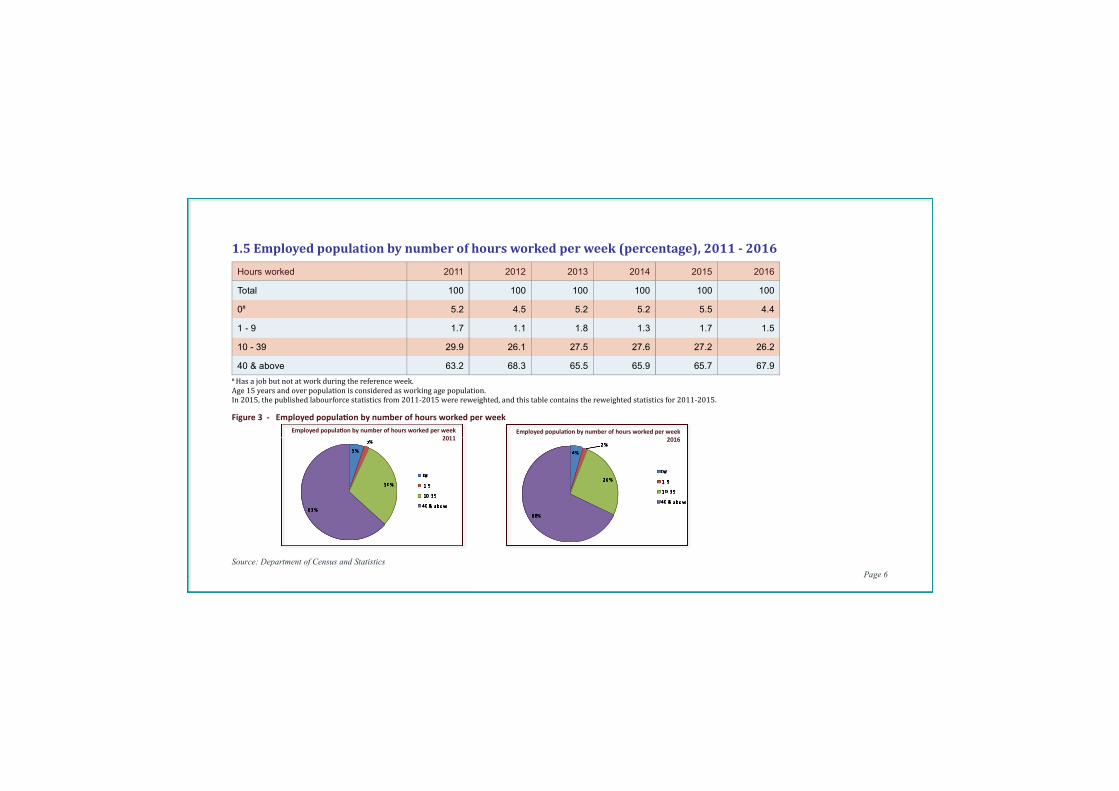
Hours worked 2011 2012 2013 2014 2015 2016
Total 100 100 100 100 100 100
0# 5.2 4.5 5.2 5.2 5.5 4.4
1 - 9 1.7 1.1 1.8 1.3 1.7 1.5
10 - 39 29.9 26.1 27.5 27.6 27.2 26.2
40 & above 63.2 68.3 65.5 65.9 65.7 67.9
1.5Employedpopulationbynumberofhoursworkedperweek(percentage),2011-2016
#Hasajobbutnotatworkduringthereferenceweek.Age15yearsandoverpopulationisconsideredasworkingagepopulation.In2015,thepublishedlabourforcestatisticsfrom2011-2015werereweighted,andthistablecontainsthereweightedstatisticsfor2011-2015.
Figure 3 - Employed popula� on by number of hours worked per week
Employed popula� on by number of hours worked per week2011
Employed popula� on by number of hours worked per week2016
Source: Department of Census and Statistics Page 7
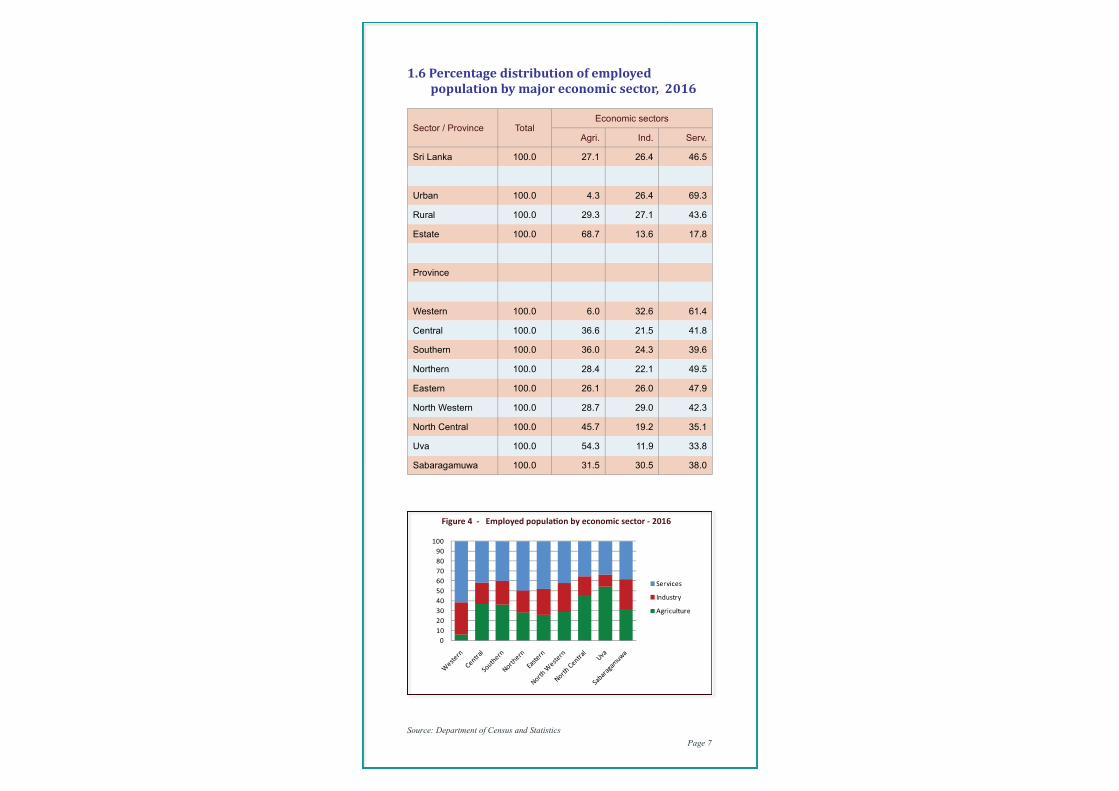
1.6Percentagedistributionofemployedpopulationbymajoreconomicsector,2016
Sector / Province TotalEconomic sectors
Agri. Ind. Serv.
Sri Lanka 100.0 27.1 26.4 46.5
Urban 100.0 4.3 26.4 69.3
Rural 100.0 29.3 27.1 43.6
Estate 100.0 68.7 13.6 17.8
Province
Western 100.0 6.0 32.6 61.4
Central 100.0 36.6 21.5 41.8
Southern 100.0 36.0 24.3 39.6
Northern 100.0 28.4 22.1 49.5
Eastern 100.0 26.1 26.0 47.9
North Western 100.0 28.7 29.0 42.3
North Central 100.0 45.7 19.2 35.1
Uva 100.0 54.3 11.9 33.8
Sabaragamuwa 100.0 31.5 30.5 38.0
Figure 4 - Employed popula� on by economic sector - 2016
Source: Department of Census and Statistics Page 8
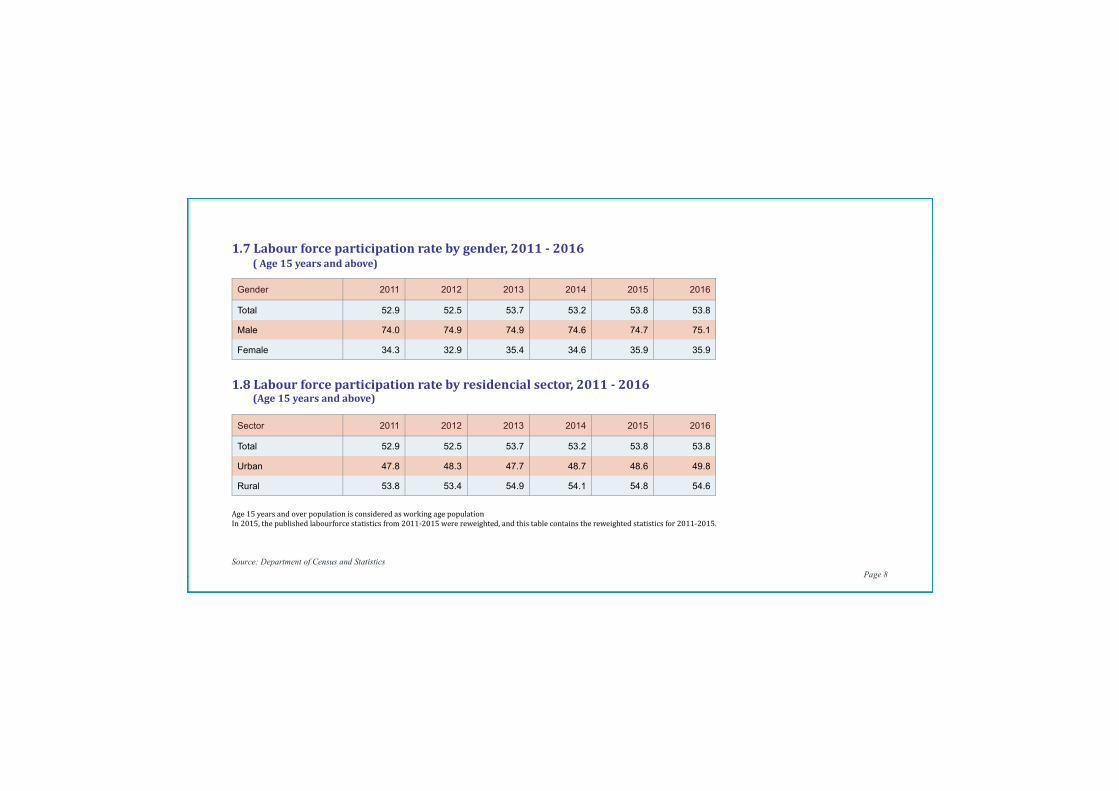
Gender 2011 2012 2013 2014 2015 2016
Total 52.9 52.5 53.7 53.2 53.8 53.8
Male 74.0 74.9 74.9 74.6 74.7 75.1
Female 34.3 32.9 35.4 34.6 35.9 35.9
1.7Labourforceparticipationratebygender,2011-2016(Age15yearsandabove)
Sector 2011 2012 2013 2014 2015 2016
Total 52.9 52.5 53.7 53.2 53.8 53.8
Urban 47.8 48.3 47.7 48.7 48.6 49.8
Rural 53.8 53.4 54.9 54.1 54.8 54.6
1.8Labourforceparticipationratebyresidencialsector,2011-2016(Age15yearsandabove)
Age15yearsandoverpopulationisconsideredasworkingagepopulationIn2015,thepublishedlabourforcestatisticsfrom2011-2015werereweighted,andthistablecontainsthereweightedstatisticsfor2011-2015.
Source: Department of Census and Statistics Page 9
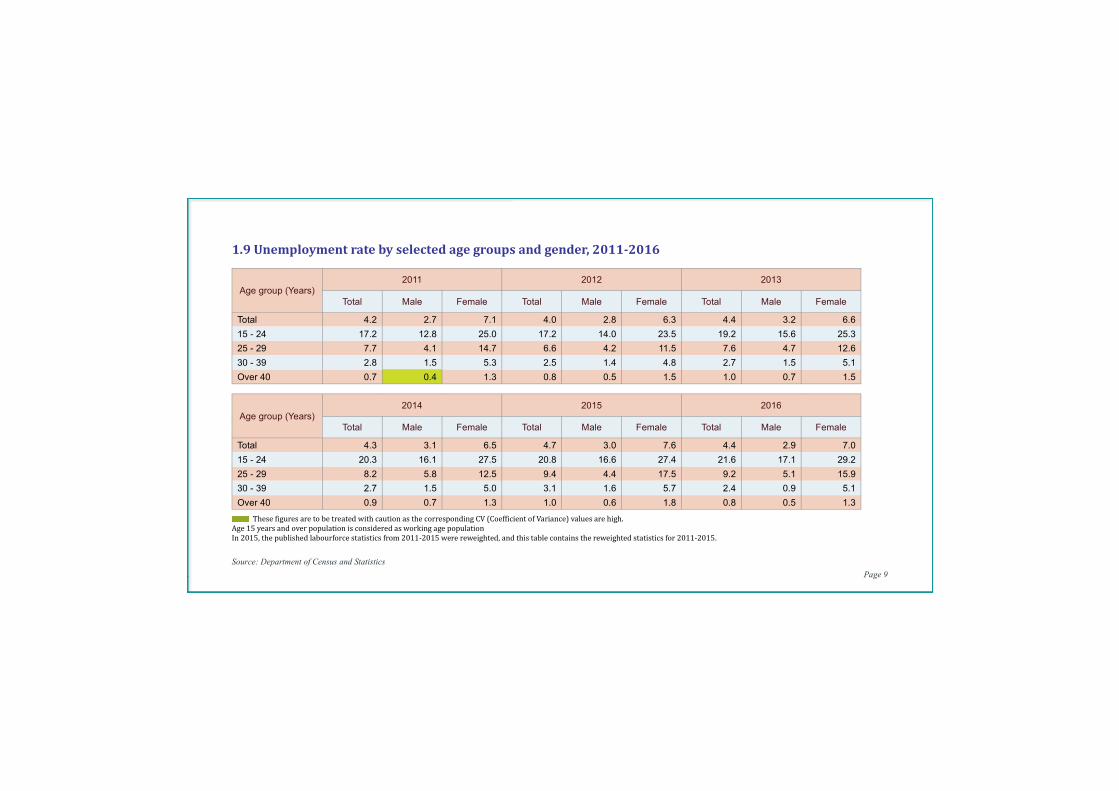
Age group (Years)2011 2012 2013
Total Male Female Total Male Female Total Male Female
Total 4.2 2.7 7.1 4.0 2.8 6.3 4.4 3.2 6.6
15 - 24 17.2 12.8 25.0 17.2 14.0 23.5 19.2 15.6 25.3
25 - 29 7.7 4.1 14.7 6.6 4.2 11.5 7.6 4.7 12.6
30 - 39 2.8 1.5 5.3 2.5 1.4 4.8 2.7 1.5 5.1
Over 40 0.7 0.4 1.3 0.8 0.5 1.5 1.0 0.7 1.5
1.9Unemploymentratebyselectedagegroupsandgender,2011-2016
Age group (Years)2014 2015 2016
Total Male Female Total Male Female Total Male Female
Total 4.3 3.1 6.5 4.7 3.0 7.6 4.4 2.9 7.0
15 - 24 20.3 16.1 27.5 20.8 16.6 27.4 21.6 17.1 29.2
25 - 29 8.2 5.8 12.5 9.4 4.4 17.5 9.2 5.1 15.9
30 - 39 2.7 1.5 5.0 3.1 1.6 5.7 2.4 0.9 5.1
Over 40 0.9 0.7 1.3 1.0 0.6 1.8 0.8 0.5 1.3
These�iguresaretobetreatedwithcautionasthecorrespondingCV(Coef�icientofVariance)valuesarehigh.Age15yearsandoverpopulationisconsideredasworkingagepopulationIn2015,thepublishedlabourforcestatisticsfrom2011-2015werereweighted,andthistablecontainsthereweightedstatisticsfor2011-2015.
Source: Department of Census and Statistics Page 10
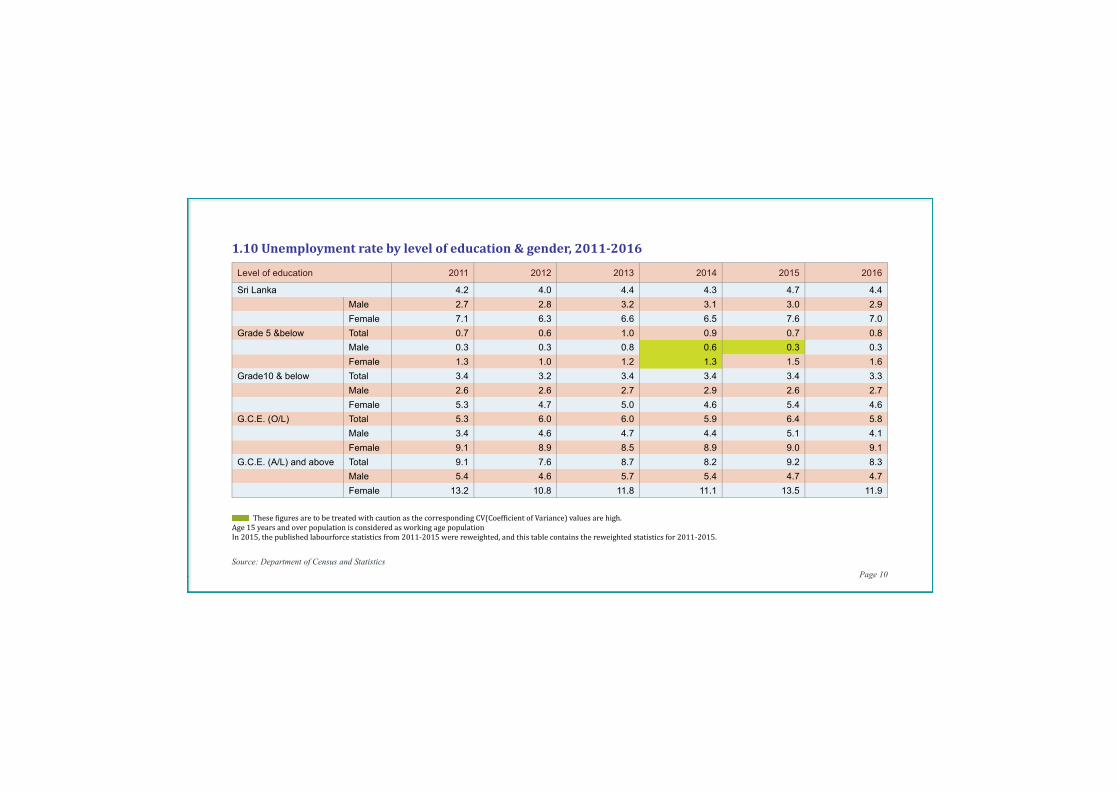
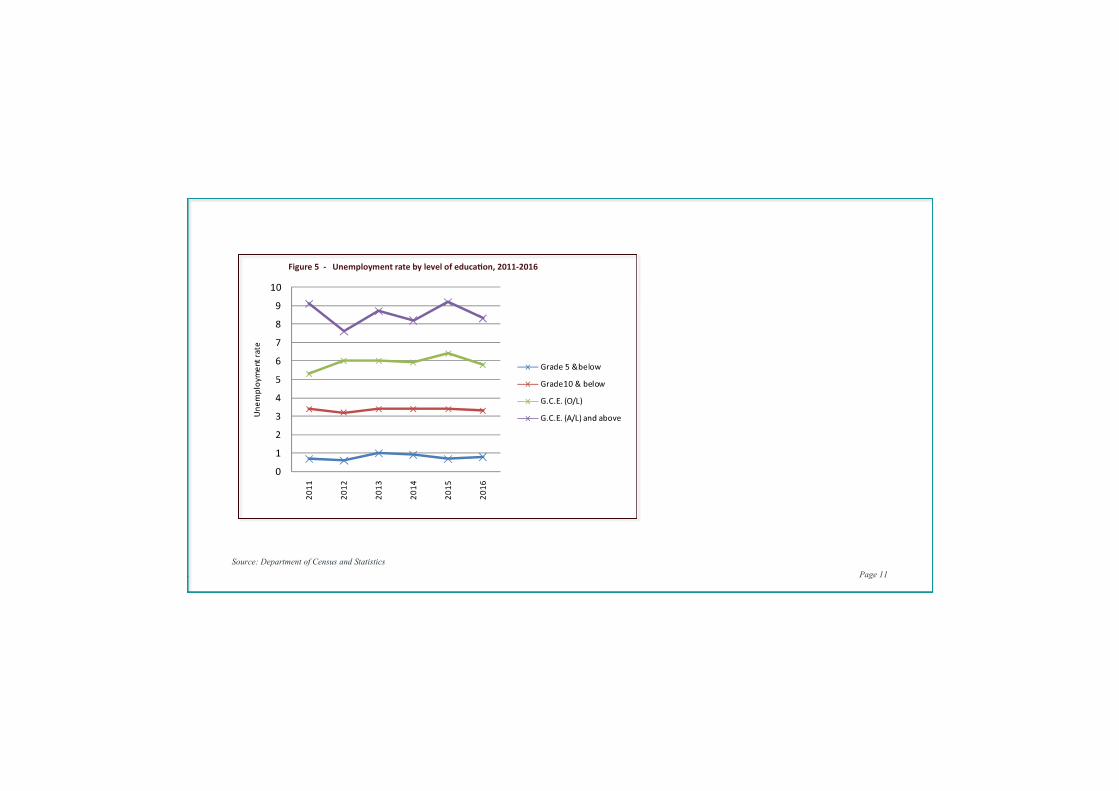
1.10Unemploymentratebylevelofeducation&gender,2011-2016
These�iguresaretobetreatedwithcautionasthecorrespondingCV(Coef�icientofVariance)valuesarehigh.Age15yearsandoverpopulationisconsideredasworkingagepopulationIn2015,thepublishedlabourforcestatisticsfrom2011-2015werereweighted,andthistablecontainsthereweightedstatisticsfor2011-2015.
Level of education 2011 2012 2013 2014 2015 2016
Sri Lanka 4.2 4.0 4.4 4.3 4.7 4.4
Male 2.7 2.8 3.2 3.1 3.0 2.9
Female 7.1 6.3 6.6 6.5 7.6 7.0
Grade 5 &below Total 0.7 0.6 1.0 0.9 0.7 0.8
Male 0.3 0.3 0.8 0.6 0.3 0.3
Female 1.3 1.0 1.2 1.3 1.5 1.6
Grade10 & below Total 3.4 3.2 3.4 3.4 3.4 3.3
Male 2.6 2.6 2.7 2.9 2.6 2.7
Female 5.3 4.7 5.0 4.6 5.4 4.6
G.C.E. (O/L) Total 5.3 6.0 6.0 5.9 6.4 5.8
Male 3.4 4.6 4.7 4.4 5.1 4.1
Female 9.1 8.9 8.5 8.9 9.0 9.1
G.C.E. (A/L) and above Total 9.1 7.6 8.7 8.2 9.2 8.3
Male 5.4 4.6 5.7 5.4 4.7 4.7
Female 13.2 10.8 11.8 11.1 13.5 11.9
Source: Department of Census and Statistics Page 11
Figure 5 - Unemployment rate by level of educa� on, 2011-2016
Source: Department of Census and Statistics Page 12
Indicator 2011 2012 2013 2014 2015 2016
Total 4.2 4.0 4.4 4.3 4.7 4.4
Male 2.7 2.8 3.2 3.1 3.0 2.9
Female 7.1 6.3 6.6 6.5 7.6 7.0
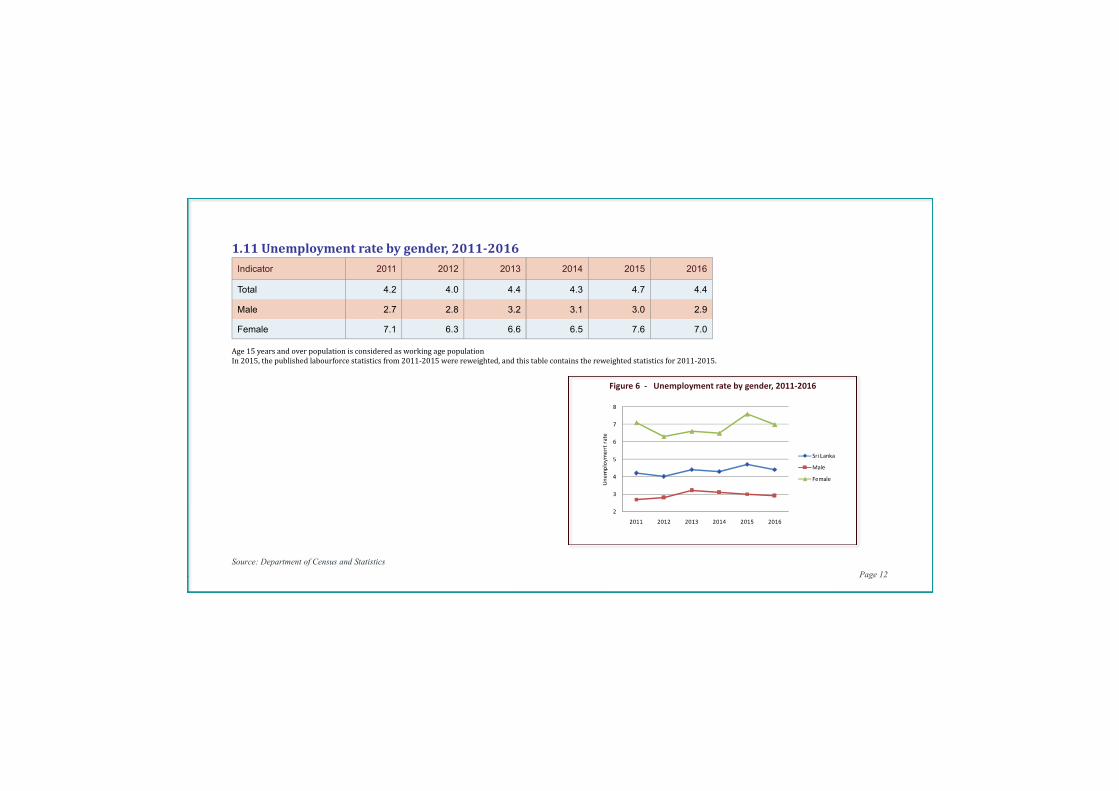
1.11Unemploymentratebygender,2011-2016
Age15yearsandoverpopulationisconsideredasworkingagepopulationIn2015,thepublishedlabourforcestatisticsfrom2011-2015werereweighted,andthistablecontainsthereweightedstatisticsfor2011-2015.
Figure 6 - Unemployment rate by gender, 2011-2016
Source: Department of Census and Statistics Page 13
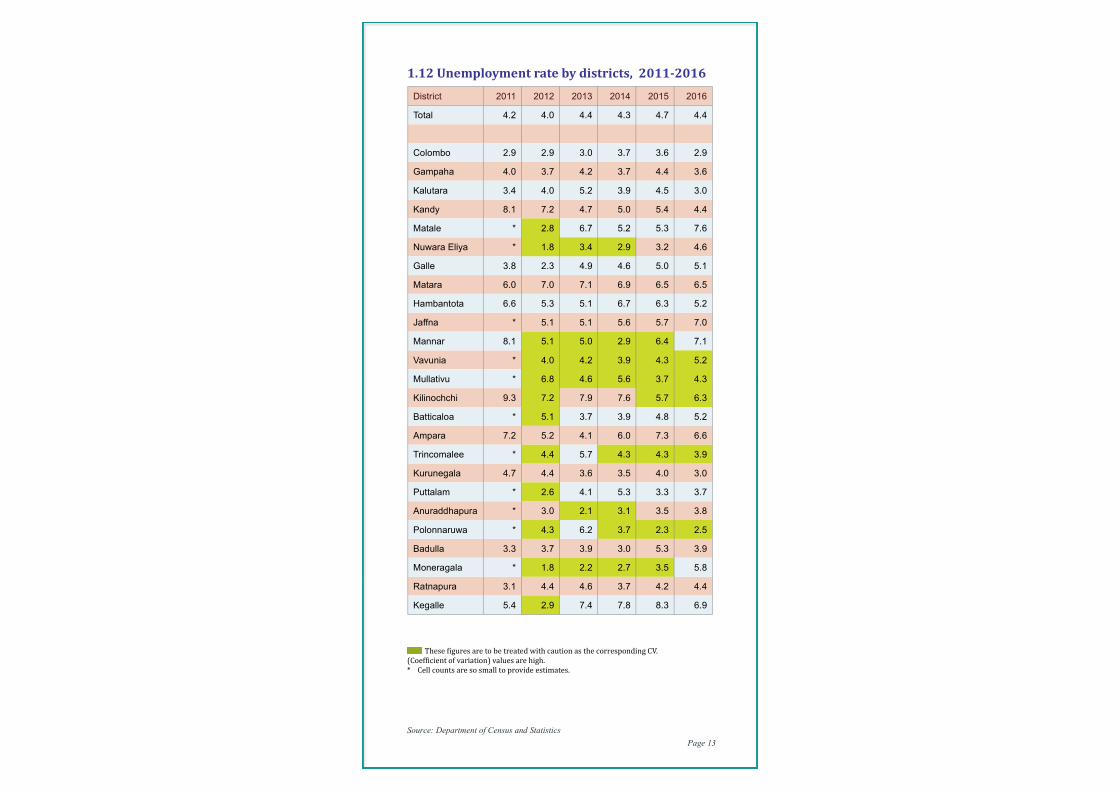
1.12Unemploymentratebydistricts,2011-2016
District 2011 2012 2013 2014 2015 2016
Total 4.2 4.0 4.4 4.3 4.7 4.4
Colombo 2.9 2.9 3.0 3.7 3.6 2.9
Gampaha 4.0 3.7 4.2 3.7 4.4 3.6
Kalutara 3.4 4.0 5.2 3.9 4.5 3.0
Kandy 8.1 7.2 4.7 5.0 5.4 4.4
Matale * 2.8 6.7 5.2 5.3 7.6
Nuwara Eliya * 1.8 3.4 2.9 3.2 4.6
Galle 3.8 2.3 4.9 4.6 5.0 5.1
Matara 6.0 7.0 7.1 6.9 6.5 6.5
Hambantota 6.6 5.3 5.1 6.7 6.3 5.2
Jaffna * 5.1 5.1 5.6 5.7 7.0
Mannar 8.1 5.1 5.0 2.9 6.4 7.1
Vavunia * 4.0 4.2 3.9 4.3 5.2
Mullativu * 6.8 4.6 5.6 3.7 4.3
Kilinochchi 9.3 7.2 7.9 7.6 5.7 6.3
Batticaloa * 5.1 3.7 3.9 4.8 5.2
Ampara 7.2 5.2 4.1 6.0 7.3 6.6
Trincomalee * 4.4 5.7 4.3 4.3 3.9
Kurunegala 4.7 4.4 3.6 3.5 4.0 3.0
Puttalam * 2.6 4.1 5.3 3.3 3.7
Anuraddhapura * 3.0 2.1 3.1 3.5 3.8
Polonnaruwa * 4.3 6.2 3.7 2.3 2.5
Badulla 3.3 3.7 3.9 3.0 5.3 3.9
Moneragala * 1.8 2.2 2.7 3.5 5.8
Ratnapura 3.1 4.4 4.6 3.7 4.2 4.4
Kegalle 5.4 2.9 7.4 7.8 8.3 6.9
These�iguresaretobetreatedwithcautionasthecorrespondingCV.(Coef�icientofvariation)valuesarehigh.*Cellcountsaresosmalltoprovideestimates.
Source: Department of Census and Statistics Page 14
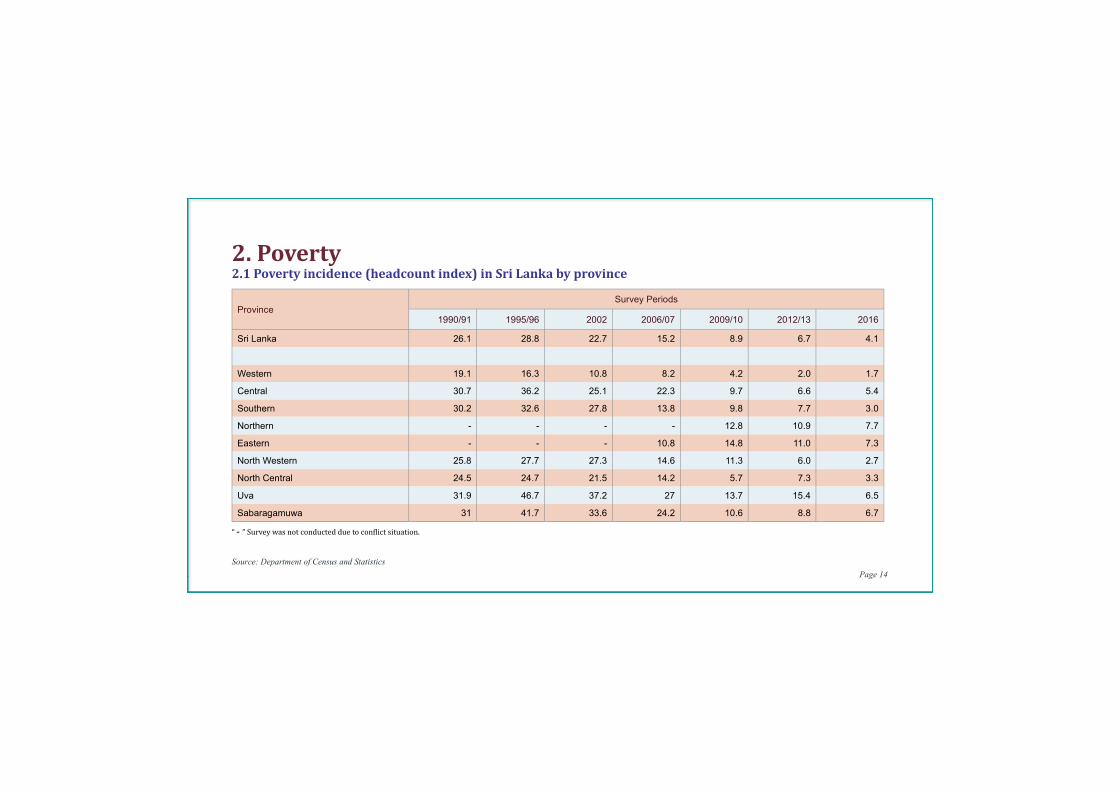
2.Poverty2.1Povertyincidence(headcountindex)inSriLankabyprovince
Province Survey Periods
1990/91 1995/96 2002 2006/07 2009/10 2012/13 2016
Sri Lanka 26.1 28.8 22.7 15.2 8.9 6.7 4.1
Western 19.1 16.3 10.8 8.2 4.2 2.0 1.7
Central 30.7 36.2 25.1 22.3 9.7 6.6 5.4
Southern 30.2 32.6 27.8 13.8 9.8 7.7 3.0
Northern - - - - 12.8 10.9 7.7
Eastern - - - 10.8 14.8 11.0 7.3
North Western 25.8 27.7 27.3 14.6 11.3 6.0 2.7
North Central 24.5 24.7 21.5 14.2 5.7 7.3 3.3
Uva 31.9 46.7 37.2 27 13.7 15.4 6.5
Sabaragamuwa 31 41.7 33.6 24.2 10.6 8.8 6.7
“- ”Surveywasnotconductedduetocon�lictsituation.
Source: Department of Census and Statistics Page 15
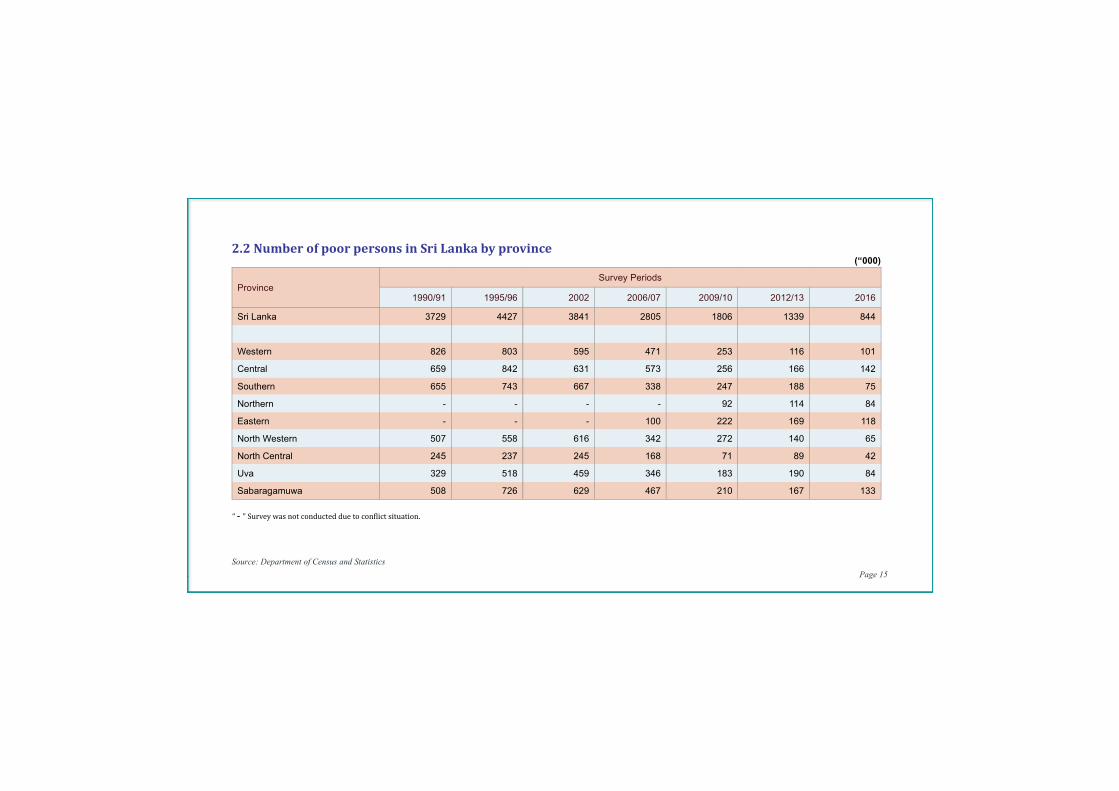
2.2NumberofpoorpersonsinSriLankabyprovince
Province Survey Periods
1990/91 1995/96 2002 2006/07 2009/10 2012/13 2016
Sri Lanka 3729 4427 3841 2805 1806 1339 844
Western 826 803 595 471 253 116 101
Central 659 842 631 573 256 166 142
Southern 655 743 667 338 247 188 75
Northern - - - - 92 114 84
Eastern - - - 100 222 169 118
North Western 507 558 616 342 272 140 65
North Central 245 237 245 168 71 89 42
Uva 329 518 459 346 183 190 84
Sabaragamuwa 508 726 629 467 210 167 133
“- ”Surveywasnotconductedduetocon�lictsituation.
(“000)
Source: Department of Census and Statistics Page 16
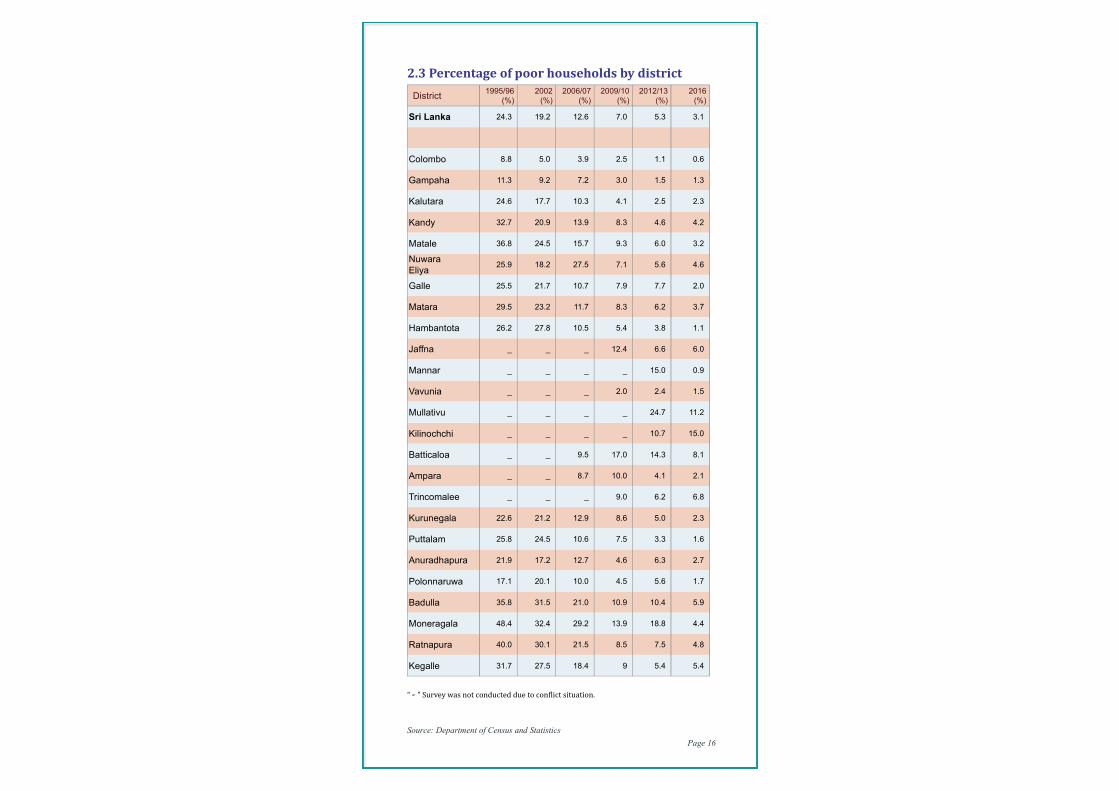
2.3Percentageofpoorhouseholdsbydistrict
District1995/96
(%)2002
(%)2006/07
(%)2009/10
(%)2012/13
(%)2016
(%)
Sri Lanka 24.3 19.2 12.6 7.0 5.3 3.1
Colombo 8.8 5.0 3.9 2.5 1.1 0.6
Gampaha 11.3 9.2 7.2 3.0 1.5 1.3
Kalutara 24.6 17.7 10.3 4.1 2.5 2.3
Kandy 32.7 20.9 13.9 8.3 4.6 4.2
Matale 36.8 24.5 15.7 9.3 6.0 3.2
Nuwara Eliya
25.9 18.2 27.5 7.1 5.6 4.6
Galle 25.5 21.7 10.7 7.9 7.7 2.0
Matara 29.5 23.2 11.7 8.3 6.2 3.7
Hambantota 26.2 27.8 10.5 5.4 3.8 1.1
Jaffna _ _ _ 12.4 6.6 6.0
Mannar _ _ _ _ 15.0 0.9
Vavunia _ _ _ 2.0 2.4 1.5
Mullativu _ _ _ _ 24.7 11.2
Kilinochchi _ _ _ _ 10.7 15.0
Batticaloa _ _ 9.5 17.0 14.3 8.1
Ampara _ _ 8.7 10.0 4.1 2.1
Trincomalee _ _ _ 9.0 6.2 6.8
Kurunegala 22.6 21.2 12.9 8.6 5.0 2.3
Puttalam 25.8 24.5 10.6 7.5 3.3 1.6
Anuradhapura 21.9 17.2 12.7 4.6 6.3 2.7
Polonnaruwa 17.1 20.1 10.0 4.5 5.6 1.7
Badulla 35.8 31.5 21.0 10.9 10.4 5.9
Moneragala 48.4 32.4 29.2 13.9 18.8 4.4
Ratnapura 40.0 30.1 21.5 8.5 7.5 4.8
Kegalle 31.7 27.5 18.4 9 5.4 5.4
“- ”Surveywasnotconductedduetocon�lictsituation.
Source: Department of Census and Statistics Page 17
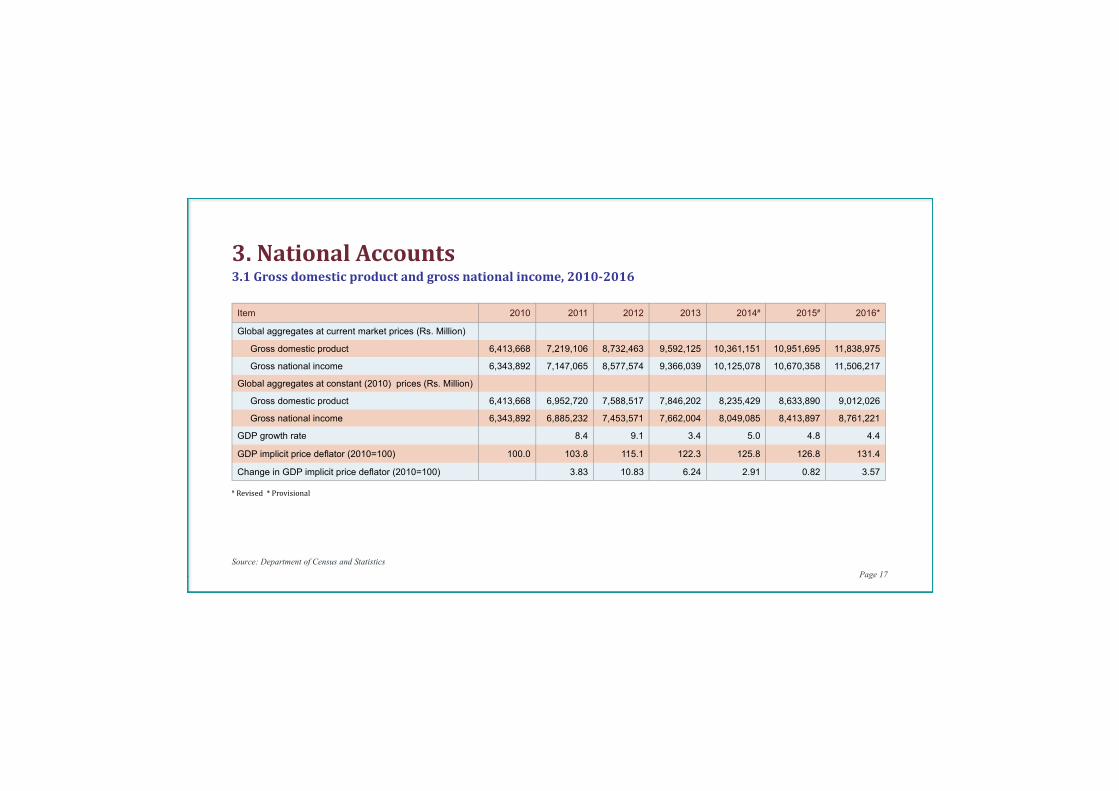
3.1Grossdomesticproductandgrossnationalincome,2010-2016
Item 2010 2011 2012 2013 2014# 2015# 2016*
Global aggregates at current market prices (Rs. Million)
Gross domestic product 6,413,668 7,219,106 8,732,463 9,592,125 10,361,151 10,951,695 11,838,975
Gross national income 6,343,892 7,147,065 8,577,574 9,366,039 10,125,078 10,670,358 11,506,217
Global aggregates at constant (2010) prices (Rs. Million)
Gross domestic product 6,413,668 6,952,720 7,588,517 7,846,202 8,235,429 8,633,890 9,012,026
Gross national income 6,343,892 6,885,232 7,453,571 7,662,004 8,049,085 8,413,897 8,761,221
GDP growth rate 8.4 9.1 3.4 5.0 4.8 4.4
GDP implicit price defl ator (2010=100) 100.0 103.8 115.1 122.3 125.8 126.8 131.4
Change in GDP implicit price defl ator (2010=100) 3.83 10.83 6.24 2.91 0.82 3.57
3.NationalAccounts
#Revised*Provisional
Source: Department of Census and Statistics Page 18
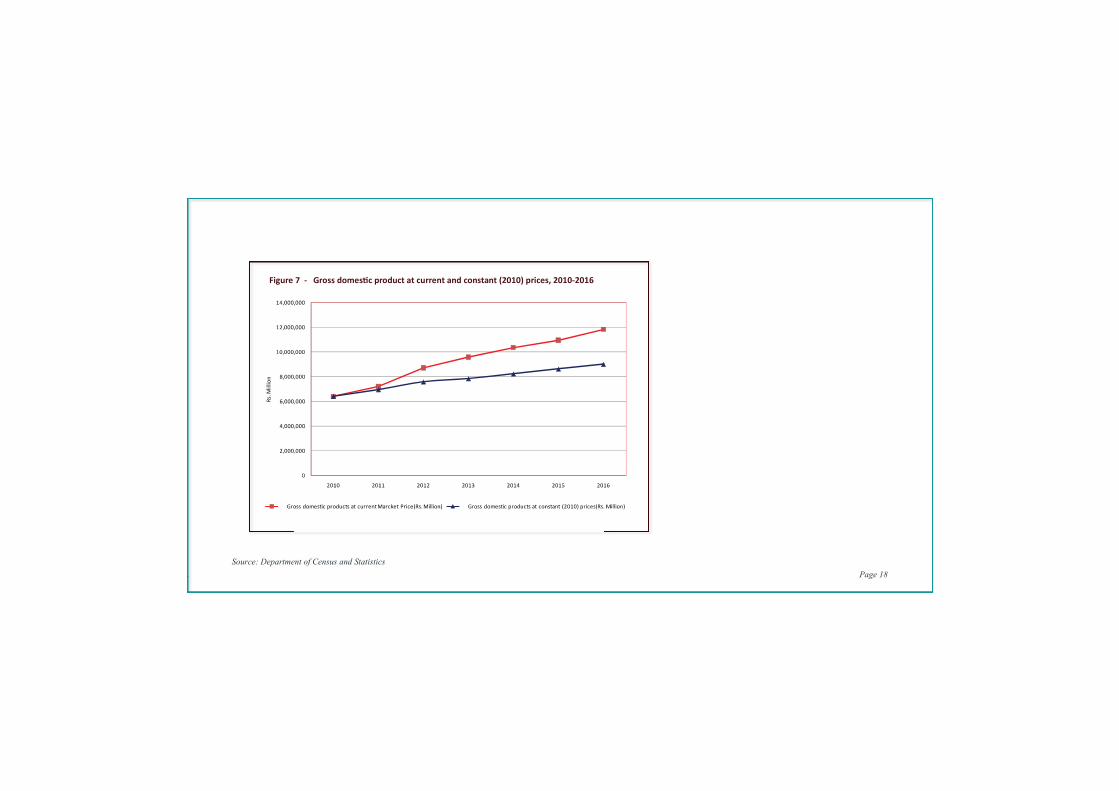
Figure 7 - Gross domes� c product at current and constant (2010) prices, 2010-2016
Source: Department of Census and Statistics Page 19
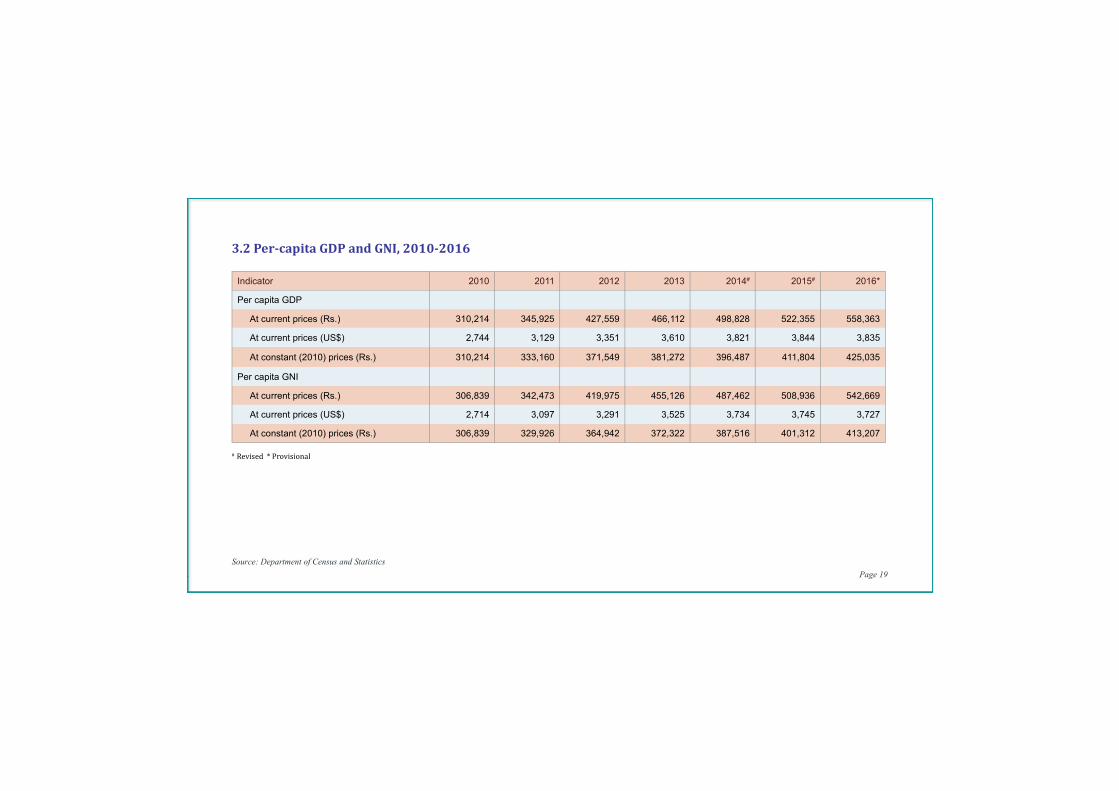
Indicator 2010 2011 2012 2013 2014# 2015# 2016*
Per capita GDP
At current prices (Rs.) 310,214 345,925 427,559 466,112 498,828 522,355 558,363
At current prices (US$) 2,744 3,129 3,351 3,610 3,821 3,844 3,835
At constant (2010) prices (Rs.) 310,214 333,160 371,549 381,272 396,487 411,804 425,035
Per capita GNI
At current prices (Rs.) 306,839 342,473 419,975 455,126 487,462 508,936 542,669
At current prices (US$) 2,714 3,097 3,291 3,525 3,734 3,745 3,727
At constant (2010) prices (Rs.) 306,839 329,926 364,942 372,322 387,516 401,312 413,207
3.2Per-capitaGDPandGNI,2010-2016
#Revised*Provisional
Source: Department of Census and Statistics Page 20
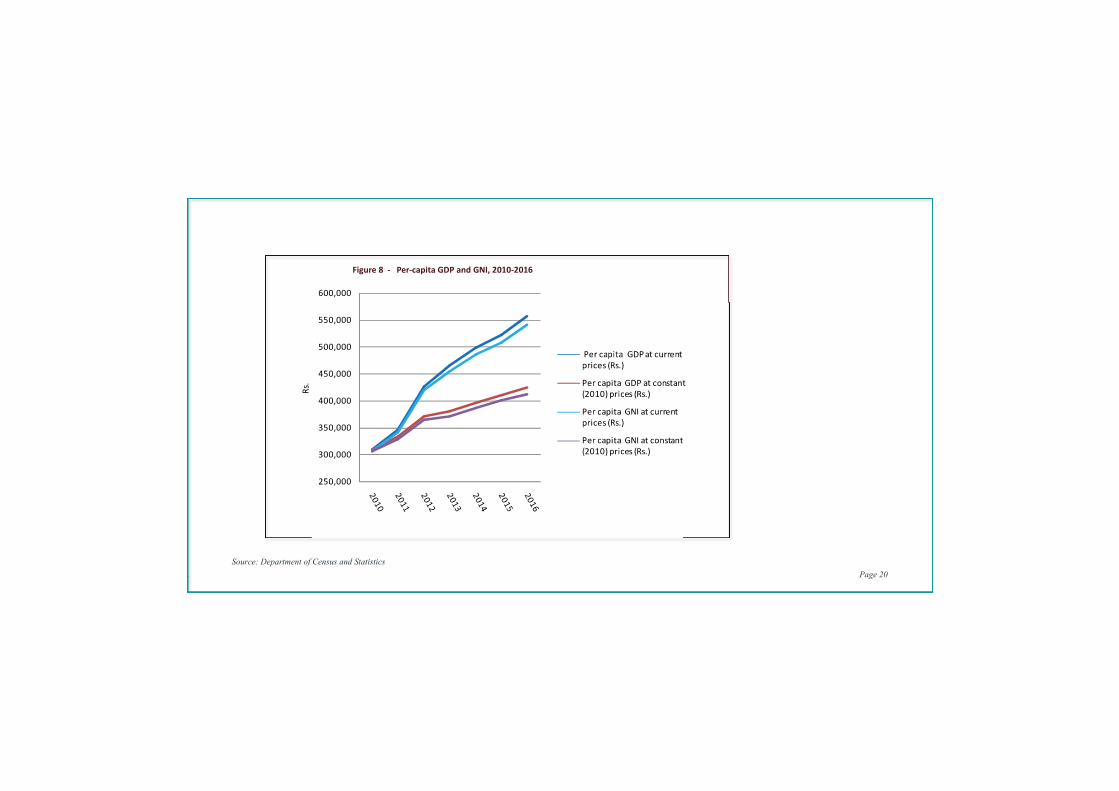
Figure 8 - Per-capita GDP and GNI, 2010-2016
Source: Department of Census and Statistics Page 21
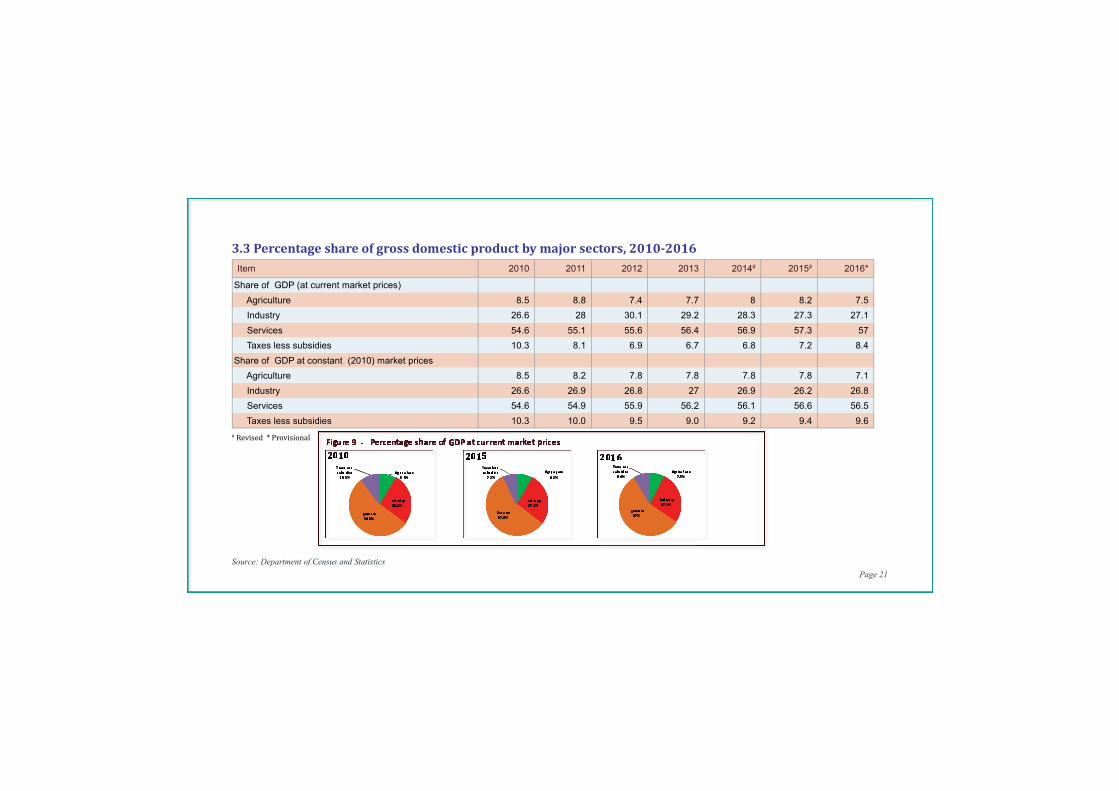
Item 2010 2011 2012 2013 2014# 2015# 2016*
Share of GDP (at current market prices)
Agriculture 8.5 8.8 7.4 7.7 8 8.2 7.5
Industry 26.6 28 30.1 29.2 28.3 27.3 27.1
Services 54.6 55.1 55.6 56.4 56.9 57.3 57
Taxes less subsidies 10.3 8.1 6.9 6.7 6.8 7.2 8.4
Share of GDP at constant (2010) market prices
Agriculture 8.5 8.2 7.8 7.8 7.8 7.8 7.1
Industry 26.6 26.9 26.8 27 26.9 26.2 26.8
Services 54.6 54.9 55.9 56.2 56.1 56.6 56.5
Taxes less subsidies 10.3 10.0 9.5 9.0 9.2 9.4 9.6
3.3Percentageshareofgrossdomesticproductbymajorsectors,2010-2016
#Revised*ProvisionalFigure 9 - Percentage share of GDP at current market prices
2010 2015 2016
Source: Department of Census and Statistics Page 22
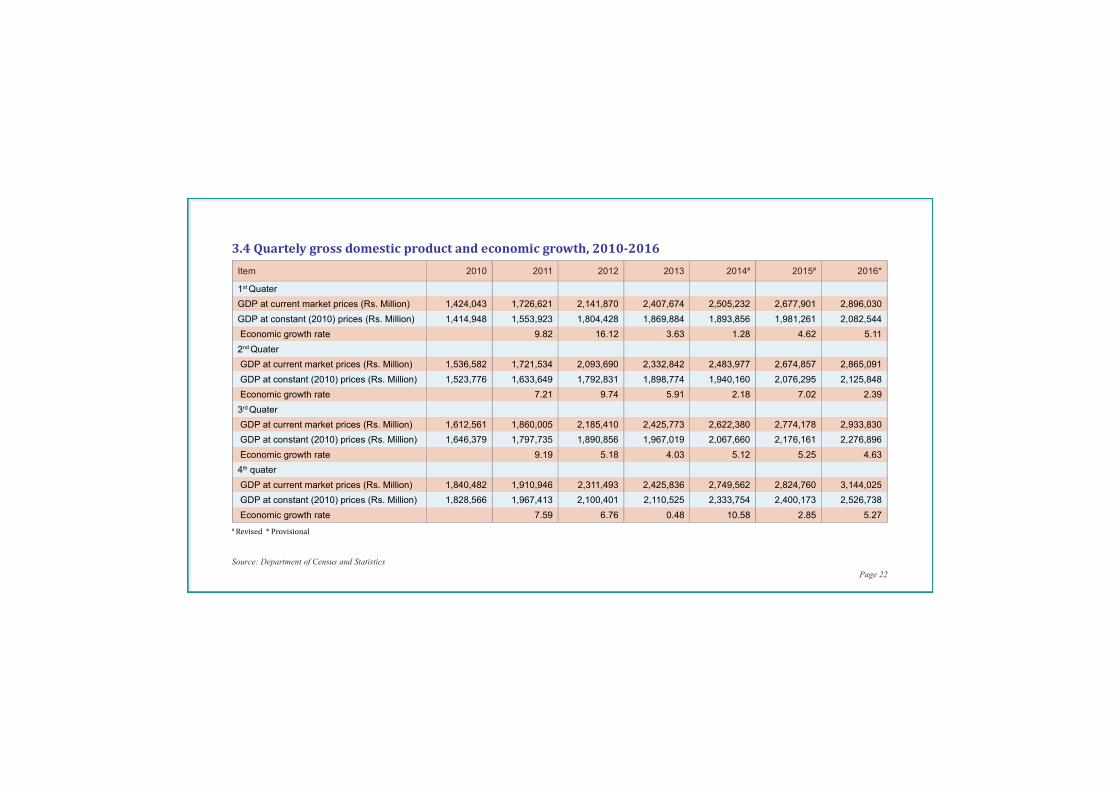
3.4Quartelygrossdomesticproductandeconomicgrowth,2010-2016
Item 2010 2011 2012 2013 2014# 2015# 2016*
1st Quater
GDP at current market prices (Rs. Million) 1,424,043 1,726,621 2,141,870 2,407,674 2,505,232 2,677,901 2,896,030
GDP at constant (2010) prices (Rs. Million) 1,414,948 1,553,923 1,804,428 1,869,884 1,893,856 1,981,261 2,082,544
Economic growth rate 9.82 16.12 3.63 1.28 4.62 5.11
2nd Quater
GDP at current market prices (Rs. Million) 1,536,582 1,721,534 2,093,690 2,332,842 2,483,977 2,674,857 2,865,091
GDP at constant (2010) prices (Rs. Million) 1,523,776 1,633,649 1,792,831 1,898,774 1,940,160 2,076,295 2,125,848
Economic growth rate 7.21 9.74 5.91 2.18 7.02 2.39
3rd Quater
GDP at current market prices (Rs. Million) 1,612,561 1,860,005 2,185,410 2,425,773 2,622,380 2,774,178 2,933,830
GDP at constant (2010) prices (Rs. Million) 1,646,379 1,797,735 1,890,856 1,967,019 2,067,660 2,176,161 2,276,896
Economic growth rate 9.19 5.18 4.03 5.12 5.25 4.63
4th quater
GDP at current market prices (Rs. Million) 1,840,482 1,910,946 2,311,493 2,425,836 2,749,562 2,824,760 3,144,025
GDP at constant (2010) prices (Rs. Million) 1,828,566 1,967,413 2,100,401 2,110,525 2,333,754 2,400,173 2,526,738
Economic growth rate 7.59 6.76 0.48 10.58 2.85 5.27
#Revised*Provisional
Source: Department of Census and Statistics Page 23
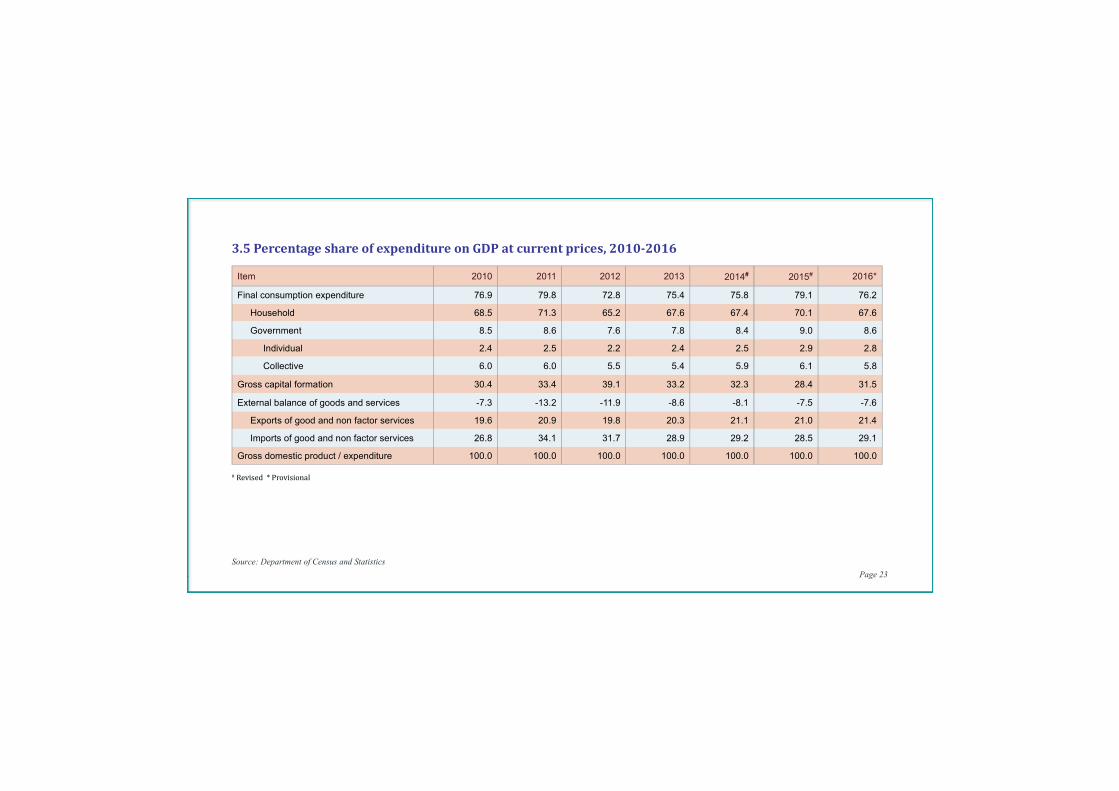
3.5PercentageshareofexpenditureonGDPatcurrentprices,2010-2016
Item 2010 2011 2012 2013 2014# 2015# 2016*
Final consumption expenditure 76.9 79.8 72.8 75.4 75.8 79.1 76.2
Household 68.5 71.3 65.2 67.6 67.4 70.1 67.6
Government 8.5 8.6 7.6 7.8 8.4 9.0 8.6
Individual 2.4 2.5 2.2 2.4 2.5 2.9 2.8
Collective 6.0 6.0 5.5 5.4 5.9 6.1 5.8
Gross capital formation 30.4 33.4 39.1 33.2 32.3 28.4 31.5
External balance of goods and services -7.3 -13.2 -11.9 -8.6 -8.1 -7.5 -7.6
Exports of good and non factor services 19.6 20.9 19.8 20.3 21.1 21.0 21.4
Imports of good and non factor services 26.8 34.1 31.7 28.9 29.2 28.5 29.1
Gross domestic product / expenditure 100.0 100.0 100.0 100.0 100.0 100.0 100.0
#Revised*Provisional
Source: Department of Census and Statistics Page 24
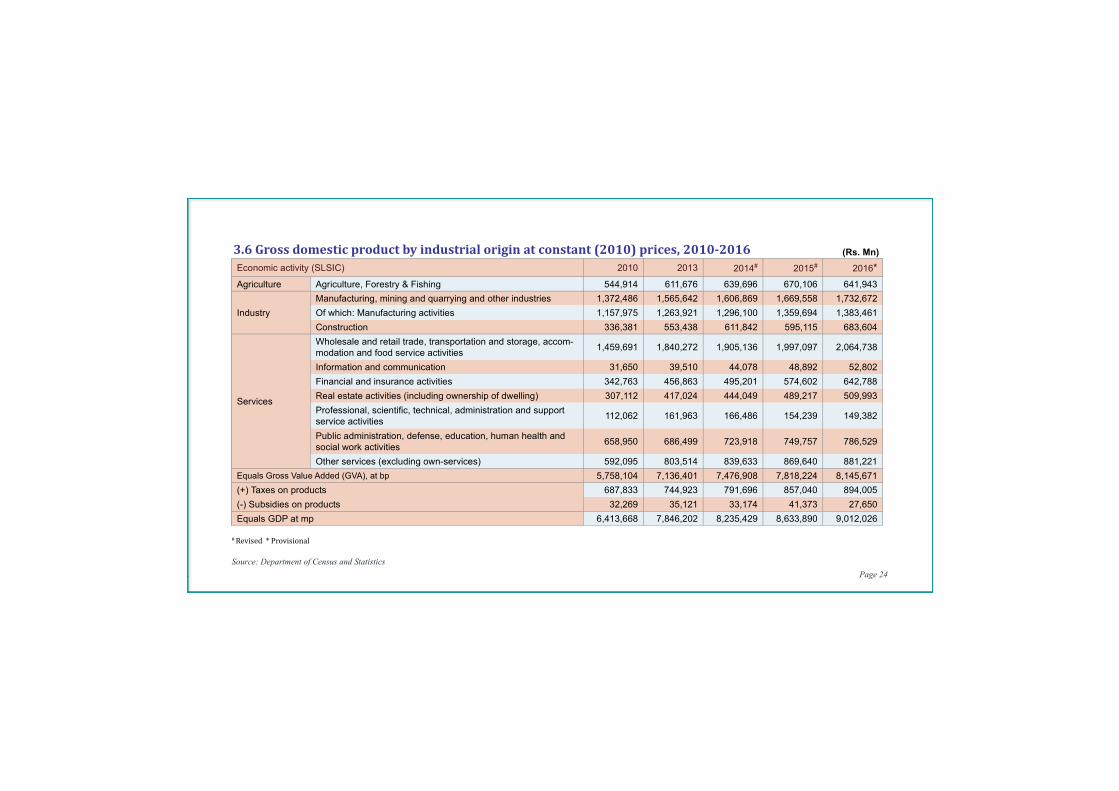
3.6Grossdomesticproductbyindustrialoriginatconstant(2010)prices,2010-2016
Economic activity (SLSIC) 2010 2013 2014# 2015# 2016*
Agriculture Agriculture, Forestry & Fishing 544,914 611,676 639,696 670,106 641,943
Industry
Manufacturing, mining and quarrying and other industries 1,372,486 1,565,642 1,606,869 1,669,558 1,732,672
Of which: Manufacturing activities 1,157,975 1,263,921 1,296,100 1,359,694 1,383,461
Construction 336,381 553,438 611,842 595,115 683,604
Services
Wholesale and retail trade, transportation and storage, accom-modation and food service activities
1,459,691 1,840,272 1,905,136 1,997,097 2,064,738
Information and communication 31,650 39,510 44,078 48,892 52,802
Financial and insurance activities 342,763 456,863 495,201 574,602 642,788
Real estate activities (including ownership of dwelling) 307,112 417,024 444,049 489,217 509,993
Professional, scientifi c, technical, administration and support service activities
112,062 161,963 166,486 154,239 149,382
Public administration, defense, education, human health and social work activities
658,950 686,499 723,918 749,757 786,529
Other services (excluding own-services) 592,095 803,514 839,633 869,640 881,221
Equals Gross Value Added (GVA), at bp 5,758,104 7,136,401 7,476,908 7,818,224 8,145,671
(+) Taxes on products 687,833 744,923 791,696 857,040 894,005
(-) Subsidies on products 32,269 35,121 33,174 41,373 27,650
Equals GDP at mp 6,413,668 7,846,202 8,235,429 8,633,890 9,012,026
#Revised*Provisional
(Rs. Mn)
Source: Department of Census and Statistics Page 25
#Revised*Provisional
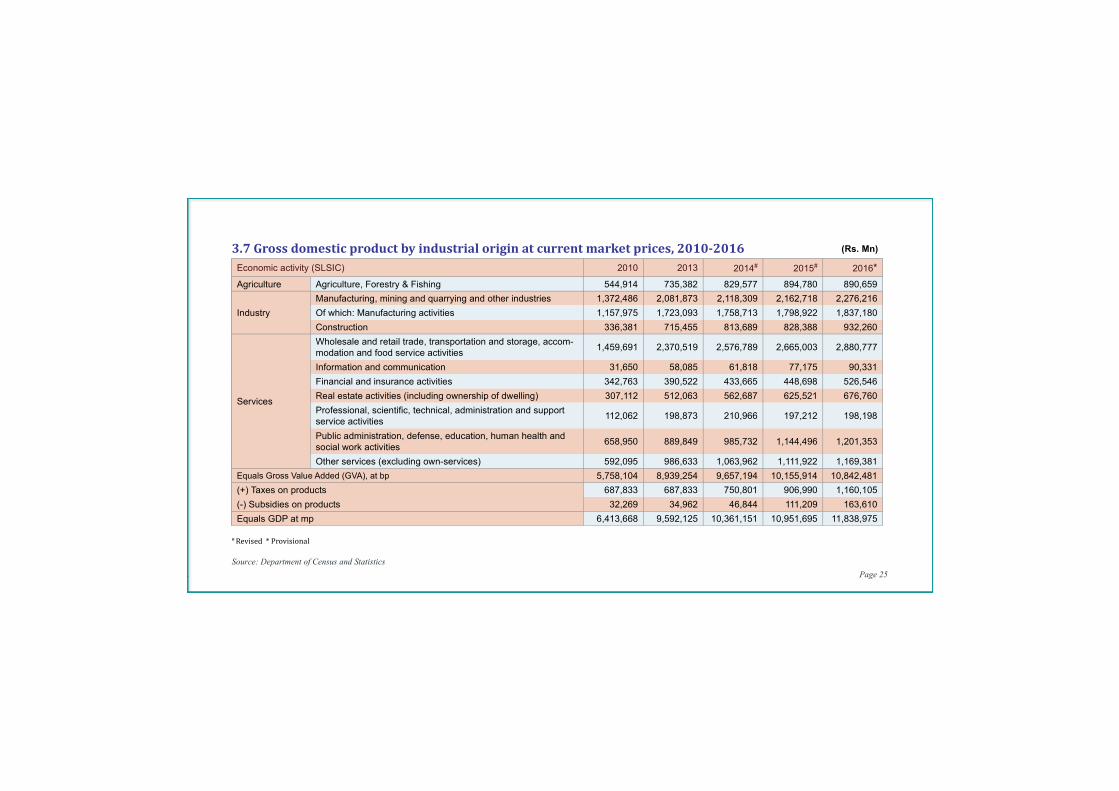
3.7Grossdomesticproductbyindustrialoriginatcurrentmarketprices,2010-2016 (Rs. Mn)
Economic activity (SLSIC) 2010 2013 2014# 2015# 2016*
Agriculture Agriculture, Forestry & Fishing 544,914 735,382 829,577 894,780 890,659
Industry
Manufacturing, mining and quarrying and other industries 1,372,486 2,081,873 2,118,309 2,162,718 2,276,216
Of which: Manufacturing activities 1,157,975 1,723,093 1,758,713 1,798,922 1,837,180
Construction 336,381 715,455 813,689 828,388 932,260
Services
Wholesale and retail trade, transportation and storage, accom-modation and food service activities
1,459,691 2,370,519 2,576,789 2,665,003 2,880,777
Information and communication 31,650 58,085 61,818 77,175 90,331
Financial and insurance activities 342,763 390,522 433,665 448,698 526,546
Real estate activities (including ownership of dwelling) 307,112 512,063 562,687 625,521 676,760
Professional, scientifi c, technical, administration and support service activities
112,062 198,873 210,966 197,212 198,198
Public administration, defense, education, human health and social work activities
658,950 889,849 985,732 1,144,496 1,201,353
Other services (excluding own-services) 592,095 986,633 1,063,962 1,111,922 1,169,381
Equals Gross Value Added (GVA), at bp 5,758,104 8,939,254 9,657,194 10,155,914 10,842,481
(+) Taxes on products 687,833 687,833 750,801 906,990 1,160,105
(-) Subsidies on products 32,269 34,962 46,844 111,209 163,610
Equals GDP at mp 6,413,668 9,592,125 10,361,151 10,951,695 11,838,975
Source: Department of Census and Statistics Page 26
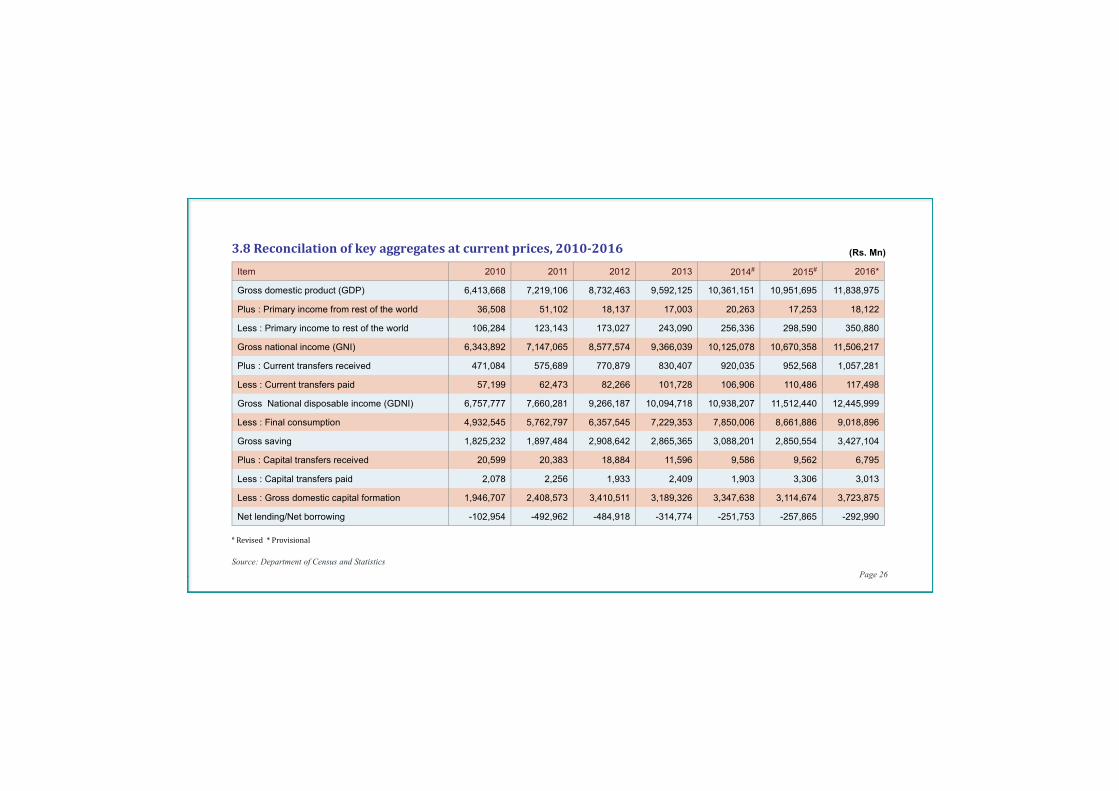
3.8Reconcilationofkeyaggregatesatcurrentprices,2010-2016
Item 2010 2011 2012 2013 2014# 2015# 2016*
Gross domestic product (GDP) 6,413,668 7,219,106 8,732,463 9,592,125 10,361,151 10,951,695 11,838,975
Plus : Primary income from rest of the world 36,508 51,102 18,137 17,003 20,263 17,253 18,122
Less : Primary income to rest of the world 106,284 123,143 173,027 243,090 256,336 298,590 350,880
Gross national income (GNI) 6,343,892 7,147,065 8,577,574 9,366,039 10,125,078 10,670,358 11,506,217
Plus : Current transfers received 471,084 575,689 770,879 830,407 920,035 952,568 1,057,281
Less : Current transfers paid 57,199 62,473 82,266 101,728 106,906 110,486 117,498
Gross National disposable income (GDNI) 6,757,777 7,660,281 9,266,187 10,094,718 10,938,207 11,512,440 12,445,999
Less : Final consumption 4,932,545 5,762,797 6,357,545 7,229,353 7,850,006 8,661,886 9,018,896
Gross saving 1,825,232 1,897,484 2,908,642 2,865,365 3,088,201 2,850,554 3,427,104
Plus : Capital transfers received 20,599 20,383 18,884 11,596 9,586 9,562 6,795
Less : Capital transfers paid 2,078 2,256 1,933 2,409 1,903 3,306 3,013
Less : Gross domestic capital formation 1,946,707 2,408,573 3,410,511 3,189,326 3,347,638 3,114,674 3,723,875
Net lending/Net borrowing -102,954 -492,962 -484,918 -314,774 -251,753 -257,865 -292,990
#Revised*Provisional
(Rs. Mn)
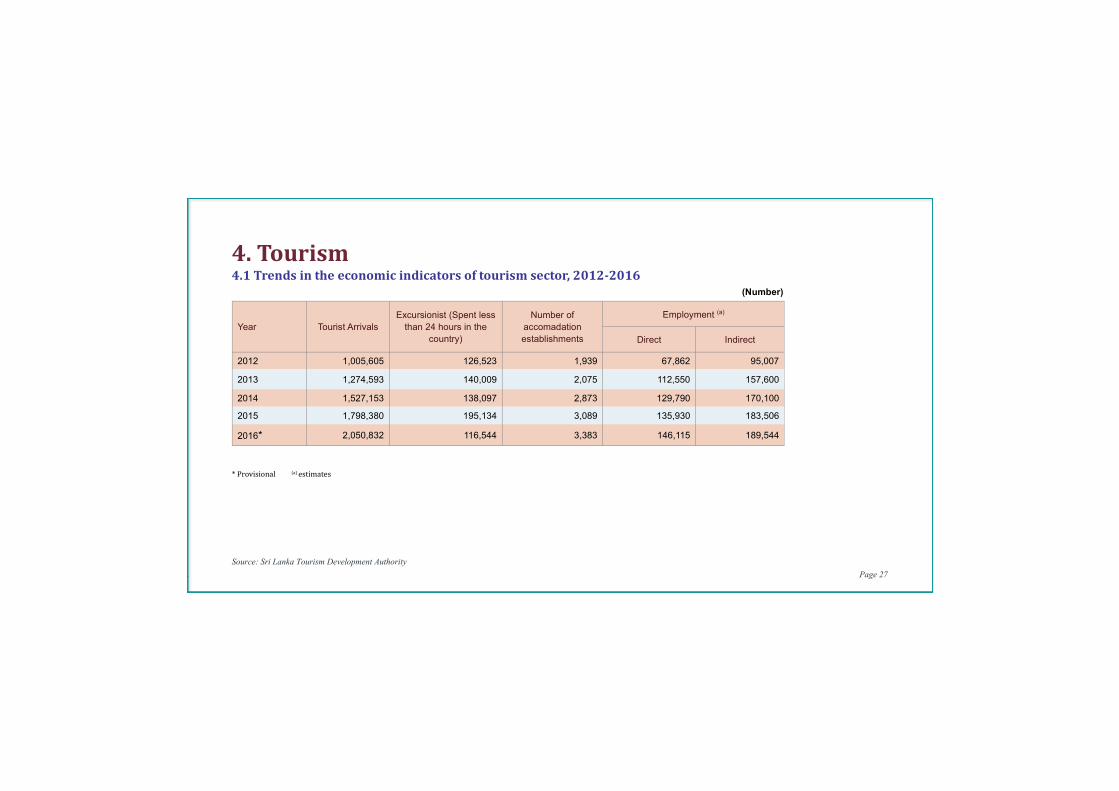
Source: Sri Lanka Tourism Development Authority Page 27
4.1Trendsintheeconomicindicatorsoftourismsector,2012-2016
Year Tourist Arrivals
Excursionist (Spent less
than 24 hours in the
country)
Number of
accomadation
establishments
Employment (a)
Direct Indirect
2012 1,005,605 126,523 1,939 67,862 95,007
2013 1,274,593 140,009 2,075 112,550 157,600
2014 1,527,153 138,097 2,873 129,790 170,100
2015 1,798,380 195,134 3,089 135,930 183,506
2016* 2,050,832 116,544 3,383 146,115 189,544
4.Tourism
*Provisional(a)estimates
(Number)
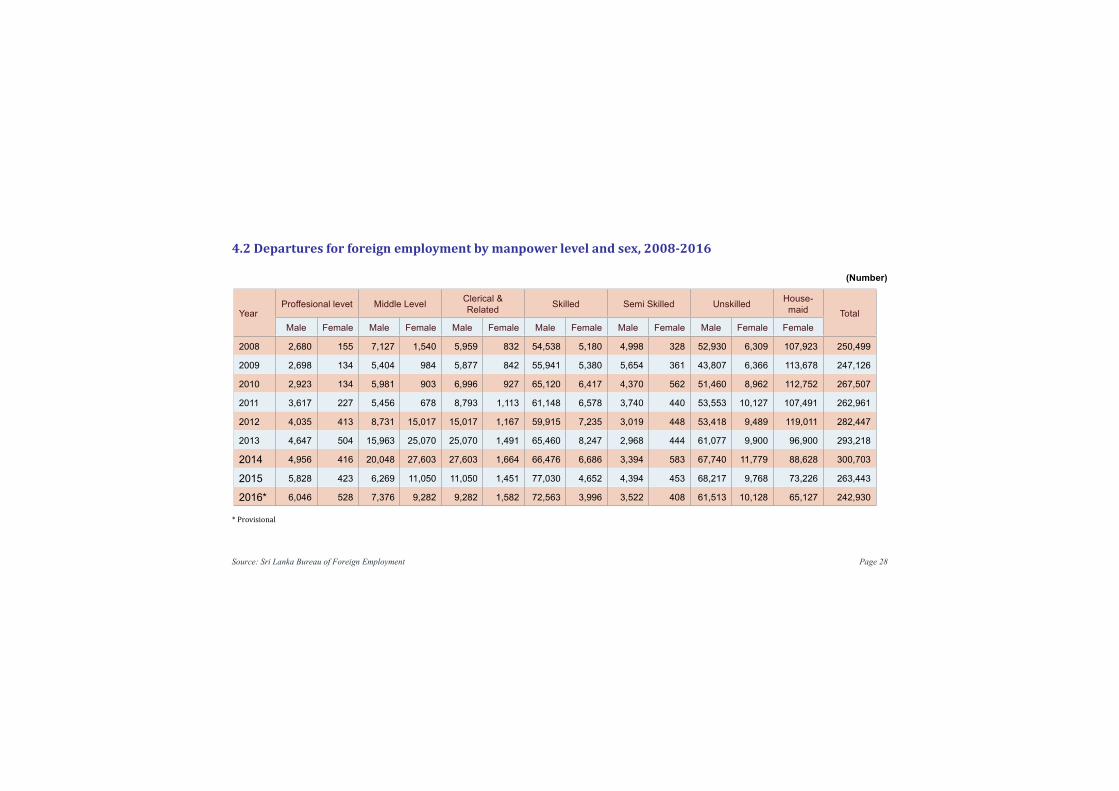
Source: Sri Lanka Bureau of Foreign Employment Page 28
4.2Departuresforforeignemploymentbymanpowerlevelandsex,2008-2016
YearProffesional levet Middle Level
Clerical & Related
Skilled Semi Skilled UnskilledHouse-maid Total
Male Female Male Female Male Female Male Female Male Female Male Female Female
2008 2,680 155 7,127 1,540 5,959 832 54,538 5,180 4,998 328 52,930 6,309 107,923 250,499
2009 2,698 134 5,404 984 5,877 842 55,941 5,380 5,654 361 43,807 6,366 113,678 247,126
2010 2,923 134 5,981 903 6,996 927 65,120 6,417 4,370 562 51,460 8,962 112,752 267,507
2011 3,617 227 5,456 678 8,793 1,113 61,148 6,578 3,740 440 53,553 10,127 107,491 262,961
2012 4,035 413 8,731 15,017 15,017 1,167 59,915 7,235 3,019 448 53,418 9,489 119,011 282,447
2013 4,647 504 15,963 25,070 25,070 1,491 65,460 8,247 2,968 444 61,077 9,900 96,900 293,218
2014 4,956 416 20,048 27,603 27,603 1,664 66,476 6,686 3,394 583 67,740 11,779 88,628 300,703
2015 5,828 423 6,269 11,050 11,050 1,451 77,030 4,652 4,394 453 68,217 9,768 73,226 263,443
2016* 6,046 528 7,376 9,282 9,282 1,582 72,563 3,996 3,522 408 61,513 10,128 65,127 242,930
*Provisional
(Number)
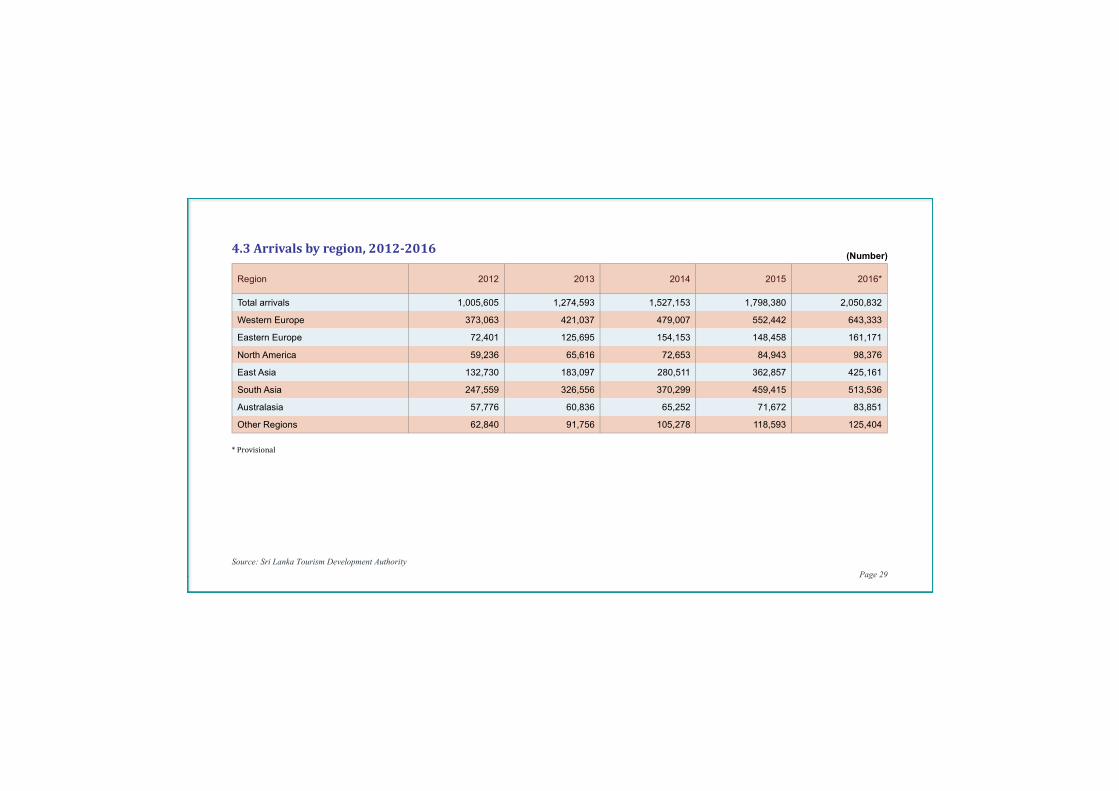
Source: Sri Lanka Tourism Development Authority Page 29
4.3Arrivalsbyregion,2012-2016
Region 2012 2013 2014 2015 2016*
Total arrivals 1,005,605 1,274,593 1,527,153 1,798,380 2,050,832
Western Europe 373,063 421,037 479,007 552,442 643,333
Eastern Europe 72,401 125,695 154,153 148,458 161,171
North America 59,236 65,616 72,653 84,943 98,376
East Asia 132,730 183,097 280,511 362,857 425,161
South Asia 247,559 326,556 370,299 459,415 513,536
Australasia 57,776 60,836 65,252 71,672 83,851
Other Regions 62,840 91,756 105,278 118,593 125,404
*Provisional
(Number)
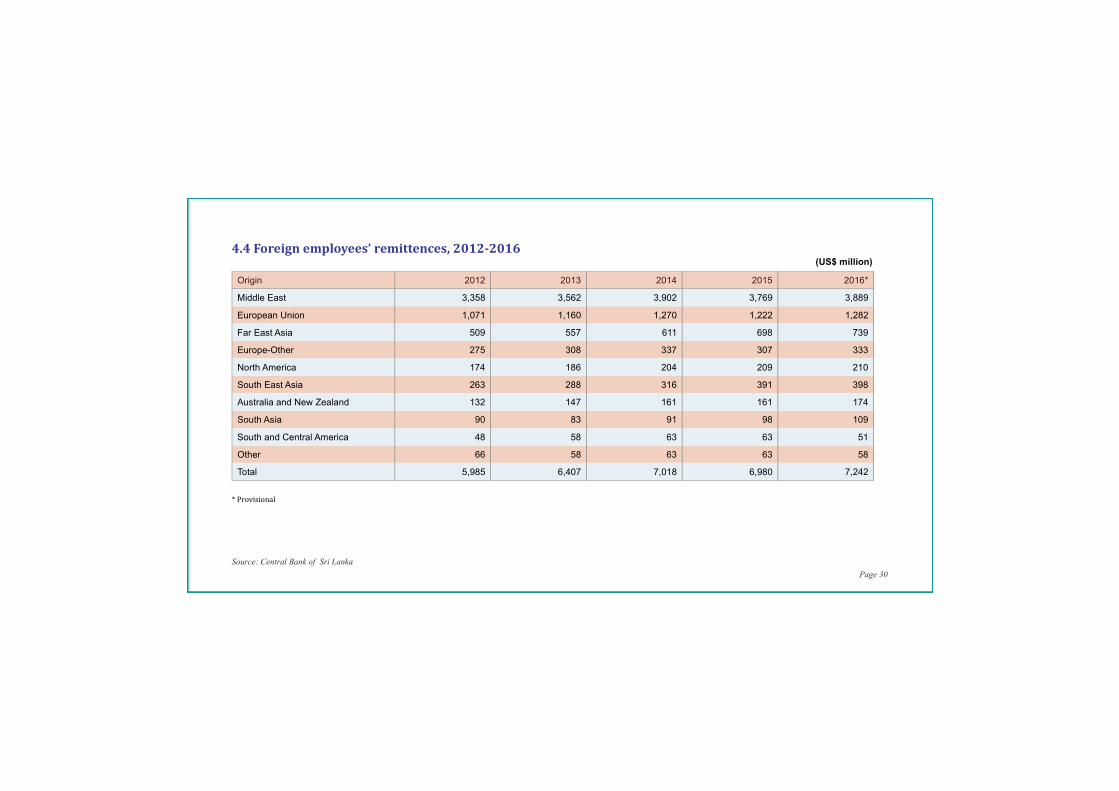
Source: Central Bank of Sri Lanka Page 30
4.4Foreignemployees’remittences,2012-2016
Origin 2012 2013 2014 2015 2016*
Middle East 3,358 3,562 3,902 3,769 3,889
European Union 1,071 1,160 1,270 1,222 1,282
Far East Asia 509 557 611 698 739
Europe-Other 275 308 337 307 333
North America 174 186 204 209 210
South East Asia 263 288 316 391 398
Australia and New Zealand 132 147 161 161 174
South Asia 90 83 91 98 109
South and Central America 48 58 63 63 51
Other 66 58 63 63 58
Total 5,985 6,407 7,018 6,980 7,242
(US$ million)
*Provisional
Source: Department of Census and Statistics Page 31
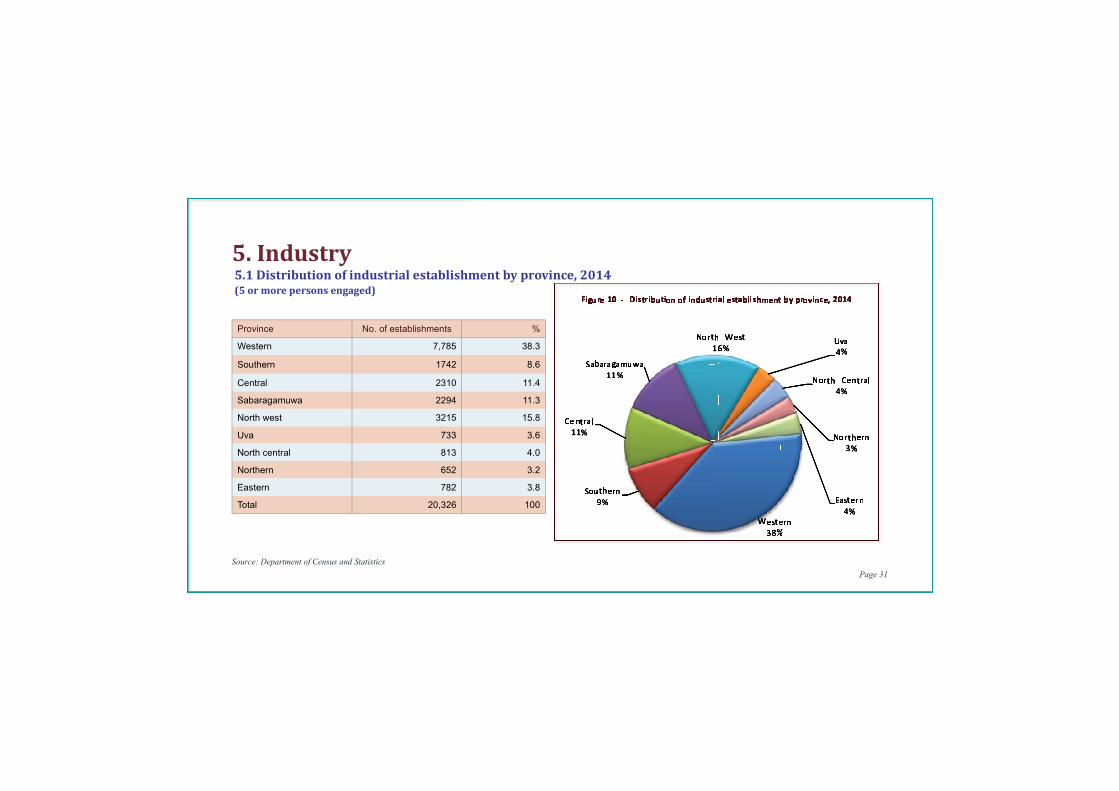
5.1Distributionofindustrialestablishmentbyprovince,2014(5ormorepersonsengaged)
5.Industry
Province No. of establishments %
Western 7,785 38.3
Southern 1742 8.6
Central 2310 11.4
Sabaragamuwa 2294 11.3
North west 3215 15.8
Uva 733 3.6
North central 813 4.0
Northern 652 3.2
Eastern 782 3.8
Total 20,326 100
Figure 10 - Distribu� on of industrial establishment by province, 2014
Source: Department of Census and Statistics Page 32
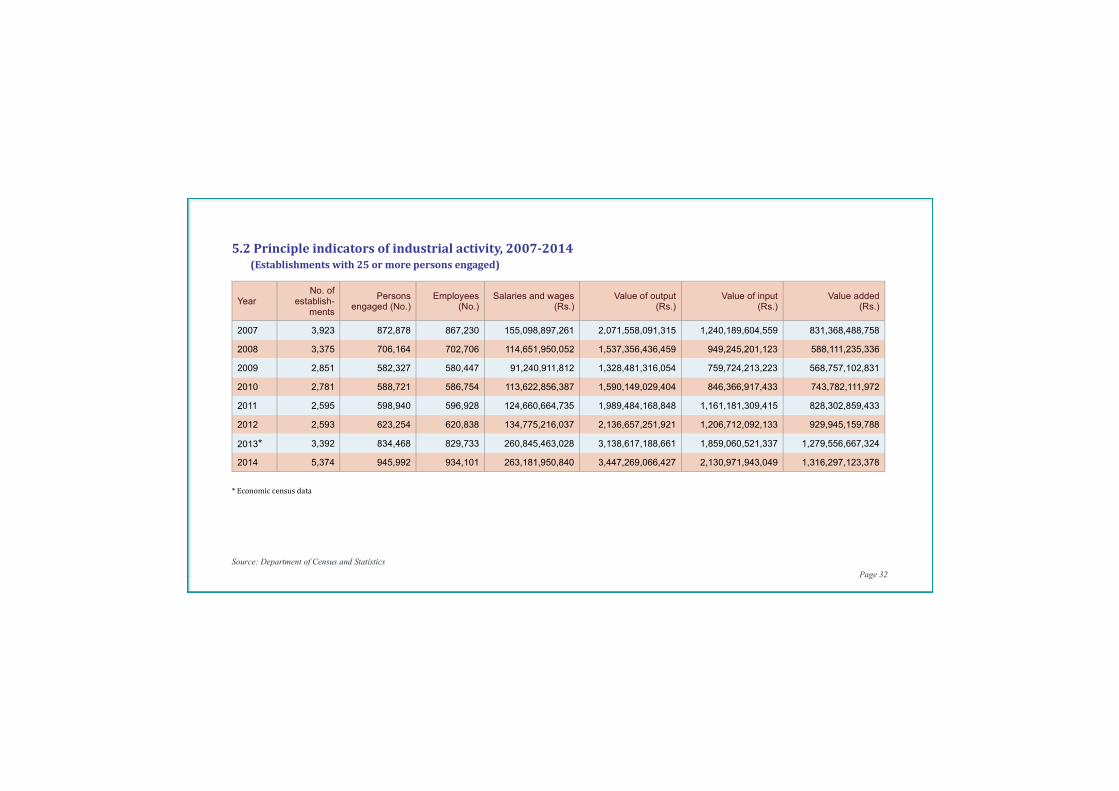
YearNo. of
establish-ments
Persons engaged (No.)
Employees (No.)
Salaries and wages (Rs.)
Value of output(Rs.)
Value of input(Rs.)
Value added(Rs.)
2007 3,923 872,878 867,230 155,098,897,261 2,071,558,091,315 1,240,189,604,559 831,368,488,758
2008 3,375 706,164 702,706 114,651,950,052 1,537,356,436,459 949,245,201,123 588,111,235,336
2009 2,851 582,327 580,447 91,240,911,812 1,328,481,316,054 759,724,213,223 568,757,102,831
2010 2,781 588,721 586,754 113,622,856,387 1,590,149,029,404 846,366,917,433 743,782,111,972
2011 2,595 598,940 596,928 124,660,664,735 1,989,484,168,848 1,161,181,309,415 828,302,859,433
2012 2,593 623,254 620,838 134,775,216,037 2,136,657,251,921 1,206,712,092,133 929,945,159,788
2013* 3,392 834,468 829,733 260,845,463,028 3,138,617,188,661 1,859,060,521,337 1,279,556,667,324
2014 5,374 945,992 934,101 263,181,950,840 3,447,269,066,427 2,130,971,943,049 1,316,297,123,378
5.2Principleindicatorsofindustrialactivity,2007-2014(Establishmentswith25ormorepersonsengaged)
*Economiccensusdata
Source: Department of Census and Statistics Page 33
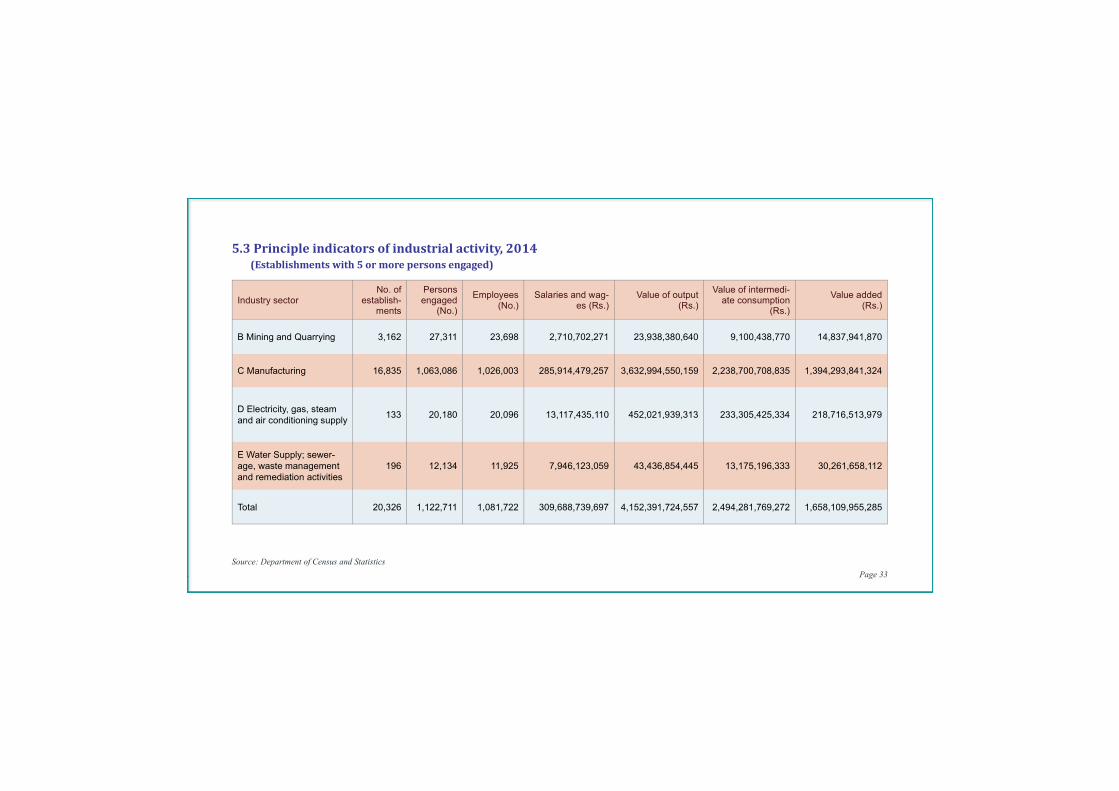
Industry sectorNo. of
establish-ments
Persons engaged
(No.)
Employees (No.)
Salaries and wag-es (Rs.)
Value of output(Rs.)
Value of intermedi-ate consumption
(Rs.)
Value added(Rs.)
B Mining and Quarrying 3,162 27,311 23,698 2,710,702,271 23,938,380,640 9,100,438,770 14,837,941,870
C Manufacturing 16,835 1,063,086 1,026,003 285,914,479,257 3,632,994,550,159 2,238,700,708,835 1,394,293,841,324
D Electricity, gas, steam and air conditioning supply
133 20,180 20,096 13,117,435,110 452,021,939,313 233,305,425,334 218,716,513,979
E Water Supply; sewer-age, waste management and remediation activities
196 12,134 11,925 7,946,123,059 43,436,854,445 13,175,196,333 30,261,658,112
Total 20,326 1,122,711 1,081,722 309,688,739,697 4,152,391,724,557 2,494,281,769,272 1,658,109,955,285
5.3Principleindicatorsofindustrialactivity,2014(Establishmentswith5ormorepersonsengaged)
Source: Department of Census and Statistics Page 34
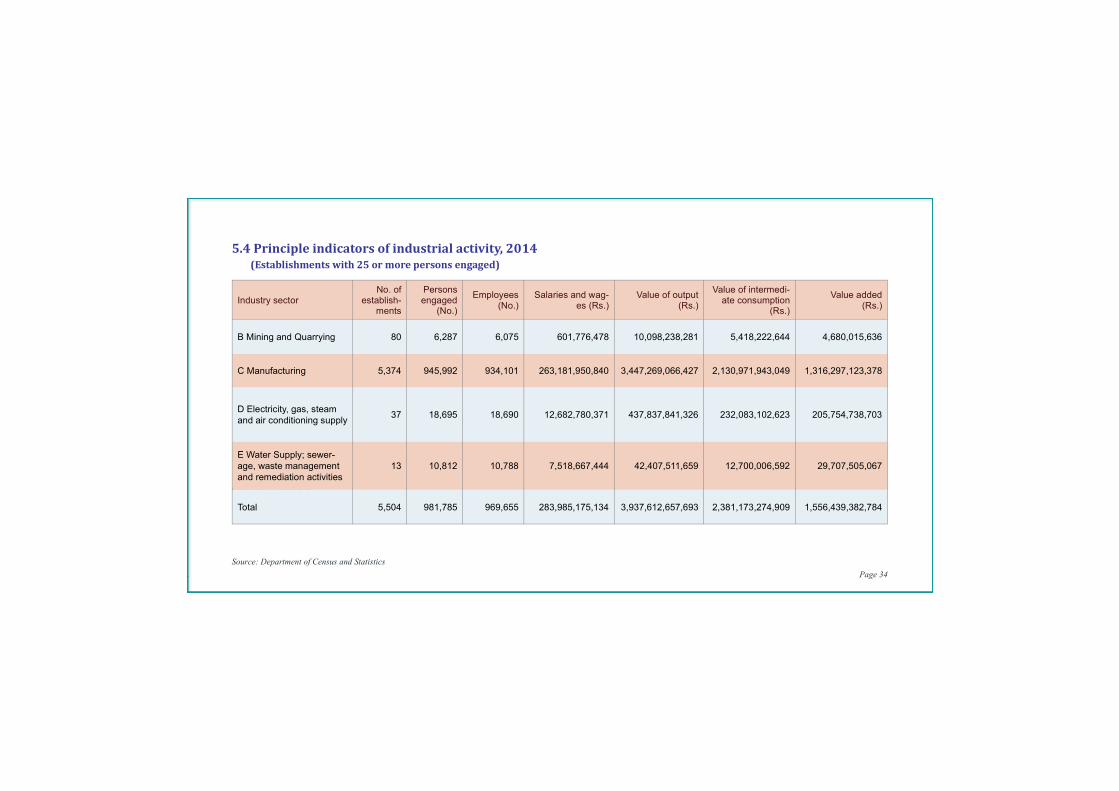
5.4Principleindicatorsofindustrialactivity,2014(Establishmentswith25ormorepersonsengaged)
*Economiccensusdata
Industry sectorNo. of
establish-ments
Persons engaged
(No.)
Employees (No.)
Salaries and wag-es (Rs.)
Value of output(Rs.)
Value of intermedi-ate consumption
(Rs.)
Value added(Rs.)
B Mining and Quarrying 80 6,287 6,075 601,776,478 10,098,238,281 5,418,222,644 4,680,015,636
C Manufacturing 5,374 945,992 934,101 263,181,950,840 3,447,269,066,427 2,130,971,943,049 1,316,297,123,378
D Electricity, gas, steam and air conditioning supply
37 18,695 18,690 12,682,780,371 437,837,841,326 232,083,102,623 205,754,738,703
E Water Supply; sewer-age, waste management and remediation activities
13 10,812 10,788 7,518,667,444 42,407,511,659 12,700,006,592 29,707,505,067
Total 5,504 981,785 969,655 283,985,175,134 3,937,612,657,693 2,381,173,274,909 1,556,439,382,784

Source: Department of Census and Statistics Page 35
5.5Principleindicatorsofindustrialactivity,2014(Establishmentswithlessthan25personsengaged)
Industry sectorNo. of
establish-ments
Persons engaged
(No.)
Employees (No.)
Salaries and wag-es (Rs.)
Value of output(Rs.)
Value of intermedi-ate consumption
(Rs.)
Value added(Rs.)
B Mining and Quarrying 3,082 21,024 17,623 2,108,925,793 13,840,142,359 3,682,216,126 10,157,926,234
C Manufacturing 11,462 117,094 91,902 22,732,528,417 185,725,483,732 107,728,765,786 77,996,717,946
D Electricity, gas, steam and air conditioning supply
96 1,485 1,406 434,654,739 14,184,097,987 1,222,322,711 12,961,775,276
E Water Supply; sewer-age, waste management and remediation activities
183 1,322 1,137 427,455,615 1,029,342,786 475,189,741 554,153,045
Total 14,822 140,925 112,068 25,703,564,563 214,779,066,864 113,108,494,363 101,670,572,501
Source: Sri Lanka Customs Page 36
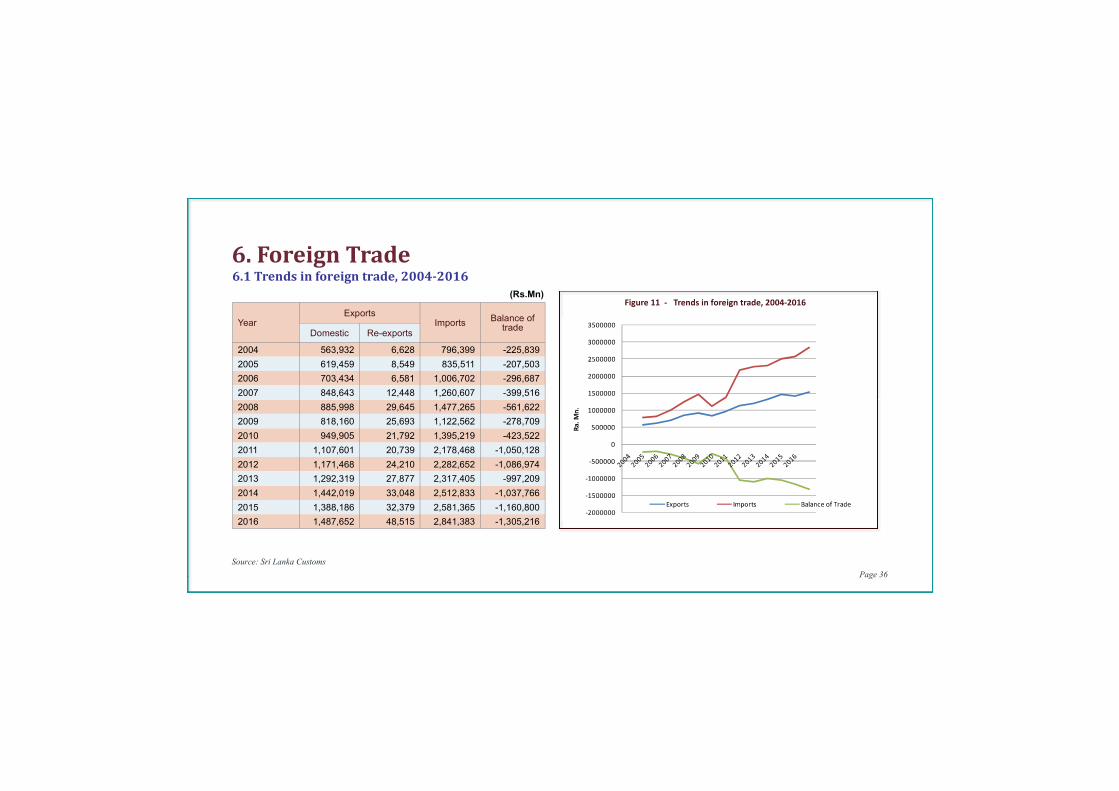
6.1Trendsinforeigntrade,2004-2016
Year Exports
ImportsBalance of
tradeDomestic Re-exports
2004 563,932 6,628 796,399 -225,839
2005 619,459 8,549 835,511 -207,503
2006 703,434 6,581 1,006,702 -296,687
2007 848,643 12,448 1,260,607 -399,516
2008 885,998 29,645 1,477,265 -561,622
2009 818,160 25,693 1,122,562 -278,709
2010 949,905 21,792 1,395,219 -423,522
2011 1,107,601 20,739 2,178,468 -1,050,128
2012 1,171,468 24,210 2,282,652 -1,086,974
2013 1,292,319 27,877 2,317,405 -997,209
2014 1,442,019 33,048 2,512,833 -1,037,766
2015 1,388,186 32,379 2,581,365 -1,160,800
2016 1,487,652 48,515 2,841,383 -1,305,216
6.ForeignTrade
(Rs.Mn)Figure 11 - Trends in foreign trade, 2004-2016
Source: Sri Lanka Customs Page 37
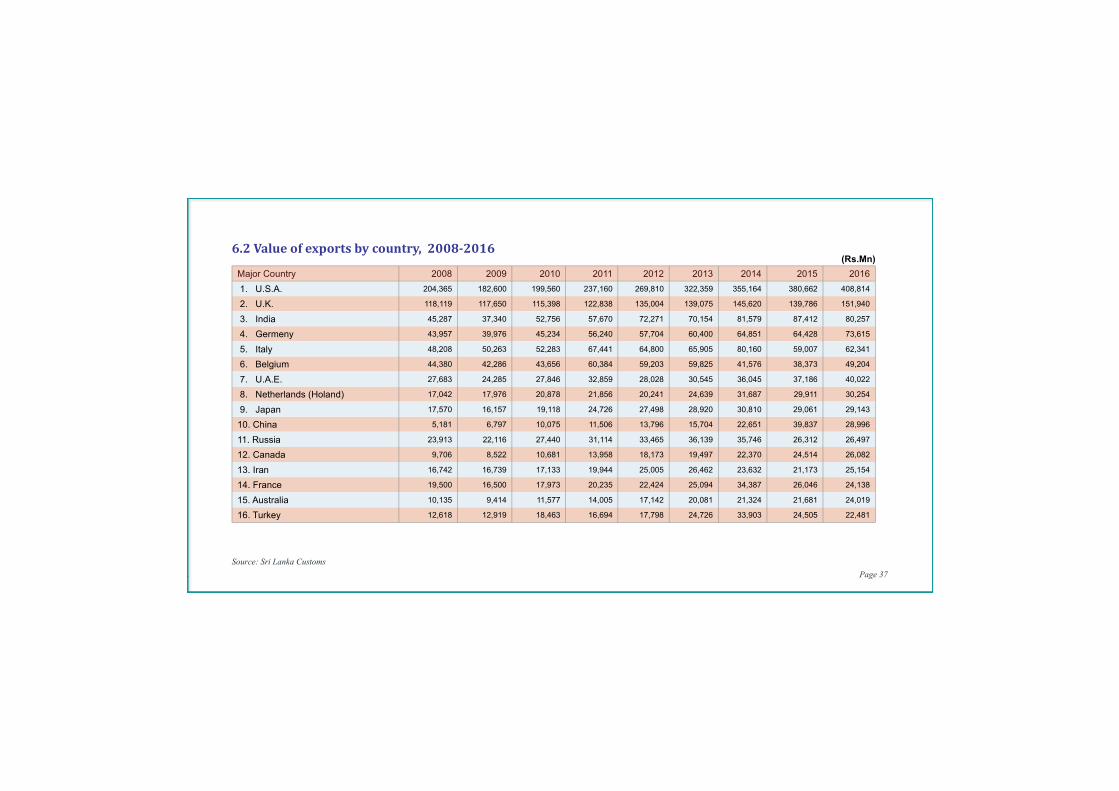
Major Country 2008 2009 2010 2011 2012 2013 2014 2015 2016
1. U.S.A. 204,365 182,600 199,560 237,160 269,810 322,359 355,164 380,662 408,814
2. U.K. 118,119 117,650 115,398 122,838 135,004 139,075 145,620 139,786 151,940
3. India 45,287 37,340 52,756 57,670 72,271 70,154 81,579 87,412 80,257
4. Germeny 43,957 39,976 45,234 56,240 57,704 60,400 64,851 64,428 73,615
5. Italy 48,208 50,263 52,283 67,441 64,800 65,905 80,160 59,007 62,341
6. Belgium 44,380 42,286 43,656 60,384 59,203 59,825 41,576 38,373 49,204
7. U.A.E. 27,683 24,285 27,846 32,859 28,028 30,545 36,045 37,186 40,022
8. Netherlands (Holand) 17,042 17,976 20,878 21,856 20,241 24,639 31,687 29,911 30,254
9. Japan 17,570 16,157 19,118 24,726 27,498 28,920 30,810 29,061 29,143
10. China 5,181 6,797 10,075 11,506 13,796 15,704 22,651 39,837 28,996
11. Russia 23,913 22,116 27,440 31,114 33,465 36,139 35,746 26,312 26,497
12. Canada 9,706 8,522 10,681 13,958 18,173 19,497 22,370 24,514 26,082
13. Iran 16,742 16,739 17,133 19,944 25,005 26,462 23,632 21,173 25,154
14. France 19,500 16,500 17,973 20,235 22,424 25,094 34,387 26,046 24,138
15. Australia 10,135 9,414 11,577 14,005 17,142 20,081 21,324 21,681 24,019
16. Turkey 12,618 12,919 18,463 16,694 17,798 24,726 33,903 24,505 22,481
6.2Valueofexportsbycountry,2008-2016(Rs.Mn)
Source: Sri Lanka Customs Page 38
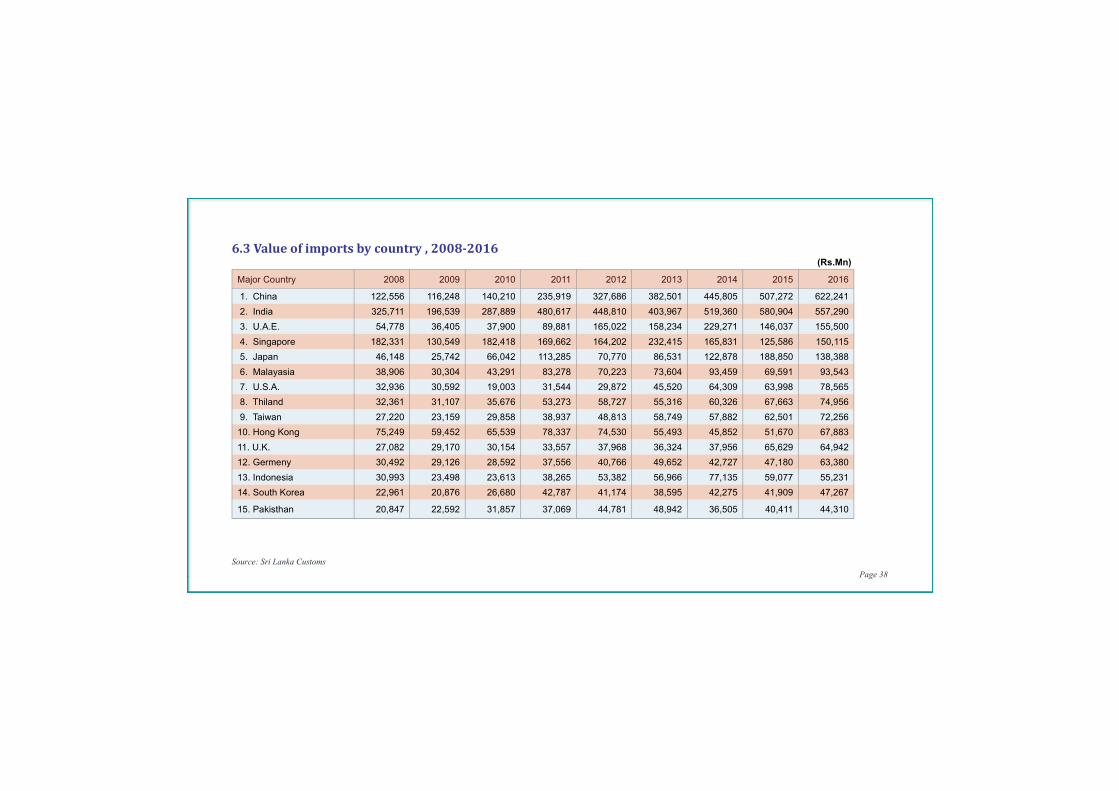
6.3Valueofimportsbycountry,2008-2016
Major Country 2008 2009 2010 2011 2012 2013 2014 2015 2016
1. China 122,556 116,248 140,210 235,919 327,686 382,501 445,805 507,272 622,241
2. India 325,711 196,539 287,889 480,617 448,810 403,967 519,360 580,904 557,290
3. U.A.E. 54,778 36,405 37,900 89,881 165,022 158,234 229,271 146,037 155,500
4. Singapore 182,331 130,549 182,418 169,662 164,202 232,415 165,831 125,586 150,115
5. Japan 46,148 25,742 66,042 113,285 70,770 86,531 122,878 188,850 138,388
6. Malayasia 38,906 30,304 43,291 83,278 70,223 73,604 93,459 69,591 93,543
7. U.S.A. 32,936 30,592 19,003 31,544 29,872 45,520 64,309 63,998 78,565
8. Thiland 32,361 31,107 35,676 53,273 58,727 55,316 60,326 67,663 74,956
9. Taiwan 27,220 23,159 29,858 38,937 48,813 58,749 57,882 62,501 72,256
10. Hong Kong 75,249 59,452 65,539 78,337 74,530 55,493 45,852 51,670 67,883
11. U.K. 27,082 29,170 30,154 33,557 37,968 36,324 37,956 65,629 64,942
12. Germeny 30,492 29,126 28,592 37,556 40,766 49,652 42,727 47,180 63,380
13. Indonesia 30,993 23,498 23,613 38,265 53,382 56,966 77,135 59,077 55,231
14. South Korea 22,961 20,876 26,680 42,787 41,174 38,595 42,275 41,909 47,267
15. Pakisthan 20,847 22,592 31,857 37,069 44,781 48,942 36,505 40,411 44,310
(Rs.Mn)
Source: Sri Lanka Customs Page 39
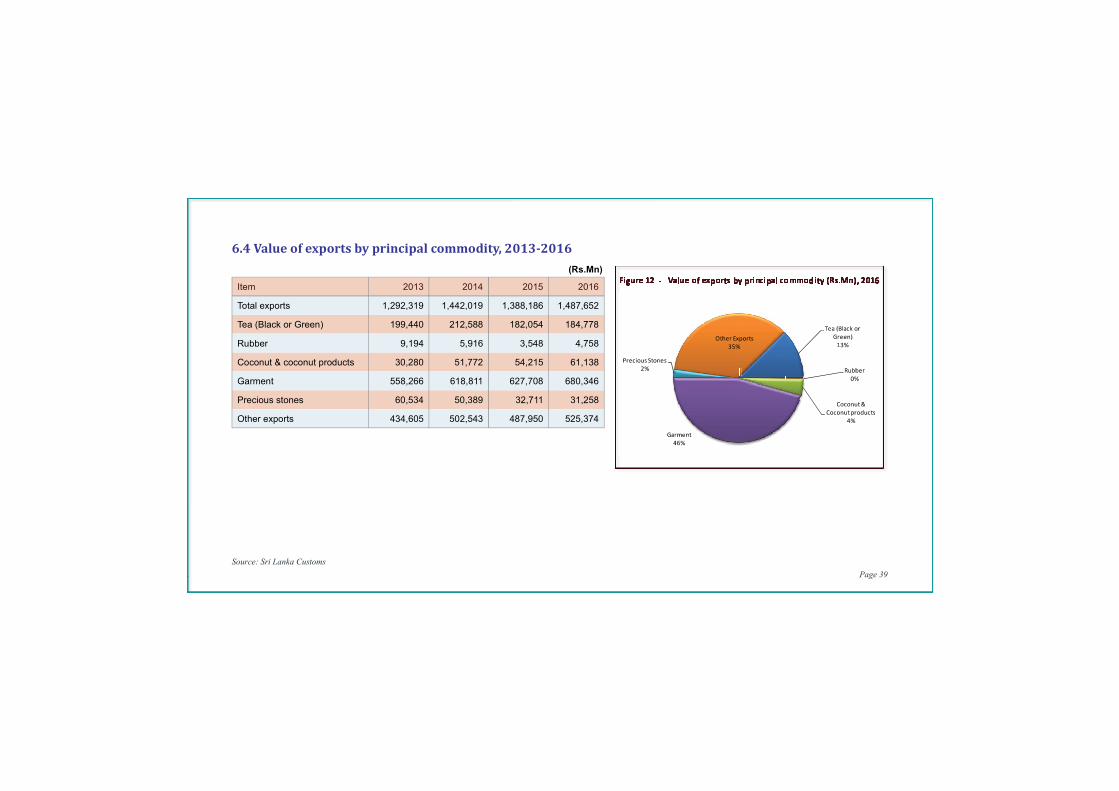
Item 2013 2014 2015 2016
Total exports 1,292,319 1,442,019 1,388,186 1,487,652
Tea (Black or Green) 199,440 212,588 182,054 184,778
Rubber 9,194 5,916 3,548 4,758
Coconut & coconut products 30,280 51,772 54,215 61,138
Garment 558,266 618,811 627,708 680,346
Precious stones 60,534 50,389 32,711 31,258
Other exports 434,605 502,543 487,950 525,374
6.4Valueofexportsbyprincipalcommodity,2013-2016
(Rs.Mn)Figure 12 - Value of exports by principal commodity (Rs.Mn), 2016
Source: Sri Lanka Customs Page 40
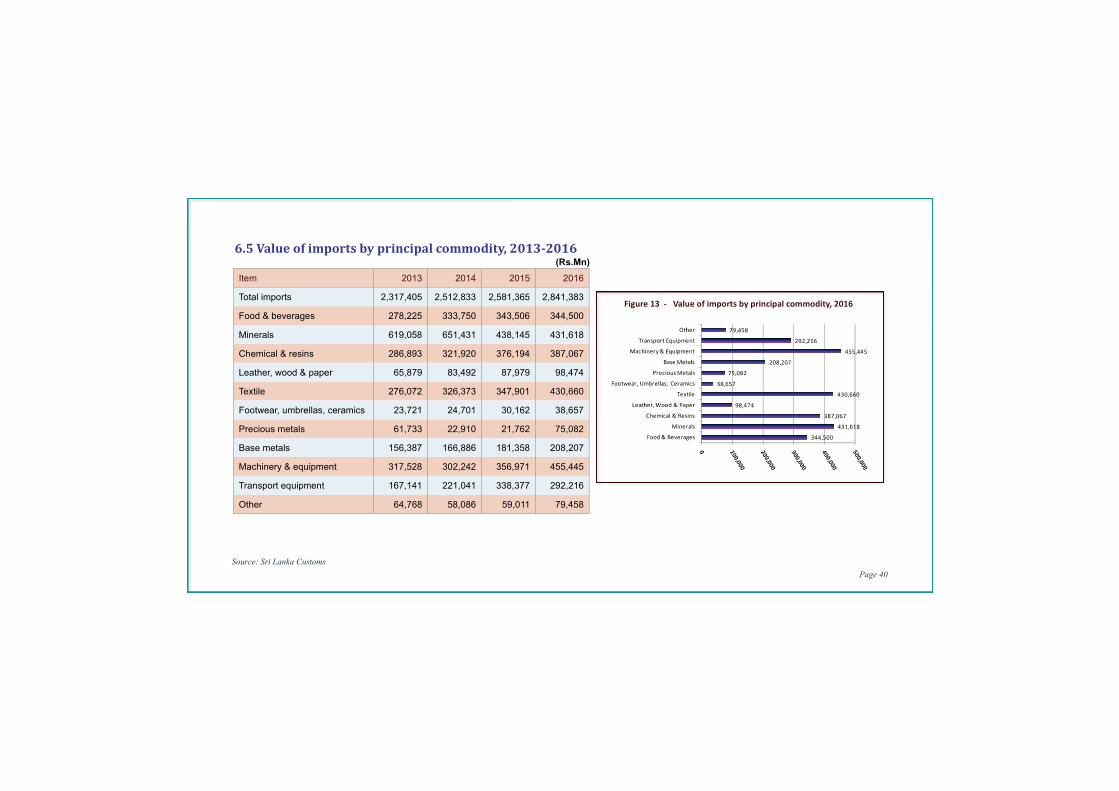
Item 2013 2014 2015 2016
Total imports 2,317,405 2,512,833 2,581,365 2,841,383
Food & beverages 278,225 333,750 343,506 344,500
Minerals 619,058 651,431 438,145 431,618
Chemical & resins 286,893 321,920 376,194 387,067
Leather, wood & paper 65,879 83,492 87,979 98,474
Textile 276,072 326,373 347,901 430,660
Footwear, umbrellas, ceramics 23,721 24,701 30,162 38,657
Precious metals 61,733 22,910 21,762 75,082
Base metals 156,387 166,886 181,358 208,207
Machinery & equipment 317,528 302,242 356,971 455,445
Transport equipment 167,141 221,041 338,377 292,216
Other 64,768 58,086 59,011 79,458
6.5Valueofimportsbyprincipalcommodity,2013-2016(Rs.Mn)
Figure 13 - Value of imports by principal commodity, 2016
Source: Central Bank of Sri Lanka Page 41
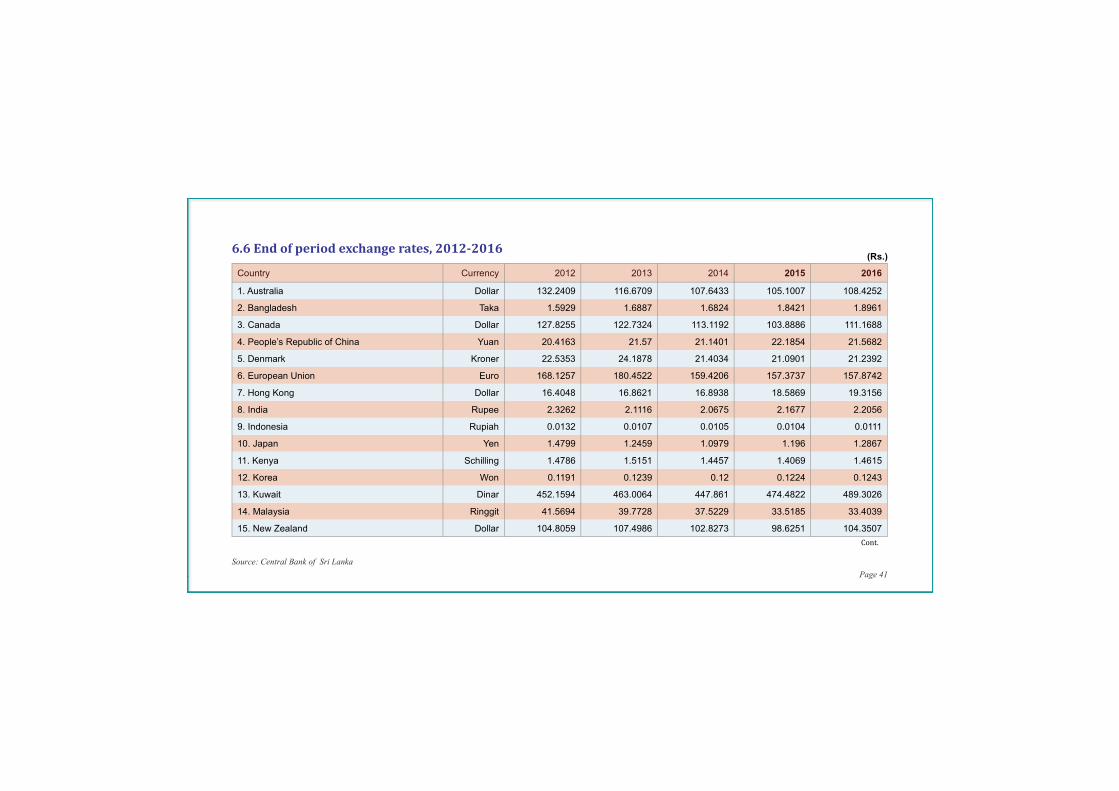
6.6Endofperiodexchangerates,2012-2016
Country Currency 2012 2013 2014 2015 2016
1. Australia Dollar 132.2409 116.6709 107.6433 105.1007 108.4252
2. Bangladesh Taka 1.5929 1.6887 1.6824 1.8421 1.8961
3. Canada Dollar 127.8255 122.7324 113.1192 103.8886 111.1688
4. People’s Republic of China Yuan 20.4163 21.57 21.1401 22.1854 21.5682
5. Denmark Kroner 22.5353 24.1878 21.4034 21.0901 21.2392
6. European Union Euro 168.1257 180.4522 159.4206 157.3737 157.8742
7. Hong Kong Dollar 16.4048 16.8621 16.8938 18.5869 19.3156
8. India Rupee 2.3262 2.1116 2.0675 2.1677 2.2056
9. Indonesia Rupiah 0.0132 0.0107 0.0105 0.0104 0.0111
10. Japan Yen 1.4799 1.2459 1.0979 1.196 1.2867
11. Kenya Schilling 1.4786 1.5151 1.4457 1.4069 1.4615
12. Korea Won 0.1191 0.1239 0.12 0.1224 0.1243
13. Kuwait Dinar 452.1594 463.0064 447.861 474.4822 489.3026
14. Malaysia Ringgit 41.5694 39.7728 37.5229 33.5185 33.4039
15. New Zealand Dollar 104.8059 107.4986 102.8273 98.6251 104.3507
Cont.
(Rs.)
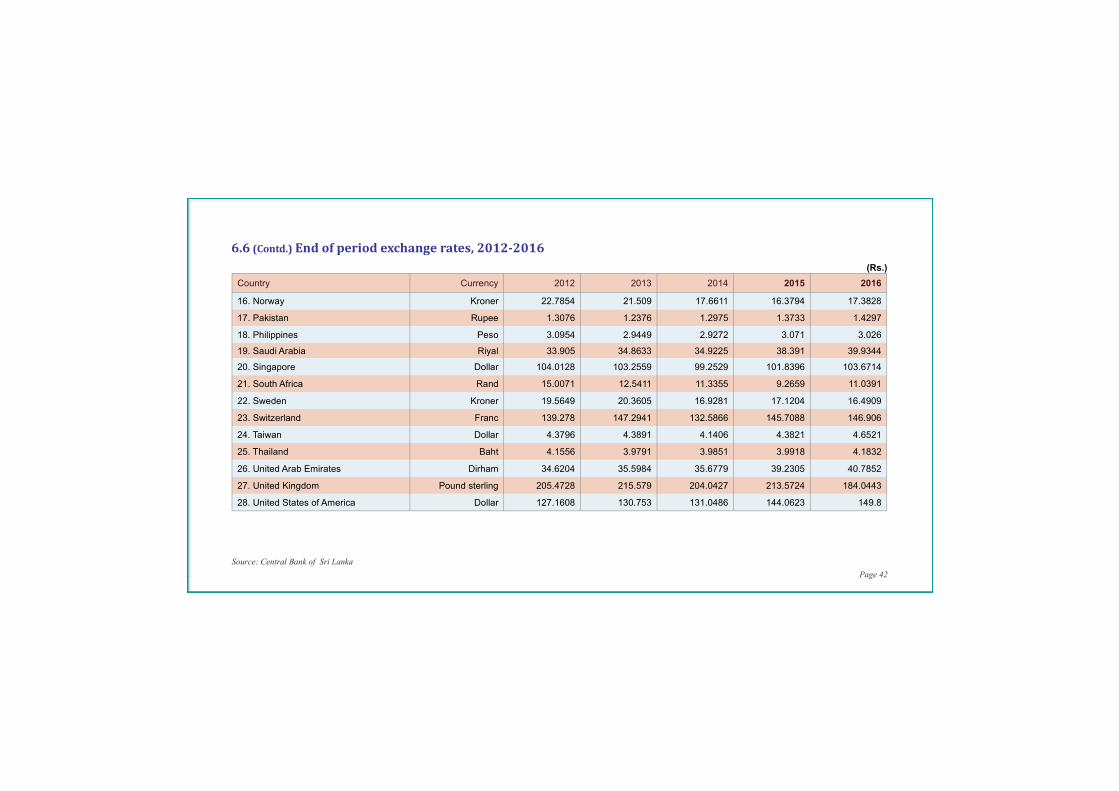
Source: Central Bank of Sri Lanka Page 42
Country Currency 2012 2013 2014 2015 2016
16. Norway Kroner 22.7854 21.509 17.6611 16.3794 17.3828
17. Pakistan Rupee 1.3076 1.2376 1.2975 1.3733 1.4297
18. Philippines Peso 3.0954 2.9449 2.9272 3.071 3.026
19. Saudi Arabia Riyal 33.905 34.8633 34.9225 38.391 39.9344
20. Singapore Dollar 104.0128 103.2559 99.2529 101.8396 103.6714
21. South Africa Rand 15.0071 12.5411 11.3355 9.2659 11.0391
22. Sweden Kroner 19.5649 20.3605 16.9281 17.1204 16.4909
23. Switzerland Franc 139.278 147.2941 132.5866 145.7088 146.906
24. Taiwan Dollar 4.3796 4.3891 4.1406 4.3821 4.6521
25. Thailand Baht 4.1556 3.9791 3.9851 3.9918 4.1832
26. United Arab Emirates Dirham 34.6204 35.5984 35.6779 39.2305 40.7852
27. United Kingdom Pound sterling 205.4728 215.579 204.0427 213.5724 184.0443
28. United States of America Dollar 127.1608 130.753 131.0486 144.0623 149.8
6.6(Contd.)Endofperiodexchangerates,2012-2016
(Rs.)
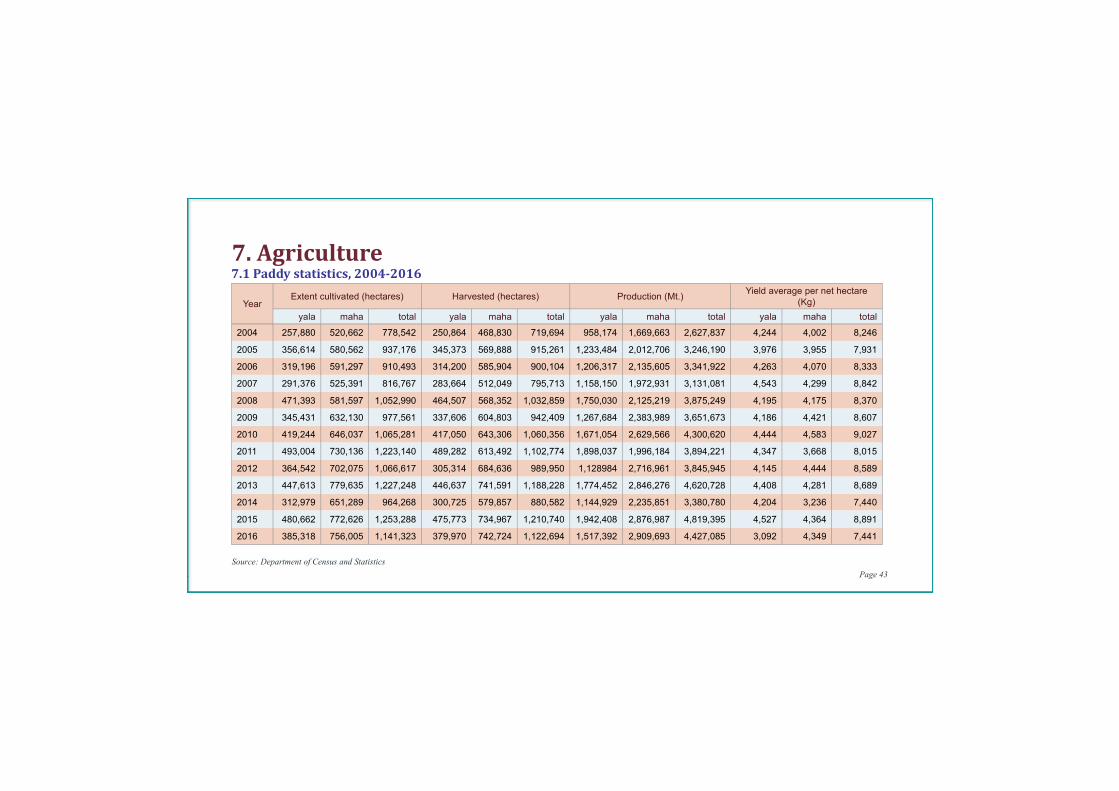
Source: Department of Census and Statistics Page 43
7.1Paddystatistics,2004-2016
YearExtent cultivated (hectares) Harvested (hectares) Production (Mt.)
Yield average per net hectare (Kg)
yala maha total yala maha total yala maha total yala maha total
2004 257,880 520,662 778,542 250,864 468,830 719,694 958,174 1,669,663 2,627,837 4,244 4,002 8,246
2005 356,614 580,562 937,176 345,373 569,888 915,261 1,233,484 2,012,706 3,246,190 3,976 3,955 7,931
2006 319,196 591,297 910,493 314,200 585,904 900,104 1,206,317 2,135,605 3,341,922 4,263 4,070 8,333
2007 291,376 525,391 816,767 283,664 512,049 795,713 1,158,150 1,972,931 3,131,081 4,543 4,299 8,842
2008 471,393 581,597 1,052,990 464,507 568,352 1,032,859 1,750,030 2,125,219 3,875,249 4,195 4,175 8,370
2009 345,431 632,130 977,561 337,606 604,803 942,409 1,267,684 2,383,989 3,651,673 4,186 4,421 8,607
2010 419,244 646,037 1,065,281 417,050 643,306 1,060,356 1,671,054 2,629,566 4,300,620 4,444 4,583 9,027
2011 493,004 730,136 1,223,140 489,282 613,492 1,102,774 1,898,037 1,996,184 3,894,221 4,347 3,668 8,015
2012 364,542 702,075 1,066,617 305,314 684,636 989,950 1,128984 2,716,961 3,845,945 4,145 4,444 8,589
2013 447,613 779,635 1,227,248 446,637 741,591 1,188,228 1,774,452 2,846,276 4,620,728 4,408 4,281 8,689
2014 312,979 651,289 964,268 300,725 579,857 880,582 1,144,929 2,235,851 3,380,780 4,204 3,236 7,440
2015 480,662 772,626 1,253,288 475,773 734,967 1,210,740 1,942,408 2,876,987 4,819,395 4,527 4,364 8,891
2016 385,318 756,005 1,141,323 379,970 742,724 1,122,694 1,517,392 2,909,693 4,427,085 3,092 4,349 7,441
7.Agriculture
Source: Department of Census and Statistics Page 44
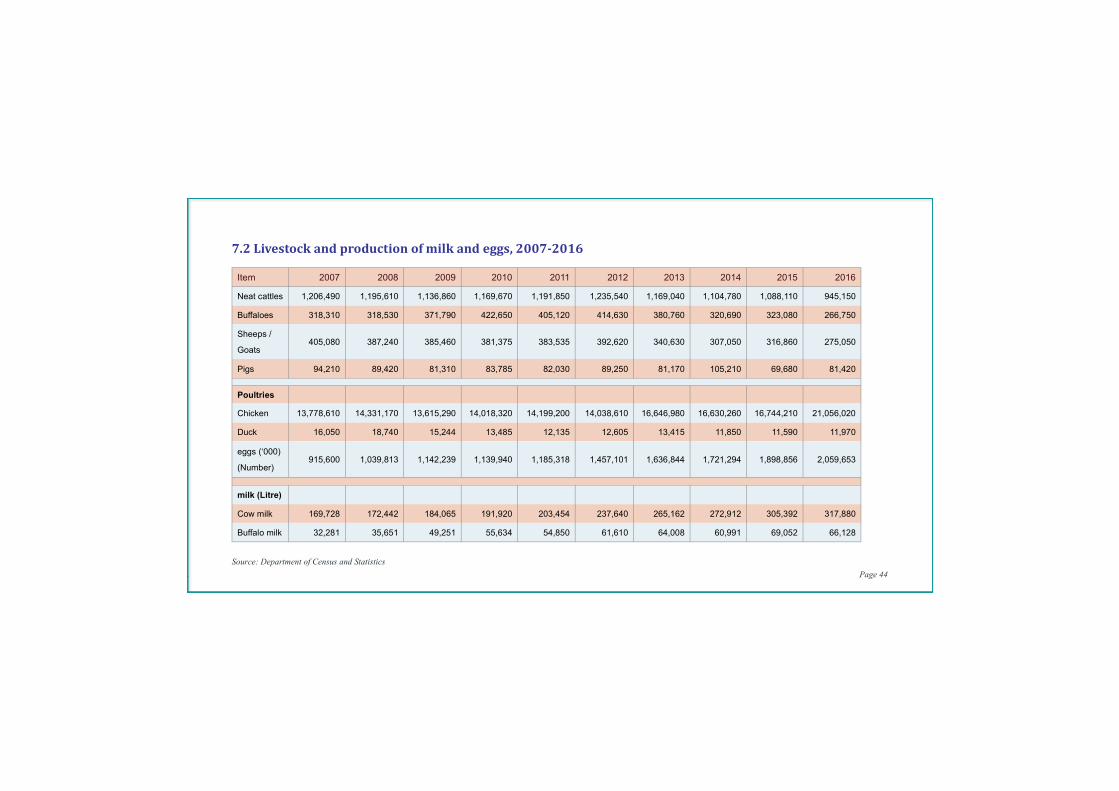
7.2Livestockandproductionofmilkandeggs,2007-2016
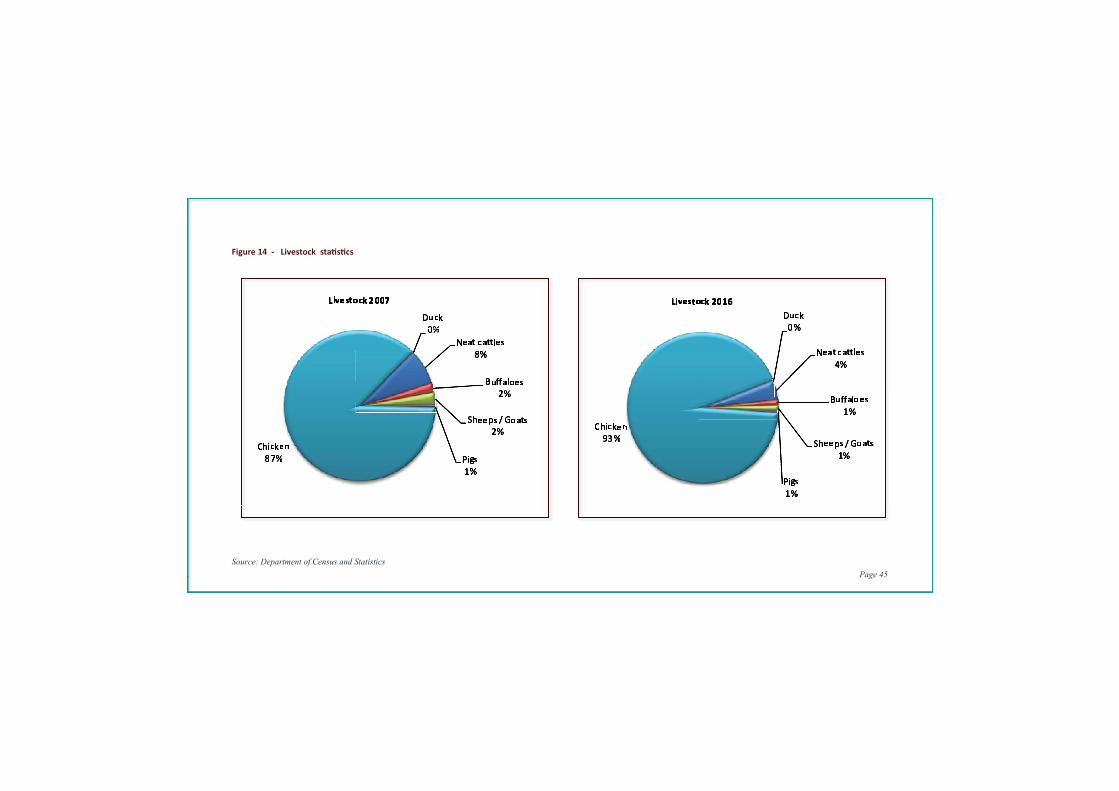
Item 2007 2008 2009 2010 2011 2012 2013 2014 2015 2016
Neat cattles 1,206,490 1,195,610 1,136,860 1,169,670 1,191,850 1,235,540 1,169,040 1,104,780 1,088,110 945,150
Buffaloes 318,310 318,530 371,790 422,650 405,120 414,630 380,760 320,690 323,080 266,750
Sheeps /
Goats 405,080 387,240 385,460 381,375 383,535 392,620 340,630 307,050 316,860 275,050
Pigs 94,210 89,420 81,310 83,785 82,030 89,250 81,170 105,210 69,680 81,420
Poultries
Chicken 13,778,610 14,331,170 13,615,290 14,018,320 14,199,200 14,038,610 16,646,980 16,630,260 16,744,210 21,056,020
Duck 16,050 18,740 15,244 13,485 12,135 12,605 13,415 11,850 11,590 11,970
eggs (‘000)
(Number) 915,600 1,039,813 1,142,239 1,139,940 1,185,318 1,457,101 1,636,844 1,721,294 1,898,856 2,059,653
milk (Litre)
Cow milk 169,728 172,442 184,065 191,920 203,454 237,640 265,162 272,912 305,392 317,880
Buffalo milk 32,281 35,651 49,251 55,634 54,850 61,610 64,008 60,991 69,052 66,128
Source: Department of Census and Statistics Page 45
Figure 14 - Livestock sta� s� cs
Source: Ministry of Fisheries and Aquatic Resources Development Page 46
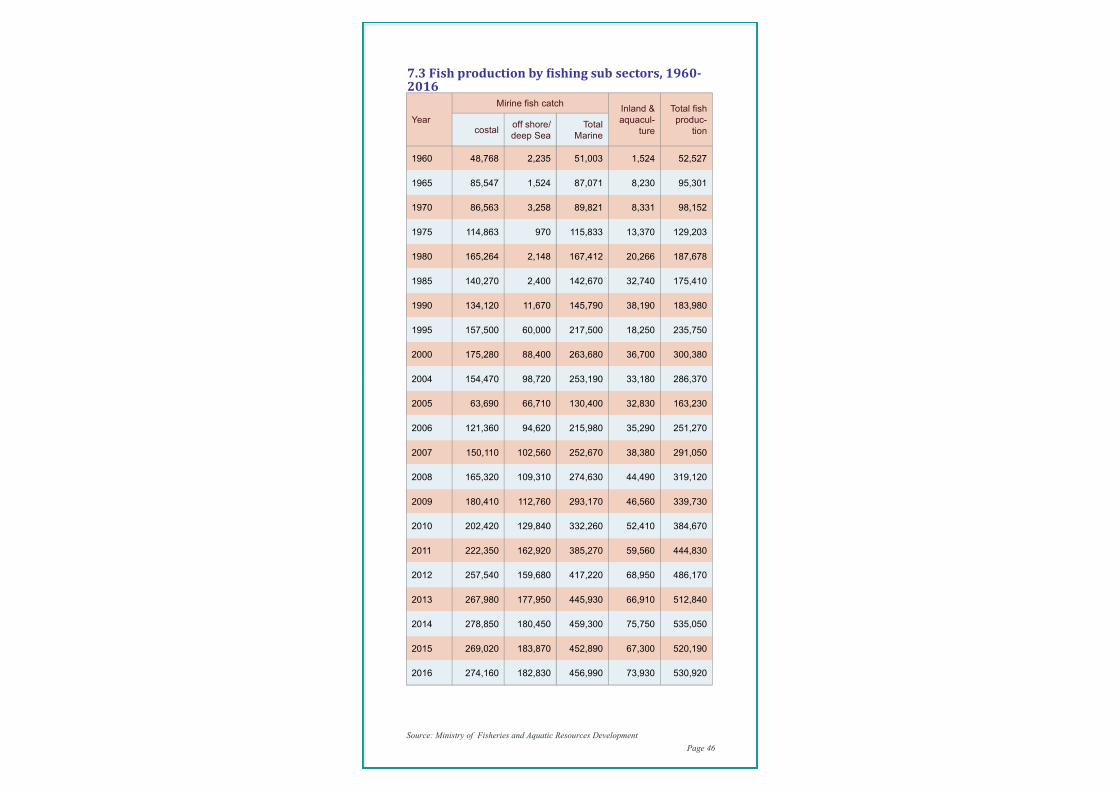
7.3Fishproductionby�ishingsubsectors,1960-2016
Year
Mirine fi sh catchInland & aquacul-
ture
Total fi sh produc-
tioncostaloff shore/deep Sea
TotalMarine
1960 48,768 2,235 51,003 1,524 52,527
1965 85,547 1,524 87,071 8,230 95,301
1970 86,563 3,258 89,821 8,331 98,152
1975 114,863 970 115,833 13,370 129,203
1980 165,264 2,148 167,412 20,266 187,678
1985 140,270 2,400 142,670 32,740 175,410
1990 134,120 11,670 145,790 38,190 183,980
1995 157,500 60,000 217,500 18,250 235,750
2000 175,280 88,400 263,680 36,700 300,380
2004 154,470 98,720 253,190 33,180 286,370
2005 63,690 66,710 130,400 32,830 163,230
2006 121,360 94,620 215,980 35,290 251,270
2007 150,110 102,560 252,670 38,380 291,050
2008 165,320 109,310 274,630 44,490 319,120
2009 180,410 112,760 293,170 46,560 339,730
2010 202,420 129,840 332,260 52,410 384,670
2011 222,350 162,920 385,270 59,560 444,830
2012 257,540 159,680 417,220 68,950 486,170
2013 267,980 177,950 445,930 66,910 512,840
2014 278,850 180,450 459,300 75,750 535,050
2015 269,020 183,870 452,890 67,300 520,190
2016 274,160 182,830 456,990 73,930 530,920
Source: Department of Census and Statistics Page 47
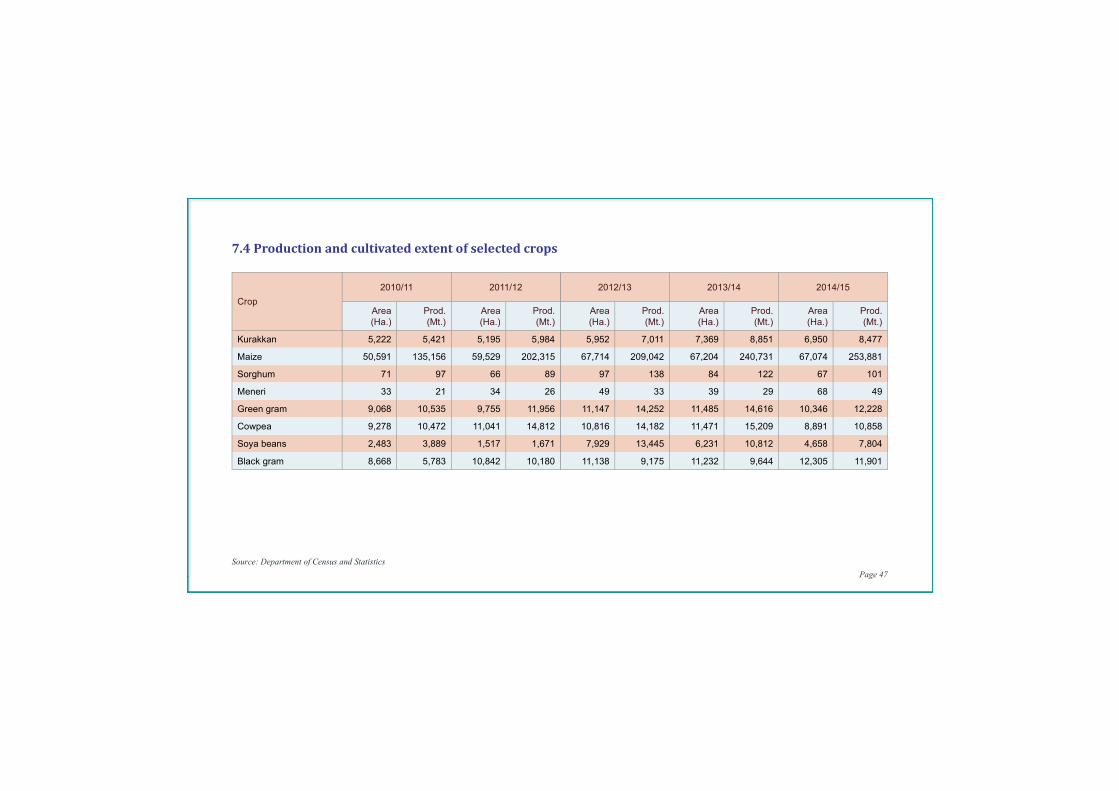
7.4Productionandcultivatedextentofselectedcrops
Crop
2010/11 2011/12 2012/13 2013/14 2014/15
Area (Ha.)
Prod. (Mt.)
Area (Ha.)
Prod. (Mt.)
Area (Ha.)
Prod. (Mt.)
Area (Ha.)
Prod. (Mt.)
Area (Ha.)
Prod. (Mt.)
Kurakkan 5,222 5,421 5,195 5,984 5,952 7,011 7,369 8,851 6,950 8,477
Maize 50,591 135,156 59,529 202,315 67,714 209,042 67,204 240,731 67,074 253,881
Sorghum 71 97 66 89 97 138 84 122 67 101
Meneri 33 21 34 26 49 33 39 29 68 49
Green gram 9,068 10,535 9,755 11,956 11,147 14,252 11,485 14,616 10,346 12,228
Cowpea 9,278 10,472 11,041 14,812 10,816 14,182 11,471 15,209 8,891 10,858
Soya beans 2,483 3,889 1,517 1,671 7,929 13,445 6,231 10,812 4,658 7,804
Black gram 8,668 5,783 10,842 10,180 11,138 9,175 11,232 9,644 12,305 11,901
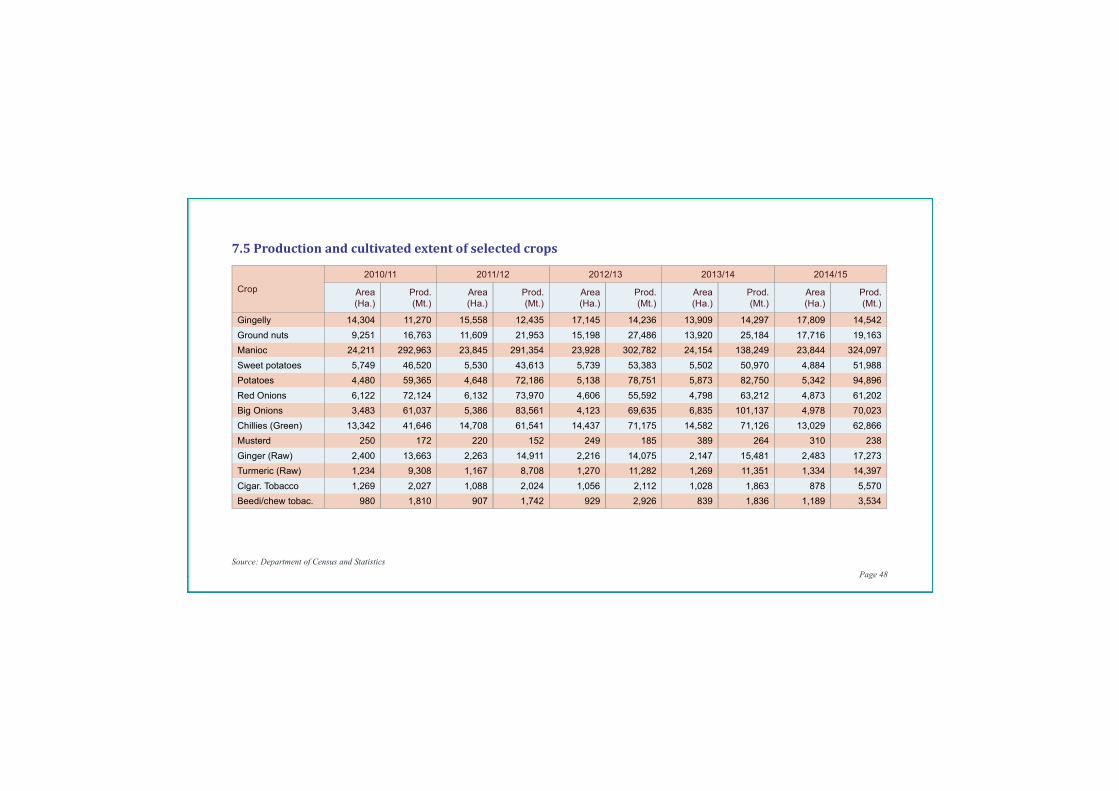
Source: Department of Census and Statistics Page 48
Crop
2010/11 2011/12 2012/13 2013/14 2014/15
Area (Ha.)
Prod. (Mt.)
Area (Ha.)
Prod. (Mt.)
Area (Ha.)
Prod. (Mt.)
Area (Ha.)
Prod. (Mt.)
Area (Ha.)
Prod. (Mt.)
Gingelly 14,304 11,270 15,558 12,435 17,145 14,236 13,909 14,297 17,809 14,542
Ground nuts 9,251 16,763 11,609 21,953 15,198 27,486 13,920 25,184 17,716 19,163
Manioc 24,211 292,963 23,845 291,354 23,928 302,782 24,154 138,249 23,844 324,097
Sweet potatoes 5,749 46,520 5,530 43,613 5,739 53,383 5,502 50,970 4,884 51,988
Potatoes 4,480 59,365 4,648 72,186 5,138 78,751 5,873 82,750 5,342 94,896
Red Onions 6,122 72,124 6,132 73,970 4,606 55,592 4,798 63,212 4,873 61,202
Big Onions 3,483 61,037 5,386 83,561 4,123 69,635 6,835 101,137 4,978 70,023
Chillies (Green) 13,342 41,646 14,708 61,541 14,437 71,175 14,582 71,126 13,029 62,866
Musterd 250 172 220 152 249 185 389 264 310 238
Ginger (Raw) 2,400 13,663 2,263 14,911 2,216 14,075 2,147 15,481 2,483 17,273
Turmeric (Raw) 1,234 9,308 1,167 8,708 1,270 11,282 1,269 11,351 1,334 14,397
Cigar. Tobacco 1,269 2,027 1,088 2,024 1,056 2,112 1,028 1,863 878 5,570
Beedi/chew tobac. 980 1,810 907 1,742 929 2,926 839 1,836 1,189 3,534
7.5Productionandcultivatedextentofselectedcrops
Source: Department of Census and Statistics Page 49
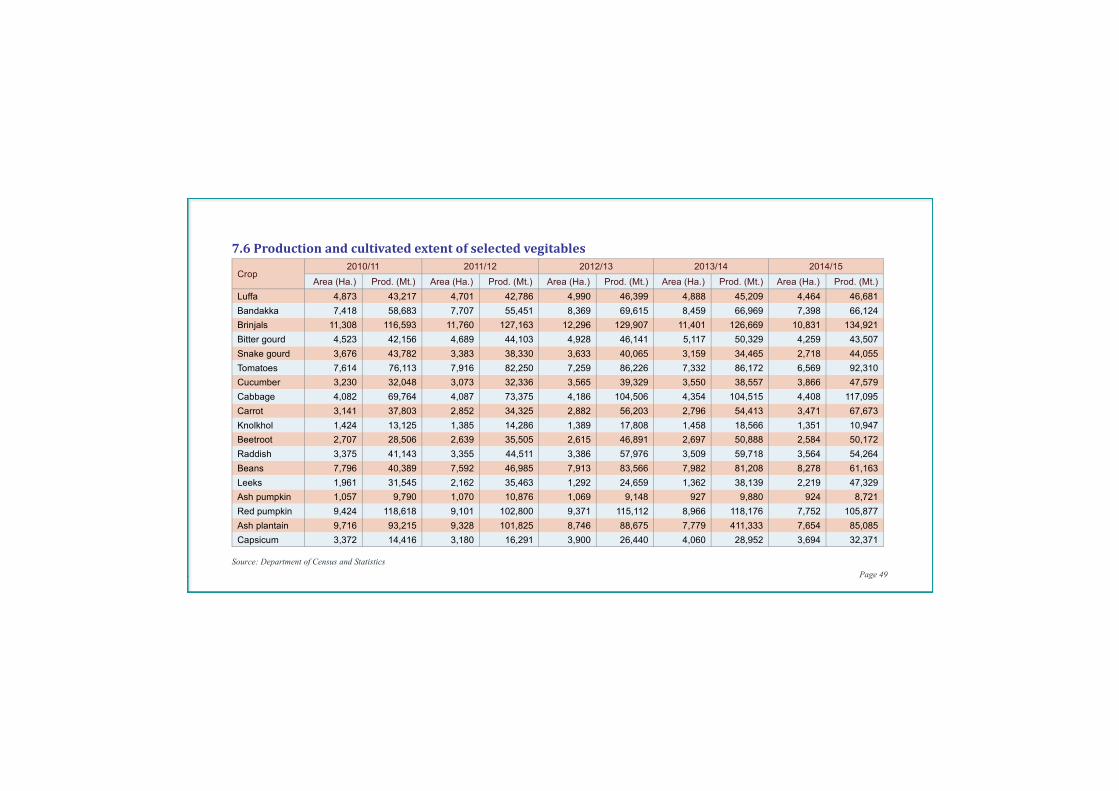
Crop2010/11 2011/12 2012/13 2013/14 2014/15
Area (Ha.) Prod. (Mt.) Area (Ha.) Prod. (Mt.) Area (Ha.) Prod. (Mt.) Area (Ha.) Prod. (Mt.) Area (Ha.) Prod. (Mt.)
Luffa 4,873 43,217 4,701 42,786 4,990 46,399 4,888 45,209 4,464 46,681
Bandakka 7,418 58,683 7,707 55,451 8,369 69,615 8,459 66,969 7,398 66,124
Brinjals 11,308 116,593 11,760 127,163 12,296 129,907 11,401 126,669 10,831 134,921
Bitter gourd 4,523 42,156 4,689 44,103 4,928 46,141 5,117 50,329 4,259 43,507
Snake gourd 3,676 43,782 3,383 38,330 3,633 40,065 3,159 34,465 2,718 44,055
Tomatoes 7,614 76,113 7,916 82,250 7,259 86,226 7,332 86,172 6,569 92,310
Cucumber 3,230 32,048 3,073 32,336 3,565 39,329 3,550 38,557 3,866 47,579
Cabbage 4,082 69,764 4,087 73,375 4,186 104,506 4,354 104,515 4,408 117,095
Carrot 3,141 37,803 2,852 34,325 2,882 56,203 2,796 54,413 3,471 67,673
Knolkhol 1,424 13,125 1,385 14,286 1,389 17,808 1,458 18,566 1,351 10,947
Beetroot 2,707 28,506 2,639 35,505 2,615 46,891 2,697 50,888 2,584 50,172
Raddish 3,375 41,143 3,355 44,511 3,386 57,976 3,509 59,718 3,564 54,264
Beans 7,796 40,389 7,592 46,985 7,913 83,566 7,982 81,208 8,278 61,163
Leeks 1,961 31,545 2,162 35,463 1,292 24,659 1,362 38,139 2,219 47,329
Ash pumpkin 1,057 9,790 1,070 10,876 1,069 9,148 927 9,880 924 8,721
Red pumpkin 9,424 118,618 9,101 102,800 9,371 115,112 8,966 118,176 7,752 105,877
Ash plantain 9,716 93,215 9,328 101,825 8,746 88,675 7,779 411,333 7,654 85,085
Capsicum 3,372 14,416 3,180 16,291 3,900 26,440 4,060 28,952 3,694 32,371
7.6Productionandcultivatedextentofselectedvegitables
Source: Department of Census and Statistics Page 50
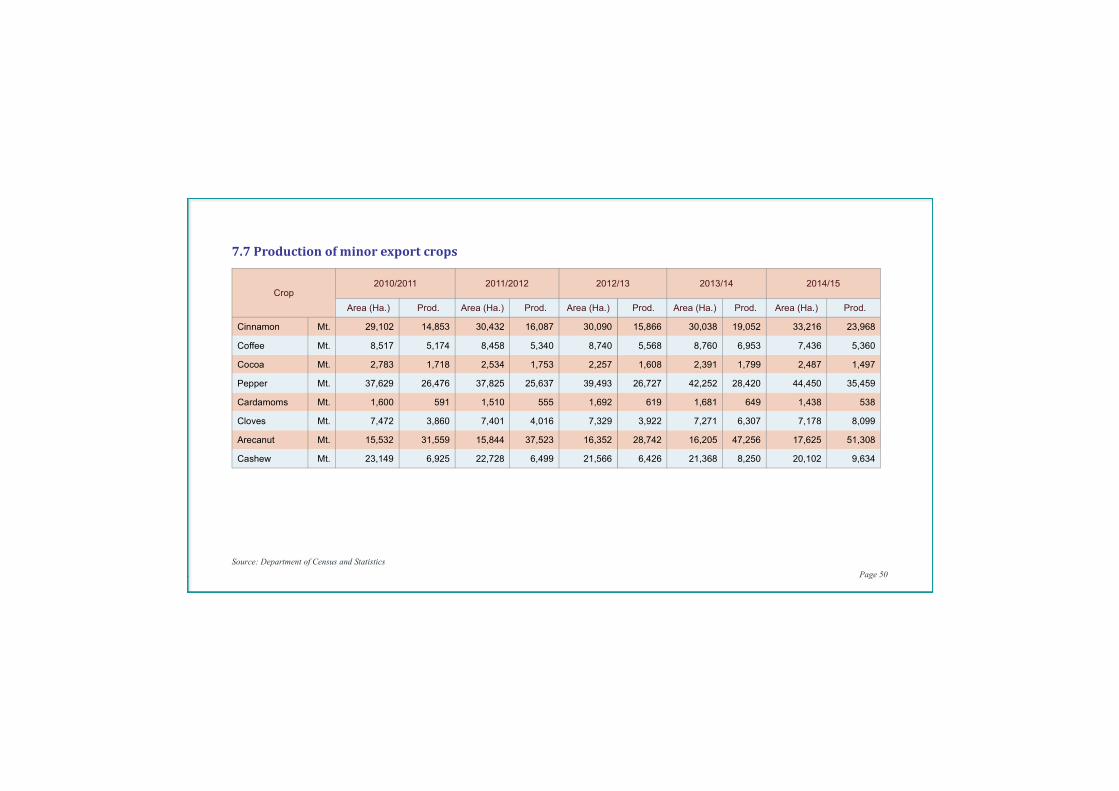
7.7Productionofminorexportcrops
Crop2010/2011 2011/2012 2012/13 2013/14 2014/15
Area (Ha.) Prod. Area (Ha.) Prod. Area (Ha.) Prod. Area (Ha.) Prod. Area (Ha.) Prod.
Cinnamon Mt. 29,102 14,853 30,432 16,087 30,090 15,866 30,038 19,052 33,216 23,968
Coffee Mt. 8,517 5,174 8,458 5,340 8,740 5,568 8,760 6,953 7,436 5,360
Cocoa Mt. 2,783 1,718 2,534 1,753 2,257 1,608 2,391 1,799 2,487 1,497
Pepper Mt. 37,629 26,476 37,825 25,637 39,493 26,727 42,252 28,420 44,450 35,459
Cardamoms Mt. 1,600 591 1,510 555 1,692 619 1,681 649 1,438 538
Cloves Mt. 7,472 3,860 7,401 4,016 7,329 3,922 7,271 6,307 7,178 8,099
Arecanut Mt. 15,532 31,559 15,844 37,523 16,352 28,742 16,205 47,256 17,625 51,308
Cashew Mt. 23,149 6,925 22,728 6,499 21,566 6,426 21,368 8,250 20,102 9,634
Source: Department of Census and Statistics Page 51
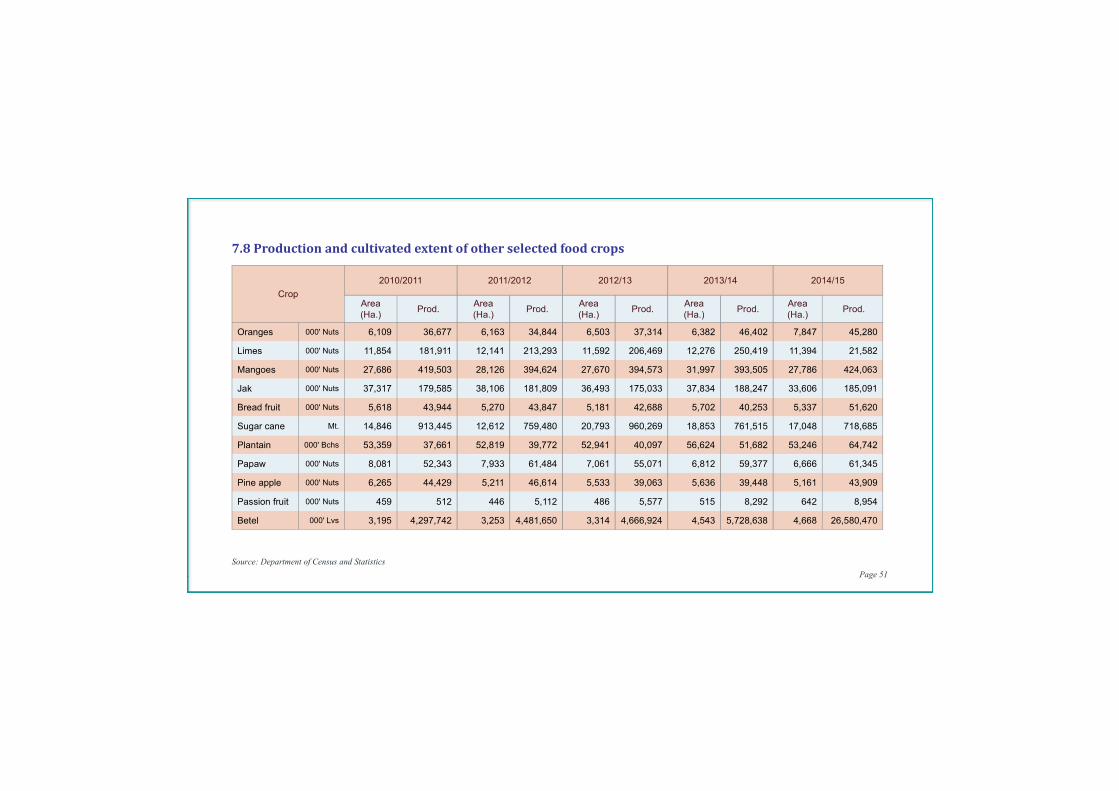
7.8Productionandcultivatedextentofotherselectedfoodcrops
Crop
2010/2011 2011/2012 2012/13 2013/14 2014/15
Area (Ha.)
Prod. Area (Ha.)
Prod. Area (Ha.)
Prod. Area (Ha.)
Prod. Area (Ha.)
Prod.
Oranges 000' Nuts 6,109 36,677 6,163 34,844 6,503 37,314 6,382 46,402 7,847 45,280
Limes 000' Nuts 11,854 181,911 12,141 213,293 11,592 206,469 12,276 250,419 11,394 21,582
Mangoes 000' Nuts 27,686 419,503 28,126 394,624 27,670 394,573 31,997 393,505 27,786 424,063
Jak 000' Nuts 37,317 179,585 38,106 181,809 36,493 175,033 37,834 188,247 33,606 185,091
Bread fruit 000' Nuts 5,618 43,944 5,270 43,847 5,181 42,688 5,702 40,253 5,337 51,620
Sugar cane Mt. 14,846 913,445 12,612 759,480 20,793 960,269 18,853 761,515 17,048 718,685
Plantain 000' Bchs 53,359 37,661 52,819 39,772 52,941 40,097 56,624 51,682 53,246 64,742
Papaw 000' Nuts 8,081 52,343 7,933 61,484 7,061 55,071 6,812 59,377 6,666 61,345
Pine apple 000' Nuts 6,265 44,429 5,211 46,614 5,533 39,063 5,636 39,448 5,161 43,909
Passion fruit 000' Nuts 459 512 446 5,112 486 5,577 515 8,292 642 8,954
Betel 000' Lvs 3,195 4,297,742 3,253 4,481,650 3,314 4,666,924 4,543 5,728,638 4,668 26,580,470
Sources: Department of Census and Statistics, Sri Lanka Tea Board, Sri Lanka Coconut Development Authority Page 52
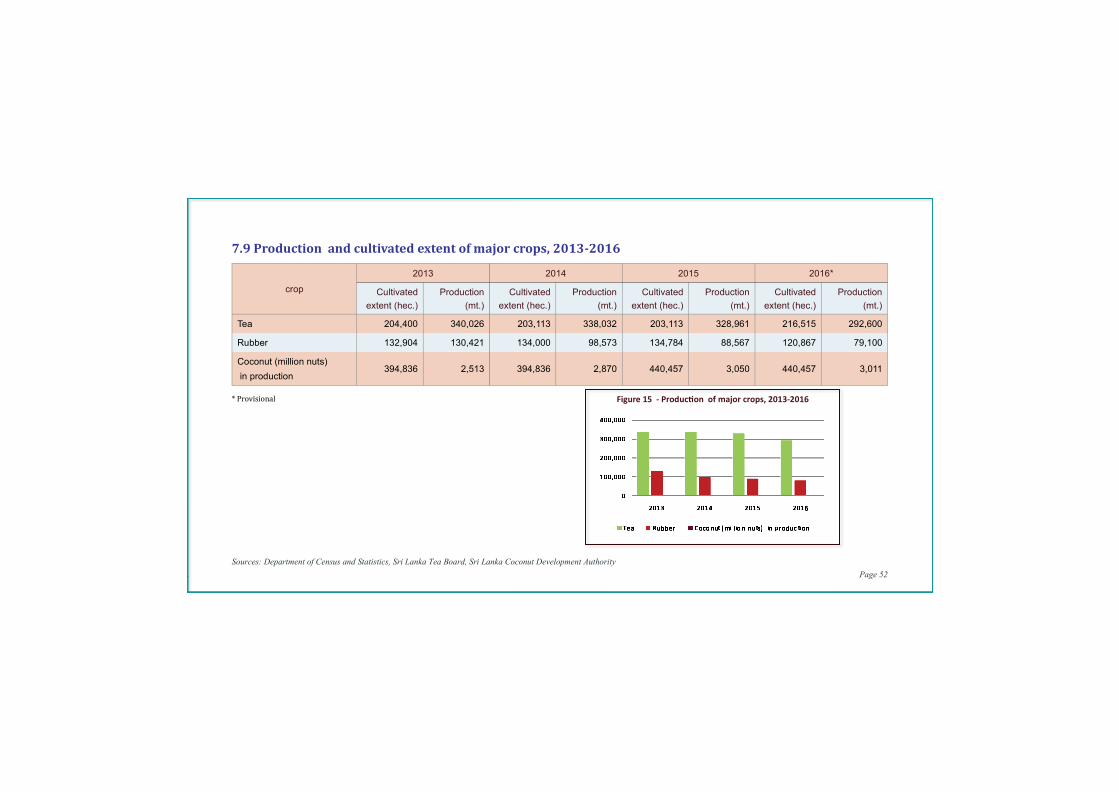
7.9Productionandcultivatedextentofmajorcrops,2013-2016
crop
2013 2014 2015 2016*
Cultivated
extent (hec.)
Production
(mt.)
Cultivated
extent (hec.)
Production
(mt.)
Cultivated
extent (hec.)
Production
(mt.)
Cultivated
extent (hec.)
Production
(mt.)
Tea 204,400 340,026 203,113 338,032 203,113 328,961 216,515 292,600
Rubber 132,904 130,421 134,000 98,573 134,784 88,567 120,867 79,100
Coconut (million nuts)
in production394,836 2,513 394,836 2,870 440,457 3,050 440,457 3,011
*Provisional Figure 15 - Produc� on of major crops, 2013-2016
Source: Department of Census and Statistics Page 53
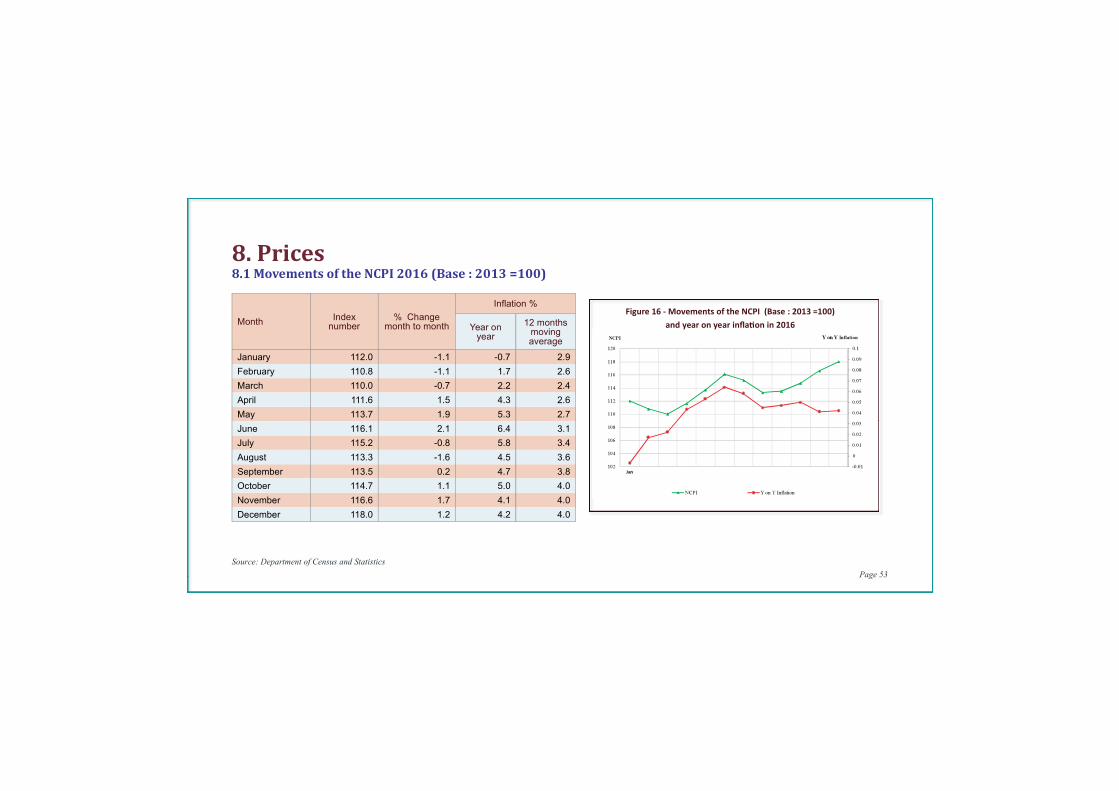
8.1MovementsoftheNCPI2016(Base:2013=100)
Month Index number
% Change month to month
Infl ation %
Year on year
12 months moving average
January 112.0 -1.1 -0.7 2.9
February 110.8 -1.1 1.7 2.6
March 110.0 -0.7 2.2 2.4
April 111.6 1.5 4.3 2.6
May 113.7 1.9 5.3 2.7
June 116.1 2.1 6.4 3.1
July 115.2 -0.8 5.8 3.4
August 113.3 -1.6 4.5 3.6
September 113.5 0.2 4.7 3.8
October 114.7 1.1 5.0 4.0
November 116.6 1.7 4.1 4.0
December 118.0 1.2 4.2 4.0
8.Prices
Figure 16 - Movements of the NCPI (Base : 2013 =100)
and year on year infl a� on in 2016
Source: Department of Census and Statistics Page 54
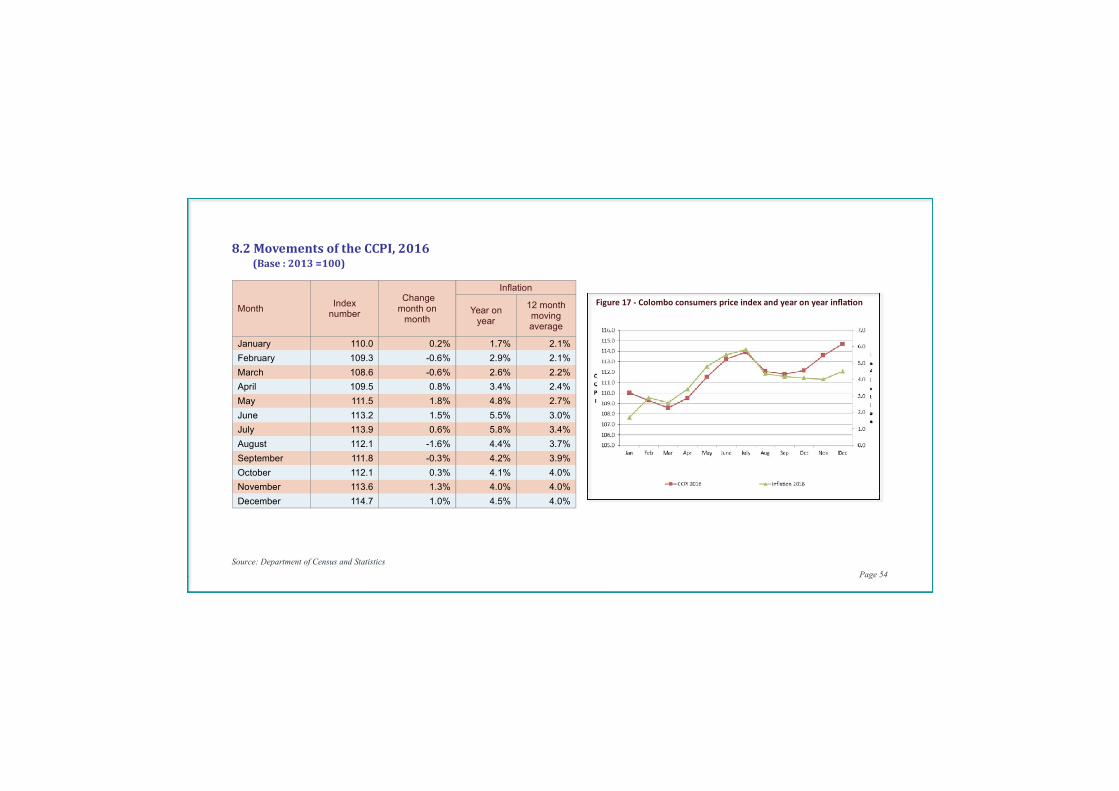
8.2MovementsoftheCCPI,2016(Base:2013=100)
MonthIndex
number
Change month on
month
Infl ation
Year on year
12 month moving average
January 110.0 0.2% 1.7% 2.1%
February 109.3 -0.6% 2.9% 2.1%
March 108.6 -0.6% 2.6% 2.2%
April 109.5 0.8% 3.4% 2.4%
May 111.5 1.8% 4.8% 2.7%
June 113.2 1.5% 5.5% 3.0%
July 113.9 0.6% 5.8% 3.4%
August 112.1 -1.6% 4.4% 3.7%
September 111.8 -0.3% 4.2% 3.9%
October 112.1 0.3% 4.1% 4.0%
November 113.6 1.3% 4.0% 4.0%
December 114.7 1.0% 4.5% 4.0%
Figure 17 - Colombo consumers price index and year on year infl a� on
Source: Department of Census and Statistics Page 55
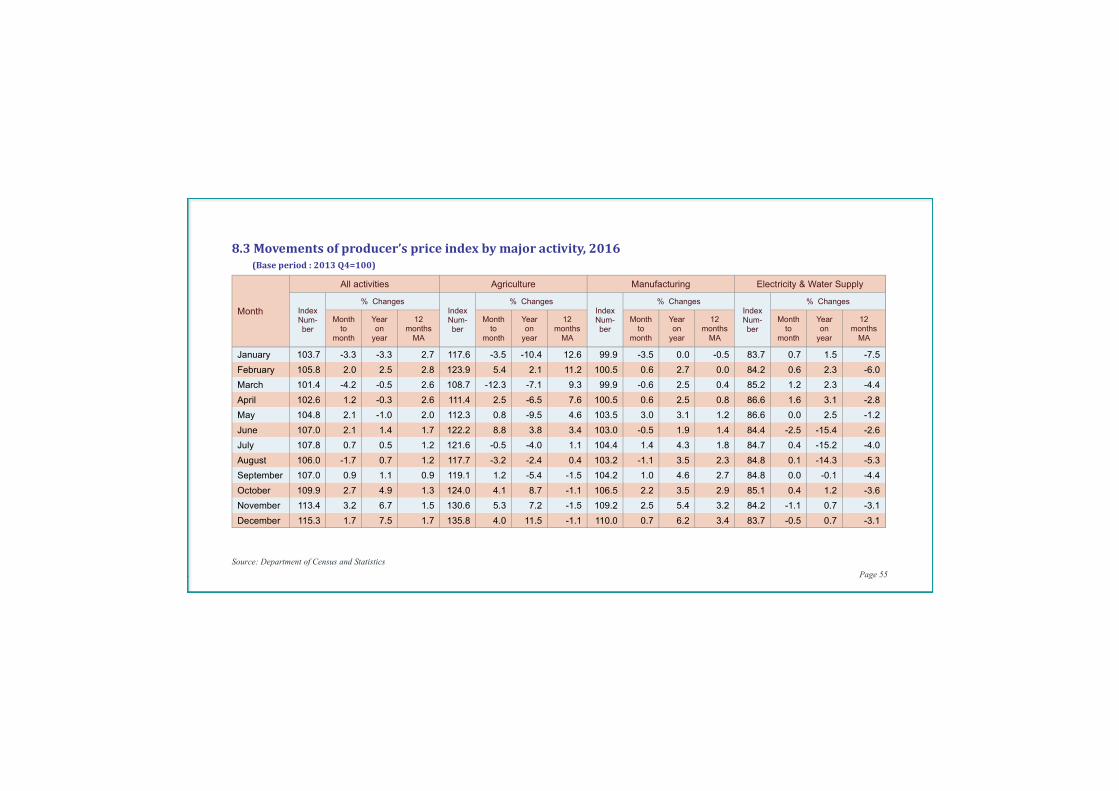
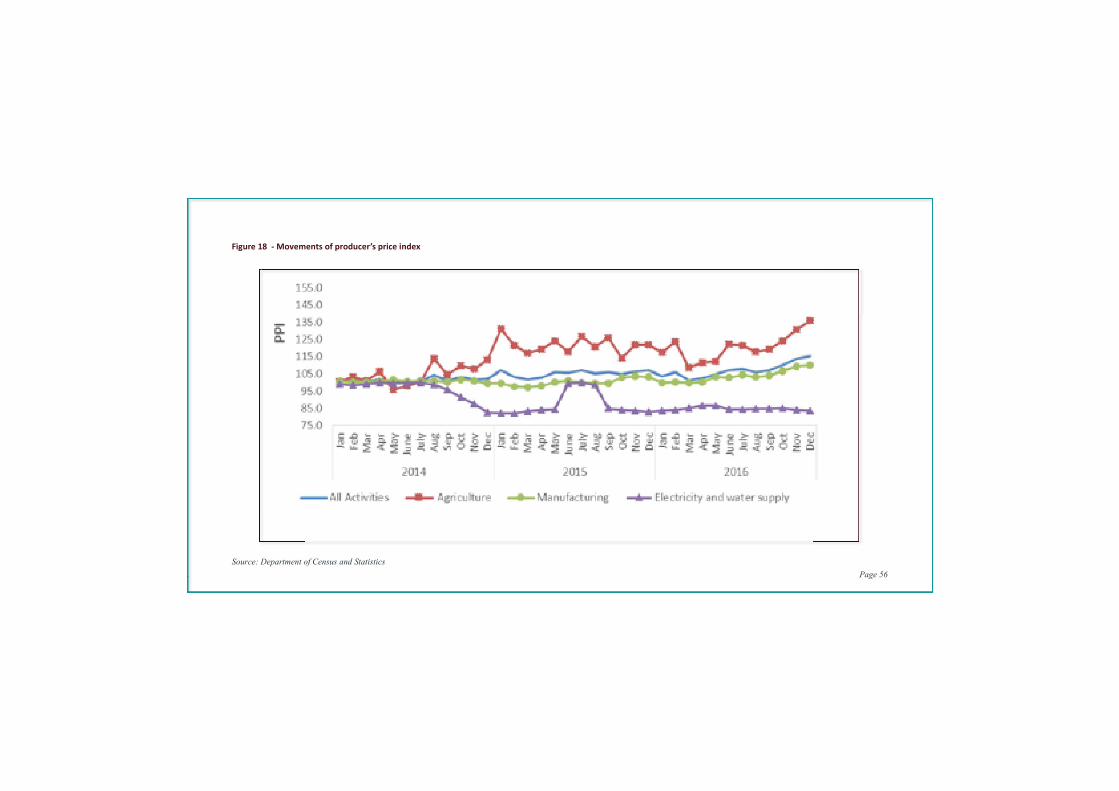
8.3Movementsofproducer’spriceindexbymajoractivity,2016(Baseperiod:2013Q4=100)
Month
All activities Agriculture Manufacturing Electricity & Water Supply
Index Num-ber
% Changes Index Num-ber
% Changes Index Num-ber
% Changes Index Num-ber
% Changes
Month to
month
Year on
year
12 months
MA
Month to
month
Year on
year
12 months
MA
Month to
month
Year on
year
12 months
MA
Month to
month
Year on
year
12 months
MA
January 103.7 -3.3 -3.3 2.7 117.6 -3.5 -10.4 12.6 99.9 -3.5 0.0 -0.5 83.7 0.7 1.5 -7.5
February 105.8 2.0 2.5 2.8 123.9 5.4 2.1 11.2 100.5 0.6 2.7 0.0 84.2 0.6 2.3 -6.0
March 101.4 -4.2 -0.5 2.6 108.7 -12.3 -7.1 9.3 99.9 -0.6 2.5 0.4 85.2 1.2 2.3 -4.4
April 102.6 1.2 -0.3 2.6 111.4 2.5 -6.5 7.6 100.5 0.6 2.5 0.8 86.6 1.6 3.1 -2.8
May 104.8 2.1 -1.0 2.0 112.3 0.8 -9.5 4.6 103.5 3.0 3.1 1.2 86.6 0.0 2.5 -1.2
June 107.0 2.1 1.4 1.7 122.2 8.8 3.8 3.4 103.0 -0.5 1.9 1.4 84.4 -2.5 -15.4 -2.6
July 107.8 0.7 0.5 1.2 121.6 -0.5 -4.0 1.1 104.4 1.4 4.3 1.8 84.7 0.4 -15.2 -4.0
August 106.0 -1.7 0.7 1.2 117.7 -3.2 -2.4 0.4 103.2 -1.1 3.5 2.3 84.8 0.1 -14.3 -5.3
September 107.0 0.9 1.1 0.9 119.1 1.2 -5.4 -1.5 104.2 1.0 4.6 2.7 84.8 0.0 -0.1 -4.4
October 109.9 2.7 4.9 1.3 124.0 4.1 8.7 -1.1 106.5 2.2 3.5 2.9 85.1 0.4 1.2 -3.6
November 113.4 3.2 6.7 1.5 130.6 5.3 7.2 -1.5 109.2 2.5 5.4 3.2 84.2 -1.1 0.7 -3.1
December 115.3 1.7 7.5 1.7 135.8 4.0 11.5 -1.1 110.0 0.7 6.2 3.4 83.7 -0.5 0.7 -3.1
Source: Department of Census and Statistics Page 56
Figure 18 - Movements of producer’s price index
Source: Department of Census and Statistics Page 57
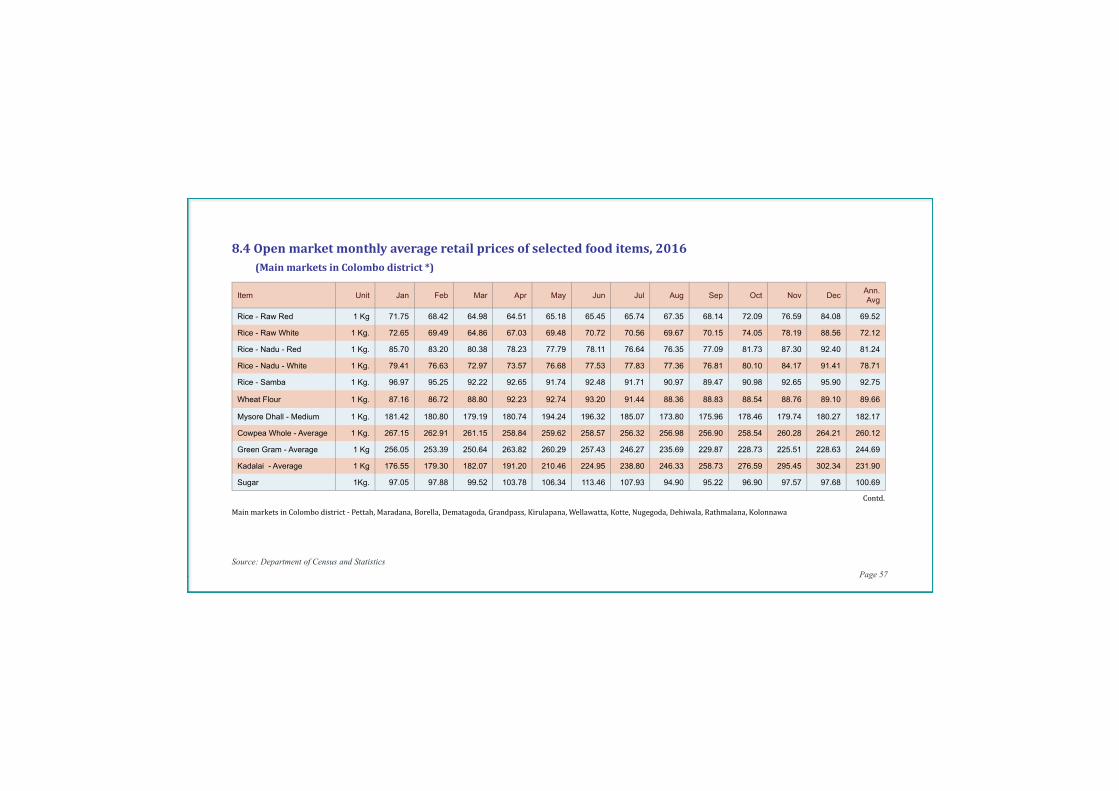
8.4Openmarketmonthlyaverageretailpricesofselectedfooditems,2016
(MainmarketsinColombodistrict*)
Item Unit Jan Feb Mar Apr May Jun Jul Aug Sep Oct Nov DecAnn.Avg
Rice - Raw Red 1 Kg 71.75 68.42 64.98 64.51 65.18 65.45 65.74 67.35 68.14 72.09 76.59 84.08 69.52
Rice - Raw White 1 Kg. 72.65 69.49 64.86 67.03 69.48 70.72 70.56 69.67 70.15 74.05 78.19 88.56 72.12
Rice - Nadu - Red 1 Kg. 85.70 83.20 80.38 78.23 77.79 78.11 76.64 76.35 77.09 81.73 87.30 92.40 81.24
Rice - Nadu - White 1 Kg. 79.41 76.63 72.97 73.57 76.68 77.53 77.83 77.36 76.81 80.10 84.17 91.41 78.71
Rice - Samba 1 Kg. 96.97 95.25 92.22 92.65 91.74 92.48 91.71 90.97 89.47 90.98 92.65 95.90 92.75
Wheat Flour 1 Kg. 87.16 86.72 88.80 92.23 92.74 93.20 91.44 88.36 88.83 88.54 88.76 89.10 89.66
Mysore Dhall - Medium 1 Kg. 181.42 180.80 179.19 180.74 194.24 196.32 185.07 173.80 175.96 178.46 179.74 180.27 182.17
Cowpea Whole - Average 1 Kg. 267.15 262.91 261.15 258.84 259.62 258.57 256.32 256.98 256.90 258.54 260.28 264.21 260.12
Green Gram - Average 1 Kg 256.05 253.39 250.64 263.82 260.29 257.43 246.27 235.69 229.87 228.73 225.51 228.63 244.69
Kadalai - Average 1 Kg 176.55 179.30 182.07 191.20 210.46 224.95 238.80 246.33 258.73 276.59 295.45 302.34 231.90
Sugar 1Kg. 97.05 97.88 99.52 103.78 106.34 113.46 107.93 94.90 95.22 96.90 97.57 97.68 100.69
MainmarketsinColombodistrict-Pettah,Maradana,Borella,Dematagoda,Grandpass,Kirulapana,Wellawatta,Kotte,Nugegoda,Dehiwala,Rathmalana,Kolonnawa
Contd.
Source: Department of Census and Statistics Page 58
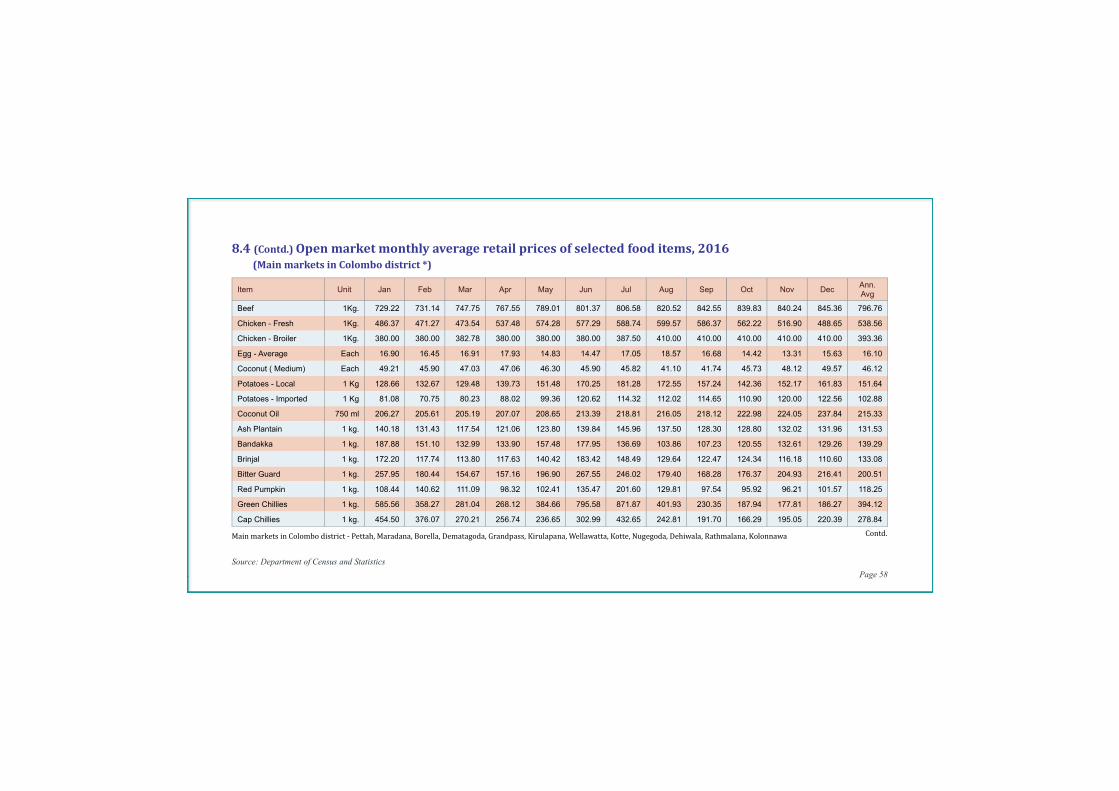
Item Unit Jan Feb Mar Apr May Jun Jul Aug Sep Oct Nov DecAnn.Avg
Beef 1Kg. 729.22 731.14 747.75 767.55 789.01 801.37 806.58 820.52 842.55 839.83 840.24 845.36 796.76
Chicken - Fresh 1Kg. 486.37 471.27 473.54 537.48 574.28 577.29 588.74 599.57 586.37 562.22 516.90 488.65 538.56
Chicken - Broiler 1Kg. 380.00 380.00 382.78 380.00 380.00 380.00 387.50 410.00 410.00 410.00 410.00 410.00 393.36
Egg - Average Each 16.90 16.45 16.91 17.93 14.83 14.47 17.05 18.57 16.68 14.42 13.31 15.63 16.10
Coconut ( Medium) Each 49.21 45.90 47.03 47.06 46.30 45.90 45.82 41.10 41.74 45.73 48.12 49.57 46.12
Potatoes - Local 1 Kg 128.66 132.67 129.48 139.73 151.48 170.25 181.28 172.55 157.24 142.36 152.17 161.83 151.64
Potatoes - Imported 1 Kg 81.08 70.75 80.23 88.02 99.36 120.62 114.32 112.02 114.65 110.90 120.00 122.56 102.88
Coconut Oil 750 ml 206.27 205.61 205.19 207.07 208.65 213.39 218.81 216.05 218.12 222.98 224.05 237.84 215.33
Ash Plantain 1 kg. 140.18 131.43 117.54 121.06 123.80 139.84 145.96 137.50 128.30 128.80 132.02 131.96 131.53
Bandakka 1 kg. 187.88 151.10 132.99 133.90 157.48 177.95 136.69 103.86 107.23 120.55 132.61 129.26 139.29
Brinjal 1 kg. 172.20 117.74 113.80 117.63 140.42 183.42 148.49 129.64 122.47 124.34 116.18 110.60 133.08
Bitter Guard 1 kg. 257.95 180.44 154.67 157.16 196.90 267.55 246.02 179.40 168.28 176.37 204.93 216.41 200.51
Red Pumpkin 1 kg. 108.44 140.62 111.09 98.32 102.41 135.47 201.60 129.81 97.54 95.92 96.21 101.57 118.25
Green Chillies 1 kg. 585.56 358.27 281.04 268.12 384.66 795.58 871.87 401.93 230.35 187.94 177.81 186.27 394.12
Cap Chillies 1 kg. 454.50 376.07 270.21 256.74 236.65 302.99 432.65 242.81 191.70 166.29 195.05 220.39 278.84
MainmarketsinColombodistrict-Pettah,Maradana,Borella,Dematagoda,Grandpass,Kirulapana,Wellawatta,Kotte,Nugegoda,Dehiwala,Rathmalana,Kolonnawa
8.4(Contd.)Openmarketmonthlyaverageretailpricesofselectedfooditems,2016(MainmarketsinColombodistrict*)
Contd.
Source: Department of Census and Statistics Page 59
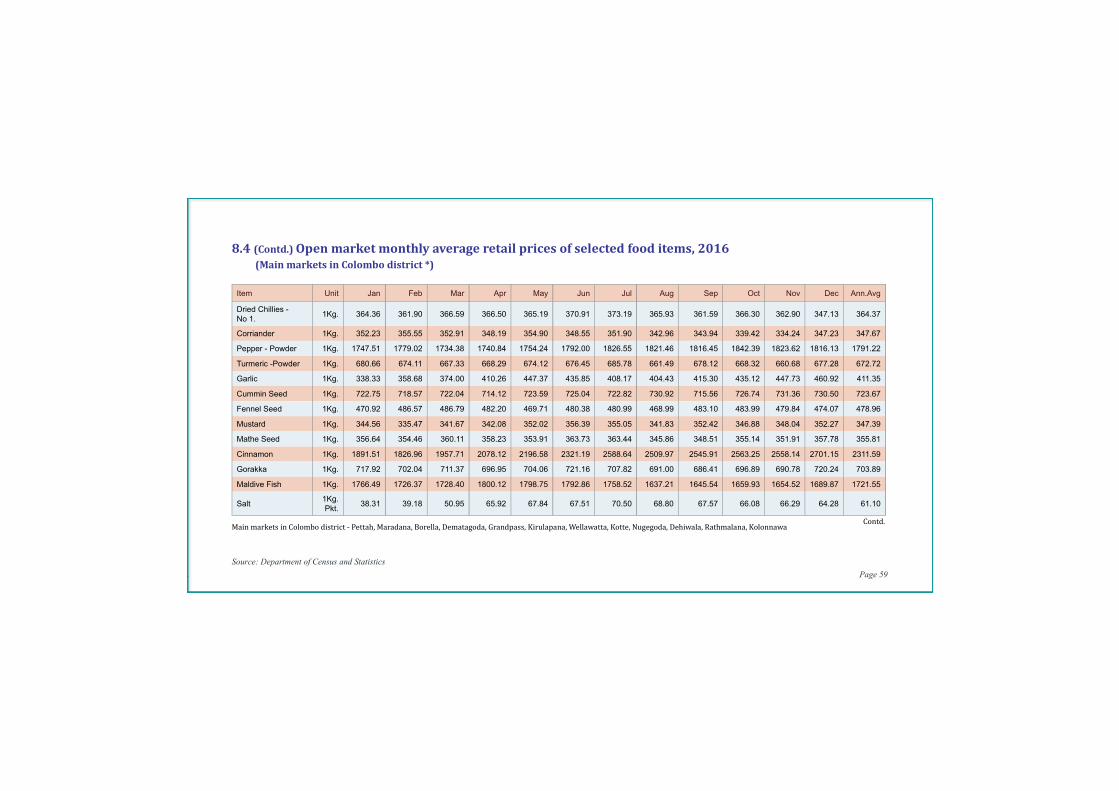
Item Unit Jan Feb Mar Apr May Jun Jul Aug Sep Oct Nov Dec Ann.Avg
Dried Chillies - No 1.
1Kg. 364.36 361.90 366.59 366.50 365.19 370.91 373.19 365.93 361.59 366.30 362.90 347.13 364.37
Corriander 1Kg. 352.23 355.55 352.91 348.19 354.90 348.55 351.90 342.96 343.94 339.42 334.24 347.23 347.67
Pepper - Powder 1Kg. 1747.51 1779.02 1734.38 1740.84 1754.24 1792.00 1826.55 1821.46 1816.45 1842.39 1823.62 1816.13 1791.22
Turmeric -Powder 1Kg. 680.66 674.11 667.33 668.29 674.12 676.45 685.78 661.49 678.12 668.32 660.68 677.28 672.72
Garlic 1Kg. 338.33 358.68 374.00 410.26 447.37 435.85 408.17 404.43 415.30 435.12 447.73 460.92 411.35
Cummin Seed 1Kg. 722.75 718.57 722.04 714.12 723.59 725.04 722.82 730.92 715.56 726.74 731.36 730.50 723.67
Fennel Seed 1Kg. 470.92 486.57 486.79 482.20 469.71 480.38 480.99 468.99 483.10 483.99 479.84 474.07 478.96
Mustard 1Kg. 344.56 335.47 341.67 342.08 352.02 356.39 355.05 341.83 352.42 346.88 348.04 352.27 347.39
Mathe Seed 1Kg. 356.64 354.46 360.11 358.23 353.91 363.73 363.44 345.86 348.51 355.14 351.91 357.78 355.81
Cinnamon 1Kg. 1891.51 1826.96 1957.71 2078.12 2196.58 2321.19 2588.64 2509.97 2545.91 2563.25 2558.14 2701.15 2311.59
Gorakka 1Kg. 717.92 702.04 711.37 696.95 704.06 721.16 707.82 691.00 686.41 696.89 690.78 720.24 703.89
Maldive Fish 1Kg. 1766.49 1726.37 1728.40 1800.12 1798.75 1792.86 1758.52 1637.21 1645.54 1659.93 1654.52 1689.87 1721.55
Salt1Kg.Pkt.
38.31 39.18 50.95 65.92 67.84 67.51 70.50 68.80 67.57 66.08 66.29 64.28 61.10
MainmarketsinColombodistrict-Pettah,Maradana,Borella,Dematagoda,Grandpass,Kirulapana,Wellawatta,Kotte,Nugegoda,Dehiwala,Rathmalana,Kolonnawa
8.4(Contd.)Openmarketmonthlyaverageretailpricesofselectedfooditems,2016(MainmarketsinColombodistrict*)
Contd.
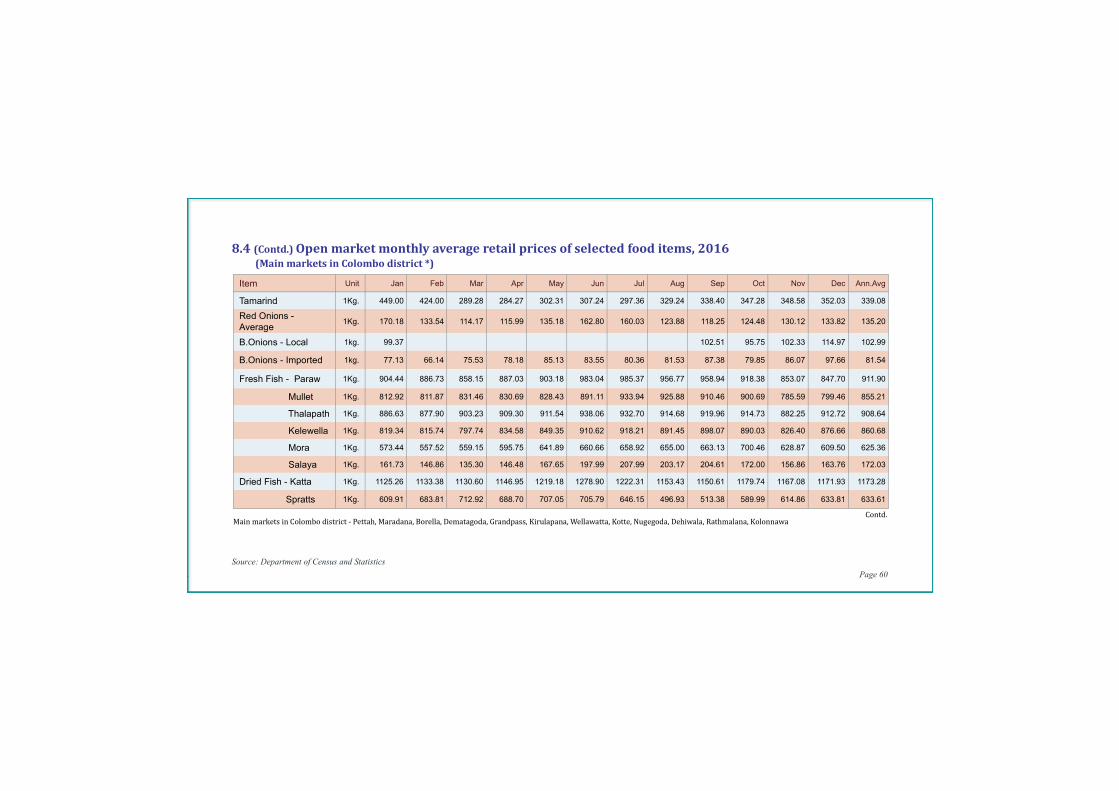
Source: Department of Census and Statistics Page 60
Item Unit Jan Feb Mar Apr May Jun Jul Aug Sep Oct Nov Dec Ann.Avg
Tamarind 1Kg. 449.00 424.00 289.28 284.27 302.31 307.24 297.36 329.24 338.40 347.28 348.58 352.03 339.08
Red Onions - Average
1Kg. 170.18 133.54 114.17 115.99 135.18 162.80 160.03 123.88 118.25 124.48 130.12 133.82 135.20
B.Onions - Local 1kg. 99.37 102.51 95.75 102.33 114.97 102.99
B.Onions - Imported 1kg. 77.13 66.14 75.53 78.18 85.13 83.55 80.36 81.53 87.38 79.85 86.07 97.66 81.54
Fresh Fish - Paraw 1Kg. 904.44 886.73 858.15 887.03 903.18 983.04 985.37 956.77 958.94 918.38 853.07 847.70 911.90
Mullet 1Kg. 812.92 811.87 831.46 830.69 828.43 891.11 933.94 925.88 910.46 900.69 785.59 799.46 855.21
Thalapath 1Kg. 886.63 877.90 903.23 909.30 911.54 938.06 932.70 914.68 919.96 914.73 882.25 912.72 908.64
Kelewella 1Kg. 819.34 815.74 797.74 834.58 849.35 910.62 918.21 891.45 898.07 890.03 826.40 876.66 860.68
Mora 1Kg. 573.44 557.52 559.15 595.75 641.89 660.66 658.92 655.00 663.13 700.46 628.87 609.50 625.36
Salaya 1Kg. 161.73 146.86 135.30 146.48 167.65 197.99 207.99 203.17 204.61 172.00 156.86 163.76 172.03
Dried Fish - Katta 1Kg. 1125.26 1133.38 1130.60 1146.95 1219.18 1278.90 1222.31 1153.43 1150.61 1179.74 1167.08 1171.93 1173.28
Spratts 1Kg. 609.91 683.81 712.92 688.70 707.05 705.79 646.15 496.93 513.38 589.99 614.86 633.81 633.61
MainmarketsinColombodistrict-Pettah,Maradana,Borella,Dematagoda,Grandpass,Kirulapana,Wellawatta,Kotte,Nugegoda,Dehiwala,Rathmalana,Kolonnawa
8.4(Contd.)Openmarketmonthlyaverageretailpricesofselectedfooditems,2016(MainmarketsinColombodistrict*)
Contd.
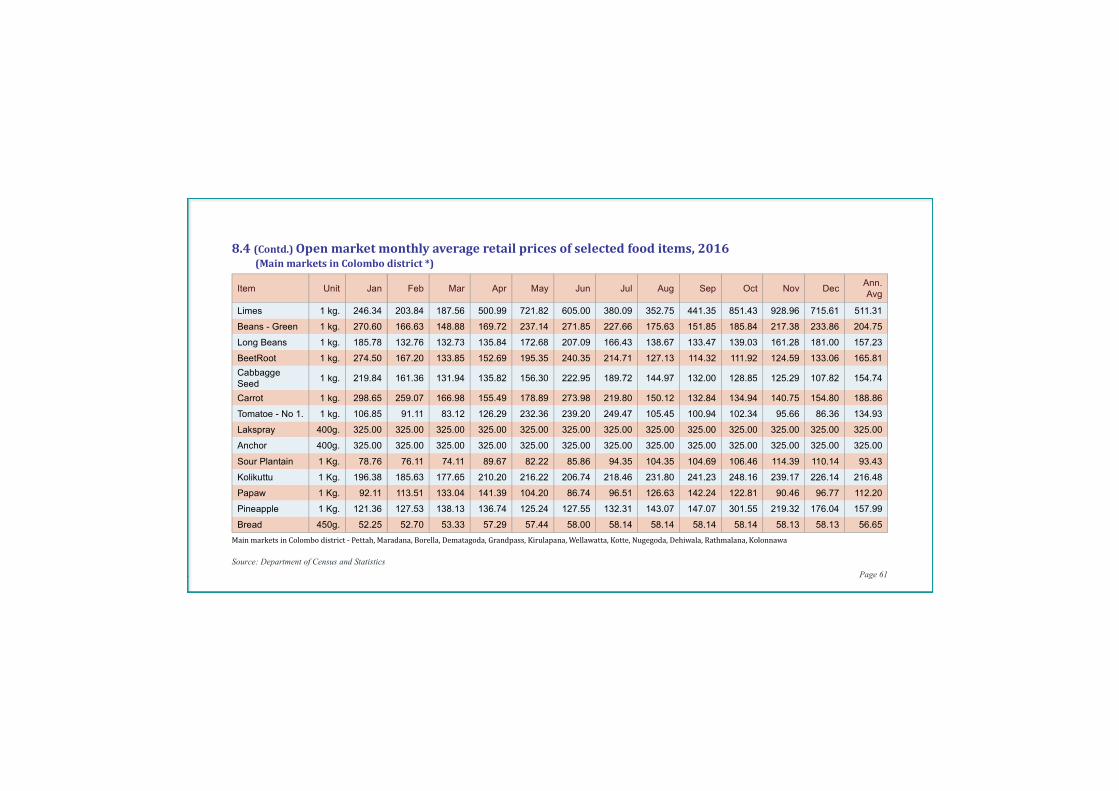
Source: Department of Census and Statistics Page 61
Item Unit Jan Feb Mar Apr May Jun Jul Aug Sep Oct Nov DecAnn.Avg
Limes 1 kg. 246.34 203.84 187.56 500.99 721.82 605.00 380.09 352.75 441.35 851.43 928.96 715.61 511.31
Beans - Green 1 kg. 270.60 166.63 148.88 169.72 237.14 271.85 227.66 175.63 151.85 185.84 217.38 233.86 204.75
Long Beans 1 kg. 185.78 132.76 132.73 135.84 172.68 207.09 166.43 138.67 133.47 139.03 161.28 181.00 157.23
BeetRoot 1 kg. 274.50 167.20 133.85 152.69 195.35 240.35 214.71 127.13 114.32 111.92 124.59 133.06 165.81
Cabbagge Seed
1 kg. 219.84 161.36 131.94 135.82 156.30 222.95 189.72 144.97 132.00 128.85 125.29 107.82 154.74
Carrot 1 kg. 298.65 259.07 166.98 155.49 178.89 273.98 219.80 150.12 132.84 134.94 140.75 154.80 188.86
Tomatoe - No 1. 1 kg. 106.85 91.11 83.12 126.29 232.36 239.20 249.47 105.45 100.94 102.34 95.66 86.36 134.93
Lakspray 400g. 325.00 325.00 325.00 325.00 325.00 325.00 325.00 325.00 325.00 325.00 325.00 325.00 325.00
Anchor 400g. 325.00 325.00 325.00 325.00 325.00 325.00 325.00 325.00 325.00 325.00 325.00 325.00 325.00
Sour Plantain 1 Kg. 78.76 76.11 74.11 89.67 82.22 85.86 94.35 104.35 104.69 106.46 114.39 110.14 93.43
Kolikuttu 1 Kg. 196.38 185.63 177.65 210.20 216.22 206.74 218.46 231.80 241.23 248.16 239.17 226.14 216.48
Papaw 1 Kg. 92.11 113.51 133.04 141.39 104.20 86.74 96.51 126.63 142.24 122.81 90.46 96.77 112.20
Pineapple 1 Kg. 121.36 127.53 138.13 136.74 125.24 127.55 132.31 143.07 147.07 301.55 219.32 176.04 157.99
Bread 450g. 52.25 52.70 53.33 57.29 57.44 58.00 58.14 58.14 58.14 58.14 58.13 58.13 56.65
8.4(Contd.)Openmarketmonthlyaverageretailpricesofselectedfooditems,2016(MainmarketsinColombodistrict*)
MainmarketsinColombodistrict-Pettah,Maradana,Borella,Dematagoda,Grandpass,Kirulapana,Wellawatta,Kotte,Nugegoda,Dehiwala,Rathmalana,Kolonnawa
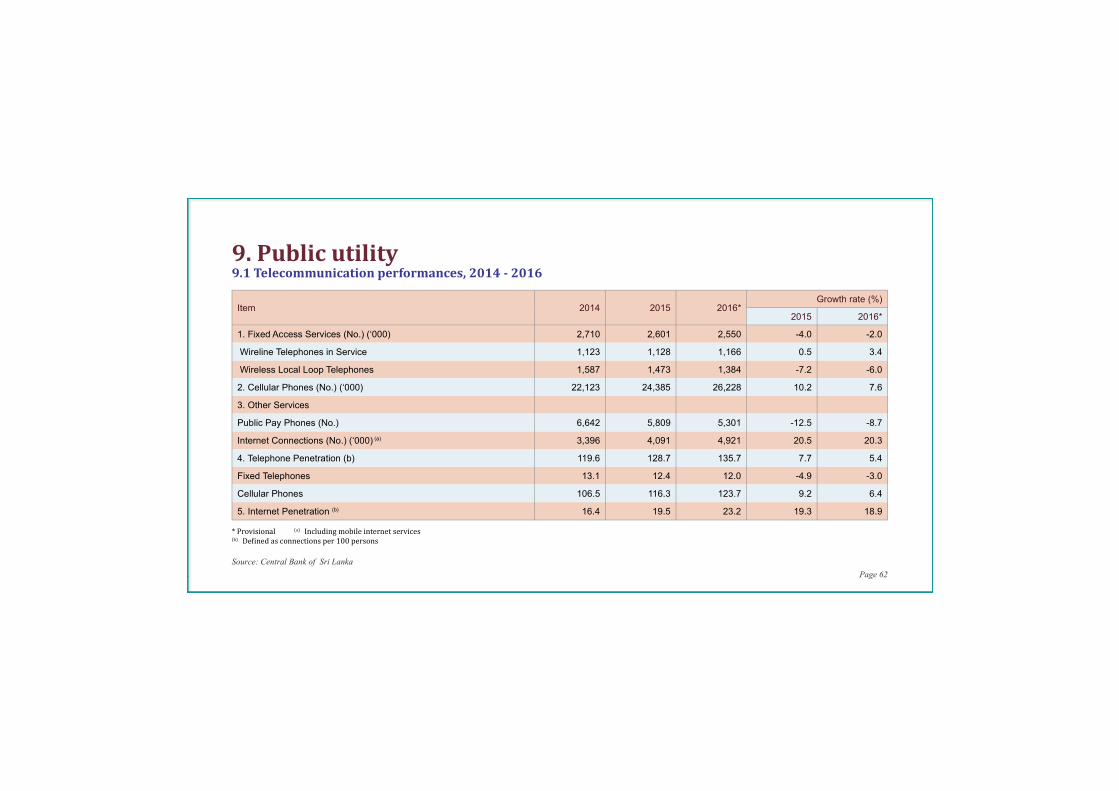
Source: Central Bank of Sri Lanka Page 62
9.1Telecommunicationperformances,2014-2016
Item 2014 2015 2016*Growth rate (%)
2015 2016*
1. Fixed Access Services (No.) (‘000) 2,710 2,601 2,550 -4.0 -2.0
Wireline Telephones in Service 1,123 1,128 1,166 0.5 3.4
Wireless Local Loop Telephones 1,587 1,473 1,384 -7.2 -6.0
2. Cellular Phones (No.) (‘000) 22,123 24,385 26,228 10.2 7.6
3. Other Services
Public Pay Phones (No.) 6,642 5,809 5,301 -12.5 -8.7
Internet Connections (No.) (‘000) (a) 3,396 4,091 4,921 20.5 20.3
4. Telephone Penetration (b) 119.6 128.7 135.7 7.7 5.4
Fixed Telephones 13.1 12.4 12.0 -4.9 -3.0
Cellular Phones 106.5 116.3 123.7 9.2 6.4
5. Internet Penetration (b) 16.4 19.5 23.2 19.3 18.9
9.Publicutility
*Provisional(a)Includingmobileinternetservices(b)De�inedasconnectionsper100persons
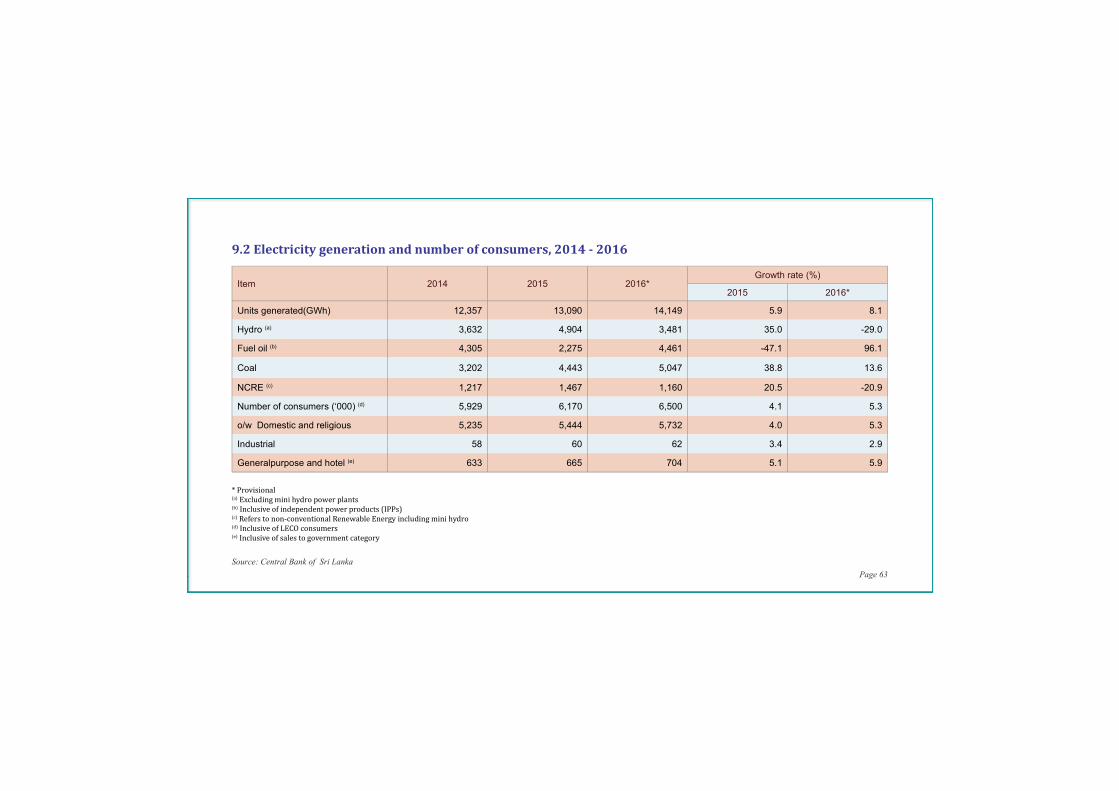
Source: Central Bank of Sri Lanka Page 63
9.2Electricitygenerationandnumberofconsumers,2014-2016
Item 2014 2015 2016*Growth rate (%)
2015 2016*
Units generated(GWh) 12,357 13,090 14,149 5.9 8.1
Hydro (a) 3,632 4,904 3,481 35.0 -29.0
Fuel oil (b) 4,305 2,275 4,461 -47.1 96.1
Coal 3,202 4,443 5,047 38.8 13.6
NCRE (c) 1,217 1,467 1,160 20.5 -20.9
Number of consumers (‘000) (d) 5,929 6,170 6,500 4.1 5.3
o/w Domestic and religious 5,235 5,444 5,732 4.0 5.3
Industrial 58 60 62 3.4 2.9
Generalpurpose and hotel (e) 633 665 704 5.1 5.9
*Provisional(a)Excludingminihydropowerplants(b)Inclusiveofindependentpowerproducts(IPPs)(c)Referstonon-conventionalRenewableEnergyincludingminihydro(d)InclusiveofLECOconsumers(e)Inclusiveofsalestogovernmentcategory
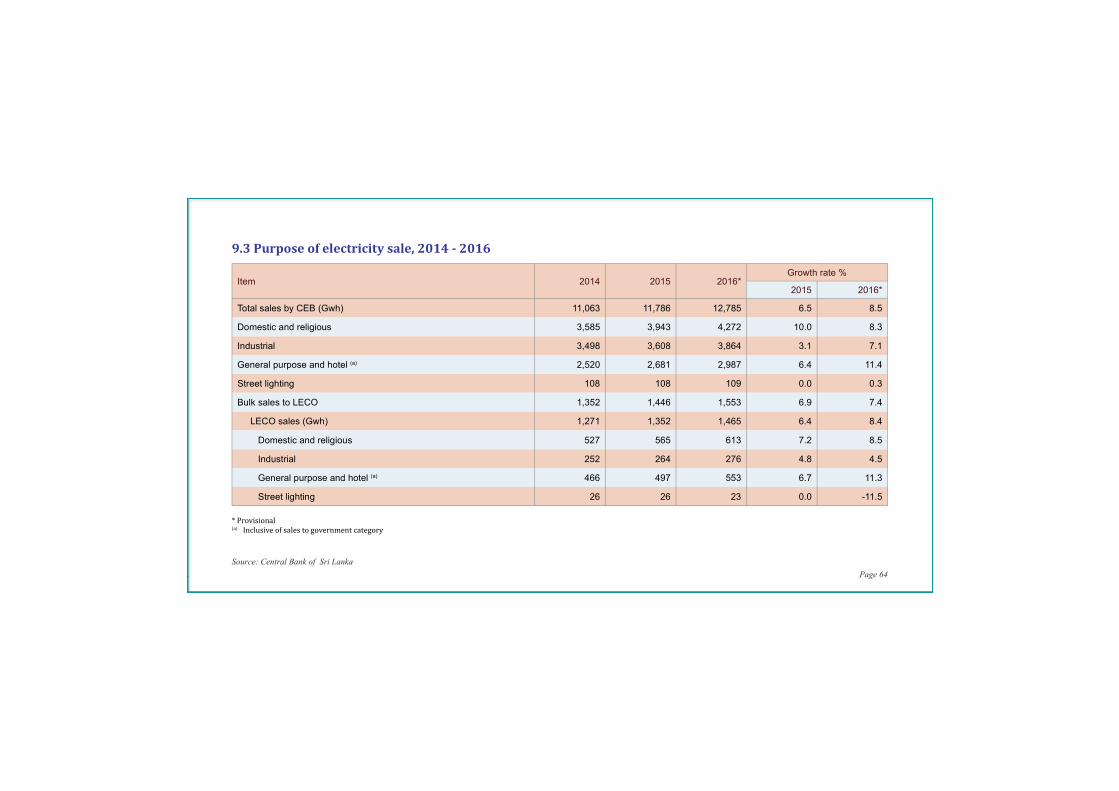
Source: Central Bank of Sri Lanka Page 64
9.3Purposeofelectricitysale,2014-2016
Item 2014 2015 2016*Growth rate %
2015 2016*
Total sales by CEB (Gwh) 11,063 11,786 12,785 6.5 8.5
Domestic and religious 3,585 3,943 4,272 10.0 8.3
Industrial 3,498 3,608 3,864 3.1 7.1
General purpose and hotel (a) 2,520 2,681 2,987 6.4 11.4
Street lighting 108 108 109 0.0 0.3
Bulk sales to LECO 1,352 1,446 1,553 6.9 7.4
LECO sales (Gwh) 1,271 1,352 1,465 6.4 8.4
Domestic and religious 527 565 613 7.2 8.5
Industrial 252 264 276 4.8 4.5
General purpose and hotel (a) 466 497 553 6.7 11.3
Street lighting 26 26 23 0.0 -11.5
*Provisional(a)Inclusiveofsalestogovernmentcategory
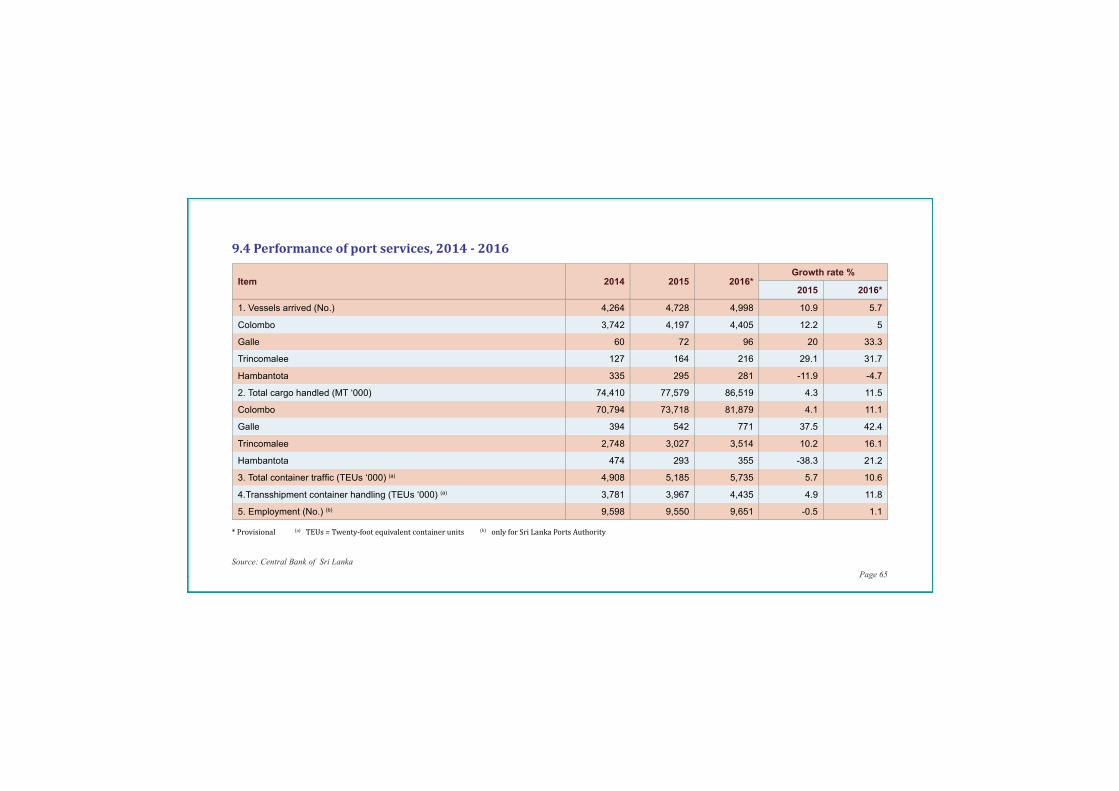
Source: Central Bank of Sri Lanka Page 65
9.4Performanceofportservices,2014-2016
Item 2014 2015 2016*Growth rate %
2015 2016*
1. Vessels arrived (No.) 4,264 4,728 4,998 10.9 5.7
Colombo 3,742 4,197 4,405 12.2 5
Galle 60 72 96 20 33.3
Trincomalee 127 164 216 29.1 31.7
Hambantota 335 295 281 -11.9 -4.7
2. Total cargo handled (MT ‘000) 74,410 77,579 86,519 4.3 11.5
Colombo 70,794 73,718 81,879 4.1 11.1
Galle 394 542 771 37.5 42.4
Trincomalee 2,748 3,027 3,514 10.2 16.1
Hambantota 474 293 355 -38.3 21.2
3. Total container traffi c (TEUs ‘000) (a) 4,908 5,185 5,735 5.7 10.6
4.Transshipment container handling (TEUs ‘000) (a) 3,781 3,967 4,435 4.9 11.8
5. Employment (No.) (b) 9,598 9,550 9,651 -0.5 1.1
*Provisional(a)TEUs=Twenty-footequivalentcontainerunits(b)onlyforSriLankaPortsAuthority
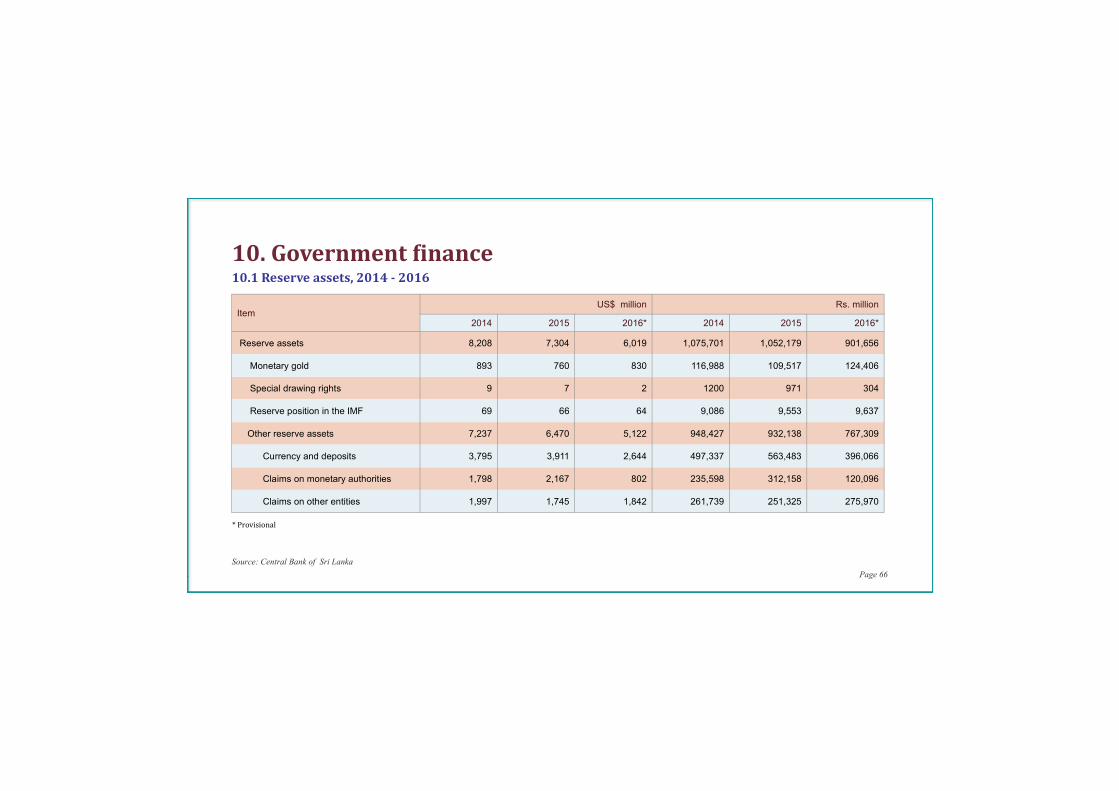
Source: Central Bank of Sri Lanka Page 66
ItemUS$ million Rs. million
2014 2015 2016* 2014 2015 2016*
Reserve assets 8,208 7,304 6,019 1,075,701 1,052,179 901,656
Monetary gold 893 760 830 116,988 109,517 124,406
Special drawing rights 9 7 2 1200 971 304
Reserve position in the IMF 69 66 64 9,086 9,553 9,637
Other reserve assets 7,237 6,470 5,122 948,427 932,138 767,309
Currency and deposits 3,795 3,911 2,644 497,337 563,483 396,066
Claims on monetary authorities 1,798 2,167 802 235,598 312,158 120,096
Claims on other entities 1,997 1,745 1,842 261,739 251,325 275,970
10.Government�inance10.1Reserveassets,2014-2016
*Provisional
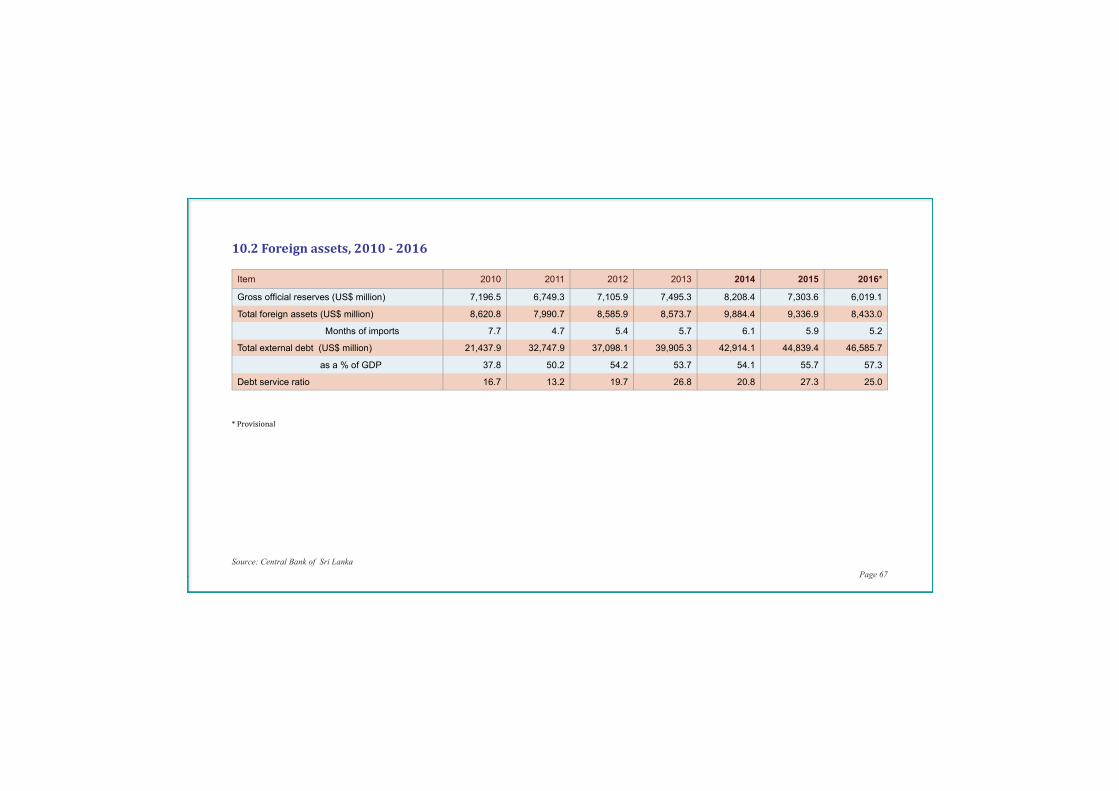
Source: Central Bank of Sri Lanka Page 67
Item 2010 2011 2012 2013 2014 2015 2016*
Gross offi cial reserves (US$ million) 7,196.5 6,749.3 7,105.9 7,495.3 8,208.4 7,303.6 6,019.1
Total foreign assets (US$ million) 8,620.8 7,990.7 8,585.9 8,573.7 9,884.4 9,336.9 8,433.0
Months of imports 7.7 4.7 5.4 5.7 6.1 5.9 5.2
Total external debt (US$ million) 21,437.9 32,747.9 37,098.1 39,905.3 42,914.1 44,839.4 46,585.7
as a % of GDP 37.8 50.2 54.2 53.7 54.1 55.7 57.3
Debt service ratio 16.7 13.2 19.7 26.8 20.8 27.3 25.0
10.2Foreignassets,2010-2016
*Provisional
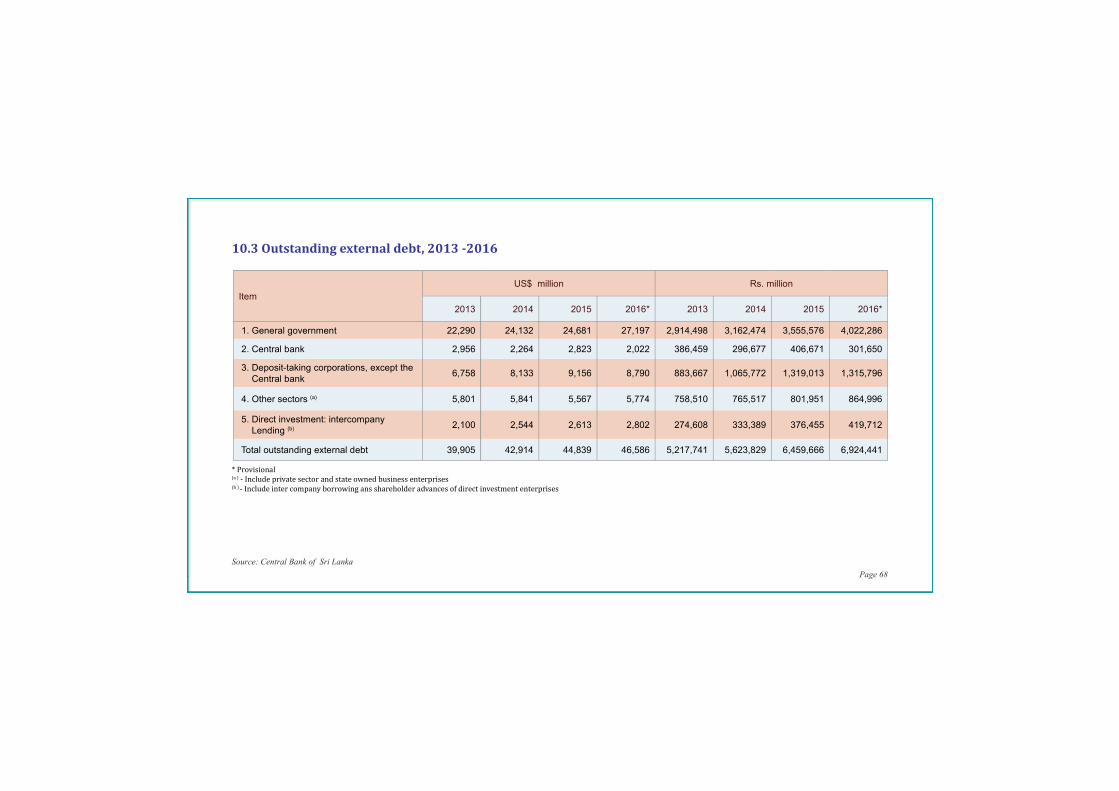
Source: Central Bank of Sri Lanka Page 68
10.3Outstandingexternaldebt,2013-2016
Item
US$ million Rs. million
2013 2014 2015 2016* 2013 2014 2015 2016*
1. General government 22,290 24,132 24,681 27,197 2,914,498 3,162,474 3,555,576 4,022,286
2. Central bank 2,956 2,264 2,823 2,022 386,459 296,677 406,671 301,650
3. Deposit-taking corporations, except the Central bank
6,758 8,133 9,156 8,790 883,667 1,065,772 1,319,013 1,315,796
4. Other sectors (a) 5,801 5,841 5,567 5,774 758,510 765,517 801,951 864,996
5. Direct investment: intercompany Lending (b)
2,100 2,544 2,613 2,802 274,608 333,389 376,455 419,712
Total outstanding external debt 39,905 42,914 44,839 46,586 5,217,741 5,623,829 6,459,666 6,924,441
*Provisional(a)-Includeprivatesectorandstateownedbusinessenterprises(b)-Includeintercompanyborrowingansshareholderadvancesofdirectinvestmententerprises
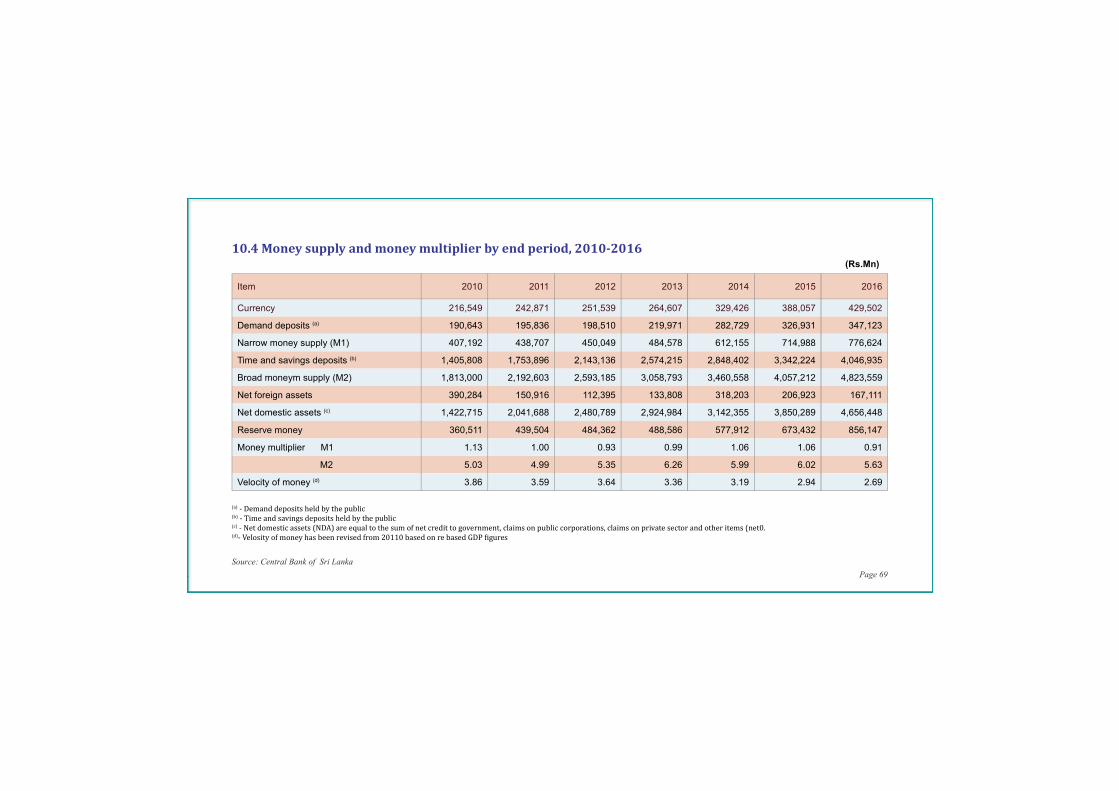
Source: Central Bank of Sri Lanka Page 69
10.4Moneysupplyandmoneymultiplierbyendperiod,2010-2016
Item 2010 2011 2012 2013 2014 2015 2016
Currency 216,549 242,871 251,539 264,607 329,426 388,057 429,502
Demand deposits (a) 190,643 195,836 198,510 219,971 282,729 326,931 347,123
Narrow money supply (M1) 407,192 438,707 450,049 484,578 612,155 714,988 776,624
Time and savings deposits (b) 1,405,808 1,753,896 2,143,136 2,574,215 2,848,402 3,342,224 4,046,935
Broad moneym supply (M2) 1,813,000 2,192,603 2,593,185 3,058,793 3,460,558 4,057,212 4,823,559
Net foreign assets 390,284 150,916 112,395 133,808 318,203 206,923 167,111
Net domestic assets (c) 1,422,715 2,041,688 2,480,789 2,924,984 3,142,355 3,850,289 4,656,448
Reserve money 360,511 439,504 484,362 488,586 577,912 673,432 856,147
Money multiplier M1 1.13 1.00 0.93 0.99 1.06 1.06 0.91
M2 5.03 4.99 5.35 6.26 5.99 6.02 5.63
Velocity of money (d) 3.86 3.59 3.64 3.36 3.19 2.94 2.69
(Rs.Mn)
(a)-Demanddepositsheldbythepublic(b)-Timeandsavingsdepositsheldbythepublic(c)-Netdomesticassets(NDA)areequaltothesumofnetcredittogovernment,claimsonpubliccorporations,claimsonprivatesectorandotheritems(net0.(d)-Velosityofmoneyhasbeenrevisedfrom20110basedonrebasedGDP�igures
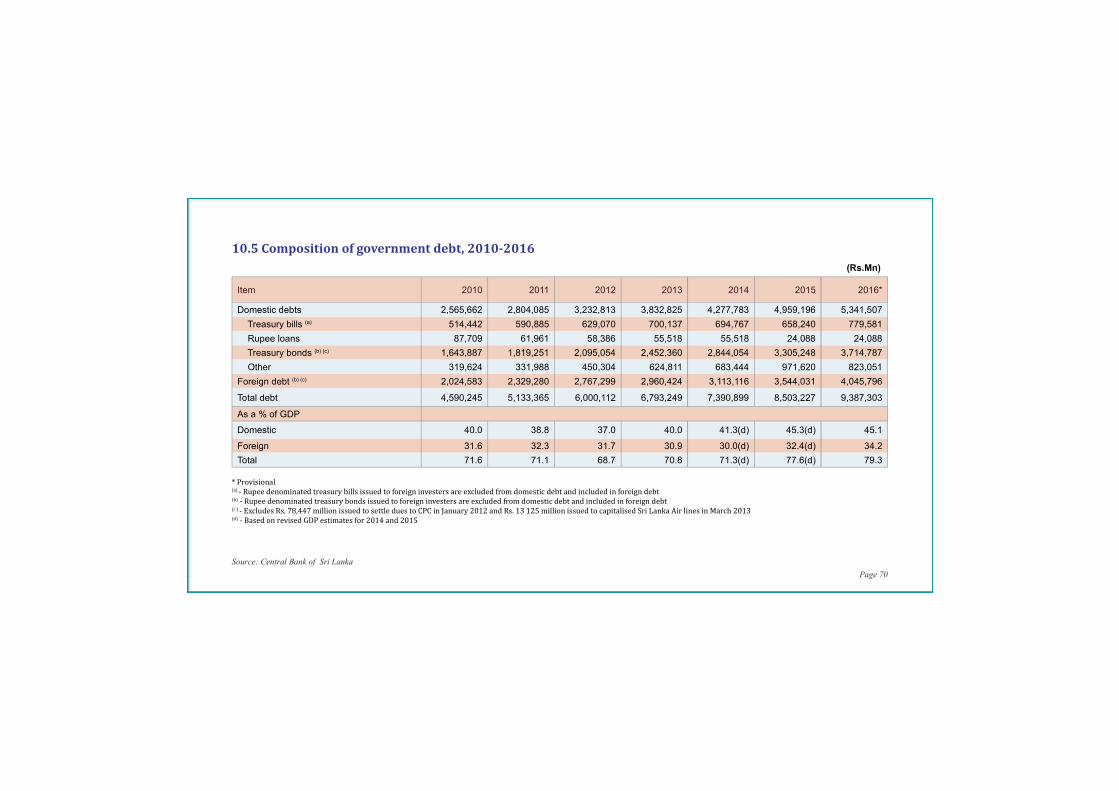
Source: Central Bank of Sri Lanka Page 70
10.5Compositionofgovernmentdebt,2010-2016
Item 2010 2011 2012 2013 2014 2015 2016*
Domestic debts 2,565,662 2,804,085 3,232,813 3,832,825 4,277,783 4,959,196 5,341,507
Treasury bills (a) 514,442 590,885 629,070 700,137 694,767 658,240 779,581
Rupee loans 87,709 61,961 58,386 55,518 55,518 24,088 24,088
Treasury bonds (b) (c) 1,643,887 1,819,251 2,095,054 2,452,360 2,844,054 3,305,248 3,714,787
Other 319,624 331,988 450,304 624,811 683,444 971,620 823,051
Foreign debt (b) (c) 2,024,583 2,329,280 2,767,299 2,960,424 3,113,116 3,544,031 4,045,796
Total debt 4,590,245 5,133,365 6,000,112 6,793,249 7,390,899 8,503,227 9,387,303
As a % of GDP
Domestic 40.0 38.8 37.0 40.0 41.3(d) 45.3(d) 45.1
Foreign 31.6 32.3 31.7 30.9 30.0(d) 32.4(d) 34.2
Total 71.6 71.1 68.7 70.8 71.3(d) 77.6(d) 79.3
(Rs.Mn)
*Provisional(a)-Rupeedenominatedtreasurybillsissuedtoforeigninvestersareexcludedfromdomesticdebtandincludedinforeigndebt(b)-Rupeedenominatedtreasurybondsissuedtoforeigninvestersareexcludedfromdomesticdebtandincludedinforeigndebt(c)-ExcludesRs.78,447millionissuedtosettleduestoCPCinJanuary2012andRs.13125millionissuedtocapitalisedSriLankaAirlinesinMarch2013(d)-BasedonrevisedGDPestimatesfor2014and2015
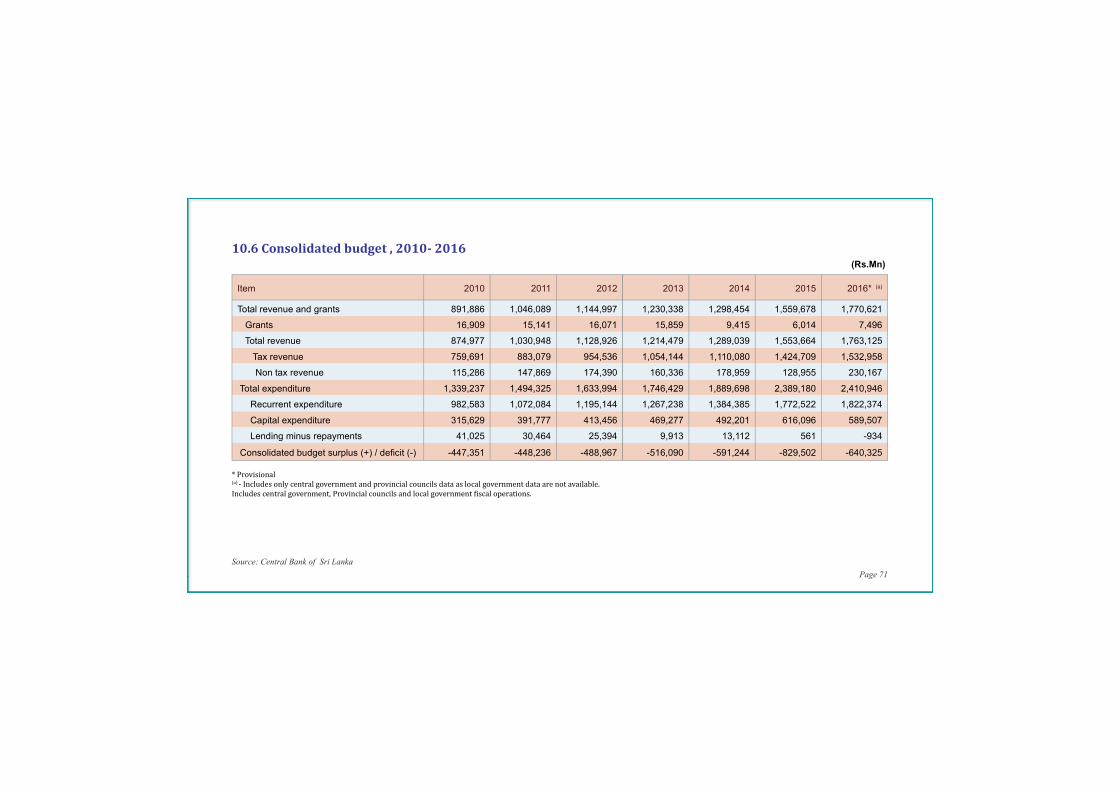
Source: Central Bank of Sri Lanka Page 71
10.6Consolidatedbudget,2010-2016
Item 2010 2011 2012 2013 2014 2015 2016* (a)
Total revenue and grants 891,886 1,046,089 1,144,997 1,230,338 1,298,454 1,559,678 1,770,621
Grants 16,909 15,141 16,071 15,859 9,415 6,014 7,496
Total revenue 874,977 1,030,948 1,128,926 1,214,479 1,289,039 1,553,664 1,763,125
Tax revenue 759,691 883,079 954,536 1,054,144 1,110,080 1,424,709 1,532,958
Non tax revenue 115,286 147,869 174,390 160,336 178,959 128,955 230,167
Total expenditure 1,339,237 1,494,325 1,633,994 1,746,429 1,889,698 2,389,180 2,410,946
Recurrent expenditure 982,583 1,072,084 1,195,144 1,267,238 1,384,385 1,772,522 1,822,374
Capital expenditure 315,629 391,777 413,456 469,277 492,201 616,096 589,507
Lending minus repayments 41,025 30,464 25,394 9,913 13,112 561 -934
Consolidated budget surplus (+) / defi cit (-) -447,351 -448,236 -488,967 -516,090 -591,244 -829,502 -640,325
(Rs.Mn)
*Provisional(a)-Includesonlycentralgovernmentandprovincialcouncilsdataaslocalgovernmentdataarenotavailable.Includescentralgovernment,Provincialcouncilsandlocalgovernment�iscaloperations.