Embed Size (px)
Citation preview

2021
ECONOMIC REVIEW OF CHEMISTRY

2021
ECONOMIC REVIEW IN CHEMISTRY
The Chemistry Industry Association of Canada (CIAC) is the voice of Canada's $52 billion chemistry industry and represents more than 50 members and partners across the country. The industry employs 81,800 Canadians and supports an additional 410,000 jobs in Canada. Members of CIAC are signatories to Responsible Care®— the association's U.N.— recognized sustainability initiative. Responsible Care® inspires its members to take actions that improve the sustainability of their operations and reduce harm throughout the entire life cycle of their products.

2021
ECONOMIC REVIEW IN CHEMISTRY
› Contents
President’s Message ....................................................................................... 3
Introduction .................................................................................................... 4
Chemistry Industry at a Glance ....................................................................... 6
Manufacturing Shipments (Revenue) .............................................................. 7
Value Added ................................................................................................... 8
Employment ................................................................................................... 9
Salaries and Wages ...................................................................................... 10
International Trade ...................................................................................... 12
Profits .......................................................................................................... 14
Productivity ................................................................................................. 15
Price Index ................................................................................................... 15
Capacity Utilization ...................................................................................... 16
Other Chemical Manufacturing Subsectors .................................................. 17
Provincial Statistics ................................................................................... 20
a. Ontario .......................................................................................................................................21
b. Alberta ........................................................................................................................................26
c. Quebec .......................................................................................................................................30
Industry Profiles ........................................................................................ 34
a. Petrochemicals and Other Organic Chemicals ...........................................................................34
b. Industrial Gases ..........................................................................................................................36
c. Inorganic Chemicals....................................................................................................................37
c. Synthetic Resins, Rubbers and Fibres .........................................................................................40
d. Specialty Chemicals ....................................................................................................................42

3
2021
ECONOMIC REVIEW IN CHEMISTRY
President’s Message
I am pleased to present to you the Chemistry Industry Association of
Canada’s (CIAC) 2020 Economic Review of Chemistry.
Canada’s $52 billion chemical manufacturing industry is a significant
contributor to our country’s economy. The sector is directly responsible for
81,800 jobs and pays approximately $6.40 billion in salary and
wages. Primarily concentrated in Alberta, Ontario and Quebec, the industry
supports an additional 410,000 jobs in the overall economy across the
country.
2020 was a year unlike any other. The chemistry sector was impacted along with the greater
economy this year and this year’s statistics show it but they also show our resilience. As economies
shutdown there was no question, we were impacted but very quickly, in some cases immediately,
demand for chemistry products rebounded. We were called upon almost immediately to supply the
goods Canadians demanded – safe and sterile food packaging, cleaning products, hand sanitizer and
water treatment chemicals just to name a few. With chemistry impacting 95% of all manufactured
products as the economy re-opened our sector responded, providing the essential building blocks to
nearly all manufactured goods.
This annual review and the accompanying executive summary provide readers with an economic
profile of the industry as well as quantitative insight into the industry’s importance to our country’s
economy, and to all Canadians.
Yours sincerely,
Bob Masterson President and CEO Chemistry Industry Association of Canada

4
2021
ECONOMIC REVIEW IN CHEMISTRY
Introduction1
Using data from Statistics Canada (unless otherwise stated), CIAC’s 2021 Economic Review of
Chemistry provides a statistical review of various key industry indicators including shipments,
imports, exports, and employment from the year 2020. The report also includes a section on
specialty chemicals, statistics for the key provinces of Quebec, Ontario and Alberta, and for the
segments of the industry of primary interest to CIAC members.
This report is prepared by the Association’s Business and Economics (B&E) team. The B&E team
provides ongoing economic analysis of government policy initiatives, business trends and changing
industry dynamics.
Industrial Classification
Industries in Canada are classified according to the 2012 North American Industrial Classification System (NAICS). This classification is maintained by Statistics Canada and its counterpart organizations in the United States and Mexico. The chemical manufacturing subsector is captured in NAICS 325 which comprises establishments primarily engaged in manufacturing chemicals and chemical products, from organic and inorganic raw materials.
NAICS 325 includes the following sub-industry groups:
• Basic chemicals (NAICS 3251) • Synthetic resins, rubbers, and synthetic fibres (NAICS 3252) • Pesticides and fertilizers (NAICS 3253) • Pharmaceuticals (NAICS 3254) • Paints, coatings and adhesives (NAICS 3255) • Soaps, cleaning compounds and toilet preparations (NAICS 3256) • Other chemical products (NAICS 3259)
This report focuses on statistics for the overall chemical industry (NAICS 325), and for the combination of NAICS 3251 and 3252 which are collectively referred to as industrial chemicals.
• NAICS 3251 Basic chemicals - comprises establishments primarily engaged in manufacturing organic and inorganic chemicals, using basic processes such as thermal cracking, distillation, and chemical reaction.
• NAICS 3252 Synthetic resins, rubbers, and fibres— comprises establishments primarily engaged in manufacturing polymers such as polyethylene, polypropylene, butyl rubbers, polyamides, and fibres made from these resins. Polymerization of monomers into polymers, for example, ethylene into polyethylene, is the basic process.
1 This publication intends to provide the best information available. However, neither CIAC nor its employees make any warranty, expressed or implied, or assumes any liability or responsibility for any use, or the results of such use, of any information or data disclosed in this report.
5
2021
ECONOMIC REVIEW IN CHEMISTRY
For more information about this report:
David Cherniak Senior Policy Analyst, Business and Economics [email protected] (613) 237-6215 ext. 231 Greg Moffatt Senior Director, Business and Economics [email protected] (613) 237-6215 ext. 230

6
2021
ECONOMIC REVIEW IN CHEMISTRY
Chemistry Industry at a Glance Chemical industry2 shipments in Canada in 2020 were $52 billion, exports were $36.0 billion, and imports totaled $62.4 billion.
The industry as a whole employed 81,800 workers in 2020 which constituted six per cent of all manufacturing jobs in Canada. In addition to the direct jobs, other jobs are supported by the purchasing activity of the chemistry industry and by the subsequent expenditure-induced activity. CIAC has estimated that for every job in the chemistry industry, another 5 indirect jobs are created in other parts of the economy, so in total the chemistry industry supports 410,000 jobs in Canada.
Industrial chemicals are a keystone industry within the Canadian economy. It converts and adds value to raw resources such as natural gas, crude oil, minerals, metals and biomass, creating intermediate products that are used as inputs by other parts of the chemistry industry, and by almost all other manufacturing segments. Major consumer industries include: plastic and rubber products (NAICS 326), forest products (NAICS 321 and 322), transportation equipment (NAICS 336), oil and gas extraction (NAICS 211), clothing (NAICS 315), construction (NAICS 23), and pharmaceuticals (NAICS 3254). For industrial chemicals, shipments in 2020 were $22.4 billion, exports were $17.8 billion, imports were $20.0 billion, and employment was 14,900 indirectly supporting 74,500 jobs in the broader Canadian economy.
Table 1: Principal Statistics for the Chemical Industry
2011 2012 2013 2014 2015 2016 2017 2018 2019 2020
Shipments, $ billion 43.4 47.1 48.6 49.7 52.2 51.6 51.3 52.9 56.0 52.0
Employment, 000 79.8 83.6 83.9 84.3 86.4 84.3 86.6 85.8 86.4 81.8
Imports, $ billion 43.4 44.4 46.4 50.3 53.7 53.3 55.8 59.8 61.8 62.3
Exports, $ billion 31.3 29.6 32.0 35.5 36.2 35.9 33.7 38.0 37.4 36.0
Table 2: Principal Statistics for the Industrial Chemical Sector
2011 2012 2013 2014 2015 2016 2017 2018 2019 2020
Shipments, $ billion 25.3 24.7 25.5 26.1 25.4 24.1 26.2 28.9 26.0 22.4
Employment, 000 17.2 17.2 17.4 17.5 17.7 15.7 16.4 16.4 15.8 14.9
Imports, $ billion 17.1 17.3 17.9 19.3 19.7 18.8 19.8 21.3 20.8 20.0
Exports, $ billion 18.6 17.0 18.7 19.8 19.2 18.7 18.7 20.6 18.4 16.5
2 Chemical industry and industrial chemicals are defined on page 1.

7
2021
ECONOMIC REVIEW IN CHEMISTRY
Manufacturing Shipments (Revenue)
In 2020, Canada’s chemical industry manufactured $52.0 billion worth of products a decrease of 4.3 per cent compared to 2019.
Shipments of industrial chemicals were $22.4 billion in 2020, representing a decrease of 13.8 per cent compared to 2019 (Table 3, Figure 1). The value of shipments for industrial chemicals declined broadly last year owing to the COVID-19 pandemic. Physical volumes remained strong but in the spring of 2020 prices for commoditized industrial chemicals declined significantly owing to the global pandemic.
Table 3: Manufacturing Shipments
Manufacturing Shipments, $ Billion 2019 2020 Change 2019-20
All chemicals 56.0 52.0 -4.3%
Industrial chemicals 26.0 22.4 -13.8%
Figure 1: Annual Chemical Industry Shipments in Billions CAD
Within the NAICS system, there are 21 manufacturing industries at the 3-digit level. Among these industries, chemicals (NAICS 325) ranks as the 4th largest based on value of shipments (Figure 2).
0
10
20
30
40
50
60
70
2011 2012 2013 2014 2015 2016 2017 2018 2019 2020
Bill
ion
s o
f C
anad
ian
$
All Chemicals Industrial Chemicals

8
2021
ECONOMIC REVIEW IN CHEMISTRY
Figure 2: Top 10 Manufacturing Industries by Value of Shipments, $ Billions
Value Added Value added measures the value of output of an industry less the value of intermediate inputs required in the production process. Compared to all manufacturing industries, chemicals ranked 3rd based on value added in 2019 (latest available, Figure 3).
Figure 3: Top 10 Manufacturing Industries by Value Added
114.0
106.0
52.0
45.5
43.6
38.7
36.7
35.1
31.0
29.0
Food
Transportation Equipment
Chemicals
Petroleum and Coal Products
Primary Metals
Fabricated Metal Products
Wood Products
Machinery
Beverage and Tobacco Products
Plastic and Rubber Products
38.0
36.9
25.5
21.2
19.4
13.2
13.1
12.7
11.5
Transportation Equipment
Food
Chemicals
Fabricated Metal Products
Machinery
Petroleum and Coal Products
Plastic and Rubber Products
Primary Metal Products
Paper Manufacturing

9
2021
ECONOMIC REVIEW IN CHEMISTRY
Employment The chemical industry employed 81,800 workers in 2020. For industrial chemicals, the figure was 14,900. For both groupings, employment peaked in 2003 and has tended to decline since, although levels have been mostly flat in recent years (Table 4 and Figure 4). In addition to the direct jobs, additional jobs are supported by the purchasing activity of the chemical industry and by the subsequent expenditure-induced activity. For every job in the chemical industry, it is estimated that another five jobs in other sectors are indirectly linked to the industry. On this
basis, the chemical industry supports about 410,000 jobs— industrial chemicals about 74,500 - in the overall Canadian economy.
Table 4: Employment in the Canadian Chemical Industry
Total Employment, Thousands 2019 2020 Change 2019-2020
All Chemicals 86.4 81.8 -5.3%
Industrial Chemicals 15.8 14.9 -5.7%
Figure 4: Chemical Industry Employment
On the basis of employment, chemicals rank 7th among all manufacturing industries (Figure 5). Plastic Products manufacturing employed 89,700 Canadians and ranked 5th among manufacturing industries.
0
20
40
60
80
100
2011 2012 2013 2014 2015 2016 2017 2018 2019 2020
All Chemicals Industrial chemicals

10
2021
ECONOMIC REVIEW IN CHEMISTRY
Figure 5: Top 10 Manufacturing Industries by Employment (in Thousands of People)
Salaries and Wages Total salaries and wages paid to employees in the chemical industry in 2020 were $6.40 billion, with $1.47 billion paid in the industrial chemical segment (Table 5). 2020 saw a small decline in wages and salaries paid in both the overall chemical sector and the Industrial Chemicals sub-sector.
Table 5: Total Salary and Wages Paid by the Chemical Industry
Total Salaries and Wages, $ Billion 2019 2020 Change 2019-20
All Chemicals 6.50 6.40 -1.5%
Industrial Chemicals 1.51 1.47 -2.7%
Chemical companies operate a variety of types of complex equipment and processes using sophisticated computer control technologies. Employees require specialized education and training to operate these processes safely and efficiently. As a result, the chemical industry’s proportion of employees with a university degree (39 per cent) is second only to the computer and electronic products industry (Figure 6), and chemicals has the highest proportion of employees with post-graduate degrees.
247.3
191.1
135.3
113.0
89.7
84.9
81.8
71.1
60.0
54.8
Food
Transportation Equipment
Machinery
Fabricated Metals
Plastic Products
Wood Products
Chemicals
Furniture
Miscellaneous Manufacturing
Computer Products

11
2021
ECONOMIC REVIEW IN CHEMISTRY
Figure 6: Top 5 Manufacturing Industry by Proportion of Employees with a University Degree
Chemicals ranked 4th among all manufacturing industries with an average salary of $78,240 (Figure 7). Within industrial chemicals the average salary was higher at $96,460. For overall manufacturing, the average salary in 2020 was $68,180.
Figure 7: Top 10 Manufacturing Industries Based on Average Earnings Per Employee in Thousands of CAD
Table 6: Average Salaries in the Chemical Industry
Average Salaries and Wages, $ Thousand 2019 2020 Change 2019-20
All Chemicals 75.2 78.2 -1.5%
Industrial Chemicals 98.1 96.5 -2.7%
44.8
39.7
34.8
30.6
22.2
Computers and electronics
Chemicals
Beverages
Electrical equipment
Petroleum refining
113.4
97.4
94.1
78.2
76.2
75.9
74.8
71.3
70.4
68.8
68.1
Petroleum and Coal Products
Primary Metals
Fabricated Metals
Chemicals
Paper Manufacturing
Transportation Equipment
Computer Equipment
Machinery
Electrical Equipment
Textile Mills
Rubber Products

12
2021
ECONOMIC REVIEW IN CHEMISTRY
International Trade
Canada exported $37.4 billion worth of chemicals and chemical products to the world in 2019, a decrease of 1.4 per cent compared to 2018. Imports increased by 4.4 per cent to $61.8 billion (Table 7 and Figure 8) driven primarily by Pharmaceutical products. The United States represents the dominant export market and the dominant source of imports. In 2019, 76 per cent of exports, worth $28.4 billion went to the United States and 55 per cent of imports worth $34 billion originated there. The next largest export markets were: China (4 per cent), followed by Italy, Japan, Mexico and Belgium (2 per cent each). The next largest sources of imports were Germany (6 per cent), Switzerland (5 per cent), and followed by China, Belgium and Ireland (2 per cent each).
For industrial chemicals, Canadian exports declined by 8.7 per cent to $18.4 billion in 2019. Imports also declined, falling by 3.4 per cent to $20.8 billion (Table 7 and Figure 9). Both imports and exports of industrial chemicals are dominated by bulk commodities like polyethylene, ethylene glycol and styrene.3 Again the United States is the primary trading partner with 79 per cent of exports worth $14.5 billion and 66 per cent of imports worth $13.6 billion. The next largest export markets were: China $1.2 billion (7 per cent) and Mexico $380 million (2 per cent). The next largest import source partners were: China $1.4 billion (7 per cent) Germany $710 million (3 per cent), Australia $490 million (4 per cent) and Mexico and India (2 per cent).
Table 7: Trade in the Chemistry Industry
3 For further analysis of the trade of specific industrial chemicals see the Industry Profiles section beginning on
page 37 of this report.
Value of Trade, $ Billion 2019 2020 Change 2019-20
All Chemicals Imports Exports
59.8 37.4
61.8 36.0
3.5% -1.4%
Industrial Chemicals Imports Exports
21.3 18.5
20.0 16.5
-2.4% -8.7%

13
2021
ECONOMIC REVIEW IN CHEMISTRY
Figure 8: Trade of All Chemicals in Billions of CAD
Figure 9: Trade of Industrial Chemicals in Billions of CAD
0
10
20
30
40
50
60
70
2011 2012 2013 2014 2015 2016 2017 2018 2019 2020
Bill
ion
s o
f C
anad
ian
$
Exports Imports
0
5
10
15
20
25
2011 2012 2013 2014 2015 2016 2017 2018 2019 2020
Bill
ion
s o
f C
anad
ian
$
Exports Imports

14
2021
ECONOMIC REVIEW IN CHEMISTRY
The chemistry industry was the 3rd largest exporter among all manufacturing industries in 2020 (Figure 10)
Figure 10: Top 10 Manufacturing Industries by Exports in Billions of CAD
Profits
Profits for the chemical sector depend on factors such as capacity utilization, energy and raw material costs, supply-demand balance and competition with foreign producers. Operating profits in 2020 for the chemical industry were $8.7 billion and $3.9 billion for industrial chemicals (Table 8).
Table 8: Operating Profits in the Chemical Industry
Operating profit, $ billion 2019 2020 Change 2019-20
Total chemicals 10.3 8.7 -15.6%
Industrial chemicals 4.6 3.9 -15.8%
Operating profits for industrial chemicals over the past 10 years show that profits suffered during the
great recession, recovered strongly in 2010 and 2011, plateaued and remained strong.
72.7
38.6
36
30.5
28.1
17.9
15.8
13.9
13.8
10.9
Transportation Equipment
Food
Chemicals
Primary Metal
Machinery
Wood Products
Paper
Petroleum and Coal Products
Plastics and Rubber Products
Computers and Electronics

15
2021
ECONOMIC REVIEW IN CHEMISTRY
Figure 11: Operating Profits for Industrial Chemicals, in Millions of CAD
Productivity One measure of manufacturing productivity is the value of revenue per employee. For all chemicals, output per employee in 2020 was $635,000. For industrial chemicals, it rises to $1.50 million. Output per employee is much higher for industrial chemicals reflecting the capital-intensive nature of the industry compared to chemicals overall. Both numbers have remained largely flat over the past decade.
Table 9: Productivity
Output per employee, $ thousand 2019 2020
All chemicals 646 635
Industrial chemicals 1,647 1,503
Price Index The Industrial Product Price Index (IPPI) reflects the prices that producers in Canada receive as the goods leave the plant. Natural gas and crude oil are two important sources of feedstocks for the chemical industry (see Figure 12) and have shown very different price behaviour in recent years. Natural gas prices rose dramatically until 2008 and have trended mostly downward since then. The decline in gas prices has been driven primarily by substantial increases in North American supply coming from shale gas formations. However, heavy maintenance schedules on the Alberta natural gas system created more volatility in pricing than has been normal over the last few years. Crude oil
0
1000
2000
3000
4000
5000
6000
2011 2012 2013 2014 2015 2016 2017 2018 2019 2020

16
2021
ECONOMIC REVIEW IN CHEMISTRY
has been volatile since 2008, showing sharp swings both upward and downward which continued in 2019.
Figure 12: Price Index, 2020=100
Capacity Utilization Capacity utilization refers to the extent to which an industry uses its installed productive capacity (Figure 13). Thus, it compares actual output with the maximum potential output that could be achieved if all capacity was fully used.
Capacity utilization for the overall chemical industry hit an all-time low of 68 per cent in the 1st quarter of 2009. Since then it has trended steadily upward, and averaged 85 per cent in 2018, approximately the same as the averages in 2016 and 2017. 2019 saw a dip in utilization that brought sector performance to a level last seen in 20114/2015. While separate data is not available for industrial chemicals, it would be expected to have utilization rates higher than the industry average since continuous production processes are employed, whereas the segment of the industry producing formulated products relies on batch processes. Figure 13: Capacity Utilization in the Chemical Industry, %
0
50
100
150
200
250
2008 2009 2010 2011 2012 2013 2014 2015 2016 2017 2018 2019 2020
Natural gas Crude Energy All chemicals Basic chemicals Resins and fibres
60
70
80
90
2009 2010 2011 2012 2013 2014 2015 2016 2017 2018 2019 2020

17
2021
ECONOMIC REVIEW IN CHEMISTRY
Other Chemical Manufacturing Subsectors As mentioned previously, the Canadian chemical industry is comprised of seven sub-industries. Figure 14 shows the relative size of these industries by shipment value in 2020. Industrial chemicals accounted for almost half of the total industry.
Figure 14: Distribution by Chemical Sub-Industries Based on Shipments
While NAICS 3251 and 3252 are the focus of this report, the following tables provide some data on the other sub-industries.
Table 10: Principal Statistics for Pesticides, Fertilizers and Other Agricultural Chemicals (NAICS 3253)
Basic Chemicals, 30%
Resins and Fibres, 16%
Ag Chemicals, 9%
Pharma, 21%
Paints and Adhesives, 5%
Soaps and Toiletries, 8%
Other, 11%
Shipments,
$ million Employment Imports,
$ million Exports, $ million
2013 4,783 5,247 3,101 1,951
2014 5,279 5,259 3,358 1,715
2015 5,406 5,271 3,576 2,057
2016 5,413 5,722 3,398 1,891
2017 6,181 5,722 3,991 1,485
2018 5,536 5,914 3,969 1,327
2019 6,099 5,598 4,034 1,393
2020 6,272 4,882 4,013 1,424

18
2021
ECONOMIC REVIEW IN CHEMISTRY
Table 11: Principal Statistics for Pharmaceuticals (NAICS 3254)
Table 12: Principal Statistics for Paints, Coatings and Adhesives (NAICS 3255)
Table 13: Principal Statistics for Soaps, Cleaning Compounds and Toilet Preparations (NAICS 3256)
Shipments,
$ million Employment Imports,
$ million Exports, $ million
2013 8,549 31,325 13,706 6,054
2014 10,055 30,833 15,387 8,301
2015 9,834 30,356 16,852 10,468
2016 11,670 29,917 17,228 11,759
2017 12,068 31,788 17,630 8,890
2018 12,255 31,124 19,502 11,003
2019 12,911 31,310 19,502 11,221
2020 13,796 31,998 22,592 11,662
Shipments,
$ million Employment Imports,
$ million Exports, $ million
2013 2,672 7,788 1,902 528
2014 2,778 8,196 2,055 596
2015 2,619 8,593 2,322 694
2016 3,342 8,216 2,434 763
2017 3,203 7,773 2,373 769
2018 3,122 6,725 2,459 835
2019 3,185 7,141 2,563 864
2020 3,057 6,136 2,442 783
Shipments,
$ million Employment Imports,
$ million Exports, $ million
2013 4,439 11,412 4,934 2,665
2014 4,200 11,503 5,312 2,907
2015 4,433 11,769 6,072 3,334
2016 4,911 13,946 6,400 3,063
2017 4,821 14,018 6,581 3,065
2018 5,149 15,384 6,818 3,439
2019 4,911 14,437 7,025 3,365
2020 4,673 13,113 7,815 3,323

19
2021
ECONOMIC REVIEW IN CHEMISTRY
Table 14: Principal Statistics for Other Chemical Products (NAICS 3259)
Shipments,
$ million Employment Imports,
$ million Exports, $ million
2013 4,698 10,800 4,798 2,055
2014 4,813 10,854 4,889 2,179
2015 4,932 10,905 5,147 2,161
2016 5,622 10,837 5,016 1,983
2017 5,284 10,660 5,410 1,965
2018 5,922 10,587 5,710 2,076
2019 6,140 12,230 5,894 2,147
2020 5,543 11,151 5,467 2,350

20
2021
ECONOMIC REVIEW IN CHEMISTRY
Provincial Statistics Both the overall chemical industry and the industrial chemicals segment are concentrated in the provinces of Ontario, Alberta and Quebec (Figure 15). Further information about these three main provinces is contained in the following portions of the analysis.
Figure 15: Provincial Distribution of the Chemical Industry, by Value of Shipments
Alberta, 24%
Alberta, 40%
Ontario, 45%
Ontario, 39%
Quebec, 19%
Quebec, 16%
Other, 12%Other, 5%
0%
100%
Chemical Shipments Industrial Chemical Shipments

21
2021
ECONOMIC REVIEW IN CHEMISTRY
a. Ontario In 2020, Ontario’s chemical industry had shipments of $25.5 billion a decrease of 6.9 per cent from 2019. Industrial chemical shipments totaled 9.0 billion in 2020 a decrease of 14.2% from 2019 (Figure 16).
Figure 16: Composition of the Ontario Chemical Industry
The largest cluster for the industrial chemical industry is in the Sarnia region, with the next largest concentrations in the Golden Horseshoe and along the St. Lawrence Seaway.
Table 15: Ontario Chemical Industry Shipments
On the basis of shipments, Chemicals was the 3rd largest of all manufacturing industries in the province in 2020 (Figure 17).
Basic chemicals21%
Resins and fibres14%
Ag chem 4%Pharmaceuticals
31%
Paints and adhesives
7%
Soaps toiletries13%
Other chemical products
10%
Shipments, $ billion 2019 2020 Change 2019-20
All chemicals 27.4 25.5 -6.9%
Industrial chemicals 10.5 9.0 -14.2%

22
2021
ECONOMIC REVIEW IN CHEMISTRY
Figure 17: Top 10 Manufacturing Industries in Ontario by Value of Shipments, $ Billion
• Value Added
On the basis of value added, chemicals also ranked 3rd among all manufacturing industries in 2019 (latest data available) (Figure 18).
Figure 18: Top 10 Industries by Value Added in Ontario, $ Billion
79.5
47.2
25.5
19.2
18.6
17.1
15.8
14.4
12.3
10.4
Transportation Equipment
Food
Chemicals
Fabricated Metal Products
Machinery
Primary Metals
Plastic and Rubber Products
Plastic Products
Beverage and Tobacco Products
Petroleum and Coal Products
23.3
15.2
11.3
9.7
9.1
7.0
5.2
4.7
3.7
3.6
Transportation Equipment
Food
Chemicals
Fabricated Metals
Machinery
Plastic and Rubber Products
Primary Metals
Computer and Electronic Products
Non-Metallic Mineral Products
Beverage and Tobacco Products

23
2021
ECONOMIC REVIEW IN CHEMISTRY
• Employment Ranking
The chemical industry directly employed 41,600 people in Ontario in 2020, a decline of 5.3 per cent from 2019. When indirect employment is included, it is estimated that the chemical industry supports almost 208,000 jobs in the province. The number of employees working in industrial chemicals was 6,897 a 6.6 per cent decrease from 2019. The industrial chemical sector supports almost 34,490 jobs in the province. When compared to other manufacturing industries, chemicals ranked 6th on the basis of employment (Figure 19).
Figure 19: Top 10 Manufacturing Industries by Number of Employees in Ontario in Thousands
116.5
86.9
71.7
61.2
50.4
41.6
30.9
28.1
27.5
23.8
Transportation Equipment
Food
Fabricated Metals
Machinery
Plastic and Rubber Products
Chemicals
Furniture
Misc. Manufacturing
Computer and Electronic…

24
2021
ECONOMIC REVIEW IN CHEMISTRY
• Salaries and Wages
The chemical industry paid a total of $3.14 billion in salaries and wages in the province in 2020. With an average annual salary of $67,000, the industry ranked 3rd among all manufacturing industries in Ontario (Figure 20). The average salary within industrial chemicals was much higher at $97,770. The average salary across all manufacturing industries in Ontario was $54,900.
Figure 20: Top 10 Manufacturing Industries by Average Salary in Ontario in $ Thousands
115.3
67.9
67.0
65.6
64.8
64.6
64.2
60.0
59.8
59.0
Petroleum and Coal Products
Non-Metallic Mineral Products
Chemicals
Transportation Equipment
Wood Products
Machinery
Computer and Electronic Products
Fabricated Metal Products
Textile Products
Electrical Equipment
25
2021
ECONOMIC REVIEW IN CHEMISTRY
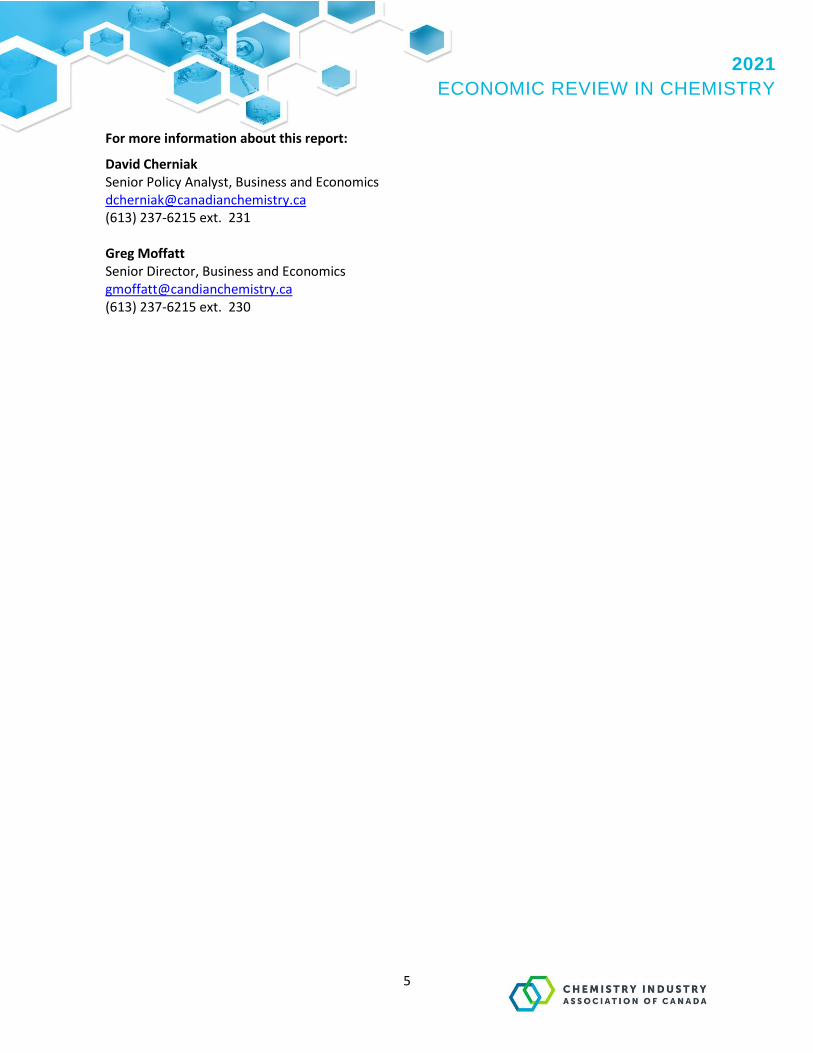
• Trade
The value of exports by the chemical industry from Ontario in 2020 was $18.6 billion, while imports were $43.1 billion (Table 16). The United States was the destination for 75 per cent of exports, followed by Italy (6.9 per cent) Japan (4 per cent) and China (3.2 per cent). The United States was also the source for most of the imports (64 per cent), followed by Switzerland and Germany (8 per cent each).
For industrial chemicals, exports from the province in 2020 were $7.8 billion, while imports were $12.8 billion. The United States was the destination for 73 per cent of exports, followed by Netherlands (8.5 per cent), Germany (6.5 per cent) and China (2.4 per cent). The United States was also the source of most of the imports (78 per cent), followed by China (5.5 per cent).
Table 16: Trade by the Chemical Industry in Ontario
Chemicals is the 2nd largest exporter among all manufacturing industries (Figure 21).
Figure 21: Top 10 Manufacturing Industries by Value of Exports from Ontario, $Billions
56.8
18.6
14.4
12.7
11.5
8.0
5.7
5.5
4.9
3.5
Transportation Equipment
Chemicals
Machinery
Primary Metal Products
Food
Plastic and Rubber Products
Misc. Manufacturing
Computer and Electronic Products
Fabricated Metal Products
Electrical Equipment
Value of trade, $ billion 2019 2020 Change 2019-20
All chemicals Imports Exports
41.8 18.8
43.1 18.6
3.1% -1.0%
Industrial chemicals Imports Exports
12.8 7.7
12.8 7.8
0% 1.3%

26
2021
ECONOMIC REVIEW IN CHEMISTRY
b. Alberta In 2020, Alberta’s chemical industry had shipments of $13.5 billion (Table 17). Seventy per cent of the total was comprised of industrial chemicals, where shipments totaled $9.4 billion (Figure 22).
Figure 22: Composition of the Alberta Chemical Industry
The industrial chemical industry in Alberta is located in the Industrial Heartland region northeast of Edmonton, in central Alberta, near Red Deer, in Medicine Hat, and growing in size and scope near Grande Prairie.
Table 17: Alberta Chemical Industry Shipments
Basic chemicals40%
Resins and fibres29%
Fertilizers16%
Other15%
Shipments, $billion 2019 2020 Change 2019-20
All chemicals 14.5 13.5 -6.9%
Industrial chemicals 10.9 9.4 -15.9%

27
2021
ECONOMIC REVIEW IN CHEMISTRY
Based on value of shipments Chemicals ranked 2nd among all manufacturing industries in the province in 2020 (Figure 23).
Figure 23: Top 5 Manufacturing Industries in Alberta by Value of Shipments, $Billion 4
• Value Added
Based on value added, chemicals ranked 1st among all manufacturing industries (Figure 24) based on 2019 data (latest available).
Figure 24: Top 5 Industries by Value Added in Alberta, $ Billion
4 The top 10 industries cannot be ranked because data for many industries has been suppressed by Statistics
Canada.
15.8
13.5
6.0
5.4
3.2
Food
Chemicals
Machinery
Fabricated Metal Products
Wood Products
6.6
4
2.9
2.7
2.6
Chemicals
Food
Fabricated Metal
Machinery
Wood Products

28
2021
ECONOMIC REVIEW IN CHEMISTRY
• Employment Ranking The chemical industry employed 7,335 people in Alberta in 2020, a decrease of 5.3 per cent compared to 2020. When indirect employment is included, it is estimated that the chemical industry supports about 36,675 jobs in the province. The number of employees working in industrial chemicals in 2020 was 3,379 indirectly supporting over 16,900 jobs in the province. When compared to other manufacturing industries in the province, chemicals ranked 5th (Figure 25). Figure 25: Top 5 Manufacturing Industries by Employment in Alberta
• Salaries and Wages
The chemical industry paid a total of $795 million in salaries and wages in the province in 2020. The average salary paid to employees in the chemical industry was $108,500, which ranked 1st among all manufacturing industries (Figure 26). The average salary within industrial chemicals was $131,270.
Figure 26: Top 5 Manufacturing Industries by Average Salary in Alberta, $ Thousands
22.6
20.8
17.3
9.0
7.3
5.7
Food
Fabricated Metal Products
Machinery
Wood Products
Chemicals
Plastics and Rubber Products
108.5
98.7
80.9
80.5
78.7
75.6
Chemicals
Paper Manufacturing
Non-Metallic Minerals
Machinery
Wood Products
Fabricated Metals

29
2021
ECONOMIC REVIEW IN CHEMISTRY
• Trade
The value of exports by the chemical industry from Alberta in 2020 was $7.1 billion, while imports were $2.9 billion (Table 18). The United States was the destination for 81 per cent of exports, followed by China (12 per cent) and Mexico and Singapore (2 per cent each). The United States was also the source of most imports (81 per cent), followed by China (7 per cent), and Germany (2 per cent).
For industrial chemicals, exports from the province in 2020 were $6.9 billion, while imports were $1.5 billion. The United States was the destination for 79 per cent of exports, followed by China (13 per cent) and Mexico (2 per cent). The United States was the source of most imports (80 per cent), followed by China (9 per cent), and Italy (2 per cent).
Table 18: Trade by the Chemical Industry in Alberta
Chemicals ranks 1st among manufacturing industries in terms of exports from Alberta (Figure 27). Considering all commodities, chemicals ranked 3rd behind only crude oil and natural gas.
Figure 27: Top 10 Manufacturing Industries by Value of Exports from Alberta, $ Billion
7.1
6.3
3.5
2.3
2.3
1.6
1.3
0.8
0.6
0.6
Chemicals
Food
Petroleum and Coal Products
Wood Products
Machinery
Paper
Primary Metal
Fabricated Metal Products
Transportation Equipment
Computers and Electronic Products
Value of trade, $ billion 2019 2020 Change 2019-20
All chemicals Imports Exports
2.9 7.9
2.6 7.1
-4.3% -13.2%
Industrial chemicals Imports Exports
1.7 6.9
1.3 6.1
-11.8% -15.9%

30
2021
ECONOMIC REVIEW IN CHEMISTRY
c. Quebec In 2020, Quebec’s chemical industry had shipments of $10.5 billion. 45 per cent is comprised of industrial chemicals (Figure 28).
Figure 28: Composition of the Quebec Chemical Industry
In 2020, shipments of industrial chemicals were $3.7 billion (Table 19). The industrial chemical industry in Quebec is concentrated in the eastern end of Montreal and along the south shore of the St. Lawrence River.
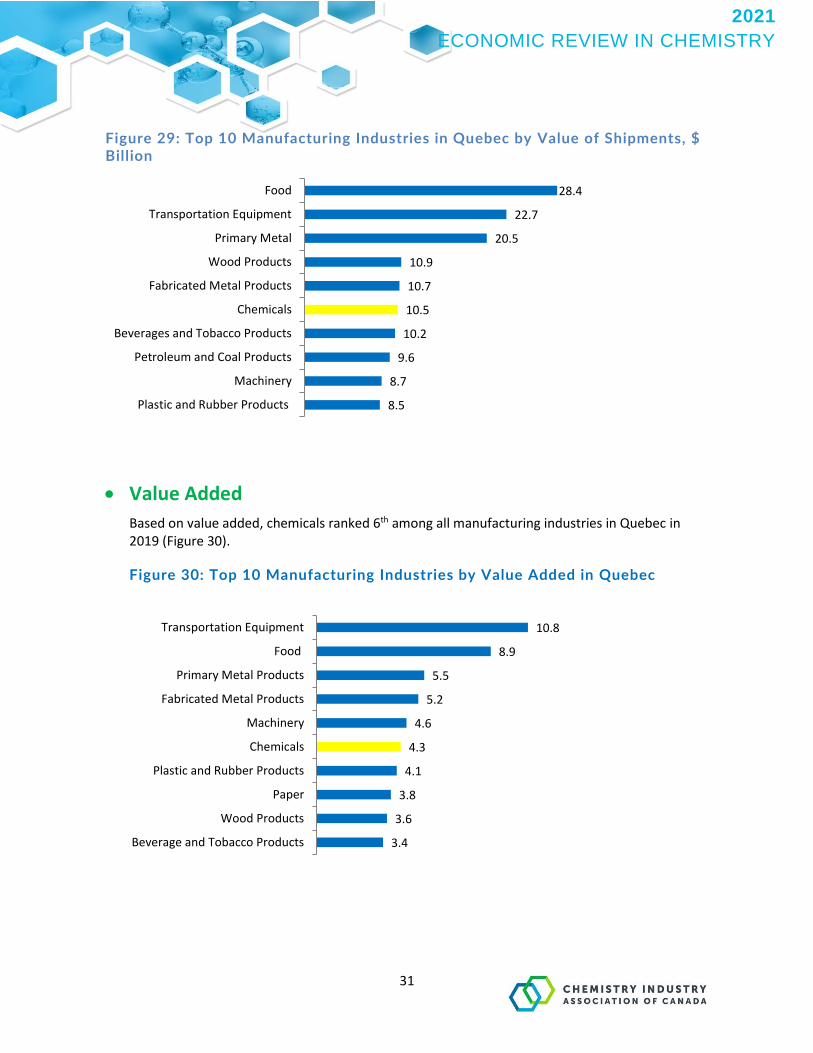
Table 19: Quebec Chemical Industry Shipments Based on shipments Chemicals was the 6th largest manufacturing industry (Figure 29).
Basic chemicals26%
Resins and fibres9%
Ag chem 4%
Pharmaceuticals32%
Paints and adhesives
8%
Soaps and toiletries
10%
Other chemical products
11%
Shipments, $billion 2018 2019 Change 2018-19
All chemicals 11.3 10.5 -6.9%
Industrial chemicals 4.3 3.7 -13.8%
31
2021
ECONOMIC REVIEW IN CHEMISTRY
Figure 29: Top 10 Manufacturing Industries in Quebec by Value of Shipments, $ Billion
• Value Added
Based on value added, chemicals ranked 6th among all manufacturing industries in Quebec in 2019 (Figure 30).
Figure 30: Top 10 Manufacturing Industries by Value Added in Quebec
28.4
22.7
20.5
10.9
10.7
10.5
10.2
9.6
8.7
8.5
Food
Transportation Equipment
Primary Metal
Wood Products
Fabricated Metal Products
Chemicals
Beverages and Tobacco Products
Petroleum and Coal Products
Machinery
Plastic and Rubber Products
10.8
8.9
5.5
5.2
4.6
4.3
4.1
3.8
3.6
3.4
Transportation Equipment
Food
Primary Metal Products
Fabricated Metal Products
Machinery
Chemicals
Plastic and Rubber Products
Paper
Wood Products
Beverage and Tobacco Products

32
2021
ECONOMIC REVIEW IN CHEMISTRY
• Employment Ranking
The chemical industry employed 20,700 people in Quebec in 2020. When indirect employment is included, it is estimated that the chemical industry supports 103,500 additional jobs in the province. The industrial chemical industry employs 3,340 and supports an additional 16,700 jobs in the province. When compared to all manufacturing industries in the province, chemicals ranked 7th (Figure 31).
Figure 31: Top 10 Manufacturing Industries by Employment in Quebec
• Salaries and Wages
The chemical industry paid a total of $1.5 billion in salaries and wages in the province in 2020, corresponding to an average annual salary of $74,900, which placed the industry 4th in Quebec (Figure 32). For all manufacturing, the average salary in the province was $54,750.
Figure 32: Top 10 Industries by Average Salary in Quebec, $ Thousands
63.8
47.6
43.3
35.3
31.8
26.7
24.7
20.7
16.9
15.6
Food
Transportation Equipment
Fabricated Metal Products
Machinery
Plastic and Rubber Products
Wood Products
Furniture
Chemicals
Primary Metals
Computers and Electronics
98.4
79.0
74.9
74.0
71.5
71.3
66.5
62.7
58.1
57.9
Primary Metals
Transportation Equipment
Chemicals
Computers and Electronics
Paper Manufacturing
Electrical Equipment
Machinery
Fabricated Metal Products
Misc. Manufacturing
Printing
33
2021
ECONOMIC REVIEW IN CHEMISTRY
• Trade
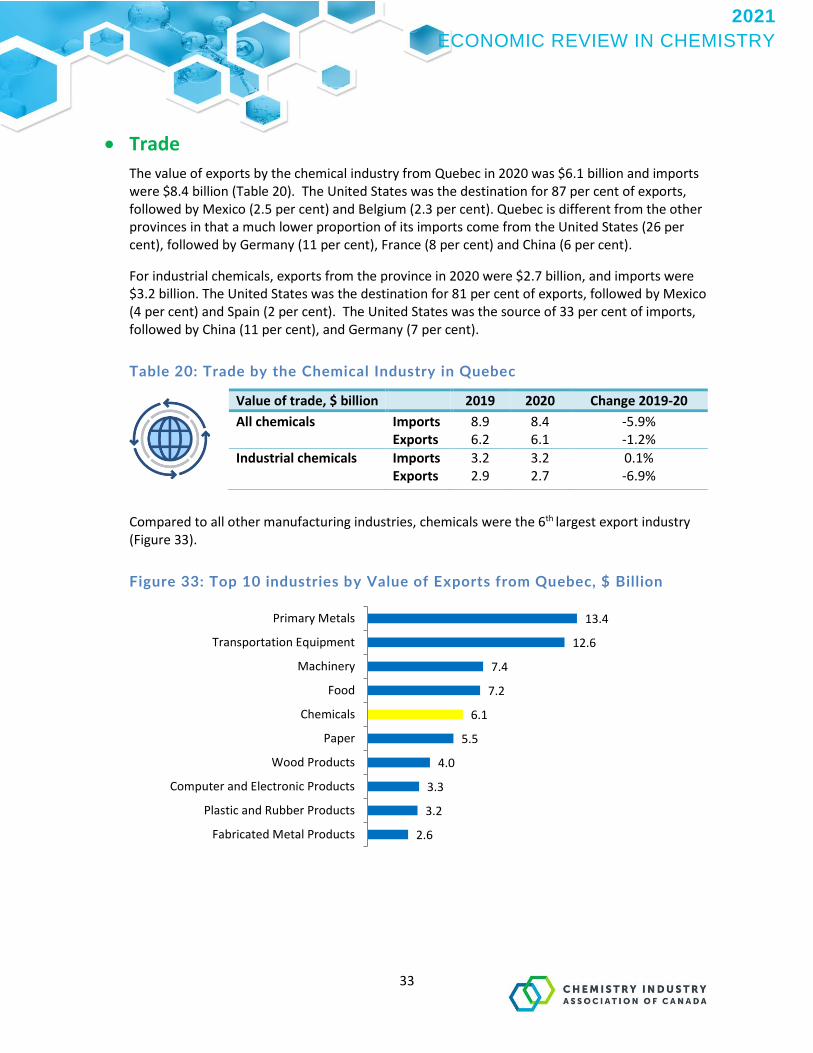
The value of exports by the chemical industry from Quebec in 2020 was $6.1 billion and imports were $8.4 billion (Table 20). The United States was the destination for 87 per cent of exports, followed by Mexico (2.5 per cent) and Belgium (2.3 per cent). Quebec is different from the other provinces in that a much lower proportion of its imports come from the United States (26 per cent), followed by Germany (11 per cent), France (8 per cent) and China (6 per cent).
For industrial chemicals, exports from the province in 2020 were $2.7 billion, and imports were $3.2 billion. The United States was the destination for 81 per cent of exports, followed by Mexico (4 per cent) and Spain (2 per cent). The United States was the source of 33 per cent of imports, followed by China (11 per cent), and Germany (7 per cent).
Table 20: Trade by the Chemical Industry in Quebec
Compared to all other manufacturing industries, chemicals were the 6th largest export industry (Figure 33).
Figure 33: Top 10 industries by Value of Exports from Quebec, $ Billion
13.4
12.6
7.4
7.2
6.1
5.5
4.0
3.3
3.2
2.6
Primary Metals
Transportation Equipment
Machinery
Food
Chemicals
Paper
Wood Products
Computer and Electronic Products
Plastic and Rubber Products
Fabricated Metal Products
Value of trade, $ billion 2019 2020 Change 2019-20
All chemicals Imports Exports
8.9 6.2
8.4 6.1
-5.9% -1.2%
Industrial chemicals Imports Exports
3.2 2.9
3.2 2.7
0.1% -6.9%

34
2021
ECONOMIC REVIEW IN CHEMISTRY
Industry Profiles The segments of the chemical industry of primary interest to CIAC members are profiled according to the following categories:
• Petrochemicals and other organic chemicals
• Inorganic chemicals
• Synthetic resins, rubbers and fibres
• Specialty chemicals
a. Petrochemicals and Other Organic Chemicals Statistics Canada reports data on organic chemicals in two industry groups:
• NAICS 32511 – Petrochemicals
• NAICS 32519 – Other organic chemicals.
The petrochemicals industry only includes hydrocarbons. The main petrochemicals produced by CIAC members in Canada are ethylene, propylene, butylenes, butadiene, higher olefins, alkanes, benzene, toluene, xylenes, and styrene. Ethylene is the largest-volume petrochemical; it is always consumed very close to the point of production so almost none is traded.
Organic chemicals that contain atoms other than hydrogen and carbon are captured in the other organic chemicals industry. CIAC members are producers of all of the largest-volume chemicals in this category in Canada: methanol, isopropyl alcohol, and ethylene glycol.
Table 21: Principal Statistics for Petrochemicals and Other Organic Chemicals
2016 2017 2018 2019 2020
Establishments Petrochemicals Other organic chemicals
28
133
27
150
16 92
29
145
29
134
Shipments $M Petrochemicals Other organic chemicals
5,597 3,402
6,747 4,820
7,008 6,181
5,945 5,601
5,138 4,716
Employment Petrochemicals Other organic chemicals
1,859 2,367
2,205 3,543
1,963 3,555
1,835 3,263
1,730 3,046
Exports $M Petrochemicals Other organic chemicals
1,556 3,924
1,880 4,138
2,488 4,390
2,061 4,041
1,641 4,219
Imports $M Petrochemicals Other organic chemicals
894
6,022
966
6,292
1,067 6,609
817
6,476
610
6,462

35
2021
ECONOMIC REVIEW IN CHEMISTRY
• Commodity Data
Statistics Canada reports production data for a limited number of organic chemicals (Table 22).
Table 22: Canadian Production of Specific Organic Chemicals, Kilotonnes
2015 2016 2017 2018 2019
Benzene 585 597 807 826 698
Toluene 174 128 477 397 356
Xylenes 350 307 646 583 487
Butadiene 237 215 235 235 227
Propylene 532 515 562 535 542
Formaldehyde 138 149 154 151 138
More data exists for imports and exports than for domestic production. Table 23 shows the exports for a select range of organic chemicals, in both tonnage and dollar value terms.
Table 23: Canadian Exports of Select Organic Chemicals, Kilotonnes
Value, $M Quantity, kt Top Markets
Benzene 37 47 USA 66% Belgium 33%
Butadiene 88 107 USA 99%
Ethylene glycol 1,576 856 China 64% USA 24% Singapore 2%
Higher olefins 200 197 USA 97% China 1%
Isopropyl alcohol 78 81 USA 99%
Methanol 96 253 USA 99%
Propylene 182 148 USA 99%
Styrene 522 565 USA 100%
Table 24: Canadian Imports of Select Organic Chemicals, Kilotonnes
Value, $M Quantity, kt Top Markets
Benzene 29.7 3 USA 90% China 7% Japan 4%
Butadiene 3.5 2.3 South Korea 54% USA 44%
Ethylene glycol 8.9 9.4 USA 98%
Higher olefins 112 76 USA 87% South Africa 10%

36
2021
ECONOMIC REVIEW IN CHEMISTRY
Saudi Arabia 7%
Isopropyl alcohol 81 53 USA 68% China 7%
Methanol 107 373 Trinidad and Tobago 75% USA 15%
Propylene 4.1 6.1 USA 97%
Styrene 1.8 1.4 USA 99%
• CIAC Members Producing Petrochemicals and Organic Chemicals in Canada
› ARLANXEO Canada Inc. › BASF Canada › Canada-Kuwait Petrochemical
Corporation5 › Dow Chemical Canada ULC › Evonik Oil Additives Canada Inc. › H.L. Blachford Ltd. › Imperial Oil › INEOS Canada Partnership › Inter-Pipeline Ltd.6
› Lanxess Canada Co./Cie › Jungbunzlauer Canada Inc. › MEGlobal Canada ULC › Methanex Corporation › Nouryon › NOVA Chemicals Corporation › SEQENS › Shell Chemicals Canada Ltd. › Stepan Canada Inc. › W.R. Grace Canada Corp
b. Industrial Gases Statistics Canada reports data on Industrial gases as part of basic chemicals within NAICS 32512.
Under this category there is a single sub-category – Industrial Gas Manufacturing
Industrial Gas manufacturers produce organic and inorganic gases in compressed - liquid and solid
forms. Some of the most used industrial gases include: acetylene, carbon dioxide, helium, hydrogen,
nitrogen, dry ice and oxygen. Manufacturing processes also include industrial gas separation and air
separation configurations.
Often Industrial Gas manufacturers will co-locate on larger manufacturing sites utilize feedstock
streams produced as co-products from the larger facility. However, this is not a hard rule, with
diverse customer markets and a relatively small physical footprint industrial gas manufacturers can
also locate closer to demand in light industrial areas.
5 Currently pre-production facility is under construction 6 Currently pre-production facility is under construction

37
2021
ECONOMIC REVIEW IN CHEMISTRY
Table 25: Principal Statistics for Industrial Gases 2016 2017 2018 2019 2020
Establishments * * 145 145 101
Shipments $M 1,060 1,053 1,196 1,311 1,337
Employment 1,683 1,059 1,173 1,049 979
Exports $M7 157 136 130 113 116
Imports $M 191 192 217 186 172
• CIAC Members Producing Industrial Gases
• Praxair Canada Inc.
c. Inorganic Chemicals Statistics Canada reports data on inorganic chemicals as part of basic chemicals within NAICS 32518. Under this category there are two sub-industry classifications:
• NAICS 325811 – Alkali and chlorine
• NAICS 325819 – Other inorganic chemicals.
Since 2010, shipment and employment data have been suppressed at the 6-digit NAICS level and only reported at the 5-digit level.
The main inorganic chemicals produced by CIAC members in Canada are: chlorine, sodium hydroxide, hydrochloric acid, hydrogen peroxide, sodium chlorate, sodium silicates, sulphuric acid, and titanium dioxide.
Table 26: Principal Statistics for Inorganic Chemicals 2016 2017 2018 2019 2020
Establishments Chlor-alkali Other inorganic chemicals
7
132
7
128
5
104
5
104
5
104
Shipments $M 4,303 4,585 4,581 4,310 4,649
Employment 5,042 4,588 3,693 3,420 3,476
Exports $M8 Chlor-alkali Other inorganic chemicals
66
3,704
64
3,512
69
3,724
77
3,703
78
2,704
Imports $M Chlor-alkali Other inorganic chemicals
403
1,971
435
1,846
522
2,186
456
2,847
457
3,334
7 Exports and Imports sometimes exceed shipments due to different databases used to collect the two sets of data. 8 Exports and Imports sometimes exceed shipments due to different databases used to collect the two sets of data.

38
2021
ECONOMIC REVIEW IN CHEMISTRY
• Commodity Data
Statistics Canada reports production data for a limited number of inorganic chemicals (Table 25).
Table 27: Canadian Production of Specific Inorganic Chemicals, Kilotonnes
2015 2016 2017 2018 2019
Carbon black 219 215 241 243 226
Chlorine 442 411 894 269 581
Hydrogen peroxide 247 221 239 243 237
Sodium hydroxide* 487 453 453 445 450
*estimated
More data exists for imports and exports than for domestic production.
Table 28: Canadian Exports of Select Inorganic Chemicals, Kilotonnes
Value, $M Quantity, kt Top markets
Carbon black 297 159 USA 79% China 3% Belgium 3%
Chlorine 49 170 USA 100%
Hydrochloric Acid 25 210 USA 99%
Hydrogen Peroxide 81 37 USA 99%
Sodium Chlorate
297 425 USA 84% Japan 9%
Sodium Hydroxide 28 44 USA 99%
Sodium Silicate 23 25 USA 99%
Sulphuric Acid 206 1,003 USA 99%
Titanium Dioxide
27
6.8
Germany 67% India 10% Brazil 8% USA 6%
Table 29: Canadian Imports of Select Inorganic Chemicals
Value, $M Quantity, kt Top Markets
Carbon black 75 51 USA 83% Russia 12%
Chlorine 4.8 13 USA 98%
Hydrochloric Acid 6.5 30 USA 99%
Hydrogen Peroxide 21 15 USA 92% Switzerland 5%

39
2021
ECONOMIC REVIEW IN CHEMISTRY
Sodium Chlorate 1.2 2.0 USA 61% U.K. 32%
Sodium Hydroxide 9.4 160 USA 75% Taiwan 12% China 11%
Sodium Silicates 9.4 16.6 USA 89% Netherlands 4% China 4%
Sulphuric Acid 16.3 88 USA 99%
Titanium Dioxide
18.1
5.8
China 67% France 15% USA 7% Germany 3%
• CIAC Members Producing Inorganic Chemicals in Canada
› Arkema Canada Inc.
› CCC Sulphur Products
› Chemtrade
› ERCO Worldwide
› Evonik Canada Inc.
› KRONOS Canada Inc.
› National Silicates Limited
› Cabot Canada Ltd.
› NorFalco Sales Inc., GLENCORE
Canada Corporation
› Nouryon
› Olin Canada ULC
› Praxair Canada Inc.
› Solvay Canada Inc.
› W.R. Grace Canada Corp
› United Initiators Canada Ltd

40
2021
ECONOMIC REVIEW IN CHEMISTRY
c. Synthetic Resins, Rubbers and Fibres There are two industry sub-groups within this classification:
• NAICS 32521 – Synthetic resins and rubbers
• NAICS 32522 – Synthetic fibres.
Since 2013, shipment and employment data have been suppressed at the 5-digit NAICS level and only reported at the 4-digit level.
The main synthetic resins and rubbers produced in Canada are polyethylene, ethylene vinyl acetate, polystyrene, PVC, polyacrylamides, PET, nylons, urea and phenol formaldehydes, latex emulsions, unsaturated polyesters, silicones, and butyl and halobutyl rubbers. Synthetic fibres are produced in Canada using a variety of domestically-produced and imported resins.
Table 30: Principal Statistics for Synthetic Resins Rubbers and Fibres 2016 2017 2018 2019 2020
Establishments Synthetic resins and rubbers Synthetic fibres
117 25
119 28
91 17
112 32
108 30
Shipments $M 9,710 9,161 10,571 9,597 8,333
Employment, 000 4,920 4,484 5,215 5,373 5,193
Exports $M Synthetic resins and rubbers Synthetic fibres
7,849 347
7,626 291
8,514 273
7,712 283
7,023 233
Imports $M Synthetic resins and rubbers Synthetic fibres
8,033 583
8,734 601
9,249 597
8,620 528
7,735 430

41
2021
ECONOMIC REVIEW IN CHEMISTRY
• Commodity Data
Within these industries, Statistics Canada reports production data only for polyethylene (Table 28).
Table 31: Canadian Production of Synthetic Resins, Kilotonnes
2015 2016 2017 2018 2019
Polyethylene 3,854 3,854 3,599 3,979 3,871
Table 32: Canadian Exports of Select Synthetic Resins and Rubbers
Value, $M Quantity, kt Top Markets
Butyl and halobutyl rubbers 174 47 China 39% USA 37% Mexico 7% South Korea 2%
Polyethylene 4,574 3,537 USA 86% Mexico 4%
Table 33: Canadian Imports of Select Synthetic Resins and Rubbers Value, $M Quantity, kt Top Markets
Butyl and Halobutyl Rubbers
11.2 3.5 Belgium 48% USA 21% China 10%
Polyethylene 1,541 927 USA 96%
• CIAC Members Producing Synthetic Resins, Rubbers and Fibres in Canada
› ARLANXEO Canada Inc.
› BASF Canada
› Dow Chemical Canada ULC
› DuPont Canada Company
› Imperial Oil
› NOVA Chemicals Corporation

42
2021
ECONOMIC REVIEW IN CHEMISTRY
d. Specialty Chemicals This profile is different from the others in the series. There is no Statistics Canada aggregation that provides data for an industry called specialty chemicals. Therefore, a number of assumptions have been made to derive an approximation for the size of this industry grouping.
Examples of the types of specialty chemicals produced by CIAC members include: fatty acids, maleic anhydride, plasticizers, citric acid, photochemicals, and additives for lubricants, plastics and rubber.
• Assumption #1: Specialty chemicals are a subset of NAICS 32519 – Other organic chemicals. Very little, if any, specialty chemicals fall within the petrochemical industry as it is comprised primarily of commodity products. For this analysis it is assumed that inorganic chemicals and synthetic resins and rubbers can also be excluded.
• Assumption #2: The ratio of specialty chemical to commodity chemical exports can be used to estimate the value of shipments and employment attributable to specialty chemicals. This assumption allows the use of relatively-detailed trade data to gain a measure of the level of specialty chemical production in Canada. However, deciding which products are commodity versus which are specialty remains subjective.
There are about 15 facilities in Canada producing ethanol that are captured within the other organic chemical industry. Since ethanol is primarily used for fuel, these facilities are not considered part of specialty chemicals.
Estimated statistics for the total other organic chemicals industry and the specialty component are shown in Table 30. The data for the other organic chemicals industry includes both commodity and specialty chemicals, and is repeated from the Petrochemicals profile. It is presented again to provide an indication of the relative size of the commodity versus specialty element of the industry.
Table 34: Estimated Principal Statistics for Specialty Chemicals 2016 2017 2018 2019 2020
Establishments Other organic chemicals Specialty chemicals
133 115
150 130
92 72
145 113
145 113
Shipments $M Other organic chemicals Specialty chemicals
3,262 1,370
3,780 1,620
6,328 2,660
6,328 2,660
6,328 2,660
Employment, 000 Other organic chemicals Specialty chemicals
2,367 994
3,543 1,760
3,537 1,880
3,640 1,880
3,640 1,880
Exports $M Other organic chemicals Specialty chemicals
3,924 1,650
4,138 1,740
4,399 1,850
3,865 1,620
3,865 1,620
Imports $M Other organic chemicals Specialty chemicals
6,021 2,530
6,290 2,640
6,603 2,770
6,473 2,720
6,473 2,720

43
2021
ECONOMIC REVIEW IN CHEMISTRY
• Commodity Data
Table 34 shows the exports for a select range of specialty chemicals, in both tonnage and dollar value terms in 2014.
Table 35: Canadian Exports of Select Specialty Chemicals, Tonnes
Value, $M Quantity, kt Top Markets
Palmitates and stearates 3.6 1.57 USA 83% Hong Kong 4% China 3%
Dinonyl or didecyl orthophthalates 0.79 0.31 USA 99%
Azo compounds 2.1 0.03 USA 83% Japan 10%
Cyanine dyes 41.9 1.09 USA 100%
Azo dyes 2.7 0.11 USA 92% Spain 2% China 2%
Other fatty acids 4.7 8.93 USA 61% China 22% Germany 13%
Table 36: Canadian Imports of Select Specialty Chemicals. Kilotonnes
Value, $M Quantity, kt Top Markets
Palmitates and stearates 17.9 7.7 USA 42% Malaysia 42% India 4% Indonesia 2%
Dinonyl or didecyl orthophthalates 11.9 6.99 Germany 37% Sweden 32% USA 25%
Azo compounds 8.42 0.33 Mexico 89% USA 4% Japan 3%
Cyanine dyes 102.2 7.81 USA 50% China 19% Germany 12% India 9%
Azo dyes 36 2.62 USA 39% India 29% France 14%
Other fatty acids 43 33.9 Malaysia 66% USA 21% India 9%

44
2021
ECONOMIC REVIEW IN CHEMISTRY
• CIAC Members Producing Specialty Chemicals in Canada
› BASF Canada
› Evonik Oil Additives Canada Inc.
› H.L. Blachford Ltd.
› Imperial Oil
› Jungbunzlauer Canada Inc.
› Lanxess Canada Co./Cie
› Nouryon
› Procter and Gamble, Inc.
› SEQENS
› Stepan Canada Inc.
› W.R. Grace Canada Corp
2021
ECONOMIC REVIEW IN CHEMISTRY
1240 - 45 O’Connor Street, Ottawa, ON K1P 1A4 | 613-237-6215
canadianchemistry.ca | @ChemistryCanada [email protected]