Embed Size (px)
Citation preview

Reality in the commodity markets: Opportunity for good governance reforms?
Daniel Kaufmann, President & CEO
Natural Resource Governance Institute (NRGI)www.resourcegovernance.org
Keynote speech at the Mongolia Economic Forum Ulaanbaatar, Mongolia, 31 March 2016

The Governance Challenge: Outline in brief
• Economics: crucial, but not alone: integrating into
governance – political, economic & institutional
• What is Governance; how measured; does it
matter?
• Evidence from the world & Mongolia: Mixed
performance specific strengths & vulnerabilities
• Governance in Extractives: a framework for
assessment & main challenges & findings
• Lessons from global evidence & experience and
some implications for Mongolia: Governance
Reform Opportunity Now2

3
WGI: Six Dimensions of Governance
• The process by which those in authority are selected and replaced – VOICE AND ACCOUNTABILITY – POLITICAL STABILITY & ABSENCE OF
VIOLENCE/TERRORISM• The capacity of government to formulate and implement
policies– GOVERNMENT EFFECTIVENESS– REGULATORY QUALITY
• The respect of citizens and state for institutions that govern interactions among them – RULE OF LAW – CONTROL OF CORRUPTION
Governance as the set of traditions and institutions by which authority in a country is exercised-- specifically:
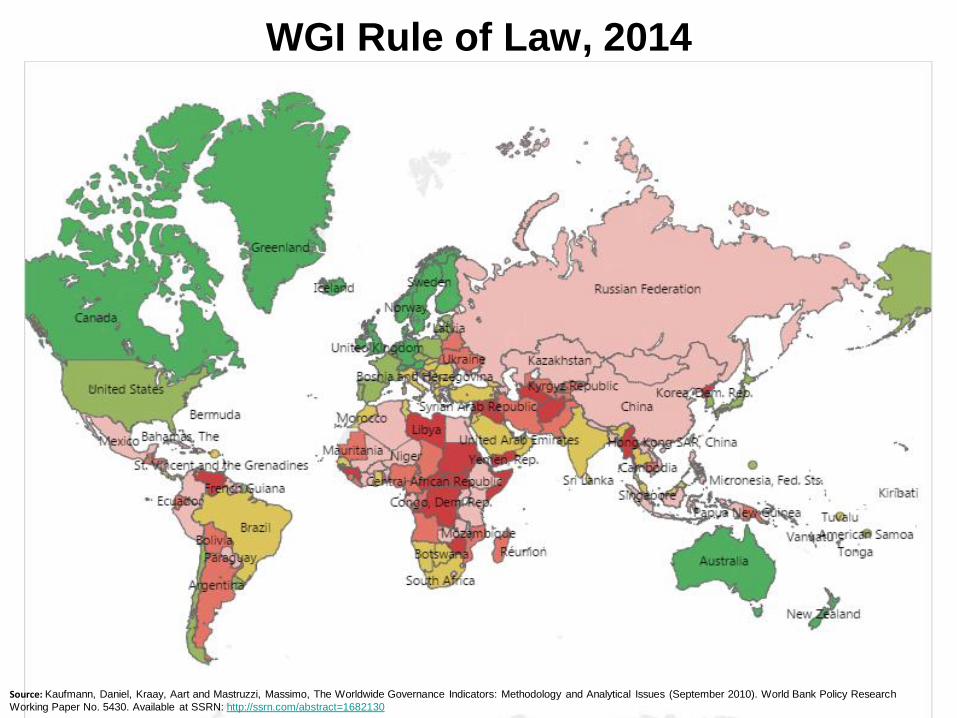
WGI Rule of Law, 2014
4Source: Kaufmann, Daniel, Kraay, Aart and Mastruzzi, Massimo, The Worldwide Governance Indicators: Methodology and Analytical Issues (September 2010). World Bank Policy Research
Working Paper No. 5430. Available at SSRN: http://ssrn.com/abstract=1682130

WGI Control of Corruption: the Americas, 2014
5Source: Kaufmann, Daniel, Kraay, Aart and Mastruzzi, Massimo, The Worldwide Governance Indicators: Methodology and Analytical Issues (September 2010). World Bank Policy Research
Working Paper No. 5430. Available at SSRN: http://ssrn.com/abstract=1682130
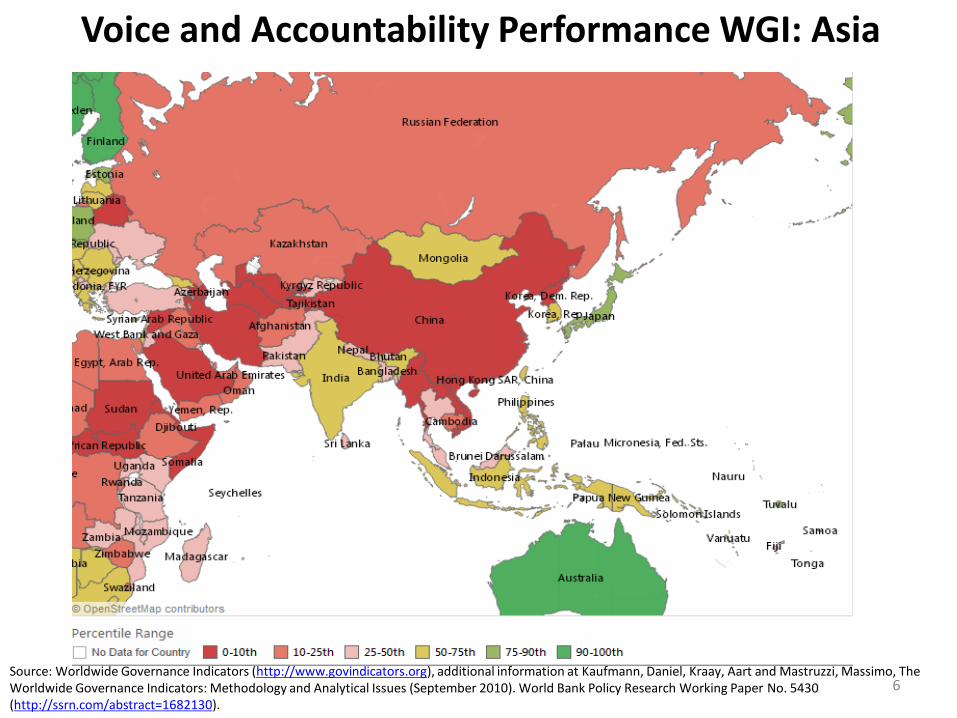
Voice and Accountability Performance WGI: Asia
Source: Worldwide Governance Indicators (http://www.govindicators.org), additional information at Kaufmann, Daniel, Kraay, Aart and Mastruzzi, Massimo, The Worldwide Governance Indicators: Methodology and Analytical Issues (September 2010). World Bank Policy Research Working Paper No. 5430 (http://ssrn.com/abstract=1682130).
6

Political Stability & Absence of Violence Indicator: Asia
Source: Worldwide Governance Indicators (http://www.govindicators.org), additional information at Kaufmann, Daniel, Kraay, Aart and Mastruzzi, Massimo, The Worldwide Governance Indicators: Methodology and Analytical Issues (September 2010). World Bank Policy Research Working Paper No. 5430 (http://ssrn.com/abstract=1682130).
7

Government Effectiveness Indicator WGI: Asia
Source: Worldwide Governance Indicators (http://www.govindicators.org), additional information at Kaufmann, Daniel, Kraay, Aart and Mastruzzi, Massimo, The Worldwide Governance Indicators: Methodology and Analytical Issues (September 2010). World Bank Policy Research Working Paper No. 5430 (http://ssrn.com/abstract=1682130).
8

Control of Corruption WGI: Asia 2014
Source: Worldwide Governance Indicators (http://www.govindicators.org), additional information at Kaufmann, Daniel, Kraay, Aart and Mastruzzi, Massimo, The Worldwide Governance Indicators: Methodology and Analytical Issues (September 2010). World Bank Policy Research Working Paper No. 5430 (http://ssrn.com/abstract=1682130).
9

Mongolia Governance Indicators: WGI 2000, 2007, 2014
Source: Worldwide Governance Indicators (http://www.govindicators.org), additional information at Kaufmann, Daniel, Kraay, Aart and Mastruzzi, Massimo, The Worldwide Governance Indicators: Methodology and Analytical Issues (September 2010). World Bank Policy Research Working Paper No. 5430 (http://ssrn.com/abstract=1682130).
10
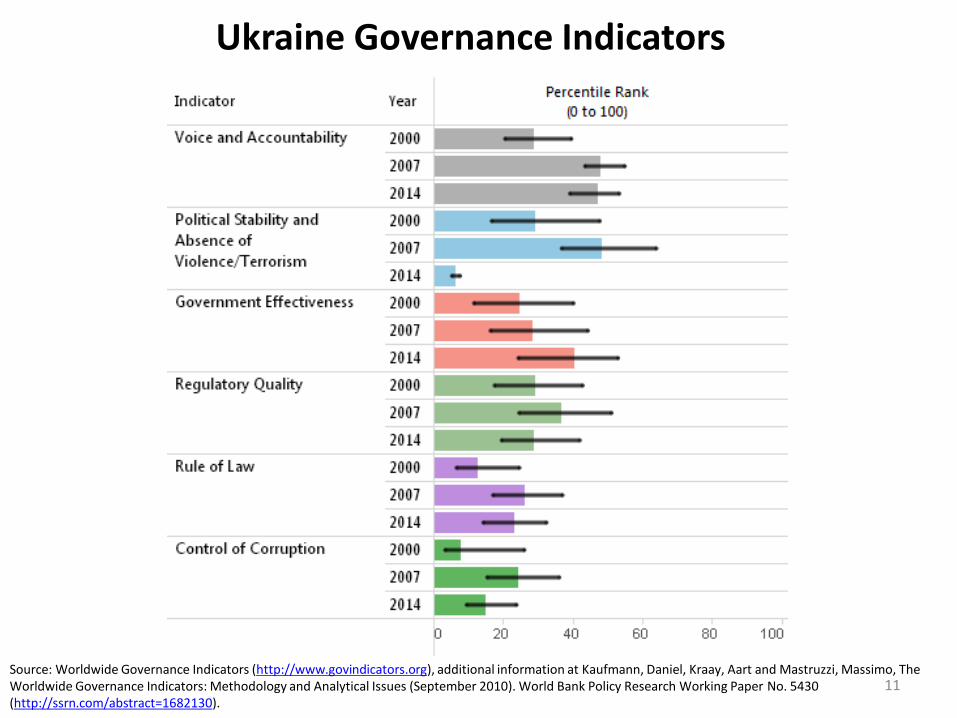
Ukraine Governance Indicators
Source: Worldwide Governance Indicators (http://www.govindicators.org), additional information at Kaufmann, Daniel, Kraay, Aart and Mastruzzi, Massimo, The Worldwide Governance Indicators: Methodology and Analytical Issues (September 2010). World Bank Policy Research Working Paper No. 5430 (http://ssrn.com/abstract=1682130).
11
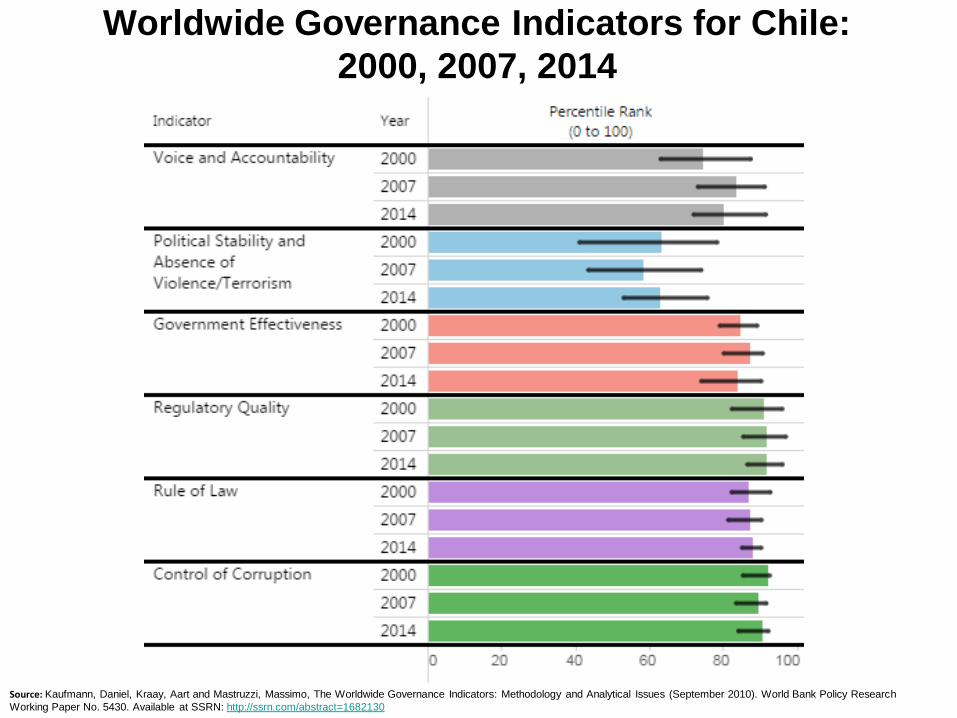
Worldwide Governance Indicators for Chile:
2000, 2007, 2014
Source: Kaufmann, Daniel, Kraay, Aart and Mastruzzi, Massimo, The Worldwide Governance Indicators: Methodology and Analytical Issues (September 2010). World Bank Policy Research
Working Paper No. 5430. Available at SSRN: http://ssrn.com/abstract=1682130

-30%
-20%
-10%
0%
10%
20%
30%
40%
199
7
199
9
200
1
200
3
200
5
200
7
200
9
201
1
201
3
201
5
Chile
Government revenue growth(Chilean Peso)
Government expenditure growth(Chilean Peso)
Managing Volatile Revenues
-40%
-20%
0%
20%
40%
60%
80%
100%
199
7
199
9
200
1
200
3
200
5
200
7
200
9
201
1
201
3
201
5
Venezuela
Government revenue growth(Venezuelan Bolívar)
Government expenditure growth(Venezuelan Bolívar)
Source: IMF World Economic Outlook Database
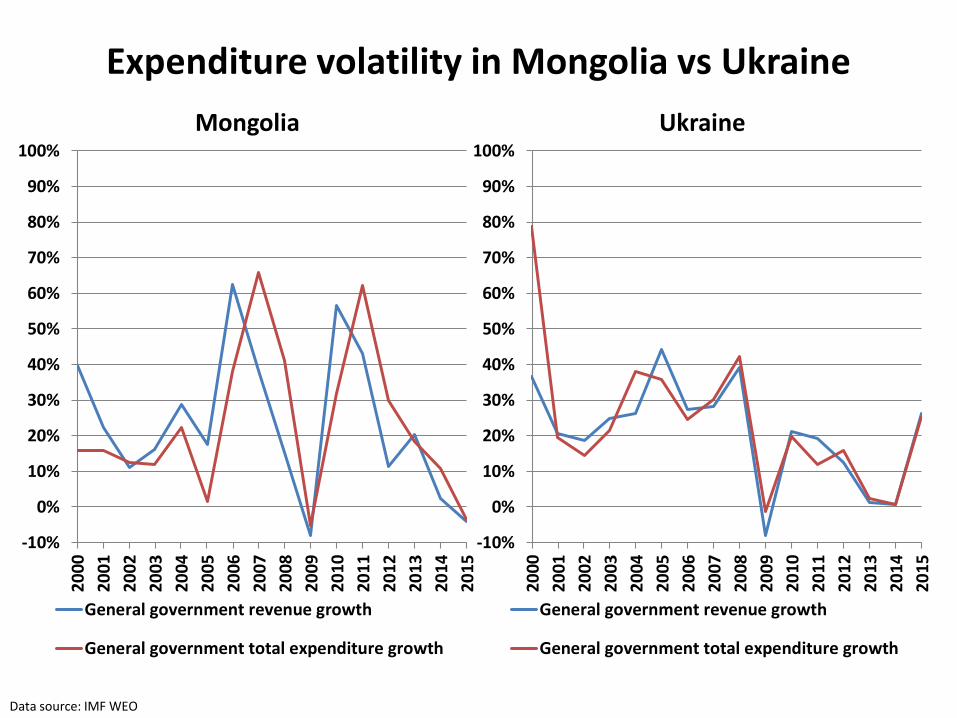
Expenditure volatility in Mongolia vs Ukraine
Data source: IMF WEO
-10%
0%
10%
20%
30%
40%
50%
60%
70%
80%
90%
100%
2000
2001
2002
2003
2004
2005
2006
2007
2008
2009
2010
2011
2012
2013
2014
2015
Mongolia
General government revenue growth
General government total expenditure growth
-10%
0%
10%
20%
30%
40%
50%
60%
70%
80%
90%
100%
2000
2001
2002
2003
2004
2005
2006
2007
2008
2009
2010
2011
2012
2013
2014
2015
Ukraine
General government revenue growth
General government total expenditure growth

Mongolia’s Borrowing and Saving: Fiscal Balance

Mongolia’s Borrowing and Saving: Debt Accumulation

Makeup of Mongolia’s 2014 Exports
Source: The Atlas of Economic Complexity (http://atlas.cid.harvard.edu/explore/tree_map/export/mng/all/show/2014/) , this is a measurement of complexity that is calculated based on how many different products a country can produce and the number of countries able to make those products
17

Makeup of Malaysia’s 2014 Exports
Source: The Atlas of Economic Complexity (http://atlas.cid.harvard.edu/explore/tree_map/export/mng/all/show/2014/) , this is a measurement of complexity that is calculated based on how many different products a country can produce and the number of countries able to make those products
18

The Atlas of Economic Complexity: Country Rankings*
*Note: Due to number of countries covered, only select countries are labeled in this chart. Mongolia is ranked 114th out of 124 countries.Source: The Atlas of Economic Complexity (http://atlas.cid.harvard.edu/explore/tree_map/export/mng/all/show/2014/) , this is a measurement of complexity that is calculated based on how many different products a country can produce and the number of countries able to make those products
-2.5
-2.0
-1.5
-1.0
-0.5
0.0
0.5
1.0
1.5
2.0
2.5Ja
pan
Sou
th K
ore
a
Cze
ch R
ep
ub
lic
Un
ite
d K
ingd
om
Slo
vaki
a
Ire
lan
d
Ch
ina
Me
xico
Esto
nia
Mal
aysi
a
Bel
aru
s
Lith
uan
ia
Bo
snia
-He
rze
govi
na
Ph
ilip
pin
es
Ukr
ain
e
Gre
ece
New
Zea
lan
d
El S
alva
do
r
Sou
th A
fric
a
Vie
tna
m
Egyp
t
Arg
enti
na
Mac
edo
nia
Gu
ate
mal
a
Ku
wai
t
Sen
egal
Cu
ba
Au
stra
lia
Zam
bia
Cam
ero
on
Qat
ar
Bo
tsw
ana
Uga
nd
a
Ban
glad
esh
Turk
men
ista
n
Mo
zam
biq
ue
Gab
on
Alg
eria
Mal
awi
Lib
ya
Gu
ine
a
An
gola
Eco
no
mic
Co
mp
lexi
ty I
nd
icat
or
Sco
re
Mongolia(score of -1.41)
19

Global Competitiveness Index: 2007-2015
2
3
4
5
6
7
Sin
gap
ore
Sou
thK
ore
a
Ch
ina
Ch
ile
Aze
rbai
jan
Kaz
akh
stan
Ru
ssia
Bra
zil
Ukr
ain
e
Tajik
ista
n
Kyr
gyzs
tan
Mo
ngo
lia
Glo
bal
Co
mp
etit
ive
nes
s In
dex
Sco
re
2007 2015
Note: Mongolia’s rank in 2007 is 101 out of 131 and in 2015 is 104 out of 140.Source: World Economic Forum, 2015-2016 Global Competitiveness Report, http://reports.weforum.org/global-competitiveness-report-2015-2016/
20
Best
Worst

2015 Open Budget Index: Mongolia scored 51 (ranked 39th among 102 countries)
0
10
20
30
40
50
60
70
80
90
100N
ew Z
eala
nd
No
rway
Fran
ce
Un
ited
Kin
gdo
m
Ger
man
y
Geo
rgia
Sou
th K
ore
a
Po
lan
d
Arg
enti
na
Spai
n
Ban
glad
esh
Co
sta
Ric
a
El S
alva
do
r
Do
min
ican
Re
pu
blic
Mo
ngo
lia
Ke
nya
Ukr
ain
e
Mal
i
Tan
zan
ia
Cam
ero
on
Bu
rkin
a Fa
so
Sen
egal
Tun
isia
Sri L
anka
Lib
eri
a
Rw
and
a
Trin
idad
& T
ob
ago
An
gola
Nig
eri
a
Bo
livia Fiji
Cam
bo
dia
Equ
ato
rial
Gu
ine
a
Mya
nm
ar
Op
en B
ud
get
Ind
ex S
core
Source: International Budget Partnership 2015 Open Budget Index, http://internationalbudget.org/opening-budgets/open-budget-initiative/open-budget-survey/
21
Worst
Best

2013 Resource Governance Index
98
92
8885
8077 76 75 74 74 73
7068
6663 62 61
58 57 56 56 5654 53 53
51 5048 47 47 47 46 46 46 46
43 43 43 43 42 42 41 4139 38
3734 34 33
31 3129 28
26
19
13
5 4
0
20
40
60
80
100
1. N
orw
ay
2. U
nit
ed
Sta
tes
(Gu
lf o
f M
exi
co)
3. U
nit
ed
Kin
gdo
m
4. A
ust
ralia
(W
este
rn A
ust
ralia
)
5. B
razi
l
6. M
exic
o
7. C
anad
a (A
lbe
rta)
8. C
hile
9. C
olo
mb
ia
10.
Tri
nid
ad a
nd
To
bag
o
11.
Per
u
12.
Ind
ia
13.
Tim
or-
Lest
e
14.
Ind
on
esia
15.
Gh
ana
16.
Lib
eri
a
17.
Zam
bia
18.
Ecu
ado
r
19.
Kaz
akh
stan
20.
Ve
ne
zue
la
21.
So
uth
Afr
ica
22.
Ru
ssia
23.
Ph
ilip
pin
es
24.
Bo
livia
25.
Mo
rocc
o
26.
Mo
ngo
lia
27.
Tan
zan
ia
28.
Aze
rbai
jan
29.
Iraq
30.
Bo
tsw
ana
31.
Bah
rain
32.
Gab
on
33.
Gu
ine
a
34.
Mal
aysi
a
35.
Sie
rra
Leo
ne
36.
Ch
ina
37.
Ye
me
n
38.
Egy
pt
39.
Pap
ua
New
Gu
inea
40.
Nig
eria
41.
An
gola
42.
Ku
wai
t
43.
Vie
tnam
44.
Co
ngo
(D
RC
)
45.
Alg
eri
a
46.
Mo
zam
biq
ue
47.
Cam
ero
on
48.
Sau
di A
rab
ia
49.
Afg
han
ista
n
50.
So
uth
Su
dan
51.
Zim
bab
we
52.
Cam
bo
dia
53.
Iran
54.
Qat
ar
55.
Lib
ya
56.
Eq
uat
ori
al G
uin
ea
57.
Tu
rkm
enis
tan
58.
Mya
nm
ar
22
Satisfactory (71-100)Partial (51-70)Weak (41-50)Failing (0-40)
Source: Natural Resource Governance Institute: 2013 Resource Governance Index, http://www.resourcegovernance.org/rgi

2013 Resource Governance Index: Mongolia
23Source: Natural Resource Governance Institute: 2013 Resource Governance Index, http://www.resourcegovernance.org/rgi

But does Governance Matter?
• OK, governance can be measured,
with caution
• But does it really matter?
24

Development Dividend of good governance & corruption control: Resource-Rich vs. Non-Resource Rich countries
Sources: GDP per capita (atop each column) from World Bank World Development Indicators, 2012.Corruption Control data from Worldwide Governance Indicators (WGI, 2012) Countries grouped into terciles based on WGI Control of Corruption scores. Resource Rich country classification according to IMF (2010).
Poor Corruption Control Average CorruptionControl
Good CorruptionControl
GD
P p
er
cap
ita (
PP
P)
Resource-Rich Countries Non Resource Rich
5,000
0
10,000
6,851
3,941
12,712
10,272
45,000
30,820
25

Domestic governance
International governance
Managing revenues
Getting a good deal
Discovery & deciding to
extract
Investing for sustainable
development
26
The Natural Resource Charter (NRC)

Global Lessons and Some Implications1. Consolidate & Build on earlier Transformative Achievements
in Political & Institutional Dimensions of Governance
-- Political and Civil Liberties, Free Press
-- Anti-Corruption program
-- Transparency reforms: i) Budget; ii) Mining Transparency:
Contracts, Beneficiary Ownership, Subnational, License
allocation, SOE (Erdenes), EITI +
2. Addressing major challenges in Economic Governance
-- Macroeconomic & debt management, lowering risks of default
or bailout: consensus on prudent fiscal, monetary & debt policies
-- Realism on mining prices, & policies of Future Heritage Fund
-- Reality of global mining foreign investments (& ‘art of negotiation’)
-- Economic diversification program: implementation & macro.
‘Seizing the Moment’: Towards national consensus 27