Embed Size (px)
Citation preview

ECONOMIC RESEARCH · ENGLISH EDITION FEBRUARY 2004
Nordic OutlookJobless growth: Causes and consequences
Important your attention is drawn to the statement on the back cover of this report which affects your rights.
SEB Economic ResearchNordic Outlook - February 2004
This report was published on February 10, 2004.
Cut-off date for calculations and forecasts was February 4, 2004.
Klas Eklund, Chief Economist +46 8 763 [email protected]
Håkan Frisén, Head of Economic Research [email protected]
Bo Enegren, Economist [email protected]
Ann Enshagen Lavebrink, Research Assistant [email protected]
Ingela Georgii-Hemming, EU Coordinator [email protected]
Olle Holmgren, Economist [email protected]
Mikael Johansson, Economist [email protected]
Fax no. +46 8 763 9300
Contributions to the sections on Germany and Norway in this report have been made by Thomas Köbel fromSEB Frankfurt/M and Tharald Stray Laastad from Trading Strategy, Merchant Banking.
SEB, Economic Research, K A3, SE-106 40 STOCKHOLM
Important: This statement affects your rights
This report is produced for institutional investors (being, in the United Kingdom, persons who fall within Article 9 (3) of the Financial Services Act 1986 (Invest-ment Advertisements) (Exemptions) Order 1988 or other persons to whom this document may lawfully be issued or passed on). This report is produced for privateinformation of recipients and neither Skandinaviska Enskilda Banken AB (publ) (the Bank) nor any identified third party data supplier (“Data Supplier(s)”) aresoliciting any action based upon it. Opinions contained in this research report represent the Bank’s present opinion only and are subject to change without notice.All information contained in this report has been compiled in good faith from sources believed to be reliable. However, no representation or warranty, express orimplied, is made with respect to the completeness or accuracy of the contents by the Bank or any Data Supplier and it is not to be relied upon as authoritative.Recipients are urged to base their investment decisions upon such investigations as they deem necessary. The Bank does not provide legal or tax advice, and whilethe Bank believes the information contained herein to be reliable, it is not intended to be and should not be construed as a legal or tax advice. To the extent permittedby applicable law, no liability whatsoever is accepted by the Bank) or any Data Supplier for any direct or consequential loss arising from use of this document or itscontents. Your attention is drawn to the fact that a member of, or any entity associated with, the Bank or its affiliates, officers, directors, employees or shareholdersof such members may from time to time have a long or short position in, or otherwise participate in the markets for, the securities and the currencies of countriesmentioned herein.
Skandinaviska Enskilda Banken AB (publ) is incorporated in Stockholm Sweden with limited liability and is a member of the Stockholm Stock Exchange.
Skandinaviska Enskilda Banken AB (publ) which is registered in England and Wales No. BR000979 is regulated by The Securities and Futures Authority and is amember of the London Stock Exchange.
Transactions involving debt securities will be executed by or with the Bank unless you are informed otherwise at the time of dealing.
Confidentiality Notice
This report is confidential and may not be reproduced or redistributed to any person other than its recipient from the Bank.
Skandinaviska Enskilda Banken AB (publ), 2004. All rights reserved.
2
SummaryNordic Outlook – February 2004
3
SummaryThe International Economy� The world economy is in a recovery phase. In the US, GDP will grow more than 4 per cent this year but more
slowly in 2005, when fiscal policy is tightened and interest rates will rise.
� The upturn will generate fewer jobs than usual, due to structurally higher productivity growth. Unemploymentwill thus remain relatively high and inflation low. The Fed can proceed slowly with its interest rate hikes and willwait until this autumn for the first one.
� Growth will decelerate somewhat in both Japan and China this year. Japan will continue its foreign exchangeinterventions but the yen will appreciate anyway. China will switch from a US dollar peg to a currency basket,but without drama or foreign exchange turbulence.
� Euro zone recovery will be sluggish, with GDP growth of 1.7 per cent this year. The strong euro will hamperexports. Domestic demand will grow only slowly. The ECB can keep its refi rate unchanged until late autumn.EU enlargement will have little impact during 2004-05.
� Bond yields will remain unchanged this spring and only creep upward slowly, beginning in the autumn. Joblessgrowth and low inflation are the reasons. Asian central banks will continue pumping capital into the US andhelping to hold down interest rates in the West.
� The dollar will weaken to USD 1.30 per euro this spring. As fiscal policy tightening approaches, the Fed beginshiking interest rates and the current account deficit stops growing, the dollar will stabilise. During 2005, it willstrengthen towards USD 1.20 per euro.
Sweden� Growth will accelerate to 2.3 per cent this year and 2.5 per cent in 2005. Due to a stronger world market and
good productivity, exports will perform decently despite the strong krona. Households will reduce their savingsand keep consumption up, in spite of tax hikes.
� In Sweden, too, higher growth will go hand in hand with weak employment. The reasons are rapidly risingproductivity in the business sector and local government financial problems.
� The wage round will see clashes about distributive principles but lead to modest pay hikes. Inflation will be verylow. Underlying inflation excluding energy will not reach 2 per cent annually over the next couple of years. TheRiksbank will cut the repo rate by another 25 basis points in April. Its rate hike cycle will begin late this year.
� The local government crisis will deepen. Public sector budget targets will not be met, and methods forcircumventing budget expenditure ceilings will become more devious.
� The government’s growth policy will achieve no breakthrough. A desire to preserve its parliamentary alliancewith the Left and Green Parties, while placating internal Social Democratic opinion, will prevent it from takingany major initiatives in taxation policy.
Other Nordic countries� Denmark’s GDP growth will quicken to 1.8 per cent this year with the help of private consumption, while
inflation will fall. The country’s current account surplus will prop up the krone and allow it to maintain a narrowinterest rate margin over the euro zone.
� In Finland, GDP growth will accelerate to 2.7 per cent this year, with private consumption as its main engine.The strong euro will lead to a comparatively sluggish export recovery and falling inflation. Capital and corporatetaxation will be reformed.
� Monetary policy shock therapy is yielding results in Norway. Growth will rise to 2.7 per cent this year, thanks tocapital spending in the oil sector and growing private consumption. Underlying inflation will bottom out thissummer and then climb a bit. Norges Bank will raise its key interest rate during the second half of 2004, and thekrone will strengthen somewhat.
ContentsNordic Outlook – February 2004
4
Summary 3International overview 5The United States 6China and Japan 9The euro zone 11The United Kingdom 14Central and Eastern Europe 15International financial markets 16Sweden 19Denmark 28Norway 29Finland 31Nordic key economic data 32International key economic data 34
Boxes
The United States: Jobless growth – for how long? 7Chinese bank and currency reforms 9The euro zone: Stability Pact headed to court 12The euro zone: Enlargement will have small short-term growth impetus 13Sweden: Moderate recovery in the telecom sector 20Sweden: Revised income growth curve 21Sweden: The moment of truth for public finances 25
International overviewNordic Outlook – February 2004
5
Still in the shadow of thebubble� Faster growth – but where are the jobs?
� Continued low interest rates
� Dollar slide hampering the rest of the world
The world economy is now undergoing a perceptiblerecovery, led by the United States. This upturn is dif-ferent from normal cyclical recoveries, however, dueto unusually weak employment and low inflation onthe one hand and major fiscal imbalances in the US onthe other. Although real-term growth hasconsolidated, the world economy is thus stillstruggling with the aftermath of the burst stock marketand capital spending bubble.
Extremely low key interest rates and large tax cutshave stimulated the American economy. But so far,growth has been based on rapid productivityimprovement without new employment. The “neweconomy” has proved more robust than many hadthought. Companies are slimming down andcostcutting, ousourcing jobs to low-cost countries,while placing new technology in service on a largescale. Despite the rapid increase in real GDP, capacityutilisation is thus low compared to potential GDP.
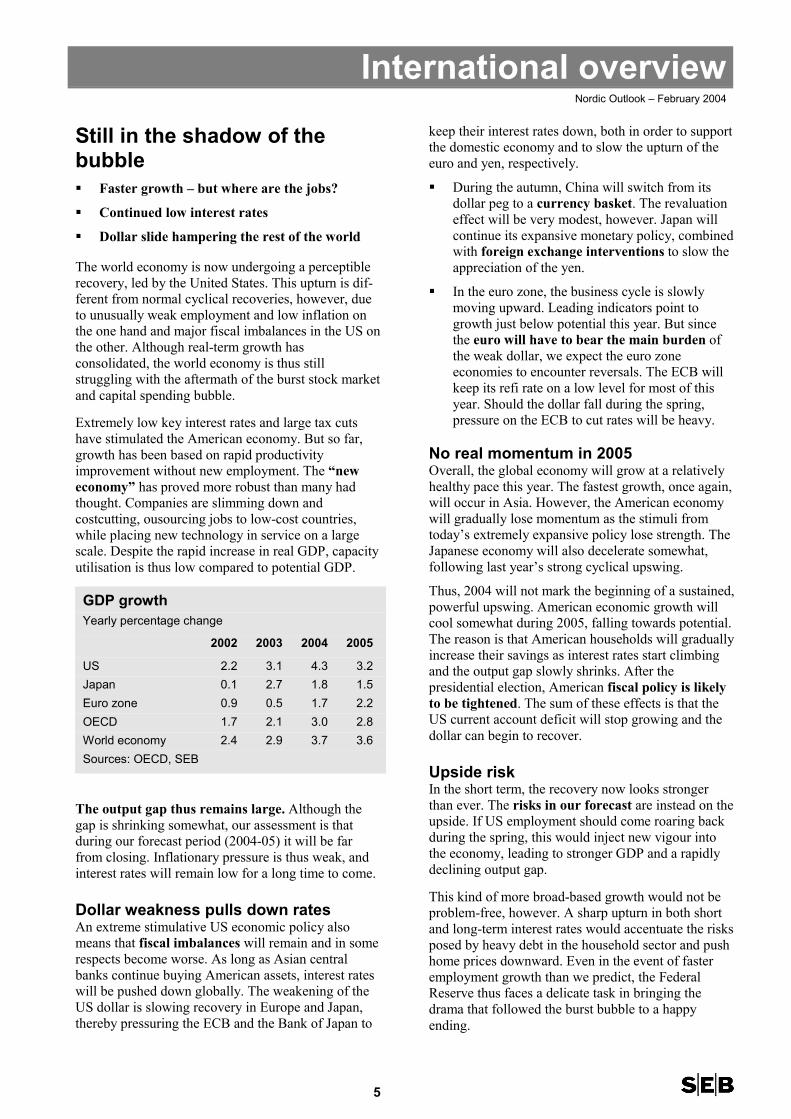
GDP growthYearly percentage change
2002 2003 2004 2005
US 2.2 3.1 4.3 3.2Japan 0.1 2.7 1.8 1.5Euro zone 0.9 0.5 1.7 2.2OECD 1.7 2.1 3.0 2.8World economy 2.4 2.9 3.7 3.6Sources: OECD, SEB
The output gap thus remains large. Although thegap is shrinking somewhat, our assessment is thatduring our forecast period (2004-05) it will be farfrom closing. Inflationary pressure is thus weak, andinterest rates will remain low for a long time to come.
Dollar weakness pulls down ratesAn extreme stimulative US economic policy alsomeans that fiscal imbalances will remain and in somerespects become worse. As long as Asian centralbanks continue buying American assets, interest rateswill be pushed down globally. The weakening of theUS dollar is slowing recovery in Europe and Japan,thereby pressuring the ECB and the Bank of Japan to
keep their interest rates down, both in order to supportthe domestic economy and to slow the upturn of theeuro and yen, respectively.
� During the autumn, China will switch from itsdollar peg to a currency basket. The revaluationeffect will be very modest, however. Japan willcontinue its expansive monetary policy, combinedwith foreign exchange interventions to slow theappreciation of the yen.
� In the euro zone, the business cycle is slowlymoving upward. Leading indicators point togrowth just below potential this year. But sincethe euro will have to bear the main burden ofthe weak dollar, we expect the euro zoneeconomies to encounter reversals. The ECB willkeep its refi rate on a low level for most of thisyear. Should the dollar fall during the spring,pressure on the ECB to cut rates will be heavy.
No real momentum in 2005Overall, the global economy will grow at a relativelyhealthy pace this year. The fastest growth, once again,will occur in Asia. However, the American economywill gradually lose momentum as the stimuli fromtoday’s extremely expansive policy lose strength. TheJapanese economy will also decelerate somewhat,following last year’s strong cyclical upswing.
Thus, 2004 will not mark the beginning of a sustained,powerful upswing. American economic growth willcool somewhat during 2005, falling towards potential.The reason is that American households will graduallyincrease their savings as interest rates start climbingand the output gap slowly shrinks. After thepresidential election, American fiscal policy is likelyto be tightened. The sum of these effects is that theUS current account deficit will stop growing and thedollar can begin to recover.
Upside riskIn the short term, the recovery now looks strongerthan ever. The risks in our forecast are instead on theupside. If US employment should come roaring backduring the spring, this would inject new vigour intothe economy, leading to stronger GDP and a rapidlydeclining output gap.
This kind of more broad-based growth would not beproblem-free, however. A sharp upturn in both shortand long-term interest rates would accentuate the risksposed by heavy debt in the household sector and pushhome prices downward. Even in the event of fasteremployment growth than we predict, the FederalReserve thus faces a delicate task in bringing thedrama that followed the burst bubble to a happyending.
The United StatesNordic Outlook – February 2004
6
Rolling the imbalances over� The forces of growth have been strengthened…
� …at the expense of sustained twin deficits
� Continued spare capacity and low inflation
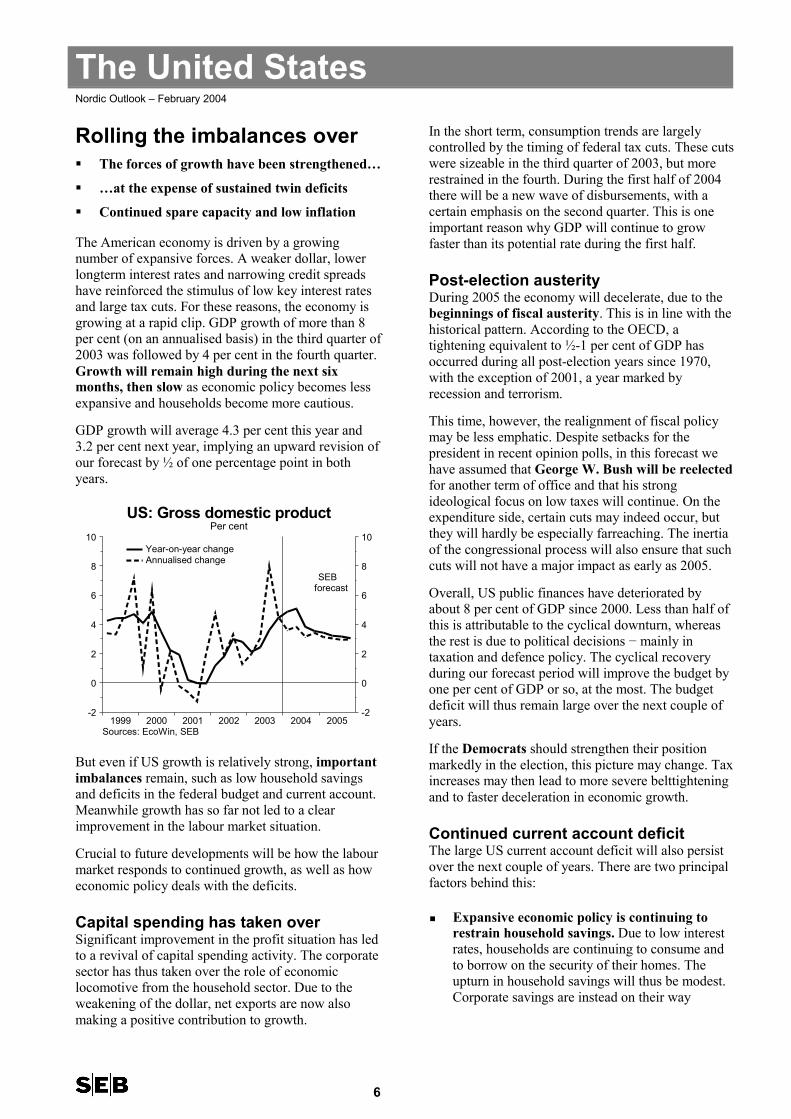
The American economy is driven by a growingnumber of expansive forces. A weaker dollar, lowerlongterm interest rates and narrowing credit spreadshave reinforced the stimulus of low key interest ratesand large tax cuts. For these reasons, the economy isgrowing at a rapid clip. GDP growth of more than 8per cent (on an annualised basis) in the third quarter of2003 was followed by 4 per cent in the fourth quarter.Growth will remain high during the next sixmonths, then slow as economic policy becomes lessexpansive and households become more cautious.
GDP growth will average 4.3 per cent this year and3.2 per cent next year, implying an upward revision ofour forecast by ½ of one percentage point in bothyears.
2005200420032002200120001999
10
8
6
4
2
0
-2
10
8
6
4
2
0
-2
Sources: EcoWin, SEB
US: Gross domestic productPer cent
forecastSEB
Year-on-year changeAnnualised change
But even if US growth is relatively strong, importantimbalances remain, such as low household savingsand deficits in the federal budget and current account.Meanwhile growth has so far not led to a clearimprovement in the labour market situation.
Crucial to future developments will be how the labourmarket responds to continued growth, as well as howeconomic policy deals with the deficits.
Capital spending has taken overSignificant improvement in the profit situation has ledto a revival of capital spending activity. The corporatesector has thus taken over the role of economiclocomotive from the household sector. Due to theweakening of the dollar, net exports are now alsomaking a positive contribution to growth.
In the short term, consumption trends are largelycontrolled by the timing of federal tax cuts. These cutswere sizeable in the third quarter of 2003, but morerestrained in the fourth. During the first half of 2004there will be a new wave of disbursements, with acertain emphasis on the second quarter. This is oneimportant reason why GDP will continue to growfaster than its potential rate during the first half.
Post-election austerityDuring 2005 the economy will decelerate, due to thebeginnings of fiscal austerity. This is in line with thehistorical pattern. According to the OECD, atightening equivalent to ½-1 per cent of GDP hasoccurred during all post-election years since 1970,with the exception of 2001, a year marked byrecession and terrorism.
This time, however, the realignment of fiscal policymay be less emphatic. Despite setbacks for thepresident in recent opinion polls, in this forecast wehave assumed that George W. Bush will be reelectedfor another term of office and that his strongideological focus on low taxes will continue. On theexpenditure side, certain cuts may indeed occur, butthey will hardly be especially farreaching. The inertiaof the congressional process will also ensure that suchcuts will not have a major impact as early as 2005.
Overall, US public finances have deteriorated byabout 8 per cent of GDP since 2000. Less than half ofthis is attributable to the cyclical downturn, whereasthe rest is due to political decisions − mainly intaxation and defence policy. The cyclical recoveryduring our forecast period will improve the budget byone per cent of GDP or so, at the most. The budgetdeficit will thus remain large over the next couple ofyears.
If the Democrats should strengthen their positionmarkedly in the election, this picture may change. Taxincreases may then lead to more severe belttighteningand to faster deceleration in economic growth.
Continued current account deficitThe large US current account deficit will also persistover the next couple of years. There are two principalfactors behind this:
▪ Expansive economic policy is continuing torestrain household savings. Due to low interestrates, households are continuing to consume andto borrow on the security of their homes. Theupturn in household savings will thus be modest.Corporate savings are instead on their way
The United StatesNordic Outlook – February 2004
7
Jobless growth – for how long?To date, the labour market has reacted on only a smallscale to vigorous US economic growth. In a historicalperspective, this trend is exceptional, both in terms ofthe productivity surge and the long period that haselapsed without the recovery generating new jobs.
New structures will prevail…The question is whether this is merely a temporarydeviation. Will employment soon take off again in thetraditional cyclical way, or are there more profoundchanges behind the low employment level?
We believe that structural factors are of greatimportance. There are several reasons whyproductivity is continuing to grow strongly:
� The “new economy” has led to a shift intechnology. New technology is affecting largeportions of the economy, through greateruserfriendliness and lower IT costs.
� Deregulation in many industries and increasinglytough competition are other important explanations.
� Keener competition is forcing companies toimprove efficiency and relocate less productivemanufacturing operations. “Offshoring” hasbecome an important factor not only inmanufacturing but also in parts of the service sector.
Our conclusion is consequently that productivity willcontinue to climb rapidly during 2004 and 2005 andthat this will hamper job creation.
...but the upturn will create new jobs later However, it is unlikely that strong US growth willgenerate no new jobs at all. A number of signalsindicate that the labour market is on its way towardsbecoming stronger. Employment will grow − albeit witha certain time lag and a weaker tradeoff. The crucialquestions are how strong the upturn will be and howmuch the economy can tolerate without triggering
inflationary forces. Our analysis of both issues leads toencouraging news from an inflation perspective.
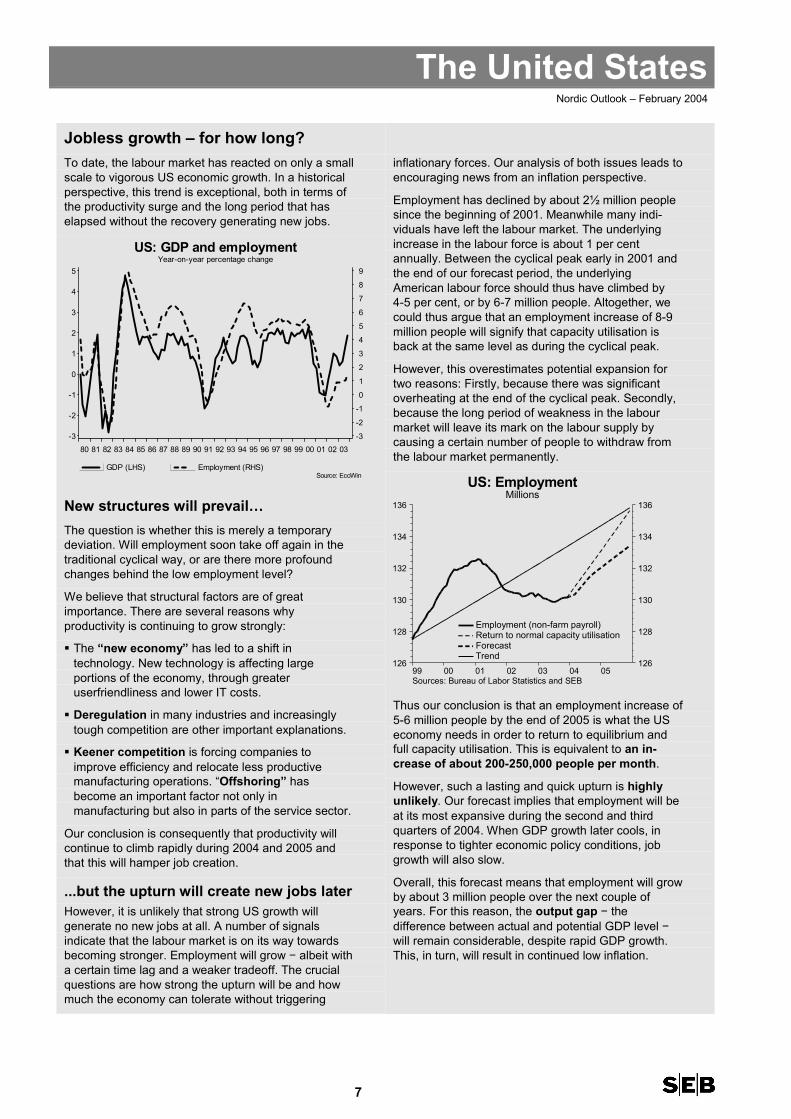
Employment has declined by about 2½ million peoplesince the beginning of 2001. Meanwhile many indi-viduals have left the labour market. The underlyingincrease in the labour force is about 1 per centannually. Between the cyclical peak early in 2001 andthe end of our forecast period, the underlyingAmerican labour force should thus have climbed by4-5 per cent, or by 6-7 million people. Altogether, wecould thus argue that an employment increase of 8-9million people will signify that capacity utilisation isback at the same level as during the cyclical peak.
However, this overestimates potential expansion fortwo reasons: Firstly, because there was significantoverheating at the end of the cyclical peak. Secondly,because the long period of weakness in the labourmarket will leave its mark on the labour supply bycausing a certain number of people to withdraw fromthe labour market permanently.
Thus our conclusion is that an employment increase of5-6 million people by the end of 2005 is what the USeconomy needs in order to return to equilibrium andfull capacity utilisation. This is equivalent to an in-crease of about 200-250,000 people per month.
However, such a lasting and quick upturn is highlyunlikely. Our forecast implies that employment will beat its most expansive during the second and thirdquarters of 2004. When GDP growth later cools, inresponse to tighter economic policy conditions, jobgrowth will also slow.
Overall, this forecast means that employment will growby about 3 million people over the next couple ofyears. For this reason, the output gap − thedifference between actual and potential GDP level −will remain considerable, despite rapid GDP growth.This, in turn, will result in continued low inflation.
Year-on-year percentage changeUS: GDP and employment
GDP (LHS) Employment (RHS)Source: EcoWin
80 81 82 83 84 85 86 87 88 89 90 91 92 93 94 95 96 97 98 99 00 01 02 03-3
-2
-1
0
1
2
3
4
5
6
7
8
9
-3
-2
-1
0
1
2
3
4
5
05040302010099
136
134
132
130
128
126
136
134
132
130
128
126
Sources: Bureau of Labor Statistics and SEB
US: EmploymentMillions
Employment (non-farm payroll)Return to normal capacity utilisationForecastTrend
The United StatesNordic Outlook – February 2004
8
downward, since a renewed inclination toundertake capital spending is overshadowingcompanies’ rising profits.
▪ The dollar slide is having only a limited impacton trade. It will require very large exchange rateshifts to turn around trade flows, in order tostrengthen the US current account in a situationwhere the American economy is growing twice asfast as those of Western Europe and Japan. Thisbecomes clear if we consider that Americanexports are only equivalent to about 10 per cent ofGDP and imports 15 per cent. Achieving balancedtrade would thus require a 50 per cent increase inexports. The modest weakening of the dollar thatwe foresee is not sufficient to achieve this.
It thus seems likely that the next couple of years willbe characterised by continued twin deficit problems.In the short term, this is not necessarily a major worry.Longer term, however, issues related to debt levelsand the sustainability of economic trends will becomeincreasingly pivotal.
USD bnUS: Public finance and current account
Federal surplus/deficit Current accountSource: EcoWin
92 93 94 95 96 97 98 99 00 01 02 03
-600
-500
-400
-300
-200
-100
0
100
200
300
-600
-500
-400
-300
-200
-100
0
100
200
300
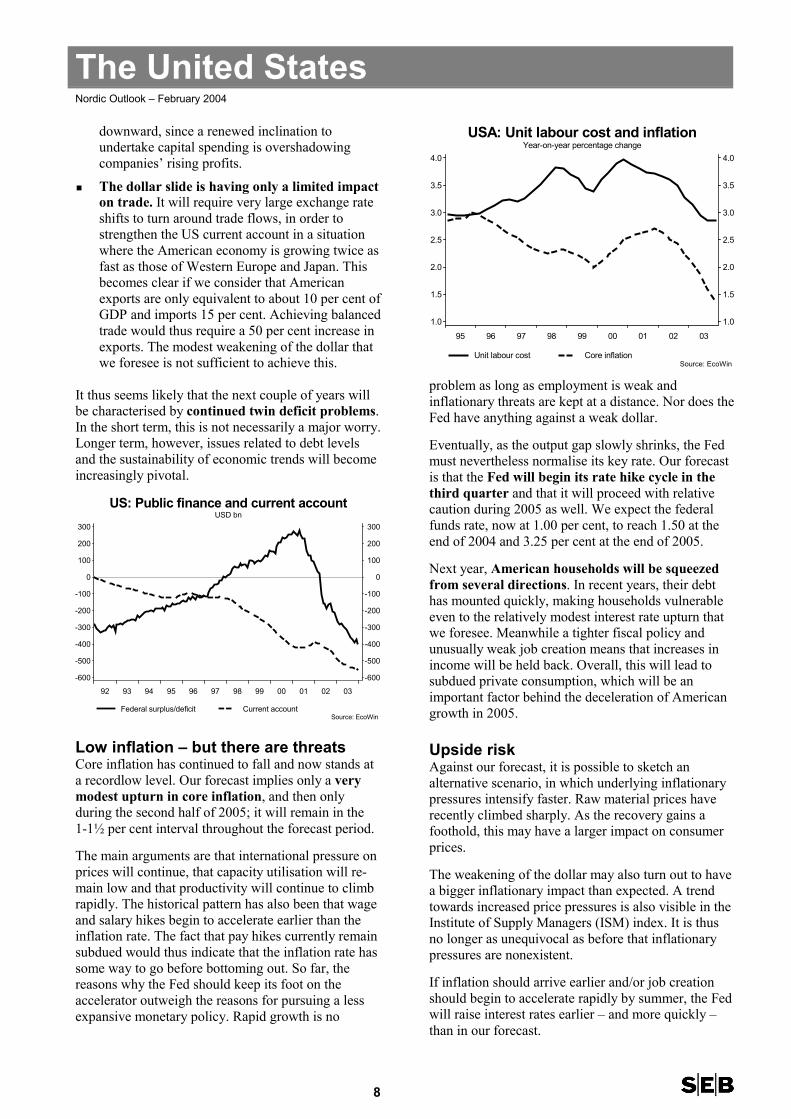
Low inflation – but there are threatsCore inflation has continued to fall and now stands ata recordlow level. Our forecast implies only a verymodest upturn in core inflation, and then onlyduring the second half of 2005; it will remain in the1-1½ per cent interval throughout the forecast period.
The main arguments are that international pressure onprices will continue, that capacity utilisation will re-main low and that productivity will continue to climbrapidly. The historical pattern has also been that wageand salary hikes begin to accelerate earlier than theinflation rate. The fact that pay hikes currently remainsubdued would thus indicate that the inflation rate hassome way to go before bottoming out. So far, thereasons why the Fed should keep its foot on theaccelerator outweigh the reasons for pursuing a lessexpansive monetary policy. Rapid growth is no
Year-on-year percentage changeUSA: Unit labour cost and inflation
Unit labour cost Core inflationSource: EcoWin
95 96 97 98 99 00 01 02 03
1.0
1.5
2.0
2.5
3.0
3.5
4.0
1.0
1.5
2.0
2.5
3.0
3.5
4.0
problem as long as employment is weak andinflationary threats are kept at a distance. Nor does theFed have anything against a weak dollar.
Eventually, as the output gap slowly shrinks, the Fedmust nevertheless normalise its key rate. Our forecastis that the Fed will begin its rate hike cycle in thethird quarter and that it will proceed with relativecaution during 2005 as well. We expect the federalfunds rate, now at 1.00 per cent, to reach 1.50 at theend of 2004 and 3.25 per cent at the end of 2005.
Next year, American households will be squeezedfrom several directions. In recent years, their debthas mounted quickly, making households vulnerableeven to the relatively modest interest rate upturn thatwe foresee. Meanwhile a tighter fiscal policy andunusually weak job creation means that increases inincome will be held back. Overall, this will lead tosubdued private consumption, which will be animportant factor behind the deceleration of Americangrowth in 2005.
Upside riskAgainst our forecast, it is possible to sketch analternative scenario, in which underlying inflationarypressures intensify faster. Raw material prices haverecently climbed sharply. As the recovery gains afoothold, this may have a larger impact on consumerprices.
The weakening of the dollar may also turn out to havea bigger inflationary impact than expected. A trendtowards increased price pressures is also visible in theInstitute of Supply Managers (ISM) index. It is thusno longer as unequivocal as before that inflationarypressures are nonexistent.
If inflation should arrive earlier and/or job creationshould begin to accelerate rapidly by summer, the Fedwill raise interest rates earlier – and more quickly –than in our forecast.
China and JapanNordic Outlook – February 2004
9
China’s cautious deceleration� Japan and China resist currency appreciation
� Somewhat slower expansion in 2004…
� …but Asia still fastest-growing in the world
The Chinese economy is second only to that of theUnited States as a contributor to world economicgrowth in recent years. The reasons are a very largeinflux of direct investments, an inexhaustible supplyof cheap labour and rapidly rising productivity,especially as a consequence of economic reforms.
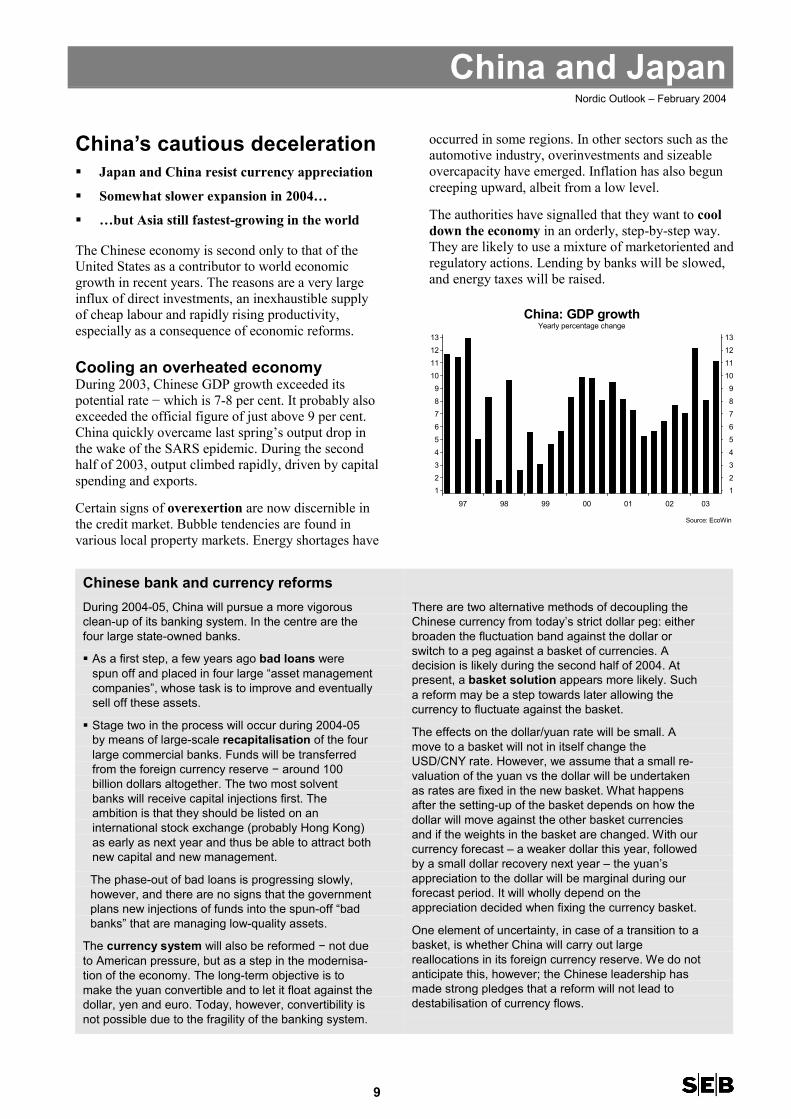
Cooling an overheated economyDuring 2003, Chinese GDP growth exceeded itspotential rate − which is 7-8 per cent. It probably alsoexceeded the official figure of just above 9 per cent.China quickly overcame last spring’s output drop inthe wake of the SARS epidemic. During the secondhalf of 2003, output climbed rapidly, driven by capitalspending and exports.
Certain signs of overexertion are now discernible inthe credit market. Bubble tendencies are found invarious local property markets. Energy shortages have
occurred in some regions. In other sectors such as theautomotive industry, overinvestments and sizeableovercapacity have emerged. Inflation has also beguncreeping upward, albeit from a low level.
The authorities have signalled that they want to cooldown the economy in an orderly, step-by-step way.They are likely to use a mixture of marketoriented andregulatory actions. Lending by banks will be slowed,and energy taxes will be raised.
Yearly percentage changeChina: GDP growth
Source: EcoWin
97 98 99 00 01 02 03
123456789
10111213
123456789
10111213
Chinese bank and currency reformsDuring 2004-05, China will pursue a more vigorousclean-up of its banking system. In the centre are thefour large state-owned banks.
� As a first step, a few years ago bad loans werespun off and placed in four large “asset managementcompanies”, whose task is to improve and eventuallysell off these assets.
� Stage two in the process will occur during 2004-05by means of large-scale recapitalisation of the fourlarge commercial banks. Funds will be transferredfrom the foreign currency reserve − around 100billion dollars altogether. The two most solventbanks will receive capital injections first. Theambition is that they should be listed on aninternational stock exchange (probably Hong Kong)as early as next year and thus be able to attract bothnew capital and new management.
The phase-out of bad loans is progressing slowly,however, and there are no signs that the governmentplans new injections of funds into the spun-off “badbanks” that are managing low-quality assets.
The currency system will also be reformed − not dueto American pressure, but as a step in the modernisa-tion of the economy. The long-term objective is tomake the yuan convertible and to let it float against thedollar, yen and euro. Today, however, convertibility isnot possible due to the fragility of the banking system.
There are two alternative methods of decoupling theChinese currency from today’s strict dollar peg: eitherbroaden the fluctuation band against the dollar orswitch to a peg against a basket of currencies. Adecision is likely during the second half of 2004. Atpresent, a basket solution appears more likely. Sucha reform may be a step towards later allowing thecurrency to fluctuate against the basket.
The effects on the dollar/yuan rate will be small. Amove to a basket will not in itself change theUSD/CNY rate. However, we assume that a small re-valuation of the yuan vs the dollar will be undertakenas rates are fixed in the new basket. What happensafter the setting-up of the basket depends on how thedollar will move against the other basket currenciesand if the weights in the basket are changed. With ourcurrency forecast – a weaker dollar this year, followedby a small dollar recovery next year – the yuan’sappreciation to the dollar will be marginal during ourforecast period. It will wholly depend on theappreciation decided when fixing the currency basket.
One element of uncertainty, in case of a transition to abasket, is whether China will carry out largereallocations in its foreign currency reserve. We do notanticipate this, however; the Chinese leadership hasmade strong pledges that a reform will not lead todestabilisation of currency flows.
China and JapanNordic Outlook – February 2004
10
These actions will slow the GDP growth rate to itspotential during 2004. China’s trade expansion willcontinue, however, and even after this modest coolingprocess the growth rate will be around 7 per cent.
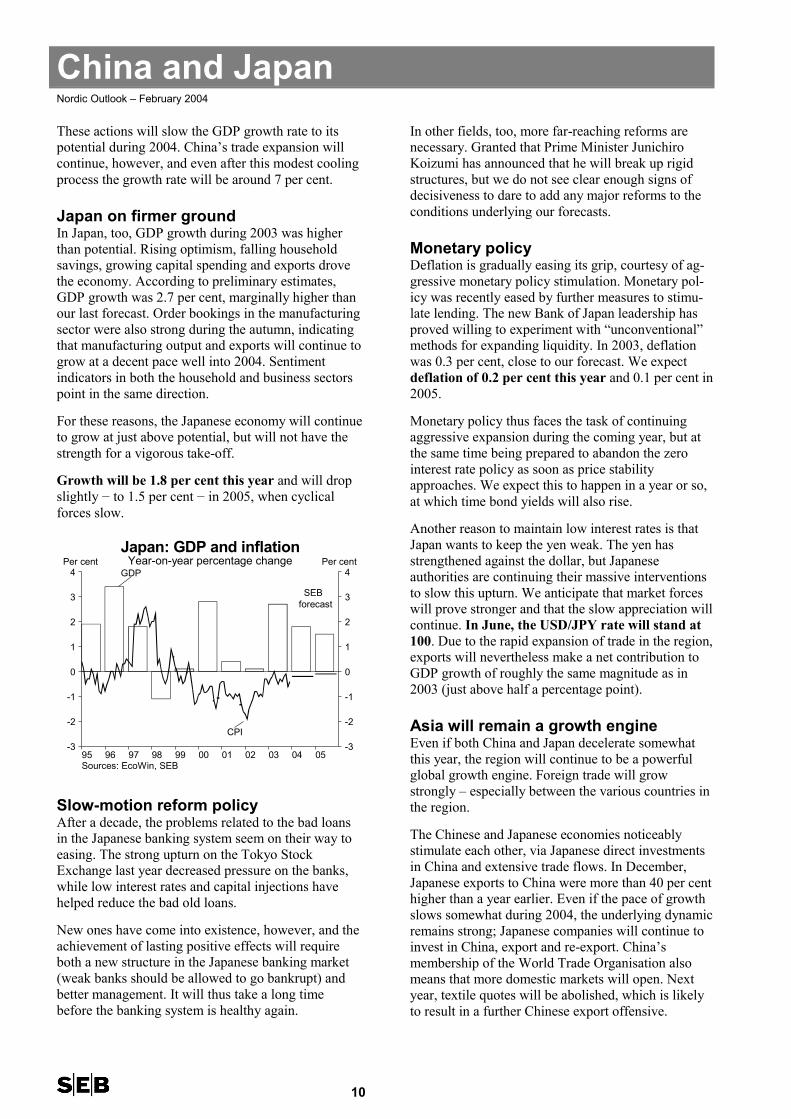
Japan on firmer groundIn Japan, too, GDP growth during 2003 was higherthan potential. Rising optimism, falling householdsavings, growing capital spending and exports drovethe economy. According to preliminary estimates,GDP growth was 2.7 per cent, marginally higher thanour last forecast. Order bookings in the manufacturingsector were also strong during the autumn, indicatingthat manufacturing output and exports will continue togrow at a decent pace well into 2004. Sentimentindicators in both the household and business sectorspoint in the same direction.
For these reasons, the Japanese economy will continueto grow at just above potential, but will not have thestrength for a vigorous take-off.
Growth will be 1.8 per cent this year and will dropslightly − to 1.5 per cent − in 2005, when cyclicalforces slow.
0504030201009998979695
4
3
2
1
0
-1
-2
-3
4
3
2
1
0
-1
-2
-3
Sources: EcoWin, SEB
Japan: GDP and inflationYear-on-year percentage changePer cent Per cent
GDP
CPI
SEB forecast
Slow-motion reform policyAfter a decade, the problems related to the bad loansin the Japanese banking system seem on their way toeasing. The strong upturn on the Tokyo StockExchange last year decreased pressure on the banks,while low interest rates and capital injections havehelped reduce the bad old loans.
New ones have come into existence, however, and theachievement of lasting positive effects will requireboth a new structure in the Japanese banking market(weak banks should be allowed to go bankrupt) andbetter management. It will thus take a long timebefore the banking system is healthy again.
In other fields, too, more far-reaching reforms arenecessary. Granted that Prime Minister JunichiroKoizumi has announced that he will break up rigidstructures, but we do not see clear enough signs ofdecisiveness to dare to add any major reforms to theconditions underlying our forecasts.
Monetary policyDeflation is gradually easing its grip, courtesy of ag-gressive monetary policy stimulation. Monetary pol-icy was recently eased by further measures to stimu-late lending. The new Bank of Japan leadership hasproved willing to experiment with “unconventional”methods for expanding liquidity. In 2003, deflationwas 0.3 per cent, close to our forecast. We expectdeflation of 0.2 per cent this year and 0.1 per cent in2005.
Monetary policy thus faces the task of continuingaggressive expansion during the coming year, but atthe same time being prepared to abandon the zerointerest rate policy as soon as price stabilityapproaches. We expect this to happen in a year or so,at which time bond yields will also rise.
Another reason to maintain low interest rates is thatJapan wants to keep the yen weak. The yen hasstrengthened against the dollar, but Japaneseauthorities are continuing their massive interventionsto slow this upturn. We anticipate that market forceswill prove stronger and that the slow appreciation willcontinue. In June, the USD/JPY rate will stand at100. Due to the rapid expansion of trade in the region,exports will nevertheless make a net contribution toGDP growth of roughly the same magnitude as in2003 (just above half a percentage point).
Asia will remain a growth engineEven if both China and Japan decelerate somewhatthis year, the region will continue to be a powerfulglobal growth engine. Foreign trade will growstrongly – especially between the various countries inthe region.
The Chinese and Japanese economies noticeablystimulate each other, via Japanese direct investmentsin China and extensive trade flows. In December,Japanese exports to China were more than 40 per centhigher than a year earlier. Even if the pace of growthslows somewhat during 2004, the underlying dynamicremains strong; Japanese companies will continue toinvest in China, export and re-export. China’smembership of the World Trade Organisation alsomeans that more domestic markets will open. Nextyear, textile quotes will be abolished, which is likelyto result in a further Chinese export offensive.

The euro zoneNordic Outlook – February 2004
11
The weak link� Stronger euro slowing the recovery
� Inflation will fall towards 1½ per cent
� EU enlargement: little short-term impact
The euro zone has been a weak link in the globaleconomic upturn. During 2003, its GDP growthreached only 0.5 per cent. Germany and the Neth-erlands even reported declining GDP last year.
Net balanceEuro zone: Sentiment indicators
Business Surveys, Manufacturing Sector, Confidence indicator Consumer Surveys, Consumer confidence indicator
Source: EcoWin
90 91 92 93 94 95 96 97 98 99 00 01 02 03
-35
-30
-25
-20
-15
-10
-5
0
5
10
-35
-30
-25
-20
-15
-10
-5
0
5
10
The export recovery that began last autumn will con-tinue in 2004, but the power of the upturn will beblunted by an ever-stronger euro. We anticipate thatupward pressure on the euro will continue during thespring. The European Central Bank will keep its refirate at the present level until late this autumn.Domestic demand, which has been sluggish to date,will rise by about 2 per cent annually during the nextcouple of years. Due to euro appreciation, thecontribution from net exports will again be slightlynegative this year. GDP growth will be 1.7 per centthis year, climbing to 2.2 per cent in 2005.
Cautiously optimistic householdsPrivate consumption weakened during the secondhalf of 2003, yet there is still reason to count onaccelerating consumption growth this year. Householdoptimism has increased continuously since last spring.Lower inflation and income tax cuts will contribute tobetter income growth in 2004. Continued low interestrates and the stock market upturn should favour aconsumption surge, especially since household sav-ings are at a high level.
So far, there are few signs of a turnaround in thecapital spending cycle. Due to continued euroappreciation, restoration of profits is being delayed,which will hamper capital spending. However, giventhe export upswing and comparatively high capacityutilisation, the capital spending cycle is close tobottoming out. In 2004, fixed investments will thus
provide a positive contribution to GDP growth for thefirst time in four years.
0504030201009998
3.5
3.0
2.5
2.0
1.5
1.0
0.5
0.0
3.5
3.0
2.5
2.0
1.5
1.0
0.5
0.0
Sources: Eurostat and SEB
Euro zone: InflationYear-on-year percentage change
forecastSEB
CPICPI excl food, alcoholic beverages, tobacco, energy
Lower inflation aheadInflation has remained at around 2 per cent yearly,despite low capacity utilisation and a stronger euro.This has created doubts as to whether inflation isactually on its way towards below 2 per cent this year.
Higher food prices after the extreme summer 2003drought, higher indirect taxes especially on tobaccoproducts plus continued relatively high oil prices havehelped keep inflation up. Core inflation (adjusted forfood, alcoholic beverages, tobacco and energy) wasless than 2 per cent throughout last year. But due toweak productivity growth, unit labour costs have notdeclined as expected, resulting in underlyinginflationary pressure.
Nevertheless, we still expect inflation to fall gradu-ally in the course of 2004. There are several reasonsfor this:
� Euro appreciation. It generally takes up to twoyears before exchange rate shifts have a full im-pact on consumer prices. A large proportion of theeffects of euro appreciation on the CPI thus lieahead. In addition, we expect a furtherstrengthening of the euro in the next six months.
� Productivity will strengthen for cyclical reasons.In the beginning of a recovery, the potential forproductivity gains is at its largest, since outputcan increase while using the existing workforce.
� Pay increases will be modest due to the weaklabour market. In Germany, wage and salarydemands have been restrained so far. In theNetherlands, pay levels during 2004 and 2005have been frozen.
However, due to rising indirect taxes and fees, theinflation downturn will prove relatively slow. Thefinancing of the health reform in Germany, for
The euro zoneNordic Outlook – February 2004
12
example, will push up euro zone inflation by 0.2percentage points. In terms of yearly averages, weforesee inflation of 1.6 per cent in 2004 and 1.5 percent in 2005.
Strong euro puts pressure on ECBIn its latest forecast update (early December), the ECBpredicted inflation of 1.8 per cent in 2004 and about1.6 per cent in 2005 (the Bank actually stated aninterval of 1.3-2.3 per cent and 1.0-2.0 per cent,respectively). This forecast was based on a technicalassumption of a euro/dollar exchange rate of 1.17.Since then the euro has strengthened by about 7 percent against the dollar and 4 per cent in effectiveterms.
Sensitivity calculations say that the effect of suchappreciation is minus 0.2-0.4 per cent on CPI and
0.3-0.6 per cent on GDP. Euro appreciation thusconstitutes a clear drag on growth.
As a result of the euro’s rise, expectations of earlyinterest rate hikes have faded, and rate cuts have nowappeared on the market agenda. We expect that as aconsequence of the above-mentioned effects oninflation and growth, the ECB will keep its refi rateon hold at the present level until the fourth quarterthis year.
The risk is clearly on the downside. Should the dollarfall markedly – in the wake of the G7 meeting –during the next month, pressure will increase sharplyon the ECB to cut rates later this spring.
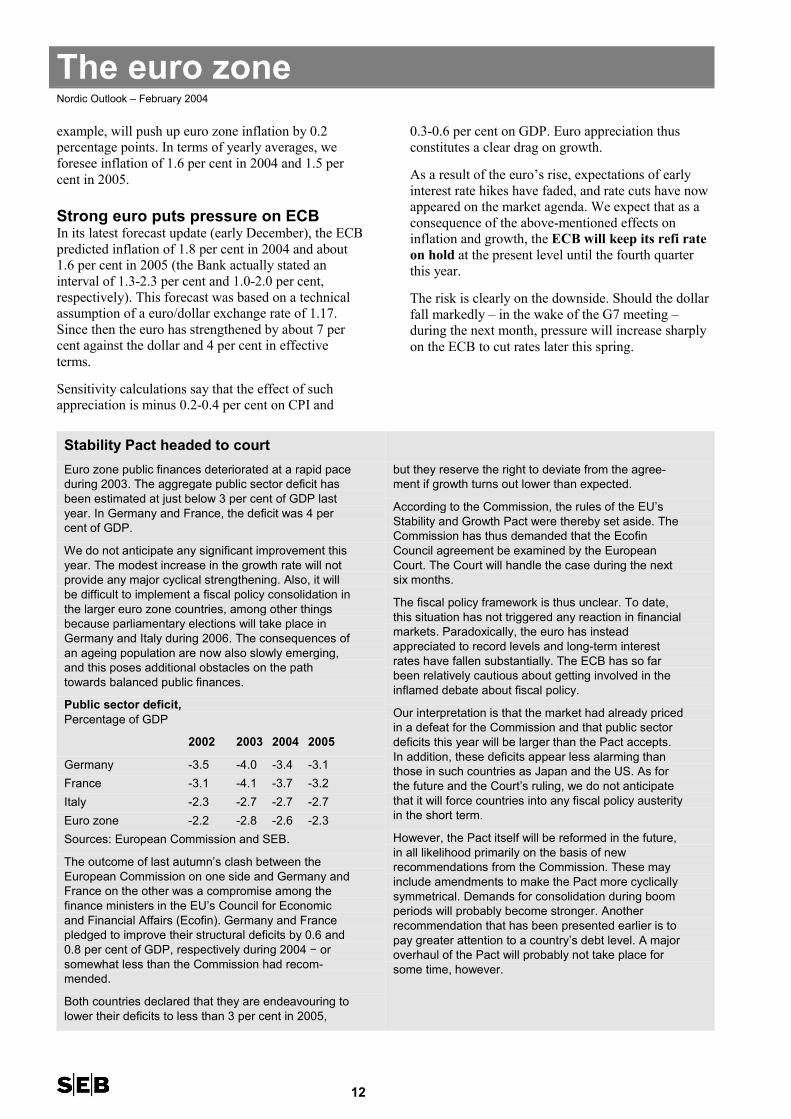
Stability Pact headed to courtEuro zone public finances deteriorated at a rapid paceduring 2003. The aggregate public sector deficit hasbeen estimated at just below 3 per cent of GDP lastyear. In Germany and France, the deficit was 4 percent of GDP.
We do not anticipate any significant improvement thisyear. The modest increase in the growth rate will notprovide any major cyclical strengthening. Also, it willbe difficult to implement a fiscal policy consolidation inthe larger euro zone countries, among other thingsbecause parliamentary elections will take place inGermany and Italy during 2006. The consequences ofan ageing population are now also slowly emerging,and this poses additional obstacles on the pathtowards balanced public finances.
Public sector deficit,Percentage of GDP
2002 2003 2004 2005
Germany -3.5 -4.0 -3.4 -3.1France -3.1 -4.1 -3.7 -3.2Italy -2.3 -2.7 -2.7 -2.7Euro zone -2.2 -2.8 -2.6 -2.3Sources: European Commission and SEB.
The outcome of last autumn’s clash between theEuropean Commission on one side and Germany andFrance on the other was a compromise among thefinance ministers in the EU’s Council for Economicand Financial Affairs (Ecofin). Germany and Francepledged to improve their structural deficits by 0.6 and0.8 per cent of GDP, respectively during 2004 − orsomewhat less than the Commission had recom-mended.
Both countries declared that they are endeavouring tolower their deficits to less than 3 per cent in 2005,
but they reserve the right to deviate from the agree-ment if growth turns out lower than expected.
According to the Commission, the rules of the EU’sStability and Growth Pact were thereby set aside. TheCommission has thus demanded that the EcofinCouncil agreement be examined by the EuropeanCourt. The Court will handle the case during the nextsix months.
The fiscal policy framework is thus unclear. To date,this situation has not triggered any reaction in financialmarkets. Paradoxically, the euro has insteadappreciated to record levels and long-term interestrates have fallen substantially. The ECB has so farbeen relatively cautious about getting involved in theinflamed debate about fiscal policy.
Our interpretation is that the market had already pricedin a defeat for the Commission and that public sectordeficits this year will be larger than the Pact accepts.In addition, these deficits appear less alarming thanthose in such countries as Japan and the US. As forthe future and the Court’s ruling, we do not anticipatethat it will force countries into any fiscal policy austerityin the short term.
However, the Pact itself will be reformed in the future,in all likelihood primarily on the basis of newrecommendations from the Commission. These mayinclude amendments to make the Pact more cyclicallysymmetrical. Demands for consolidation during boomperiods will probably become stronger. Anotherrecommendation that has been presented earlier is topay greater attention to a country’s debt level. A majoroverhaul of the Pact will probably not take place forsome time, however.
The euro zoneNordic Outlook – February 2004
13
Enlargement will have small short-termgrowth impetusOn May 1, the European Union will gain ten newmember countries: Poland, the Czech Republic,Hungary, Slovakia, Slovenia, Lithuania, Cyprus,Latvia, Estonia and Malta. The population of the EUwill increase by 20 per cent, from about 380 to 455million. All these new countries intend to join the eurocurrency union before the end of the decade.Enlargement will undoubtedly have major politicalrepercussions for the EU. However, its short-termeconomic consequences have, to a great extent,already taken place.
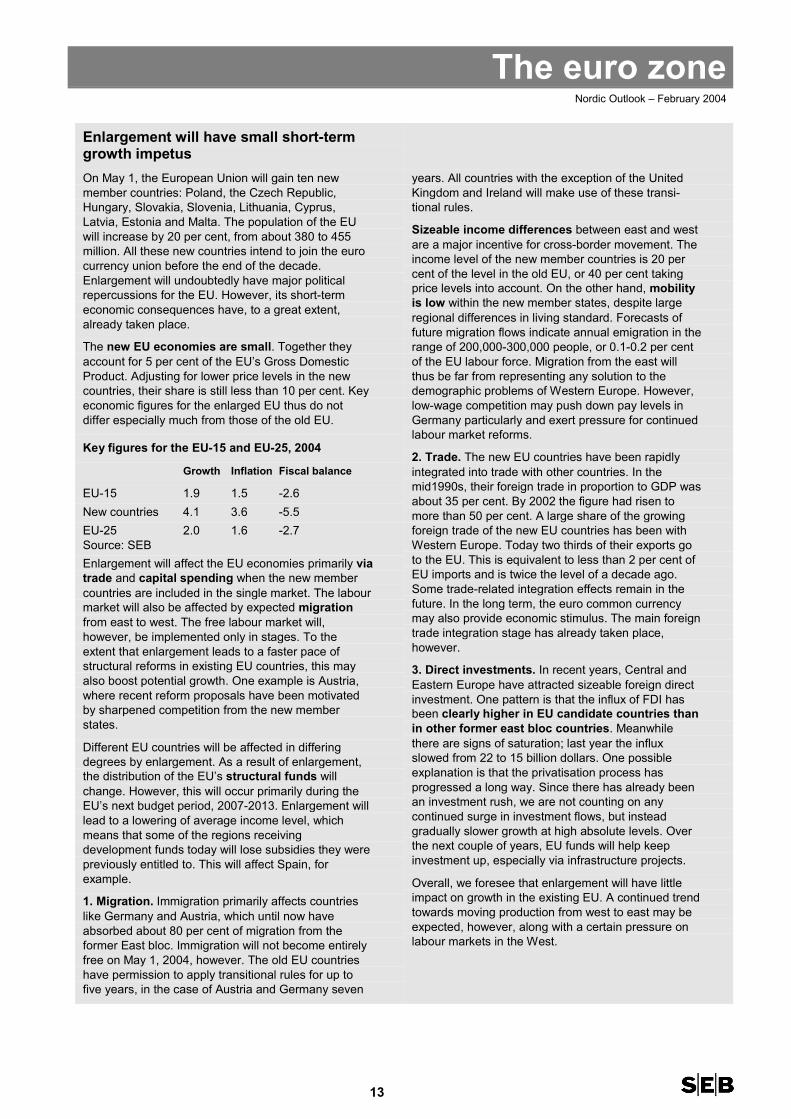
The new EU economies are small. Together theyaccount for 5 per cent of the EU’s Gross DomesticProduct. Adjusting for lower price levels in the newcountries, their share is still less than 10 per cent. Keyeconomic figures for the enlarged EU thus do notdiffer especially much from those of the old EU.
Key figures for the EU-15 and EU-25, 2004
Growth Inflation Fiscal balance
EU-15 1.9 1.5 -2.6New countries 4.1 3.6 -5.5EU-25 2.0 1.6 -2.7Source: SEBEnlargement will affect the EU economies primarily viatrade and capital spending when the new membercountries are included in the single market. The labourmarket will also be affected by expected migrationfrom east to west. The free labour market will,however, be implemented only in stages. To theextent that enlargement leads to a faster pace ofstructural reforms in existing EU countries, this mayalso boost potential growth. One example is Austria,where recent reform proposals have been motivatedby sharpened competition from the new memberstates.
Different EU countries will be affected in differingdegrees by enlargement. As a result of enlargement,the distribution of the EU’s structural funds willchange. However, this will occur primarily during theEU’s next budget period, 2007-2013. Enlargement willlead to a lowering of average income level, whichmeans that some of the regions receivingdevelopment funds today will lose subsidies they werepreviously entitled to. This will affect Spain, forexample.
1. Migration. Immigration primarily affects countrieslike Germany and Austria, which until now haveabsorbed about 80 per cent of migration from theformer East bloc. Immigration will not become entirelyfree on May 1, 2004, however. The old EU countrieshave permission to apply transitional rules for up tofive years, in the case of Austria and Germany seven
years. All countries with the exception of the UnitedKingdom and Ireland will make use of these transi-tional rules.
Sizeable income differences between east and westare a major incentive for cross-border movement. Theincome level of the new member countries is 20 percent of the level in the old EU, or 40 per cent takingprice levels into account. On the other hand, mobilityis low within the new member states, despite largeregional differences in living standard. Forecasts offuture migration flows indicate annual emigration in therange of 200,000-300,000 people, or 0.1-0.2 per centof the EU labour force. Migration from the east willthus be far from representing any solution to thedemographic problems of Western Europe. However,low-wage competition may push down pay levels inGermany particularly and exert pressure for continuedlabour market reforms.
2. Trade. The new EU countries have been rapidlyintegrated into trade with other countries. In themid1990s, their foreign trade in proportion to GDP wasabout 35 per cent. By 2002 the figure had risen tomore than 50 per cent. A large share of the growingforeign trade of the new EU countries has been withWestern Europe. Today two thirds of their exports goto the EU. This is equivalent to less than 2 per cent ofEU imports and is twice the level of a decade ago.Some trade-related integration effects remain in thefuture. In the long term, the euro common currencymay also provide economic stimulus. The main foreigntrade integration stage has already taken place,however.
3. Direct investments. In recent years, Central andEastern Europe have attracted sizeable foreign directinvestment. One pattern is that the influx of FDI hasbeen clearly higher in EU candidate countries thanin other former east bloc countries. Meanwhilethere are signs of saturation; last year the influxslowed from 22 to 15 billion dollars. One possibleexplanation is that the privatisation process hasprogressed a long way. Since there has already beenan investment rush, we are not counting on anycontinued surge in investment flows, but insteadgradually slower growth at high absolute levels. Overthe next couple of years, EU funds will help keepinvestment up, especially via infrastructure projects.
Overall, we foresee that enlargement will have littleimpact on growth in the existing EU. A continued trendtowards moving production from west to east may beexpected, however, along with a certain pressure onlabour markets in the West.
The United KingdomNordic Outlook – February 2004
14
Recovery on firmer ground� Exports are rebounding
� Modest rate hikes will cool the housing market
� Budget deficit exceeds 3 per cent of GDP
The recovery in the British economy is gaining anever-firmer foothold. An upturn in exports and capitalspending is broadening growth, which was previouslyconsumption-led. We expect GDP to rise by 2.6 percent, both this year and in 2005. The UK will thusachieve its potential growth rate again, after havingfallen below it for three consecutive years. A modesttightening of monetary policy − which will cool theheated housing and credit markets − will limit growth.
Exports have clearly recovered from a weak start in2003. Lingering positive effects from last year’sweakened pound are fuelling the export sector. Inaddition, the international economic outlook hasbrightened. This promises export increases of 4-5 percent annually in 2004-2005. Corporate capitalspending is also beginning to gain momentum, butsince the investment level is relatively high and manycompanies need to make large pension provisions inthe next few years, growth figures will be modest.
Last year, growth in private consumption slowed from3.5 to 2.5 per cent. Due to rising interest rates, con-sumption growth will remain at this calmer level.Home prices are a key factor affecting the con-sumption trend. During the autumn, the rate ofyearon-year price increases cooled to 15-20 per centfrom 30 per cent early in 2003. A major price slidecannot be ruled out, in light of strongly inflated pricelevels. This would lead to clearly lower consumptiongrowth; a slide in home prices is thus the main threatagainst a balanced recovery.
Unemployment will remain unchanged at its currentlow level. Public sector expansion has sustainedemployment to date, and this year the manufacturingsector will again begin recruiting new employees.
Cautious interest rate hikesThe Bank of England recently carried out its secondrepo rate hike since November, from 3.75 to 4.00 percent. But the BoE has good reasons to hurry slowlyand will content itself with 50 basis points during theremainder of 2004.
� Households are deep in debt and highly sensitiveto interest rates. Rate hikes have a relatively rapidimpact, especially in the UK, where more thanthree fourths of home mortgage loans haveadjustable interest rates.
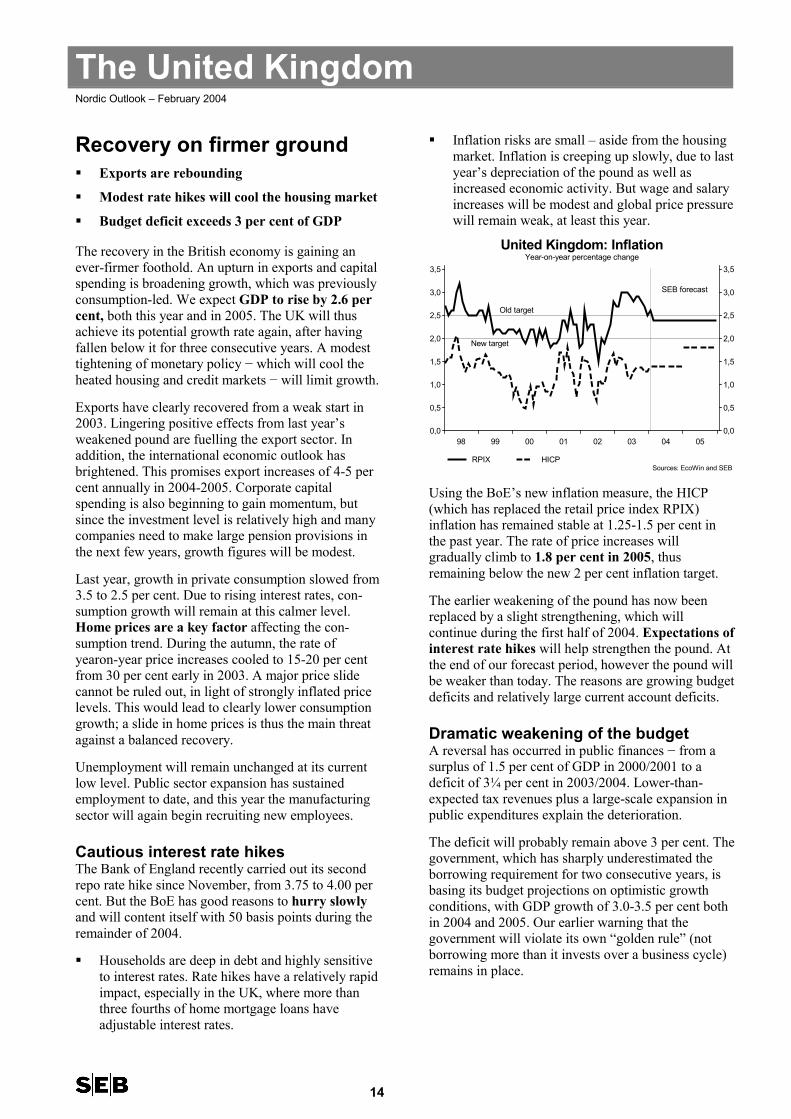
� Inflation risks are small – aside from the housingmarket. Inflation is creeping up slowly, due to lastyear’s depreciation of the pound as well asincreased economic activity. But wage and salaryincreases will be modest and global price pressurewill remain weak, at least this year.
Year-on-year percentage changeUnited Kingdom: Inflation
RPIX HICPSources: EcoWin and SEB
98 99 00 01 02 03 04 050,0
0,5
1,0
1,5
2,0
2,5
3,0
3,5
0,0
0,5
1,0
1,5
2,0
2,5
3,0
3,5
Old target
SEB forecast
New target
Using the BoE’s new inflation measure, the HICP(which has replaced the retail price index RPIX)inflation has remained stable at 1.25-1.5 per cent inthe past year. The rate of price increases willgradually climb to 1.8 per cent in 2005, thusremaining below the new 2 per cent inflation target.
The earlier weakening of the pound has now beenreplaced by a slight strengthening, which willcontinue during the first half of 2004. Expectations ofinterest rate hikes will help strengthen the pound. Atthe end of our forecast period, however the pound willbe weaker than today. The reasons are growing budgetdeficits and relatively large current account deficits.
Dramatic weakening of the budgetA reversal has occurred in public finances − from asurplus of 1.5 per cent of GDP in 2000/2001 to adeficit of 3¼ per cent in 2003/2004. Lower-than-expected tax revenues plus a large-scale expansion inpublic expenditures explain the deterioration.
The deficit will probably remain above 3 per cent. Thegovernment, which has sharply underestimated theborrowing requirement for two consecutive years, isbasing its budget projections on optimistic growthconditions, with GDP growth of 3.0-3.5 per cent bothin 2004 and 2005. Our earlier warning that thegovernment will violate its own “golden rule” (notborrowing more than it invests over a business cycle)remains in place.
Central and Eastern EuropeNordic Outlook – February 2004
15
Good growth − but delaysin joining the euro zone� Exports are recovering
� Inflation is accelerating
� Risk of market instability in Hungary-Poland
Central and Eastern Europe have performed wellduring the economic slowdown in the West. In mostcountries, the growth slump has been mild. Domesticdemand has been fuelled by strong real wageincreases, falling interest rates, expansive fiscal policyand structural transformation.
These positive forces will continue to operate in 2004-2005, although they will diminish in strength. Realwage increases will be high but will slow somewhat.Interest rates will gradually climb, fiscal policy willtighten and the lion’s share of the privatisation processwill have been completed in most places, exceptRussia. On the other hand, exports will grow, drivenby recovering EU economies as well as depreciatingcurrencies in Poland, the Czech Republic and Hun-gary. More export-oriented growth will help easedisturbingly large current account deficits in Estonia,Latvia, the Czech Republic and Hungary.
Inflation will bottom out and climb slowly in the nextcouple of years. The upturn will occur from a verylow level in most countries. In Poland and the CzechRepublic, lower exchange rates along with theshortterm impact of poor harvests on food prices willhelp push inflation upward. For the ten countriesjoining the EU in May − eight of which are in Centraland Eastern Europe − harmonisation of indirect taxeswill also mean upward pressure on inflation. InRussia, however, we anticipate falling inflation.
Lithuania in the front ranksThe three Baltic countries will show fast GDPgrowth, with 5.4-7.2 per cent in 2004. Lithuania is thestar of the class, with higher growth and smallercurrent account deficits than in neighbouringcountries. Estonia needs to tighten its fiscal policy,due to unsustainable current account deficits and rapidcredit expansion.
We are raising our growth forecast for Russia bymore than one percentage point to 6.2 per cent thisyear; in 2005 we predict 5.5 per cent. This is largelydue to high oil prices, but also to faster-than-expectedgrowth in domestic demand. President VladimirPutin’s position was further strengthened by theDecember parliamentary election.
Putin will also win the presidential election in Marchand then resume the economic reform process. Thearrest of former Yukos oil group owner MikhailKhodorkovsky does not seem to be having more thana temporary negative impact on the willingness offoreigners to invest in Russia.
The Polish economy reported growth of 3.7 per centin 2003, after several lean years. Growth will broadenand accelerate somewhat in 2004-2005. However, thepublic budget deficit – several percentage pointsabove the Maastricht limit – triggered financialinstability last year. Poland also has problems with itsdebt ceiling. Not until next year will the governmentbegin to trim the deficits. Market confidence is fragile.If the government should fail to push through its cost-cutting plan in Parliament, interest rates will climb.We anticipate that a somewhat watered-downausterity package will be approved. Poland will jointhe euro zone in 2009-2010 at the earliest.
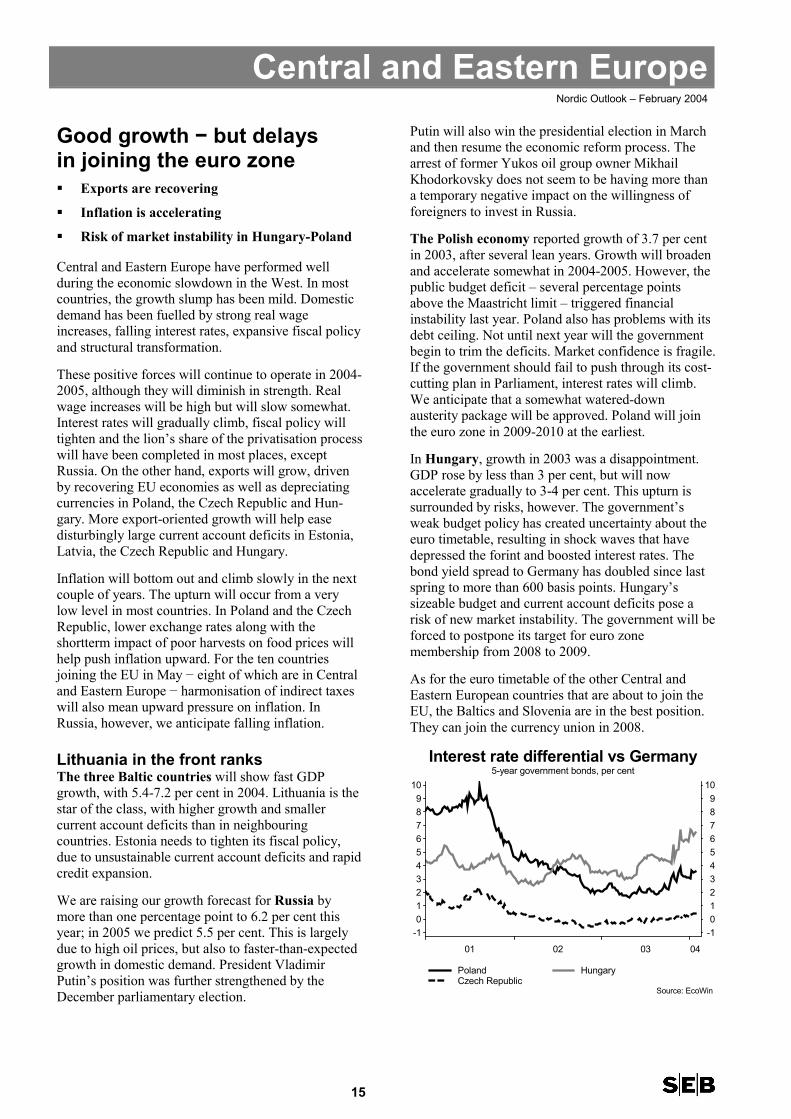
In Hungary, growth in 2003 was a disappointment.GDP rose by less than 3 per cent, but will nowaccelerate gradually to 3-4 per cent. This upturn issurrounded by risks, however. The government’sweak budget policy has created uncertainty about theeuro timetable, resulting in shock waves that havedepressed the forint and boosted interest rates. Thebond yield spread to Germany has doubled since lastspring to more than 600 basis points. Hungary’ssizeable budget and current account deficits pose arisk of new market instability. The government will beforced to postpone its target for euro zonemembership from 2008 to 2009.
As for the euro timetable of the other Central andEastern European countries that are about to join theEU, the Baltics and Slovenia are in the best position.They can join the currency union in 2008.
5-year government bonds, per centInterest rate differential vs Germany
Poland Czech Republic
Hungary
Source: EcoWin
01 02 03 04
-10123456789
10
-10123456789
10
International financial marketsNordic Outlook – February 2004
16
Weak dollar, low interest rates� Jobless growth will mean low interest rates
� Central banks keep their foot on accelerator
� Imbalances weaken dollar and squeeze ECB
Global financial markets are being driven by partlyopposing forces. Stock markets have risen strongly,propelled by hopes of a continued strong cyclicalupswing. The fixed income market, however, has notfollowed suit. Bond yields have stayed at remarkablylow levels compared to the stock market upturn. Thecrucial issue is whether – and for how long – thisdichotomy can persist. Our view is that the economicrecovery can go on for a while yet without fuellinghigher inflationary pressures in major economies. Ourmain worry as regards stock markets is therefore notinterest rates but valuations. In the foreign exchangemarket, the focus is on global imbalances − withAmerica’s large savings deficits being financed bytransfers from capital accumulation in Asia.
200019801960194019201900
50
40
30
20
10
0
50
40
30
20
10
0
Sources: Smithers & Co, BEA, Thomson Datastream
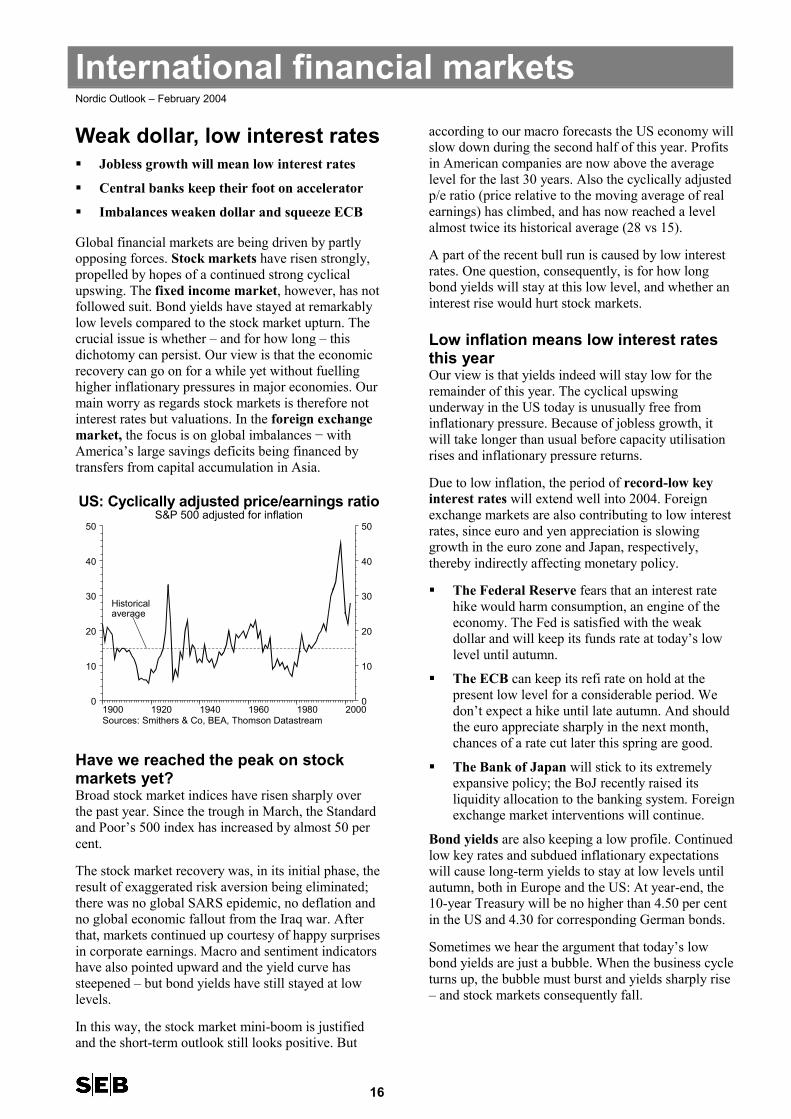
US: Cyclically adjusted price/earnings ratioS&P 500 adjusted for inflation
Historical average
Have we reached the peak on stockmarkets yet?Broad stock market indices have risen sharply overthe past year. Since the trough in March, the Standardand Poor’s 500 index has increased by almost 50 percent.
The stock market recovery was, in its initial phase, theresult of exaggerated risk aversion being eliminated;there was no global SARS epidemic, no deflation andno global economic fallout from the Iraq war. Afterthat, markets continued up courtesy of happy surprisesin corporate earnings. Macro and sentiment indicatorshave also pointed upward and the yield curve hassteepened – but bond yields have still stayed at lowlevels.
In this way, the stock market mini-boom is justifiedand the short-term outlook still looks positive. But
according to our macro forecasts the US economy willslow down during the second half of this year. Profitsin American companies are now above the averagelevel for the last 30 years. Also the cyclically adjustedp/e ratio (price relative to the moving average of realearnings) has climbed, and has now reached a levelalmost twice its historical average (28 vs 15).
A part of the recent bull run is caused by low interestrates. One question, consequently, is for how longbond yields will stay at this low level, and whether aninterest rise would hurt stock markets.
Low inflation means low interest ratesthis yearOur view is that yields indeed will stay low for theremainder of this year. The cyclical upswingunderway in the US today is unusually free frominflationary pressure. Because of jobless growth, itwill take longer than usual before capacity utilisationrises and inflationary pressure returns.
Due to low inflation, the period of record-low keyinterest rates will extend well into 2004. Foreignexchange markets are also contributing to low interestrates, since euro and yen appreciation is slowinggrowth in the euro zone and Japan, respectively,thereby indirectly affecting monetary policy.
� The Federal Reserve fears that an interest ratehike would harm consumption, an engine of theeconomy. The Fed is satisfied with the weakdollar and will keep its funds rate at today’s lowlevel until autumn.
� The ECB can keep its refi rate on hold at thepresent low level for a considerable period. Wedon’t expect a hike until late autumn. And shouldthe euro appreciate sharply in the next month,chances of a rate cut later this spring are good.
� The Bank of Japan will stick to its extremelyexpansive policy; the BoJ recently raised itsliquidity allocation to the banking system. Foreignexchange market interventions will continue.
Bond yields are also keeping a low profile. Continuedlow key rates and subdued inflationary expectationswill cause long-term yields to stay at low levels untilautumn, both in Europe and the US: At year-end, the10-year Treasury will be no higher than 4.50 per centin the US and 4.30 for corresponding German bonds.
Sometimes we hear the argument that today’s lowbond yields are just a bubble. When the business cycleturns up, the bubble must burst and yields sharply rise– and stock markets consequently fall.
International financial marketsNordic Outlook – February 2004
17
050403020100999897
7
6
5
4
3
2
1
0
7
6
5
4
3
2
1
0
Sources: EcoWin and SEB
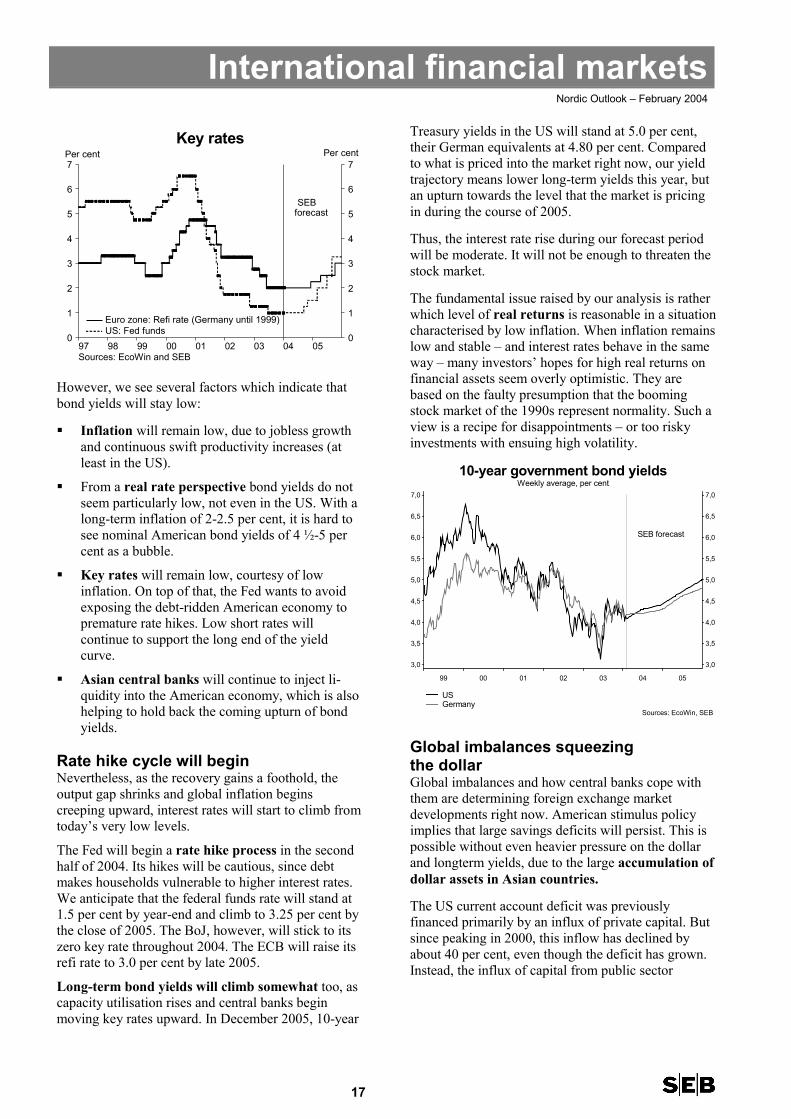
Key rates
forecast
Per cent Per cent
SEB
Euro zone: Refi rate (Germany until 1999)US: Fed funds
However, we see several factors which indicate thatbond yields will stay low:
� Inflation will remain low, due to jobless growthand continuous swift productivity increases (atleast in the US).
� From a real rate perspective bond yields do notseem particularly low, not even in the US. With along-term inflation of 2-2.5 per cent, it is hard tosee nominal American bond yields of 4 ½-5 percent as a bubble.
� Key rates will remain low, courtesy of lowinflation. On top of that, the Fed wants to avoidexposing the debt-ridden American economy topremature rate hikes. Low short rates willcontinue to support the long end of the yieldcurve.
� Asian central banks will continue to inject li-quidity into the American economy, which is alsohelping to hold back the coming upturn of bondyields.
Rate hike cycle will beginNevertheless, as the recovery gains a foothold, theoutput gap shrinks and global inflation beginscreeping upward, interest rates will start to climb fromtoday’s very low levels.
The Fed will begin a rate hike process in the secondhalf of 2004. Its hikes will be cautious, since debtmakes households vulnerable to higher interest rates.We anticipate that the federal funds rate will stand at1.5 per cent by year-end and climb to 3.25 per cent bythe close of 2005. The BoJ, however, will stick to itszero key rate throughout 2004. The ECB will raise itsrefi rate to 3.0 per cent by late 2005.
Long-term bond yields will climb somewhat too, ascapacity utilisation rises and central banks beginmoving key rates upward. In December 2005, 10-year
Treasury yields in the US will stand at 5.0 per cent,their German equivalents at 4.80 per cent. Comparedto what is priced into the market right now, our yieldtrajectory means lower long-term yields this year, butan upturn towards the level that the market is pricingin during the course of 2005.
Thus, the interest rate rise during our forecast periodwill be moderate. It will not be enough to threaten thestock market.
The fundamental issue raised by our analysis is ratherwhich level of real returns is reasonable in a situationcharacterised by low inflation. When inflation remainslow and stable – and interest rates behave in the sameway – many investors’ hopes for high real returns onfinancial assets seem overly optimistic. They arebased on the faulty presumption that the boomingstock market of the 1990s represent normality. Such aview is a recipe for disappointments – or too riskyinvestments with ensuing high volatility.
Weekly average, per cent10-year government bond yields
US Germany
Sources: EcoWin, SEB
99 00 01 02 03 04 05
3,0
3,5
4,0
4,5
5,0
5,5
6,0
6,5
7,0
3,0
3,5
4,0
4,5
5,0
5,5
6,0
6,5
7,0
SEB forecast
Global imbalances squeezingthe dollarGlobal imbalances and how central banks cope withthem are determining foreign exchange marketdevelopments right now. American stimulus policyimplies that large savings deficits will persist. This ispossible without even heavier pressure on the dollarand longterm yields, due to the large accumulation ofdollar assets in Asian countries.
The US current account deficit was previouslyfinanced primarily by an influx of private capital. Butsince peaking in 2000, this inflow has declined byabout 40 per cent, even though the deficit has grown.Instead, the influx of capital from public sector
International financial marketsNordic Outlook – February 2004
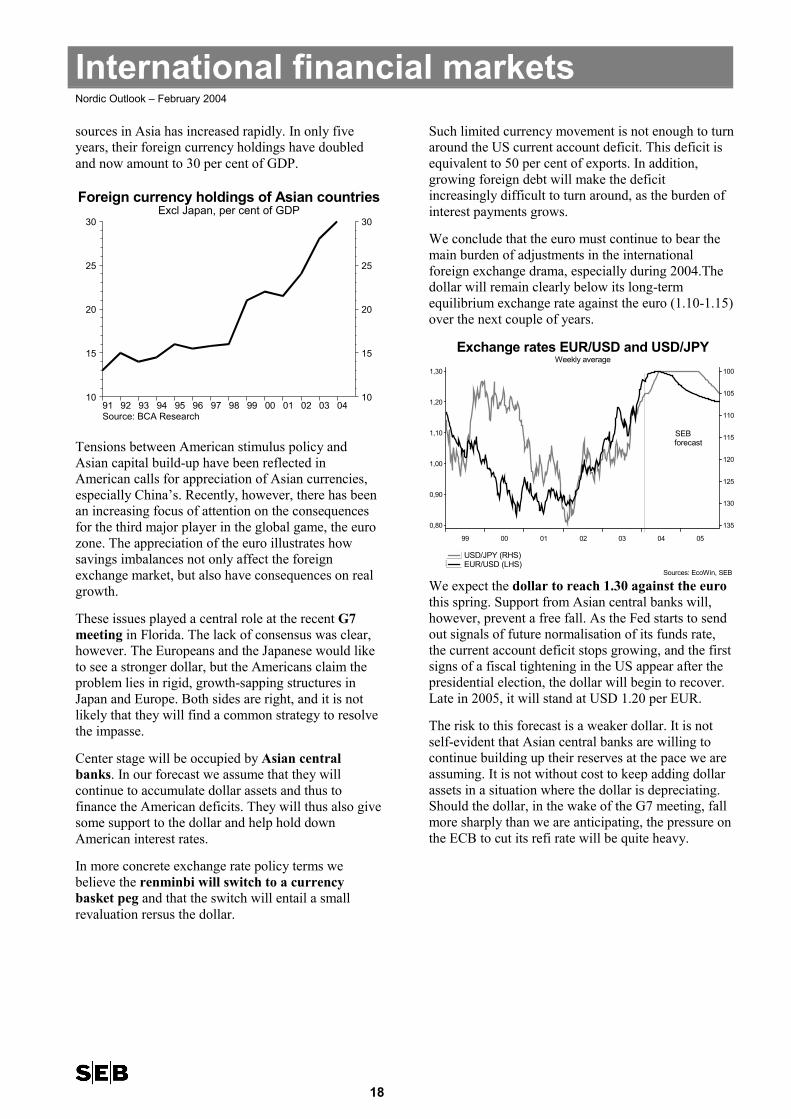
18
sources in Asia has increased rapidly. In only fiveyears, their foreign currency holdings have doubledand now amount to 30 per cent of GDP.
0403020100999897969594939291
30
25
20
15
10
30
25
20
15
10
Source: BCA Research
Foreign currency holdings of Asian countriesExcl Japan, per cent of GDP
Tensions between American stimulus policy andAsian capital build-up have been reflected inAmerican calls for appreciation of Asian currencies,especially China’s. Recently, however, there has beenan increasing focus of attention on the consequencesfor the third major player in the global game, the eurozone. The appreciation of the euro illustrates howsavings imbalances not only affect the foreignexchange market, but also have consequences on realgrowth.
These issues played a central role at the recent G7meeting in Florida. The lack of consensus was clear,however. The Europeans and the Japanese would liketo see a stronger dollar, but the Americans claim theproblem lies in rigid, growth-sapping structures inJapan and Europe. Both sides are right, and it is notlikely that they will find a common strategy to resolvethe impasse.
Center stage will be occupied by Asian centralbanks. In our forecast we assume that they willcontinue to accumulate dollar assets and thus tofinance the American deficits. They will thus also givesome support to the dollar and help hold downAmerican interest rates.
In more concrete exchange rate policy terms webelieve the renminbi will switch to a currencybasket peg and that the switch will entail a smallrevaluation rersus the dollar.
Such limited currency movement is not enough to turnaround the US current account deficit. This deficit isequivalent to 50 per cent of exports. In addition,growing foreign debt will make the deficitincreasingly difficult to turn around, as the burden ofinterest payments grows.
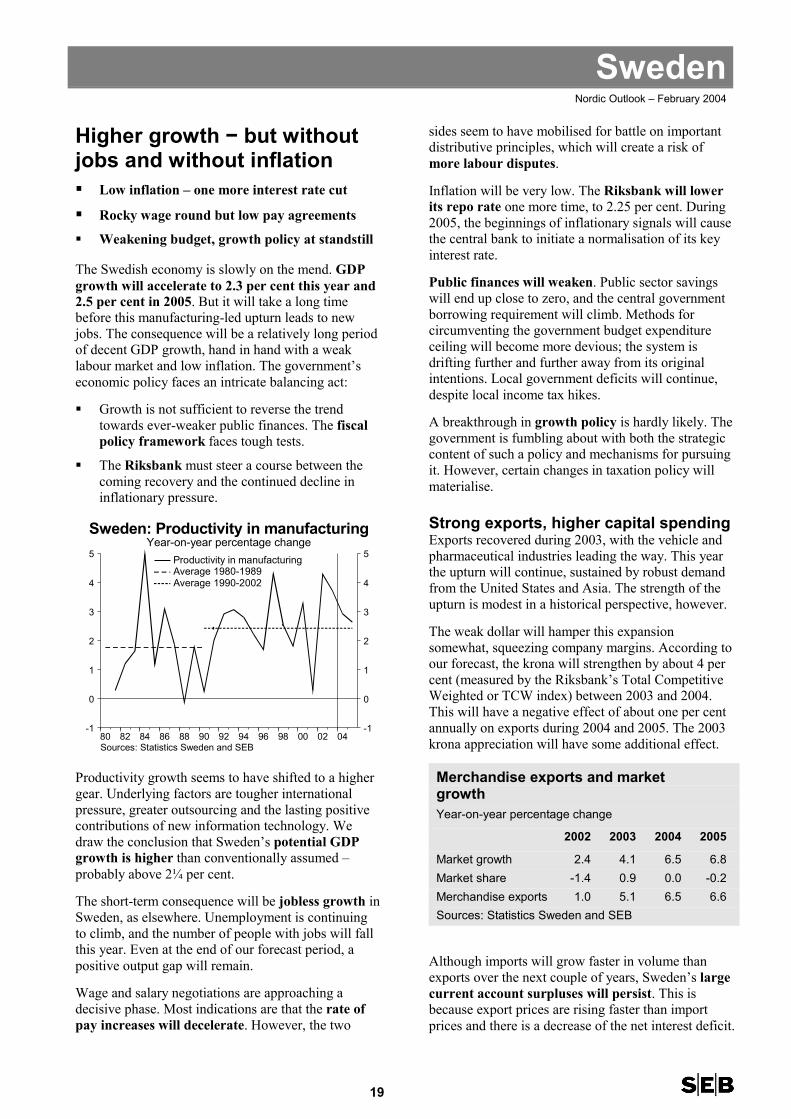
We conclude that the euro must continue to bear themain burden of adjustments in the internationalforeign exchange drama, especially during 2004.Thedollar will remain clearly below its long-termequilibrium exchange rate against the euro (1.10-1.15)over the next couple of years.
Weekly averageExchange rates EUR/USD and USD/JPY
USD/JPY (RHS) EUR/USD (LHS)
Sources: EcoWin, SEB
99 00 01 02 03 04 05
100
105
110
115
120
125
130
1350,80
0,90
1,00
1,10
1,20
1,30
SEBforecast
We expect the dollar to reach 1.30 against the eurothis spring. Support from Asian central banks will,however, prevent a free fall. As the Fed starts to sendout signals of future normalisation of its funds rate,the current account deficit stops growing, and the firstsigns of a fiscal tightening in the US appear after thepresidential election, the dollar will begin to recover.Late in 2005, it will stand at USD 1.20 per EUR.
The risk to this forecast is a weaker dollar. It is notself-evident that Asian central banks are willing tocontinue building up their reserves at the pace we areassuming. It is not without cost to keep adding dollarassets in a situation where the dollar is depreciating.Should the dollar, in the wake of the G7 meeting, fallmore sharply than we are anticipating, the pressure onthe ECB to cut its refi rate will be quite heavy.
SwedenNordic Outlook – February 2004
19
Higher growth − but withoutjobs and without inflation� Low inflation – one more interest rate cut
� Rocky wage round but low pay agreements
� Weakening budget, growth policy at standstill
The Swedish economy is slowly on the mend. GDPgrowth will accelerate to 2.3 per cent this year and2.5 per cent in 2005. But it will take a long timebefore this manufacturing-led upturn leads to newjobs. The consequence will be a relatively long periodof decent GDP growth, hand in hand with a weaklabour market and low inflation. The government’seconomic policy faces an intricate balancing act:
� Growth is not sufficient to reverse the trendtowards ever-weaker public finances. The fiscalpolicy framework faces tough tests.
� The Riksbank must steer a course between thecoming recovery and the continued decline ininflationary pressure.
04020098969492908886848280
5
4
3
2
1
0
-1
5
4
3
2
1
0
-1
Sources: Statistics Sweden and SEB
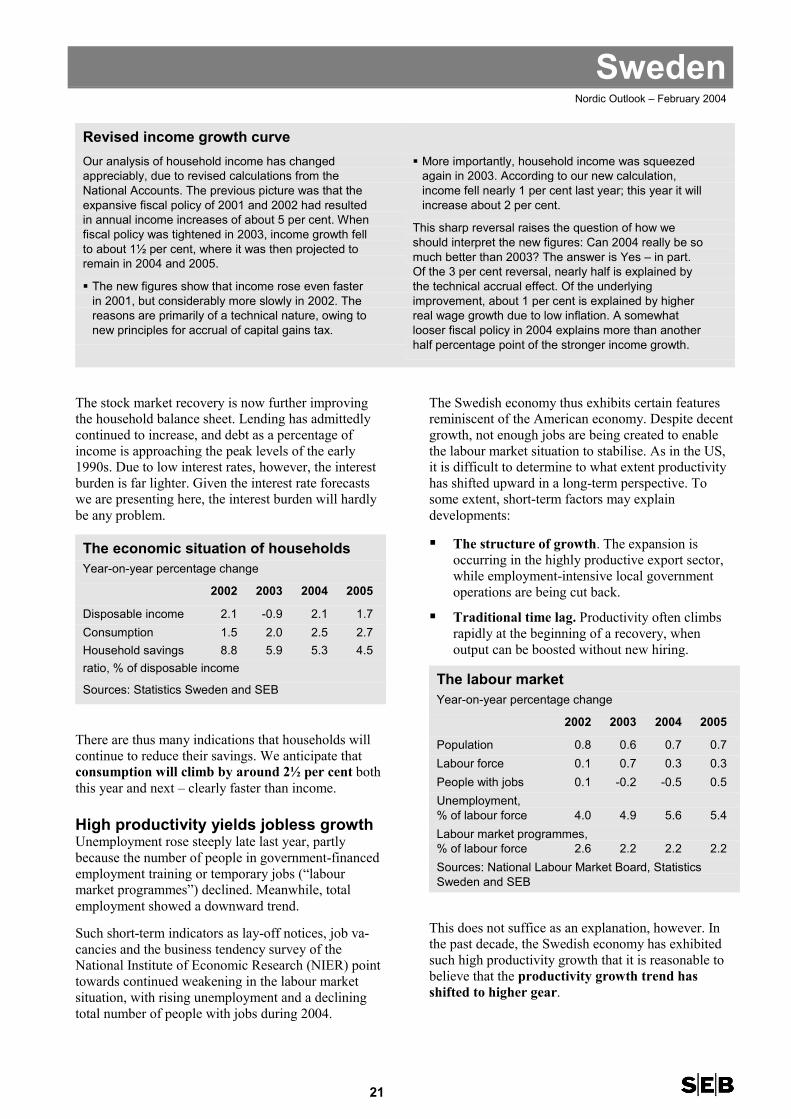
Sweden: Productivity in manufacturingYear-on-year percentage change
Productivity in manufacturingAverage 1980-1989Average 1990-2002
Productivity growth seems to have shifted to a highergear. Underlying factors are tougher internationalpressure, greater outsourcing and the lasting positivecontributions of new information technology. Wedraw the conclusion that Sweden’s potential GDPgrowth is higher than conventionally assumed –probably above 2¼ per cent.
The short-term consequence will be jobless growth inSweden, as elsewhere. Unemployment is continuingto climb, and the number of people with jobs will fallthis year. Even at the end of our forecast period, apositive output gap will remain.
Wage and salary negotiations are approaching adecisive phase. Most indications are that the rate ofpay increases will decelerate. However, the two
sides seem to have mobilised for battle on importantdistributive principles, which will create a risk ofmore labour disputes.
Inflation will be very low. The Riksbank will lowerits repo rate one more time, to 2.25 per cent. During2005, the beginnings of inflationary signals will causethe central bank to initiate a normalisation of its keyinterest rate.
Public finances will weaken. Public sector savingswill end up close to zero, and the central governmentborrowing requirement will climb. Methods forcircumventing the government budget expenditureceiling will become more devious; the system isdrifting further and further away from its originalintentions. Local government deficits will continue,despite local income tax hikes.
A breakthrough in growth policy is hardly likely. Thegovernment is fumbling about with both the strategiccontent of such a policy and mechanisms for pursuingit. However, certain changes in taxation policy willmaterialise.
Strong exports, higher capital spendingExports recovered during 2003, with the vehicle andpharmaceutical industries leading the way. This yearthe upturn will continue, sustained by robust demandfrom the United States and Asia. The strength of theupturn is modest in a historical perspective, however.
The weak dollar will hamper this expansionsomewhat, squeezing company margins. According toour forecast, the krona will strengthen by about 4 percent (measured by the Riksbank’s Total CompetitiveWeighted or TCW index) between 2003 and 2004.This will have a negative effect of about one per centannually on exports during 2004 and 2005. The 2003krona appreciation will have some additional effect.
Merchandise exports and marketgrowthYear-on-year percentage change
2002 2003 2004 2005
Market growth 2.4 4.1 6.5 6.8Market share -1.4 0.9 0.0 -0.2Merchandise exports 1.0 5.1 6.5 6.6Sources: Statistics Sweden and SEB
Although imports will grow faster in volume thanexports over the next couple of years, Sweden’s largecurrent account surpluses will persist. This isbecause export prices are rising faster than importprices and there is a decrease of the net interest deficit.
SwedenNordic Outlook – February 2004
20
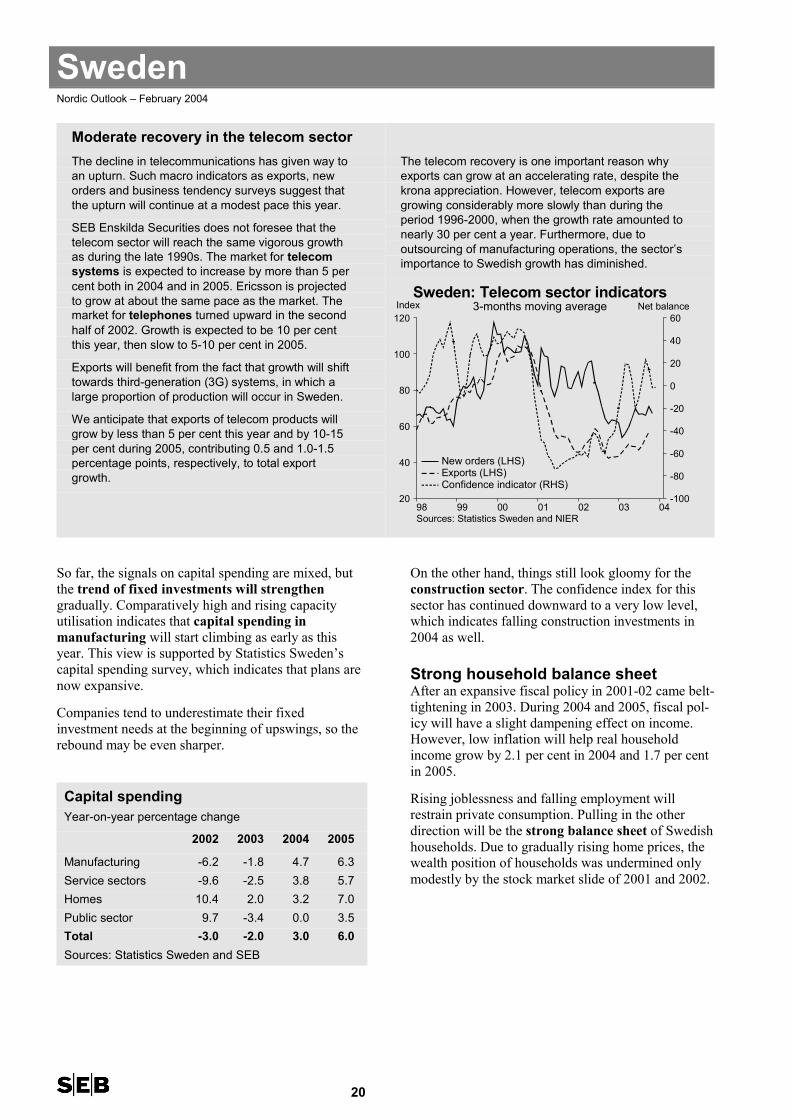
Moderate recovery in the telecom sectorThe decline in telecommunications has given way toan upturn. Such macro indicators as exports, neworders and business tendency surveys suggest thatthe upturn will continue at a modest pace this year.
SEB Enskilda Securities does not foresee that thetelecom sector will reach the same vigorous growthas during the late 1990s. The market for telecomsystems is expected to increase by more than 5 percent both in 2004 and in 2005. Ericsson is projectedto grow at about the same pace as the market. Themarket for telephones turned upward in the secondhalf of 2002. Growth is expected to be 10 per centthis year, then slow to 5-10 per cent in 2005.
Exports will benefit from the fact that growth will shifttowards third-generation (3G) systems, in which alarge proportion of production will occur in Sweden.
We anticipate that exports of telecom products willgrow by less than 5 per cent this year and by 10-15per cent during 2005, contributing 0.5 and 1.0-1.5percentage points, respectively, to total exportgrowth.
The telecom recovery is one important reason whyexports can grow at an accelerating rate, despite thekrona appreciation. However, telecom exports aregrowing considerably more slowly than during theperiod 1996-2000, when the growth rate amounted tonearly 30 per cent a year. Furthermore, due tooutsourcing of manufacturing operations, the sector’simportance to Swedish growth has diminished.
So far, the signals on capital spending are mixed, butthe trend of fixed investments will strengthengradually. Comparatively high and rising capacityutilisation indicates that capital spending inmanufacturing will start climbing as early as thisyear. This view is supported by Statistics Sweden’scapital spending survey, which indicates that plans arenow expansive.
Companies tend to underestimate their fixedinvestment needs at the beginning of upswings, so therebound may be even sharper.
Capital spendingYear-on-year percentage change
2002 2003 2004 2005
Manufacturing -6.2 -1.8 4.7 6.3Service sectors -9.6 -2.5 3.8 5.7Homes 10.4 2.0 3.2 7.0Public sector 9.7 -3.4 0.0 3.5Total -3.0 -2.0 3.0 6.0Sources: Statistics Sweden and SEB
On the other hand, things still look gloomy for theconstruction sector. The confidence index for thissector has continued downward to a very low level,which indicates falling construction investments in2004 as well.
Strong household balance sheetAfter an expansive fiscal policy in 2001-02 came belt-tightening in 2003. During 2004 and 2005, fiscal pol-icy will have a slight dampening effect on income.However, low inflation will help real householdincome grow by 2.1 per cent in 2004 and 1.7 per centin 2005.
Rising joblessness and falling employment willrestrain private consumption. Pulling in the otherdirection will be the strong balance sheet of Swedishhouseholds. Due to gradually rising home prices, thewealth position of households was undermined onlymodestly by the stock market slide of 2001 and 2002.
04030201009998
120
100
80
60
40
20
60
40
20
0
-20
-40
-60
-80
-100
Sources: Statistics Sweden and NIER
Sweden: Telecom sector indicators3-months moving averageIndex Net balance
New orders (LHS)Exports (LHS)Confidence indicator (RHS)
SwedenNordic Outlook – February 2004
21
Revised income growth curveOur analysis of household income has changedappreciably, due to revised calculations from theNational Accounts. The previous picture was that theexpansive fiscal policy of 2001 and 2002 had resultedin annual income increases of about 5 per cent. Whenfiscal policy was tightened in 2003, income growth fellto about 1½ per cent, where it was then projected toremain in 2004 and 2005.
� The new figures show that income rose even fasterin 2001, but considerably more slowly in 2002. Thereasons are primarily of a technical nature, owing tonew principles for accrual of capital gains tax.
� More importantly, household income was squeezedagain in 2003. According to our new calculation,income fell nearly 1 per cent last year; this year it willincrease about 2 per cent.
This sharp reversal raises the question of how weshould interpret the new figures: Can 2004 really be somuch better than 2003? The answer is Yes – in part.Of the 3 per cent reversal, nearly half is explained bythe technical accrual effect. Of the underlyingimprovement, about 1 per cent is explained by higherreal wage growth due to low inflation. A somewhatlooser fiscal policy in 2004 explains more than anotherhalf percentage point of the stronger income growth.
The stock market recovery is now further improvingthe household balance sheet. Lending has admittedlycontinued to increase, and debt as a percentage ofincome is approaching the peak levels of the early1990s. Due to low interest rates, however, the interestburden is far lighter. Given the interest rate forecastswe are presenting here, the interest burden will hardlybe any problem.
The economic situation of householdsYear-on-year percentage change
2002 2003 2004 2005
Disposable income 2.1 -0.9 2.1 1.7Consumption 1.5 2.0 2.5 2.7Household savings 8.8 5.9 5.3 4.5ratio, % of disposable income
Sources: Statistics Sweden and SEB
There are thus many indications that households willcontinue to reduce their savings. We anticipate thatconsumption will climb by around 2½ per cent boththis year and next – clearly faster than income.
High productivity yields jobless growthUnemployment rose steeply late last year, partlybecause the number of people in government-financedemployment training or temporary jobs (“labourmarket programmes”) declined. Meanwhile, totalemployment showed a downward trend.
Such short-term indicators as lay-off notices, job va-cancies and the business tendency survey of theNational Institute of Economic Research (NIER) pointtowards continued weakening in the labour marketsituation, with rising unemployment and a decliningtotal number of people with jobs during 2004.
The Swedish economy thus exhibits certain featuresreminiscent of the American economy. Despite decentgrowth, not enough jobs are being created to enablethe labour market situation to stabilise. As in the US,it is difficult to determine to what extent productivityhas shifted upward in a long-term perspective. Tosome extent, short-term factors may explaindevelopments:
� The structure of growth. The expansion isoccurring in the highly productive export sector,while employment-intensive local governmentoperations are being cut back.
� Traditional time lag. Productivity often climbsrapidly at the beginning of a recovery, whenoutput can be boosted without new hiring.
The labour marketYear-on-year percentage change
2002 2003 2004 2005
Population 0.8 0.6 0.7 0.7Labour force 0.1 0.7 0.3 0.3People with jobs 0.1 -0.2 -0.5 0.5Unemployment,% of labour force 4.0 4.9 5.6 5.4Labour market programmes,% of labour force 2.6 2.2 2.2 2.2Sources: National Labour Market Board, StatisticsSweden and SEB
This does not suffice as an explanation, however. Inthe past decade, the Swedish economy has exhibitedsuch high productivity growth that it is reasonable tobelieve that the productivity growth trend hasshifted to higher gear.
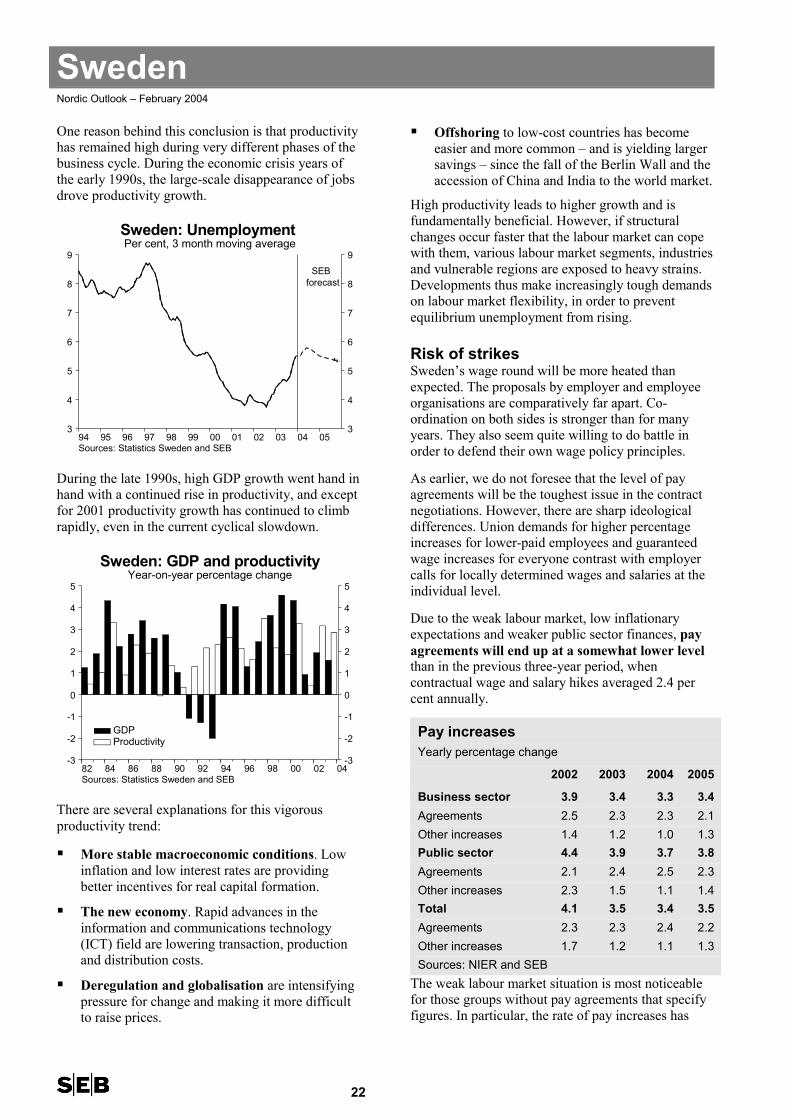
SwedenNordic Outlook – February 2004
22
One reason behind this conclusion is that productivityhas remained high during very different phases of thebusiness cycle. During the economic crisis years ofthe early 1990s, the large-scale disappearance of jobsdrove productivity growth.
050403020100999897969594
9
8
7
6
5
4
3
9
8
7
6
5
4
3
Sources: Statistics Sweden and SEB
Sweden: Unemployment Per cent, 3 month moving average
forecastSEB
During the late 1990s, high GDP growth went hand inhand with a continued rise in productivity, and exceptfor 2001 productivity growth has continued to climbrapidly, even in the current cyclical slowdown.
040200989694929088868482
5
4
3
2
1
0
-1
-2
-3
5
4
3
2
1
0
-1
-2
-3
Sources: Statistics Sweden and SEB
Sweden: GDP and productivityYear-on-year percentage change
GDPProductivity
There are several explanations for this vigorousproductivity trend:
� More stable macroeconomic conditions. Lowinflation and low interest rates are providingbetter incentives for real capital formation.
� The new economy. Rapid advances in theinformation and communications technology(ICT) field are lowering transaction, productionand distribution costs.
� Deregulation and globalisation are intensifyingpressure for change and making it more difficultto raise prices.
� Offshoring to low-cost countries has becomeeasier and more common – and is yielding largersavings – since the fall of the Berlin Wall and theaccession of China and India to the world market.
High productivity leads to higher growth and isfundamentally beneficial. However, if structuralchanges occur faster that the labour market can copewith them, various labour market segments, industriesand vulnerable regions are exposed to heavy strains.Developments thus make increasingly tough demandson labour market flexibility, in order to preventequilibrium unemployment from rising.
Risk of strikesSweden’s wage round will be more heated thanexpected. The proposals by employer and employeeorganisations are comparatively far apart. Co-ordination on both sides is stronger than for manyyears. They also seem quite willing to do battle inorder to defend their own wage policy principles.
As earlier, we do not foresee that the level of payagreements will be the toughest issue in the contractnegotiations. However, there are sharp ideologicaldifferences. Union demands for higher percentageincreases for lower-paid employees and guaranteedwage increases for everyone contrast with employercalls for locally determined wages and salaries at theindividual level.
Due to the weak labour market, low inflationaryexpectations and weaker public sector finances, payagreements will end up at a somewhat lower levelthan in the previous three-year period, whencontractual wage and salary hikes averaged 2.4 percent annually.
Pay increasesYearly percentage change
2002 2003 2004 2005
Business sector 3.9 3.4 3.3 3.4Agreements 2.5 2.3 2.3 2.1Other increases 1.4 1.2 1.0 1.3Public sector 4.4 3.9 3.7 3.8Agreements 2.1 2.4 2.5 2.3Other increases 2.3 1.5 1.1 1.4Total 4.1 3.5 3.4 3.5Agreements 2.3 2.3 2.4 2.2Other increases 1.7 1.2 1.1 1.3Sources: NIER and SEB
The weak labour market situation is most noticeablefor those groups without pay agreements that specifyfigures. In particular, the rate of pay increases has
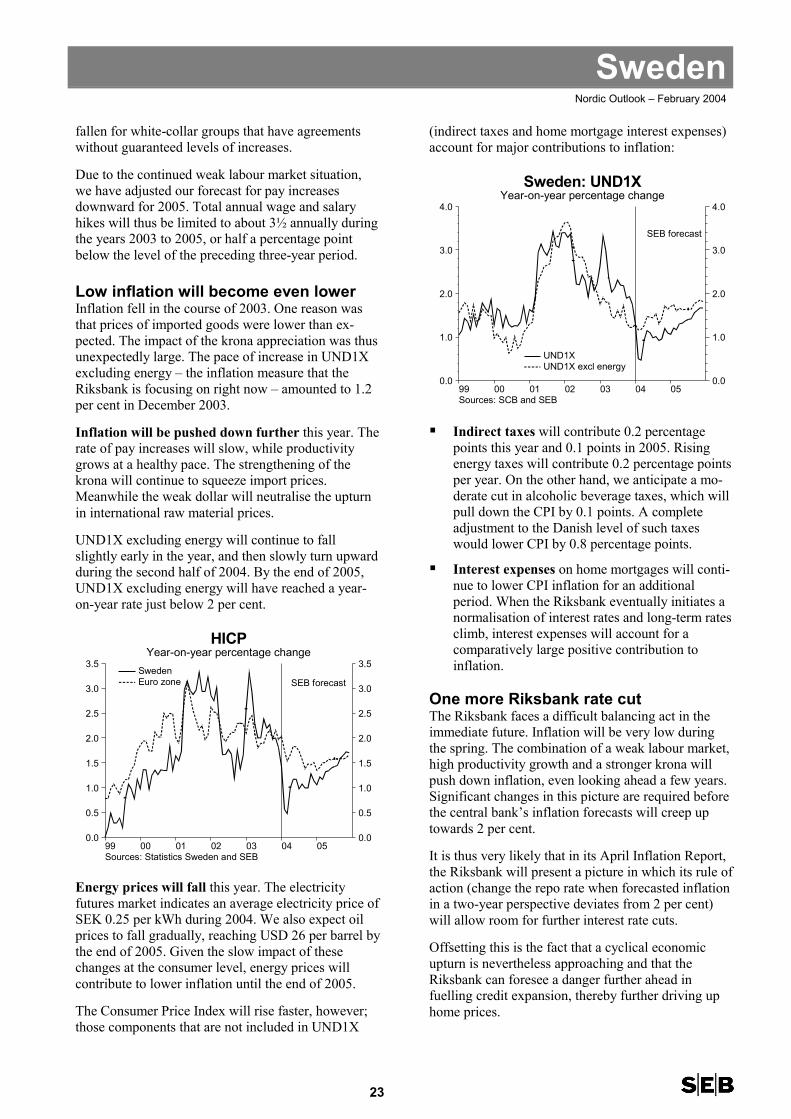
SwedenNordic Outlook – February 2004
23
fallen for white-collar groups that have agreementswithout guaranteed levels of increases.
Due to the continued weak labour market situation,we have adjusted our forecast for pay increasesdownward for 2005. Total annual wage and salaryhikes will thus be limited to about 3½ annually duringthe years 2003 to 2005, or half a percentage pointbelow the level of the preceding three-year period.
Low inflation will become even lowerInflation fell in the course of 2003. One reason wasthat prices of imported goods were lower than ex-pected. The impact of the krona appreciation was thusunexpectedly large. The pace of increase in UND1Xexcluding energy – the inflation measure that theRiksbank is focusing on right now – amounted to 1.2per cent in December 2003.
Inflation will be pushed down further this year. Therate of pay increases will slow, while productivitygrows at a healthy pace. The strengthening of thekrona will continue to squeeze import prices.Meanwhile the weak dollar will neutralise the upturnin international raw material prices.
UND1X excluding energy will continue to fallslightly early in the year, and then slowly turn upwardduring the second half of 2004. By the end of 2005,UND1X excluding energy will have reached a year-on-year rate just below 2 per cent.
05040302010099
3.5
3.0
2.5
2.0
1.5
1.0
0.5
0.0
3.5
3.0
2.5
2.0
1.5
1.0
0.5
0.0
Sources: Statistics Sweden and SEB
HICPYear-on-year percentage change
SEB forecastSwedenEuro zone
Energy prices will fall this year. The electricityfutures market indicates an average electricity price ofSEK 0.25 per kWh during 2004. We also expect oilprices to fall gradually, reaching USD 26 per barrel bythe end of 2005. Given the slow impact of thesechanges at the consumer level, energy prices willcontribute to lower inflation until the end of 2005.
The Consumer Price Index will rise faster, however;those components that are not included in UND1X
(indirect taxes and home mortgage interest expenses)account for major contributions to inflation:
05040302010099
4.0
3.0
2.0
1.0
0.0
4.0
3.0
2.0
1.0
0.0
Sources: SCB and SEB
Sweden: UND1XYear-on-year percentage change
SEB forecast
UND1XUND1X excl energy
� Indirect taxes will contribute 0.2 percentagepoints this year and 0.1 points in 2005. Risingenergy taxes will contribute 0.2 percentage pointsper year. On the other hand, we anticipate a mo-derate cut in alcoholic beverage taxes, which willpull down the CPI by 0.1 points. A completeadjustment to the Danish level of such taxeswould lower CPI by 0.8 percentage points.
� Interest expenses on home mortgages will conti-nue to lower CPI inflation for an additionalperiod. When the Riksbank eventually initiates anormalisation of interest rates and long-term ratesclimb, interest expenses will account for acomparatively large positive contribution toinflation.
One more Riksbank rate cutThe Riksbank faces a difficult balancing act in theimmediate future. Inflation will be very low duringthe spring. The combination of a weak labour market,high productivity growth and a stronger krona willpush down inflation, even looking ahead a few years.Significant changes in this picture are required beforethe central bank’s inflation forecasts will creep uptowards 2 per cent.
It is thus very likely that in its April Inflation Report,the Riksbank will present a picture in which its rule ofaction (change the repo rate when forecasted inflationin a two-year perspective deviates from 2 per cent)will allow room for further interest rate cuts.
Offsetting this is the fact that a cyclical economicupturn is nevertheless approaching and that theRiksbank can foresee a danger further ahead infuelling credit expansion, thereby further driving uphome prices.
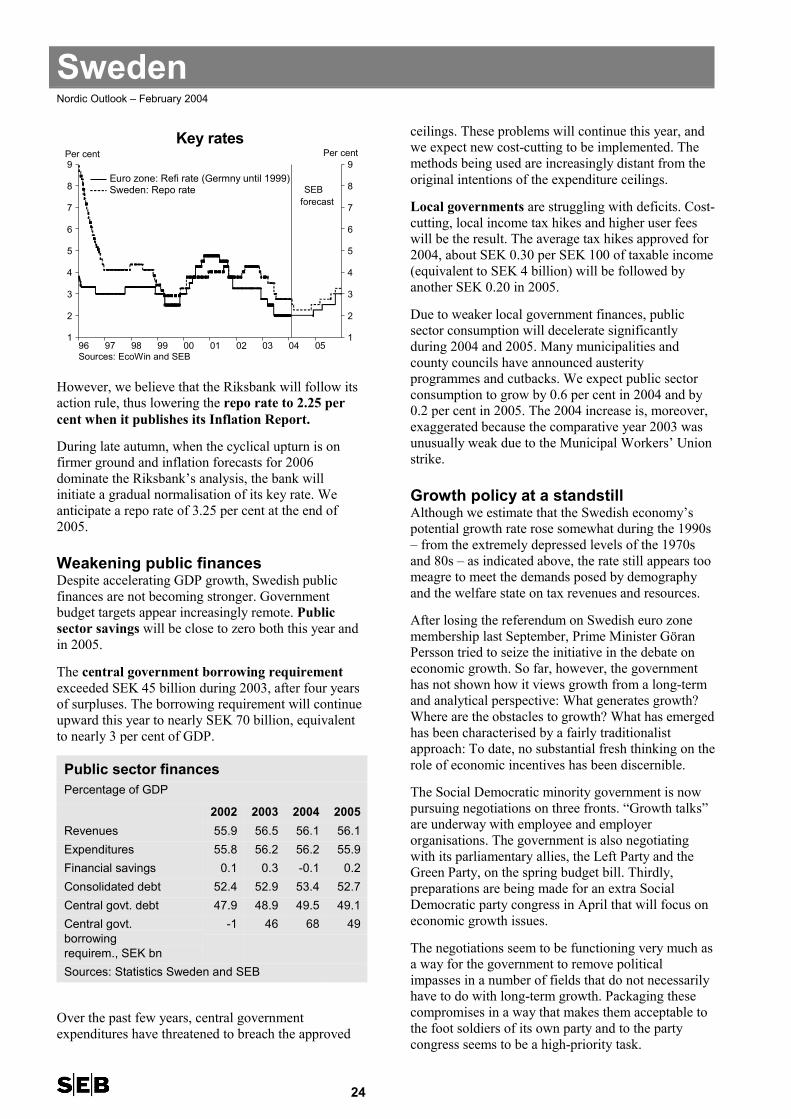
SwedenNordic Outlook – February 2004
24
05040302010099989796
9
8
7
6
5
4
3
2
1
9
8
7
6
5
4
3
2
1
Sources: EcoWin and SEB
Key rates
forecast
Per cent Per cent
SEBEuro zone: Refi rate (Germny until 1999)Sweden: Repo rate
However, we believe that the Riksbank will follow itsaction rule, thus lowering the repo rate to 2.25 percent when it publishes its Inflation Report.
During late autumn, when the cyclical upturn is onfirmer ground and inflation forecasts for 2006dominate the Riksbank’s analysis, the bank willinitiate a gradual normalisation of its key rate. Weanticipate a repo rate of 3.25 per cent at the end of2005.
Weakening public financesDespite accelerating GDP growth, Swedish publicfinances are not becoming stronger. Governmentbudget targets appear increasingly remote. Publicsector savings will be close to zero both this year andin 2005.
The central government borrowing requirementexceeded SEK 45 billion during 2003, after four yearsof surpluses. The borrowing requirement will continueupward this year to nearly SEK 70 billion, equivalentto nearly 3 per cent of GDP.
Public sector financesPercentage of GDP
2002 2003 2004 2005Revenues 55.9 56.5 56.1 56.1Expenditures 55.8 56.2 56.2 55.9Financial savings 0.1 0.3 -0.1 0.2Consolidated debt 52.4 52.9 53.4 52.7Central govt. debt 47.9 48.9 49.5 49.1Central govt.borrowingrequirem., SEK bn
-1 46 68 49
Sources: Statistics Sweden and SEB
Over the past few years, central governmentexpenditures have threatened to breach the approved
ceilings. These problems will continue this year, andwe expect new cost-cutting to be implemented. Themethods being used are increasingly distant from theoriginal intentions of the expenditure ceilings.
Local governments are struggling with deficits. Cost-cutting, local income tax hikes and higher user feeswill be the result. The average tax hikes approved for2004, about SEK 0.30 per SEK 100 of taxable income(equivalent to SEK 4 billion) will be followed byanother SEK 0.20 in 2005.
Due to weaker local government finances, publicsector consumption will decelerate significantlyduring 2004 and 2005. Many municipalities andcounty councils have announced austerityprogrammes and cutbacks. We expect public sectorconsumption to grow by 0.6 per cent in 2004 and by0.2 per cent in 2005. The 2004 increase is, moreover,exaggerated because the comparative year 2003 wasunusually weak due to the Municipal Workers’ Unionstrike.
Growth policy at a standstillAlthough we estimate that the Swedish economy’spotential growth rate rose somewhat during the 1990s– from the extremely depressed levels of the 1970sand 80s – as indicated above, the rate still appears toomeagre to meet the demands posed by demographyand the welfare state on tax revenues and resources.
After losing the referendum on Swedish euro zonemembership last September, Prime Minister GöranPersson tried to seize the initiative in the debate oneconomic growth. So far, however, the governmenthas not shown how it views growth from a long-termand analytical perspective: What generates growth?Where are the obstacles to growth? What has emergedhas been characterised by a fairly traditionalistapproach: To date, no substantial fresh thinking on therole of economic incentives has been discernible.
The Social Democratic minority government is nowpursuing negotiations on three fronts. “Growth talks”are underway with employee and employerorganisations. The government is also negotiatingwith its parliamentary allies, the Left Party and theGreen Party, on the spring budget bill. Thirdly,preparations are being made for an extra SocialDemocratic party congress in April that will focus oneconomic growth issues.
The negotiations seem to be functioning very much asa way for the government to remove politicalimpasses in a number of fields that do not necessarilyhave to do with long-term growth. Packaging thesecompromises in a way that makes them acceptable tothe foot soldiers of its own party and to the partycongress seems to be a high-priority task.
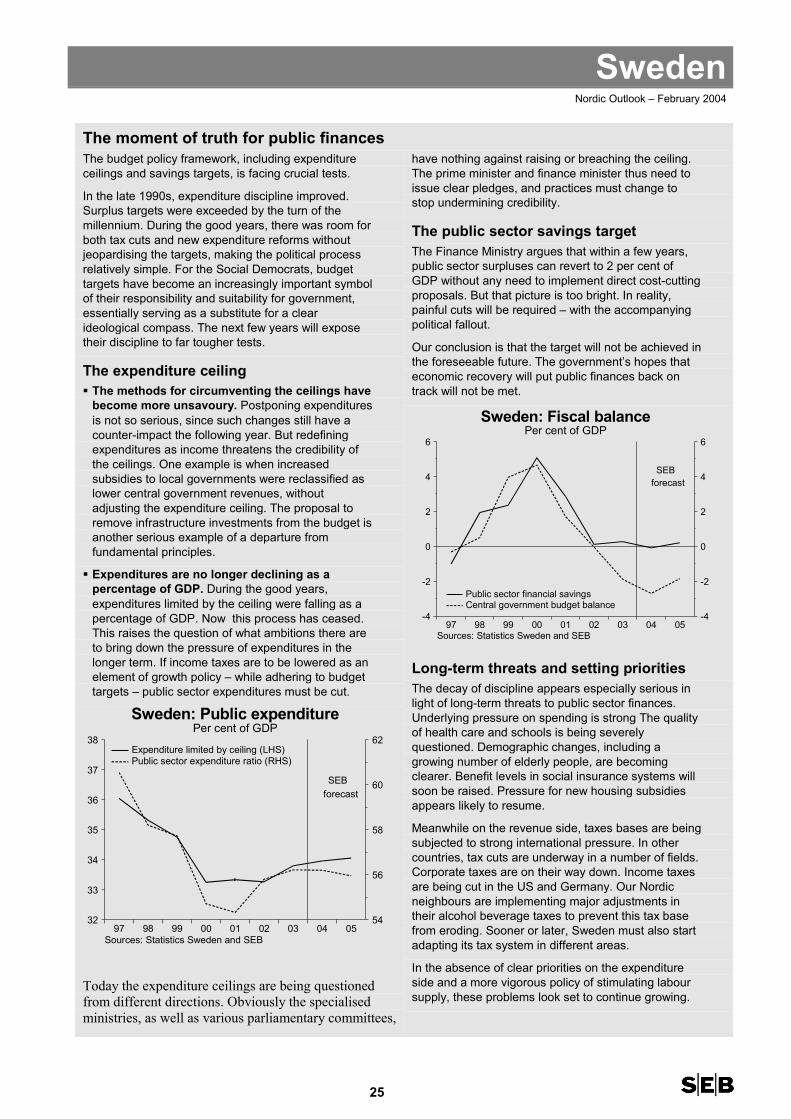
SwedenNordic Outlook – February 2004
25
The moment of truth for public financesThe budget policy framework, including expenditureceilings and savings targets, is facing crucial tests.
In the late 1990s, expenditure discipline improved.Surplus targets were exceeded by the turn of themillennium. During the good years, there was room forboth tax cuts and new expenditure reforms withoutjeopardising the targets, making the political processrelatively simple. For the Social Democrats, budgettargets have become an increasingly important symbolof their responsibility and suitability for government,essentially serving as a substitute for a clearideological compass. The next few years will exposetheir discipline to far tougher tests.
The expenditure ceiling� The methods for circumventing the ceilings have
become more unsavoury. Postponing expendituresis not so serious, since such changes still have acounter-impact the following year. But redefiningexpenditures as income threatens the credibility ofthe ceilings. One example is when increasedsubsidies to local governments were reclassified aslower central government revenues, withoutadjusting the expenditure ceiling. The proposal toremove infrastructure investments from the budget isanother serious example of a departure fromfundamental principles.
� Expenditures are no longer declining as apercentage of GDP. During the good years,expenditures limited by the ceiling were falling as apercentage of GDP. Now this process has ceased.This raises the question of what ambitions there areto bring down the pressure of expenditures in thelonger term. If income taxes are to be lowered as anelement of growth policy – while adhering to budgettargets – public sector expenditures must be cut.
Today the expenditure ceilings are being questionedfrom different directions. Obviously the specialisedministries, as well as various parliamentary committees,
have nothing against raising or breaching the ceiling.The prime minister and finance minister thus need toissue clear pledges, and practices must change tostop undermining credibility.
The public sector savings targetThe Finance Ministry argues that within a few years,public sector surpluses can revert to 2 per cent ofGDP without any need to implement direct cost-cuttingproposals. But that picture is too bright. In reality,painful cuts will be required – with the accompanyingpolitical fallout.
Our conclusion is that the target will not be achieved inthe foreseeable future. The government’s hopes thateconomic recovery will put public finances back ontrack will not be met.
Long-term threats and setting prioritiesThe decay of discipline appears especially serious inlight of long-term threats to public sector finances.Underlying pressure on spending is strong The qualityof health care and schools is being severelyquestioned. Demographic changes, including agrowing number of elderly people, are becomingclearer. Benefit levels in social insurance systems willsoon be raised. Pressure for new housing subsidiesappears likely to resume.
Meanwhile on the revenue side, taxes bases are beingsubjected to strong international pressure. In othercountries, tax cuts are underway in a number of fields.Corporate taxes are on their way down. Income taxesare being cut in the US and Germany. Our Nordicneighbours are implementing major adjustments intheir alcohol beverage taxes to prevent this tax basefrom eroding. Sooner or later, Sweden must also startadapting its tax system in different areas.
In the absence of clear priorities on the expenditureside and a more vigorous policy of stimulating laboursupply, these problems look set to continue growing.
050403020100999897
38
37
36
35
34
33
32
62
60
58
56
54
Sources: Statistics Sweden and SEB
Sweden: Public expenditurePer cent of GDP
forecastSEB
Expenditure limited by ceiling (LHS)Public sector expenditure ratio (RHS)
050403020100999897
6
4
2
0
-2
-4
6
4
2
0
-2
-4
Sources: Statistics Sweden and SEB
Sweden: Fiscal balancePer cent of GDP
forecastSEB
Public sector financial savingsCentral government budget balance
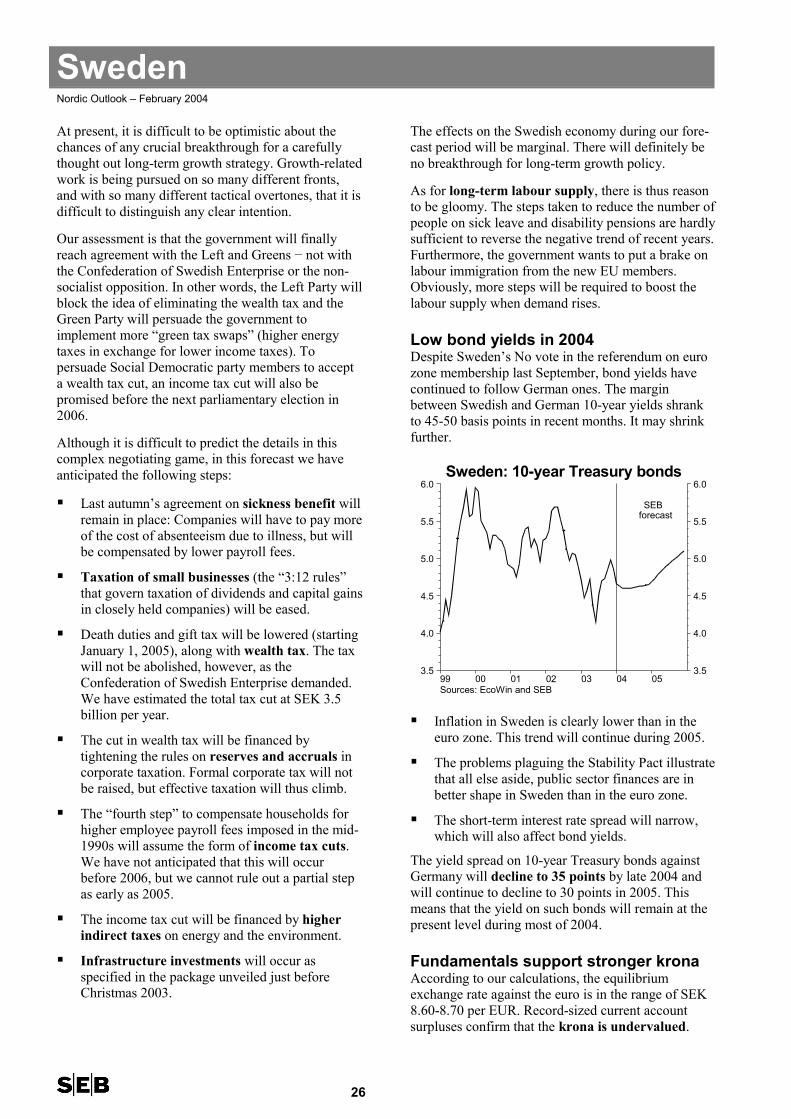
SwedenNordic Outlook – February 2004
26
At present, it is difficult to be optimistic about thechances of any crucial breakthrough for a carefullythought out long-term growth strategy. Growth-relatedwork is being pursued on so many different fronts,and with so many different tactical overtones, that it isdifficult to distinguish any clear intention.
Our assessment is that the government will finallyreach agreement with the Left and Greens − not withthe Confederation of Swedish Enterprise or the non-socialist opposition. In other words, the Left Party willblock the idea of eliminating the wealth tax and theGreen Party will persuade the government toimplement more “green tax swaps” (higher energytaxes in exchange for lower income taxes). Topersuade Social Democratic party members to accepta wealth tax cut, an income tax cut will also bepromised before the next parliamentary election in2006.
Although it is difficult to predict the details in thiscomplex negotiating game, in this forecast we haveanticipated the following steps:
� Last autumn’s agreement on sickness benefit willremain in place: Companies will have to pay moreof the cost of absenteeism due to illness, but willbe compensated by lower payroll fees.
� Taxation of small businesses (the “3:12 rules”that govern taxation of dividends and capital gainsin closely held companies) will be eased.
� Death duties and gift tax will be lowered (startingJanuary 1, 2005), along with wealth tax. The taxwill not be abolished, however, as theConfederation of Swedish Enterprise demanded.We have estimated the total tax cut at SEK 3.5billion per year.
� The cut in wealth tax will be financed bytightening the rules on reserves and accruals incorporate taxation. Formal corporate tax will notbe raised, but effective taxation will thus climb.
� The “fourth step” to compensate households forhigher employee payroll fees imposed in the mid-1990s will assume the form of income tax cuts.We have not anticipated that this will occurbefore 2006, but we cannot rule out a partial stepas early as 2005.
� The income tax cut will be financed by higherindirect taxes on energy and the environment.
� Infrastructure investments will occur asspecified in the package unveiled just beforeChristmas 2003.
The effects on the Swedish economy during our fore-cast period will be marginal. There will definitely beno breakthrough for long-term growth policy.
As for long-term labour supply, there is thus reasonto be gloomy. The steps taken to reduce the number ofpeople on sick leave and disability pensions are hardlysufficient to reverse the negative trend of recent years.Furthermore, the government wants to put a brake onlabour immigration from the new EU members.Obviously, more steps will be required to boost thelabour supply when demand rises.
Low bond yields in 2004Despite Sweden’s No vote in the referendum on eurozone membership last September, bond yields havecontinued to follow German ones. The marginbetween Swedish and German 10-year yields shrankto 45-50 basis points in recent months. It may shrinkfurther.
05040302010099
6.0
5.5
5.0
4.5
4.0
3.5
6.0
5.5
5.0
4.5
4.0
3.5
Sources: EcoWin and SEB
Sweden: 10-year Treasury bonds
forecastSEB
� Inflation in Sweden is clearly lower than in theeuro zone. This trend will continue during 2005.
� The problems plaguing the Stability Pact illustratethat all else aside, public sector finances are inbetter shape in Sweden than in the euro zone.
� The short-term interest rate spread will narrow,which will also affect bond yields.
The yield spread on 10-year Treasury bonds againstGermany will decline to 35 points by late 2004 andwill continue to decline to 30 points in 2005. Thismeans that the yield on such bonds will remain at thepresent level during most of 2004.
Fundamentals support stronger kronaAccording to our calculations, the equilibriumexchange rate against the euro is in the range of SEK8.60-8.70 per EUR. Record-sized current accountsurpluses confirm that the krona is undervalued.
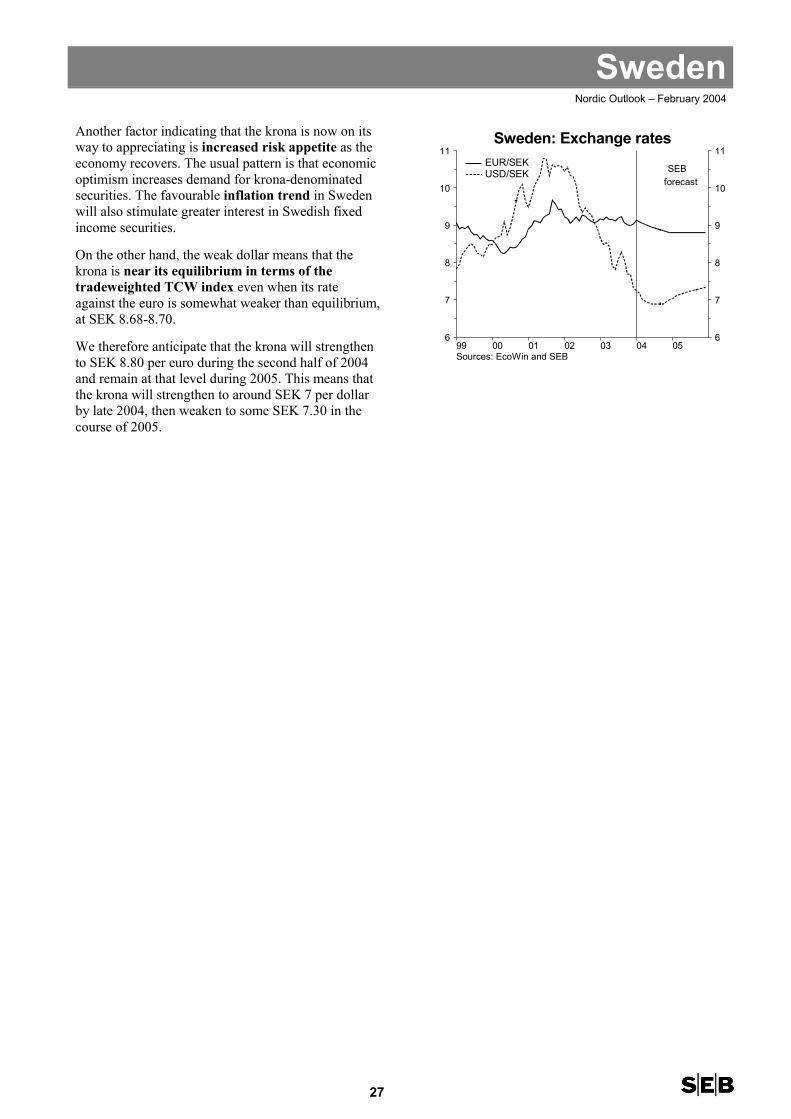
SwedenNordic Outlook – February 2004
27
Another factor indicating that the krona is now on itsway to appreciating is increased risk appetite as theeconomy recovers. The usual pattern is that economicoptimism increases demand for krona-denominatedsecurities. The favourable inflation trend in Swedenwill also stimulate greater interest in Swedish fixedincome securities.
On the other hand, the weak dollar means that thekrona is near its equilibrium in terms of thetradeweighted TCW index even when its rateagainst the euro is somewhat weaker than equilibrium,at SEK 8.68-8.70.
We therefore anticipate that the krona will strengthento SEK 8.80 per euro during the second half of 2004and remain at that level during 2005. This means thatthe krona will strengthen to around SEK 7 per dollarby late 2004, then weaken to some SEK 7.30 in thecourse of 2005.
05040302010099
11
10
9
8
7
6
11
10
9
8
7
6
Sources: EcoWin and SEB
Sweden: Exchange rates
forecastSEBEUR/SEK
USD/SEK
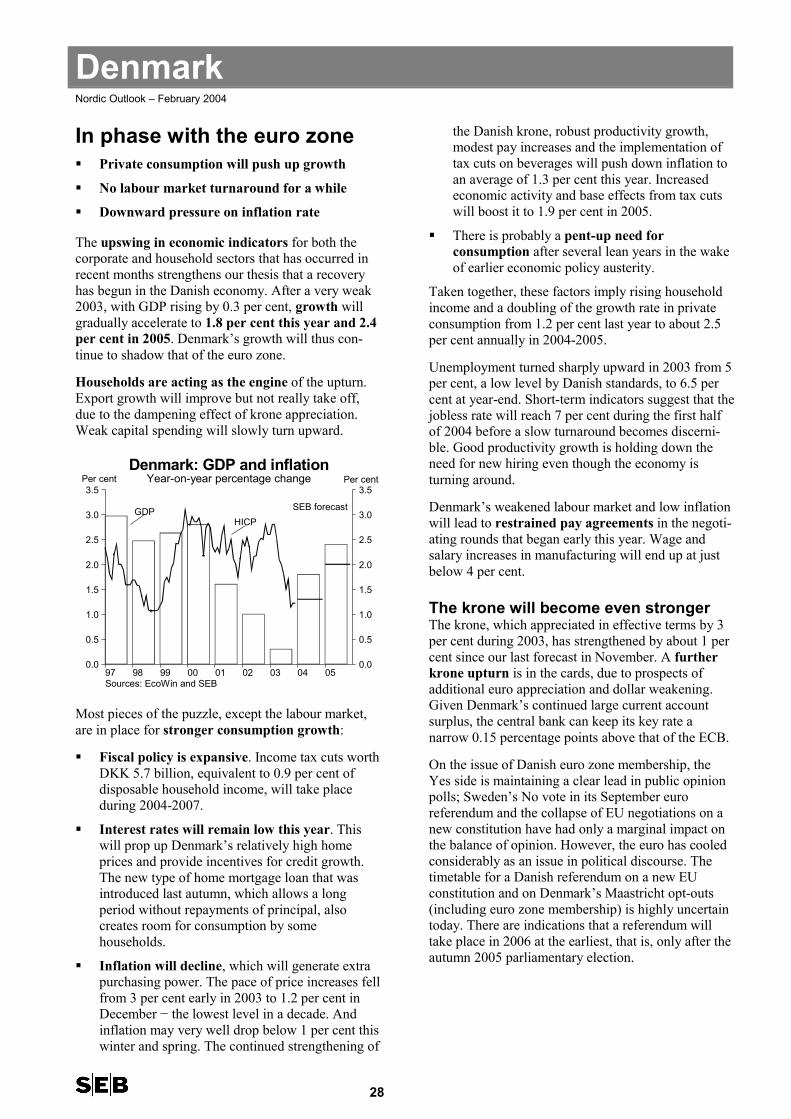
DenmarkNordic Outlook – February 2004
28
In phase with the euro zone� Private consumption will push up growth
� No labour market turnaround for a while
� Downward pressure on inflation rate
The upswing in economic indicators for both thecorporate and household sectors that has occurred inrecent months strengthens our thesis that a recoveryhas begun in the Danish economy. After a very weak2003, with GDP rising by 0.3 per cent, growth willgradually accelerate to 1.8 per cent this year and 2.4per cent in 2005. Denmark’s growth will thus con-tinue to shadow that of the euro zone.
Households are acting as the engine of the upturn.Export growth will improve but not really take off,due to the dampening effect of krone appreciation.Weak capital spending will slowly turn upward.
050403020100999897
3.5
3.0
2.5
2.0
1.5
1.0
0.5
0.0
3.5
3.0
2.5
2.0
1.5
1.0
0.5
0.0
Sources: EcoWin and SEB
Denmark: GDP and inflationYear-on-year percentage changePer cent Per cent
GDPHICP
SEB forecast
Most pieces of the puzzle, except the labour market,are in place for stronger consumption growth:
� Fiscal policy is expansive. Income tax cuts worthDKK 5.7 billion, equivalent to 0.9 per cent ofdisposable household income, will take placeduring 2004-2007.
� Interest rates will remain low this year. Thiswill prop up Denmark’s relatively high homeprices and provide incentives for credit growth.The new type of home mortgage loan that wasintroduced last autumn, which allows a longperiod without repayments of principal, alsocreates room for consumption by somehouseholds.
� Inflation will decline, which will generate extrapurchasing power. The pace of price increases fellfrom 3 per cent early in 2003 to 1.2 per cent inDecember − the lowest level in a decade. Andinflation may very well drop below 1 per cent thiswinter and spring. The continued strengthening of
the Danish krone, robust productivity growth,modest pay increases and the implementation oftax cuts on beverages will push down inflation toan average of 1.3 per cent this year. Increasedeconomic activity and base effects from tax cutswill boost it to 1.9 per cent in 2005.
� There is probably a pent-up need forconsumption after several lean years in the wakeof earlier economic policy austerity.
Taken together, these factors imply rising householdincome and a doubling of the growth rate in privateconsumption from 1.2 per cent last year to about 2.5per cent annually in 2004-2005.
Unemployment turned sharply upward in 2003 from 5per cent, a low level by Danish standards, to 6.5 percent at year-end. Short-term indicators suggest that thejobless rate will reach 7 per cent during the first halfof 2004 before a slow turnaround becomes discerni-ble. Good productivity growth is holding down theneed for new hiring even though the economy isturning around.
Denmark’s weakened labour market and low inflationwill lead to restrained pay agreements in the negoti-ating rounds that began early this year. Wage andsalary increases in manufacturing will end up at justbelow 4 per cent.
The krone will become even strongerThe krone, which appreciated in effective terms by 3per cent during 2003, has strengthened by about 1 percent since our last forecast in November. A furtherkrone upturn is in the cards, due to prospects ofadditional euro appreciation and dollar weakening.Given Denmark’s continued large current accountsurplus, the central bank can keep its key rate anarrow 0.15 percentage points above that of the ECB.
On the issue of Danish euro zone membership, theYes side is maintaining a clear lead in public opinionpolls; Sweden’s No vote in its September euroreferendum and the collapse of EU negotiations on anew constitution have had only a marginal impact onthe balance of opinion. However, the euro has cooledconsiderably as an issue in political discourse. Thetimetable for a Danish referendum on a new EUconstitution and on Denmark’s Maastricht opt-outs(including euro zone membership) is highly uncertaintoday. There are indications that a referendum willtake place in 2006 at the earliest, that is, only after theautumn 2005 parliamentary election.
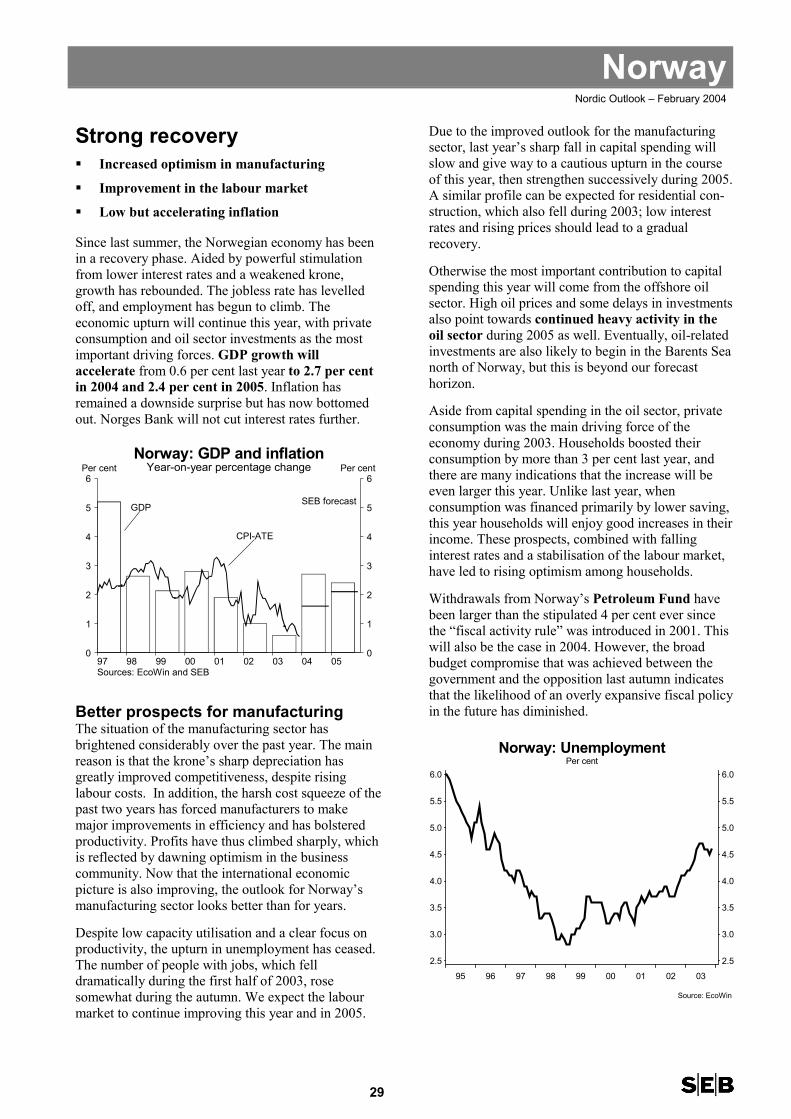
NorwayNordic Outlook – February 2004
29
Strong recovery� Increased optimism in manufacturing
� Improvement in the labour market
� Low but accelerating inflation
Since last summer, the Norwegian economy has beenin a recovery phase. Aided by powerful stimulationfrom lower interest rates and a weakened krone,growth has rebounded. The jobless rate has levelledoff, and employment has begun to climb. Theeconomic upturn will continue this year, with privateconsumption and oil sector investments as the mostimportant driving forces. GDP growth willaccelerate from 0.6 per cent last year to 2.7 per centin 2004 and 2.4 per cent in 2005. Inflation hasremained a downside surprise but has now bottomedout. Norges Bank will not cut interest rates further.
050403020100999897
6
5
4
3
2
1
0
6
5
4
3
2
1
0
Sources: EcoWin and SEB
Norway: GDP and inflationYear-on-year percentage changePer cent Per cent
GDP
CPI-ATE
SEB forecast
Better prospects for manufacturingThe situation of the manufacturing sector hasbrightened considerably over the past year. The mainreason is that the krone’s sharp depreciation hasgreatly improved competitiveness, despite risinglabour costs. In addition, the harsh cost squeeze of thepast two years has forced manufacturers to makemajor improvements in efficiency and has bolsteredproductivity. Profits have thus climbed sharply, whichis reflected by dawning optimism in the businesscommunity. Now that the international economicpicture is also improving, the outlook for Norway’smanufacturing sector looks better than for years.
Despite low capacity utilisation and a clear focus onproductivity, the upturn in unemployment has ceased.The number of people with jobs, which felldramatically during the first half of 2003, rosesomewhat during the autumn. We expect the labourmarket to continue improving this year and in 2005.
Due to the improved outlook for the manufacturingsector, last year’s sharp fall in capital spending willslow and give way to a cautious upturn in the courseof this year, then strengthen successively during 2005.A similar profile can be expected for residential con-struction, which also fell during 2003; low interestrates and rising prices should lead to a gradualrecovery.
Otherwise the most important contribution to capitalspending this year will come from the offshore oilsector. High oil prices and some delays in investmentsalso point towards continued heavy activity in theoil sector during 2005 as well. Eventually, oil-relatedinvestments are also likely to begin in the Barents Seanorth of Norway, but this is beyond our forecasthorizon.
Aside from capital spending in the oil sector, privateconsumption was the main driving force of theeconomy during 2003. Households boosted theirconsumption by more than 3 per cent last year, andthere are many indications that the increase will beeven larger this year. Unlike last year, whenconsumption was financed primarily by lower saving,this year households will enjoy good increases in theirincome. These prospects, combined with fallinginterest rates and a stabilisation of the labour market,have led to rising optimism among households.
Withdrawals from Norway’s Petroleum Fund havebeen larger than the stipulated 4 per cent ever sincethe “fiscal activity rule” was introduced in 2001. Thiswill also be the case in 2004. However, the broadbudget compromise that was achieved between thegovernment and the opposition last autumn indicatesthat the likelihood of an overly expansive fiscal policyin the future has diminished.
Per centNorway: Unemployment
Source: EcoWin
95 96 97 98 99 00 01 02 03
2.5
3.0
3.5
4.0
4.5
5.0
5.5
6.0
2.5
3.0
3.5
4.0
4.5
5.0
5.5
6.0
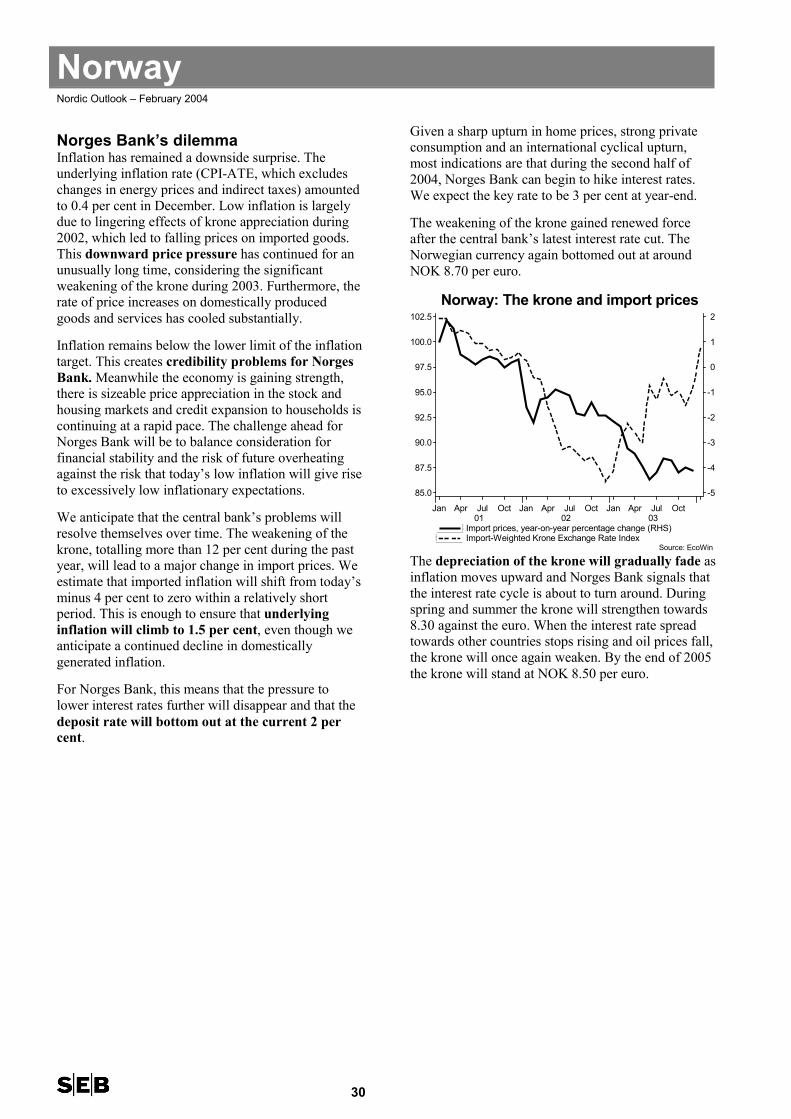
NorwayNordic Outlook – February 2004
30
Norges Bank’s dilemmaInflation has remained a downside surprise. Theunderlying inflation rate (CPI-ATE, which excludeschanges in energy prices and indirect taxes) amountedto 0.4 per cent in December. Low inflation is largelydue to lingering effects of krone appreciation during2002, which led to falling prices on imported goods.This downward price pressure has continued for anunusually long time, considering the significantweakening of the krone during 2003. Furthermore, therate of price increases on domestically producedgoods and services has cooled substantially.
Inflation remains below the lower limit of the inflationtarget. This creates credibility problems for NorgesBank. Meanwhile the economy is gaining strength,there is sizeable price appreciation in the stock andhousing markets and credit expansion to households iscontinuing at a rapid pace. The challenge ahead forNorges Bank will be to balance consideration forfinancial stability and the risk of future overheatingagainst the risk that today’s low inflation will give riseto excessively low inflationary expectations.
We anticipate that the central bank’s problems willresolve themselves over time. The weakening of thekrone, totalling more than 12 per cent during the pastyear, will lead to a major change in import prices. Weestimate that imported inflation will shift from today’sminus 4 per cent to zero within a relatively shortperiod. This is enough to ensure that underlyinginflation will climb to 1.5 per cent, even though weanticipate a continued decline in domesticallygenerated inflation.
For Norges Bank, this means that the pressure tolower interest rates further will disappear and that thedeposit rate will bottom out at the current 2 percent.
Given a sharp upturn in home prices, strong privateconsumption and an international cyclical upturn,most indications are that during the second half of2004, Norges Bank can begin to hike interest rates.We expect the key rate to be 3 per cent at year-end.
The weakening of the krone gained renewed forceafter the central bank’s latest interest rate cut. TheNorwegian currency again bottomed out at aroundNOK 8.70 per euro.
Norway: The krone and import prices
Import prices, year-on-year percentage change (RHS) Import-Weighted Krone Exchange Rate Index
Source: EcoWin
Jan Apr Jul Oct Jan Apr Jul Oct Jan Apr Jul Oct01 02 03
-5
-4
-3
-2
-1
0
1
2
85.0
87.5
90.0
92.5
95.0
97.5
100.0
102.5
The depreciation of the krone will gradually fade asinflation moves upward and Norges Bank signals thatthe interest rate cycle is about to turn around. Duringspring and summer the krone will strengthen towards8.30 against the euro. When the interest rate spreadtowards other countries stops rising and oil prices fall,the krone will once again weaken. By the end of 2005the krone will stand at NOK 8.50 per euro.
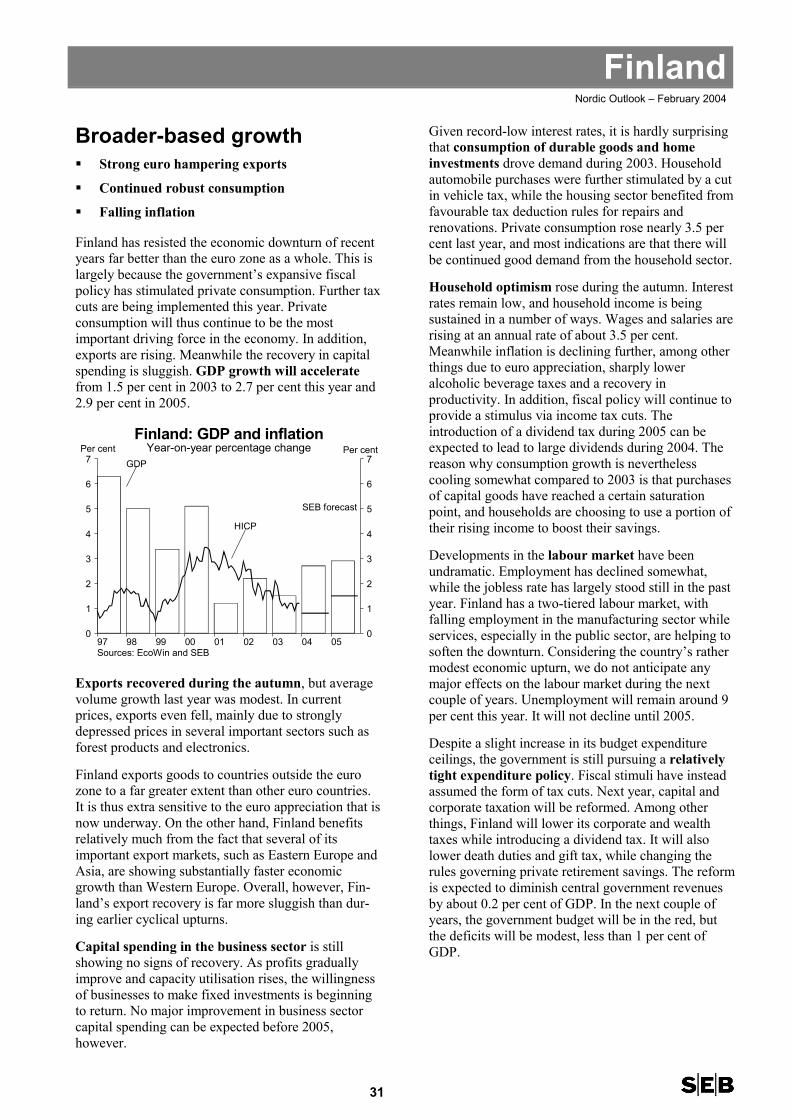
FinlandNordic Outlook – February 2004
31
Broader-based growth� Strong euro hampering exports
� Continued robust consumption
� Falling inflation
Finland has resisted the economic downturn of recentyears far better than the euro zone as a whole. This islargely because the government’s expansive fiscalpolicy has stimulated private consumption. Further taxcuts are being implemented this year. Privateconsumption will thus continue to be the mostimportant driving force in the economy. In addition,exports are rising. Meanwhile the recovery in capitalspending is sluggish. GDP growth will acceleratefrom 1.5 per cent in 2003 to 2.7 per cent this year and2.9 per cent in 2005.
050403020100999897
7
6
5
4
3
2
1
0
7
6
5
4
3
2
1
0
Sources: EcoWin and SEB
Finland: GDP and inflationYear-on-year percentage changePer cent Per cent
GDP
HICP
SEB forecast
Exports recovered during the autumn, but averagevolume growth last year was modest. In currentprices, exports even fell, mainly due to stronglydepressed prices in several important sectors such asforest products and electronics.
Finland exports goods to countries outside the eurozone to a far greater extent than other euro countries.It is thus extra sensitive to the euro appreciation that isnow underway. On the other hand, Finland benefitsrelatively much from the fact that several of itsimportant export markets, such as Eastern Europe andAsia, are showing substantially faster economicgrowth than Western Europe. Overall, however, Fin-land’s export recovery is far more sluggish than dur-ing earlier cyclical upturns.
Capital spending in the business sector is stillshowing no signs of recovery. As profits graduallyimprove and capacity utilisation rises, the willingnessof businesses to make fixed investments is beginningto return. No major improvement in business sectorcapital spending can be expected before 2005,however.
Given record-low interest rates, it is hardly surprisingthat consumption of durable goods and homeinvestments drove demand during 2003. Householdautomobile purchases were further stimulated by a cutin vehicle tax, while the housing sector benefited fromfavourable tax deduction rules for repairs andrenovations. Private consumption rose nearly 3.5 percent last year, and most indications are that there willbe continued good demand from the household sector.
Household optimism rose during the autumn. Interestrates remain low, and household income is beingsustained in a number of ways. Wages and salaries arerising at an annual rate of about 3.5 per cent.Meanwhile inflation is declining further, among otherthings due to euro appreciation, sharply loweralcoholic beverage taxes and a recovery inproductivity. In addition, fiscal policy will continue toprovide a stimulus via income tax cuts. Theintroduction of a dividend tax during 2005 can beexpected to lead to large dividends during 2004. Thereason why consumption growth is neverthelesscooling somewhat compared to 2003 is that purchasesof capital goods have reached a certain saturationpoint, and households are choosing to use a portion oftheir rising income to boost their savings.
Developments in the labour market have beenundramatic. Employment has declined somewhat,while the jobless rate has largely stood still in the pastyear. Finland has a two-tiered labour market, withfalling employment in the manufacturing sector whileservices, especially in the public sector, are helping tosoften the downturn. Considering the country’s rathermodest economic upturn, we do not anticipate anymajor effects on the labour market during the nextcouple of years. Unemployment will remain around 9per cent this year. It will not decline until 2005.
Despite a slight increase in its budget expenditureceilings, the government is still pursuing a relativelytight expenditure policy. Fiscal stimuli have insteadassumed the form of tax cuts. Next year, capital andcorporate taxation will be reformed. Among otherthings, Finland will lower its corporate and wealthtaxes while introducing a dividend tax. It will alsolower death duties and gift tax, while changing therules governing private retirement savings. The reformis expected to diminish central government revenuesby about 0.2 per cent of GDP. In the next couple ofyears, the government budget will be in the red, butthe deficits will be modest, less than 1 per cent ofGDP.
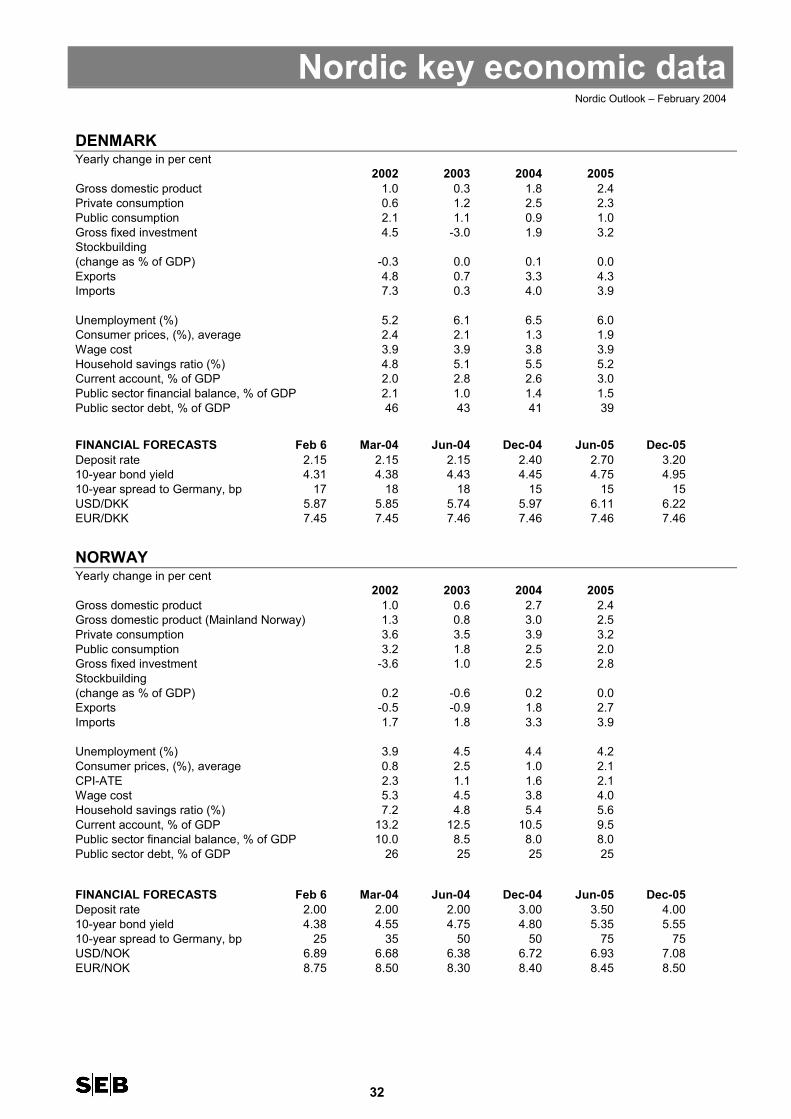
Nordic key economic dataNordic Outlook – February 2004
32
DENMARKYearly change in per cent
2002 2003 2004 2005Gross domestic product 1.0 0.3 1.8 2.4Private consumption 0.6 1.2 2.5 2.3Public consumption 2.1 1.1 0.9 1.0Gross fixed investment 4.5 -3.0 1.9 3.2Stockbuilding(change as % of GDP) -0.3 0.0 0.1 0.0Exports 4.8 0.7 3.3 4.3Imports 7.3 0.3 4.0 3.9
Unemployment (%) 5.2 6.1 6.5 6.0Consumer prices, (%), average 2.4 2.1 1.3 1.9Wage cost 3.9 3.9 3.8 3.9Household savings ratio (%) 4.8 5.1 5.5 5.2Current account, % of GDP 2.0 2.8 2.6 3.0Public sector financial balance, % of GDP 2.1 1.0 1.4 1.5Public sector debt, % of GDP 46 43 41 39
FINANCIAL FORECASTS Feb 6 Mar-04 Jun-04 Dec-04 Jun-05 Dec-05Deposit rate 2.15 2.15 2.15 2.40 2.70 3.2010-year bond yield 4.31 4.38 4.43 4.45 4.75 4.9510-year spread to Germany, bp 17 18 18 15 15 15USD/DKK 5.87 5.85 5.74 5.97 6.11 6.22EUR/DKK 7.45 7.45 7.46 7.46 7.46 7.46
NORWAYYearly change in per cent
2002 2003 2004 2005Gross domestic product 1.0 0.6 2.7 2.4Gross domestic product (Mainland Norway) 1.3 0.8 3.0 2.5Private consumption 3.6 3.5 3.9 3.2Public consumption 3.2 1.8 2.5 2.0Gross fixed investment -3.6 1.0 2.5 2.8Stockbuilding(change as % of GDP) 0.2 -0.6 0.2 0.0Exports -0.5 -0.9 1.8 2.7Imports 1.7 1.8 3.3 3.9
Unemployment (%) 3.9 4.5 4.4 4.2Consumer prices, (%), average 0.8 2.5 1.0 2.1CPI-ATE 2.3 1.1 1.6 2.1Wage cost 5.3 4.5 3.8 4.0Household savings ratio (%) 7.2 4.8 5.4 5.6Current account, % of GDP 13.2 12.5 10.5 9.5Public sector financial balance, % of GDP 10.0 8.5 8.0 8.0Public sector debt, % of GDP 26 25 25 25
FINANCIAL FORECASTS Feb 6 Mar-04 Jun-04 Dec-04 Jun-05 Dec-05Deposit rate 2.00 2.00 2.00 3.00 3.50 4.0010-year bond yield 4.38 4.55 4.75 4.80 5.35 5.5510-year spread to Germany, bp 25 35 50 50 75 75USD/NOK 6.89 6.68 6.38 6.72 6.93 7.08EUR/NOK 8.75 8.50 8.30 8.40 8.45 8.50
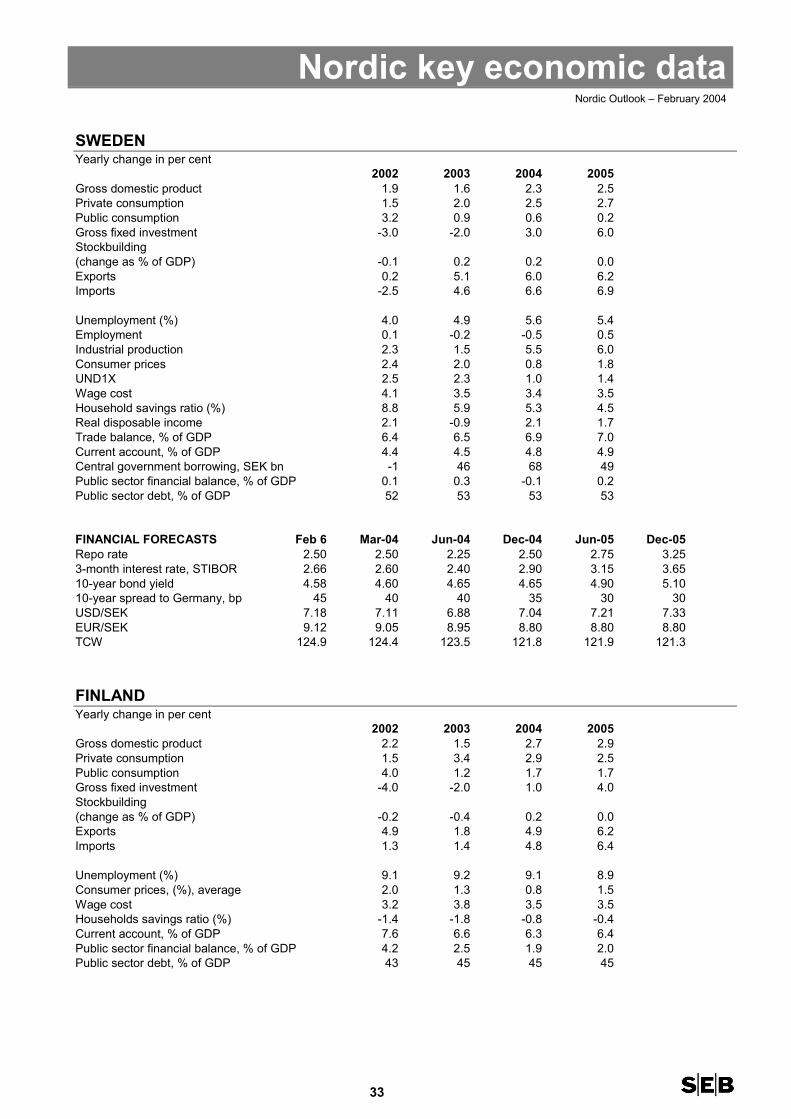
Nordic key economic dataNordic Outlook – February 2004
33
SWEDENYearly change in per cent
2002 2003 2004 2005Gross domestic product 1.9 1.6 2.3 2.5Private consumption 1.5 2.0 2.5 2.7Public consumption 3.2 0.9 0.6 0.2Gross fixed investment -3.0 -2.0 3.0 6.0Stockbuilding(change as % of GDP) -0.1 0.2 0.2 0.0Exports 0.2 5.1 6.0 6.2Imports -2.5 4.6 6.6 6.9
Unemployment (%) 4.0 4.9 5.6 5.4Employment 0.1 -0.2 -0.5 0.5Industrial production 2.3 1.5 5.5 6.0Consumer prices 2.4 2.0 0.8 1.8UND1X 2.5 2.3 1.0 1.4Wage cost 4.1 3.5 3.4 3.5Household savings ratio (%) 8.8 5.9 5.3 4.5Real disposable income 2.1 -0.9 2.1 1.7Trade balance, % of GDP 6.4 6.5 6.9 7.0Current account, % of GDP 4.4 4.5 4.8 4.9Central government borrowing, SEK bn -1 46 68 49Public sector financial balance, % of GDP 0.1 0.3 -0.1 0.2Public sector debt, % of GDP 52 53 53 53
FINANCIAL FORECASTS Feb 6 Mar-04 Jun-04 Dec-04 Jun-05 Dec-05Repo rate 2.50 2.50 2.25 2.50 2.75 3.253-month interest rate, STIBOR 2.66 2.60 2.40 2.90 3.15 3.6510-year bond yield 4.58 4.60 4.65 4.65 4.90 5.1010-year spread to Germany, bp 45 40 40 35 30 30USD/SEK 7.18 7.11 6.88 7.04 7.21 7.33EUR/SEK 9.12 9.05 8.95 8.80 8.80 8.80TCW 124.9 124.4 123.5 121.8 121.9 121.3
FINLANDYearly change in per cent
2002 2003 2004 2005Gross domestic product 2.2 1.5 2.7 2.9Private consumption 1.5 3.4 2.9 2.5Public consumption 4.0 1.2 1.7 1.7Gross fixed investment -4.0 -2.0 1.0 4.0Stockbuilding(change as % of GDP) -0.2 -0.4 0.2 0.0Exports 4.9 1.8 4.9 6.2Imports 1.3 1.4 4.8 6.4
Unemployment (%) 9.1 9.2 9.1 8.9Consumer prices, (%), average 2.0 1.3 0.8 1.5Wage cost 3.2 3.8 3.5 3.5Households savings ratio (%) -1.4 -1.8 -0.8 -0.4Current account, % of GDP 7.6 6.6 6.3 6.4Public sector financial balance, % of GDP 4.2 2.5 1.9 2.0Public sector debt, % of GDP 43 45 45 45
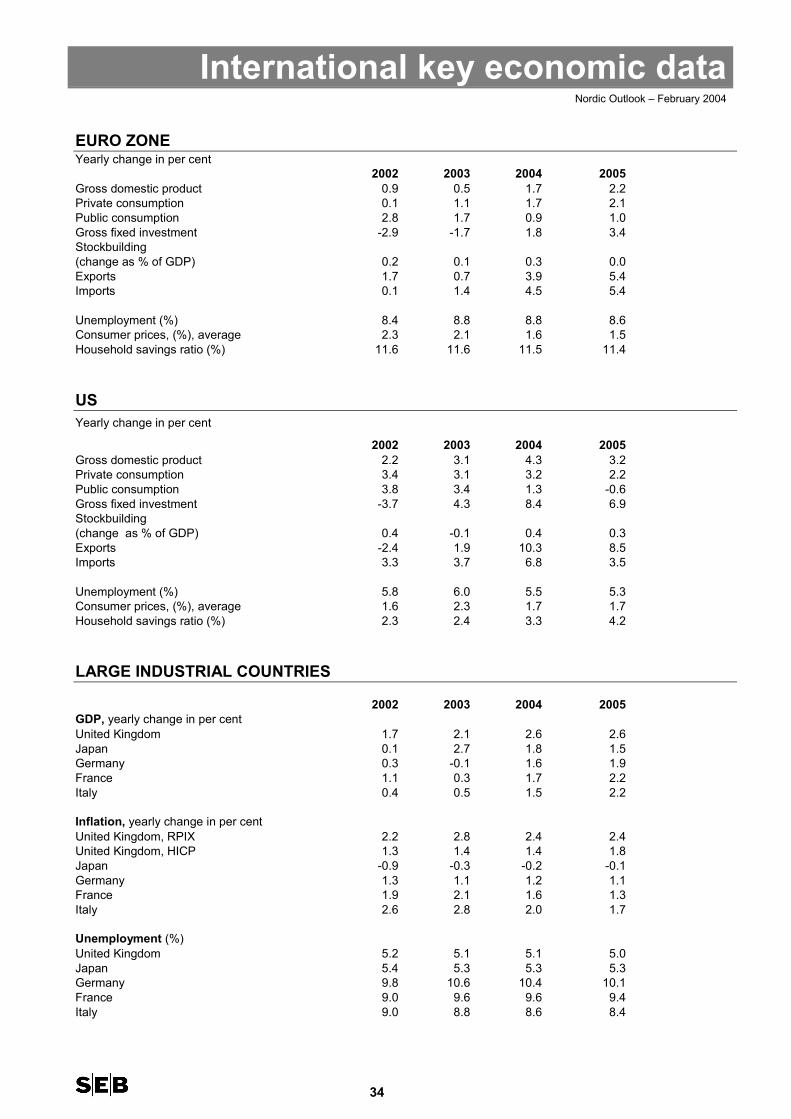
International key economic dataNordic Outlook – February 2004
34
EURO ZONEYearly change in per cent
2002 2003 2004 2005Gross domestic product 0.9 0.5 1.7 2.2Private consumption 0.1 1.1 1.7 2.1Public consumption 2.8 1.7 0.9 1.0Gross fixed investment -2.9 -1.7 1.8 3.4Stockbuilding(change as % of GDP) 0.2 0.1 0.3 0.0Exports 1.7 0.7 3.9 5.4Imports 0.1 1.4 4.5 5.4
Unemployment (%) 8.4 8.8 8.8 8.6Consumer prices, (%), average 2.3 2.1 1.6 1.5Household savings ratio (%) 11.6 11.6 11.5 11.4
USYearly change in per cent
2002 2003 2004 2005Gross domestic product 2.2 3.1 4.3 3.2Private consumption 3.4 3.1 3.2 2.2Public consumption 3.8 3.4 1.3 -0.6Gross fixed investment -3.7 4.3 8.4 6.9Stockbuilding(change as % of GDP) 0.4 -0.1 0.4 0.3Exports -2.4 1.9 10.3 8.5Imports 3.3 3.7 6.8 3.5
Unemployment (%) 5.8 6.0 5.5 5.3Consumer prices, (%), average 1.6 2.3 1.7 1.7Household savings ratio (%) 2.3 2.4 3.3 4.2
LARGE INDUSTRIAL COUNTRIES
2002 2003 2004 2005GDP, yearly change in per centUnited Kingdom 1.7 2.1 2.6 2.6Japan 0.1 2.7 1.8 1.5Germany 0.3 -0.1 1.6 1.9France 1.1 0.3 1.7 2.2Italy 0.4 0.5 1.5 2.2
Inflation, yearly change in per centUnited Kingdom, RPIX 2.2 2.8 2.4 2.4United Kingdom, HICP 1.3 1.4 1.4 1.8Japan -0.9 -0.3 -0.2 -0.1Germany 1.3 1.1 1.2 1.1France 1.9 2.1 1.6 1.3Italy 2.6 2.8 2.0 1.7
Unemployment (%)United Kingdom 5.2 5.1 5.1 5.0Japan 5.4 5.3 5.3 5.3Germany 9.8 10.6 10.4 10.1France 9.0 9.6 9.6 9.4Italy 9.0 8.8 8.6 8.4
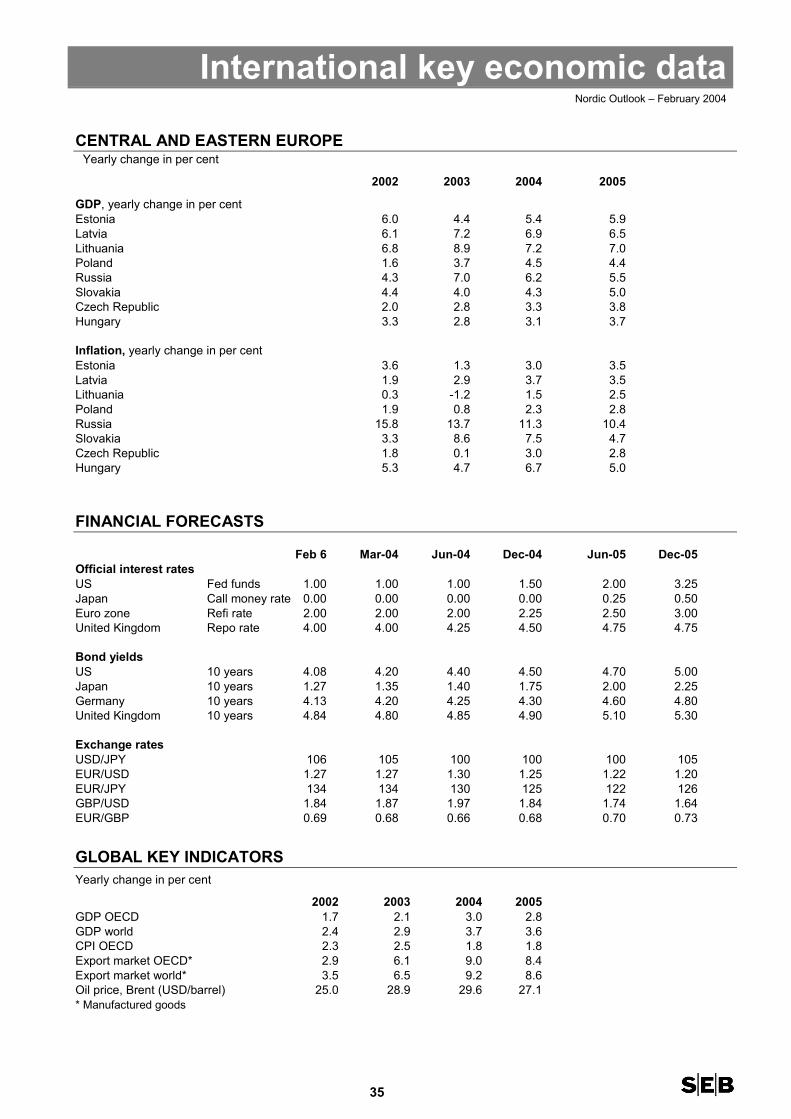
International key economic dataNordic Outlook – February 2004
35
CENTRAL AND EASTERN EUROPEYearly change in per cent
2002 2003 2004 2005
GDP, yearly change in per centEstonia 6.0 4.4 5.4 5.9Latvia 6.1 7.2 6.9 6.5Lithuania 6.8 8.9 7.2 7.0Poland 1.6 3.7 4.5 4.4Russia 4.3 7.0 6.2 5.5Slovakia 4.4 4.0 4.3 5.0Czech Republic 2.0 2.8 3.3 3.8Hungary 3.3 2.8 3.1 3.7
Inflation, yearly change in per centEstonia 3.6 1.3 3.0 3.5Latvia 1.9 2.9 3.7 3.5Lithuania 0.3 -1.2 1.5 2.5Poland 1.9 0.8 2.3 2.8Russia 15.8 13.7 11.3 10.4Slovakia 3.3 8.6 7.5 4.7Czech Republic 1.8 0.1 3.0 2.8Hungary 5.3 4.7 6.7 5.0
FINANCIAL FORECASTS
Feb 6 Mar-04 Jun-04 Dec-04 Jun-05 Dec-05Official interest ratesUS Fed funds 1.00 1.00 1.00 1.50 2.00 3.25Japan Call money rate 0.00 0.00 0.00 0.00 0.25 0.50Euro zone Refi rate 2.00 2.00 2.00 2.25 2.50 3.00United Kingdom Repo rate 4.00 4.00 4.25 4.50 4.75 4.75
Bond yieldsUS 10 years 4.08 4.20 4.40 4.50 4.70 5.00Japan 10 years 1.27 1.35 1.40 1.75 2.00 2.25Germany 10 years 4.13 4.20 4.25 4.30 4.60 4.80United Kingdom 10 years 4.84 4.80 4.85 4.90 5.10 5.30
Exchange ratesUSD/JPY 106 105 100 100 100 105EUR/USD 1.27 1.27 1.30 1.25 1.22 1.20EUR/JPY 134 134 130 125 122 126GBP/USD 1.84 1.87 1.97 1.84 1.74 1.64EUR/GBP 0.69 0.68 0.66 0.68 0.70 0.73
GLOBAL KEY INDICATORSYearly change in per cent
2002 2003 2004 2005GDP OECD 1.7 2.1 3.0 2.8GDP world 2.4 2.9 3.7 3.6CPI OECD 2.3 2.5 1.8 1.8Export market OECD* 2.9 6.1 9.0 8.4Export market world* 3.5 6.5 9.2 8.6Oil price, Brent (USD/barrel) 25.0 28.9 29.6 27.1* Manufactured goods

Economic Research available on InternetNordic Outlook published by SEB Economic Research is available on the Internet at: www.seb.se. This page is open to all.
To get access to all other research and trading recommendations for Merchant Banking's customers on the Internet at www.mb.seb.se, a password is needed that is exclusive to these clients. If you wish to get access to this web site, please contact Merchant Bankings to receive the password.
Technical requirementsMost of our research is published in PDF format (Portable Document Format). The software Adobe Acrobat, that reads PDF documents, is free of charge and can be downloaded from Adobe's web site at: www.adobe.com.
SEB is a Northern European bank with more than 600 branch offices,
mainly in Sweden and the other Nordic countries, the Baltic countries
and Germany. The SEB Group has about 20,000 employees, half of whom
are outside Sweden, and more than 4 million customers, both private
individuals and companies.
SEB has traditions dating back to the 19th century, but at the same
time is in the forefront in terms of using modern technology. The Bank
gives priority to long-term relationships and expertise. SEB is a leader
on behalf of companies and private individuals that have international
activities requiring specialised financial expertise. We have local roots via
our branch offices, at the same time as a large proportion of our customers
take advantage of modern Internet-based services.
Economic Research is SEB’s unit for the assessment of economic trends
and policies as well as long-term developments in financial markets.
The unit supplies the entire SEB Group and its customers with a number
of different products and analyses. The “Nordic Outlook” report appears
once each quarter and covers the world economy, Europe and Sweden.
www.seb.se