Embed Size (px)
Citation preview
Agricultural Market Access Under Tariff-Rate Quotas
Jayson Beckman, Fred Gale, and Tani Lee
Economic Research Service
Economic Research Report Number 279
January 2021
Economic Research Service
Cover images from Getty Images.
Use of commercial and trade names does not imply approval or constitute endorsement by USDA.
To ensure the quality of its research reports and satisfy governmentwide standards, ERS requires that all research reports with substantively new material be reviewed by qualified technical research peers. This technical peer review process, coordinated by ERS' Peer Review Coordinating Council, allows experts who possess the technical background, perspective, and expertise to provide an objective and meaningful assessment of the output’s substantive content and clarity of communication during the publication’s review.
In accordance with Federal civil rights law and U.S. Department of Agriculture (USDA) civil rights regulations and policies, the USDA, its Agencies, offices, and employees, and institutions participating in or administering USDA programs are prohibited from discriminating based on race, color, national origin, religion, sex, gender identity (including gender expression), sexual orientation, disability, age, marital status, family/parental status, income derived from a public assistance program, political beliefs, or reprisal or retaliation for prior civil rights activity, in any program or activity conducted or funded by USDA (not all bases apply to all programs). Remedies and complaint filing deadlines vary by program or incident.
Persons with disabilities who require alternative means of communication for program information (e.g., Braille, large print, audiotape, American Sign Language, etc.) should contact the responsible Agency or USDA's TARGET Center at (202) 720-2600 (voice and TTY) or contact USDA through the Federal Relay Service at (800) 877-8339. Additionally,program information may be made available in languages other than English.
To file a program discrimination complaint, complete the USDA Program Discrimination Complaint Form, AD-3027, found online at How to File a Program Discrimination Complaint and at any USDA office or write a letter addressed to USDA and provide in the letter all of the information requested in the form. To request a copy of the complaint form, call (866) 632-9992. Submit your completed form or letter to USDA by: (1) mail: U.S. Department of Agriculture, Office ofthe Assistant Secretary for Civil Rights,1400 Independence Avenue, SW, Washington, D.C. 20250-9410; (2) fax: (202)690-7442; or (3) email: [email protected].
USDA is an equal opportunity provider, employer, and lender.
Recommended citation format for this publication
Jayson Beckman, Fred Gale, and Tani Lee. Agricultural Market Access Under Tariff-Rate Quotas, ERR 279, January 2021. U.S. Department of Agriculture, Economic Research Service.
Economic Research Service
Economic Research Report Number 279
January 2021
Agricultural Market Access Under Tariff-Rate Quotas
Jayson Beckman, Fred Gale, and Tani Lee
AbstractForty World Trade Organization (WTO) members have established 1,125 agricultural tariff-rate quotas (TRQs). TRQs are a two-tiered tariff scheme (a lower rate under a quota amount, and a higher rate once that is reached), developed during multilateral trade negotiations in the 1990s to facilitate market access for agricultural trade. This report provides data and analysis on the preva-lence of these trade measures. TRQs are classified according to indicators of whether market access is constrained by administrative procedures or nontariff measures that prevent the quota from filling or by the quota itself. This analysis found that 13 percent of TRQs were “underuti-lized” when imports were less than 65 percent of the quota (a low “fill rate”), even though the cost of imports was less than the domestic price. Another 22 percent of TRQs were classified as “binding” when the fill rate was high and the import cost was less than the domestic commodity price. Issues have been raised in the WTO regarding some of these TRQs, with the largest number of questions about transparency and administration of quotas.
Keywords: Agriculture, trade, World Trade Organization, WTO, tariffs, tariff-rate quotas, TRQs, TRQ administration
AcknowledgmentsThe authors thank Shawn Arita, USDA, Office of the Chief Economist, and Bryce Cooke, Chase Bank, for their work on this report. The authors also thank three anonymous reviewers and other reviewers in the USDA, Office of the Chief Economist and the USDA, Foreign Agricultural Service. We appreciate the editorial support provided by Courtney Knauth, ERS editor, and production layout assistance by Andrea Pimm, ERS designer.
ii Agricultural Market Access Under Tariff-Rate Quotas, ERR 279
USDA, Economic Research Service
Contents
Summary . . . . . . . . . . . . . . . . . . . . . . . . . . . . . . . . . . . . . . . . . . . . . . . . . . . . . . . . . . . . . . . . . . . . . iii
Introduction . . . . . . . . . . . . . . . . . . . . . . . . . . . . . . . . . . . . . . . . . . . . . . . . . . . . . . . . . . . . . . . . . . . .5
Profiles of TRQs . . . . . . . . . . . . . . . . . . . . . . . . . . . . . . . . . . . . . . . . . . . . . . . . . . . . . . . . . . . . . . . .7
TRQ Issues Raised at Meetings of the WTO Committee on Agriculture . . . . . . . . . . . . . . . . . 14
Empirical Assessment of TRQ Fill . . . . . . . . . . . . . . . . . . . . . . . . . . . . . . . . . . . . . . . . . . . . . . . .18
TRQ Classification for Selected Members . . . . . . . . . . . . . . . . . . . . . . . . . . . . . . . . . . . . . . . . . .23
Conclusions . . . . . . . . . . . . . . . . . . . . . . . . . . . . . . . . . . . . . . . . . . . . . . . . . . . . . . . . . . . . . . . . . . .28
References . . . . . . . . . . . . . . . . . . . . . . . . . . . . . . . . . . . . . . . . . . . . . . . . . . . . . . . . . . . . . . . . . . . .29
ErrataOn February 8, 2021, table 2 was revised to correct the over-quota rate for U.S. sugar. No other tables of the report were affected by the error.
A report summary from the Economic Research Service January 2021
ERS is a primary source of economic research and
analysis from the U.S. Department of Agriculture, providing timely informa-
tion on economic and policy issues related to agriculture, food, the environment, and
rural America. www.ers.usda.gov
Agricultural Market Access Under Tariff-Rate Quotas
Jayson Beckman, Fred Gale, and Tani Lee
Economic Research Service
Economic Research Report Number 279
January 2021
• A significant proportion of TRQs have low fill rates (the percentage of the quota filled):36 percent had import volumes less than 20 percent of the quota during 2006-15.However, a larger proportion (40 percent of TRQs) had imports that were at least 80percent of the quota. Only 6 percent of TRQs had fill rates of 40-60 percent—the rangethat includes the 56-percent average.
• In meetings of the WTO Committee on Agriculture during 1996-2015, WTO membersasked 1,972 questions about other members’ TRQs, 925 questions about TRQ transpar-ency issues (47 percent), and 435 questions about administration issues (22 percent).
To assess the impact of TRQs on agricultural trade, the study authors characterized TRQs in terms of two indicators: (1) whether the TRQ fill rate exceeded a 65-percent threshold set by a Decision issued at the 2013 Bali Ministerial Conference of the WTO, and (2) whether domestic prices exceeded the cost of imports (border prices plus the in-quota tariff). The TRQs were then classified into four groups that allow for analysis of the TRQ impact on agricultural trade:
• Underutilized TRQs (13 percent)—imports filled less than 65 percent of the quota, anddomestic prices exceeded the estimated cost of imports, suggesting that potential demandfor additional imports may be constrained by administrative procedures or other nontariffmeasures that impede trade.
Agricultural Market Access Under Tariff- Rate Quotas
Jayson Beckman, Fred Gale, and Tani Lee
What Is the Issue?
Tariff-rate quotas (TRQs) were established during multilateral trade negotiations within the World Trade Organization (WTO) in the 1990s to facilitate market access for agricultural commodities that were subject to import quotas and nontariff measures. Under a TRQ, imports up to a specified quota face a lower tariff than imports above the quota. More than 20 years after the measures were first adopted, 40 World Trade Organization (WTO) members have a total of 1,125 TRQs in their bound schedules (i.e., inventories of tariffs for specific commodities at maximum allowable rates). This report provides information about the prevalence of TRQs and their impact on global agricultural trade.
What Did the Study Find?
The authors’ review of TRQs shows that they vary widely in the size of quotas, tariff levels, implementation procedures, and commodities covered.
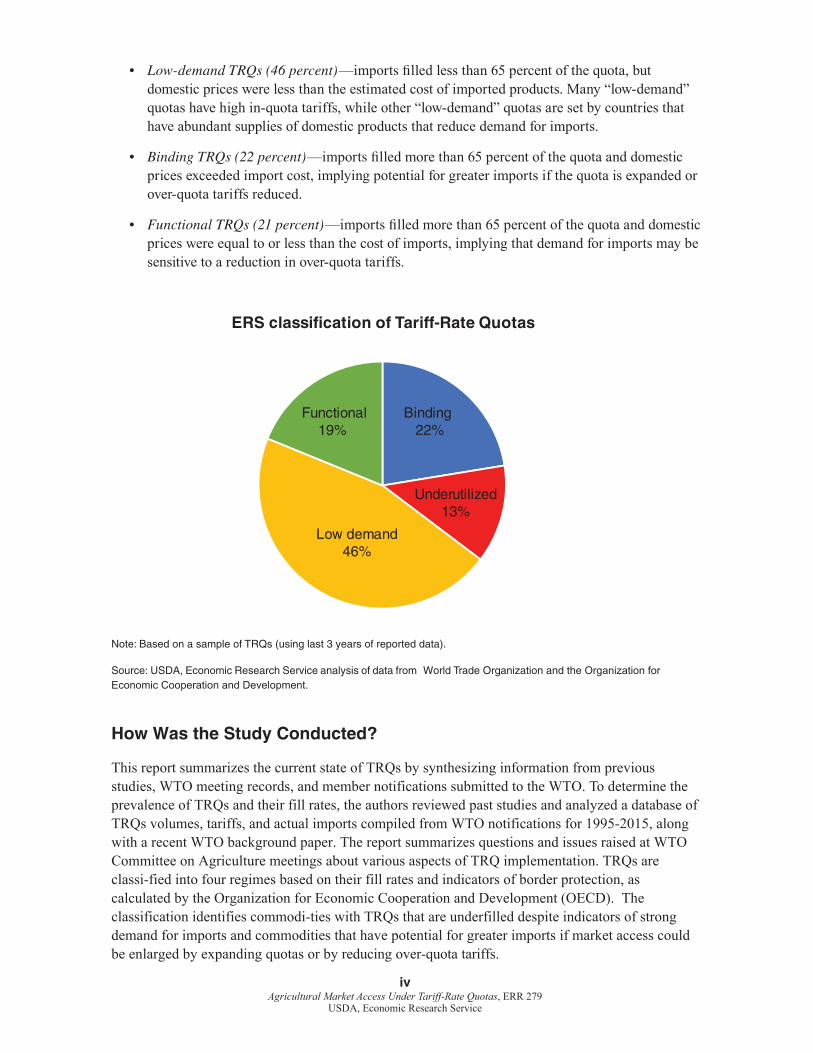
• Low-demand TRQs (46 percent)—imports filled less than 65 percent of the quota, butdomestic prices were less than the estimated cost of imported products. Many “low-demand”quotas have high in-quota tariffs, while other “low-demand” quotas are set by countries thathave abundant supplies of domestic products that reduce demand for imports.
• Binding TRQs (22 percent)—imports filled more than 65 percent of the quota and domesticprices exceeded import cost, implying potential for greater imports if the quota is expanded orover-quota tariffs reduced.
• Functional TRQs (21 percent)—imports filled more than 65 percent of the quota and domesticprices were equal to or less than the cost of imports, implying that demand for imports may besensitive to a reduction in over-quota tariffs.
Note: Based on a sample of TRQs (using last 3 years of reported data).
Source: USDA, Economic Research Service analysis of data from World Trade Organization and the Organization for Economic Cooperation and Development.
How Was the Study Conducted?
This report summarizes the current state of TRQs by synthesizing information from previous studies, WTO meeting records, and member notifications submitted to the WTO. To determine the prevalence of TRQs and their fill rates, the authors reviewed past studies and analyzed a database of TRQs volumes, tariffs, and actual imports compiled from WTO notifications for 1995-2015, along with a recent WTO background paper. The report summarizes questions and issues raised at WTO Committee on Agriculture meetings about various aspects of TRQ implementation. TRQs are classi-fied into four regimes based on their fill rates and indicators of border protection, as calculated by the Organization for Economic Cooperation and Development (OECD). The classification identifies commodi-ties with TRQs that are underfilled despite indicators of strong demand for imports and commodities that have potential for greater imports if market access could be enlarged by expanding quotas or by reducing over-quota tariffs.
iv Agricultural Market Access Under Tariff-Rate Quotas, ERR 279
USDA, Economic Research Service
Functional19%
Binding22%
Underutilized13%
Low demand46%
ERS classification of Tariff-Rate Quotas
5 Agricultural Market Access Under Tariff-Rate Quotas, ERR 279
USDA, Economic Research Service
Agricultural Market Access Under Tariff-Rate Quotas
Introduction
Tariff-rate quotas (TRQs) are a two-tiered tariff scheme developed during the Uruguay Round Agreement on Agriculture (URAA) multilateral trade negotiations in the 1990s to expand market access for agricultural commodities and to facilitate further liberalization of agricultural trade. TRQs charge a lower tariff on import volumes that are under a defined quota (in-quota rate) and a higher tariff charged on volumes above the quota (over-quota rate).
TRQs were created as part of the URAA’s “tariffication” process. Quotas and other nontariff measures (NTMs) were converted to bound tariffs (the maximum tariff before legal action can be brought against a country) that provided an equivalent level of protection. However, the resulting tariffs for some commodities and countries were too high for imports to be economically feasible. To address this issue, the URAA established TRQs that would open markets to a minimum amount of trade at a tariff below the bound rate in order to provide a base level of market access.1 When they were first established by the URAA, TRQs were expected to form the basis for negotiating further tariff reductions and quota increases in later rounds of World Trade Organization (WTO) talks (IATRC, 2001). TRQs were also expected to give developing-country exporters more access to markets in developed countries.
TRQs were used primarily by developed countries that were founding members of the WTO in the 1990s. Gibson et al. (2001) reported that TRQs were used by about a third of the countries they exam-ined and covered just 6 percent of agricultural tariff lines. Countries that joined the WTO after the URAA also had to convert quotas and NTMs to tariffs, and some of them negotiated TRQs that were included in their schedule of commitments.
Studies published in the years after the URAA raised concerns about impediments to imports of commodities covered by TRQs. The International Agricultural Trade Research Consortium (IATRC, 2001) noted that some observers were disappointed in the degree of market access provided by TRQs, and their study suggested that TRQs may have simply perpetuated existing trading arrangements in some instances. Gibson et al. (2001) found that average tariffs for commodities covered by TRQs were at or above the world average prices for tariffs. Abbott (2002) noted that complex or burdensome administrative measures for implementing TRQs limited their use.
Concerns about low TRQ fill rates and administrative procedures led to a 2013 WTO Bali Ministerial Decision on TRQs that clarified procedures for managing TRQs and called for adoption of mecha-nisms to monitor their use. Implementation of the Bali Decision is ongoing, and concerns about TRQ implementation persist. A study of TRQs (WTO, 2019a) submitted to the WTO by the United States raised concerns that some TRQs do not fill even when market conditions appear to make imports profitable and called for more analysis to deepen members’ knowledge of how TRQs operate. A recent U.S. challenge of China’s grain TRQs pointed out that the quotas had never filled even when a wide gap between Chinese prices and international prices made imports profitable (WTO, 2019b).
1TRQs were meant to establish quotas equal to about 5 percent of the country’s market share (IATRC, 2001).
6 Agricultural Market Access Under Tariff-Rate Quotas, ERR 279
USDA, Economic Research Service
In the present report, the authors analyze the current status of TRQs, using several data sources and analytical approaches. The report draws upon past analyses and WTO background papers, and it analyzes a database of TRQs for 1995-2015 to assess their prevalence and their utilization by country and commodity. The report summarizes questions and issues raised at WTO Committee on Agriculture meetings regarding various aspects of TRQ implementation. This is followed by a classification of TRQs into four categories based on their fill rates and indicators of border protection. The classification identifies TRQs that are underfilled despite signs of strong economic demand for imports and TRQs for commodities that have high fill rates and show potential for increased imports if the quota is expanded.
7 Agricultural Market Access Under Tariff-Rate Quotas, ERR 279
USDA, Economic Research Service
Profiles of TRQs
A WTO background paper (WTO, 2018) and a profile of TRQs submitted to the WTO by the United States Committee on Agriculture (WTO, 2019b) reported that 40 members had 1,125 TRQs in their bound schedules in 2016 (table 1).2 Other findings were:
• TRQs account for 9 percent of these WTO members’ bound agricultural schedules.
• Both developed and developing countries use TRQs.
• TRQs cover a wide variety of products, but they are most prevalent for dairy, sugar, and animal products.
• The average in-quota bound tariff was 34.5 percent.
• On average, bound out-of-quota tariffs were 2.3 times higher than in-quota duties.
• The average TRQ fill rate for 2014-16 was 56 percent; only four members had average fill rates of 100 percent.
• Average TRQ fill rates declined during 2007-16.
These findings are similar to assessments conducted after TRQs were first implemented in the early 2000s. Gibson et al. (2001) found that TRQs covered 6 percent of the countries they examined, and the average 64-percent in-quota tariff was much higher than the 34.5-percent average tariff on agri-culture at the time. Gibson et al. (2001) and Abbott (2002) noted that TRQs often covered sensitive livestock and dairy products. Abbott observed that many TRQs replaced country-specific quotas and preferential trading arrangements and suggested that these TRQs did little to expand market access, since they simply perpetuated existing trade.
Because the implementation of TRQs varies widely across countries and commodities, generaliza-tions are difficult. Some members have numerous TRQs that account for more than 25 percent of their bound schedules, while other members have just a few. Some countries and commodities have very high in-quota tariffs that far exceed the overall average tariff for agricultural products, but others have low or duty-free access for in-quota imports. Many TRQs do not limit the volume of imports at the in-quota tariff-rate.
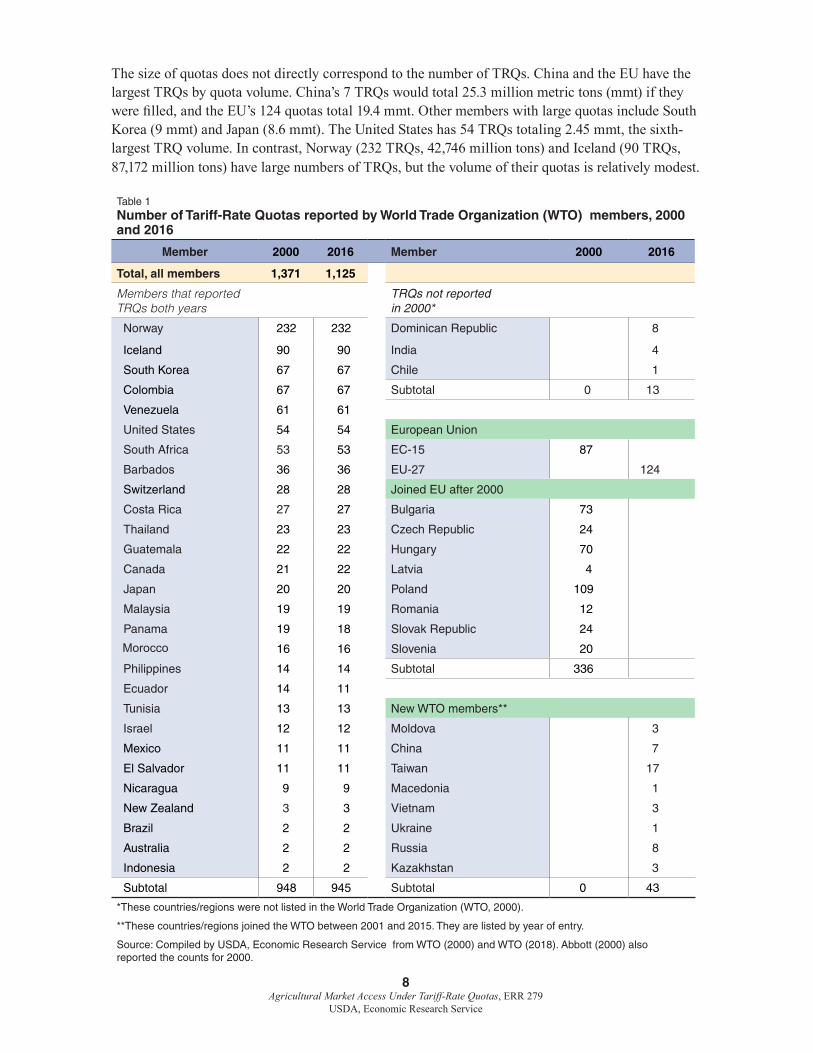
Since 2000, the number of TRQs has declined from 1,371 to 1,125, with many of them consolidated through EU enlargement. Counts of TRQs in 2000 and 2016 reported by WTO (2000) and WTO (2018, table 1) show that 27 WTO members maintained a nearly constant number of TRQs (Panama and Ecuador reported three fewer TRQs in 2016 and Canada reported one more). These members accounted for 945 (or 84 percent) of the 1,125 TRQs in 2016. Eight new WTO members accounted for 43 TRQs in 2016.3 Eight Eastern European countries (with 336 TRQs listed separately in 2000) joined the EU and had their TRQs consolidated into the EU schedule. The 15-member European Community (EC) had 87 TRQs in 2000, while the 27-member EU had 124 TRQs in 2016—a net gain of 37 TRQs after it absorbed new members.
2Each WTO member must have a Schedule for Goods that includes “Bound duties,” or maximum tariffs that the member can apply for a specific product.
3China joined the WTO with 10 TRQs, but its soybean oil, rapeseed oil, and palm oil TRQs expired in 2006.
8 Agricultural Market Access Under Tariff-Rate Quotas, ERR 279
USDA, Economic Research Service
The size of quotas does not directly correspond to the number of TRQs. China and the EU have the largest TRQs by quota volume. China’s 7 TRQs would total 25.3 million metric tons (mmt) if they were filled, and the EU’s 124 quotas total 19.4 mmt. Other members with large quotas include South Korea (9 mmt) and Japan (8.6 mmt). The United States has 54 TRQs totaling 2.45 mmt, the sixth-largest TRQ volume. In contrast, Norway (232 TRQs, 42,746 million tons) and Iceland (90 TRQs, 87,172 million tons) have large numbers of TRQs, but the volume of their quotas is relatively modest.
Table 1 Number of Tariff-Rate Quotas reported by World Trade Organization (WTO) members, 2000 and 2016
Member 2000 2016 Member 2000 2016
Total, all members 1,371 1,125
Members that reported TRQs both years
TRQs not reported in 2000*
Norway 232 232 Dominican Republic 8
Iceland 90 90 India 4
South Korea 67 67 Chile 1
Colombia 67 67 Subtotal 0 13
Venezuela 61 61
United States 54 54 European Union
South Africa 53 53 EC-15 87
Barbados 36 36 EU-27 124
Switzerland 28 28 Joined EU after 2000
Costa Rica 27 27 Bulgaria 73
Thailand 23 23 Czech Republic 24
Guatemala 22 22 Hungary 70
Canada 21 22 Latvia 4
Japan 20 20 Poland 109
Malaysia 19 19 Romania 12
Panama 19 18 Slovak Republic 24
16 16 Slovenia 20
Philippines 14 14 Subtotal 336
Ecuador 14 11
Tunisia 13 13 New WTO members**
Israel 12 12 Moldova 3
Mexico 11 11 China 7
El Salvador 11 11 Taiwan 17
Nicaragua 9 9 Macedonia 1
New Zealand 3 3 Vietnam 3
Brazil 2 2 Ukraine 1
Australia 2 2 Russia 8
Indonesia 2 2 Kazakhstan 3
Subtotal 948 945 Subtotal 0 43
*These countries/regions were not listed in the World Trade Organization (WTO, 2000).
**These countries/regions joined the WTO between 2001 and 2015. They are listed by year of entry.
Source: Compiled by USDA, Economic Research Service from WTO (2000) and WTO (2018). Abbott (2000) also reported the counts for 2000.
Morocco
9 Agricultural Market Access Under Tariff-Rate Quotas, ERR 279
USDA, Economic Research Service
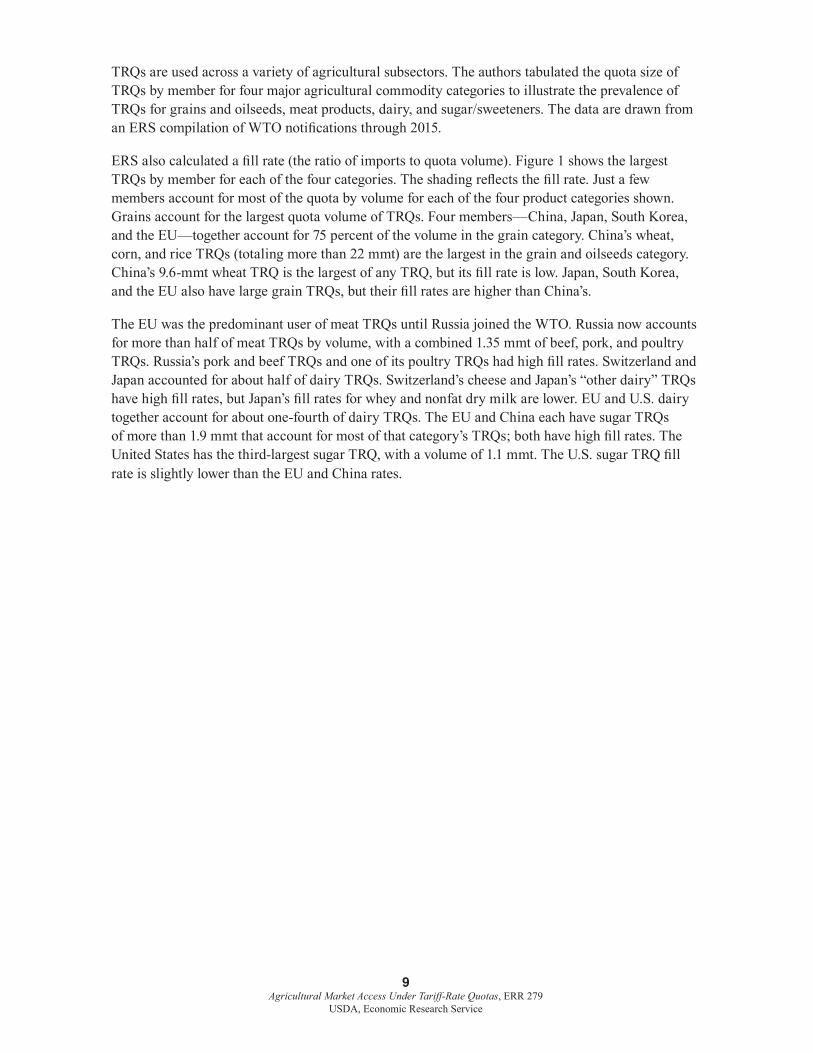
TRQs are used across a variety of agricultural subsectors. The authors tabulated the quota size of TRQs by member for four major agricultural commodity categories to illustrate the prevalence of TRQs for grains and oilseeds, meat products, dairy, and sugar/sweeteners. The data are drawn from an ERS compilation of WTO notifications through 2015.
ERS also calculated a fill rate (the ratio of imports to quota volume). Figure 1 shows the largest TRQs by member for each of the four categories. The shading reflects the fill rate. Just a few members account for most of the quota by volume for each of the four product categories shown. Grains account for the largest quota volume of TRQs. Four members—China, Japan, South Korea, and the EU—together account for 75 percent of the volume in the grain category. China’s wheat, corn, and rice TRQs (totaling more than 22 mmt) are the largest in the grain and oilseeds category. China’s 9.6-mmt wheat TRQ is the largest of any TRQ, but its fill rate is low. Japan, South Korea, and the EU also have large grain TRQs, but their fill rates are higher than China’s.
The EU was the predominant user of meat TRQs until Russia joined the WTO. Russia now accounts for more than half of meat TRQs by volume, with a combined 1.35 mmt of beef, pork, and poultry TRQs. Russia’s pork and beef TRQs and one of its poultry TRQs had high fill rates. Switzerland and Japan accounted for about half of dairy TRQs. Switzerland’s cheese and Japan’s “other dairy” TRQs have high fill rates, but Japan’s fill rates for whey and nonfat dry milk are lower. EU and U.S. dairy together account for about one-fourth of dairy TRQs. The EU and China each have sugar TRQs of more than 1.9 mmt that account for most of that category’s TRQs; both have high fill rates. The United States has the third-largest sugar TRQ, with a volume of 1.1 mmt. The U.S. sugar TRQ fill rate is slightly lower than the EU and China rates.
10 Agricultural Market Access Under Tariff-Rate Quotas, ERR 279
USDA, Economic Research Service
Figure 1 Tariff-Rate Quotas by annual quota size (in thousand MTs) and fill rates (in percentages) in 2011-15
Notes: Darker shading indicates a higher fill rate.
MT = Metric Tons. Country abbreviations are: CHN, China; KOR, Korea; EU, European Union; JPN, Japan; MAR, Morocco; COL, Colom-bia; TUN, Tunisia; CAN, Canada; ECU, Ecuador; RUS, Russia; USA, United States; PHL, Philippines; ISR, Israel; ZAF, South Africa; VNM, Vietnam; MEX, Mexico; THA, Thailand; DOM, Dominican Republic; CHE, Switzerland; VEN, Venezuela. BRA, Brazil.
Source: USDA, Economic Research Service Using information from World Trade Organization and Global Trade Atlas.
High in-quota and over-quota tariffs affect access to markets for commodities covered by TRQs. While TRQs typically have a two-tier tariff scheme (a lower rate under a quota amount, and a higher rate once that is reached), Skully (2001b) reported that about half of TRQs were actually administered as applied tariffs that charged the same tariffs for in-quota and over-quota imports. Gibson et al. (2001) found that the level of tariffs for commodities covered by TRQs was relatively high, but the level of tariffs varied widely across members. Gibson and colleagues found an average over-quota tariff for TRQ commodities of 128 percent. The 63-per-cent average in-quota tariff was also relatively high, exceeding the overall average tariff for agricultural prod-ucts of 49 percent for countries they examined. Abbott (2001) noted that the high tariffs reflected the adoption of TRQs for commodities that individual member countries designated as sensitive, allowing them to set high rates of protection (e.g., with tariffs or TRQs).
CHNWheat and products9,636K
CHNRice and products5,320K
CHNCorn and products7,200K
JPNWheat and products5,740K
TUNWheat
MARWheatandproducts
EUCorn and products2,778K
EUWheat andproducts3,937K
KORCorn andproducts 6,102K
Grains and oilseeds RUSBeef570K
EUPoultry681K
RUSPork430K
EUBeef185K
EUEggs158K
RUSPoultry364K
USABeef657K
Meat products
CHECheese527K
JPNOther Dairy273K
JPNWhey84K
JPNNFDM82K MEX
NFDM120K
KORWhey54K
ZAFOtherDairy54K
USAOther Dairy
EUNFDM
EUCheese103K
EUButter86K
EUCheese136K
Dairy
EUCane/beet sugar1,972K
CHNCane/beet sugar1,945K
VMNCane/beet sugar300K
MARCane/beet sugar
USACane/beet sugar1,117K
Sugar/sweeteners
Fill rate (percent)
0.000 1.000
11 Agricultural Market Access Under Tariff-Rate Quotas, ERR 279
USDA, Economic Research Service
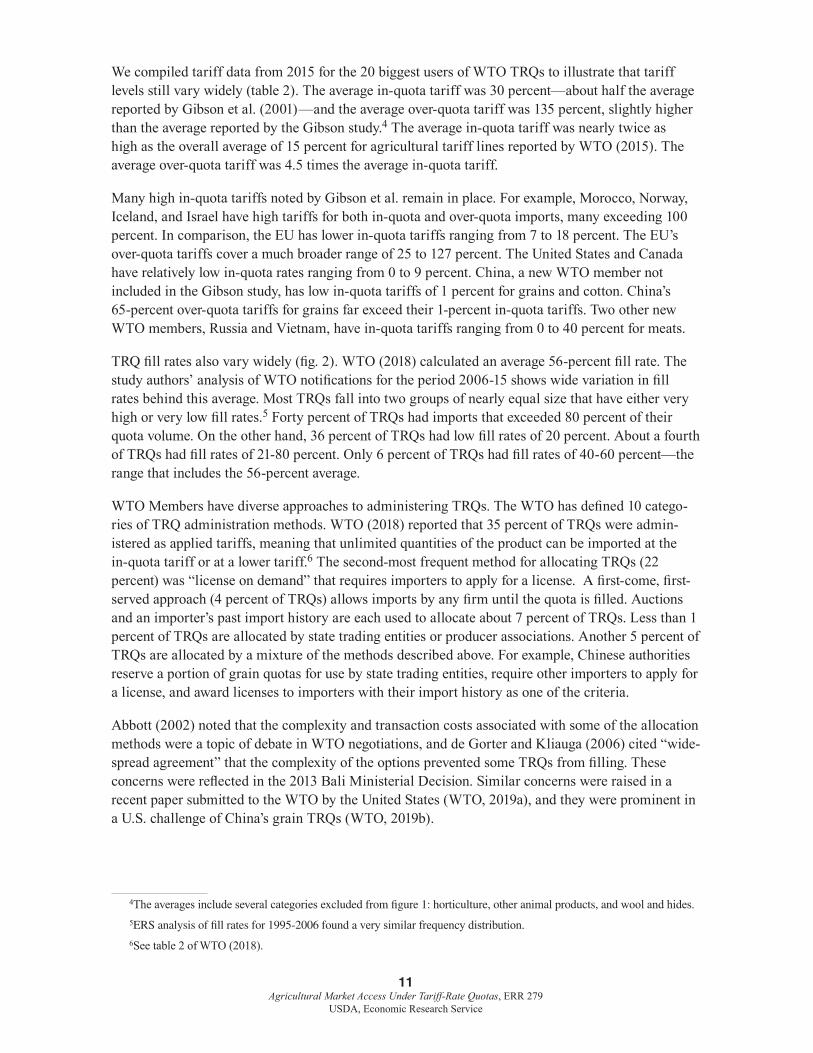
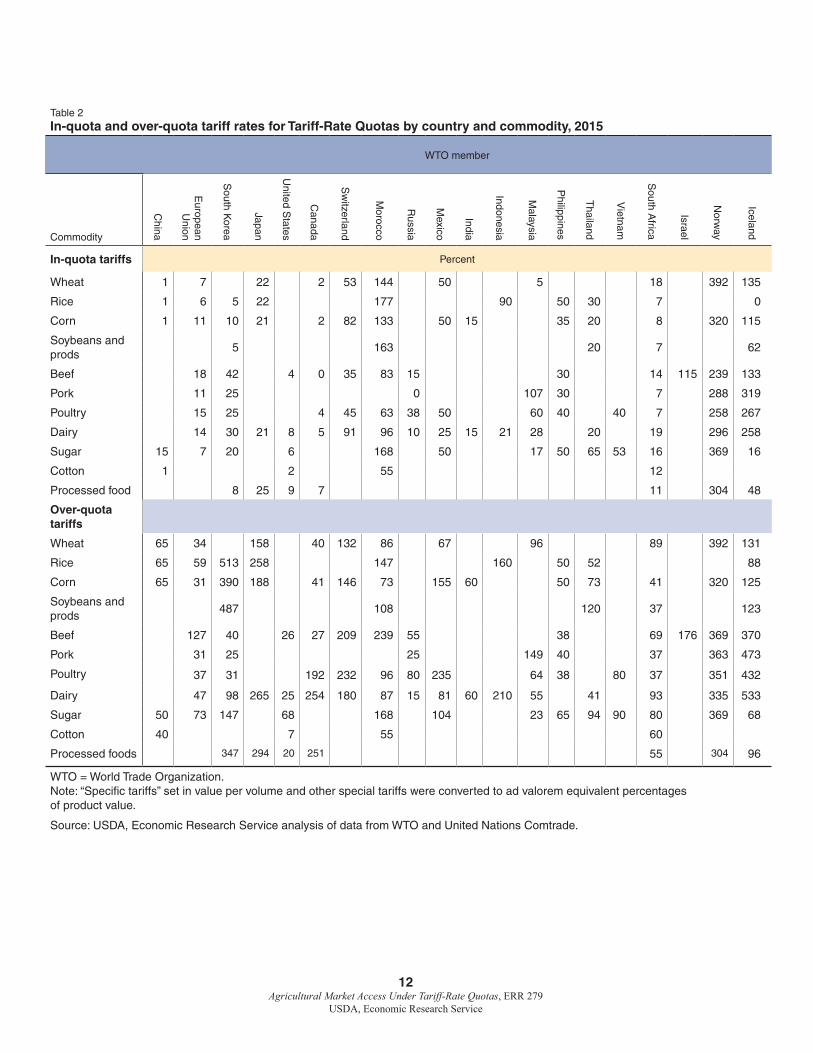
We compiled tariff data from 2015 for the 20 biggest users of WTO TRQs to illustrate that tariff levels still vary widely (table 2). The average in-quota tariff was 30 percent—about half the average reported by Gibson et al. (2001)—and the average over-quota tariff was 135 percent, slightly higher than the average reported by the Gibson study.4 The average in-quota tariff was nearly twice as high as the overall average of 15 percent for agricultural tariff lines reported by WTO (2015). The average over-quota tariff was 4.5 times the average in-quota tariff.
Many high in-quota tariffs noted by Gibson et al. remain in place. For example, Morocco, Norway, Iceland, and Israel have high tariffs for both in-quota and over-quota imports, many exceeding 100 percent. In comparison, the EU has lower in-quota tariffs ranging from 7 to 18 percent. The EU’s over-quota tariffs cover a much broader range of 25 to 127 percent. The United States and Canada have relatively low in-quota rates ranging from 0 to 9 percent. China, a new WTO member not included in the Gibson study, has low in-quota tariffs of 1 percent for grains and cotton. China’s 65-percent over-quota tariffs for grains far exceed their 1-percent in-quota tariffs. Two other new WTO members, Russia and Vietnam, have in-quota tariffs ranging from 0 to 40 percent for meats.
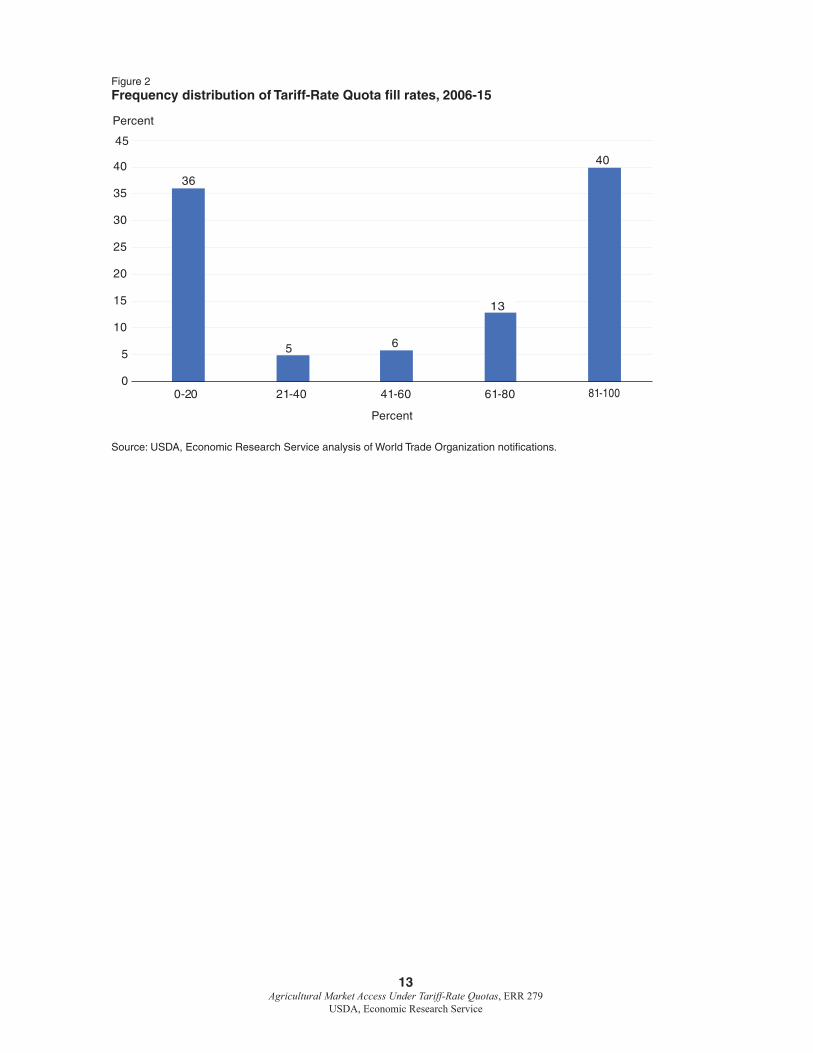
TRQ fill rates also vary widely (fig. 2). WTO (2018) calculated an average 56-percent fill rate. The study authors’ analysis of WTO notifications for the period 2006-15 shows wide variation in fill rates behind this average. Most TRQs fall into two groups of nearly equal size that have either very high or very low fill rates.5 Forty percent of TRQs had imports that exceeded 80 percent of their quota volume. On the other hand, 36 percent of TRQs had low fill rates of 20 percent. About a fourth of TRQs had fill rates of 21-80 percent. Only 6 percent of TRQs had fill rates of 40-60 percent—the range that includes the 56-percent average.
WTO Members have diverse approaches to administering TRQs. The WTO has defined 10 catego-ries of TRQ administration methods. WTO (2018) reported that 35 percent of TRQs were admin-istered as applied tariffs, meaning that unlimited quantities of the product can be imported at the in-quota tariff or at a lower tariff.6 The second-most frequent method for allocating TRQs (22 percent) was “license on demand” that requires importers to apply for a license. A first-come, first-served approach (4 percent of TRQs) allows imports by any firm until the quota is filled. Auctions and an importer’s past import history are each used to allocate about 7 percent of TRQs. Less than 1 percent of TRQs are allocated by state trading entities or producer associations. Another 5 percent of TRQs are allocated by a mixture of the methods described above. For example, Chinese authorities reserve a portion of grain quotas for use by state trading entities, require other importers to apply for a license, and award licenses to importers with their import history as one of the criteria.
Abbott (2002) noted that the complexity and transaction costs associated with some of the allocation methods were a topic of debate in WTO negotiations, and de Gorter and Kliauga (2006) cited “wide-spread agreement” that the complexity of the options prevented some TRQs from filling. These concerns were reflected in the 2013 Bali Ministerial Decision. Similar concerns were raised in a recent paper submitted to the WTO by the United States (WTO, 2019a), and they were prominent in a U.S. challenge of China’s grain TRQs (WTO, 2019b).
4The averages include several categories excluded from figure 1: horticulture, other animal products, and wool and hides.5ERS analysis of fill rates for 1995-2006 found a very similar frequency distribution.6See table 2 of WTO (2018).
12 Agricultural Market Access Under Tariff-Rate Quotas, ERR 279
USDA, Economic Research Service
Table 2 In-quota and over-quota tariff rates for Tariff-Rate Quotas by country and commodity, 2015
WTO member
Commodity
China
European
Union
South K
orea
Japan
United S
tates
Canada
Sw
itzerland
Morocco
Russia
Mexico
India
Indonesia
Malaysia
Philippines
Thailand
Vietnam
South A
frica
Israel
Norw
ay
Iceland
In-quota tariffs Percent
Wheat 1 7 22 2 53 144 50 5 18 392 135
Rice 1 6 5 22 177 90 50 30 7 0
Corn 1 11 10 21 2 82 133 50 15 35 20 8 320 115
Soybeans and prods
5 163 20 7 62
Beef 18 42 4 0 35 83 15 30 14 115 239 133
Pork 11 25 0 107 30 7 288 319
Poultry 15 25 4 45 63 38 50 60 40 40 7 258 267
Dairy 14 30 21 8 5 91 96 10 25 15 21 28 20 19 296 258
Sugar 15 7 20 6 168 50 17 50 65 53 16 369 16
Cotton 1 2 55 12
Processed food 8 25 9 7 11 304 48
Over-quota tariffs
Wheat 65 34 158 40 132 86 67 96 89 392 131
Rice 65 59 513 258 147 160 50 52 88
Corn 65 31 390 188 41 146 73 155 60 50 73 41 320 125
Soybeans and prods
487 108 120 37 123
Beef 127 40 26 27 209 239 55 38 69 176 369 370
Pork 31 25 25 149 40 37 363 473
Poultry 37 31 192 232 96 80 235 64 38 80 37 351 432
Dairy 47 98 265 25 254 180 87 15 81 60 210 55 41 93 335 533
Sugar 50 73 147 68 168 104 23 65 94 90 80 369 68
Cotton 40 7 55 60
Processed foods 347 294 20 251 55 304 96
WTO = World Trade Organization. Note: “Specific tariffs” set in value per volume and other special tariffs were converted to ad valorem equivalent percentages of product value.
Source: USDA, Economic Research Service analysis of data from WTO and United Nations Comtrade.
13 Agricultural Market Access Under Tariff-Rate Quotas, ERR 279
USDA, Economic Research Service
Figure 2 Frequency distribution of Tariff-Rate Quota fill rates, 2006-15
36
5 6
40
0
5
10
15
20
25
30
35
40
0-20 21-40 41-60 61-80 81-100
Percent
Percent
45
13
Source: USDA, Economic Research Service analysis of World Trade Organization notifications.
14 Agricultural Market Access Under Tariff-Rate Quotas, ERR 279
USDA, Economic Research Service
TRQ Issues Raised at Meetings of the WTO Committee on Agriculture
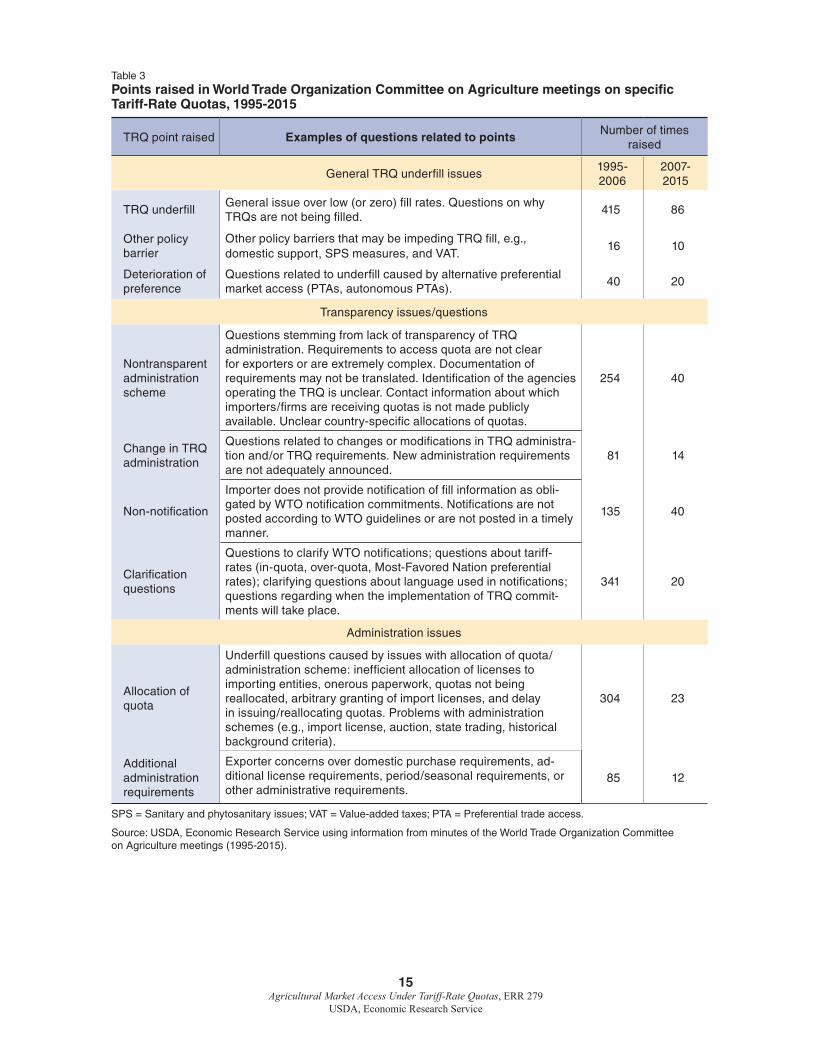
Questions and comments raised in meetings of the WTO Committee on Agriculture (COA) reflect concerns about the implementation of TRQs. The study authors documented over 1,400 questions and comments concerning TRQs from the minutes of nearly 80 COA meetings during 1995-2015. We classified the questions into three broad categories: “General TRQ underfill,” “Transparency,” and “Administration” and further classified the questions into nine subcategories. Table 3 presents the number of questions in these categories for the first 11 years after the Uruguay Round Agreement on Agriculture (1995-2006) and for a more recent period (2007-15).
The largest number of questions addressed TRQ underfill. During 1995-2006, members asked 415 questions about TRQs with low or zero fill, and they raised 86 such queries during 2007-15. A smaller number of questions asked whether low fill rates were due to other policies such as sani-tary and phytosanitary issues (SPS), value-added taxes (VAT), or preferential trade access (PTA). Some questions probed specific issues related to administrative procedures. Most of the other ques-tions asked for clarification of rules for import licenses, quota distribution, and other policies that may be responsible for low fill rates of quotas. During 1995-2006, over 600 requests were made for transparency-related clarifications about eligibility for quotas, complex rules for accessing quotas, and explanations of notifications. Transparency concerns were raised more than 100 times during 2007-15. Administrative issues were raised 389 times during 1995-2006, but only 40 times during 2007-15. Administrative concerns included questions related to difficulties with domestic purchase requirements and acquiring import licenses, as well as specific problems about an importing coun-try’s administration schemes.
15 Agricultural Market Access Under Tariff-Rate Quotas, ERR 279
USDA, Economic Research Service
Table 3 Points raised in World Trade Organization Committee on Agriculture meetings on specific Tariff-Rate Quotas, 1995-2015
TRQ point raised Examples of questions related to pointsNumber of times
raised
General TRQ underfill issues1995-2006
2007-2015
TRQ underfillGeneral issue over low (or zero) fill rates. Questions on why TRQs are not being filled.
415 86
Other policy barrier
Other policy barriers that may be impeding TRQ fill, e.g., domestic support, SPS measures, and VAT.
16 10
Deterioration of preference
Questions related to underfill caused by alternative preferential market access (PTAs, autonomous PTAs).
40 20
Transparency issues/questions
Nontransparent administration scheme
Questions stemming from lack of transparency of TRQ administration. Requirements to access quota are not clear for exporters or are extremely complex. Documentation of requirements may not be translated. Identification of the agencies operating the TRQ is unclear. Contact information about which importers/firms are receiving quotas is not made publicly available. Unclear country-specific allocations of quotas.
254 40
Change in TRQ administration
Questions related to changes or modifications in TRQ administra-tion and/or TRQ requirements. New administration requirements are not adequately announced.
81 14
Non-notification
Importer does not provide notification of fill information as obli-gated by WTO notification commitments. Notifications are not posted according to WTO guidelines or are not posted in a timely manner.
135 40
Clarification questions
Questions to clarify WTO notifications; questions about tariff- rates (in-quota, over-quota, Most-Favored Nation preferential rates); clarifying questions about language used in notifications; questions regarding when the implementation of TRQ commit-ments will take place.
341 20
Administration issues
Allocation of quota
Underfill questions caused by issues with allocation of quota/administration scheme: inefficient allocation of licenses to importing entities, onerous paperwork, quotas not being reallocated, arbitrary granting of import licenses, and delay in issuing/reallocating quotas. Problems with administration schemes (e.g., import license, auction, state trading, historical background criteria).
304 23
Additional administration requirements
Exporter concerns over domestic purchase requirements, ad-ditional license requirements, period/seasonal requirements, or other administrative requirements.
85 12
SPS = Sanitary and phytosanitary issues; VAT = Value-added taxes; PTA = Preferential trade access.
Source: USDA, Economic Research Service using information from minutes of the World Trade Organization Committee on Agriculture meetings (1995-2015).
16 Agricultural Market Access Under Tariff-Rate Quotas, ERR 279
USDA, Economic Research Service
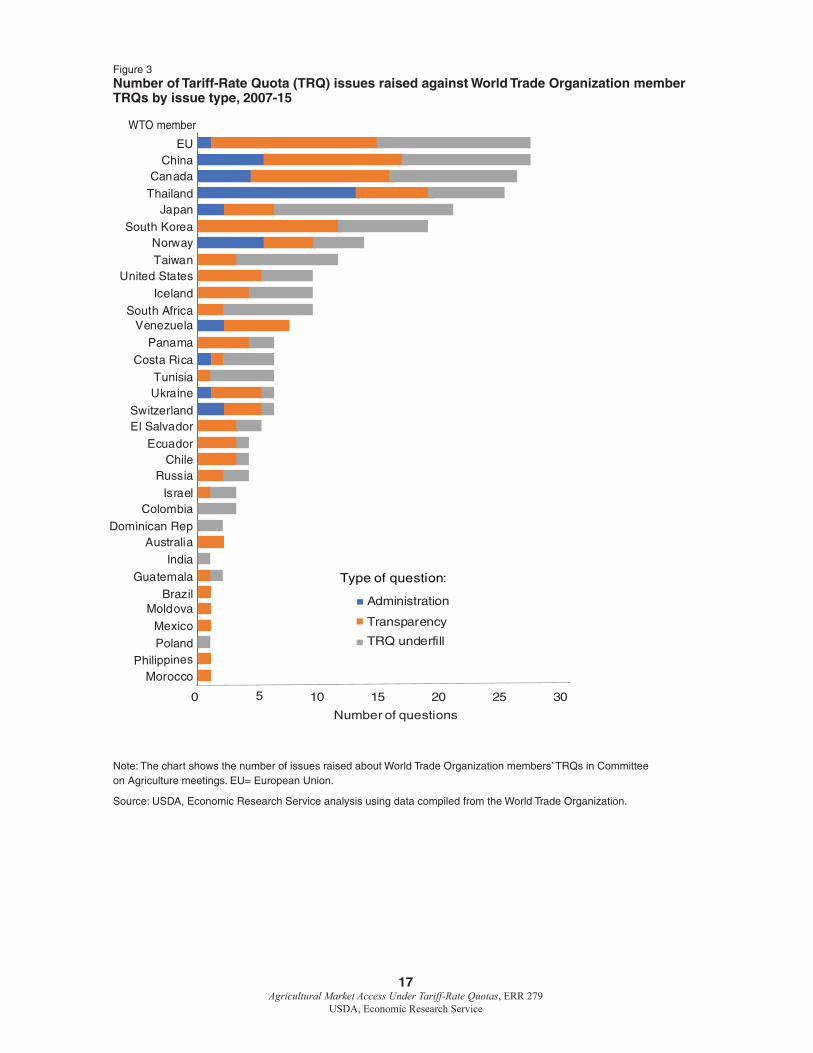
Figure 3 shows the relative number of TRQ-related questions that were directed to 32 WTO members during 2007-15. As noted, the questions were grouped into three major categories: administration, transparency, and TRQ underfill (table 3). The members receiving the largest number of questions were Canada, China, Thailand, the EU, Japan, and South Korea, each of which received 18 or more questions. Together, these six countries received more than half of the 265 questions. The United States received nine questions. Half of the members shown in figure 3 received one to five questions each.
Most members received questions about TRQ underfill; transparency issues were also raised with most members. Specific administration issues were raised less frequently; China, Canada, and Norway each received four to five questions on such issues. TRQ transparency and underfill ques-tions were raised in roughly equal frequency to Canada, China, and the EU, but quota underfill was the topic of most questions to Japan. Some details of these queries were as follows:
• The abundance of questions directed to the EU reflects its large number of TRQs. Many questions for the EU regarded low fill rates for its fruit, vegetable, and meat quotas. Members often questioned the EU’s country-specific allocations for many quotas.
• Canada received many questions regarding its dairy TRQs.
• Members commonly asked about low fill rates for South Korea’s TRQs, transparency concerns, and administrative procedures.
• In questioning Japan, members noted the complexity of its quota allocation methods for items like butter and nonfat dry milk. Members questioned whether new importers were deterred by Japan’s end-use requirements and use of historical business records to locate TRQs for some products.
• Thailand received the largest number of questions related to administration, specifically regarding import licensing, state trading, and frequent changes in procedures.
• Questions for China often addressed administrative procedures for allocating its grain TRQs.
• The United States received five questions on transparency issues and four on underfill, mainly in regard to sugar and dairy TRQs.
17 Agricultural Market Access Under Tariff-Rate Quotas, ERR 279
USDA, Economic Research Service
Figure 3 Number of Tariff-Rate Quota (TRQ) issues raised against World Trade Organization member TRQs by issue type, 2007-15
Note: The chart shows the number of issues raised about World Trade Organization members’ TRQs in Committee on Agriculture meetings. EU= European Union.
Source: USDA, Economic Research Service analysis using data compiled from the World Trade Organization.
0 10 15 20 25 30
MoroccoPhilippines
Poland
Mexico
MoldovaBrazil
Guatemala
India
AustraliaDominican Rep
ColombiaIsrael
RussiaChile
Ecuador
El SalvadorSwitzerland
UkraineTunisia
Costa Rica
Panama
VenezuelaSouth Africa
Iceland
United StatesTaiwan
NorwaySouth Korea
JapanThailand
CanadaChina
Administration
TRQ underfill
Number of questions
Transparency
5
WTO member
Type of question:
EU
18 Agricultural Market Access Under Tariff-Rate Quotas, ERR 279
USDA, Economic Research Service
Empirical Assessment of TRQ Fill
Persistent concerns about impediments to market access for commodities covered by TRQs are reflected by the significant number of TRQs with low fill rates, the frequency of the WTO Committee on Agriculture questions regarding low fill rates, and the 2013 Bali Ministerial Decision regarding clarification of procedures for managing TRQs and the adoption of mechanisms to monitor their use. Skully (2001a; 2001b) outlined several possible TRQ scenarios in which demand for imports could be less than, equal to, or beyond the quota. Similarly, Abbott (2002) specified three discrete regimes for trade under TRQs, depending on market conditions and the implementa-tion methods. Abbott noted that trade under TRQs could be no different from a simple tariff when the demand for imports is weak, while the two-tier tariff regime comes into play when imports exceed the quota. Abbott pointed out that the TRQ functioned like a traditional quota when imports reach the quota but do not exceed it. De Gorter and Kliauga (2006) identified eight possible regimes that focused on the most relevant policy instrument:7 These regimes revolved around:
• Whether quotas, in-quota tariffs, or over-quota tariffs are binding;
• The extent of quota underfill; and
• Whether there are over-quota imports.
Using a similar analytical approach, ERS classified TRQs into four regimes along two dimensions: fill rates and the difference between domestic and foreign prices.
This report incorporated a measure of border protection—the percent difference between domestic and border prices—as an indicator of the potential demand for imports traded under TRQs. While the tariff is an observable policy instrument that protects domestic markets, the impacts of administrative measures and other nontariff barriers are not directly observed or easy to quantify. Economists often measure these impacts by calculating rates of border protection (Tsakok, 1990). When there is no barrier to imports and domestic and imported commodities are similar in quality and other characteristics, supply-demand analysis suggests that arbitrage will equalize domestic and international prices plus the tariff. Thus, equal domestic and border prices are taken as an indi-cator that demand for imports has reached its potential. On the other hand, a persistent gap between domestic and international prices is taken as an indicator that a nontariff barrier may impede imports. Among the barriers are administrative procedures for managing TRQs—as discussed above—or other measures such as sanitary and phytosanitary rules that impede market access for imported commodities.
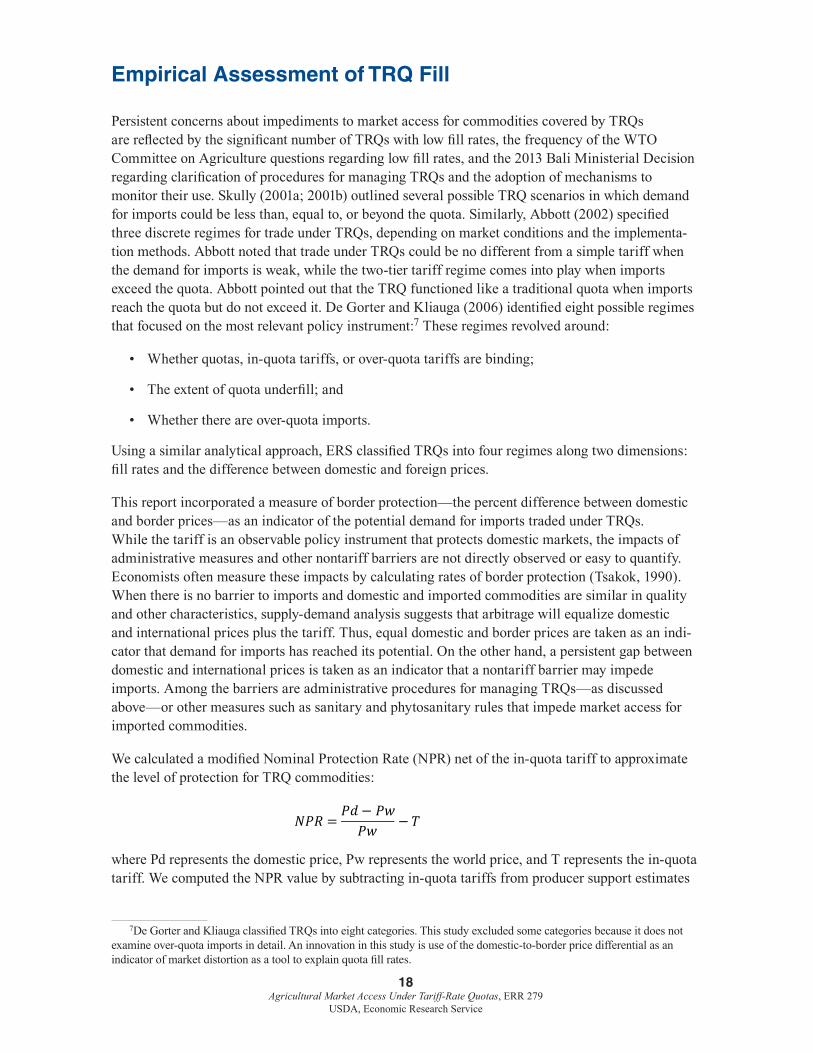
We calculated a modified Nominal Protection Rate (NPR) net of the in-quota tariff to approximate the level of protection for TRQ commodities:
where Pd represents the domestic price, Pw represents the world price, and T represents the in-quota tariff. We computed the NPR value by subtracting in-quota tariffs from producer support estimates
7De Gorter and Kliauga classified TRQs into eight categories. This study excluded some categories because it does not examine over-quota imports in detail. An innovation in this study is use of the domestic-to-border price differential as an indicator of market distortion as a tool to explain quota fill rates.
𝑁𝑃𝑅 =𝑃𝑑 − 𝑃𝑤
𝑃𝑤− 𝑇
19 Agricultural Market Access Under Tariff-Rate Quotas, ERR 279
USDA, Economic Research Service
(PSE), which were calculated by OECD for commodities with available data and were obtained from the OECD Agricultural Support database.
TRQ fill rates (imports/quota x 100), calculated from a member’s three most recent WTO notifica-tions through 2015, were classified as “high” or “low” using the 65-percent fill rate specified in the Bali Ministerial Decision as a threshold. Fill rates of 65-100 percent were classified as “high” and rates of 0-64 percent were classified as “low.”
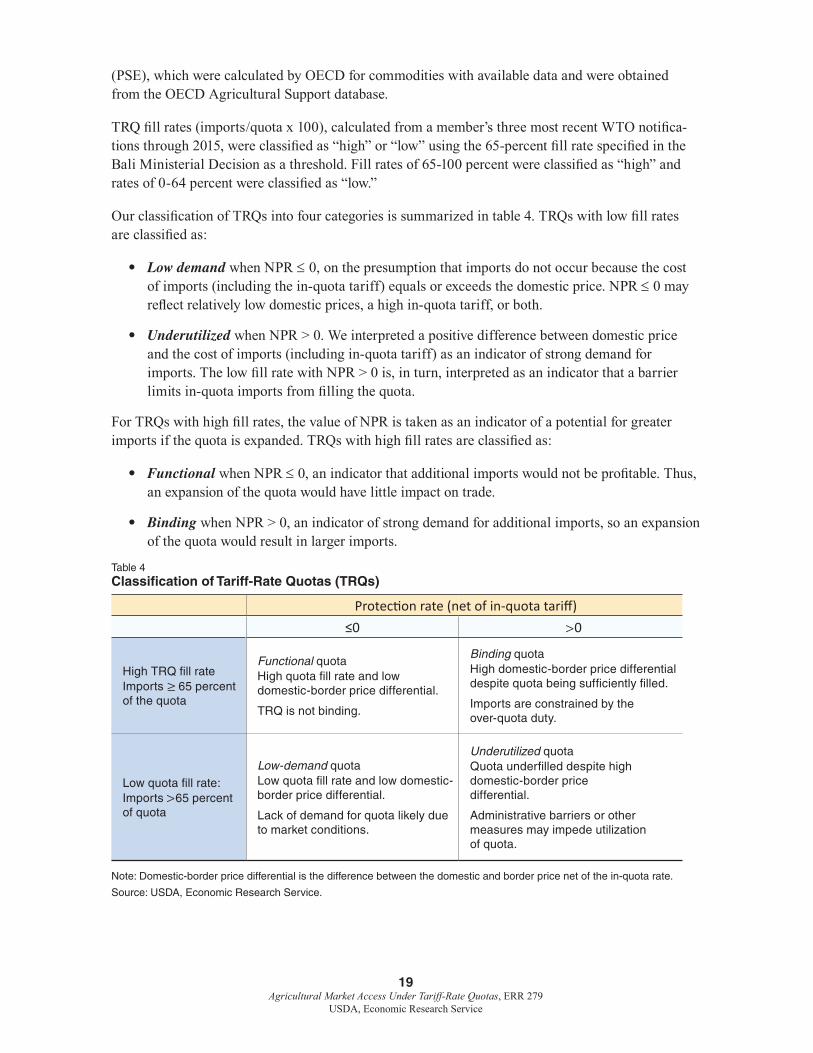
Our classification of TRQs into four categories is summarized in table 4. TRQs with low fill rates are classified as:
• Low demand when NPR ≤ 0, on the presumption that imports do not occur because the cost of imports (including the in-quota tariff) equals or exceeds the domestic price. NPR ≤ 0 may reflect relatively low domestic prices, a high in-quota tariff, or both.
• Underutilized when NPR > 0. We interpreted a positive difference between domestic price and the cost of imports (including in-quota tariff) as an indicator of strong demand for imports. The low fill rate with NPR > 0 is, in turn, interpreted as an indicator that a barrier limits in-quota imports from filling the quota.
For TRQs with high fill rates, the value of NPR is taken as an indicator of a potential for greater imports if the quota is expanded. TRQs with high fill rates are classified as:
• Functional when NPR ≤ 0, an indicator that additional imports would not be profitable. Thus, an expansion of the quota would have little impact on trade.
• Binding when NPR > 0, an indicator of strong demand for additional imports, so an expansion of the quota would result in larger imports.
Table 4 Classification of Tariff-Rate Quotas (TRQs)
Protection rate (net of in-quota tariff) ≤0 >0
High TRQ fill rateImports ≥ 65 percent of the quota
Functional quotaHigh quota fill rate and low domestic-border price differential.
TRQ is not binding.
Binding quotaHigh domestic-border price differential despite quota being sufficiently filled.
Imports are constrained by the over-quota duty.
Low quota fill rate:Imports >65 percent of quota
Low-demand quotaLow quota fill rate and low domestic-border price differential.
Lack of demand for quota likely due to market conditions.
Underutilized quotaQuota underfilled despite high domestic-border price differential.
Administrative barriers or other measures may impede utilization of quota.
Note: Domestic-border price differential is the difference between the domestic and border price net of the in-quota rate.
Source: USDA, Economic Research Service.
20 Agricultural Market Access Under Tariff-Rate Quotas, ERR 279
USDA, Economic Research Service
The analysis cannot discern whether NPR > 0 for “binding” or “underutilized” TRQs reflects the effects of the TRQ itself or the effects of other nontariff measures (NTMs) that may impede imports. In practice, some commodities covered by TRQs also have NTMs. Indeed, in the most import-sensitive agricultural sectors, NTMs and TRQs are often jointly present. For example, imports may be impeded by differing regulations and practices between trade partners regarding feed additives, genetically modified crops, inspections, and tolerances for foreign material in grain shipments. For such commodities, NPR > 0 may reflect the presence of both types of barriers. In these instances, gains in market access achieved by removing impediments to TRQ utilization or by expanding quotas may be limited (Beckman and Arita, 2017).
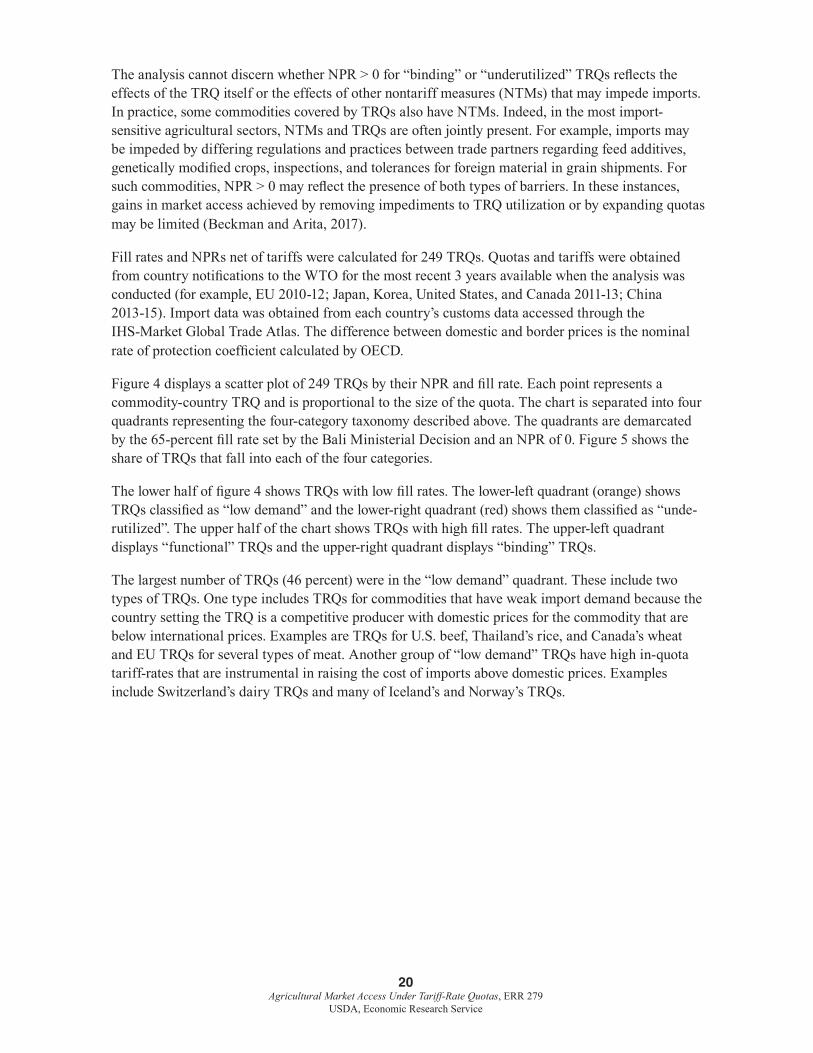
Fill rates and NPRs net of tariffs were calculated for 249 TRQs. Quotas and tariffs were obtained from country notifications to the WTO for the most recent 3 years available when the analysis was conducted (for example, EU 2010-12; Japan, Korea, United States, and Canada 2011-13; China 2013-15). Import data was obtained from each country’s customs data accessed through the IHS-Market Global Trade Atlas. The difference between domestic and border prices is the nominal rate of protection coefficient calculated by OECD.
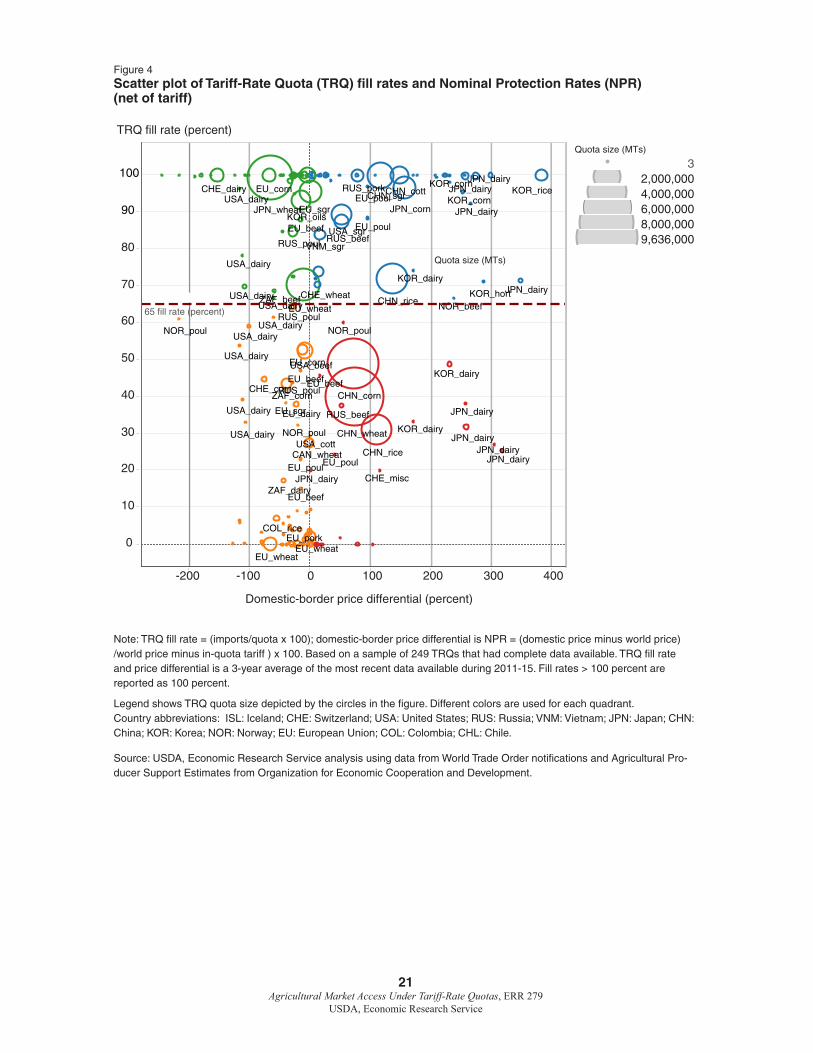
Figure 4 displays a scatter plot of 249 TRQs by their NPR and fill rate. Each point represents a commodity-country TRQ and is proportional to the size of the quota. The chart is separated into four quadrants representing the four-category taxonomy described above. The quadrants are demarcated by the 65-percent fill rate set by the Bali Ministerial Decision and an NPR of 0. Figure 5 shows the share of TRQs that fall into each of the four categories.
The lower half of figure 4 shows TRQs with low fill rates. The lower-left quadrant (orange) shows TRQs classified as “low demand” and the lower-right quadrant (red) shows them classified as “unde-rutilized”. The upper half of the chart shows TRQs with high fill rates. The upper-left quadrant displays “functional” TRQs and the upper-right quadrant displays “binding” TRQs.
The largest number of TRQs (46 percent) were in the “low demand” quadrant. These include two types of TRQs. One type includes TRQs for commodities that have weak import demand because the country setting the TRQ is a competitive producer with domestic prices for the commodity that are below international prices. Examples are TRQs for U.S. beef, Thailand’s rice, and Canada’s wheat and EU TRQs for several types of meat. Another group of “low demand” TRQs have high in-quota tariff-rates that are instrumental in raising the cost of imports above domestic prices. Examples include Switzerland’s dairy TRQs and many of Iceland’s and Norway’s TRQs.
21 Agricultural Market Access Under Tariff-Rate Quotas, ERR 279
USDA, Economic Research Service
Figure 4 Scatter plot of Tariff-Rate Quota (TRQ) fill rates and Nominal Protection Rates (NPR) (net of tariff)
-200 -100 0 100 200 300 400
Domestic-border price differential (percent)
0
10
20
30
40
50
60
70
80
90
100
ZAF_dairy
ZAF_corn
ZAF_beef
VNM_sgr
USA_sgr
USA_dairy
USA_dairy
USA_dairy
USA_dairy
USA_dairy
USA_dairy
USA_dairy
USA_dairy
USA_dairy
USA_cott
USA_beef
RUS_poul
RUS_poul
RUS_poul
RUS_pork
RUS_beef
RUS_beef
NOR_poul
NOR_poul NOR_poul
NOR_beef
KOR_oils
KOR_hort
KOR_dairy
KOR_dairy
KOR_dairy
KOR_corn
KOR_corn
JPN_wheat
JPN_dairyJPN_dairy
JPN_dairy
JPN_dairy
JPN_dairy
JPN_dairy
JPN_dairy
JPN_dairyJPN_dairy
JPN_corn
EU_wheat
EU_wheatEU_wheat
EU_sgr
EU_sgr
EU_poul
EU_poul
EU_poul
EU_poul
EU_pork
EU_dairy
EU_corn
EU_corn
EU_beef
EU_beefEU_beef
EU_beef
COL_rice
CHN_wheat
CHN_sgr
CHN_rice
CHN_rice
CHN_cott
CHN_corn
CHE_wheat
CHE_misc
CHE_dairy
CHE_corn
CAN_wheat
KOR_rice
65 fill rate (percent)
Quota size (MTs)
Quota size (MTs)
32,000,0004,000,0006,000,0008,000,0009,636,000
Quota size (MTs)
TRQ fill rate (percent)
Note: TRQ fill rate = (imports/quota x 100); domestic-border price differential is NPR = (domestic price minus world price) /world price minus in-quota tariff ) x 100. Based on a sample of 249 TRQs that had complete data available. TRQ fill rate and price differential is a 3-year average of the most recent data available during 2011-15. Fill rates > 100 percent are reported as 100 percent.
Legend shows TRQ quota size depicted by the circles in the figure. Different colors are used for each quadrant. Country abbreviations: ISL: Iceland; CHE: Switzerland; USA: United States; RUS: Russia; VNM: Vietnam; JPN: Japan; CHN: China; KOR: Korea; NOR: Norway; EU: European Union; COL: Colombia; CHL: Chile.
Source: USDA, Economic Research Service analysis using data from World Trade Order notifications and Agricultural Pro-ducer Support Estimates from Organization for Economic Cooperation and Development.
22 Agricultural Market Access Under Tariff-Rate Quotas, ERR 279
USDA, Economic Research Service
Figure 5 ERS classification of Tariff-Rate Quotas
Note: Based on the sample of tariff-rate quotas displayed in figure 4.
Source: USDA, Economic Research Service analysis using data from World Trade Organization notifications and Producer Support Estimates from Organization for Economic Cooperation and Development.
The smallest number of TRQs (13 percent) were in the “underutilized” quadrant. Notable among these are China’s TRQs for wheat, corn, and medium-grain rice, among the largest TRQs by vol-ume. The prominence of China’s grain TRQs in this category is consistent with a challenge brought against them in the WTO by the United States, which noted that the quotas did not fill despite large differences between domestic and international prices that made imports profitable. Dairy, poultry, and beef TRQs operated by Japan, Korea, Russia, EU, Norway, and Vietnam, and the EU’s rice TRQ, were also classified in this quadrant.
More than 40 percent of TRQs were classified in the upper two quadrants—the two categories with high fill rates. These are almost evenly split between “binding” (22 percent) and “functional” (19 percent). The binding TRQs in the upper-right quadrant (blue) include large TRQs for China long-grain rice, sugar, and cotton; Japan corn and rice; Korean rice; and U.S. sugar. Others include dairy TRQs operated by Japan, Korea, Mexico, and Norway; beef TRQs operated by Norway, Switzerland, and Russia; Russia’s pork TRQ; and sugar TRQs for Vietnam and South Africa.
The functional TRQs in the upper-left quadrant (green) include large TRQs exceeding 1 million tons for wheat in Japan and the EU, a sugar TRQ operated by the EU, and Korea’s edible oils TRQ. Others in this quadrant include corn TRQs for Colombia, South Africa, and EU; dairy TRQs for Colombia, South Africa, Iceland, and the United States; beef TRQs for Colombia, Zimbabwe, EU, Iceland, Israel, and Norway; sugar TRQs operated by Colombia; and poultry TRQs operated by the EU and Iceland.
Functional19%
Binding22%
Underutilized13%
Low demand46%
23 Agricultural Market Access Under Tariff-Rate Quotas, ERR 279
USDA, Economic Research Service
TRQ Classification for Selected Members
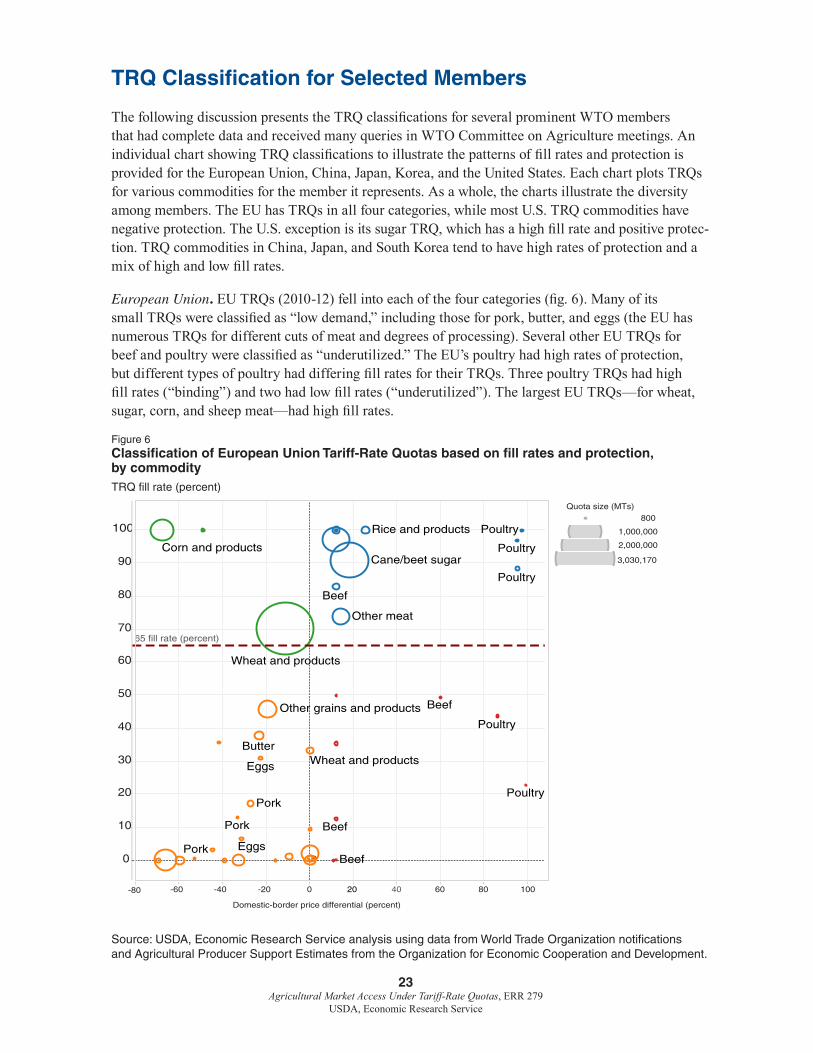
The following discussion presents the TRQ classifications for several prominent WTO members that had complete data and received many queries in WTO Committee on Agriculture meetings. An individual chart showing TRQ classifications to illustrate the patterns of fill rates and protection is provided for the European Union, China, Japan, Korea, and the United States. Each chart plots TRQs for various commodities for the member it represents. As a whole, the charts illustrate the diversity among members. The EU has TRQs in all four categories, while most U.S. TRQ commodities have negative protection. The U.S. exception is its sugar TRQ, which has a high fill rate and positive protec-tion. TRQ commodities in China, Japan, and South Korea tend to have high rates of protection and a mix of high and low fill rates.
European Union . EU TRQs (2010-12) fell into each of the four categories (fig. 6). Many of its small TRQs were classified as “low demand,” including those for pork, butter, and eggs (the EU has numerous TRQs for different cuts of meat and degrees of processing). Several other EU TRQs for beef and poultry were classified as “underutilized.” The EU’s poultry had high rates of protection, but different types of poultry had differing fill rates for their TRQs. Three poultry TRQs had high fill rates (“binding”) and two had low fill rates (“underutilized”). The largest EU TRQs—for wheat, sugar, corn, and sheep meat—had high fill rates.
Figure 6 Classification of European Union Tariff-Rate Quotas based on fill rates and protection, by commodity
Source: USDA, Economic Research Service analysis using data from World Trade Organization notifications and Agricultural Producer Support Estimates from the Organization for Economic Cooperation and Development.
TRQ fill rate (percent)
-60 -40 -20 0 20 40 60 80 100
Domestic-border price differential (percent)
0
10
20
30
40
50
60
70
80
90
100
Wheat and products
Cane/beet sugarCorn and products
Other grains and products
Other meat
Eggs
Butter
Rice and products
Wheat and products
Beef
Pork
Poultry
Eggs
Pork
Beef
Poultry
Poultry
Poultry
Pork
Beef
Beef
Poultry
65 fill rate (percent)
Quota size (MTs)800
1,000,000
2,000,000
3,030,170
-80
24 Agricultural Market Access Under Tariff-Rate Quotas, ERR 279
USDA, Economic Research Service
Figure 7 Classification of U.S. Tariff-Rate Quotas based on fill rates and protection, by commodity
TRQ fill rate (percent)
-120 -100 -80 -60 -40 -20 0 20 40 60
Domestic-border price differential (percent)
0
10
20
30
40
50
60
70
80
90
100
TRQ fill rate (percent)
Cane/beet sugar
Beef
Cheese
Cheese
Other sugar products
Cotton and products
Cheese
Cheese
Other dairy
Cheese
Butter
Cheese Other dairy
Cheese
Cotton and products
Cheese
65 fill rate (percent)
Quota size (MTs)3
200,000400,000600,000800,000
1,000,0001,117,195
Source: USDA, Economic Research Service analysis using data from World Trade Organization notifications and Agricultural Producer Support Estimates from the Organization for Economic Cooperation and Development.
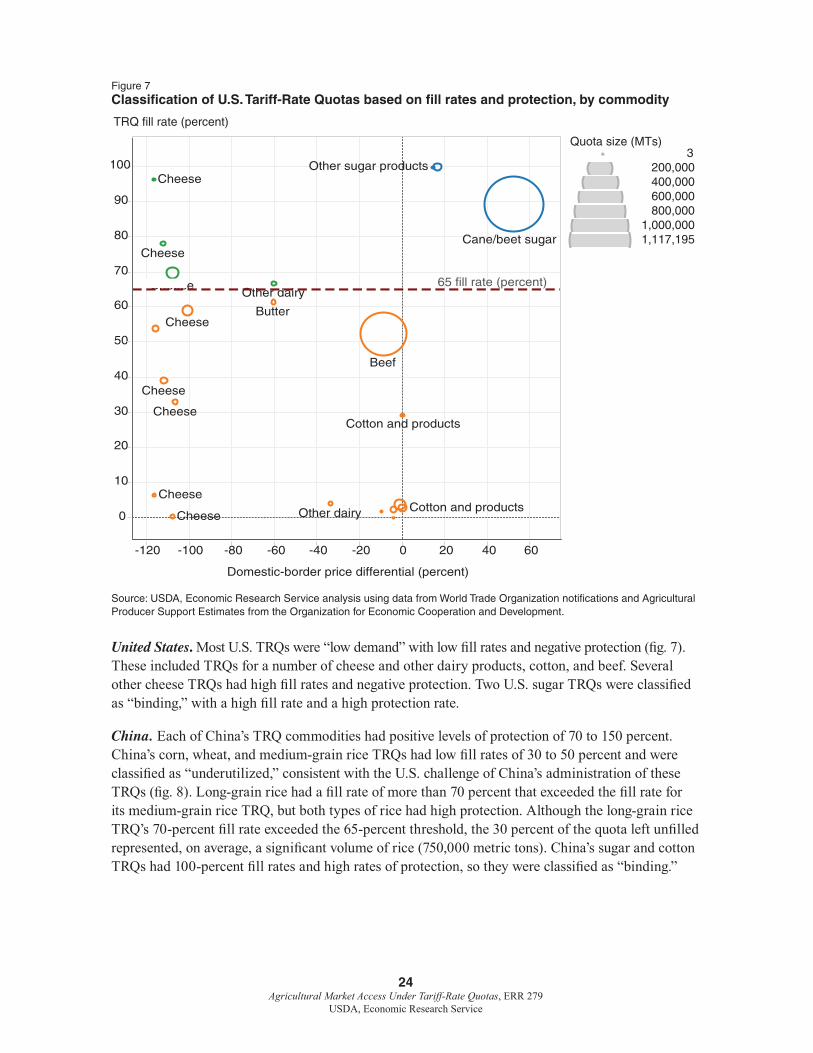
United States . Most U.S. TRQs were “low demand” with low fill rates and negative protection (fig. 7). These included TRQs for a number of cheese and other dairy products, cotton, and beef. Several other cheese TRQs had high fill rates and negative protection. Two U.S. sugar TRQs were classified as “binding,” with a high fill rate and a high protection rate.
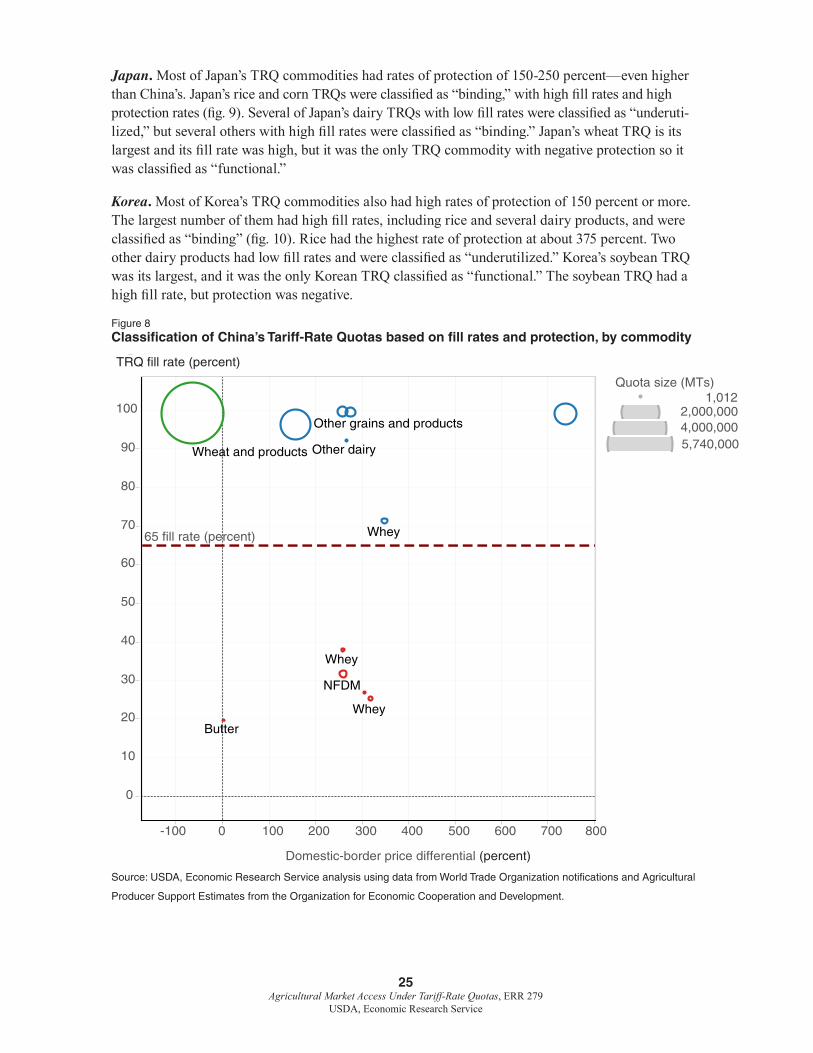
China. Each of China’s TRQ commodities had positive levels of protection of 70 to 150 percent. China’s corn, wheat, and medium-grain rice TRQs had low fill rates of 30 to 50 percent and were classified as “underutilized,” consistent with the U.S. challenge of China’s administration of these TRQs (fig. 8). Long-grain rice had a fill rate of more than 70 percent that exceeded the fill rate for its medium-grain rice TRQ, but both types of rice had high protection. Although the long-grain rice TRQ’s 70-percent fill rate exceeded the 65-percent threshold, the 30 percent of the quota left unfilled represented, on average, a significant volume of rice (750,000 metric tons). China’s sugar and cotton TRQs had 100-percent fill rates and high rates of protection, so they were classified as “binding.”
25 Agricultural Market Access Under Tariff-Rate Quotas, ERR 279
USDA, Economic Research Service
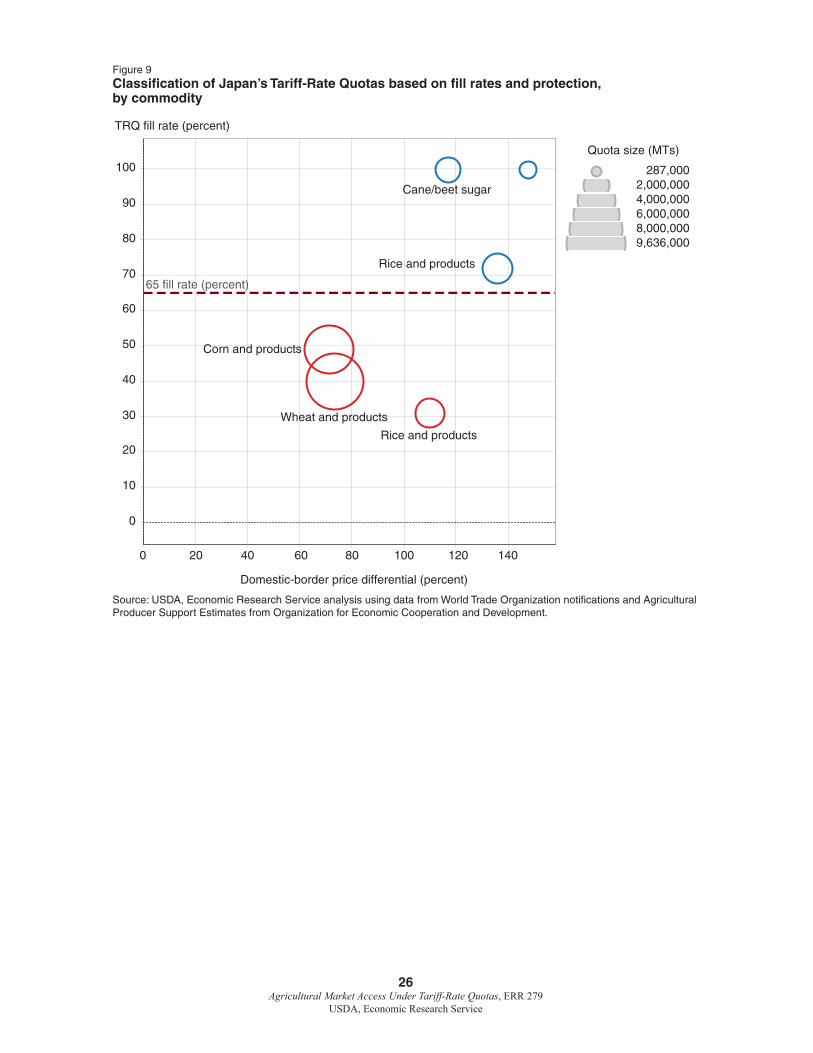
Japan . Most of Japan’s TRQ commodities had rates of protection of 150-250 percent—even higher than China’s. Japan’s rice and corn TRQs were classified as “binding,” with high fill rates and high protection rates (fig. 9). Several of Japan’s dairy TRQs with low fill rates were classified as “underuti-lized,” but several others with high fill rates were classified as “binding.” Japan’s wheat TRQ is its largest and its fill rate was high, but it was the only TRQ commodity with negative protection so it was classified as “functional.”
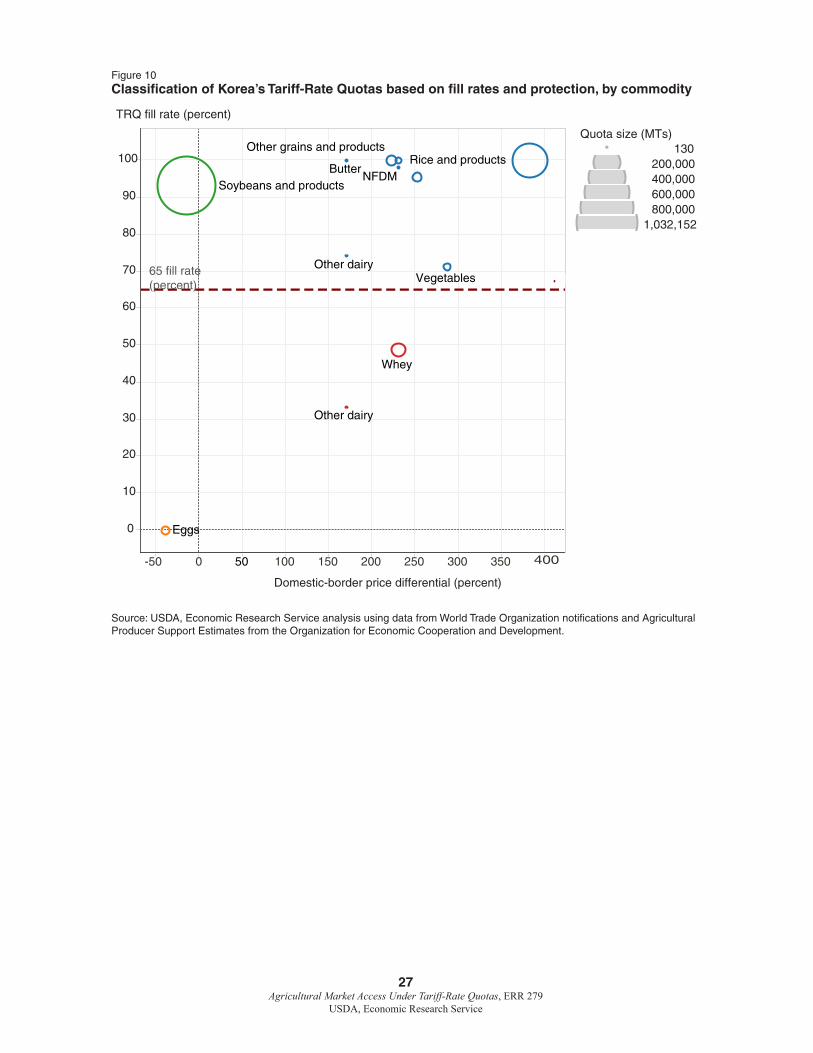
Korea . Most of Korea’s TRQ commodities also had high rates of protection of 150 percent or more. The largest number of them had high fill rates, including rice and several dairy products, and were classified as “binding” (fig. 10). Rice had the highest rate of protection at about 375 percent. Two other dairy products had low fill rates and were classified as “underutilized.” Korea’s soybean TRQ was its largest, and it was the only Korean TRQ classified as “functional.” The soybean TRQ had a high fill rate, but protection was negative.
Figure 8 Classification of China’s Tariff-Rate Quotas based on fill rates and protection, by commodity
Source: USDA, Economic Research Service analysis using data from World Trade Organization notifications and Agricultural
Producer Support Estimates from the Organization for Economic Cooperation and Development.
TRQ fill rate (percent)
-100 0 100 200 300 400 500 600 700 800
Domestic-border price differential (percent)
0
10
20
30
40
50
60
70
80
90
100
Wheat and products
Other grains and products
NFDM
Whey
Whey
Whey
Butter
Other dairy
65 fill rate (percent)
Quota size (MTs)1,012
2,000,0004,000,0005,740,000
26 Agricultural Market Access Under Tariff-Rate Quotas, ERR 279
USDA, Economic Research Service
Figure 9 Classification of Japan’s Tariff-Rate Quotas based on fill rates and protection, by commodity
Source: USDA, Economic Research Service analysis using data from World Trade Organization notifications and Agricultural Producer Support Estimates from Organization for Economic Cooperation and Development.
0 20 40 60 80 100 120 140
Domestic-border price differential (percent)
0
10
20
30
40
50
60
70
80
90
100
Wheat and products
Corn and products
Rice and products
Rice and products
Cane/beet sugar
65 fill rate (percent)
Quota size (MTs)
287,0002,000,0004,000,0006,000,0008,000,0009,636,000
TRQ fill rate (percent)
27 Agricultural Market Access Under Tariff-Rate Quotas, ERR 279
USDA, Economic Research Service
Figure 10 Classification of Korea’s Tariff-Rate Quotas based on fill rates and protection, by commodity
-50 0 50 100 150 200 250 300 350 400
Domestic-border price differential (percent)
0
10
20
30
40
50
60
70
80
90
100
Soybeans and products
Rice and products
Whey
Other grains and products
Eggs
Vegetables
NFDMButter
Other dairy
Other dairy
65 fill rate (percent)
Quota size (MTs)130
200,000400,000600,000800,000
1,032,152
TRQ fill rate (percent)
Source: USDA, Economic Research Service analysis using data from World Trade Organization notifications and Agricultural Producer Support Estimates from the Organization for Economic Cooperation and Development.
28 Agricultural Market Access Under Tariff-Rate Quotas, ERR 279
USDA, Economic Research Service
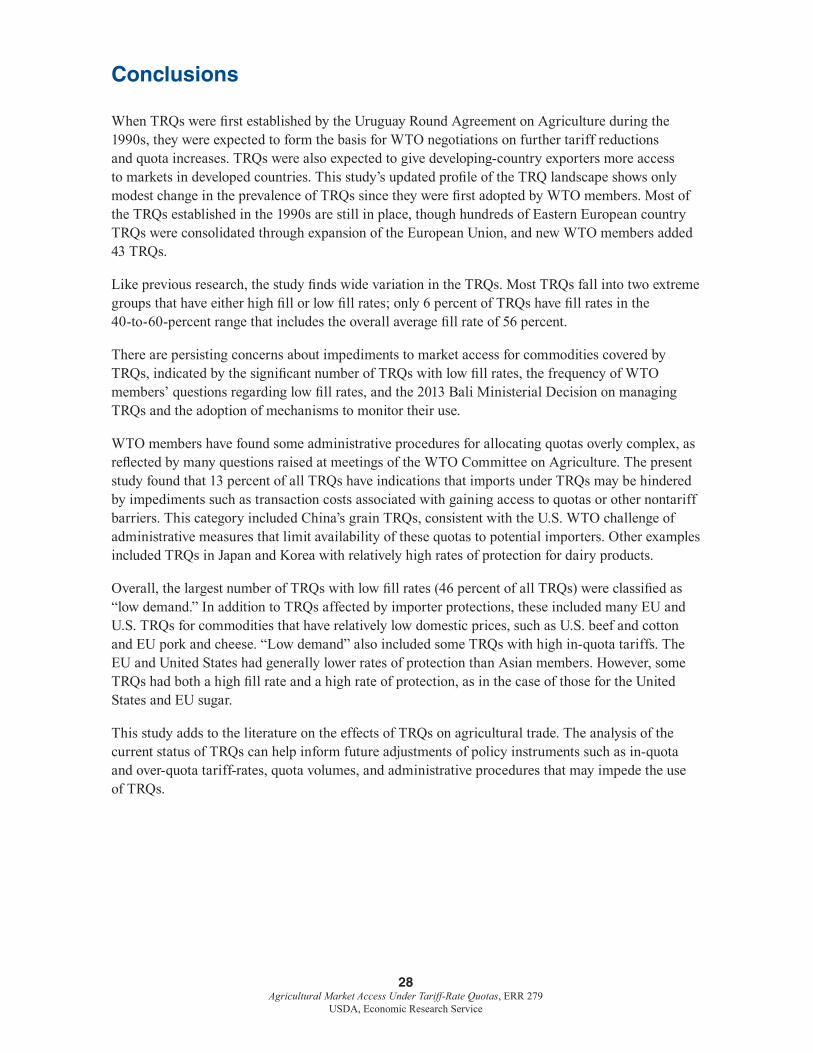
Conclusions
When TRQs were first established by the Uruguay Round Agreement on Agriculture during the 1990s, they were expected to form the basis for WTO negotiations on further tariff reductions and quota increases. TRQs were also expected to give developing-country exporters more access to markets in developed countries. This study’s updated profile of the TRQ landscape shows only modest change in the prevalence of TRQs since they were first adopted by WTO members. Most of the TRQs established in the 1990s are still in place, though hundreds of Eastern European country TRQs were consolidated through expansion of the European Union, and new WTO members added 43 TRQs.
Like previous research, the study finds wide variation in the TRQs. Most TRQs fall into two extreme groups that have either high fill or low fill rates; only 6 percent of TRQs have fill rates in the 40-to-60-percent range that includes the overall average fill rate of 56 percent.
There are persisting concerns about impediments to market access for commodities covered by TRQs, indicated by the significant number of TRQs with low fill rates, the frequency of WTO members’ questions regarding low fill rates, and the 2013 Bali Ministerial Decision on managing TRQs and the adoption of mechanisms to monitor their use.
WTO members have found some administrative procedures for allocating quotas overly complex, as reflected by many questions raised at meetings of the WTO Committee on Agriculture. The present study found that 13 percent of all TRQs have indications that imports under TRQs may be hindered by impediments such as transaction costs associated with gaining access to quotas or other nontariff barriers. This category included China’s grain TRQs, consistent with the U.S. WTO challenge of administrative measures that limit availability of these quotas to potential importers. Other examples included TRQs in Japan and Korea with relatively high rates of protection for dairy products.
Overall, the largest number of TRQs with low fill rates (46 percent of all TRQs) were classified as “low demand.” In addition to TRQs affected by importer protections, these included many EU and U.S. TRQs for commodities that have relatively low domestic prices, such as U.S. beef and cotton and EU pork and cheese. “Low demand” also included some TRQs with high in-quota tariffs. The EU and United States had generally lower rates of protection than Asian members. However, some TRQs had both a high fill rate and a high rate of protection, as in the case of those for the United States and EU sugar.
This study adds to the literature on the effects of TRQs on agricultural trade. The analysis of the current status of TRQs can help inform future adjustments of policy instruments such as in-quota and over-quota tariff-rates, quota volumes, and administrative procedures that may impede the use of TRQs.
29 Agricultural Market Access Under Tariff-Rate Quotas, ERR 279
USDA, Economic Research Service
References
Abbott, P. 2002. “Tariff-rate Quotas: Failed Market Access Instruments?” European Review of Agricultural Economics 29(1):109-30.
Beckman, J., and S. Arita. 2017. “Modeling the Interplay between Sanitary and Phytosanitary Measures and Tariff-rate Quotas under Partial Trade Liberalization.” American Journal of Agricultural Economics 99(4):1078-95.
De Gorter, H., and E. Kliauga. 2006. “Reducing Tariffs versus Expanding Tariff-Rate Quotas.” Chapter in Agricultural Trade Reform and the Doha Development Agenda. K. Anderson and W. Martin (eds.). World Bank, Washington, DC.
Gibson, P., J. Wainio, D. Whitley, and M. Bowman. 2001. Profiles of Tariffs in Global Agricultural Markets. Agricultural Economic Report 796, U.S. Department of Agriculture, Economic Research Service.
International Agricultural Trade Research Consortium (IATRC). 2001. Issues in Reforming Tariff-Rate Import Quotas in the Agreement on Agriculture in the WTO. H. de Gorter (ed.).
Skully, D. 2001a. “Liberalizing tariff-rate quotas.” Chapter 3 in Agricultural Policy Reform in the WTO—The Road Ahead. Agricultural Economic Report 802, U.S. Department of Agriculture, Economic Research Service.
Skully, D. 2001b. Economics of Tariff-Rate Quota Administration. Technical Bulletin No. 1893, U.S. Department of Agriculture, Economic Research Service.
Tsakok, I. 1990. Agricultural Price Policy: A Practitioner’s Guide to Partial Equilibrium Analysis. Cornell University Press, Ithaca, NY.
World Trade Organization (WTO). 2000. “Tariff and Other Quotas.” Background Paper by the Secretariat, Committee on Agriculture Special Session. G/AG/NG/S/7.
World Trade Organization (WTO). 2014. World Tariff Profiles.
World Trade Organization (WTO). 2015. World Tariff Profiles.
World Trade Organization (WTO). 2018. “Tariff Quota Administration Methods and Fill Rates 2007-2016.” Background Paper by the Secretariat, Committee on Agriculture. G/AG/W/183.
World Trade Organization (WTO). 2019a. China—”Tariff-Rate Quotas for Certain Agricultural Products. Report of the Panel.” WT/DS517/R.
World Trade Organization (WTO). 2019b. “Tariff Implementation Issues—Issues with Tariff-Rate Quotas.” Communication from the United States to Committee on Agriculture. JOB/AG/169.