Embed Size (px)
Citation preview

ECONOMIC REPORT 20152
ECONOMIC REPORT 2014

ECONOMIC REPORT 2015 3
1. Foreword 4
2. Industry at a Glance 6
3. Prices and Markets 10
4. GlobalReactiontotheOilPriceFall 18
5. MaintainingCompetitiveness– SeizingtheCostEfficiencyChallenge 22
6. EconomicContribution 32
7. Performance Indicators 42 8. CaseStudies 64
9 Appendices 74a. EU Emissions Trading Scheme 75b. The Fiscal Regime 77
10. Glossary 80

ECONOMIC REPORT 20154
1. Foreword
11. Foreword

ECONOMIC REPORT 2015 5
11
2
3
4
5
6
7
8
9
10
Oil & Gas UK’s Economic Report 2015 is the definitive guide to the current status and future prospects of the offshore oil and gas industry in
the UK. Data provided by Oil & Gas UK members, along with information from the Department of Energy & Climate Change, form the basis of this report.
This great industry of ours is facing very challenging times. The UK Continental Shelf (UKCS) has seen four successive years of record investment, but the return on that investment is being severely undermined by acute cost inflation. Last year, more was spent on UK offshore oil and gas operations than was earnt from production, a situation that has been exacerbated by the continued fall in commodity prices.
This is not sustainable and investors are therefore hard-pressed to commit to fresh activity here. Exploration for new resources has fallen to its lowest level since the 1970s and, with so few new projects gaining approval, capital investment is expected to drop from £14.8 billion (2014) by £2-4 billion in each of the next three years.
The significant fall in production efficiency and sharply rising costs have left the UK sector particularly exposed to the drop in oil price. However, even before the oil price fall, industry’s attention was focused on developing a coherent response to the challenges facing the basin while upholding the safety of the workforce. It is now widely recognised that a transformation in the way business is done is required if the UK sector is to become more resilient and competitive in a world of sustained lower oil prices.
This transformation is now under way. Alongside the UK Government’s restructuring of the tax regime to provide a more fiscally competitive proposition, as well as its funding of seismic surveys to open up new areas for exploration, the industry has been working hard to bring costs down and improve efficiency. The concerted action of companies is beginning to yield results and will help to restore the attractiveness of the basin.
The measures being taken to improve the efficiency of assets offshore have resulted in stronger delivery from existing fields. Oil & Gas UK expects the rate of decline in production from those fields to slow dramatically over the next two years. Taken together with the start-up of the sizeable Golden Eagle field, the government’s provisional data show that production in the first half of 2015 was three per cent higher than the same period in 2014, an indication that over this year we are likely to see the first annual production increase for 15 years.
Furthermore, we are now seeing companies’ commitment to improving cost and efficiency reflected in industry performance. We anticipate that by the end of 2016, companies will have reduced the cost of operating their existing assets by 22 per cent (£2.1 billion), though the fall will be offset to some extent by £1 billion of operating expenditure relating to fields brought on-stream in the intervening period.
With assistance from the recovering production profile, the average operating cost per barrel of oil equivalant (boe) is also expected to fall from £17.80 in 2014 to £17 this year and by a further £2-3/boe to around £15/boe by the end of 2016, almost reversing the last three years of consistent increases.
Regretfully, this transformation brings with it difficult decisions that have to be made across the industry. We estimate employment supported by the sector in the UK has contracted by 15 per cent since the start of 2014 to 375,000 jobs. It is likely that capacity may have to be reduced still further in order for the business to weather the downturn. The Scottish Government Energy Jobs Task Force and New Anglia Local Enterprise Partnership are active in supporting affected businesses and employees.
This human cost of job losses makes it all the more important that we build on the positive actions taken so far, redoubling our efforts to drive transformation so that the industry can emerge from the downturn in safe and competitive shape to grasp the opportunities that will continue to present themselves in the future.
The Efficiency Task Force co-ordinated by Oil & Gas UK will be key to raising the bar, with its pan-industry initiatives – focused on business process, standardisation and behavioural and cultural change – driving co-operation and improvement in efficiency over the next two years and beyond.
A continued low oil price will inevitably cause companies to reflect on the future viability of their assets. Retaining infrastructure and delaying decommissioning will be key to prolonging production from existing fields and promoting future developments. The constructive tripartite approach to maximising economic recovery of the UK’s oil and gas by HM Treasury, industry and the new regulator, the Oil and Gas Authority, will be crucial and Oil & Gas UK is already playing its part in a new phase of consultation on the tax and regulatory environment.
Over 43 billion boe have been produced to date from the UKCS. Almost half again remains to be extracted. Maximising the recovery of our oil and gas resource will strengthen the country’s energy security, boost tax revenues, exports and the balance of payments as well as sustain high value activity and jobs in our world-class supply chain. Everyone has a part to play in the transformation. This industry is embracing change and taking bold and purposeful action to emerge leaner, fitter and with a competitive and efficient cost base that will ensure a positive and sustainable future.
Challenging times continue, but I am confident that a corner is being turned.
DeirdreMichieChief Executive, Oil & Gas UK

ECONOMIC REPORT 20156
2

ECONOMIC REPORT 2015 7
Energy Supply
• Oil and gas provided 68 per cent of the UK’s total primary energy in 2014, with oil for transport and gas for heating being dominant in these markets.
• In 2030, 70 per cent of the UK’s total primary energy is expected to come from oil and gas, according to the Department of Energy & Climate Change (DECC).
• The UK Continental Shelf (UKCS) continues to satisfy just over 50 per cent of the UK’s oil and gas demand. Import levels are expected to rise to 74 per cent by 2030.
OilandGasPrices(moneyoftheday)
• The price for Brent oil averaged $99 per barrel (bbl) in 2014, lower than the nominal averages of $109 in 2013, $112 in 2012 and $111 in 2011.
• The price for Brent oil averaged $76/bbl in the fourth quarter of 2014 as the price fell rapidly from a peak of $110/bbl in June.
• Over the first six months of 2015, the price for Brent oil averaged $58/bbl.
• The month-ahead gas price at the National Balancing Point fell to an average of 51 pence per therm (p/th) over 2014 and has averaged 46 p/th over the first six months of 2015.
EconomicContribution
• The supply chain in the UK generated over £39 billion of sales in 2013 with similar figures estimated for 2014. These supply chain sales included over £16 billion of export of goods and services (in 2013).
• Offshore oil and gas extraction, last year, was the sixth largest contributor to national gross value added among the 37 production, manufacturing and construction sectors in the UK economy.
• Production of oil and gas boosted the balance of payments by £25.2 billion in 2014.
• The industry paid £2.2 billion in corporate taxes on production in 2014-15, the lowest in over 20 years because of falls in oil price and as a consequence of recent investments.
• Since 1970, the industry has paid over £330 billion in such taxes.
Employment
• It is estimated that the UKCS currently supports around 375,000 jobs1, most of which are highly skilled and well paid.
• This reflects an estimated 15 per cent contraction in employment since its peak at around 440,000 at the start of 2014.
• Cost reductions and efficiency improvements are key to ensuring the UKCS attracts fresh investment over the remainder of this decade, which is critical to future employment prospects of the basin.
2. Industry at a Glance
The following summarises the key findings of Oil & Gas UK’s Economic Report 2015. Figures are given in 2014 money unless otherwise stated.
1 This number reflects direct, indirect and induced employment. Direct employment – those employed by companies operating in the extraction of oil and gas and associated services. Indirect employment – employment as a result of supply chain effects caused by oil and gas sector activity. For these companies, extraction of oil and gas and associated services will be one part of a wider business. Induced employment – employment supported by the redistribution of income from the oil and gas sector.2
1
2
3
4
5
6
7
8
9
10
ECONOMIC REPORT 20158
Reserves/Resources
• More than 43 billion barrels of oil equivalent (boe) have been recovered since first production from the UKCS in 1967.
• Further overall recovery is forecast to be up to 22 billion boe.
• Considering the full range of opportunities available, the UKCS has the potential to deliver:
o 8-12 billion boe in existing reserves
o 1.5-4 billion boe in potential additional resources
o 2-6 billion boe in yet-to-find potential
DrillingActivity
• Over the first half of 2015, seven exploration wells were drilled, plus three appraisal wells (with six sidetracks) and 38 development wells (with 27 sidetracks).
• The number of wells drilled (including sidetracks) in 2014 was 14 exploration wells, 18 appraisal wells and 126 development wells.
• The results of exploration drilling continued to disappoint with nearly 60 million boe of recoverable reserves discovered last year, taking the total from 2012 to 2014 to just 168 million boe.
• The three-year average of around 55 million boe of recoverable reserves discovered per year is the lowest since exploration activity began on the UKCS.
• This year, the UK Government delivered funding of £20 million for seismic surveys in untapped regions of the UKCS to stimulate exploration.
Total Expenditure
• Total pre-tax expenditure on the UKCS was £26.6 billion last year, a three per cent increase on 2013, driven by capital investment and operating expenditure growth of around £0.4 billion and £0.8 billion, respectively.
• Since 1970, the industry has spent over £590 billion, comprising:
o £375 billion of capital investment in exploration drilling and field developments
o £215 billion on production operations
o £4 billion on decommissioning assets that have ceased production
• Rising expenditure and falling revenues, last year, led to a £4.2 billion cash-flow deficit, the largest on the UKCS since 1976.
CapitalInvestment
• Capital investment was £14.8 billion in 2014, the highest on record for the fourth successive year.
• It is expected to fall sharply this year to £10-11 billion.
• Based on current investment assumptions, Oil & Gas UK expects capital investment to fall by £2-4 billion per year from 2015 as large ongoing projects reach completion.
NewDevelopments
• Four new fields came on-stream in 2014, bringing approximately 190 million boe into production.
• DECC approved eight new fields last year, which will require capital investment of £2.4 billion to develop and are expected to yield 160 million boe of production over time. In addition, DECC has approved 28 brownfield projects of various sizes.
• The amount of fresh investment committed to new developments is expected to average £3-4 billion per year over 2016 and 2017, compared to almost £10 billion per year from 2011 to 2013.
OperatingCosts
• The cost of operating the UKCS rose by around nine per cent to £9.7 billion in 2014.
• As a result of industry cost and efficiency improvements, Oil & Gas UK anticipates expenditure on operating existing assets to fall by 22 per cent by the end of 2016 (£2.1 billion).
• Total operating expenditure is expected to fall to £9.3 billion in 2015 and £8.6 billion in 2016, when the new fields being brought on-stream are also factored in.
• Unit operating costs (UOCs) averaged £17.80 ($29.30)/boe in 2014 and are expected to fall to £17/boe this year.
• Average UOC reductions of £2-3/boe are anticipated by the end of 2016.

ECONOMIC REPORT 2015 9
Production
• Provisional data from DECC for the first six months of 2015 show an increase in production by around three per cent against the same period last year.
• In 2014, UKCS production averaged 1.49 million boe per day (in total 545 million boe), just 0.2 per cent less than 2013. This was the best year-on-year production performance since 2000, with many assets reporting improved production efficiency and new fields coming on-stream.
• The UK remains in the top 25 global producers of both oil (23rd) and gas (23rd).
Decommissioning
• Decommissioning expenditure is likely to rise from £1 billion in 2014 to over £2 billion in 2018, by which time over 50 fields will either be approaching or undertaking decommissioning.
• Some 475 installations, 10,000 kilometres of pipelines, 15 onshore terminals and 5,000 wells will eventually have to be decommissioned.
Editorial Note: The drafting of this report was undertaken during the period June to August 2015.
1
2
3
4
5
6
7
8
9
10

ECONOMIC REPORT 201510
3
ECONOMIC REPORT 2015 11
3.1 Oil Markets and Price Trends
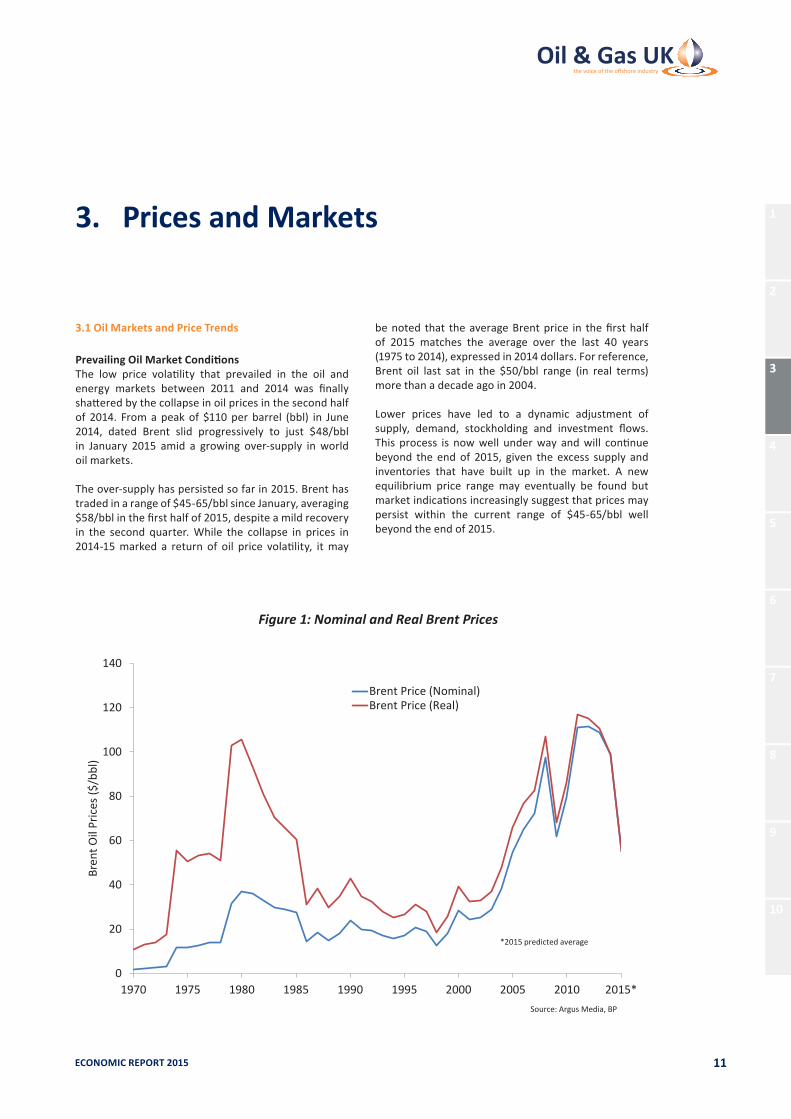
PrevailingOilMarketConditionsThe low price volatility that prevailed in the oil and energy markets between 2011 and 2014 was finally shattered by the collapse in oil prices in the second half of 2014. From a peak of $110 per barrel (bbl) in June 2014, dated Brent slid progressively to just $48/bbl in January 2015 amid a growing over-supply in world oil markets.
The over-supply has persisted so far in 2015. Brent has traded in a range of $45-65/bbl since January, averaging $58/bbl in the first half of 2015, despite a mild recovery in the second quarter. While the collapse in prices in 2014-15 marked a return of oil price volatility, it may
be noted that the average Brent price in the first half of 2015 matches the average over the last 40 years (1975 to 2014), expressed in 2014 dollars. For reference, Brent oil last sat in the $50/bbl range (in real terms) more than a decade ago in 2004.
Lower prices have led to a dynamic adjustment of supply, demand, stockholding and investment flows.This process is now well under way and will continue beyond the end of 2015, given the excess supply and inventories that have built up in the market. A new equilibrium price range may eventually be found but market indications increasingly suggest that prices may persist within the current range of $45-65/bbl well beyond the end of 2015.
0
20
40
60
80
100
120
140
1970 1975 1980 1985 1990 1995 2000 2005 2010 2015*
Bren
t Oil
Pric
es ($
/bbl
)
Brent Price (Nominal)Brent Price (Real)
Source: Argus Media, BP
*2015 predicted average
Figure 1: Nominal and Real Brent Prices
3. Prices and Markets
31
2
3
4
5
6
7
8
9
10
ECONOMIC REPORT 201512
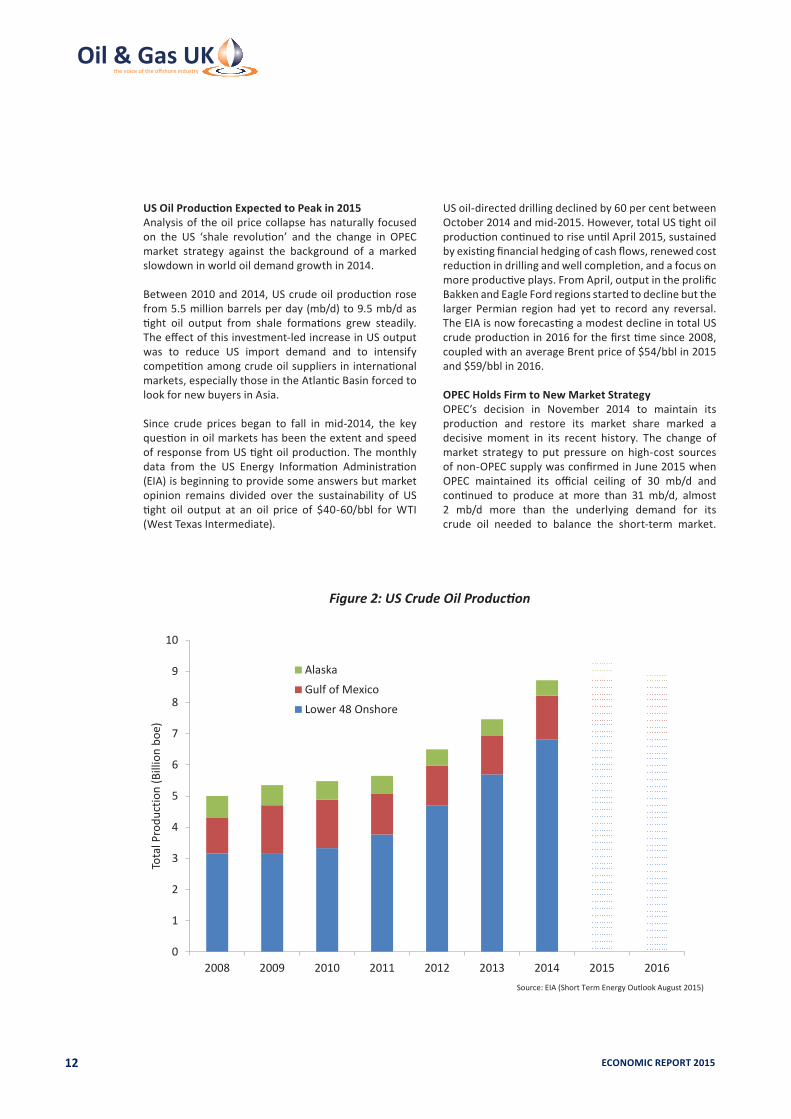
USOilProductionExpectedtoPeakin2015Analysis of the oil price collapse has naturally focused on the US ‘shale revolution’ and the change in OPEC market strategy against the background of a marked slowdown in world oil demand growth in 2014.
Between 2010 and 2014, US crude oil production rose from 5.5 million barrels per day (mb/d) to 9.5 mb/d as tight oil output from shale formations grew steadily. The effect of this investment-led increase in US output was to reduce US import demand and to intensify competition among crude oil suppliers in international markets, especially those in the Atlantic Basin forced to look for new buyers in Asia.
Since crude prices began to fall in mid-2014, the key question in oil markets has been the extent and speed of response from US tight oil production. The monthly data from the US Energy Information Administration (EIA) is beginning to provide some answers but market opinion remains divided over the sustainability of US tight oil output at an oil price of $40-60/bbl for WTI (West Texas Intermediate).
US oil-directed drilling declined by 60 per cent between October 2014 and mid-2015. However, total US tight oil production continued to rise until April 2015, sustained by existing financial hedging of cash flows, renewed cost reduction in drilling and well completion, and a focus on more productive plays. From April, output in the prolific Bakken and Eagle Ford regions started to decline but the larger Permian region had yet to record any reversal. The EIA is now forecasting a modest decline in total US crude production in 2016 for the first time since 2008, coupled with an average Brent price of $54/bbl in 2015 and $59/bbl in 2016.
OPEC Holds Firm to New Market StrategyOPEC’s decision in November 2014 to maintain its production and restore its market share marked a decisive moment in its recent history. The change of market strategy to put pressure on high-cost sources of non-OPEC supply was confirmed in June 2015 when OPEC maintained its official ceiling of 30 mb/d and continued to produce at more than 31 mb/d, almost 2 mb/d more than the underlying demand for its crude oil needed to balance the short-term market.
0
1
2
3
4
5
6
7
8
9
10
2008 2009 2010 2011 2012 2013 2014 2015 2016
Tota
l Pro
duct
ion
(Bill
ion
boe)
Alaska
Gulf of Mexico
Lower 48 Onshore
Source: EIA (Short Term Energy Outlook August 2015)
Figure 2: US Crude Oil Production

ECONOMIC REPORT 2015 13
Saudi Arabia’s crude oil production in June was reported to have reached a new record of 10.6 mb/d. Its renunciation of any role as swing supplier to the oil market has resulted in the steady build-up of inventories for six consecutive quarters in 2014 and 2015 and a diminished ability of the supply chain to continue to absorb current production.
There is little doubt that Saudi Arabia will have seen the signs of a reversal of US tight oil output, the recovery in its market share in Asia and the sharp cut in upstream capital expenditure in 2015 as the first indications of the success of its new strategy. However, the impetus to cut capital and operating costs among non-OPEC producers and the incentive for other OPEC producers to maintain export volumes may ensure that the battle for market share is protracted and painful for high-cost producers.
By mid-2015, Iraqi production had risen to 3.9 mb/d, the highest since 1979 and is believed to be capable of further expansion. Furthermore, in July, the conclusion of years of international negotiations over Iran’s nuclear capability is expected to lead to the partial lifting of sanctions after three years of restraint. This raises the prospect of a gradual recovery in Iranian production and exports in late 2015 and 2016 and further downward pressure on international crude prices.
Demand Responds Slowly to Lower PricesThe collapse in oil prices acted as a welcome stimulus to economic activity in oil-importing countries, including the UK. By dampening inflationary expectations and inducing a brief period of consumer price deflation in early 2015 in some developed economies, the fall in oil prices offered support to consumer expenditure and postponed further the long-expected tightening of US and UK monetary policy.
The collapse in crude oil prices did not feed through to end-users uniformly because product prices were slower to decline and, in many parts of the world, the link between international prices and end-user prices is muted by high taxes, exchange-rate movements or government consumer subsidies. Nonetheless, a demand-side response is now emerging in the US, Europe and non-OECD Asia. After recording demand growth of 0.7 mb/d in 2014, the International Energy Agency (IEA) is now projecting an increase of 1.6 mb/d this year and 1.4 mb/d in 2016. This represents above-trend growth over the last 15 years but is still not sufficiently rapid to eliminate quickly the current stock surplus.
LowerPricesinInvestmentAppraisalThe behaviour of long-dated oil futures prices provides an indication of how the recent spot price volatility has affected price expectations and how it may influence future upstream investment.
Between mid-2014 and the summer of 2015, the price of Brent futures for delivery in 2018 fell from $100/bbl to $62/bbl (see Figure 3 overleaf) and the futures curve moved from backwardation to contango, where prices for forward delivery are above current spot prices. While there is a tension between near-term price falls and anticipation of a higher price in the longer term, it is undoubtedly the case that investments are being screened against much lower oil prices than have been seen for a decade or more. Over the same period, wholesale gas prices at the UK National Balancing Point (NBP) for 2018 delivery have also declined, from 59 pence/therm (p/th) (or $10/million BTU (m BTU)) to 44 p/th ($7.30/m BTU), broadly in line with the shift in forward oil-indexed term contract prices in continental Europe.
StrongerDollarEasesImpactofLowerPricesonthe UKContinentalShelfThe UK Continental Shelf (UKCS), as part of the international upstream industry, is largely a US dollar-based industry. All oil revenues are dollar-denominated and gas revenues also reflect the influence of continental oil-indexed contract prices, even if the NBP-related revenues are denominated in sterling. Revenues from oil account for about 70 per cent of total UKCS operating revenues. The operating cost base also combines both dollar-denominated and local sterling-denominated elements.
As so often in the past, the recent sharp decline in dollar oil prices was accompanied by a strengthening of the US dollar against other traded currencies. This mitigated the impact of lower oil prices on the terms of trade for both oil-importing and oil-exporting countries. The relative strength of the US recovery and anticipation of a tightening of monetary policy and rise in US interest rates in 2015 reinforced the rise in the dollar. Against sterling, the dollar strengthened from 1.70 in mid-2014 to 1.50 in March/April 2015 (see Figure 4 overleaf). The chronic Eurozone crisis and the anticipation of a possible exit by Greece from the Eurozone accentuated the appreciation of the US dollar against the Euro. The effect of this dollar appreciation on UKCS producers was to slightly alleviate the severe squeeze on cash flow and margins arising from the fall in oil prices. At the time of writing, the $/£ exchange rate had reverted to 1.55, within the post-recession range of 1.50-1.70.
1
2
3
4
5
6
7
8
9
10

ECONOMIC REPORT 201514
1.20
1.30
1.40
1.50
1.60
1.70
1.80
1.90
2.00
2.10
2008 2009 2010 2011 2012 2013 2014 2015
US D
olla
r to
UK S
terli
ng E
xcha
nge
Rate
Source: Bank of England
Figure 4: US Dollar-UK Sterling Spot Exchange Rate
Figure 3: Brent Futures Curves Reflect Shift in Price Expectations
0
20
40
60
80
100
120
2014 2015 2016 2017 2018 2019 2020
Bren
t Fut
ures
Dai
ly S
ettle
men
t Pric
es ($
/bbl
)
End December 2013
Mid 2014
End December 2014
August 2015
Source: Intercontinental Exchange

ECONOMIC REPORT 2015 15
3.2 Gas Markets and Prices
RegionalgaspriceconvergenceGas markets around the world are increasingly inter-connected by liquefied natural gas (LNG) flows but still remain largely regional in nature. There is therefore no single world benchmark gas price of the kind represented by North Sea Brent in oil markets. Pricing of gas and LNG outside of North America is also marked by a difference between term contract prices, many of which remain linked to oil prices, and spot or hub prices for uncontracted supply. Oil-indexation of contract prices has diminished in Europe since 2009 as contract terms have been progressively renegotiated but the link still persists in Asian gas and LNG markets.
In 2014, there was a decline in traded gas and LNG prices in all major regions and a convergence of Asian and European markets, as illustrated in Figure 5. However, we did not see the complete convergence of all regional gas prices, as we did in 2009 in the depths of the worldwide recession. The difference lies in the contribution of the ‘shale gas revolution’ in lowering the cost structure of North American supply and in underpinning investment in new LNG export facilities on the US Gulf coast. The first LNG exports from the
US are expected towards the end of 2015 when the first train of Cheniere’s Sabine Pass liquefaction plant is commissioned.
The sharp weakening of European hub prices and Asian spot LNG prices preceded the collapse in oil prices, but the decline was later reinforced by oil market over-supply and low oil prices. By the beginning of this year, the Asian spot price premium over NBP had almost disappeared entirely after more than three years of tightness in LNG markets. US gas prices, represented by Henry Hub front month futures, also weakened from a winter peak in the first quarter of 2014 and settled back below $3/m BTU in 2015. The US economy continues to enjoy a gas cost advantage over European and Asian markets, which is reflected in much lower wholesale electricity prices, but the advantage narrowed in 2014 to a level last seen in 2010.
UKNBPWholesalePricesReflectEuropean Demand WeaknessAlmost all gas production from the UKCS is sold at prices explicitly related to prices at the NBP, the virtual hub based on the National Transmission System (NTS) owned and operated by National Grid. In 2014, UK gas production of 34.8 billion cubic metres (bcm) accounted
0
2
4
6
8
10
12
14
16
18
20
22
2008 2009 2010 2011 2012 2013 2014 2015
Gas P
rice
($/M
illio
n BT
U)
NBP Month Ahead
Henry Hub Front Month
Far East Spot LNG
Source: ICIS Heren, NYMEX Source: ICIS Heren, NYMEX
Figure 5: Regional Gas and Liquefied Natural Gas Prices, January 2008 to August 2015
1
2
3
4
5
6
7
8
9
10

ECONOMIC REPORT 201516
for about half the gas entering the NTS (67 bcm). NBP prices are closely correlated with hub prices in adjacent hub markets on the near-continent, notably Zeebrugge and the Dutch TTF (Title Transfer Facility) market, and reflect prevailing supply and demand conditions across north-west Europe.
Although NBP prices respond to many of the same influences as oil prices, the divergent behaviour of NBP and oil price since 2014 to 2015 is worthy of note. UKCS gas producers faced a major fall in NBP prices in the first half of 2014, whereas the fall for oil producers was concentrated in the last few months of the year.
Gas demand in Europe in 2014 fell 10.1 per cent to 452 bcm due to an exceptionally warm winter in
2013-14, the economic weakness of much of the Eurozone, price-induced demand restraint and further contraction of gas use for electricity generation in favour of coal and renewables.
In the UK, total gas demand in 2014 was 70.2 bcm, the lowest since 1994. Even if corrected to take account of the warmer-than-normal temperatures in 2014, demand would only be estimated at 75 bcm. Unlike most other EU countries, the UK recorded a slight increase in gas use for electricity generation, from 18.7 bcm to 19.8 bcm, as gas picked up market share after the permanent closure of old coal-fired plants. Based on provisional data for the first six months of this year and normal temperatures, UK gas demand in 2015 is expected to rise modestly to 72.5 bcm (plus 3.2 per cent).
0
20
40
60
80
100
120
1995 2000 2005 2010 2015
Gas B
alan
ce (b
cm)
Domestic Industrial Electricity Generation Other Energy Services
Source: DECC, Oil & Gas UK projection
Figure 6: UK Gas Demand by Sector

ECONOMIC REPORT 2015 17
Average month-ahead NBP prices fell to a four-year low of 51 p/th ($8.40/m BTU) in 2014, in response to acute demand-side weakness rather than the collapse in oil price. The influence of lower oil prices can be seen in the progressive erosion of prices for delivery in the winter of 2015-16 from 60 p/th in mid-2014 to 45 p/th at the time of writing.
Prompt NBP prices in the summer of 2015 have so far avoided the collapse seen in 2014, and the full-year average is expected to be in the range of 42-49 p/th. The slide in forward winter prices, despite the recent severe restrictions on production from the large Dutch Groningen field, indicates that there is adequate supply
in European gas markets even at times of peak winter demand. Excess supply is conventionally kept in check by export restraint by the holders of uncontracted pipeline gas. This role of regulating supply and defending NBP/TTF hub prices may be more difficult to perform once new sources of LNG enter the market in late 2015 and 2016, unless European demand unexpectedly reverses its policy-induced downward trend.
0
10
20
30
40
50
60
70
80
90
100
Gas P
rice
(p/t
h)
Day Ahead
Front Winter
Source: ICIS Heren
Figure 7: Daily National Balancing Point Prices, January 2010 to August 2015
1
2
3
4
5
6
7
8
9
10

ECONOMIC REPORT 201518
4

ECONOMIC REPORT 2015 19
4.1CapitalInvestmentCutsandCostDeflation
Figure 8 shows the changes in worldwide capital budgets for oil and gas exploration and production companies between 2014 and 2015 and illustrates how budgets are being tightened globally and not just in the UK. A Wood Mackenzie survey of 44 organisations found that each company plans to spend on average $1.7 billion less in 2015 than they did in 2014, representing an average fall of just over 25 per cent.
The vast majority of capital that companies still plan to invest in 2015 is on activity already committed to before the price fall. Although less than three per cent
of worldwide oil and gas capital is invested in the UK, the UKCS is particularly struggling to attract discretionary investment in new exploration, appraisal, or development activity.
The primary reason for the global reduction in capital investment is to restore cash flow at a time when revenues have been negatively impacted by oil prices. However, it is believed that investors are also postponing investment in anticipation of further cost deflation in the near term. For example, rig rates across the world are falling and those for the North Sea are shown in Figure 9 overleaf. The day-rate for semi-submersible rigs fell by around 40 per cent from January 2014 to
-10
-8
-6
-4
-2
0
2
4
6
Chan
ge in
Glo
bal C
apex
Bud
get (
US$
Billi
on)
Companies Investing in the UKCS
Companies not Investing in the UKCS
Source: Wood Mackenzie
Figure 8: Capital Budget Changes, 2015 versus 2014
4. GlobalReactiontotheOilPriceFall
41
2
3
4
5
6
7
8
9
10

ECONOMIC REPORT 201520
July 2015. Movement in jack-up rig day-rates has been less visible so far, as many are yet to be rebooked. These rates are expected to fall significantly once longer-term contracts are renegotiated.
It is anticipated that there will be similar deflationary pressure on the cost of subsea equipment; lease rates for floating, production, storage and offloading (FPSO) vessels; and platform installation, all of which are
expected to fall by at least ten per cent over the next two years. While cost deflation helps to improve the economics of investments on the UKCS, the fall in oil price also makes other less expensive basins more attractive to investors, putting further pressure on the UKCS.
0
50
100
150
200
250
300
350
400
450
500
Jan-
04
Jul-0
4
Jan-
05
Jul-0
5
Jan-
06
Jul-0
6
Jan-
07
Jul-0
7
Jan-
08
Jul-0
8
Jan-
09
Jul-0
9
Jan-
10
Jul-1
0
Jan-
11
Jul-1
1
Jan-
12
Jul-1
2
Jan-
13
Jul-1
3
Jan-
14
Jul-1
4
Jan-
15
Jul-1
5
Nom
inal
Rig
Rat
e (T
hous
and
$/Da
y)
Semi-Submersible Rigs
Jack-Up Rigs
Source: North Sea Reporter
Figure 9: North Sea Daily Rig Rates Based on Reported Contract Awards for Mobile Units
ECONOMIC REPORT 2015 21
4.2MergersandAcquisitions
As is often the case, the fall in oil price has led to speculation about an increase in mergers and acquisitions (M&A). After 18 months of little activity, there were signs that in the latter stages of 2014 the M&A market was becoming more liquid, when a flurry of smaller deals were followed by Repsol’s US$8.3 billion corporate takeover of Talisman2. The biggest deal of the price cycle occurred on 8 April 2015 when BG Group announced an agreement with Shell to sell its entire share capital for approximately £47 billion. Some industry commentators expected this to herald a summer of frantic M&A activity, but this has not materialised.
Smaller companies that are typically more heavily financed by debt than equity have a greater reliance on short-term revenues to balance cash flows and, as such, are often considered more susceptible to takeovers in the wake of significant falls in oil price. This has been the case in previous downturns, although there has been little evidence of such deals thus far during 2015. The few corporate acquisitions over the first half of 2015 may indicate that companies have been able to respond swiftly to the lower price environment by reducing costs and improving efficiency, but there could still be an increase in M&A activity over the remainder of this year and into 2016.
Furthermore, even if additional corporate deals fail to happen, individual assets on the UKCS are still likely to change hands. Many of the UKCS’ established players are seeking to divest their non-core assets and rationalise portfolios, while an increasing number of small private equity-backed businesses are looking to invest in UKCS assets to develop fresh portfolios and expand within the sector.
2 See http://bit.ly/1VWE5GP
1
2
3
4
5
6
7
8
9
10

ECONOMIC REPORT 201522
5

ECONOMIC REPORT 2015 23
5.1CostGrowth
As the UKCS evolves, it is inevitable that the costs of operating the basin and developing new opportunities will become an increasingly significant factor in its competitiveness, particularly as production declines from maturing fields and the size of new discoveries get smaller over time.
Cost growth on the UKCS, particularly since 2010, has been significantly higher than in other oil and gas provinces, including those around the North Sea. At the start of 2014, even with oil prices above $100, it had become apparent that the UKCS would become an increasingly uncompetitive destination for investment unless action was taken to address inflationary pressures and significantly improve the cost and efficiency of operations.
In response, Oil & Gas UK commissioned fresh studies to examine the drivers behind the rise in costs on the UKCS, working with a range of organisations including McKinsey. This analysis showed that capital costs per barrel of oil equivalent (boe) had increased by 18 per cent from 2004 to 2013 on a compound annual growth rate (CAGR) and operating costs per boe had risen at a 12 per cent CAGR. In both instances, the growth reflected the trend of declining volumes in both new and existing assets coupled with general cost increases in activities.
The rise in costs has been evident across fields of all ages and in all regions of the UKCS, although costs have been better controlled in the southern North Sea (SNS). It appears to be driven by three factors: increased commodity costs driving up unit costs; growth in activity (both in the UK and overseas) resulting in
0
5
10
15
20
25
2000 2001 2002 2003 2004 2005 2006 2007 2008 2009 2010 2011 2012 2013 2014
Aver
age
Lift
ing
Cost
/boe
($)
Angola Brazil
Denmark Egypt
Indonesia Netherlands
Nigeria Norway
UK US (Gulf of Mexico Deepwater)
Linear (UK)
Source: Wood Mackenzie
Figure 10: Weighted Average Lifting Costs for UK and Other Regions
5.MaintainingCompetitiveness– SeizingtheCostandEfficiencyChallenge
51
2
3
4
5
6
7
8
9
10
ECONOMIC REPORT 201524
greater demand for supply chain services; and reduced efficiency (greater effort expended to achieve a given output).
In 2014, unit operating costs (UOCs) averaged £17.80/boe ($29.30) and development costs £13.60/boe ($20). Total operating expenditure increased by just under £1 billion to reach a record £9.7 billion in 2014, while capital investment was at an all-time high of £14.8 billion (see Section 7 on performance indicators).
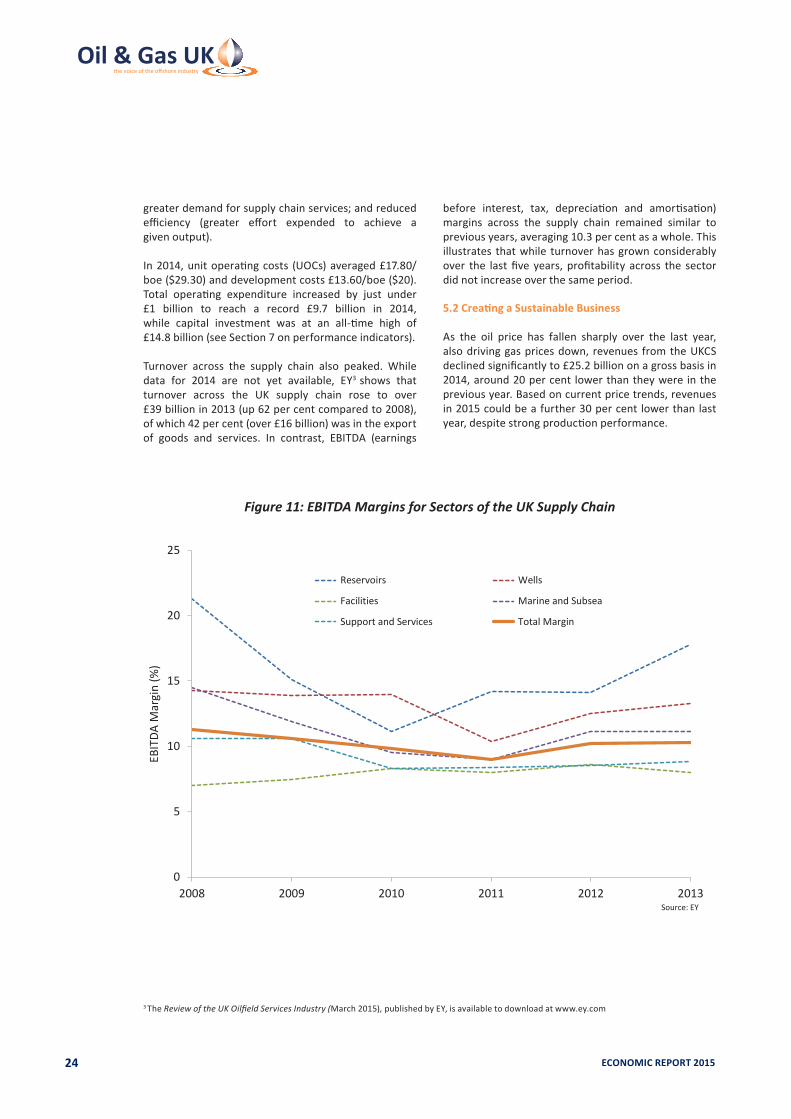
Turnover across the supply chain also peaked. While data for 2014 are not yet available, EY3 shows that turnover across the UK supply chain rose to over £39 billion in 2013 (up 62 per cent compared to 2008), of which 42 per cent (over £16 billion) was in the export of goods and services. In contrast, EBITDA (earnings
before interest, tax, depreciation and amortisation) margins across the supply chain remained similar to previous years, averaging 10.3 per cent as a whole. This illustrates that while turnover has grown considerably over the last five years, profitability across the sector did not increase over the same period. 5.2CreatingaSustainableBusiness
As the oil price has fallen sharply over the last year, also driving gas prices down, revenues from the UKCS declined significantly to £25.2 billion on a gross basis in 2014, around 20 per cent lower than they were in the previous year. Based on current price trends, revenues in 2015 could be a further 30 per cent lower than last year, despite strong production performance.
0
5
10
15
20
25
2008 2009 2010 2011 2012 2013
EBIT
DA M
argi
n (%
)
Reservoirs Wells
Facilities Marine and Subsea
Support and Services Total Margin
Source: EY
Figure 11: EBITDA Margins for Sectors of the UK Supply Chain
3 The Review of the UK Oilfield Services Industry (March 2015), published by EY, is available to download at www.ey.com

ECONOMIC REPORT 2015 25
As Figure 12 shows, when the total revenues from the UKCS as a whole are compared against the combined expenditure on investment, exploration, operations and decommissioning, the basin is seen to be cash-flow negative, on a post-tax basis. The industry last had such a cash-flow deficit four decades ago when the first large discoveries were being developed. As then, much of the expenditure in recent years has been targeted at a few large projects. It cannot be guaranteed that revenues from these same new developments will prove sufficient to see a swift recovery in net cash flow. Nor will this help many existing fields that will still have operating costs that are approaching or exceeding their production revenues.
Simply put, the basin is spending more than it earns. It had significant cost challenges when oil was at $110/bbl and the scale of the issue has escalated as the oil price collapsed. In 2014, at $50/bbl, almost 20 per cent of oil production was from fields that were cash-flow negative.
For many companies, in the current business environment, the UKCS no longer offers an attractive investment proposition and, as a result, capital investment is forecast to fall by £2-4 billion per year (see Section 7.5 for more on capital investment). Exploration and appraisal (E&A) drilling has also fallen to levels last seen in the 1970s (see Section 7.3), which is a concern in terms of finding new discoveries for possible future development.
-20
-10
0
10
20
30
40
50
60
70
1970
1971
1972
1973
1974
1975
1976
1977
1978
1979
1980
1981
1982
1983
1984
1985
1986
1987
1988
1989
1990
1991
1992
1993
1994
1995
1996
1997
1998
1999
2000
2001
2002
2003
2004
2005
2006
2007
2008
2009
2010
2011
2012
2013
2014
2015
Cash
Flo
w (£
Bill
ion
-201
4 M
oney
)
Gross Revenue
Post-Tax Costs
Post-Tax Cash Flow
Source: DECC, Oil & Gas UK
Figure 12: Cash Flow Forecast
1
2
3
4
5
6
7
8
9
10

ECONOMIC REPORT 201526
AThree-ProngedApproachTowardsRegenerationOver the last year, there has been collective action by industry, the regulator and the UK Government to improve the UKCS’ competitiveness, encourage fresh investment, and extend the life of existing assets and infrastructure that may otherwise be decommissioned:
• HM Treasury announced a range of tax reforms, including the Investment Allowance, in the March 2015 Budget to help attract fresh investment. This received continued endorsement in the summer Budget 2015 (see Section 7.5 for more details under promoting investment).
• The new regulator, the Oil and Gas Authority (OGA), has been established and will work to improve stewardship of the basin.
• The industry is now building on these efforts by delivering the cost and efficiency improvements required to secure the UKCS’ long-term future (further details below).
5.3 Industry Response
All the indications are that there will not be a swift increase in commodity prices to offset the increasingly expensive cost base in the UKCS. The industry must instead rapidly adapt to a world of lower prices. There are no easy choices. A decade ago, the industry was seen to be able to prosper at such oil prices. Since then, costs have risen, production has fallen and infrastructure has aged. The industry recognises it needs to improve efficiency and reduce costs for safe and sustainable operations and is responding quickly to the challenge.
When businesses come under pressure, cost reduction tends to take priority for up to nine months. New projects on the UKCS are simply not attracting investment so operators and contractors have to make tough decisions on budgets and capacity. Such behaviour is inevitable and has already been seen by many businesses as they seek to regain control and balance expenditure against income.
Alongside cost-cutting, however, there is an appetite for innovation and efficiency improvement that will deliver value for both client and supplier. Experience shows, however, that significant efficiency improvements cannot happen overnight. These changes often take
longer to implement but yield greater benefits than simply cost cutting. The transformation, outlined in Figure 13 opposite, can take between 12 months and three years to achieve and can only come about through true co-operation and a cultural change in the shape of collaborative working between operators, major contractors and small to medium sized enterprises (SMEs). There is also an important role for unions, governments, regulators and trade associations.
Oil&GasUKEfficiencyTaskForceWhile recognising that some behavioural change will be company-specific, Oil & Gas UK is taking the lead to help drive pan-industry initiatives to achieve efficiency improvements and transformational change. It is important for companies to consider how they can support this transition.
The focus on pan-industry initiatives is being formalised under Oil & Gas UK’s Efficiency Task Force with the objective of driving improvement in efficiency over the next two years and beyond, creating a sustainable industry. A dedicated well-resourced team has been set up within Oil & Gas UK to focus on three workstreams: • Business Process • Standardisation• Co-operation, Culture and Behaviours
Industry is also seeking to learn from other sectors that have overcome similar challenges. PwC, commissioned by the Oil and Gas Industry Council, recently published a study4 highlighting success in other sectors (such as automotive, rail and chemicals) from which industry is drawing tangible measures that can be transferred to offshore oil and gas.
4 The Cross Sector Efficiency Study is available to download at http://pwc.to/1P0xdmF

ECONOMIC REPORT 2015 27
Transformational Change
Efficiency Improvement
CostReduction
12 – 36 months
5 – 18 months
3 – 9months
10-15%•Spend
reduction•Tactical
process improvements
•Cost avoidance
15-25%•Activity
reduction•Consolidation•Organisation
design•Technology
25-40%•Asset/service/
geographic restructure
•M&A + network integration
•Operating model
Source: Deloitte LLP
Figure 13: Transforming the UKCS’ Cost Structure
Efficiency Task Force
EfficiencyTask Force
Business Process Standardisation Co-operation, Culture and Behaviours
The objective of the Efficiency Task Force is to drive a pan-industry improvement in efficiency over the next two
years and beyond, creating a sustainable industry
Figure 14: Oil & Gas UK’s Effi ciency Task Force – Objecti ve and Workstreams
1
2
3
4
5
6
7
8
9
10

ECONOMIC REPORT 201528
BehaviourChange–BusinessProcessThe industry recognised last year that cost inflation urgently needed to be addressed. Even when the oil price was at $110/bbl, that need was clear and the work that companies started then is already bearing fruit. Some companies are well down the road of reviewing their business processes and identifying where efficiencies can be made and Oil & Gas UK is keen to help share case studies with other companies.
One major operator has accelerated the completion of planned tasks by 12 per cent over three months by encouraging offshore teams to use visualisation techniques to enhance the planning of operations and maintenance activities. Another operator has reviewed its inventory management process and re-assigned stock identified as surplus to requirements to productive projects in another location, at a much lower cost and in a shorter timescale than it would otherwise have taken to source the materials. A semi-submersible drilling contractor has, meanwhile, reduced the cost of plugging and abandoning (P&A) wells by 30 to 40 per cent by reviewing its processes and adopting a batch approach.
Another major operator analysed how it uses unplanned rotating equipment support. After discussing alternative contract models with its supplier, the company switched from a fixed monthly fee to a pay-as-you-go service and saved about $360,000.
Meanwhile, a major engineering contractor introduced a new method to replace defective caissons more quickly in response to demand from a customer. The new approach meant the job could be completed in a third of the time and more safely. Expanding foam was pumped down the caisson, fully encapsulating corroded
internal dip pipes. This removed the risk of the pipes becoming detached during the cassion’s removal and falling onto a gas export line located below and allowed the top of the caisson to be cut away in larger sections than before, saving time and reducing costs.
Oil & Gas UK is also driving several pan-industry initiatives to help improve business processes. It has published guidance on how to execute planned maintenance shutdowns more efficiently to reduce production losses. The association has also developed an online portal of spare part inventories across the sector, which will allow companies to source replacement equipment quickly and efficiently with the aim of reducing production downtime. Details of drilling rig availability are also being shared to plan and optimise well operations.
The Efficiency Task Force will be reinforcing these efforts with a focus on improving business processes such as procurement, logistics and warehousing.
BehaviourChange–StandardisationThe tendancy for over-specification of products and services, in which both operators and contractors have played a role, has been a great driver of rising costs. It is thought that simplification and standardisation in areas such as well P&A, subsea and valves could deliver savings of more than 15 per cent over the next decade.
Individual projects are already under way; for example, an exercise to map control of work and training processes to identify priority areas where standardisation will achieve improvements in efficiency. The findings will help the industry to address duplication of standards relating to safety-critical roles and tasks.
BUSINESS PROCESS
STANDARDISATION

ECONOMIC REPORT 2015 29
Meanwhile, the Efficiency Task Force intends to consider the savings to be achieved from a shared and common approach to routines and the supply of equipment. A key focus will be to review specifications of valves and piping classes, processes for routine well P&A and subsea technology.
BehaviourChange–Co-operation,Culture andBehavioursThe longer-term transformational change (referred to in Figure 13 previously) can only come about with true co-operation and cultural change in the shape of collaborative working between operators, major contractors and SMEs, harnessing the energy, insight and innovation that each participant can bring to embed new ways of working and create new business models. Such an approach will continue to be a fundamental requirement to secure the industry’s future.
There are already bright spots emerging where companies are taking the initiative and working with natural competitors for better outcomes. One specialist in developing marginal fields is leading a consortium of companies so that those with additional technology and expertise in this discipline can come together to offer more cost-effective ways for clients to overcome technical challenges. A major operator has joined forces with the operator of neighbouring acreage to use seismic data enhancement techniques and drill a well on a prospect thought to stretch across both blocks. As a result, a commercial discovery has been made.
Furthermore, logistics companies are offering shared services of supply vessels, all in the name of using available resources more efficiently and at lower cost.
The challenge of seeing beyond traditional methods and finding ways to share innovative working practices
with the rest of the industry is great and will require a very different approach from all players. To succeed, the approach needs to involve everyone in the workforce. The Efficiency Task Force will consider the merits of an Efficiency Charter and efficiency sharing events to achieve this.
The automotive industry demonstrates what can be achieved through concerted action to tackle costs and improve efficiency within a high technology sector. Vehicle manufacturers recognised that standalone cost improvement programmes would not deliver the necessary cost reduction to sustain their market growth, while outsourcing and operational improvement programmes such as ‘Lean’ could help but were insufficient. In response, collaboration across the sector, both regionally and globally, was pursued to good effect. Strategic alliances emerged between leading manufacturers and with key equipment suppliers; support and logistic processes were shared across the industry. Shared manufacturing facilities, standard components, sub-frames and model architecture are increasingly the norm while retaining strong and separate brand identities.
1
2
3
4
5
6
7
8
9
10
CO-OPERATION,CULTURE ANDBEHAVIOURS

ECONOMIC REPORT 201530
5.4CostandEfficiency:AchievementstoDate
Early improvements in the cost and efficiency of operations on the UKCS are already apparent. The portfolio of assets is constantly evolving as new fields start up and some old fields are decommissioned. Typically, fields perform better in their early years before production comes off plateau and more regular maintenance interventions are required. New start-ups usually have a positive impact on UOCs, which, when looked at on a UKCS basis, can mask problems experienced in some of the older assets. One of the aims of this report is to unpick the impact new start-up fields have on production and operating costs to investigate how well the industry is doing in reducing costs and maintaining production in its existing assets.
As reported, £9.7 billion was spent in 2014 operating the UKCS. When considering the impact of the current cost and efficiency drive, the costs of operating existing assets are expected to fall by 22 per cent by the end of 2016. This involves significant cost reductions by the existing business of almost £800 million (eight per cent) this year and a further £1.3 billion (14 per cent) next year. However, as a number of new fields will be brought on-stream over the next two years, some of this gain will in part be offset. As a consequence, total operating expenditure is expected to fall to £9.3 billion this year and fall further to £8.6 billion next year.
Extensive work was carried out to improve asset performance in response to the sharp fall in production over the period 2010 to 2013, which led to significant increases in operating cost. This investment is now
Reduction from Existing Fields
Contribution from New Fields
0
8.0
8.5
9.0
9.5
10.0
2014/15 2015/16
Tota
l Ope
ratin
g Co
sts
(£ B
illio
n)
Source: Oil & Gas UK
9.7
8.9
9.3 9.3
8.0
8.6
Figure 15: Changes in Operating Costs (New versus Existing Fields)
ECONOMIC REPORT 2015 31
545
521
548 548
569
532
Contribution from New Fields
Reduction from Existing Fields
0
520
530
540
550
560
570
2014/15 2015/16
Tota
l Pro
ducti
on (M
illio
n bo
e)
Source: Oil & Gas UK
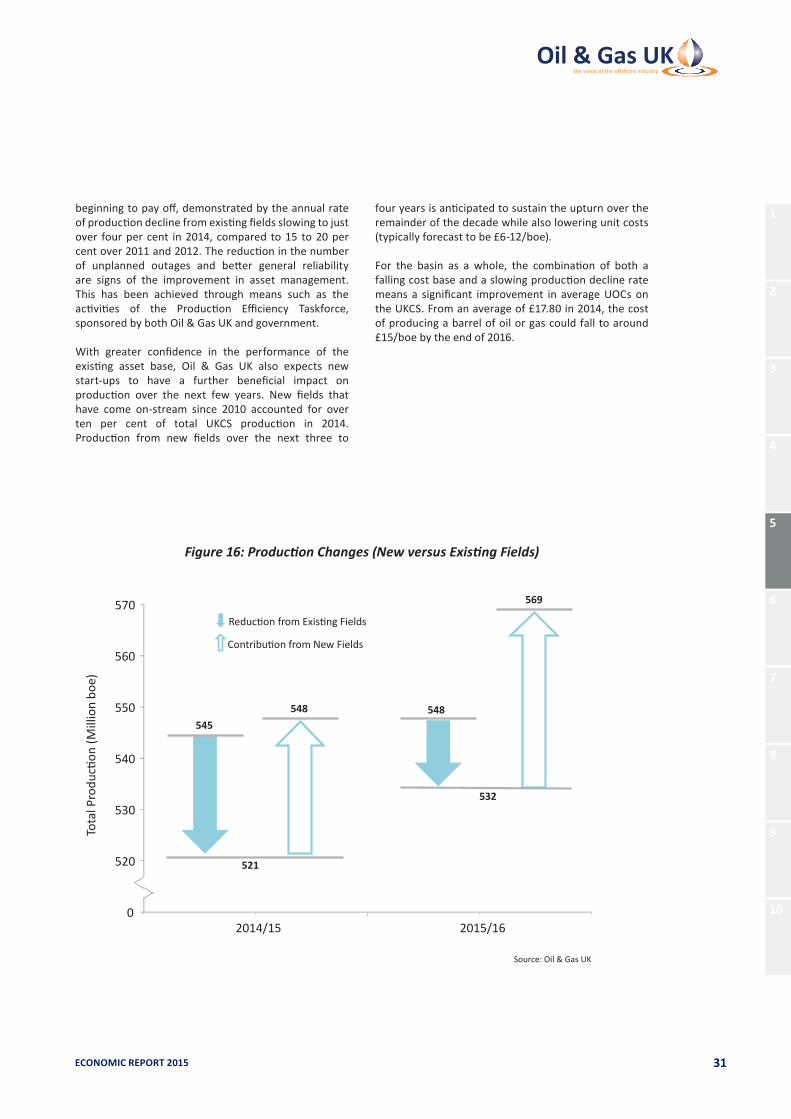
beginning to pay off, demonstrated by the annual rate of production decline from existing fields slowing to just over four per cent in 2014, compared to 15 to 20 per cent over 2011 and 2012. The reduction in the number of unplanned outages and better general reliability are signs of the improvement in asset management. This has been achieved through means such as the activities of the Production Efficiency Taskforce, sponsored by both Oil & Gas UK and government.
With greater confidence in the performance of the existing asset base, Oil & Gas UK also expects new start-ups to have a further beneficial impact on production over the next few years. New fields that have come on-stream since 2010 accounted for over ten per cent of total UKCS production in 2014. Production from new fields over the next three to
four years is anticipated to sustain the upturn over the remainder of the decade while also lowering unit costs (typically forecast to be £6-12/boe).
For the basin as a whole, the combination of both a falling cost base and a slowing production decline rate means a significant improvement in average UOCs on the UKCS. From an average of £17.80 in 2014, the cost of producing a barrel of oil or gas could fall to around £15/boe by the end of 2016.
Figure 16: Production Changes (New versus Existing Fields)
1
2
3
4
5
6
7
8
9
10
ECONOMIC REPORT 201532
6
ECONOMIC REPORT 2015 33
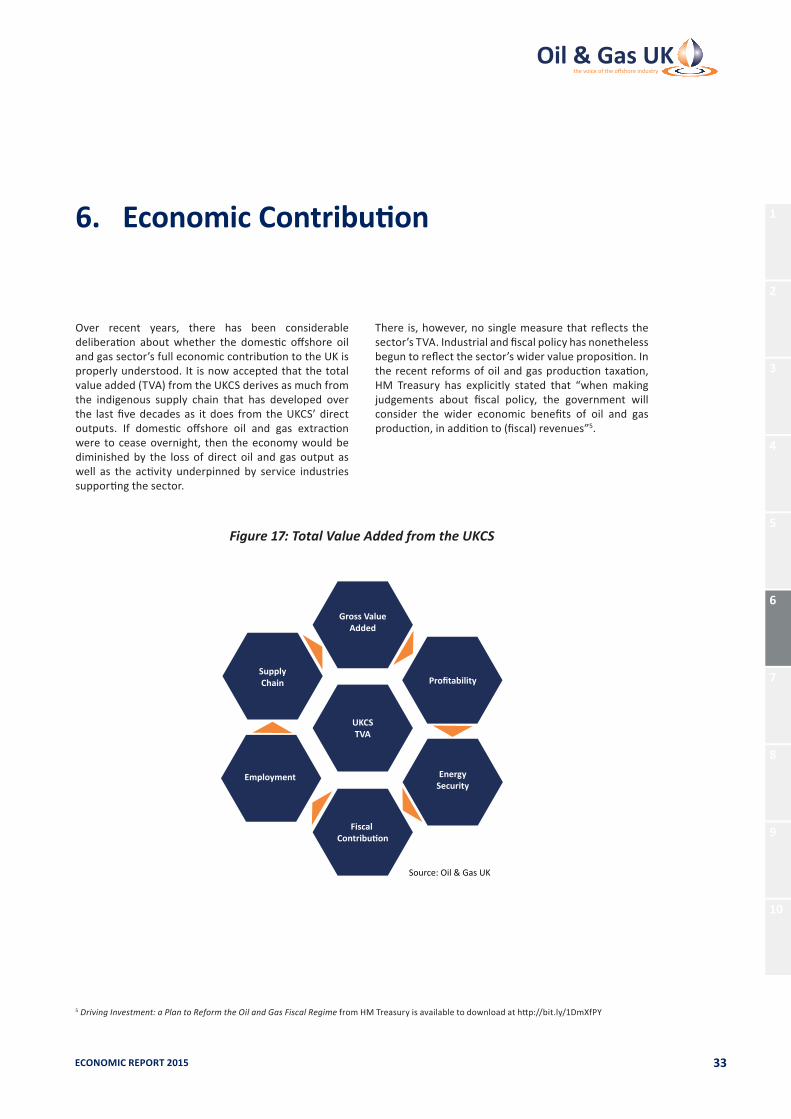
Over recent years, there has been considerable deliberation about whether the domestic offshore oil and gas sector’s full economic contribution to the UK is properly understood. It is now accepted that the total value added (TVA) from the UKCS derives as much from the indigenous supply chain that has developed over the last five decades as it does from the UKCS’ direct outputs. If domestic offshore oil and gas extraction were to cease overnight, then the economy would be diminished by the loss of direct oil and gas output as well as the activity underpinned by service industries supporting the sector.
There is, however, no single measure that reflects the sector’s TVA. Industrial and fiscal policy has nonetheless begun to reflect the sector’s wider value proposition. In the recent reforms of oil and gas production taxation, HM Treasury has explicitly stated that “when making judgements about fiscal policy, the government will consider the wider economic benefits of oil and gas production, in addition to (fiscal) revenues”5.
UKCSTVA
Profitability
EnergySecurity
Fiscal Contribution
Employment
SupplyChain
Gross ValueAdded
Source: Oil & Gas UK
Figure 17: Total Value Added from the UKCS
6.EconomicContribution
5 Driving Investment: a Plan to Reform the Oil and Gas Fiscal Regime from HM Treasury is available to download at http://bit.ly/1DmXfPY61
2
3
4
5
6
7
8
9
10

ECONOMIC REPORT 201534
6.1 Gross Value Added
Despite strong performance in the early 2000s, extraction of oil and gas contributed just 1.1 per cent to total UK gross value added (GVA) in 2014, the lowest rate since 1990. Performance in 2014 was significantly affected by the decline in oil price during the latter half of the year, although offshore oil and gas extraction was still the sixth largest contributor to GVA among the 37 production, manufacturing and construction sectors in the UK economy.
The wider contribution from the oilfield services sector (companies that are not solely licensed and engaged in
oil and gas extraction) is typically captured by the Office for National Statistics (ONS) within a category termed ‘mining support activities’. From 2008 to 2013, the ONS’ annual business survey approximates almost 100 per cent of GVA in this category as attributable to support activities for petroleum and natural gas extraction. This infers that the wider supply chain made a contribution of 0.2 per cent to total UK GVA in 2014.
Data from the first two quarters of 2015 show GVA from oil and gas extraction down over 40 per cent compared to the same period in 2014 when oil prices were over $100/bbl.
0.0
0.5
1.0
1.5
2.0
2.5
1990 1994 1998 2002 2006 2010 2014
Cont
ribut
ion
to 2
014
GVA
(%)
Source: ONS
Figure 18: Contribution to UK Gross Value Added by Extraction of Oil and Gas
ECONOMIC REPORT 2015 35
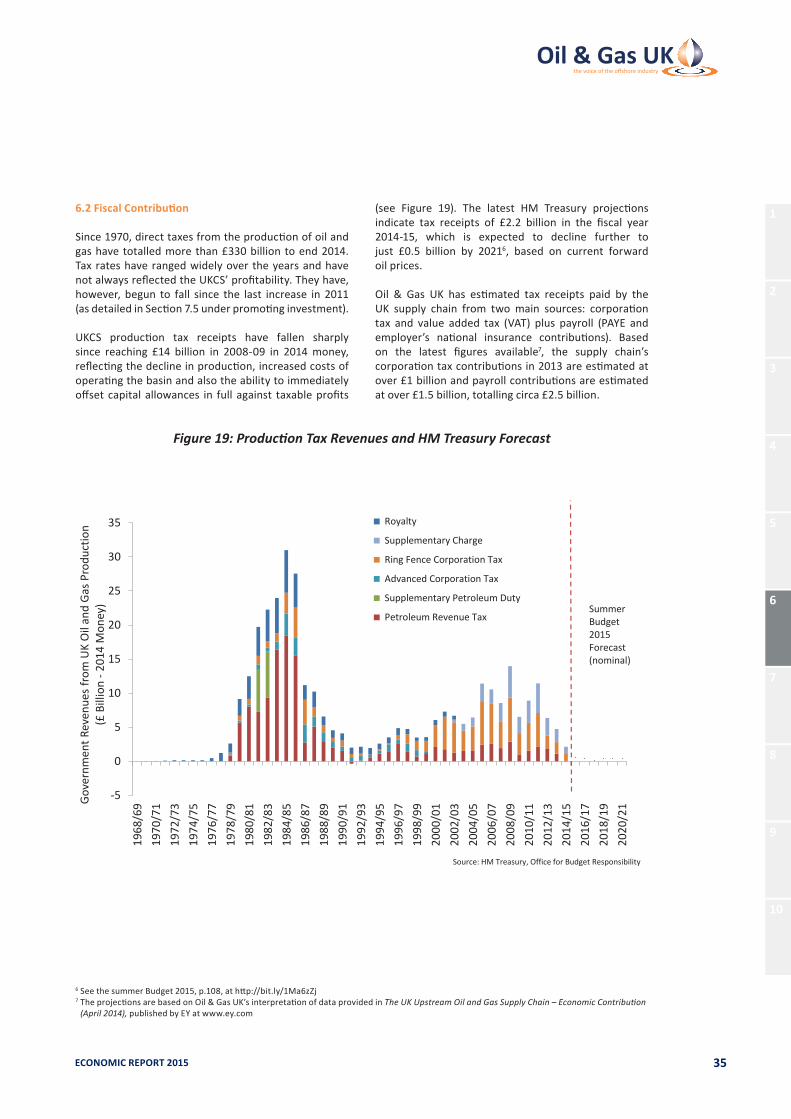
6.2FiscalContribution
Since 1970, direct taxes from the production of oil and gas have totalled more than £330 billion to end 2014. Tax rates have ranged widely over the years and have not always reflected the UKCS’ profitability. They have, however, begun to fall since the last increase in 2011 (as detailed in Section 7.5 under promoting investment).
UKCS production tax receipts have fallen sharply since reaching £14 billion in 2008-09 in 2014 money, reflecting the decline in production, increased costs of operating the basin and also the ability to immediately offset capital allowances in full against taxable profits
(see Figure 19). The latest HM Treasury projections indicate tax receipts of £2.2 billion in the fiscal year 2014-15, which is expected to decline further to just £0.5 billion by 20216, based on current forward oil prices.
Oil & Gas UK has estimated tax receipts paid by the UK supply chain from two main sources: corporation tax and value added tax (VAT) plus payroll (PAYE and employer’s national insurance contributions). Based on the latest figures available7, the supply chain’s corporation tax contributions in 2013 are estimated at over £1 billion and payroll contributions are estimated at over £1.5 billion, totalling circa £2.5 billion.
-5
0
5
10
15
20
25
30
35
1968
/69
1970
/71
1972
/73
1974
/75
1976
/77
1978
/79
1980
/81
1982
/83
1984
/85
1986
/87
1988
/89
1990
/91
1992
/93
1994
/95
1996
/97
1998
/99
2000
/01
2002
/03
2004
/05
2006
/07
2008
/09
2010
/11
2012
/13
2014
/15
2016
/17
2018
/19
2020
/21Go
vern
men
t Rev
enue
s fro
m U
K O
il an
d Ga
s Pro
duct
ion
(£ B
illio
n -2
014
Mon
ey)
Royalty
Supplementary Charge
Ring Fence Corporation Tax
Advanced Corporation Tax
Supplementary Petroleum Duty
Petroleum Revenue TaxSummer Budget 2015 Forecast (nominal)
Source: HM Treasury, Office for Budget Responsibility
Figure 19: Production Tax Revenues and HM Treasury Forecast
6 See the summer Budget 2015, p.108, at http://bit.ly/1Ma6zZj 7 The projections are based on Oil & Gas UK’s interpretation of data provided in The UK Upstream Oil and Gas Supply Chain – Economic Contribution
(April 2014), published by EY at www.ey.com
1
2
3
4
5
6
7
8
9
10

ECONOMIC REPORT 201536
6.3Profitability
The ONS has measured the UKCS’ pre-tax rate of return for many years. While rate of return is a recognised accounting metric, it does have limitations when applied to the oil and gas sector, not least because returns are reported pre-tax. This ignores the substantial and additional layers of tax uniquely imposed on the industry (see Appendix B) and the subsequent ineffective valuation of the depreciated capital base.
Notwithstanding the limitations of the measure, Figure 20 shows the steady decline of the UKCS’ profitability since 2011, despite strong oil prices over most of the period. The rate of return reached 7.9 per cent in the first quarter of 2015, the latest period for which data are available and the lowest since at least 19978. The industry’s rate of return is now half what it was during the last major downturn in the fourth quarter of 2008, reflecting the fall in oil price coupled with rising costs and record capital investment.
6.4TheUKSupplyChain
The home-grown oil and gas supply chain is acknowledged to be a major industrial enterprise, servicing the demands of the UKCS and developing a strong international business founded on its domestic success. As shown by Figure 22 opposite, turnover has grown rapidly over the last five years, rising by almost 65 per cent over the period 2008 to 2013, equivalent to a CAGR of ten per cent per annum. The strongest growth has been in the wells and the marine and subsea sectors.
Exports of high technology goods and services to the global energy market supplement domestic business and contributed over £16 billion, or 42 per cent, of the supply chain’s £39 billion total turnover in 20139. The supply chain also provides highly skilled employment in support of the indigenous offshore oil and gas industry and increasingly to service the international market.
0
20
40
60
80
100
120
140
0
10
20
30
40
50
60
70
1997 1999 2001 2003 2005 2007 2009 2011 2013 2015
Nom
inal
Dat
ed B
rent
($/b
bl)
Net
Rat
e of
Ret
urn
(%)
Net Rate of Return (%)
Nominal Dated Brent ($/bbl)
Source: ONS, Argus Media
Figure 20: Office for National Statistics Published Net Rate of Return (Pre-Tax)
8 See www.ons.gov.uk/ons/dcp171778_410201.pdf9 EY’s Review of the UK Oilfield Services Industry (March 2015) is available to download at www.ey.com

ECONOMIC REPORT 2015 37
Tier 2:• Catering/facility management• Sea/air transport• Warehousing/logistics• Communications• Recruitment• Training• Health, safety and environmental
services• Energy consultancies• IT Hardware/software
Tier 2:• Marine/subsea contractors• Heavy lift/pipe lay contractors• Floating, production, storage
units
Tier 3:• Subsea manifold/riser design and
manufacture• Marine/subsea equipment• Subsea inspection services
Tier 2:• Engineering, operation,
maintenance and decommissioning contractors
• Engineering consultants• Structure and topside design and
fabrication
Tier 3:• Machinery/plant design and
manufacture• Engineering support contractors• Specialist engineering services• Specialist steels and tubulars• Inspection services
Tier 2:• Well services contractors• Drilling contractors• Well engineering consultants
Tier 3:• Drilling and well equipment
design and manufacture• Laboratory services
Tier 2: • Seismic data acquisition and
processing contractors
Tier 3: • Geosciences consultancies• Data interpretation
consultancies• Seismic instrumentation
UKSupplyChain
Reservoirs
Wells
Facilities
Marineand
Subsea
Supportand
Services
Source: EY
Figure 21: UK Upstream Oil and Gas Supply Chain Sub-Sectors
0
5
10
15
20
25
30
35
40
45
2008 2009 2010 2011 2012 2013
Supp
ly C
hain
Tur
nove
r (£
Billi
on)
Reservoirs Support and Services
Wells Marine and Subsea
Facilities
Source: EY, Oil & Gas UK
Figure 22: UK Supply Chain Turnover – Growth by Sub-Sector
1
2
3
4
5
6
7
8
9
10
ECONOMIC REPORT 201538
A significant fall in the size of the market for oilfield goods and services is anticipated, reflecting the global decline in capital investment by most oil companies and the more immediate reductions in capital and operating expenditure on the UKCS. As a measure of the size of the change in the market, Wood Mackenzie estimates that the number of major project final investment decision deferrals represent over $200 billion in potential global capital spend.
The ability to diversify beyond oil and gas may provide a buffer for those in the facilities, marine and subsea, and service and support sectors. However, most companies will be directly impacted and consolidation, through increased M&A activity, is likely as companies seek to become more competitive. As is often the case during a downturn, the drive to improve the efficiency of operations to tackle rising costs will differentiate companies (see Section 5 on pan-industry action to improve efficiency).
It will be essential to sustain UK oil and gas production at sufficient levels to retain the country’s strong oil and gas supply chain capability. World energy demand is expected to grow by 32 per cent over the next 20 years, with oil and gas demand expected to grow by 28 per cent over the same period10, reflecting the long-term strength of the global opportunity for the sector.
6.5 Energy Security
Oil and gas provided 68 per cent of the UK’s energy requirements in 2014, as shown in Figure 24 opposite. The Department of Energy & Climate Change (DECC) estimates that there will be little change to this over the next 15 years.
In the UK today, oil is predominantly (97 per cent) used for transportation, while gas is used primarily for space heating and power generation. Currently, just over half of the domestic demand for oil and gas is met by UKCS production, with the remainder imported. Indigenous oil and gas production is not only economically valuable, but also provides security of supply.
The UK has been a net importer of oil and gas since 2004. Its import dependency sat at 48 per cent in 2014. By 2030, as demand for oil and gas remains but production declines, DECC forecasts imports to rise to 74 per cent.
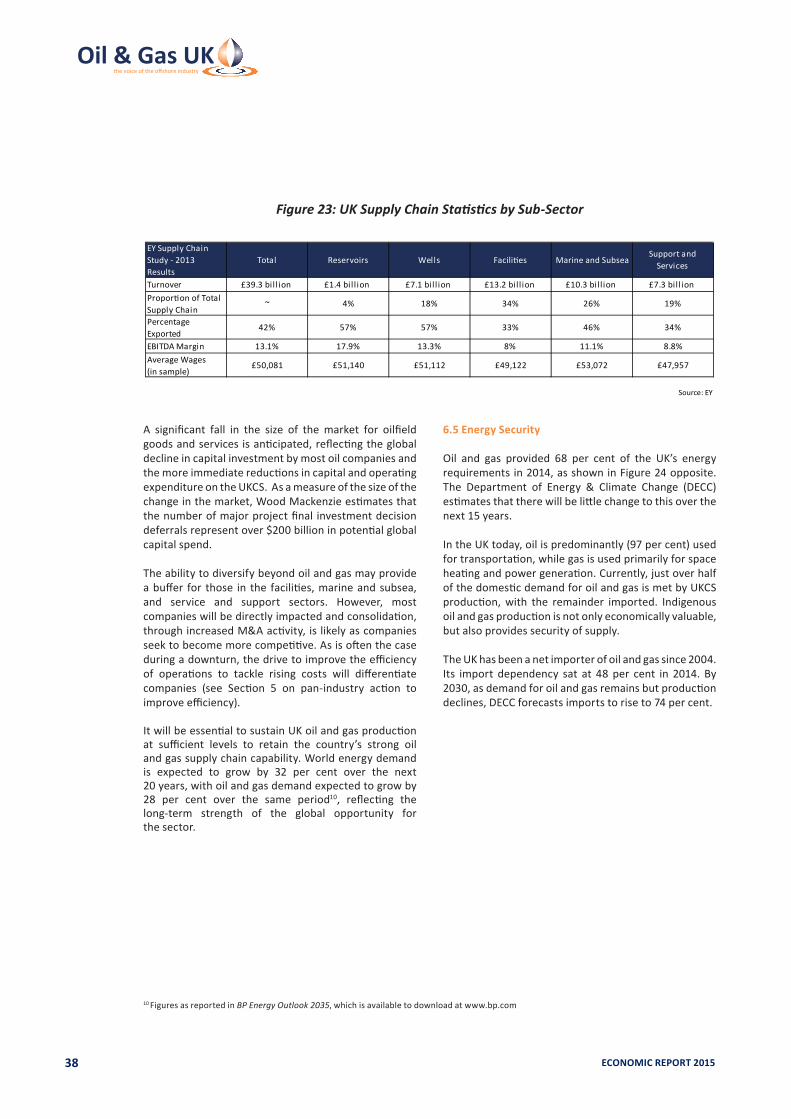
Figure 23: UK Supply Chain Statistics by Sub-Sector
Turnover £39.3 bil l ion £1.4 bil l ion £7.1 bil l ion £13.2 bil l ion £10.3 bil l ion £7.3 bil l ionProportion of Total Supply Chain
~ 4% 18% 34% 26% 19%
Percentage Exported
42% 57% 57% 33% 46% 34%
EBITDA Margin 13.1% 17.9% 13.3% 8% 11.1% 8.8%Average Wages (in sample)
£50,081 £51,140 £51,112 £49,122 £53,072 £47,957
Source: EY
Support and Services
EY Supply Chain Study - 2013 Results
Total Reservoirs Wells Facilities Marine and Subsea
10 Figures as reported in BP Energy Outlook 2035, which is available to download at www.bp.com

ECONOMIC REPORT 2015 39
0%
10%
20%
30%
40%
50%
60%
70%
80%
90%
100%
2000 2005 2010 2015 2020 2025 2030
Natural Gas Oil Nuclear Renewables and Waste Solids Electricity Net Imports
Forecast
Source: DECC
Figure 24: Primary Energy Demand by Source
0
10
20
30
40
50
60
70
80
90
100
2005 2010 2015 2020 2025 2030
Impo
rt D
epen
denc
y (%
)
Source: DECC
Figure 25: UK Import Propensity
1
2
3
4
5
6
7
8
9
10

ECONOMIC REPORT 201540
6.6 Employment
The UKCS continues to support hundreds of thousands of highly skilled and well paid jobs across exploration and production companies and the wider supply chain. However, the prevailing business environment is inevitably having a dampening effect on employment.
Given the scale, complexity and cyclical nature of the industry, a precise measure of employment has inherent uncertainties, but less expenditure – in the shape of a £5 billion reduction this year – is leading to less activity, which, in turn, leads to less employment.
At the start of 2014, it was estimated that 440,00011 jobs were supported by the industry. At the time of writing, Oil & Gas UK is aware that since then thousands of jobs have been lost within the oil and gas sector, and many more positions, both on and offshore, remain at risk.
Over the course of 2015, Oil & Gas UK estimates a 15 per cent reduction in jobs – to 375,00012 – across the entire employment spectrum of direct, indirect, and induced jobs. This fall in employment by the oil and gas sector accounts for the companies in the supply chain whose business may not be entirely focused on oil and gas, but who are nonetheless affected by the reduction in the industry’s expenditure.
Job losses have resulted from companies responding directly to the lower commodity prices and cutting costs, but some have also come from efficiency improvements as the industry looks to enhance its working practices. The losses also reflect the more widespread reduction in activity arising from the decline in investment and lack of new projects being sanctioned.
Along with exploration and production companies, sectors such as drilling, subsea and engineering services have been particularly affected as UKCS activity typically accounts for a large proportion of their turnover.
In response to the worsening market conditions, companies will inevitably look to diversify their business into other sectors and focus more on export-based activities.
Redundancies within the oil and gas sector may not always lead to net job loss as some individuals may be deployed in other roles or be able to transfer their skillsto other sectors. This may be reflected in the claimant count13 illustrated in Figure 26 opposite, which shows the number of people receiving benefits principally for the reason of being unemployed. In regions such as the east of England and Yorkshire and the Humber, where oil and gas activity has a legacy of significant employment, the claimant count compared to the same month in the previous year has continued to fall. However, in Aberdeenshire and Aberdeen City, the number of claimants has increased each month since May 2015.
Data on the number of ‘high quality’ applications per oil and gas job readily reflect the recent contraction of the job market. As illustrated in Figure 27 opposite, application numbers nearly doubled between December 2014 and May 2015 as companies started to cut budgets and reduce their workforce.
Ensuring the UKCS attracts fresh investment and sustains strong rates of expenditure over the remainder of this decade are key to the future employment prospects of the basin and are closely linked to the cost reduction and efficiency improvement initiatives being pursued across the industry, as outlined in Section 5.
11 This number reflects direct, indirect and induced employment (see definitions in the glossary). It is based on a study by Experian commissioned by Oil & Gas UK in late 2014 where employment estimates were derived using the flow of capital formation and expenditure based on national accounts data from the ONS. The domestic supply chain not only serves the UKCS, but also overseas oil and gas industries. While it is expected that some employees included within the indirect employment estimate may support export activity, there could be others that work solely on overseas business which this study has not captured.
12 The estimated 5,500 direct job losses announced publicly to June 2015 are approximately 15 per cent of the direct employment provided by the oil and gas sector, which ONS reported to be 36,600 in 2013 (the latest figures available). Assuming a similar 15 per cent decline in employment across the whole of the sector leads to a reduction from 440,000 at the start of 2014 down to 375,000 in 2015. This estimate of the fall in employment is supported by a more fundamental assessment using economic multipliers derived from the detailed Experian analysis of employment provided by the sector in 2013. The multipliers indicate that approximately eight indirect and eight induced jobs are sustained by every £1 million of expenditure. The fall in employment is calculated by applying these multipliers to the expected drop in expenditure between 2014 and 2015, with the loss of direct jobs then included to derive total change. The result arrives within 1.5 per cent of the 375,000 projection and serves to validate the more simple 15 per cent cut approach described above.
13 Claimant count is used as a proxy for unemployment.

ECONOMIC REPORT 2015 41
0
5
10
15
20
25
30
35
January2014
May2014
September2014
January2015
May2015
Aver
age
Num
ber o
f 'H
igh
Qua
lity'
App
licat
ions
per
Job
Source: Oil and Gas Job Search
-40
-30
-20
-10
0
10
20
Janu
ary
2014
Febr
uary
201
4
Mar
ch 2
014
April
201
4
May
201
4
June
201
4
July
201
4
Augu
st 2
014
Sept
embe
r 201
4
Oct
ober
201
4
Nov
embe
r 201
4
Dece
mbe
r 201
4
Janu
ary
2015
Febr
uary
201
5
Mar
ch 2
015
April
201
5
May
201
5
June
201
5
July
201
5
Annu
al M
onth
ly C
hang
e in
Cla
iman
ts A
ged
16 to
64
(%) Aberdeen City
Aberdeenshire Yorkshire and the Humber East of England
Source: nomis (ONS)
Figure 26: Unemployment Claimant Count
Figure 27: Number of ‘High Quality’ Applications per Oil and Gas Job
1
2
3
4
5
6
7
8
9
10

ECONOMIC REPORT 201542
7

ECONOMIC REPORT 2015 43
This section reviews the UKCS’ commercial health. Using data gathered in June 2015, it provides an updated review of recent performance and assesses potential trends for the basin over the next two to three years, building on the findings of the Oil & Gas UK Activity Survey14 published in February 2015.
7.1Reserves/ResourcePotential
DECC has historically published annual details of reserves and resources. This will now be the responsibility of the new regulator, the Oil and Gas Authority (OGA). Oil & Gas UK has compared the latest figures against information available from its own surveys of operator companies and the following provides a summary of the UKCS’ resource potential based on current trends.
Over 43 billion barrels of oil and gas have been produced on the UKCS over the last five decades. Future resource recovery will depend on prospectivity, technology improvements, commodity prices, operational costs and efficiencies, and the integrity and longevity of infrastructure, combined with energy, fiscal and regulatory policies.
Oil and gas reserves and resources are reported under a range of classifications with low, mid and high cases15. Figure 28 summarises the figures from DECC as at 31 December 2014.
Proven, probable and possible reserves of 11.9 billion boe are reported. It should be noted that this is a somewhat higher figure than the ten billion boe of sanctioned, probable and possible reserves reported by Oil & Gas UK in its 2015 Activity Survey, which focuses only on potential reserve development within operators’ existing business plans.
DECC estimates that the UKCS offers potential additional resources (PARs) ranging between 1.5-7.3 billion boe. The PARs represent discoveries without plans for development that are not currently technically or commercially viable. A wide range of uncertainty is reflected in these estimates and, from year to year, projects are seen to move between the PARs and the reserves categories.
Category (Billion boe)
ProvenProven and
Probable (2P)Proven, Probable and Possible (3P)
Reserves 4.2 8.1 11.9
Low Mid HighPotential Additional Resources (PARs)
1.5 3.7 7.3
Low Mid HighYet-To-Find (YTF) (based on central case)
2 6 9
Source: DECC
Figure 28: Reserves and Resources as Reported at 31 December 2014
7. Performance Indicators
14 Oil & Gas UK’s Activity Survey 2015 is available to download at www.oilandgasuk.co.uk/activitysurvey 15 See www.gov.uk/oil-and-gas-uk-field-data#uk-oil-and-gas-reserves-and-resources7
1
2
3
4
5
6
7
8
9
10

ECONOMIC REPORT 201544
Yet-to-find (YTF) volumes range between 6-16 billion boe, based on a cut-off rate of five per cent geological success. However, the central case across a range of geological success cut-off rates suggests a tighter range of 2-9 billion boe, which would appear to be a more realistic interpretation of likely exploration potential given recent performance.
As shown in Figure 29, Oil & Gas UK estimates the range of ultimate recovery to be between 11.5-22 billion boe, based on currently available data and discounting the high case outcomes tabled by the OGA for PARs and YTF. The lower case reflects recent poor exploration success and limited maturation of existing PARS through to production. To achieve the high case of up to 22 billion boe, there will need to be significant improvements in near-field and frontier exploration success as well as concerted improvement in recovery, driven by successful cost reduction and efficiency programmes (see Section 5), substantial technological advances and widespread deployment of enhanced oil recovery.
7.2MaturingUndevelopedDiscoveries
A significant portfolio of discovered reserves has built up over the years that has been unable to attract capital for development. Wood Mackenzie estimates that there are currently more than 300 such discoveries without development plans comprising nearly 3.9 billion boe, the majority of which were discovered before 2000.
As Figure 30 opposite shows, almost 80 per cent of these total reserves reside in accumulations of 50 million boe or less. Many of these opportunities are particularly difficult to develop, based on parameters such as reservoir accessibility, product quality or proximity to infrastructure. When typical commercial thresholds are applied, only 1.4 billion boe are currently considered potentially economically viable to develop, with over 2.5 billion boe currently deemed only contingent reserves. Given the limited lifespan of much existing infrastructure, it is imperative that the industry now rises to the challenge to find new ways to enhance the viability of these typically small opportunities, or they may never be recovered.
Figure 29: Estimated Total Resource Potential
812
1.5
4
2
6
0
5
10
15
20
25
LowOutcome
HighOutcome
Rese
rves
/Res
ourc
es (B
illio
n bo
e)
YTF
PARs
Reserves
Source: DECC, Oil & Gas UK
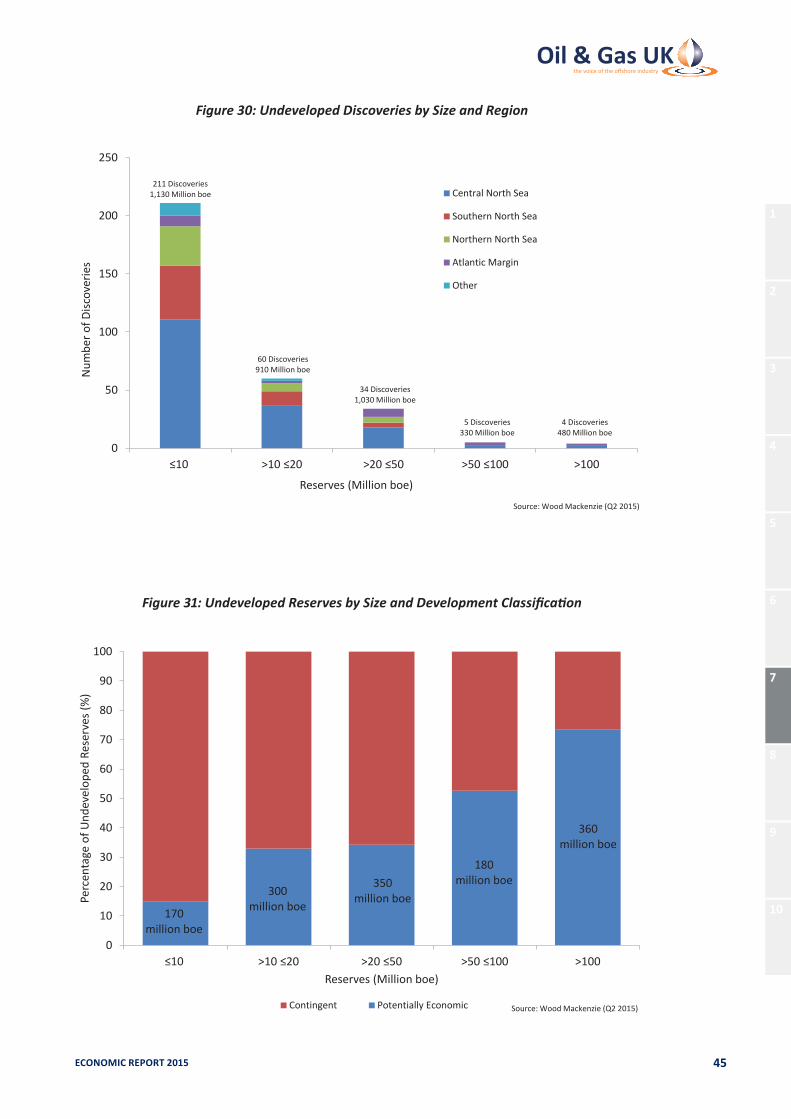
ECONOMIC REPORT 2015 45
0
50
100
150
200
250
≤10 >10 ≤20 >20 ≤50 >50 ≤100 >100
Num
ber o
f Disc
over
ies
Reserves (Million boe)
Central North Sea
Southern North Sea
Northern North Sea
Atlantic Margin
Other
211 Discoveries1,130 Million boe
60 Discoveries910 Million boe
34 Discoveries1,030 Million boe
5 Discoveries330 Million boe
4 Discoveries480 Million boe
Source: Wood Mackenzie (Q2 2015)
Figure 30: Undeveloped Discoveries by Size and Region
0
10
20
30
40
50
60
70
80
90
100
≤10 >10 ≤20 >20 ≤50 >50 ≤100 >100
Perc
enta
ge o
f Und
evel
oped
Res
erve
s (%
)
Reserves (Million boe)
Contingent Potentially Economic Source: Wood Mackenzie (Q2 2015)
360 million boe
180million boe350
million boe300 million boe170
million boe
Figure 31: Undeveloped Reserves by Size and Development Classification
1
2
3
4
5
6
7
8
9
10

ECONOMIC REPORT 201546
7.3 Drilling
Drilling TrendsDrilling trends across the UKCS reflect the wider issues facing the industry and can be considered a leading indicator of the basin’s health as a whole. As Figure 32 shows, there has been a general decline in drilling activity over the last decade. The rate of E&A drilling has halved compared to a decade ago and development drilling has fallen by about 30 per cent. This fall shows the difficulties the UK faces
when competing with other less mature provinces for exploration capital on perceived prospectivity, costs, materiality and alignment to portfolio needs.
There is an increasing number of drilling rigs being stacked. As at August 2015, 16 rigs are believed to have been laid-up while awaiting work. It is likely some will be decommissioned as drilling programmes are cut in a cash-constrained world.
0
10
20
30
40
50
60
70
80
90
100
Q1
Q2
Q3
Q4
Q1
Q2
Q3
Q4
Q1
Q2
Q3
Q4
Q1
Q2
Q3
Q4
Q1
Q2
Q3
Q4
Q1
Q2
Q3
Q4
Q1
Q2
Q3
Q4
Q1
Q2
Q3
Q4
Q1
Q2
Q3
Q4
Q1
Q2
Q3
Q4
Q1
Q2
2005 2006 2007 2008 2009 2010 2011 2012 2013 2014 2015
Wel
ls Dr
illed
incl
udin
g Ge
olog
ical
Sid
etra
cks
Exploration
Appraisal
Development
Source: DECC
Figure 32: Quarterly Drilling Performance

ECONOMIC REPORT 2015 47
DevelopmentDrillingFigure 33 shows the number of development wells drilled over the last decade and provides a comparison against production over the same period. As expected, there is a strong positive correlation between the two, with the obvious conclusion that the drive to increase production will rely on a sustained rise in development drilling. Likewise, any further decline in development drilling will further depress the production outlook.
ExplorationandAppraisalDrillingOne of the biggest challenges facing the sector is the progressive decline in E&A drilling over the last decade (see Figure 34 overleaf). Exploration drilling is now at its lowest since exploration on the UKCS began in 1964. Last year, just 13 exploration wells plus one sidetrack16 were drilled and 14 appraisal wells plus four sidetracks. For an extractive industry, an active and successful exploration programme is a prerequisite. The fall-off in exploration means the UK is only replacing a fraction of the reserves it produces, diminishing the scale of the
sector and its ability to sustain investment in the near term and deliver new production over the longer term.
Figure 34 overleaf shows that the rate of exploration drilling declined sharply in 2009, in part, at least, as a result of the financial crisis of 2008-09 and the oil price fall. Exploration activity then staged a brief recovery before falling back further as the tax rate increased in 2011. It has since averaged at 16 wells (including sidetracks) per year. Appraisal drilling has held up better, though a sharp decline was seen last year following reduced exploration activity. It is expected to remain low in 2015.
Over the last two to three years, the rate of drilling appears to have hit a floor and the number of wells drilled on the UKCS thus far in 2015 has held up against the three-year average, despite the precipitous fall in oil prices witnessed over the last 12 months. It should be noted, however, that companies were already committed to drilling most of this year’s wells before the
Figure 33: Development Drilling Activity against the Production Profile
0
200
400
600
800
1,000
1,200
1,400
0
50
100
150
200
250
2005 2006 2007 2008 2009 2010 2011 2012 2013 2014
Tota
l Pro
duct
ion
(Mill
ion
boe)
Num
ber o
f Wel
ls Dr
illed
Development Wells Drilled
Production
Source: DECC
16 All sidetracks referred to are geological sidetracks, which is when the target location changes but surface location stays the same.
1
2
3
4
5
6
7
8
9
10

ECONOMIC REPORT 201548
oil price slumped. Over the first half of this year, seven exploration wells were drilled (with no sidetracks), plus three appraisal wells (with six sidetracks) and 38 development wells (with 27 sidetracks). It is anticipated that around 20 E&A wells will be drilled in total this year, but with rig rates and the costs of acquiring seismic at their most competitive for years there will be opportunities for those companies that have the capacity to invest in exploration in a counter-cyclical manner.
There has also been a sharp decline in the volumes discovered (see Figure 35 opposite). This is a consequence of fewer wells being drilled and of companies becoming more risk averse, targeting smaller, less risky accumulations. Over the last three years, there have typically been four discoveries a year, with total recoverable reserves averaging annually around 55 million boe. As at mid-year 2015, one successful well with recoverable reserves of around 20 million boe had been reported, although the results from three of the seven wells drilled to date are yet to be reported. Further wells are planned in the second half of the year, which may lift the outcome.
7.4StimulatingExploration
The industry, regulator and government all accept that the current pace of exploration is insufficient. Key priorities are to encourage exploration and prove the basin’s resource potential.
As mentioned earlier, DECC has published central case figures that suggest YTF potential of between 2-9 billion boe, depending on the perceived geological risk associated with the resources being targeted.
At current drilling rates, it is anticipated that only a small fraction of these YTF resources will be discovered before the decommissioning of UKCS infrastructure curbs further exploration activity.
0
10
20
30
40
50
60
70
80
90
2005 2006 2007 2008 2009 2010 2011 2012 2013 2014
Exploration SidetracksExploration
Appraisal SidetracksAppraisal
Num
ber o
f Wel
ls Dr
illed
Source: DECC, Oil & Gas UK
Figure 34: Exploration and Appraisal Drilling

ECONOMIC REPORT 2015 49
There is no single lever to pull to promote exploration on the UKCS. The factors restraining activity include:
• Access to data and licences – as the basin matures, licensing needs to reflect current operations and promote access to fresh plays, which may appeal to exploration-focused companies. This can be furthered by the swifter release of seismic and well data.
• Prospectivity – the limited commitment to new 3D seismic and wells in the 28th Licensing Round signalled a lack of confidence in the prospectivity of the UKCS, which on-going work is seeking to address.
• Access to infrastructure – some operators are concerned that the longevity and cost of existing infrastructure may restrain exploration programmes. There also needs to be a coherent programme to allow multiple parties access to infrastructure on a commercially efficient basis.
• Drilling costs – the cost of drilling an average exploration well has doubled over the last five years, to around £45 million per well.
• Recent performance – the average discovery size over the last five years was just over 14.5 million boe, recognising not all volumes are commercially viable.
The last discovery with recoverable reserves greater than 100 million boe was Culzean, seven years ago.
• Access to capital – in a period where funding is severely restrained, only the most competitive opportunities globally will secure exploration capital. A compelling value proposition needs to be presented to potential investors reflecting an appropriate balance between risk and post-tax reward.
All of these factors need to be addressed and recalibrated if the UK is to reinvigorate exploration.
Over the last two years, Oil & Gas UK has led a number of initiatives to stimulate the exploration market. Working with industry and DECC, these include:
• Areviewofpotentialnewplays – drilling over the last ten years has predominantly been confined to known basins. Work is being done to identify new plays and encourage explorers to pursue fresh opportunities. This is further supported by the government-funded seismic surveys now being carried out in the Rockall Basin and the Mid-North Sea High.
0
100
200
300
400
500
600
2005 2006 2007 2008 2009 2010 2011 2012 2013 2014 2015
Disc
over
ed R
eser
ves
(Mill
ion
boe)
Technical
Commercial
Source: Wood Mackenzie (Q2 2015)
Figure 35: Reserves Discovered through Exploration 1
2
3
4
5
6
7
8
9
10

ECONOMIC REPORT 201550
• ThePitfalls,PeaksandProgressConference – held for the past two years to share the reasons for exploration success and failure.
• The21stCenturyExplorationRoadMap – to improve geological knowledge of the UKCS. This involves:
o An analysis of E&A wells drilled in the Moray Firth and central North Sea (CNS) from 2003 to 2013. The OGA has carried out a systematic review of 97 wells to determine the root cause for drilling failures and successes and is discussing the findings with explorers. A final report will be published later this year.
o An in-depth study by the British Geological Survey (BGS) that takes a fresh look at the Palaeozoic reservoirs in the CNS, Orcadian Basin and Irish Sea. This joint industry and government-funded study involves companies sharing regional seismic and deep well data and the BGS holding regular technical meetings with industry participants to ensure transfer of knowledge and ideas. The project will be completed in early 2016 with the publication of digital geological maps and related information.
HM Treasury has also taken steps to stimulate exploration. Measures announced in the March and summer 2015 Budgets include:
• A reduction in the Supplementary Charge (SC) to 20 per cent and introduction of an Investment Allowance that should assist to improve the post-tax value of exploration.
• A commitment to consult with industry on further measures to promote exploration, potentially to be included in Budget 2016.
• £20 million of funding to acquire fresh 2D seismic on the Rockall Basin and Mid-North Sea High, currently under way.
The government-funded seismic is a potential game changer and epitomises the new tripartite approach between industry, HM Treasury and the OGA. The contract to acquire seismic has been awarded to WesternGeco Ltd. Seismic acquisition started in the summer of 2015, acquiring up to 19,000 kilometres of new data. This will be processed and released freely to industry and academia through Common Data Access (CDA) Limited in early 2016, together with the release of additional data. This new information, in conjunction with the Palaeozoic study, will provide new insight into the UKCS and should help stimulate interest in the 29th Licensing Round, which OGA plans to announce in 2016.
7.5CapitalInvestment17
After seven consecutive years of strong growth peaking at £14.8 billion last year, capital investment is expected to fall sharply in 2015 to £10-11 billion; although cost overruns in major projects, as seen in recent years, could see it exceed £11 billion.
The investment outlook over the next three years is dominated by a small number of large developments that received final investment decision before the oil price began to fall in June 2014 and which are still progressing to completion. Investment in just four of those projects – Clair Ridge, Schiehallion, Mariner and Kraken – is expected to account for around one third of total investment this year. Much of the remaining investment comes from a multiplicity of smaller projects that were sanctioned between 2011 and 2013, and are now approaching completion. Given the size of these developments, capital investment is unlikely to fall below £10 billion this year, despite the challenging economic climate. Most of these projects will come on-stream over the next three years and will, in turn, support a gradual improvement in the production outlook.
However, capital investment in new opportunities beyond that which is already committed appears to be scarce. The only new field approved since September 2014 is the Edradour-Glenlivet development. It is hoped that the Culzean high-pressure, high-temperature field development will also be sanctioned this year, but at mid-year it was yet to gain final approval.
The relatively few new projects coming forward for sanction and development, combined with the completion of current development projects, leads Oil & Gas UK to forecast a rapid fall in investment over the next three years, as shown by Figure 36. Current plans suggest £6-7 billion of new investments could be approved in 2016 and 2017. However, approval of these projects is not assured, and even if they are sanctioned, annual investment may still fall by £2-4 billion per year over the next three years unless further new opportunities are discovered and progressed rapidly.
The lack of new projects in development reflects, in part, the decline in exploration over much of the last decade, as outlined earlier. Investors are cautious due to the fact that unit operating costs have doubled over the last five years and there has been a tendency over the past two years towards project delays and capital overspend. During that time, only one major new field development appears to have been delivered without delay and on budget. Figure 37 illustrates the limited number of new field approvals over this year and last, and the importance of securing investment in some large projects over 2016 and 2017.
17 Capital investment excludes E&A capital.

ECONOMIC REPORT 2015 51
Figure 36: Capital Investment Outlook
0
2
4
6
8
10
12
14
16
2010 2011 2012 2013 2014 2015 2016 2017
Capi
tal I
nves
tmen
t (£
Billi
on -
2014
Mon
ey)
Source: Oil & Gas UK
£14.8 billion
£10 - 11 billion
£6 - 8 billion
£4 - 7 billion
0
2
4
6
8
10
12
14
2010 2011 2012 2013 2014 2015 2016 2017
Tota
l Cap
ital I
nves
tmen
t by
Fiel
d (£
Bill
ion
-201
5 M
oney
)
Year of Field Approval Source: DECC, Oil & Gas UK
Figure 37: Capital Investment by Field in Year of Field Approval
1
2
3
4
5
6
7
8
9
10

ECONOMIC REPORT 201552
PromotingInvestmentThe UKCS has successfully attracted investment for 50 years and significant efforts over the last 18 months to reshape the basin are expected to help continue this trend (see Section 5).
The UK has many qualities that make it an attractive destination for investment capital, such as the availability of export infrastructure and low geological and project delivery risk. However, the criterion to rank and measure investment attractiveness on an international scale has remained consistently focused on project economics, as would be expected.
For companies seeking to extract oil and gas, risk-adjusted, post-tax measures of return, such as net present value (NPV), expected monetary value (EMV), along with the well-used capital rationing tool of profitability index (P/I), will be key considerations.
The UKCS has other benefits that are not easily captured within these measures of attractiveness, such as low political risk, a robust view on safety, and an increasingly simple and stable fiscal regime. Alongside these, exogenous variables such as price and exchange rate will clearly have a big impact when distributing capital.
While the sustained fall in commodity prices has tested the industry globally, it has also provided a heightened impetus for action across the UKCS. Energised by Sir Ian Wood’s recommendations in his review of the UKCS18, industry, the new regulator – OGA – and government (forming the “tripartite approach” identified by Sir Ian Wood) have committed to creating an environment that promotes the principles of Maximising Economic Recovery from the UKCS (MER UK). This dedication to change will make the UKCS a more competitive place to do business.
In Budget 2014, the Chancellor of the Exchequer announced that the government would review the UK’s oil and gas fiscal regime “to ensure that it continues to incentivise economic recovery as the basin matures.”19
Extensive consultation with industry followed, culminating in the publication in December 2014 of Driving Investment: a Plan to Reform the Oil and Gas Fiscal Regime20. Within the review, government recognised that the tax burden on the oil and gas industry had to fall as the basin matured; that fiscal policy would be formed with reference to international fiscal competitiveness; and that the UKCS would no longer be viewed as merely a revenue raising asset but for the full economic value it
could deliver, especially exports and the oilfield services supply chain.
The resulting significant package of fiscal measures announced in both the spring and summer 2015 Budgets transform the UKCS’ commercial attractiveness, maximising and rewarding investment at all stages of the industry life cycle. The reforms will help ensure it can compete globally for capital as post-tax returns are enhanced to reflect the risk associated with investments in the basin.
The Chancellor announced reductions in the SC to 20 per cent from 1 January 2015 and Petroleum Revenue Tax (PRT) to 35 per cent from 1 January 2016, as well as the introduction of a new Investment Allowance. The Investment Allowance, which replaces the old suite of Field Allowances, is a far simpler support for capital investment that no longer distorts the allocation of capital between different projects. It is based on capital expenditure and generates an allowance of 62.5 pence in the pound against SC – reducing the headline tax rate on a portion of production up to the Ring Fence Corporation Tax (RFCT) at 30 per cent (plus, where applicable, PRT). See Appendix B for details on the fiscal regime.
Wood Mackenzie estimates the March Budget will transfer £13 billion of value (NPV10 at 1 January 2015) from government to industry over time.
Further work will develop the Investment Allowance to ensure it covers the wide range of productive discretionary investment that is necessary under MER UK21 and is not just limited to certain types of activity. For example, the capital part of long funding lease payments for FPSOs will accrue the allowance where previously it did not.
Other aspects of UKCS fiscal policy, such as reforms to the tax handling of exploration, infrastructure and decommissioning, will be addressed in the latter half of 2015.
Overall, while the commercial environment on the UKCS has become more challenging over the past 12 months, much progress has been made to improve the post-tax return to the investor. The value of these positive changes can only be maximised if significant movement can also be made to reduce cost and improve efficiency, returning the basin to a sustainable economic position. This challenge has never been greater, but the rewards for doing so are substantial and industry is already taking concerted action in this area (see Section 5).
18 The UKCS Maximising Recovery Review: Final Report is available to download at www.woodreview.co.uk19 See Budget 2014, p35, at http://bit.ly/1KVnorZ 20 See http://bit.ly/1DmXfPY21 See summer Budget 2015 at http://bit.ly/1Ma6zZj

ECONOMIC REPORT 2015 53
7.6OperatingExpenditure
The cost of operating on the UKCS rose to £9.7 billion in 2014, slightly higher than the estimate published in Oil & Gas UK’s Activity Survey in February 201522 and a nine per cent increase from 2013. Operating expenditure in the UK has now increased by a third since 2011, a worrying trend that the industry recognises it needs to tackle.
Some degree of operating cost increase is to be expected in a mature basin, reflecting the increasing complexity within and between assets. Such a trend is inevitable as both the number of operators and the number of small fields continue to grow. However, expenditure growth over the last three years has far exceeded what may be seen as acceptable, averaging ten per cent per year since 2011. The UKCS has reached a stage where, for many assets, any further rise in annual operating costs cannot be sustained, particularly during a period of flat or falling oil prices.
Even as far back as May 2014, before the severe fall in price, companies active on the UKCS recognised the significance of the problem of rising costs coupled with falling production and began to intervene. Details of pan-industry initiatives to reduce costs and increase efficiencies can be found in Section 5.
Oil & Gas UK gathered data this summer that show that, on average, UKCS operators expect to reduce
their total operating expenditure this year by around four per cent to £9.3 billion. Companies report further likely reductions of six to ten per cent in 2016 as greater benefits from the cost reduction and efficiency improvement programmes are realised. The future beyond 2016 is extremely uncertain and price and market movements will undoubtedly affect the behaviour of companies in the longer term.
One cost that is likely to increase over the remainder of the decade is the cost of carbon. The extraction of offshore oil and gas in itself is a significant industrial consumer of energy, with around ten per cent of gas produced from the UKCS used to run offshore installations. As such, the industry is a big emitter of greenhouse gases (GHG) and is covered by the European Union Emissions Trading Scheme (ETS), which is now in its third phase (2013 to 2020).
In 2014, the UK upstream industry, comprising 100 offshore installations and 26 onshore terminals within the scheme, emitted 14.7 million tonnes of CO2 equivalent (mainly CO2 and methane) amounting to about three per cent of the UK’s total GHG emissions. It is estimated that the UKCS’ current costs of ETS compliance are £20-25 million per year. After 2020, the annual cost could rise to £125-150 million if ETS reforms deliver a carbon price of €25/tonne (te) CO2. More information about carbon price and GHG emissions can be found in Appendix A.
0
2
4
6
8
10
12
2003 2004 2005 2006 2007 2008 2009 2010 2011 2012 2013 2014 2015 2016
Oper
atin
g Cos
t (£
Billio
n -2
014
Mon
ey)
Source: Oil & Gas UK
Q4 2014 Forecast
Q2 2015 Forecast
-4%
-6 - 10%
Figure 38: Operating Costs
22 Oil & Gas UK’s Activity Survey is available to download at www.oilandgasuk.co.uk/activitysurvey
1
2
3
4
5
6
7
8
9
10

ECONOMIC REPORT 201554
UnitOperatingCostsPerhaps the most meaningful way to assess the long-term sustainability of the UKCS is by looking at the trends and distribution of UOCs. From an average cost of £17.80/boe in 2014, UOCs are expected to fall by around four per cent in 2015 to £17/boe.
In 2016, further planned reductions in operating costs, as well as a potential increase in production, could lead to average UOCs falling by almost £2/boe to £15-16/boe. However, this improvement is far from certain. If initiatives to improve efficiency fail to deliver, or the production upturn does not materialise, average
UOCs will remain in the £17-18/boe range for the near future.
The distribution of UOCs is skewed in the UKCS. Focusing on the bulk of UKCS fields23 in Figure 40 opposite, there is a range from less than £5/boe up to more than £60/boe. In 2014, two thirds of all fields had a UOC less than the mean average of £17.80/boe and over 50 fields were at less than £10/boe. On the other hand, just over one-third of these fields had UOCs in excess of the mean average. This suggests that while the pressures of a lower oil price are felt across the basin, most fields remain viable even in the current business environment.
0
2
4
6
8
10
12
14
16
18
20
2003 2004 2005 2006 2007 2008 2009 2010 2011 2012 2013 2014 2015 2016
Uni
t Ope
ratin
g Co
st (£
/boe
-20
14 M
oney
)
Q4 2014 Forecast
Q2 2015 Forecast
Source: Oil & Gas UK
Figure 39: Average Unit Operating Costs
23 Those that produced at least 1,000,000 boe in each year.

ECONOMIC REPORT 2015 55
Many of the most costly fields to operate, those to the right hand side of Figure 40, are in fact approaching the end of their productive lives. With fewer recoverable reserves remaining and a high proportion of fixed operating costs, UOCs often accelerate excessively in the final years of production. As fields deplete over time, there will always be those operating at the tail of their production with very high UOCs in the years immediately prior to decommissioning.
Nevertheless, there are also a small number of very high cost fields on the UKCS with significant recoverable reserves remaining. These fields, most of which are found in the northern North Sea (NNS), struggle to remain viable against a backdrop of rapidly declining revenues. Dunlin is the first example of a major field that has reached its economic limit and ceased production despite significant volumes of reserves remaining within existing reservoirs.
0
10
20
30
40
50
60
70
80
0-10 10-20 20-30 30-40 40-50 50-60 >60
Num
ber o
f Fie
lds
Unit Operating Cost (£/boe - 2014 Money)
2011
2012
2013
2014
Source: Oil & Gas UK
Figure 40: Distribution of Unit Operating Costs by Number of Fields 1
2
3
4
5
6
7
8
9
10

ECONOMIC REPORT 201556
Geographically, Figure 41 shows that dry gas production in the SNS region is typically much less expensive (£12-13/boe) than in other areas of the UKCS. This is despite the maturity of the region, with many fields in the fourth decade of operation and close to the end of their productive lives. This reflects the simpler technical nature of the developments and the discounted sale price of gas when compared to oil.
Fields in the NNS area, on average, will experience UOCs twice those of the SNS, with aging infrastructure, redundant facilities and a shortage of fuel gas contributing to the disparity. In contrast, in the CNS, the UKCS’ most productive region and where around one
quarter of production is gas, UOCs have been very close to the UKCS mean average for the last ten years.
It is interesting to note that the gap between the unit costs of operating liquids and gas fields on the UKCS was previously much smaller (see Figure 42 opposite). The costs of operating liquid production were generally around 20 per cent higher than gas in the period prior to 2010, before production fell sharply, driving UOCs higher for both. However, there was a much greater decline in liquids production, which has led to a 40 per cent cost premium associated with producing liquids compared to dry gas, on a unit basis, in 2015.
0
5
10
15
20
25
30
2004 2005 2006 2007 2008 2009 2010 2011 2012 2013 2014 2015
Uni
t Ope
ratin
g Co
sts (
£/bo
e)
Southern North Sea and Irish Sea
Central North Sea
Northern North Sea
Source: Oil & Gas UK
Figure 41: Regional Average Unit Operating Costs
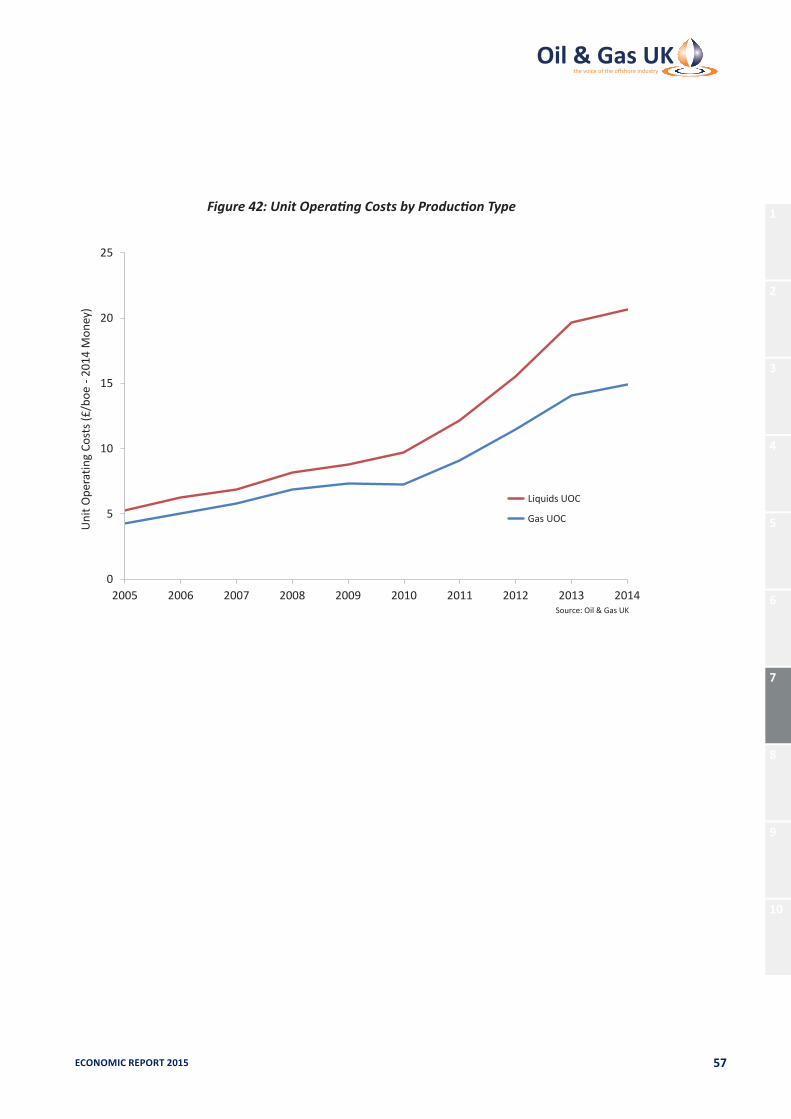
ECONOMIC REPORT 2015 57
Figure 42: Unit Operating Costs by Production Type
0
5
10
15
20
25
2005 2006 2007 2008 2009 2010 2011 2012 2013 2014
Uni
t Ope
ratin
g Co
sts (
£/bo
e -2
014
Mon
ey)
Liquids UOC
Gas UOC
Source: Oil & Gas UK
1
2
3
4
5
6
7
8
9
10

ECONOMIC REPORT 201558
7.7Production
Provisional data from DECC for the first six months of 2015 shows production to have increased by around three per cent against the same period last year, with initial indications suggesting that production could increase this year for the first time in 15 years. After poor delivery in February, as some key assets were shut-in for all or part of the month, production for the second quarter of the year looks particularly encouraging and early figures suggest that May saw the best overall monthly output since March 2012.
Production from the large Golden Eagle field, which only came on-stream in November 2014, has helped crude oil production increase over the first half of this year as well as strong delivery from existing assets (see Section 8 for a case study on the Golden Eagle Area Development). Although natural gas liquids (NGL) production has fallen by around nine per cent, total liquids production is up by around three per cent for the year, as is net gas production.
While annual production performance for 2015 is still uncertain and will only become clearer after the summer maintenance season, some sizeable new start-ups are anticipated over the second half of
this year. Consequently, Oil & Gas UK believes that production is likely to be no worse than last year and, if fields such as Solan and Laggan Tormore come on-stream, this may lead to a production increase of around three or four per cent.
The positive production performance reported so far this year follows on from 2014, when total annual production averaged 1.49 million boe per day (in total 545 million boe)24, just 0.2 per cent less than in 2013 and representing the best year-on-year performance in 15 years. Many existing assets were able to slow their reservoir decline rates and reported improved production efficiency, plus new start-ups (Juliet, Kew, Golden Eagle and Kinnoull) supplemented production from existing fields. Performance over the last 18 months indicates that production may be beginning to turn around after particularly poor delivery from 2011 to 2013.
Net gas production was up 1.5 per cent last year on 2013, helped by a full year of production from the Jasmine field. Liquids production provided around 60 per cent of the total and was down by 1.4 per cent. This is still the best annual performance since 2000, but was not helped by the delay in a number of new field start-ups.
24 Oil & Gas UK has revised the way it converts gas production from volume units to barrels of oil equivalent based on new data published by DECC. While the production trends are only nominally affected, the new data show that in previous years Oil & Gas UK was being overly-conservative in the conversion from gas to oil. This results in the net gas production estimates being upwardly revised for both our historical and forecast production figures (the revisions are typically around five per cent but vary depending on the calorific value of the gas produced in each year).
0
20
40
60
80
100
120
140
Jan-
05
Jul-0
5
Jan-
06
Jul-0
6
Jan-
07
Jul-0
7
Jan-
08
Jul-0
8
Jan-
09
Jul-0
9
Jan-
10
Jul-1
0
Jan-
11
Jul-1
1
Jan-
12
Jul-1
2
Jan-
13
Jul-1
3
Jan-
14
Jul-1
4
Jan-
15
Prod
uctio
n (M
illio
n bo
e)
Source: DECC, DUKES
Figure 43: Monthly Production Performance

ECONOMIC REPORT 2015 59
0
0.5
1
1.5
2
2.5
3
3.5
4
2005 2006 2007 2008 2009 2010 2011 2012 2013 2014
Tota
l Pro
duct
ion
(Mill
ion
boep
d)
-9.5%
-9.9%
-6.4%
-19.7%
-15.0%-7.7% -0.2%
-5.1%-4.8%
Source: DECC, DUKES
Figure 44: Year-on-Year Production Performance
0
200
400
600
800
1,000
1,200
1,400
2005 2006 2007 2008 2009 2010 2011 2012 2013 2014
Prod
uctio
n (M
illio
n bo
e)
Gas
Oil and Natural Gas Liquids
Source: DECC, DUKES
Figure 45: Liquids and Gas Production
1
2
3
4
5
6
7
8
9
10
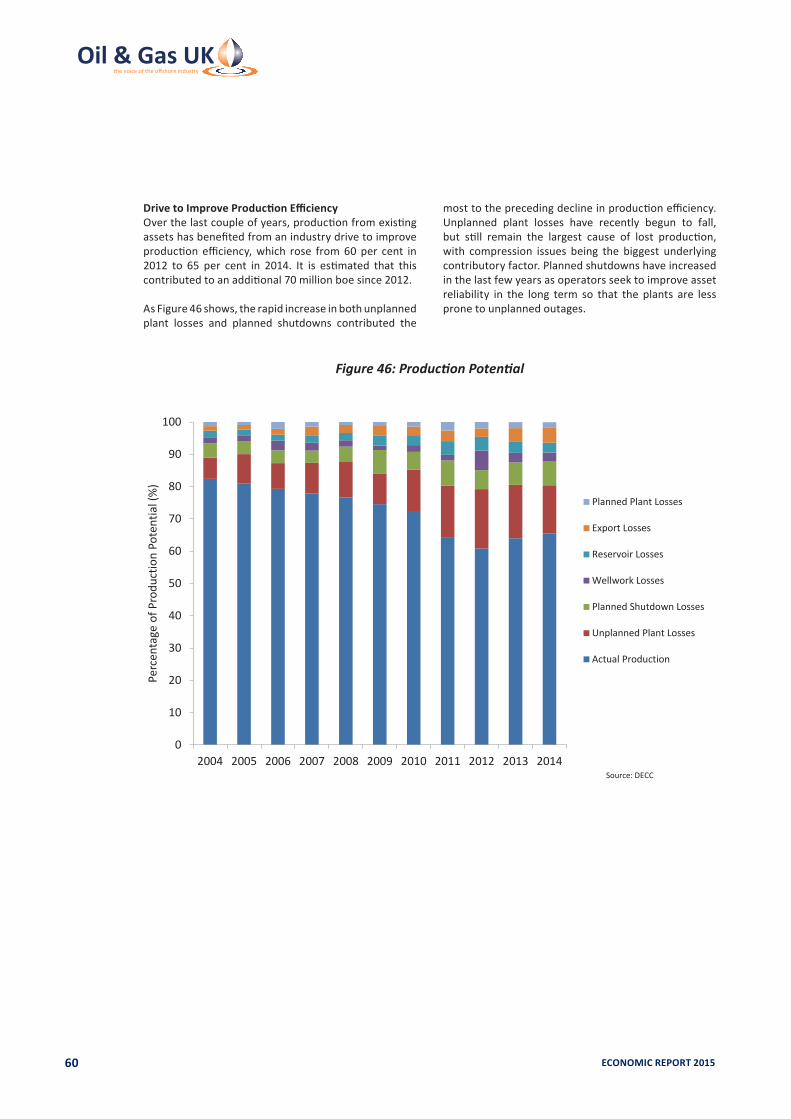
ECONOMIC REPORT 201560
DrivetoImproveProductionEfficiencyOver the last couple of years, production from existing assets has benefited from an industry drive to improve production efficiency, which rose from 60 per cent in 2012 to 65 per cent in 2014. It is estimated that this contributed to an additional 70 million boe since 2012.
As Figure 46 shows, the rapid increase in both unplanned plant losses and planned shutdowns contributed the
most to the preceding decline in production efficiency. Unplanned plant losses have recently begun to fall, but still remain the largest cause of lost production, with compression issues being the biggest underlying contributory factor. Planned shutdowns have increased in the last few years as operators seek to improve asset reliability in the long term so that the plants are less prone to unplanned outages.
0
10
20
30
40
50
60
70
80
90
100
2004 2005 2006 2007 2008 2009 2010 2011 2012 2013 2014
Perc
enta
ge o
f Pro
duct
ion
Pote
ntia
l (%
)
Planned Plant Losses
Export Losses
Reservoir Losses
Wellwork Losses
Planned Shutdown Losses
Unplanned Plant Losses
Actual Production
Source: DECC
Figure 46: Production Potential
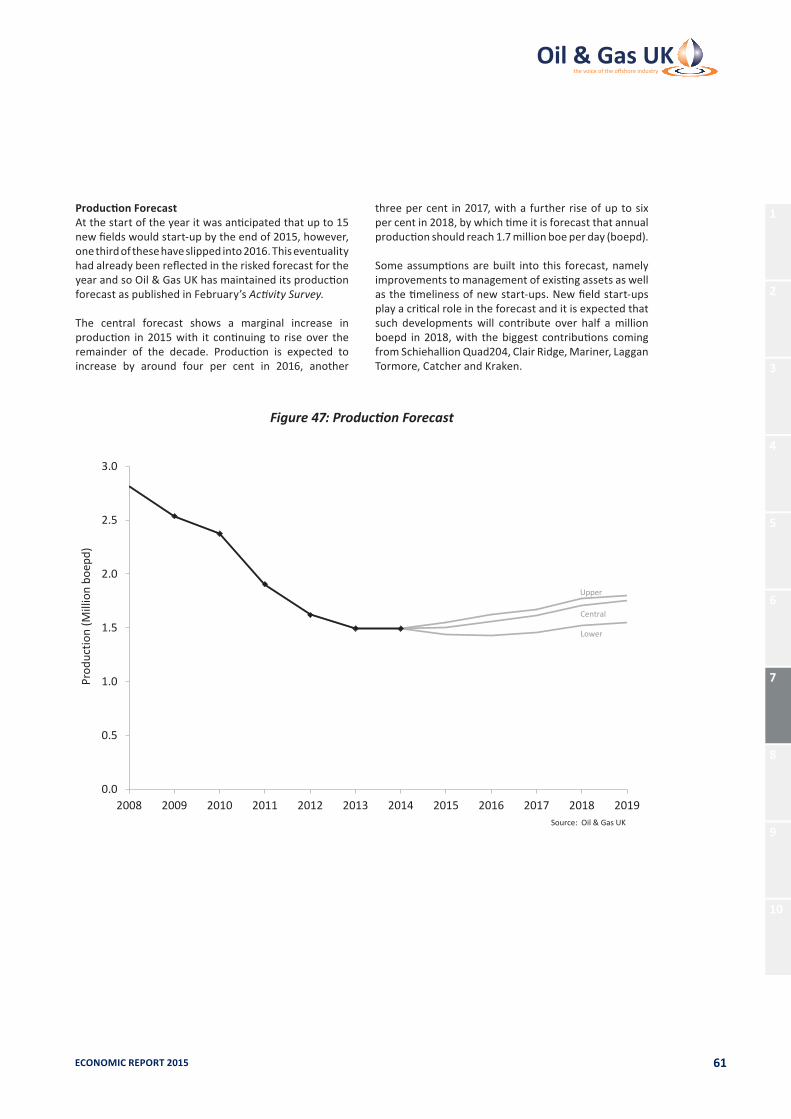
ECONOMIC REPORT 2015 61
ProductionForecastAt the start of the year it was anticipated that up to 15 new fields would start-up by the end of 2015, however, one third of these have slipped into 2016. This eventuality had already been reflected in the risked forecast for the year and so Oil & Gas UK has maintained its production forecast as published in February’s Activity Survey.
The central forecast shows a marginal increase in production in 2015 with it continuing to rise over the remainder of the decade. Production is expected to increase by around four per cent in 2016, another
three per cent in 2017, with a further rise of up to six per cent in 2018, by which time it is forecast that annual production should reach 1.7 million boe per day (boepd).
Some assumptions are built into this forecast, namely improvements to management of existing assets as well as the timeliness of new start-ups. New field start-ups play a critical role in the forecast and it is expected that such developments will contribute over half a million boepd in 2018, with the biggest contributions coming from Schiehallion Quad204, Clair Ridge, Mariner, Laggan Tormore, Catcher and Kraken.
0.0
0.5
1.0
1.5
2.0
2.5
3.0
2008 2009 2010 2011 2012 2013 2014 2015 2016 2017 2018 2019
Prod
uctio
n (M
illio
n bo
epd)
Upper
Central
Lower
Source: Oil & Gas UK
Figure 47: Production Forecast
1
2
3
4
5
6
7
8
9
10

ECONOMIC REPORT 201562
0
0.5
1
1.5
2
2.5
2014 2015 2016 2017 2018
Deco
mm
issio
ning
Exp
endi
ture
(£ B
illio
n)
Source: Oil & Gas UK
Figure 48: Decommissioning Forecast by Field
7.8Decommissioning
The industry is determined to avoid premature decommissioning and retain the infrastructure required to achieve MER UK. However, there will always come a time when the costs of further recovery can no longer be sustained by income from the field and when the surrounding region is considered to have insufficient prospectivity to support future operations.
The UKCS’ maturity means that decommissioning is one of the OGA’s priorities. It is aligned with industry strategy to ensure decommissioning is carried out as cost effectively and safely as possible, but not prematurely.
While decommissioning on the UKCS is still in its infancy, expenditure in this area passed £1 billion for the first time in 2014. It is likely to rise to around £1.5 billion in
2015 and to over £2 billion per annum by 2018. Last year, 14 fields on the UKCS incurred spend in excess of £10 million on decommissioning activity. That number is likely to rise to over 50 fields at different phases of decommissioning by the end of the decade.
The scale of some of the decommissioning projects to be undertaken on the UKCS over the next decade has not been seen before anywhere in the world. Where the UK leads, other countries will inevitably follow and demand for expertise will continue to grow both domestically and globally. The experience gained over the next decade will offer a competitive advantage to the UK’s domestic supply chain, providing the opportunity to become world leaders in this field as long as companies are able to adapt their businesses to offer support on decommissioning projects. See Section 8 for a case study on the Brent decommissioning project.

ECONOMIC REPORT 2015 63
1
2
3
4
5
6
7
8
9
10
ECONOMIC REPORT 201564
8

ECONOMIC REPORT 2015 65
GoldenEagleAreaDevelopment
SummaryAs the UK offshore oil and gas industry focuses on delivering significant and sustained improvements in cost management in conjunction with MER UK, the Golden Eagle Area Development is an excellent example of what is still possible in a recognised mature basin.
The Nexen-operated Golden Eagle is one of the biggest developments on the UKCS for several years. Production of first oil in late 2014 was accomplished ahead of schedule and under budget. Just as important, the project’s safety record was truly a best-in-class performance. At the time of first production, on 30 October 2014, the project team had successfully executed 18 million man-hours without a lost time incident (LTI).
These achievements represent the efforts of a wide range of suppliers and contractors from the UK and global supply chain, as well as the joint venture partners in the project – Maersk, Suncor, EOG and One BV.
Around two-thirds of the £2.3 billion investment in Golden Eagle directly benefited the UK supply chain and the development phase supported around 2,500 jobs. Around 400 operational roles have been created to safely and reliably manage production at Golden Eagle, which has an expected production life of at least 18 years. Peak oil production is anticipated at 70,000 boepd.
FromDiscoverytoDevelopmentThe Golden Eagle Area Development is located approximately 70 kilometres north east of Aberdeen, where water depths typically range between 89 and 139 metres. As with all offshore oil and gas activity, safety was the primary priority throughout the
8.CaseStudies
Location of the Golden Eagle platform, 70 kilometres north east of Aberdeen81
2
3
4
5
6
7
8
9
10

ECONOMIC REPORT 201566
development phase and the project team adopted the mantra “Safety First” from the very start of the project.
The huge development involved three different fields: Golden Eagle, Peregrine and Solitaire. Golden Eagle itself was discovered in 2007 and Peregrine in 2008. Solitaire, although discovered in 2001, was acquired by Nexen and co-venture participants in 2010. Overall, production volumes of around 140 million bbls are currently expected over the lifetime of the development.The Field Development Plan (FDP) for Golden Eagle was approved by DECC in October 2011, followed by Solitaire the subsequent year.
Many of the project team members had undertaken key roles in Nexen’s Buzzard development, which produced first oil in 2007 and is currently the biggest producing field on the UKCS. Together, they brought their experience and skills – along with substantial learnings from Buzzard – to Golden Eagle.
One of the project team’s early priorities was to establish a high level of visibility within all facets of the Golden Eagle supply chain.
Graham Swan, major projects director at Nexen, explains: “Nexen wanted to make certain that every company involved – large or small – had a clear understanding of how they fitted into the overall project. A key focus of early discussions was to cultivate alignment of the behaviours and values expected by all parties involved.
“This proved to be an excellent way in setting the correct tone to embark upon this huge mission and gave all partners the opportunity to fully understand how their contribution mattered in successfully delivering the project.”
The project team ensured they remained visible throughout the development phase. They followed the project’s centre of gravity, from blueprints to fabrication yards to the flotel.
A World RecordThe wellhead and production, utilities and quarters (PUQ) decks were fabricated by Lamprell in Dubai, with the accommodation and helideck built by SLP at their yard in Lowestoft.
The Golden Eagle platform and drilling rigs during the development phase

ECONOMIC REPORT 2015 67
The safe transfer of the decks from Dubai to the North Sea required a 30-day voyage and managing security issues in and around the Gulf and Arabian Peninsula, including the threat of piracy. This section of the journey was preceded with a high-degree of planning, collaboration and communication with partners in the maritime industry, security and the military.
In fact, this phase of the development saw a new world record set. The safe delivery of the 13,191.98 tonnes of PUQ deck was officially recognised by Guinness World Records as the heaviest load moved by self-propelled modular trailers (SPMTs). An official Guinness World Record certificate was presented to Lamprell at a ceremony in April 2014.
TakingShapeAhead of the various decks and platform modules arriving, work took place in 2013 to install two sets of jackets, both weighing around 6,000 tonnes. The jackets, piled securely in the seabed, are as tall as the London Eye and were manufactured by Heerema in Holland. The subsea installation campaign with Technip also kicked off in 2013 with installation of infield and oil and gas export pipeline routes.
The PUQ deck was installed in May 2014, enabling the project to move into the final phase of development and start the countdown to first production. This marked a major transition point. The development project team now had to arrange to hand over responsibility for the asset to the operations team, which would manage the platform once production commenced.
GoldenEagleTakesFlightWith the final facilities hook-up and offshore commissioning completed over the summer of 2014, Nexen began to import gas to the platform in mid-October to prepare for first oil production. First oil arrived on 30 October – 47 days ahead of schedule and under budget.
Following first oil, the Nexen team focused on ensuring a safe and reliable ramp up to full production in 2015 with excellent progress made towards plateau rates of 70,000 boepd in 2015. A major part of this work includes enabling production from the Solitaire field, located to the north east of the Golden Eagle platform.
Oil produced from Golden Eagle enters the Flotta pipeline system at Talisman’s Claymore platform and more than doubles the crude throughput at the Flotta terminal in Orkney. The introduction of Golden Eagle liquids will significantly improve the quality of Flotta Blend, meriting a new name – Flotta Gold.
Golden Eagle’s production, utilities and quarters deck
Looking ForwardWith the UK offshore oil and gas industry now focused on the shared agenda of MER UK, the Golden Eagle Area Development has the ability to provide the UKCS with a new hub for potential future oil and gas finds.
Ray Riddoch, Nexen’s UK managing director, says: “Golden Eagle adds significant production volumes to our North Sea business today and is a potential hub for future discoveries.
“More fundamentally, our project team has proved that North Sea mega-projects such as Golden Eagle can still be done and delivered safely and efficiently. We look forward to applying the lessons we’ve learned from Golden Eagle to future Nexen projects in the North Sea and elsewhere.”
1
2
3
4
5
6
7
8
9
10

ECONOMIC REPORT 201568
Brent Delta

ECONOMIC REPORT 2015 69
Brent Field Decommissioning
SummaryThe Brent oil and gas field, lying 186 kilometres north east of the Shetland Islands, has been a cornerstone of the UK’s hugely successful oil and gas industry for almost 40 years. It has created and sustained thousands of jobs, contributed billions of pounds in tax revenues, and provided the UK with a substantial amount of its oil and gas. Now, after many years of service to the UK, the Brent field is reaching the stage where almost all the economically recoverable reserves of oil and gas have been produced.
The field infrastructure is extensive. It comprises four topsides with a combined weight of more than 100,000 tonnes; three concrete gravity base structures weighing 300,000 tonnes each; 17,000 tonnes of steel jacket; 103 kilometres of pipeline; 140 wells; and 64 concrete storage tanks in total, with 42 used to store oil. At around 60 metres in height, each concrete storage cell is taller than Nelson’s Column.
When the Brent field was discovered in 1971, it was one of the most significant oil and gas finds made in the UK sector of the North Sea. At that time the expected life span of the field was 25 years at the most.
Brent Bravo began production in November 1976, and a month later the first tanker loaded crude oil at the Brent Spar. In 1982, Brent field production peaked at 504,000 bbls of oil and 26.6 million cubic metres of gas per day. Its production that year would have met the annual energy needs of around half of all UK homes.
Continuous investment and a redevelopment in the 1990s by the field’s owners Shell and Esso extended the field’s life well beyond original expectations.
Since production began in 1976, two thirds of the revenue generated from the field has been paid to the government as tax – amounting to more than £20 billion.
NextPhaseThe next phase in the life cycle of the field is to decommission the Brent field’s four platforms and their related infrastructure. This will be a complex, major engineering project and will take over ten years to complete. It follows the decommissioning of other operators’ platforms in the North Sea with some 40 programmes submitted to DECC so far.
Having extended the field’s life for as long as possible and extracted 99.5 per cent of the economically recoverable reserves, the next step before considering decommissioning was to explore potential ways to re-use the platforms. Options considered ranged from carbon capture and storage facilities to wind farms. However, eventually Shell and DECC concluded that the age of the infrastructure, its distance from shore, the lack of demand for re-use, as well as the cost of modernising the facilities, made its re-use unattractive.
Brent decommissioning project director, Alistair Hope, said: “The sheer scale of the field infrastructure means that not only is Brent the biggest decommissioning project Shell has undertaken so far, it will also be one of the biggest to be undertaken in the North Sea to date. It is located in an extremely harsh marine environment, and the age of the infrastructure adds to the engineering challenge. Decommissioning the enormous Brent structures will require advanced engineering and significant investment.”
Shell has been working since 2006 on the long-term planning necessary to cease production and subsequently decommission the Brent field. Production from Brent Delta ceased in December 2011 and from both Alpha and Bravo in November 2014. Production from Charlie is expected to come to an end within the next few years.
Shell has carefully planned the Brent field’s decommissioning process following a tightly defined regulatory process. Different risks, challenges and benefits have been weighed up through a thorough process of Comparative Assessments, and various options will have been considered before the recommendations are submitted to DECC.
The task is to find a way to carry out this work so that it will:• Ensure the safety of people working on the project• Have minimal impact on the environment• Be technically achievable• Consider the impact on other users of the sea and
affected communities• Be economically responsible
1
2
3
4
5
6
7
8
9
10

ECONOMIC REPORT 201570
As operator of the Brent field, Shell is required to submit a Decommissioning Programme to DECC. The programme will include detailed recommendations for closing down and making safe the four platforms and subsea infrastructure of the Brent field, including 140 wells, comprising over 400 individual well bores. These recommendations will be the result of over eight years of engineering studies, including the commissioning of over 300 separate studies, expert input, consultations and scientific assessments, including extensive discussions with stakeholders.
Early stakeholder engagement and research has been essential, and Shell has carried out a thorough and transparent process of in-depth consultation with interested parties, as well as with technical specialists and experts from across the industry. Since 2007, Shell has received input from over 180 organisations, including non-governmental organisations, academics, local fishermen and community groups, as well as local and national government, involving over 400 individuals. The company has communicated regularly through its website, meetings, presentations and media briefings.
The expertise and input of people from outside of the project has made a significant contribution to the recommendations for decommissioning. Their insights and experience have contributed to the decision-making. The project team has been, and continues to be, in dialogue with a range of organisations that are affected by and take an interest in the Brent field’s decommissioning to understand their views. There has also been extensive work with industry bodies and technical experts to explore the full range of options and test the recommendations.
To ensure the validity of the science, an independent group of externally appointed experts and scientists, called the Independent Review Group (IRG) was set up in 2006 at the outset of the project. Its role is to review objectively all the scientific and engineering methods that have been used to assess the decommissioning options and verify that they are based on sound science. The project has responded to around 3,000 review comments from the IRG since its work began. The IRG panel is chaired by Professor John Shepherd, a professor of oceanography at the University of Southampton, who also sits on the UK Government’s climate change
Brent field
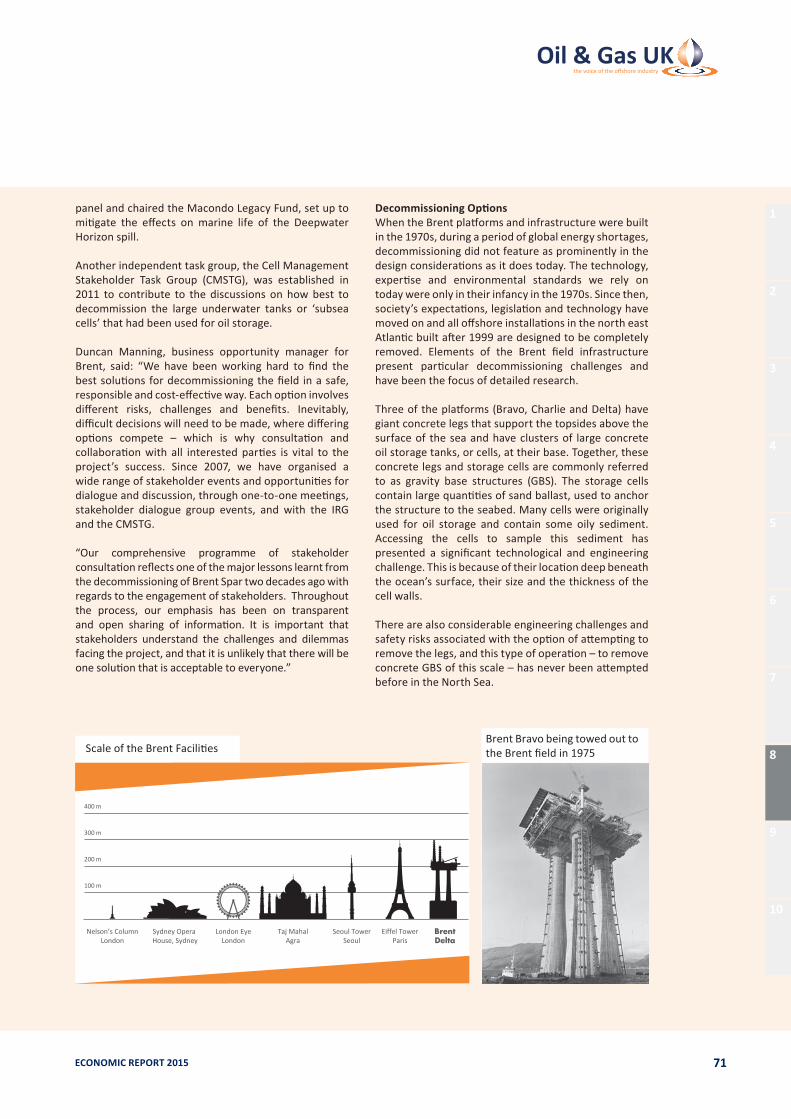
ECONOMIC REPORT 2015 71
panel and chaired the Macondo Legacy Fund, set up to mitigate the effects on marine life of the Deepwater Horizon spill.
Another independent task group, the Cell Management Stakeholder Task Group (CMSTG), was established in 2011 to contribute to the discussions on how best to decommission the large underwater tanks or ‘subsea cells’ that had been used for oil storage.
Duncan Manning, business opportunity manager for Brent, said: “We have been working hard to find the best solutions for decommissioning the field in a safe, responsible and cost-effective way. Each option involves different risks, challenges and benefits. Inevitably, difficult decisions will need to be made, where differing options compete – which is why consultation and collaboration with all interested parties is vital to the project’s success. Since 2007, we have organised a wide range of stakeholder events and opportunities for dialogue and discussion, through one-to-one meetings, stakeholder dialogue group events, and with the IRG and the CMSTG.
“Our comprehensive programme of stakeholder consultation reflects one of the major lessons learnt from the decommissioning of Brent Spar two decades ago with regards to the engagement of stakeholders. Throughout the process, our emphasis has been on transparent and open sharing of information. It is important that stakeholders understand the challenges and dilemmas facing the project, and that it is unlikely that there will be one solution that is acceptable to everyone.”
DecommissioningOptionsWhen the Brent platforms and infrastructure were built in the 1970s, during a period of global energy shortages, decommissioning did not feature as prominently in the design considerations as it does today. The technology, expertise and environmental standards we rely on today were only in their infancy in the 1970s. Since then, society’s expectations, legislation and technology have moved on and all offshore installations in the north east Atlantic built after 1999 are designed to be completely removed. Elements of the Brent field infrastructure present particular decommissioning challenges and have been the focus of detailed research.
Three of the platforms (Bravo, Charlie and Delta) have giant concrete legs that support the topsides above the surface of the sea and have clusters of large concrete oil storage tanks, or cells, at their base. Together, these concrete legs and storage cells are commonly referred to as gravity base structures (GBS). The storage cells contain large quantities of sand ballast, used to anchor the structure to the seabed. Many cells were originally used for oil storage and contain some oily sediment. Accessing the cells to sample this sediment has presented a significant technological and engineering challenge. This is because of their location deep beneath the ocean’s surface, their size and the thickness of the cell walls.
There are also considerable engineering challenges and safety risks associated with the option of attempting to remove the legs, and this type of operation – to remove concrete GBS of this scale – has never been attempted before in the North Sea.
400 m
300 m
200 m
100 m
Nelson’s Column London
Sydney Opera House, Sydney
Taj Mahal Agra
Seoul Tower Seoul
Eiffel Tower Paris
Brent Delta
London Eye London
Scale of the Brent Facilities
1
2
3
4
5
6
7
8
9
10
Brent Bravo being towed out to the Brent field in 1975
ECONOMIC REPORT 201572
In cases such as these, there may be no ideal solution and no clear consensus among experts on the best solution. The Oslo/Paris (OSPAR) Convention, which provides the framework for protecting and conserving the north east Atlantic (including the North Sea), recognises that there are significant difficulties in removing huge concrete installations such as GBS. In these instances, operators can and have made a case for an exemption from the general rule of complete removal, referred to as a ‘derogation’. If Shell’s assessments conclude that the safest and most responsible solution is to leave the GBS structures in place, it will seek such a derogation. Decommissioning is an intrinsic part of the life cycle of any oil and gas field. For the Brent field, this is a long-term project that is expected to take over a decade to complete. It is likely to create and sustain thousands of full-time UK jobs – many of which are highly skilled – for years to come.
The field has a long history of providing employment and supply chain opportunities to local people and businesses. Several major contracts have already been awarded to UK companies after a competitive tendering process. The Brent Delta decommissioning services contract was awarded in 2010 to Wood Group PSN, an Aberdeen-based company that provides services to the global oil and gas sector. The contract for recycling the platforms’ topsides and the Brent Alpha steel jacket was awarded in 2014 to Able UK Limited, in Seaton Port, near Hartlepool. The target is for at least 97 per cent of the facilities to be recycled. The work at Able to reinforce the quay and dismantle and recycle the topside will create and sustain around 100 jobs.
Hundreds of oil and gas installations in the North Sea are scheduled for decommissioning by 2040 and some 470 installations will require decommissioning over the next 30 to 40 years. This presents the UK with a potential opportunity to become a global leader in decommissioning skills – skills that could later be deployed around the world.
As one of the first major fields to be decommissioned in the North Sea, Brent will enable UK companies to develop specialist skills and gain invaluable expertise, just as they did when the platforms were being installed and production offshore was starting. Sharing knowledge and best practice is very important for the development of the emerging decommissioning sector.
Shell works with other operators, regulators and the supply chain – directly and through Decom North Sea – and speaks at international conferences to ensure this knowledge and experience will give the UK an opportunity to become a leader in decommissioning projects, both in the North Sea and worldwide.
Alistair Hope said: “There is a clear need to improve decommissioning cost efficiencies and to develop a collaborative approach across the industry, with a focus on decreasing the time it takes to plug and make safe the wells, which accounts for a high proportion of the decommissioning costs.”
The recommendations for decommissioning the Brent field are being submitted to the UK Government in two phases. With DECC’s approval, Shell made the decision to bring forward submission of a Decommissioning Programme for the Brent Delta topside, ahead of a programme for the remainder of the infrastructure. This initial programme has been through the public consultation phase and gained approval in July 2015.
Removal of the Brent Delta topside will involve using a newly-designed heavy lift vessel, the Pioneering Spirit, developed by Swiss-based specialists Allseas. This game-changing new technology will use advanced engineering techniques to remove the 24,200 tonne topside structure in one lift. It will be the heaviest single lift offshore ever. Shell’s structural engineers have been strengthening the underside of Brent Delta’s topside, as well as the drilling derrick and flare tower, to ensure they can withstand the lift forces. The Pioneering Spirit will have been through extensive trials, including test lifts, ahead of the Brent Delta topside operation. Once lifted, the structure will be loaded onto a barge and moved to the Able yard for recycling. The quay at this yard has required additional strengthening to enable it to take the weight of the Brent topsides’ skid.
The plan for decommissioning the remainder of the Brent field will be submitted when Shell is confident that the proposals are safe, technically achievable, environmentally and socially sound, and financially responsible. The approval process for the full plan is expected to take more than a year, while the entire Brent field decommissioning is expected to take more than a decade to complete.

ECONOMIC REPORT 2015 73
The Pioneering Spirit being fitted with its lifting arms 1
2
3
4
5
6
7
8
9
10

ECONOMIC REPORT 201574
9

ECONOMIC REPORT 2015 75
A)EUEmissionsTradingScheme
Although the UKCS is a major source of energy production, it is also a significant industrial consumer of energy and a source of GHG emissions. As such, the offshore and onshore installations that form part of the UK upstream are covered within the EU ETS, which was intended at its inception in 2005 to be the principal policy instrument for EU decarbonisation.
The scheme imposes a carbon cost on all participants, requiring them to purchase EU Allowances (EUA) for their GHG emissions unless they are granted free allowances. The UK upstream sector receives free allowances in the current ETS Phase III (from 2013 to 2020) for part of its emissions since it is deemed to be vulnerable to ‘carbon leakage’ and international competition from producing areas that do not face a carbon price.
The demand for EUAs from industrial sectors collapsed during the economic recession in 2008-09, causing the carbon price to fall sharply as the supply of allowances was unable to respond. The effect on the carbon price was exacerbated by the effect of the 2009 EU Renewables Directive, which mandated new investment
in renewables and thereby undermined further the demand for allowances.
As the European economic recovery since 2010 has been muted, EUA prices have remained depressed, undermining confidence in the ETS as an effective policy instrument. After reaching a low of €4/te CO2 in 2013, EUA prices in the first half of 2015 have averaged more than €7/te CO2 and seem likely to rise modestly over the remainder of Phase III. In an effort to reduce the chronic surplus of allowances and to restore the ETS’ credibility, the EU finally agreed in 2014 to defer the auction of 900 million allowances within Phase III (so-called ‘backloading’) to reduce the surplus in 2014-15. In April 2015, it intervened further to create a new Market Stability Reserve (MSR) from 1 January 2019. The MSR will act as a reservoir, absorbing the surplus and raising EUA prices by the mid-2020s. Although there is no explicit carbon price target, efforts to model the impact of these interventions suggest that prices may be in the range €20-30/te CO2 by 2025, but still below the €40-60/te CO2 thought to be decisive in shifting energy demand to lower-carbon fuels.
0
5
10
15
20
25
30
2008 2009 2010 2011 2012 2013 2014 2015
EUA
Spot
Pric
e (€
/te
CO2e
)
Source: ICIS Heren, Intercontinental Exchange
*August 2015 predicted average
*
Figure 49: Monthly Average Spot EU Allowance Prices, January 2008 to August 2015
9. Appendices
91
2
3
4
5
6
7
8
9
10
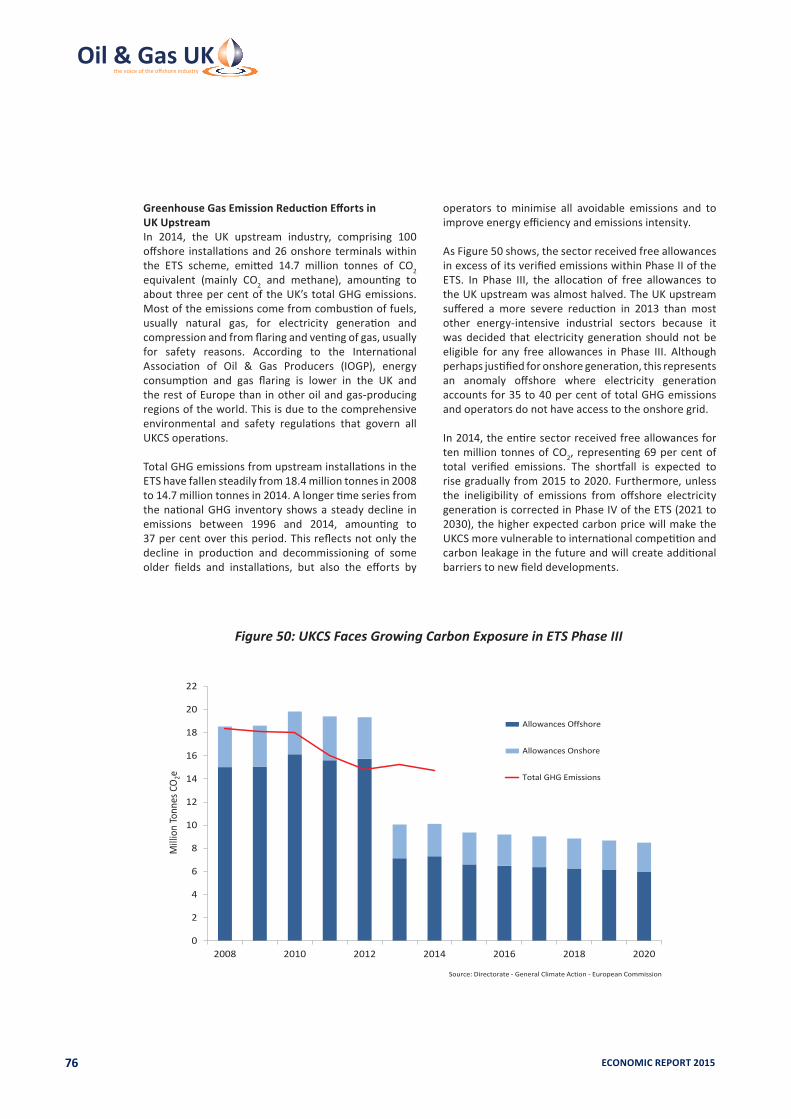
ECONOMIC REPORT 201576
GreenhouseGasEmissionReductionEffortsin UK UpstreamIn 2014, the UK upstream industry, comprising 100 offshore installations and 26 onshore terminals within the ETS scheme, emitted 14.7 million tonnes of CO2 equivalent (mainly CO2 and methane), amounting to about three per cent of the UK’s total GHG emissions. Most of the emissions come from combustion of fuels, usually natural gas, for electricity generation and compression and from flaring and venting of gas, usually for safety reasons. According to the International Association of Oil & Gas Producers (IOGP), energy consumption and gas flaring is lower in the UK and the rest of Europe than in other oil and gas-producing regions of the world. This is due to the comprehensive environmental and safety regulations that govern all UKCS operations.
Total GHG emissions from upstream installations in the ETS have fallen steadily from 18.4 million tonnes in 2008 to 14.7 million tonnes in 2014. A longer time series from the national GHG inventory shows a steady decline in emissions between 1996 and 2014, amounting to 37 per cent over this period. This reflects not only the decline in production and decommissioning of some older fields and installations, but also the efforts by
operators to minimise all avoidable emissions and to improve energy efficiency and emissions intensity.
As Figure 50 shows, the sector received free allowances in excess of its verified emissions within Phase II of the ETS. In Phase III, the allocation of free allowances to the UK upstream was almost halved. The UK upstream suffered a more severe reduction in 2013 than most other energy-intensive industrial sectors because it was decided that electricity generation should not be eligible for any free allowances in Phase III. Although perhaps justified for onshore generation, this represents an anomaly offshore where electricity generation accounts for 35 to 40 per cent of total GHG emissions and operators do not have access to the onshore grid.
In 2014, the entire sector received free allowances for ten million tonnes of CO2, representing 69 per cent of total verified emissions. The shortfall is expected to rise gradually from 2015 to 2020. Furthermore, unless the ineligibility of emissions from offshore electricity generation is corrected in Phase IV of the ETS (2021 to 2030), the higher expected carbon price will make the UKCS more vulnerable to international competition and carbon leakage in the future and will create additional barriers to new field developments.
0
2
4
6
8
10
12
14
16
18
20
22
2008 2010 2012 2014 2016 2018 2020
Mill
ion
Tonn
es C
O 2e
Allowances Offshore
Allowances Onshore
Total GHG Emissions
Source: Directorate - General Climate Action - European Commission
Figure 50: UKCS Faces Growing Carbon Exposure in ETS Phase III

ECONOMIC REPORT 2015 77
B)TheFiscalRegime
The production of oil and gas from the UKCS is subject to a tax system that is different from that applying to the rest of industry and commerce in the UK. It is a so-called ‘ring fence’ regime25 comprising:
• Ring Fence Corporation Tax (RFCT) – this is computed in a similar way to normal Corporation Tax (CT, a tax on company profits), but with different rules for the treatment of losses, 100 per cent first-year capital allowances, and a higher rate of 30 per cent on all profits. The oil and gas industry has not benefited from reductions in the CT rate seen elsewhere in the economy in recent years.
• Supplementary Charge (SC) – this is an additional corporation tax but finance costs are not deductible, levied on all profits at the rate of 20 per cent from 1 January 2015 (before that the rate was 32 per cent).
• Petroleum Revenue Tax (PRT) – this is a tax on field-based profits and only applies to fields given development consent before March 1993 by the then
Department of Trade and Industry26. PRT is levied at a rate of 50 per cent (but will reduce to 35 per cent from 1 January 2016) and is deductible for the purposes of computing profits charged to RFCT and SC. Immediate relief is given for all capital and revenue expenses.
Marginal tax rates therefore vary across the UKCS as follows (see Figure 51):
• Fields subject to PRT, SC and RFCT pay 75 per cent of their profits in tax (falling to 67.5 per cent from 1 January 2016), comprising PRT at 50 per cent (35 per cent from 1 January 2016), plus 30 per cent RFCT and 20 per cent SC of the remaining 50 per cent.
• Fields not paying PRT (either because they are not liable to this tax, or by virtue of a relief called Oil Allowance27) are subject to tax at a marginal rate of 50 per cent (30 per cent RFCT plus 20 per cent SC).
• Fields that benefit from a field/investment allowance – a relief against SC – pay tax at a rate between 30 per cent (that is only paying RFCT) and 50 per cent (on all net income above the value of the field allowance).
0 20 40 60 80 100
Non Oil andGas Company
Qualifies forInvestmentAllowance
Non-PRT, NoAllowance
PRT PayingField*
Pre-Tax Profit
% Share
35% PRT 30% RFCT 20% SC
30% RFCT
20% CT
20% SC
100% Pre-Tax Profit
30% RFCT
32.5% Post-Tax Profit
50% Post-Tax Profit
50-70% Post-Tax Profit
80% Post-Tax Profit
of remaining 65%
Source: Oil & Gas UK
0-20% SC
*Effective as of 1.1.2016Until this date PRT sits at 50% and Post-Tax Profit at 25%
Figure 51: Tax Rates for UKCS and Other UK Companies, post March 2015 Budget
25 The ‘ring fence’ ensures that the profits from oil and gas production are taxed separately from any other activities within a company and any losses made by those other activities cannot be used by the company to offset the profits from the production of oil and gas.
26 DECC’s predecessor for energy matters. Its other main functions are now the responsibility of the Department for Business, Innovation & Skills.
27 Oil Allowance is a relief to ensure that PRT is only levied on the largest, most productive fields. The allowance gives each field liable to PRT amounts of oil and gas that can be produced free of PRT per tax period and for the life of the field. Any production above these amounts is subject to PRT at the prevailing rate.
1
2
3
4
5
6
7
8
9
10
ECONOMIC REPORT 201578
TheInvestmentAllowanceBudget 2015 announced the introduction of a new simplified investment incentive based on capital expenditure incurred within a determined field area. This new allowance replaces all the previous offshore field allowances and works to reduce the marginal rate of tax on a much broader range of investments across the UKCS.
The allowance shelters a certain amount of income (62.5 pence for every £1 invested) from the (now reduced) SC – meaning that for a proportion of production income generated by that field only RFCT is due. Transitional rules are in place to ensure that the value of the old field allowances is protected as long as FDP approval is gained before the end of 201528. The Investment Allowance applies to all investment expenditure incurred after 1 April 2015.
The benefits of this new approach (alongside the cluster allowance for areas thought to contain high pressure high temperature resources) are principally that of simplification of the allowance regime and removal of the distortionary effects of the old allowances that incentivised some projects over others. Alongside reductions in headline rates for SC and PRT, also announced at Budget, the Investment Allowance aims to more successfully attract capital to the UKCS, as is necessary for a mature and high cost region.
TheBalanceofTaxesandAllowancesThe oil and gas fiscal regime taxes profits at a minimum rate of 30 per cent, which is considerably higher than for companies in all other parts of the economy. The Oil Allowance within the PRT regime and the Field Investment Allowance for SC purposes only ever reduce the tax burden from very high rates to ones that are closer to, but still higher, than that for other companies. Therefore, these allowances cannot be said to represent a subsidy for the industry, as is sometimes claimed; all they do is partially alleviate the higher than normal tax burden.
Furthermore, companies that have integrated businesses are subject to both the ring fence regime in respect of their upstream oil and gas production and the normal CT regime for their downstream refining and marketing businesses. Companies cannot offset their profits or losses between the two regimes to reduce their overall tax liability, because upstream profits are always taxed separately under the ring fence regime.
28 For the list of Field Allowances, see the Economic Report 2014 at www.oilandgasuk.co.uk/publicationssearch.cfm

ECONOMIC REPORT 2015 79
1
2
3
4
5
6
7
8
9
10

ECONOMIC REPORT 201580
10

ECONOMIC REPORT 2015 81
10. Glossary
10bbl barrel (of oil) (one barrel = 0.16 m3 and 7.55 barrels = one tonne)
bcm billion cubic metres (one metre3 = 35.3 cubic feet)
bcm/y billion cubic metres per year (of gas)
BGS British Geological Survey
billion one thousand million or 109
boe barrel of oil equivalent – this includes oil, gas and other hydrocarbons and equates all of these with oil, in energy equivalent terms, so that a common measure can be made of any of them (one boe = 164 m3 or 5.8 thousand cubic feet of natural gas)
boepd barrel of oil equivalent per day
bpd barrels per day
brownfield an oil or gas field already in production
Brent as applied to trading, the standard quality of oil in Europe and elsewhere comprising a blend of four North Sea crudes from the Brent, Ekofisk, Forties and Oseberg fields
BTU British Thermal Unit (of energy)
CAGR compound annual growth rate
capex capital expenditure
CDA Common Data Access Limited (a subsidiary of Oil & Gas UK)
CNS central North Sea
CO2 carbon dioxide (one of the six greenhouse gases under the Kyoto protocol)
condensate low density, liquid hydrocarbon usually associated with natural gas which, depending on temperature and pressure, can be gaseous
CoP cessation of production (from a field)
CT Corporation Tax (see also RFCT)
DECC Department of Energy & Climate Change
Direct those employed by companies employment operating in the extraction of oil and gas and associated services
DRD Decommissioning Relief Deed
E&A exploration and appraisal (drilling)
EBITDA earnings before interest, tax, depreciation and amortisation
EIA Energy Information Administration (of the USA)
EMV Expected Mutual Value
EOR enhanced oil recovery
E&P exploration and production (of oil and/or gas)
EU European Union (the 28 member states)
EUA EU Allowances
EU ETS European Union’s Emissions Trading System
FDP Field Development Plan (subject to approval by DECC)
FPSO floating, production, storage and offloading (vessel)
GDP gross domestic product (the main measure of domestic economic output)
Geological description of a well that has had sidetrack a change in target location but
surface location has remained the same
GHG greenhouse gas (of which there are six under the Kyoto protocol)
greenfield an undeveloped oil or gas field (as opposed to ‘brownfield’)
1
2
3
4
5
6
7
8
9
10
ECONOMIC REPORT 201582
GVA gross value added
HH Henry Hub (the principal trading point for gas in the USA)
HMRC Her Majesty’s Revenue and Customs (sometimes known as ‘the Exchequer’)
HMT Her Majesty’s Treasury (of which HMRC is part)
HPHT high pressure, high temperature (of reservoirs)
IEA International Energy Agency (part of the OECD)
Indirect employment as a result of supplyemployment chain effects caused by oil and gas sector activity. For these companies, extraction of oil and gas and associated services will be one part of a wider businessInduced employment supported by the employment redistribution of income from the oil and gas sector
IOGP International Association of Oil & Gas Producers
LNG liquefied natural gas
LTI lost time incident
LTO light, tight oil
M&A mergers and acquisitions
mb/d million barrels per day (of oil)
mboepd million barrels of oil equivalent per day
mcm/d million cubic metres per day (of gas)
mechanical description of a specific sidetrack sidetrack that is made to bypass an
obstruction while the surface and target locations remain the same
MER UK maximising economic recovery from the UKCS (ref. the Wood Review)
MNSH Map of Northern Sea High
mtoe million tonnes of oil equivalent
mt/y million tonnes per year
MSR Market Stability Reserve
NBP National Balancing Point (fictional location in Britain where the NTS is notionally in balance and at which the trading of gas takes place)
NGL natural gas liquid (for example butane, propane)
NIC National Insurance Contributions
NPV Net Present Value
NNS northern North Sea
NTS National Transmission System (high pressure gas transmission system in Britain operated by National Grid – the ‘motorway’ network for gas)
OECD Organisation of Economic Co-operation and Development (based in Paris)
OGA Oil and Gas Authority
ONS Office for National Statistics
OPEC Organisation of Petroleum Exporting Countries
opex operating expenditure
P&A plugging and abandonment
PAR potential additional resources
PAYE Pay As You Earn
PE production efficiency, a measure of a field’s performance by comparing actual production as a percentage of the maximum production potential, after allowing for the natural decline of a reservoir, the reliability of infrastructure, the effects of shutdowns and major maintenance, and the like
P/I Profitability Index
PRT Petroleum Revenue Tax
PUQ production, utilities and quarters
p/th pence per therm (for gas)
RFCT Ring Fence Corporation Tax (as applied to upstream oil and gas production in UK)
SC Supplementary Charge (a corporate tax applied to upstream oil and gas production in addition to RFCT)
sidetrack description of a well that is started from the bore of an existing well, but is then deviated to create a new well
SME small to medium (sized) enterprise

ECONOMIC REPORT 2015 83
SNS southern North Sea (sometimes referred to as ‘southern gas basin’)
TVA Total Value Added
UKCS United Kingdom Continental Shelf
UOC unit operating cost
VAT Value Added Tax
WoS west of Shetland (sometimes referred to as ‘Atlantic margin’)
WTI West Texas Intermediate (the standard quality of oil for trading in the USA)
YTF yet-to-find (resources)
1
2
3
4
5
6
7
8
9
10

ECONOMIC REPORT 201584
Notes

ECONOMIC REPORT 2015 85
1
2
3
4
5
6
7
8
9
10

ECONOMIC REPORT 201586
Notes

ECONOMIC REPORT 2015 87

ECONOMIC REPORT 201588


![Offshore Gas Turbines and Dry Low NOx ... - Oil & Gas UKoilandgasuk.co.uk/wp-content/uploads/2015/05/producys-cayrgory.pdf · Technical Note –– [ENV002] Rev01 Page 1 of 29 February](https://img.pdfslide.us/doc/110x75/5a6ff6047f8b9abb538b8335/offshore-gas-turbines-and-dry-low-nox-oil-gas-ukoilandgasukcoukwp-contentuploads201505producys-cayrgorypdfpdf.jpg)