Embed Size (px)
Citation preview
1
Working Paper
334
ECONOMIC REFORMS ANDINDUSTRIAL PERFORMANCE
An Analysis of Capacity Utilisation in Indian Manufacturing
E. Abdul Azeez
June 2002

2
Working Papers published since August 1997 (WP 279 onwards)
can be downloaded from the Centre’s website (www.cds.edu)
3
This paper is derived from my M.Phil thesis submitted to the Jawaharlal
Nehru University, New Delhi. I thank my supervisors Dr. K Pushpangadan
and Dr. Achin Chakraborty for their insightful comments and enduring
inspirations while pursuing this work. The suggestions and
encouragement by Professor KK Subrahmanian and Dr. M Suresh Babu
are warmly acknowledged. An earlier version of the paper was presented
at the conference on Models and Methods in Economics, at the Indian
Statistical Institute, Calcutta, on 30th January 2002. I thank Professor
Dipankor Coondoo, who offered critical comments on the paper, and
other participants in the seminar for their suggestions. And the comments
and help extended by Jojo Jacob, Parameswaran and Lakshmi Nair are
also acknowledged. The usual disclaimer applies.
ECONOMIC REFORMS AND INDUSTRIAL PERFORMANCE
An Analysis of Capacity Utilisation in Indian Manufacturing
E. Abdul Azeez
June 2002

4
ABSTRACT
This paper examines the performance of Indian manufacturing
sector in terms of economic capacity utilization (CU), over 1974-1998.
An attempt is also made to understand the impact of policy changes,
inter alia, on the observed movements of CU. The economic CU, defined
as the realization of output at which the short run average total cost is
minimized, is estimated using a translog cost function. We observe
cyclical movements in CU over the period. Three distinct phases have
been identified with regard to the movements in CU. While phase one
(1974-1984) is characterized by relatively wide fluctuations, phase two
(1985-1990) witnessed a roughly stable level of utilization. In the third
phase (1991-1998), a variant of the fluctuations witnessed in the first
phase is seen to have resurfaced. Interestingly, there has not been any
significant correspondence between the observed phases of CU with the
corresponding policy environment. While supply and demand side factors
are significant in determining CU in Indian manufacturing, the impact
of economic reforms per se is not remarkable.
Key words: India, Manufacturing, Capacity Utilization, Economicreforms
JEL Classifications: D24, L5, L60, O47
5
I. INTRODUCTION
The industrial sector in India has been undergoing significant
changes both in its structure and pattern owing to the policy changes
since the first industrial policy resolution of 1948 onwards. In pursuit of
building an industrial base for the country, the policy makers advocated
a series of guidelines characterized by pervasive licensing, reservation
of key areas for public sector, inward oriented trade policy, control over
large domestic firms, foreign direct investment, technology transfer and
interventions in factor market. However, there emerged a view that the
restrictive industrial policy regime, which roughly prevailed till 1985,
created a high-cost industrial structure characterized by technological
obsolescence, low rates of productivity, capacity utilization (CU) and
growth. As the rough nature of this complex control system became
more and more obvious, there emerged consensus over the need for a re-
orientation in planning. The increasing skepticism over the success of
the import-substituting regime in the country (see Bhagwati and Desai,
1970, Little et al, 1970) resulted in a shift in the policy thinking towards
a more liberal policy regime, based on the grounds of achieving
efficiency and competitiveness. This resulted in a shift in the policy
sphere since the late seventies1 , nevertheless, it witnessed further
1 In the second half of the 1970s the government started relaxing the foreigntrade regime and a number of imported items were placed on the opengeneral license list.
6
significant changes in its direction during the 1980s.2 However, the key
role played by the state in allocating resources remained decisive. The
shift in the policy paradigm got further stimulus in 1991 with the
introduction of new economic and industrial policies, where the market
is allowed to play a decisive role.
These major changes in the policy regimes created debates among
economists regarding the impact of the liberal policy environment on
industrial performance in India. We, in this paper examine the
performance of Indian manufacturing sector in terms of Capacity
Utilization (CU), over 1974-98, a reasonable number of years that cover
the highly restricted, the partially liberalized and the fully liberalized
regimes. The study differs from earlier studies on two grounds. Firstly,
we estimate economic capacity utilization for the Indian manufacturing
sector using a theoretically pertinent methodology. Secondly we make
an attempt to understand the impact of policy changes, inter alia, on the
movements of CU.
The rest of the paper is organized as follows. A brief discussion on
the relationship between economic reforms and capacity utilization is
provided in the next section. The third section briefly reviews some of
the recent studies on capacity utilization in Indian industry. Section
four discusses the concept of economic capacity utilization and the
methodology employed for estimating it. The fifth section explains the
data and variables and the sixth section discusses the empirical results.
Section seven examines the relationship between selected factors and
CU. And the final section concludes the paper.
2 For a discussion of the reforms in 1985 see Khullar (1991), and World Bank(1989). Following the major changes in the policy environment, the turnaround in output growth during the eighties is often attributed to the changesin policy regime (Ahluwalia, 1985 and 1987).
7
II. ECONOMIC REFORMS AND CU: THE ANALYTICALUNDERPINNINGS
The shift towards a liberal industrial policy paradigm during the
late eighties and early nineties is justified by a number of arguments,
both theoretical and empirical.3 The micro economic arguments for a
more liberal policy atmosphere stem from the potential gains accruing
from increased competition and exploitation of scale economies. Then
there are the macro economic arguments that link appropriate exchange
rate policies with the exploitation of scale economies through increased
exports, and with better capacity utilization (Srivastava, 1996). Industrial
efficiency may be achieved through import liberalization by exposing
domestic producers to greater competition, internal and external, and
by improving access to imported intermediate inputs and capital goods.
It is argued that the regulation regime, giving protection to any domestic
producer of an import substitute, regardless of cost, efficiency and
comparative advantage, clearly created a climate for the existence of
excess capacity4 in the sense that costs could be well above the
technological minimum. By reducing the rate of export growth, the
policy also affected CU with a low growth of export demand.5 Further
the policy of issuing import license based on the installed capacity
3 See Bhagwati and Srinivasan (1975), Bhagwati and Desai (1970), Ahluwalia(1991) and Srivastava (1996).
4 It is argued that the restrictive import policy, if maintained for a number ofyears the artificially created high levels of profitability could lead to overinvestment in the industry resulting in a general fall in productivity andcapacity utilization. See Winston (1974)
5 The central idea of the argument that more exports would increase aggregateoutput rests on the idea that domestic resources are under utilized. If allresources were fully utilized, any increase in one component of demandwould necessarily lead to a fall in another.

8
induced firms to expand their capacity in order to get more licenses.6
The controlled regime also allowed firms to maintain their monopoly
power by shielding them from competition, both domestic and external,
and thus making them to operate at high levels of profit even with
excess capacity. As regards capacity utilization, apart from operating in
a protected domestic market, highly subsidized inputs and controlled
output prices further enable firms to make profits even at lower levels of
utilization. Thus, it is viewed, that the limited threat of domestic entry
and virtual absence of foreign competition allowed the existence of
excess capacity in the Industrial sector in India.
These arguments, prima facia, bring the notion that a more liberal
policy atmosphere will lead to better capacity utilization. With regard
to the external oriented policy measures, however, one may have views
to the contrary which undermine any strong relationship between the
policy environment and the CU. This is because the direction of change
in CU, as a result of a policy change in the direction of more external
orientation, is ambiguous, from the theoretical point of view. Variations
in CU are the systematic outcome of the rational optimization procedure
of firms depending on input availability and market situations. Persistent
under-utilization of optimal capacity, therefore, appears to be puzzling
in view of the fact that firms are expected to optimize through their
decisions on capacity creation and utilization. In a liberalized regime,
as the domestic market is more integrated with the international market
and the demand fluctuations are likely to be more pronounced, there is
6 Bhagwati and Desai (1970) argues that since Actual User licenses (importlicenses) were allotted equitably on the basis of existing capacity there wereincentives for expanding capacity so as to have access to more imports.Bhagwati and Srinivasan (1975) further argues that the system of importlicensing might have led to the excessive holding of inventories ofintermediates and raw materials by Indian firms.
9
likely to be more fluctuating movements in utilization. In such a context,
the relationship between liberal economic reforms and the CU depends
on the effectiveness of policy changes in relaxing both supply and
demand bottlenecks. However, firms may still keep idle capacity even
in a more competitive market condition, for different set of reasons. The
recent theoretical works in industrial organization allude to the
possibility that excess capacity may be used as a strategy for deterring
entry, as firms have to assure their survival in the market. Spence (1977)
observes that ‘competitive profit maximizing’ firms can carry excess
capacity to deter a vigorous threat of entry.7 Bulow et al (1985) further
confirm this argument. The basic entry deterrence argument is that excess
capacity enables incumbents to threaten to expand output and cut prices
following entry thereby making entry unprofitable. However, in India
the existence of excess capacity did not deter entry in the earlier regime,
as the protected environment offered adequate profit opportunities for
those who could obtain a license to enter (Bhagwati and Srinivasan,
1975); the entry was rather barred by the licensing policy. But in the
changed policy environment one may not reject the possibility of firms
investing in excess capacity for both strategic and non-strategic reasons.8
7 …Under incomplete markets, fixed cost must be covered if firms are tosurvive. Hence prices must exceed marginal cost, as different from theperfect situations, by a mark-up sufficient to cover fixed charges. This leadsto average cost pricing hence downward price rigidities in the face of excesscapacities. When a price is down ward rigid, quantity constraints comes intoration excess supply-capacities are unutilized (Dreze, 1999).
8 Profit maximizing firms hold non-strategic excess capacity in markets wheredemand is cyclical or stochastic, or where plants are inherently lumpy orsubject to economies of scale. Strategic excess capacity may be built eitherto deter new entry or to pre-empt existing rivals (Liberman, 1987).
10
III. CU IN INDIA: A BRIEF REVIEW OF LITERATURE
While most recent studies examining the industrial performance
in India after policy reforms focused on the analysis of total factor
productivity growth, diminutive attention was given to capacity
utilization. It may be noted that even the analysis of total factor
productivity would be more meaningful if adjustment is made for
fluctuations in capacity utilization9. In view of the overriding importance
of capacity utilization in the overall resource-use efficiency of the
economy, however, a few researchers have tried to examine the trends
and determinants of capacity utilization in Indian industry. In line with
the earlier attempts10, recent studies (Ajit, 1993, Burange, 1992) also
show the existence of excess capacity in the industrial sector. Studies
that examined the determinants of CU found that most of the industries
are demand constrained (Goldar and Renganathan, 1991, Srinivasan,
1992). Also there are a few studies that correlate utilization with public
investment in infrastructure, capital and intermediary imports and the
adoption of liberal policy (Seth, 1998). An examination of the literature
reveals, however, that most studies have used conventional measures in
measuring CU, and have paid insufficient attention to the possible
theoretical problems. Since most of them followed the conventional
engineering (installed capacity) and Wharton approaches, the principal
problem underlying the interpretation of most of the existing studies is
the weak link between the underlying economic theory and the used
measures of CU; a theoretical investigation into the problem is hard to
find.
9 Hulten (1986), Morrison (1986) and Berndt and Fuss (1986) discuss theimportance of adjusting total factor productivity measures by properlymeasured capacity utilization ratios.
10. Azeez (1999) provides a review of these studies.
11
It has long been recognized in the literature that the engineering
approach is deficient, in the sense that it is not based on any explicit
theoretical foundation.11 The economic capacity of a given stock of
capital will vary with the relative price changes, resulting in a change in
the optimum combination of capital and other variable inputs. Therefore,
the role of non-capital input in deciding potential is crucial. In India
engineering CU figures are mainly based on the installed capacity data
collected from firms and published by different agencies like DGTD.
The data that many studies used for this purpose are quite unsatisfactory
in that they compound inevitable conceptual difficulties with several
statistical drawbacks (Bhagwati and Srinivasan, 1975).12 Additionally,
these figures give highly exaggerated picture of actual capacity, mainly
due to policy reasons and reporting errors.13 The definition of installed
capacity differs from firm to firm, there is no uniform way to define it
and it is not clear how firms respond to the question of their capacity.
Many of the firms report capacity based on a single shift operation,
which is not the case in practice. This creates ambiguity in explaining
the results also. Moreover, as the economy moved from a system of
licensing and strict control on production to a system of capacity increase
endorsements and then further to broad-banding and then finally to de-
licensing, the importance of the installed capacity figure to the
government agencies (such as DGTD) has declined substantially.
11 The pioneering contribution by Berndt and Morrison (1981) has clearlypointed out the importance of applying economic theory in estimating CU.
12 For details on the inadequacies of these data, see Bhagwati and Srinivasan(1975) and Slocum (1970).
13 Firms used to report an exaggerated picture of their actual capacity in orderto obtain more import licenses.
12
The Wharton indices are also questioned on many theoretical
grounds.14 In this method, one first identifies the major peaks in a
seasonally adjusted output series, assuming that the major peaks represent
output where resources are utilized at full capacity. Joining these major
peaks by linear interpolation, potential output is estimated for non-
peak years. It is unrealistic to assume that each major peak represents
the same intensity of resource utilization. Assuming a constant
arithmetic growth rate of potential output between peaks is also not
justifiable.
It is, thus, observed that the earlier studies on capacity
utilization has left unaddressed several theoretical and data problems
in measuring CU. This motivates us to have an inquiry into the
economic capacity utilization in Indian manufacturing using a more
reliable database and also to examine how CU is affected inter alia
by policy changes.
IV ECONOMIC CAPACITY UTILIZATION: CONCEPT ANDMEASUREMENT
Capacity utilization has been extensively used in the literature as
an indicator of industrial performance as it pictures both the use of
scarce resources as well as the state of demand. It has been defined as the
ratio of actual output to capacity or potential output; it captures the
output gap between actual output and capacity output. While potential
output can broadly be defined as the maximum possible output given
the level of inputs and technology, there is little consensus on its
measurement. Economists recognize that such a level of output "is
conditioned in most cases by economic circumstances and must be
14 A detailed review of different measures of capacity utilization and associatedproblems is seen in Christiano (1981).

13
interpreted as being the 'optimum output' from the economic point of
view". Cassel (1937) and Hickman (1964) define it as the output (Y*) at
which the short run average total cost curve reaches its minimum; a
measure of potential output given a firm's short-run stock of capital and
perhaps other fixed inputs in the short run (Nelson, 1989).15 We follow
this definition of economic capacity.
Consider a firm with a well-behaved production function
Y= f (L, F, M, K, T) (1)
where Y is the level of output, L, F, M and K are the inputs of labor,
fuel, material and capital respectively. T is the time trend to represent
the disembodied technical change. Let the capital stock be a quasi-
fixed input.16 Then the optimization problem is to maximize variable
profits, i.e revenue minus variable costs, conditional on output price P,
prices of variable input prices Pi, and fixed input K (Lau, 1976). Following
the theory of duality the optimization problem may be reformulated as
that of minimizing variable cost (Berndt and Morrison, 1981) conditional
on Y, Pi, K and T. Then we have a dual variable cost function.
VC = f(Y,Pi,K,T) (2)
Where VC is the total variable cost and Pi represents the vector of
variable input prices. Estimation of optimal or potential output from the
above-specified cost function requires a suitable functional form.
15 Changes in such economic variables as input prices, and the short-runfixity of certain factors (such as capital) may influence capacity outputdefined by the economic approach (Morrison, 1985). In other words, thepotential may be defined as the maximum output that can be produced withexisting plant and equipment, provided that the availability of variablefactors of production is not restricted.
16 Since capacity output is inherently a short run notion, it is necessary that themodeling framework incorporates the short run constraints facing the firms(Berndt and Hesse, 1986)
14
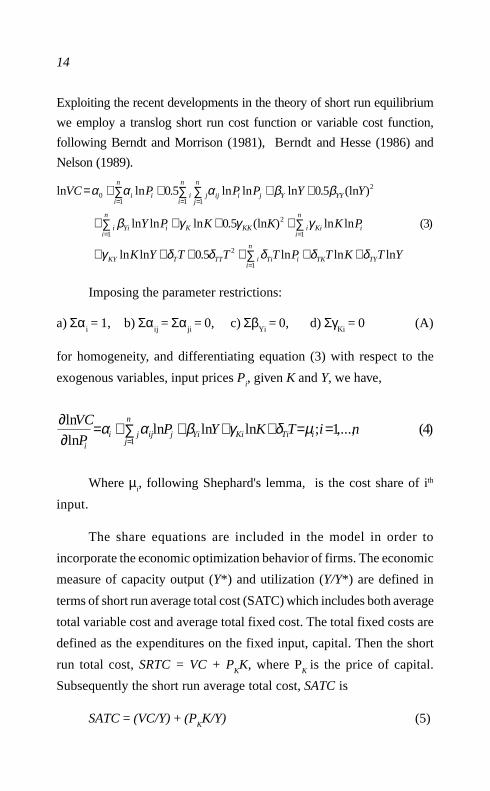
Exploiting the recent developments in the theory of short run equilibrium
we employ a translog short run cost function or variable cost function,
following Berndt and Morrison (1981), Berndt and Hesse (1986) and
Nelson (1989).
Imposing the parameter restrictions:
a) Σαi = 1, b) Σα
ij = Σα
ji = 0, c) Σβ
Yi = 0, d) Σγ
Ki = 0 (A)
for homogeneity, and differentiating equation (3) with respect to the
exogenous variables, input prices Pi, given K and Y, we have,
Where µi, following Shephard's lemma, is the cost share of ith
input.
The share equations are included in the model in order to
incorporate the economic optimization behavior of firms. The economic
measure of capacity output (Y*) and utilization (Y/Y*) are defined in
terms of short run average total cost (SATC) which includes both average
total variable cost and average total fixed cost. The total fixed costs are
defined as the expenditures on the fixed input, capital. Then the short
run total cost, SRTC = VC + PKK, where P
K is the price of capital.
Subsequently the short run average total cost, SATC is
SATC = (VC/Y) + (PKK/Y) (5)
)4(,...,1;lnlnlnln
ln1
niTKYPP
VCiTiKi
n
jYijijji
i
==++∑ ++=∂∂
=µδγβαα
∑ ++++++
∑ ∑++++
∑ ++∑+∑+=
=
= =
= ==
n
iTYTKiTiiTTTKY
iKi
n
i
n
iiKKKiYii
n
iYYYjiij
n
jji
n
iii
YTKTPTTTYK
PKKKPY
YYPPPVC
1
2
1 1
2
1
2
110
lnlnln5.0lnln
)3(lnln)(ln5.0lnlnln
)(ln5.0lnlnln5.0lnln
δδδδδγ
γγγβ
ββααα

15
Now if the potential output Y = Y* is defined at the point where
SATC is minimized, then (∂∂∂∂∂SATC/∂∂∂∂∂Y*) = 0, which in terms of (5) implies
that
(1/Y*)(∂VC/∂ Y*) - (VC/Y*2) - (Pk K/Y*2) = 0 (6)
Since ∂∂∂∂∂lnVC/∂∂∂∂∂lnY* = (∂∂∂∂∂VC/∂∂∂∂∂Y*)(Y* /VC), the required estimate of
∂∂∂∂∂VC/∂∂∂∂∂Y* is (∂∂∂∂∂ln VC/∂∂∂∂∂ln Y*)(VC/Y*), where
Substituting (7) in (6), we have
(8)
Where µy and VC are functions of both ln Y* and Y* and
therefore, it is not possible to obtain an analytical or closed model
solution for Y* in (8). Instead, numerical or iterative computational
procedure must be employed. Then the estimate of CU will be the
ratio of Y to Y*.
V. DATA AND VARIABLES
The study covers the organized segment of the manufacturing
sector in India at the aggregate level, which includes 18 two-digit
industries, for the period 1974-98. The selection of time period is largely
guided by the availability of data as well as the policy changes occurred
during this period. The data on output, capital, labor, fuel and materials
required for the analysis are taken from various issues of the Annual
Survey of Industries (ASI) published by the Central Statistical
Organization. The variables are constructed as follows.
0 = KP - 1)-( VC = Y
SATCKY*
µ∂
∂
)7(lnlnlnln
ln1
** YTiKiiYi
n
iiYYY TKPY
Y
VC µδγβββ =++∑++=∂∂
=

16
Output is defined as gross value of output deflated by the wholesale
price index (WPI) of manufactured products (1981-2=100). For the
construction of a series on capital stock the perpetual inventory method
is followed. Using the gross net ratio provided in Hashim and Dadi
(1973), we construct a benchmark year capital stock for 1960. Then a
perpetual inventory component is added to this benchmark year estimate
in order to obtain the consistent series of capital stock for the subsequent
years. 17 Total cost is defined as the sum of compensation to labor, fuel,
material and capital inputs. Capital cost is defined as the gross operating
surplus after adjusting for emoluments.18 The value of total emoluments
is considered as the labor cost and the total emoluments divided by
number of employees as the wage rate. For the price of fuel, we construct
a composite price index by combining price indices of different
components of total fuel consumed by the manufacturing sector. The
input components are classified according to the availability of WPI
and are then clubbed to a single price using appropriate weights. The
weights are calculated from the Input Output Transaction Matrix, 1989-
90. The value of total fuel consumed, as per ASI definition, is taken as
the fuel cost. The value of total purchase of materials is used as the cost
of materials. For constructing the price of material we follow the same
procedure as in the case of fuel.
17 Azeez (1999) discusses the capital stock estimation procedure in detail.
18 It may be noted here that sum of labor and capital cost is identically equalto gross value added at factor cost (Berndt and Hesse, 1986). However, ahigh gross operating surplus does not make it less profitable to employmore capital. There exists some skepticism on whether the capital cost issufficiently exogenous or not, however, the absence of any other betterdata makes us to rely on this. I am grateful to Prof. J.S Cubbin for makingme aware of this problem, while reading through the discussion on data andvariables in Azeez (2001).

17
VI. EMPIRICAL RESULTS
We estimate the equations (3) and (4) simultaneously, subject to
the parameter restrictions (A). Since ∑µ i=1,19 we estimate the model
after dropping the labor share equation (by normalizing all the prices
and variable cost). For estimation we follow an iterative version of the
Zellner's Seemingly Unrelated Regression Estimation (SURE)
technique20, which are equivalent to maximum likelihood estimates, in
order to ensure invariance with respect to the choice of which share
Table 1: SURE Estimates of Translog Cost Function
Parameters Estimates Parameters Estimates
α0
0.009 (0.023) γKF
0.153 (0.031)
αF
0.056 (0.004) γKM
-0.348 (0.047)
αM
0.801 (0.007) γKY
-2.636 (0.459)
αFF
0.060 (0.006) δT
0.020 (0.019)
αMM
0.109 (0.006) δTT
-0.009 (0.008)
αFM
-0.076 (0.005) δTF
-0.010 (0.003)
βY
0.417 (0.105) δTM
0.024 (0.004)
βYY
8.757 (0.441) δTK
0.565 (0.096)
βYF
-0.026 (0.022) δTY
-0.431 (0.041)
βYM
0.069 (0.038) DW (VC) 1.73
γK
0.425 (0.251) DW (µF) 1.60
γKK
-5.796 (1.317) DW (µM) 1.37
Log likelihood 318.4
Note: standard errors are given in parentheses.DW = Durbin Watson statistic
19 The input shares in variable cost must sum to unity, by definition. This willgive a singular disturbance covariance matrix
20 Kmenta et al. (1968) has shown that iteration of the Zellner estimationprocedure until convergence results in maximum-likelihood estimates andis a computationally efficient method.

18
equation we drop. The estimated SURE coefficients together with their
test statistics and the maximized value of log likelihood are recorded in
table 1. The fit is generally good for the variable cost equation and fuel
share equation, though not quite good for the material share equation
(the R-square values are 0.97, 0.72 and 0.09 respectively for the variable
cost function, share equations of fuel and of materials). The Chi-square
value (1606.7) produced by the Wald test (for testing the validity of
imposed restrictions) and insignificant auto correlation exhibits the
robustness of the model. However, the estimated cost function is well
behaved only if it is concave in input prices and its input share functions
are positive. It is found that the estimated variable cost shares are positive
at all observations and the Hessian matrix based on the parameter
estimates are negative semi-definite, thereby satisfying the first and
second order conditions.
The estimated parameters and the time series data are employed
with (8) to calculate the potential output (Y*), the output where the
short run average total cost is minimized, which is used to estimate
economic CU. As a closed form solution is not possible for (8) a numerical
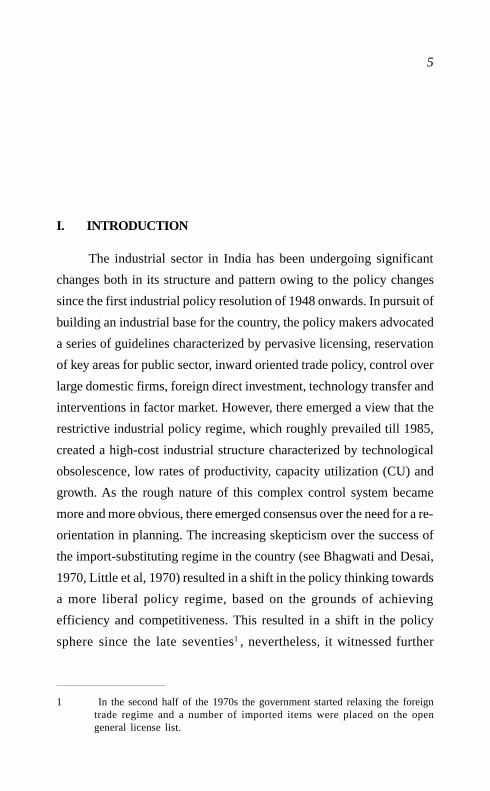
iterative technique is followed. The ensuing estimates of CU ratios,
Figure 1Economic and Installed Capacity Utilization in Indian Manufacturing
0.500
0.600
0.700
0.800
0.900
1.000
1.100
19
73
-41
97
4-5
19
75
-61
97
6-7
19
77
-81
97
8-9
19
79
-80
19
80
-11
98
1-2
19
82
-31
98
3-4
19
84
-51
98
5-6
19
86
-71
98
7-8
19
88
-91
98
9-9
01
99
0-1
19
91
-21
99
2-3
19
93
-41
99
4-5
19
95
-61
99
6-7
19
97
-8
Installed CU
Economic CU
19
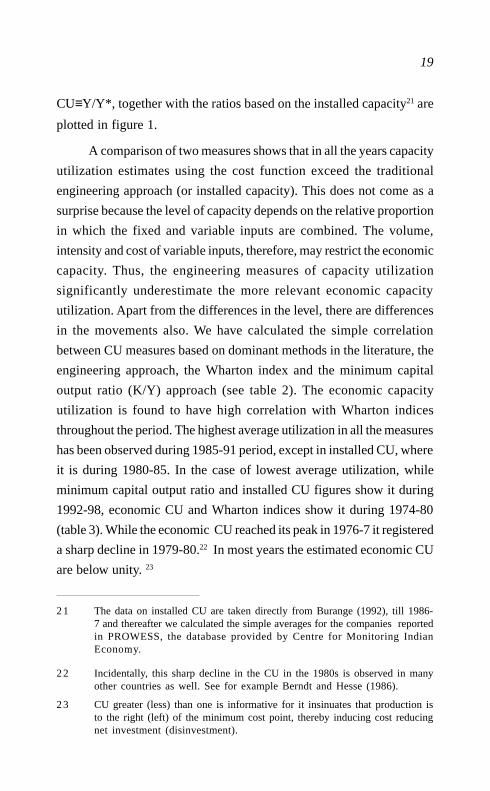
CU≡Y/Y*, together with the ratios based on the installed capacity21 are
plotted in figure 1.
A comparison of two measures shows that in all the years capacity
utilization estimates using the cost function exceed the traditional
engineering approach (or installed capacity). This does not come as a
surprise because the level of capacity depends on the relative proportion
in which the fixed and variable inputs are combined. The volume,
intensity and cost of variable inputs, therefore, may restrict the economic
capacity. Thus, the engineering measures of capacity utilization
significantly underestimate the more relevant economic capacity
utilization. Apart from the differences in the level, there are differences
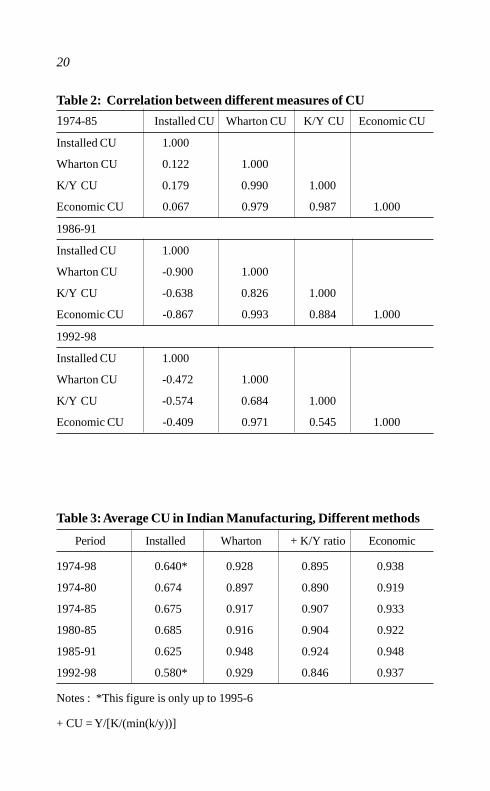
in the movements also. We have calculated the simple correlation
between CU measures based on dominant methods in the literature, the
engineering approach, the Wharton index and the minimum capital
output ratio (K/Y) approach (see table 2). The economic capacity
utilization is found to have high correlation with Wharton indices
throughout the period. The highest average utilization in all the measures
has been observed during 1985-91 period, except in installed CU, where
it is during 1980-85. In the case of lowest average utilization, while
minimum capital output ratio and installed CU figures show it during
1992-98, economic CU and Wharton indices show it during 1974-80
(table 3). While the economic CU reached its peak in 1976-7 it registered
a sharp decline in 1979-80.22 In most years the estimated economic CU
are below unity. 23
21 The data on installed CU are taken directly from Burange (1992), till 1986-7 and thereafter we calculated the simple averages for the companies reportedin PROWESS, the database provided by Centre for Monitoring IndianEconomy.
22 Incidentally, this sharp decline in the CU in the 1980s is observed in manyother countries as well. See for example Berndt and Hesse (1986).
23 CU greater (less) than one is informative for it insinuates that production isto the right (left) of the minimum cost point, thereby inducing cost reducingnet investment (disinvestment).
20
Table 2: Correlation between different measures of CU
1974-85 Installed CU Wharton CU K/Y CU Economic CU
Installed CU 1.000
Wharton CU 0.122 1.000
K/Y CU 0.179 0.990 1.000
Economic CU 0.067 0.979 0.987 1.000
1986-91
Installed CU 1.000
Wharton CU -0.900 1.000
K/Y CU -0.638 0.826 1.000
Economic CU -0.867 0.993 0.884 1.000
1992-98
Installed CU 1.000
Wharton CU -0.472 1.000
K/Y CU -0.574 0.684 1.000
Economic CU -0.409 0.971 0.545 1.000
Table 3: Average CU in Indian Manufacturing, Different methods
Period Installed Wharton + K/Y ratio Economic
1974-98 0.640* 0.928 0.895 0.938
1974-80 0.674 0.897 0.890 0.919
1974-85 0.675 0.917 0.907 0.933
1980-85 0.685 0.916 0.904 0.922
1985-91 0.625 0.948 0.924 0.948
1992-98 0.580* 0.929 0.846 0.937
Notes : *This figure is only up to 1995-6
+ CU = Y/[K/(min(k/y))]

21
Over the period as a whole, both potential and actual output grew
at a similar rate say around 7.3 percent. However, the expansion of
potential shows a significant acceleration. It is also observed, while
looking at the growth rates of inputs that the non-accelerating output
growth has been mainly due to the intensive use of capital input. Whereas
the growth rate of capital input is significant and accelerating, the growth
of employment is very negligible (see table 4). The significant growth of
capacity output, therefore, may be attributed to the accelerating growth of
additional investment in the sector.
Table 4: Growth of inputs and output, Aggregate Manufacturing,
1974-98
Output 7.39
NVA* 6.79
Fixed Capital* 8.75
Capital Stock* 7.65
Investment* 7.67
Employment 1.55
Fuel 6.43
Material 6.49
Potential Output* 7.28
Notes: Growth rates are estimated from ASI data using an exponential fit.All are significant at 1 % level.Variables with * mark show a significant acceleration in their growth
rates.
CU in Indian Manufacturing: Analyzing the trends
From the Figure 1, we also observe three distinct phases in the
movements of economic CU. Phase one, from 1973-4 to 1983-4, is
characterized by relatively wide fluctuations. In phase two, covering
the period 1983-4 to 1989-90, CU is roughly stable with very little

22
fluctuations. In the final phase, 1990-1 to 1997-8, CU shows a fluctuating
tendency.
To examine phase one, CU shows an increasing trend from 1973-
4 to 1977-8, following an increase in the domestic demand due to an
increase in the national income. The gross domestic expenditure during
this period registered an average growth rate of 4.8 per cent per annum.
After the peak growth of CU in 1977-8, it shows a declining trend in
1978-9 and 1979-80 following a slump in the demand for which already
different explanations have been provided in the literature. 24 This
together with the impact of second and third oil shocks might have
resulted in a drop in utilization. The period 1980-83 clearly marked a
significant recovery in utilization. This was also the period in which the
highly debated turn around in Indian industry occurred. 25 In addition
to the revival in agricultural production, the policy reforms during this
period that regularized the excess plant capacity might also have helped
improve the CU.
The beginning of second phase coincides with the partial
liberalization of the mid eighties. The period witnessed the gradual
replacement of the protected regime with ambitious schemes for
modernization and capacity rejuvenation. The industrial licensing was
further liberalized in 1987-8. To encourage production and to provide
flexibility to manufacturers to adjust their product mix to market demand,
the concept of broad banding was introduced. However, CU remained
almost stable, except for a slight improvement after 1988.
24 It is identified that this was a period of stagnant demand for manufacturedproducts (Krishnaji, 1984), and decline in agricultural real wages (Anandraj,1996) resulting a reduction in the demand for industrial products from theagricultural sector.
25 See Ahluwalia (1985)

23
During the third phase beginning the early nineties, CU figures
show a slightly declining trend in the first half and thereafter an increase,
though it came down again in the end-years. One of the arguments for
liberalizing the industrial sector was that a more open economy provides
the impetus for stimulating capacity utilization. It is worth mentioning
here that the process of liberalization and macro economic stabilization
is observed to involve a large decline in output in the early stages of
transition. Further a considerable under-utilization of capacity may
also be expected in the early stages of transition. 26 Our results indicate
that the adoption of liberal economic policies have caused fluctuations
in capacity utilization. This may be attributed to the increased role of
market forces in an open economy, which triggers the demand
fluctuations and the corresponding expectations which may force firms
to keep part of capacity idle in order to meet future demand exigencies.
It, however, requires a more rigorous analysis incorporating the
anticipatory expectations (Morrison, 1985) and market imperfections,
to arrive at firm conclusions, which is beyond the scope of present
study.
VII. FACTORS AFFECTING CU
It may be noted that the observed variations in CU over the years
are in consonance with the ups and downs in the growth of the economy.
It is seen that the variation in the level of gross domestic product (GDP)
and the level of output in the manufacturing sector have also been
relatively high during the first and third phases (Table 5) compared to
that of second phase. For a rigorous understanding, we have carried out
a simple regression analysis, where we regress capacity utilization on
the growth of GDP and two dummy variables to capture the effect of
26 See Hernandez Cata (1997).

24
macro policy changes. The first dummy takes the value one for post
1985 period and zero otherwise, and the second one takes the value one
for post 1991 period and zero otherwise. Interestingly these results are
in concurrence with our observations.27 While GDP, a proxy for the
demand, has shown a positive and significant impact on CU, both dummy
variables show no significant impact on CU. Thus the principal
observation from the above analysis is that the sector witnessed a cyclical
movement in the capacity utilization, which is in concurrence with the
growth of the economy. This cyclicality has been observed regardless of
the changes in policy sphere, implying that CU does not show any
significant response to the policy changes.
Table 5: Variation in CU, Output and Gross Domestic Product
Year CU Output GDP
1974-84 6.53 24.91 13.42
1985-90 2.62 15.48 11.41
1991-98 4.00 20.38 14.93
Note: Figures are coefficient of variation
Input Prices and CU
The framework we followed permits us to calculate the effects of
input price changes on potential output and capacity utilization. The
effect of variations in input prices on Y* and CU depends on the
substitutability/complementarity of variable inputs with capital (Berndt
and Morrison, 1981). If the variable input and capital are Hicks-Allen
27 The regression result is ln CU= -0.09338 + 0.6337(ln GDP
t - lnGDP
t-1) +-0.00522D1 - 0.0124D2
(-3.57) (1.75) (0.235) (-0.720)
R2=0.18, and t ratios in parenthesis.
25
substitutes (complements), then the predominant effect of an increase in
variable input price is to decrease (increase) Y*; if however, they are
independent inputs, the variations in input prices do not affect Y*.
Therefore, an important way of evaluating the effect of input prices on
Y* and CU is to calculate the elasticity of optimal output with respect to
input prices, i.e. eyi
= ∂∂∂∂∂ lnY*/ ∂∂∂∂∂lnPi. Following the approaches suggested
by Brown and Christensen (1981) and Berndt and Hesse (1986), we
calculate the elasticities in the following way.
We have at the minimum point of the SATC,
SATC = VC/Y* + PK .K/Y* = f (Y*, P
i, K, T)
And equation (8)
∂∂∂∂∂SATC/ ∂∂∂∂∂Y* =∂∂∂∂∂ f/ ∂∂∂∂∂Y*, =VC (µy-1)-PKK = 0 = f
y
Taking the total differential of fy
.,;**
0 MandFLidTT
fdK
K
fdP
P
fdY
Y
fdf yy
ii
i
yyy =
∂∂
+∂∂
+∂∂
+∂∂
== ∑
(9)
Setting dK=dT=dPj (i≠j) = 0 and dividing both sides of the
equation by dPi, we get
Then
(10)
Now following equation (8), ∂∂∂∂∂fy /∂∂∂∂∂P
i and ∂∂∂∂∂f
y /∂∂∂∂∂Y* for the translog
cost function may be derived as
0*
*=
∂∂
+∂∂
i
y
i
y
P
f
dP
dY
Y
f
*
*
Yf
Pf
P
Y
y
iy
i ∂∂∂∂−
=∂∂

26
∂fy/ ∂P
i = (µy-1)µi(VC/P
i) + (VC/P
i)β
yi
= (VC/Pi)[(µy-1)µ
i+ β
yi] (11)
∂fy/ ∂Y* = VC[β
yy(1/Y*)]+[( µ
y-1)µ
y(VC/Y*)]
= (VC/Y*)[βyy + (µ
y-1)µy]
Substituting (11) in (10) we have,
(12)
Potential output elasticity with respect to i th input is defined as eyi
= ∂lnY*/∂lnPi = (∂Y*/∂Pi) (P
i/Y*); for i =L, F and M, i.e.
The above result is important that it shows the substitutability/
complementarity between the variable inputs and capital i.e.
i
yi P
Ke
ln
ln
∂∂−=
For example, if the material inputs and capital are substitutes,
then eym
<0, i.e. increases in material prices, ceteris paribus, will reduce
the capacity output level. In other words, increases in PM would increase
the firm's long run optimal K/Y ratio from, say, K0/Y* to K
1/Y*, implying
a smaller Y* corresponding to the given level of capital K0. In such a
case, given current K, the larger long run (K/Y*) ratio can be preserved
by reducing current capacity output Y* by operating on a new SRAC
curve with minimum point to the left of the original minimum cost
output level. Hence in this case, given K and Y, increases in PM would
reduce Y* and therefore increase CU (Berndt and Hesse, 1986).
yy µ)1
−++−
−=
yyyy
yiiy
ii P
Y
dP
dY
µµββµµ)1(
)1(**
yyyy
iyyiyie
µµβµµβ
)1(
])1([
−+−+−
=

27
Table 6: Estimated Potential output Elasticities with respect to inputs
Year eyf
eym
eyl
1973-4 0.00290 –0.00969 0.00464
1979-80 0.00201 –0.02085 0.00323
1984-5 0.00220 –0.01718 0.00387
1989-90 0.00215 –0.01781 0.00399
1994-5 0.00198 –0.01912 0.00387
1997-8 0.00143 –0.02097 0.00361
0
0.2
0.4
0.6
0.8
1
Sha
re
19
73
-4
19
79
-80
19
84
-5
19
90
-1
19
97
-8
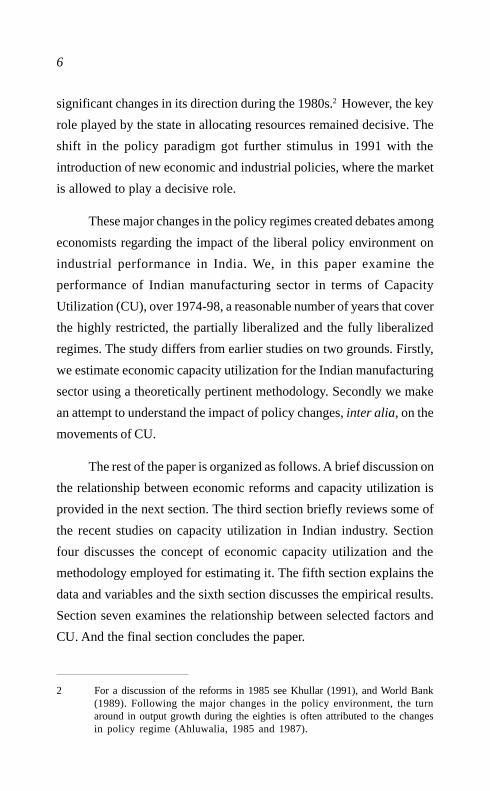
Figure 2Input shares in Variable cost
Share of Fuel Share of Material Share of Labour
The estimated elasticities are reported in table 6. The table brings
many issues of interest. It shows that the effect of increase in the price of
material is to reduce the potential output. But in the case of labor and
fuel the effect is positive. This may imply that the fuel and labor are
long run complements to the capital. The quantitative magnitude of the
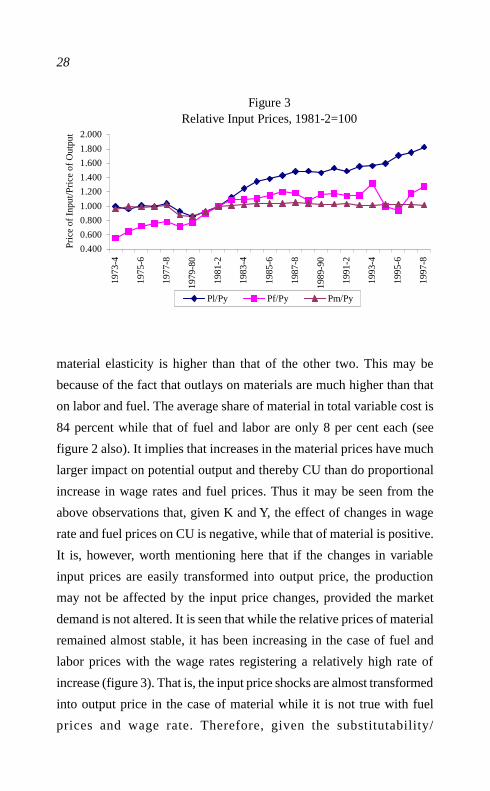
28
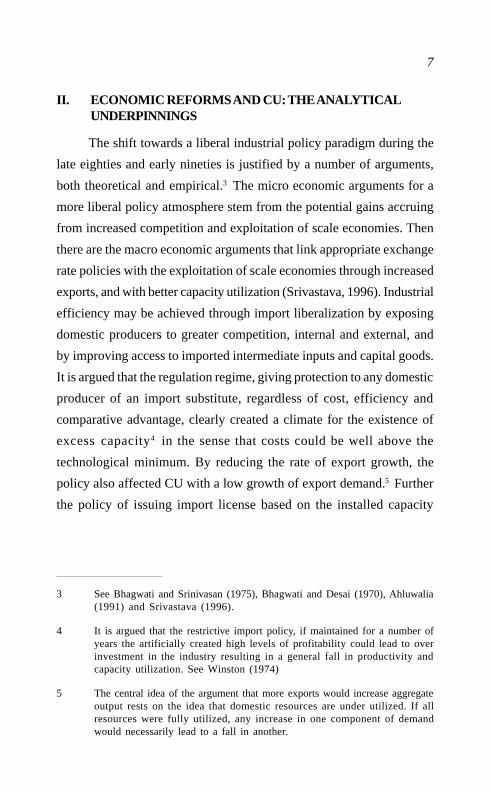
Figure 3Relative Input Prices, 1981-2=100
0.400
0.600
0.800
1.000
1.200
1.400
1.600
1.800
2.000
1973
-4
1975
-6
1977
-8
1979
-80
1981
-2
1983
-4
1985
-6
1987
-8
1989
-90
1991
-2
1993
-4
1995
-6
1997
-8
Pric
e of
Inpu
t/Pric
e of
Out
pu t
Pl/Py Pf/Py Pm/Py
material elasticity is higher than that of the other two. This may be
because of the fact that outlays on materials are much higher than that
on labor and fuel. The average share of material in total variable cost is
84 percent while that of fuel and labor are only 8 per cent each (see
figure 2 also). It implies that increases in the material prices have much
larger impact on potential output and thereby CU than do proportional
increase in wage rates and fuel prices. Thus it may be seen from the
above observations that, given K and Y, the effect of changes in wage
rate and fuel prices on CU is negative, while that of material is positive.
It is, however, worth mentioning here that if the changes in variable
input prices are easily transformed into output price, the production
may not be affected by the input price changes, provided the market
demand is not altered. It is seen that while the relative prices of material
remained almost stable, it has been increasing in the case of fuel and
labor prices with the wage rates registering a relatively high rate of
increase (figure 3). That is, the input price shocks are almost transformed
into output price in the case of material while it is not true with fuel
prices and wage rate. Therefore, given the substitutability/
29
complementarity relationship between variable inputs and capital, the
material price shocks are unlikely to have negative effect on CU, while
fuel and labor prices are likely to have a modest negative impact. Also
note that the quantitative magnitude of potential output elasticity with
respect to labor price is always higher than that of fuel price implying a
relatively larger effect of wage rates on CU.
The principal inference that may be drawn from the above exercise
is that CU is an outcome of firms’ optimization procedure depending
upon simultaneous factors. We observe, on top of the findings of earlier
studies, that along with demand side factors, supply side factors are also
important in deciding the movements of capacity utilization.
VIII. IN LIEU OF CONCLUSION
To summarize, we have examined the trends in and the factors
affecting economic capacity utilization (CU) in Indian manufacturing
sector over 1974-1998. The CU is estimated employing a translog
variable cost function, which is estimated along with the share equations,
using an iterative version of the Zellner’s Seemingly Unrelated
Regression Estimation (SURE) technique. The analysis reveals that the
conventional installed capacity utilization measures underestimate the
true economic utilization levels. Further, the Indian manufacturing sector
experienced a cyclical pattern of economic capacity utilization over
the period of study. It has also identified three distinct phases of
economic CU movements. While phase one (1974-1984) has marked
relatively wide fluctuations the phase two (1985-1990), shown more or
less a stable level of utilization. A mild variant of the fluctuations of the
sort witnessed in the first phase is seen to have resurfaced in the third
phase (1991-1998). Interestingly, there has not been any significant
correspondence between the observed phases of CU with the
corresponding policy environment. While phase one is characterized

30
by a restrictive policy regime, phase two and three are characterized by
partial and further liberalization policies. Thus, it can be said that the
initiation of liberalization, which roughly coincides with the second
and third phases, has shied to exert a favorable impact on CU though the
stimulation of CU has been one of the major grounds for introducing
liberal policy reforms in the nineties. Perhaps, this is not a surprising
outcome of liberalization. For, the economic theory mentions of different
possible reasons for keeping idle capacity in a competitive economy.
Therefore, it can be said in lieu of conclusion that the tendency to
attribute all economic outcomes in a period, which coincide with
economic reforms may not match with the empirical facts. The major
point emerging from the study is the significant role of supply side as
well as demand side factors in affecting the level of economic capacity
utilization. The impact of economic reforms per se is not significant
though the policy changes may influence supply and demand side factors
determining the level of economic capacity utilization.
E. Abdul Azeez is a Doctoral Student at the Centre for Development
Studies, Thiruvananthapuram. His main areas of research interests
are: Industrial Organisation and Economic Reforms and its Impact.
Email contact: [email protected] & [email protected]

31
References
Ahluwalia, I J (1985), Industrial Growth in India – Stagnation since the
Mid-Sixties, New Delhi, Oxford University Press.
Ahluwalia, I J (1987), “Role of Policy in Industrial Development”, in
Brahmananda, PR and VR Panchamukhi (ed), The Development
Process of the Indian Economy, Delhi, Himalaya Publishing
Company
Ahluwalia, I J (1991), Productivity Growth in Indian Manufacturing,New Delhi, Oxford University Press.
Ajit, D (1993), “Capacity Utilisation in Indian Industries”, Reserve Bank
of India, Occasional Papers, 14, (1), pp. 21-46.
Anandraj, R (1996), Indian Industrial Growth, Anatomy of the Planning
Regime, Unpublished Ph.D. thesis submitted to the Jawaharlal
Nehru University, New Delhi, Centre for Development Studies,
Trivandrum.
Azeez, E A (1999) “Trends and Determinants of Capacity Utilisation: A
Study of Indian Manufacturing under Liberalisation”,
Unpublished M.Phil Dissertation submitted to the Jawaharlal
Nehru University, New Delhi, Centre for Development Studies,
Trivandrum
Azeez, E A (2001), “Utilization of Optimal Capacity in Indian
Manufacturing, 1974-96”, Applied Economics Letters, 9 (8), pp.
623-28.
Berndt, E R and M A Fuss (1986), “Productivity Measurement with
Adjustments for Variations in Capacity Utilization and other forms
of Temporary Equilibrium”, Journal of Econometrics, 33 pp.7-29.
Berndt, E R and D M Hesse (1986), “Measuring and Assessing Capacity
Utilization in the Manufacturing Sectors of Nine OECDCountries”, European Economic Review, 30, pp. 961-89.

32
Berndt, E R and C J Morrison (1981), “Capacity Utilization Measures:Underlying Economic Theory and an Alternative Approach”,
American Economic Review, Papers and Proceedings, 71,
pp. 48-52.
Bhagwati, J N and T N Srinivasan (1975), Foreign Trade Regimes and
Economic Development in India, New York, Columbia UniversityPress.
Bhagwati, J N and P Desai (1970), India: Planning for Industrialisation,
London, Oxford University Press.
Brown R S and L R Christensen (1981), “Estimating Elasticities of
Substitution in a Model of Partial Static Equilibrium: AnApplication to US Agriculture, 1947-1974”, in Berndt and Field
(ed) Modeling and Measuring Natural Resource Substitution,
MIT press, Cambridge, MA,
Bulow J, Geanakoplos J and P Klemprer (1985), “Holding Idle Capacity
to Deter Entry”, The Economic Journal, 95, pp.178-82.
Burange, L G (1992), “The Trends in Capacity Utilisation in Indian
Manufacturing Sector”, Journal of Indian School of Political
Economy, July-Sept, pp. 445-55.
Cassel, J M (1937), “Excess Capacity and Monopolistic Competition”,
Quarterly Journal of Economics, 51, pp. 426-43.
Christiano, L J (1981), “A Survey of Measures of Capacity Utilization”,IMF Staff Papers, 28, pp. 144-99.
Dadi, M M, and S R Hashim (1973), Capital Output Rations in Indian
Manufacturing, 1946-64, M S University of Baroda.
Dixit, A (1980), “The Role of Investment in Entry-deterrence”, The
Economic Journal, 90, pp. 95-106.
Dreze, J H (1999), “On the Macroeconomics of Uncertainty and
Incomplete Markets”, Presidential Address for the Twelfth World

33
Congress of the International Economic Association, Buenos-
Aires, August 1999.
Goldar, B N, and V S Ranganathan (1991), “Capacity Utilisation in
Indian industries”, The Indian Economic Journal, 39 (2), pp. 82-90.
Government of India, Annual Survey of Industries, Various Issues, NewDelhi, Central Statistical Organisation, Ministry of Planning.
Government of India, Input Output Transaction Matrix, New Delhi,
Ministry of Planning.
Hernandez-Cata, E (1997), “Liberalization and Behavior of Output duringthe Transition from Plan to Market”, IMF Staff papers, 44 (4),
pp. 405-29.
Hickman, B G (1964), “On a new Method of Capacity Estimation”,Journal of American Statistical Association, 59, pp. 529-49.
Hulten C R (1986), “Productivity Change, Capacity Utilization, and the
Sources of Efficiency Growth”, Journal of Econometrics, 33, pp.31-50.
Khullar (1991), Economic Reforms in India, 1985-90: The Case of the
Elephant and Seven Blind Men, Boston University.
Kmenta, J. and Gilbert, R F (1968), “Small Sample Properties of
Alternative Estimators of Seemingly Unrelated Regressions”,Journal of American Statistical Association, 63, 1180-200.
Krishnaji, N (1984), “The Demand Constraint: A Note on the Role of
Food Grain Prices and Income Inequality”, Economic and
Political Weekly, August, pp. 1261-66
Lau, L J (1976), “A Characterization of the Normalized Restricted Profit
Function”, Journal of Economic Theory, 12, pp. 131-63.
Liberman, M B (1987), “Excess Capacity as a Barrier to Entry: An
Empirical Appraisal”, Journal of Industrial Economics, 35, pp.
607-627.
Little, I M D et al (1970), Industry and Trade in Some Developing
Countries: A Comparative Study, Oxford University Press, Oxford.
34
Morrison, C J (1986), “Productivity Measurement with Non-static
Expectations and Varying Capacity Utilization: An IntegratedApproach, Journal of Econometrics, 33, pp. 51-74
Morrison, C J (1985), "On the Economic Interpretation and Measurement
of Optimal Capacity Utilization with Anticipatory Expectation”,Review of Economic Studies, 52 (169), pp.295-310.
Nelson, R A (1989), “On the Measurement of Capacity Utilization”, The
Journal of Industrial Economics, 37, pp.273-86.
Seth, V K (1998), “Economic Reforms and Capacity Utilisation in IndianIndustry”, Productivity, 39 (3), pp.391-98.
Solocum, N (1970), Underutilised Industrial Capacity in India, New
Delhi, USAID.
Spence, A M (1977), “Entry, Capacity, Investment and Oligopolistic
Pricing”, The Bell Journal of Economics, 8, pp 534-44.
Srinivasan, P V (1992), “Excess Capacities in Indian Industries, Supplyor Demand Determined?” Economic and Political Weekly,
November 7, pp. 2437-41.
Srivastava, V (1996), Liberalisation Productivity and Competition: A
Panel Study of Indian Manufacturing, New Delhi, Oxford
University Press.
Varshist, D C (1984), “Substitution Possibilities and Price Sensitivity of
Energy Demand in Indian Manufacturing”, Indian Economic
Journal, 32, (1), 84-97.
Winston, G C (1974), “The Theory of Capital Utilization and Idleness”,
Journal of Economic Literature, 12, pp. 1301-20.
World Bank (1989), India: An Industrializing Economy in Transition,
Washington, World Bank.
Zellner, A (1962), “An Efficient Method of Estimating SeeminglyUnrelated Regression and Tests for Aggregation Bias”, Journal
of the American Statistical Association, 57, No 298, pp.348-68.
35
CENTRE FOR DEVELOPMENT STUDIES
LIST OF WORKING PAPERS
[New Series]
The Working Paper Series was initiated in 1971. A new series was
started in 1996 from WP. 270 onwards. Working papers beginning from
279 can now be downloaded from the Centre's website (www.cds.edu)
W.P. 270 ACHIN CHAKRABORTY On the Possibility of a Weighting Sys-tem for Functionings December 1996
W.P. 271 SRIJIT MISHRA Production and Grain Drain in two inland Re-gions of Orissa December 1996
W.P. 272 SUNIL MANI Divestment and Public Sector Enterprise Reforms,Indian Experience Since 1991 February 1997
W.P. 273 ROBERT E. EVENSON, K.J. JOSEPH Foreign Technology Li-censing in Indian Industry : An econometric analysis of the choice ofpartners, terms of contract and the effect on licensees’ performanceMarch 1997
W.P. 274 K. PUSHPANGADAN, G. MURUGAN User Financing & Collec-tive action: Relevance sustainable Rural water supply in India. March1997.
W.P. 275 G. OMKARNATH Capabilities and the process of DevelopmentMarch 1997
W. P. 276 V. SANTHAKUMAR Institutional Lock-in in Natural ResourceManagement: The Case of Water Resources in Kerala, April 1997.
W. P. 277 PRADEEP KUMAR PANDA Living Arrangements of the Elderlyin Rural Orissa, May 1997.
W. P. 278 PRADEEP KUMAR PANDA The Effects of Safe Drinking Waterand Sanitation on Diarrhoeal Diseases Among Children in RuralOrissa, May 1997.
W.P. 279 U.S. MISRA, MALA RAMANATHAN, S. IRUDAYA RAJANInduced Abortion Potential Among Indian Women, August 1997.

36
W.P. 280 PRADEEP KUMAR PANDA Female Headship, Poverty andChild Welfare : A Study of Rural Orissa, India, August 1997.
W.P. 281 SUNIL MANI Government Intervention in Industrial R & D, SomeLessons from the International Experience for India, August 1997.
W.P. 282 S. IRUDAYA RAJAN, K. C. ZACHARIAH Long Term Implica-tions of Low Fertility in Kerala, October 1997.
W.P. 283 INDRANI CHAKRABORTY Living Standard and EconomicGrowth: A fresh Look at the Relationship Through the Non- Paramet-ric Approach, October 1997.
W.P. 284 K. P. KANNAN Political Economy of Labour and Development inKerala, January 1998.
W.P. 285 V. SANTHAKUMAR Inefficiency and Institutional Issues in theProvision of Merit Goods, February 1998.
W.P. 286 ACHIN CHAKRABORTY The Irrelevance of Methodology andthe Art of the Possible : Reading Sen and Hirschman, February 1998.
W.P. 287 K. PUSHPANGADAN, G. MURUGAN Pricing with ChangingWelfare Criterion: An Application of Ramsey- Wilson Model to Ur-ban Water Supply, March 1998.
W.P. 288 S. SUDHA, S. IRUDAYA RAJAN Intensifying Masculinity of SexRatios in India : New Evidence 1981-1991, May 1998.
W.P. 289 JOHN KURIEN Small Scale Fisheries in the Context of Globalisation,October 1998.
W.P. 290 CHRISTOPHE Z. GUILMOTO, S. IRUDAYA RAJAN RegionalHeterogeneity and Fertility Behaviour in India, November 1998.
W.P. 291 P. K. MICHAEL THARAKAN Coffee, Tea or Pepper? FactorsAffecting Choice of Crops by Agro-Entrepreneurs in NineteenthCentury South-West India, November 1998
W.P. 292 PRADEEP KUMAR PANDA Poverty and young Women's Em-ployment: Linkages in Kerala, February, 1999.
W.P. 293 MRIDUL EAPEN Economic Diversification In Kerala : A SpatialAnalysis, April, 1999.
W.P. 294 K. P. KANNAN Poverty Alleviation as Advancing Basic HumanCapabilities: Kerala's Achievements Compared, May, 1999.
W.P. 295 N. SHANTA AND J. DENNIS RAJA KUMAR Corporate Statis-tics: The Missing Numbers, May, 1999.
W.P. 296 P.K. MICHAEL THARAKAN AND K. NAVANEETHAMPopulation Projection and Policy Implications for Education:ADiscussion with Reference to Kerala, July, 1999.
37
W.P. 297 K.C. ZACHARIAH, E. T. MATHEW, S. IRUDAYA RAJANImpact of Migration on Kerala's Economy and Society, July, 1999.
W.P. 298 D. NARAYANA, K. K. HARI KURUP, Decentralisation of theHealth Care Sector in Kerala : Some Issues, January, 2000.
W.P. 299 JOHN KURIEN Factoring Social and Cultural Dimensions intoFood and Livelihood Security Issues of Marine Fisheries; A CaseStudy of Kerala State, India, February, 2000.
W.P. 300 D. NARAYANA Banking Sector Reforms and the EmergingInequalities in Commercial Credit Deployment in India, March, 2000.
W.P. 301 P. L. BEENA An Analysis of Mergers in the Private CorporateSector in India, March, 2000.
W.P. 302 K. PUSHPANGADAN, G. MURUGAN, Gender Bias in aMarginalised Community: A Study of Fisherfolk in Coastal Kerala,May 2000.
W.P. 303 K. C. ZACHARIAH, E. T. MATHEW, S. IRUDAYA RAJAN ,Socio-Economic and Demographic Consequenes of Migration inKerala, May 2000.
W.P. 304 K. P. KANNAN, Food Security in a Regional Perspective; A Viewfrom 'Food Deficit' Kerala, July 2000.
W.P. 305 K. N. HARILAL, K.J. JOSEPH, Stagnation and Revival of KeralaEconomy: An Open Economy Perspective, August 2000.
W.P. 306 S. IRUDAYA RAJAN, Home Away From Home: A Survey of OldageHomes and inmates in Kerala, August 2000.
W.P. 307 K. NAVANEETHAM, A. DHARMALINGAM, Utilization ofMaternal Health Care Services in South India, October 2000.
W.P. 308 K. P. KANNAN, N . VIJAYAMOHANAN PILLAI, Plight of thePower Sector in India : SEBs and their Saga of Inefficiency November2000.
W.P. 309 V. SANTHAKUMAR AND ACHIN CHAKRABORTY,Environmental Valuation and its Implications on the Costs and Benefitsof a Hydroelectric Project in Kerala, India, November 2000.
W.P. 310 K. K. SUBRAHMANIAN. E. ABDUL AZEEZ , Industrial GrowthIn Kerala: Trends And Explanations November 2000
W.P. 311 INDRANI CHAKRABORTY Economic Reforms, Capital Inflowsand Macro Economic Impact in India, January 2001
W.P. 312 N. VIJAYAMOHANAN PILLAI Electricity Demand Analysisand Forecasting –The Tradition is Questioned, February 2001

38
W.P. 313 VEERAMANI. C India's Intra-Industry Trade Under EconomicLiberalization: Trends and Country Specific Factors, March 2001
W.P. 314 U.S.MISHRA AND MALA RAMANATHAN Delivery Compli-cations and Determinants of Caesarean Section Rates in India - AnAnalysis of National Family Health Surveys, 1992-93, March 2001.
W.P. 315 ACHIN CHAKRABORTY The Concept and Measurementof Group Inequality, May 2001.
W.P. 316 K. P. KANNAN AND N. VIJAYAMOHANAN PILLAI ThePolitical Economy of Public Utilities: A Study of the IndianPower Sector, June 2001.
W.P. 317 K. J. JOSEPH AND K. N. HARILAL India's IT Export Boom:Challenges Ahead. July 2001.
W.P. 318 JOHN KURIEN AND ANTONYTO PAUL Social SecurityNets for Marine Fisheries-The growth and ChangingComposition of Social Security Programmes in the FisheriesSector of Kerala State, India. September 2001.
W.P. 319 K. C. ZACHARIAH , P. R. GOPINATHAN NAIR ANDS. IRUDAYA RAJAN Return Emigrants in Kerala:Rehabilitation Problems and Development Potential. October2001
W.P. 320 N. VIJAYAMOHANAN PILLAI, K. P. KANNAN, Time andCost Over-runs of the Power Projects in Kerala, November2001.
W.P. 321 VEERAMANI C. Analysing Trade Flows and IndustrialStructure of India: The Question of Data Harmonisation,November 2001.
W.P. 322 K. C. ZACHARIAH, The Syrian Christians of Kerala:Demographic and Socioeconomic Transition in the TwentiethCentury, November 2001.
W.P. 323 V. K. RAMACHANDRAN, MADHURA SWAMINATHAN,VIKAS RAWAL, How have Hired Workers Fared? A CaseStudy of Women Workers from an Indian Village, 1977 to1999. December 2001.
W.P. 324 K. P. KANNAN, N. VIJAYAMOHANAN PILLAI, TheAetiology of the Inefficiency Syndrome in the Indian PowerSector Main Issues and Conclusions of a Study. March 2002.
W.P. 325 N. VIJAYAMOHANAN PILLAI, Reliability and Rationingcost in a Power System. March 2002.
39
W.P. 326 K.C. ZACHARIAH, B.A. PRAKASH, S. IRUDAYA RAJAN,Gulf Migration Study : Employment, Wages and WorkingConditions of Kerala Emigrants in the United Arab Emirates.March 2002.
W.P. 327 K. RAVI RAMAN, Bondage in Freedom, Colonial Plantationsin Southern India c. 1797-1947. March 2002.
W.P. 328 K. P. KANNAN, K. S. HARI, Kerala's Gulf ConnectionEmigration, Remittances and their Macroeconomic Impact1972-2000. March 2002.
W.P. 329 J. DEVIKA, Imagining Women's Social Space in Early
Modern Keralam. April 2002.
W.P. 330 ACHIN CHAKRABORTY, The Rhetoric of Disagreementin Reform Debates April 2002.
W.P. 331 SURESH BABU, Economic Reforms and Entry Barriers inIndian Manufacturing. April 2002.
W.P. 332 K. P. KANNAN, The Welfare Fund Model of Social Securityfor Informal Sector Workers: The Kerala Experience.April 2002.
W.P. 333 K. PUSHPANGADAN Social Returns from Drinking Water,Sanitation and Hygiene Education: A Case Study of TwoCoastal Villages in Kerala, May 2002.
40
BOOKS PUBLISHED BY THE CDS
Health Status of KeralaP G K Panikar and C R SomanCDS. 1984. pp 159, Hardcover , Rs.100/ $ 11 & Paperback, Rs. 75/ $ 10
Bovine Economy in IndiaA VaidyanathanOxford & IBH. 1988. pp 209, Hardcover, Rs. 96/ $ 11
Essays in Federal Financial RelationsI S Gulati and K K GeorgeOxford and IBH. 1988. pp 172, Hardcover, Rs. 82/ $ 10
Land Transfers and Family PartitioningD RajasekharOxford and IBH. 1988. pp 90, Hardcover, Rs. 66/ $ 10
Ecology or Economics in Cardamom Development(No Stock)K N Nair, D Narayana and P SivanandanOxford & IBH. 1989. pp 99, Paperback, Rs. 75/ $ 10
The Motor Vehicle Industry in India(Growth within a Regulatory Environment)D NarayanaOxford & IBH. 1989. pp 99, Paperback, Rs. 75/ $ 10
The Pepper Economy of India (No Stock)P S George, K N Nair and K PushpangadanOxford & IBH. 1989. pp 88, Paperback, Rs. 65/ $ 10
Livestock Economy of KeralaP S George and K N NairCDS. 1990. pp 189, Hardcover, Rs. 95/ $ 10
Caste and The Agrarian StructureT K SundariOxford & IBH. 1991. pp 175, Paperback, Rs.125/ $ 14

41
Coconut Development in Kerala: Ex-post EvaluationD Narayana, K N Nair, P Sivanandan, N Shanta andG N RaoCDS. 1991. pp 139, Paperback, Rs.40/ $ 10
Trends in Private Corporate SavingsN ShantaCDS. 1991. pp 90, Paperback, Rs. 25/ $ 10
International Environment, Multinational Corporations and DrugPolicyP G K Panikar, P Mohanan Pillai & T K SundariCDS. 1992. pp 77, Paperback, Rs.40/ $ 10
Rural Household Savings and Investment: A Study of SomeSelected VillagesP G K Panikar, P Mohanan Pillai & T K SundariCDS. 1992. pp 144, Paperback, Rs. 50/ $ 10
Indian Industrialization: Structure and Policy Issues. (No Stock)Arun Ghosh, K K Subrahmanian, Mridul Eapen & Haseeb A Drabu(EDs).
OUP. 1992. pp 364, Hardcover, Rs.350/ $ 40
Limits To Kerala Model of Development: An Analysis of FiscalCrisis and Its Implications.K K GeorgeCDS. 1999 (2nd edition) pp 128, Paperback, Rs. 160/ $ 18
Industrial Concentration and Economic Behaviour: Case Study ofIndian Tyre IndustrySunil ManiCDS. 1993. pp 311, Hardcover, Rs. 300/ $ 34
Peasant Economy and The Sugar Cooperative: A Study Of TheAska Region in OrissaKeshabananda DasCDS. 1993. pp 146, Paperback, Rs.140/ $ 16
Urban Process in Kerala 1900-1981T T SreekumarCDS. 1993. pp 86, Paperback, Rs.100/ $ 11

42
Edi d b
Impact of External Transfers on the Regional Economy of KeralaP R Gopinathan Nair & P Mohanan PillaiCDS 1994. pp 36, Paperback, Rs.30/ $ 10
Demographic Transition in Kerala in the 1980sK C Zachariah, S Irudaya Rajan, P S Sarma, K Navaneetham,P S Gopinathan Nair & U S Mishra,
CDS. 1999 (2nd Edition) pp 305, Paperback, Rs.250/ $ 28
Growth of Firms in Indian Manufacturing IndustryN ShantaCDS. 1994. pp 228, Hardcover, Rs. 250/ $ 28
Floods and Flood Control Policies: an Analysis With Reference tothe Mahanadi Delta in OrissaSadhana SatapathyCDS. 1993 pp 98, Paperback, Rs. 110/$ 12
Growth of Market Towns in Andhra: A Study of the RayalseemaRegion C 1900-C.1945NamertaCDS. 1994. pp 186, Paperback, Rs.125/ $ 14
Growth of Education in Andhra - A Long Run ViewC UpendranathCDS. 1994. pp 158, Paperback, Rs. 135/ $ 15
CDS M.Phil Theses (1975/76-1989/90): A Review Vol.1G N RaoCDS. 1996. pp 162, Paperback, Rs. 155/ $ 18
Trends In Agricultural Wages in Kerala 1960-1990A A BabyCDS. 1996. pp 83, Paperback, Rs. 105/ $ 12
CDS M.Phil Theses (1990/91-1993/94): A Review Vol.IIT T SreekumarCDS. 1996. pp 99, Paperback, Rs. 120/$ 14
Industrialisation in Kerala: Status of Current Research and FutureIssuesP Mohanan Pillai & N ShantaCDS. 1997. pp 74, Paperback, Rs. 110/ $ 12
43
Health, Inequality and Welfare EconomicsAmartya SenCDS. 1996. pp 26, Paperback, Rs. 70/ $ 10
Property Rights, Resource Management & Governance: CraftingAn Institutional Framework for Global Marine FisheriesJohn KurienCDS & SIFFS, 1998. pp 56, Paperback, Rs. 50/ $10
Agrarian Transition Under Colonialism: Study of A Semi AridRegion of Andhra, C.1860-1900GN RaoCDS,1999. pp 133, Paperback, Rs. 170/ $19
Land Relations and Agrarian Development in India:A ComparativeHistorical Study of Regional VariationsSakti PadhiCDS,1999. pp 335, Hardcover, Rs. 425/$48
Poverty, Unemployment and Development Policy : A Case Study ofSelected Issues With Reference to KeralaUnited Nations, 2000 (reprint), pp 235
(available for sale in India only), Rs. 275
Performance of Industrial Clusters: A Comparative Study of PumpManufacturing Cluster in Coimbatore (Tamil Nadu) & RubberFootwear Cluster in Kottayam (Kerala)P. Mohanan PillaiCDS, 2001, pp 158, Paperback, Rs. 175/$18
Kerala’s Gulf Connection: CDS Studies on International LabourMigration from Kerala State in India
K.C. Zachariah, K. P. Kannan, S. Irudaya Rajan (eds)
CDS, 2002, pp 232, Hardcover, Rs. 250/$25
Plight of the Power Sector in India: Inefficiency, Reform andPolitical Economy (forthcoming)K.P. Kannan and N. Vijayamohanan Pillai
CDS, 2002, Rs. 400/$40

44

45